phase and widening construction of steel bridges · fdot research project number bdk80-977-28 ....
TRANSCRIPT

FDOT Research Project Number BDK80-977-28
Phase and Widening Construction of Steel Bridges
Alireza Mohammadi Aaron Yakel, Ph.D.
Atorod Azizinamini, Ph.D., P.E.
Department of Civil and Environmental Engineering Florida International University
Miami, Florida
10555 W. Flagler Street, EC 3600 Miami, FL 33174
Sponsored By Florida Department of Transportation
March, 2014
F I N A L
R E P O R T

ii
Disclaimer
The opinions, findings, and conclusions expressed in this publication are those of the authors and not necessarily those of the State of Florida Department of Transportation

iii
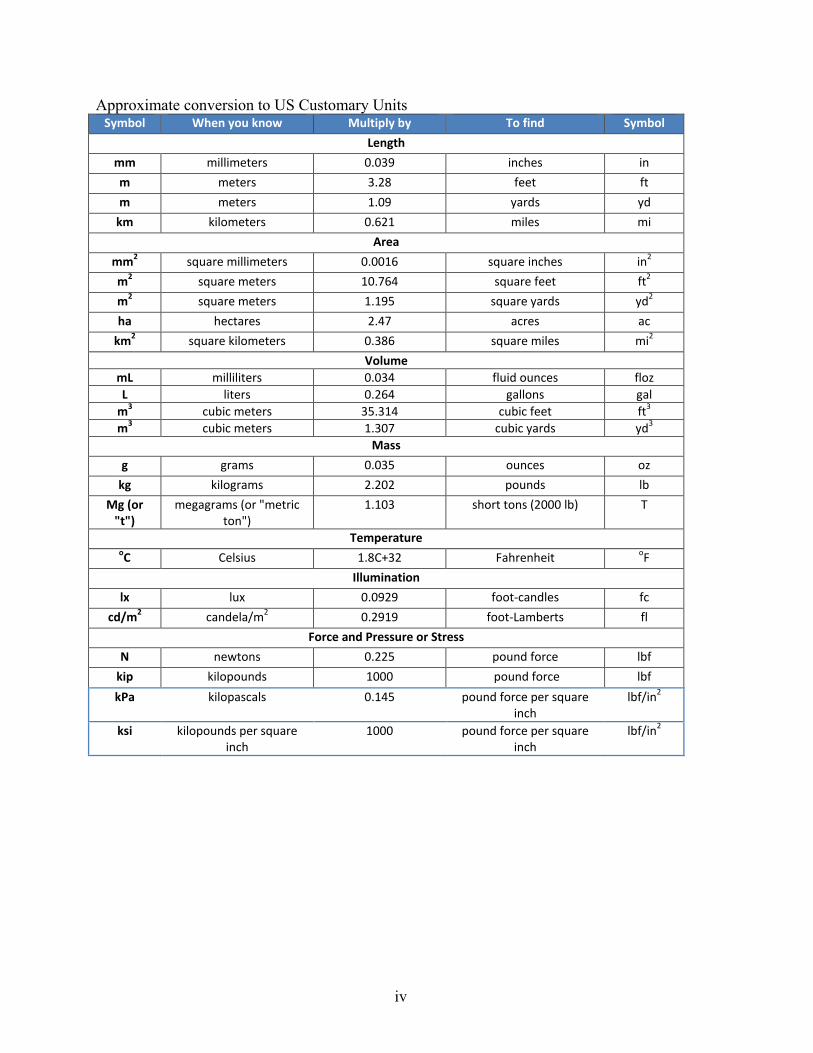
Conversion Tables
Approximate conversion to SI Units Symbol When you know Multiply by To find Symbol
Length in inches 25.4 millimeters mm ft feet 0.305 meters m yd yards 0.914 meters m mi miles 1.61 kilometers km
Area in2 Square inches 645.2 square millimeters mm2 ft2 Square feet 0.093 square meters m2 yd2 square yard 0.836 square meters m2 ac acres 0.405 hectares ha
mi2 square miles 2.59 square kilometers km2 Volume
fl oz fluid ounces 29.57 milliliters mL gal gallons 3.785 liters L ft3 cubic feet 0.028 cubic meters m3 yd3 cubic yards 0.765 cubic meters m3
Mass oz ounces 28.35 grams g lb pounds 0.454 kilograms kg T short tons (2000 lb) 0.907 megagrams (or "metric
ton") Mg (or "t")
Temperature oF Fahrenheit 5 (F-32)/9 or (F-
32)/1.8 Celsius oC
Illumination fc foot-candles 10.76 lux lx fl foot-Lamberts 3.426 candela/m2 cd/m2
Force and Pressure or Stress lbf pound force 4.45 newtons N
lbf/in2 pound force per square inch
6.89 kilopascals kPa
iv
Approximate conversion to US Customary Units Symbol When you know Multiply by To find Symbol
Length mm millimeters 0.039 inches in m meters 3.28 feet ft m meters 1.09 yards yd
km kilometers 0.621 miles mi Area
mm2 square millimeters 0.0016 square inches in2 m2 square meters 10.764 square feet ft2 m2 square meters 1.195 square yards yd2 ha hectares 2.47 acres ac
km2 square kilometers 0.386 square miles mi2 Volume
mL milliliters 0.034 fluid ounces floz L liters 0.264 gallons gal
m3 cubic meters 35.314 cubic feet ft3 m3 cubic meters 1.307 cubic yards yd3
Mass g grams 0.035 ounces oz
kg kilograms 2.202 pounds lb Mg (or
"t") megagrams (or "metric
ton") 1.103 short tons (2000 lb) T
Temperature oC Celsius 1.8C+32 Fahrenheit oF
Illumination lx lux 0.0929 foot-candles fc
cd/m2 candela/m2 0.2919 foot-Lamberts fl Force and Pressure or Stress
N newtons 0.225 pound force lbf kip kilopounds 1000 pound force lbf kPa kilopascals 0.145 pound force per square
inch lbf/in2
ksi kilopounds per square inch
1000 pound force per square inch
lbf/in2
v
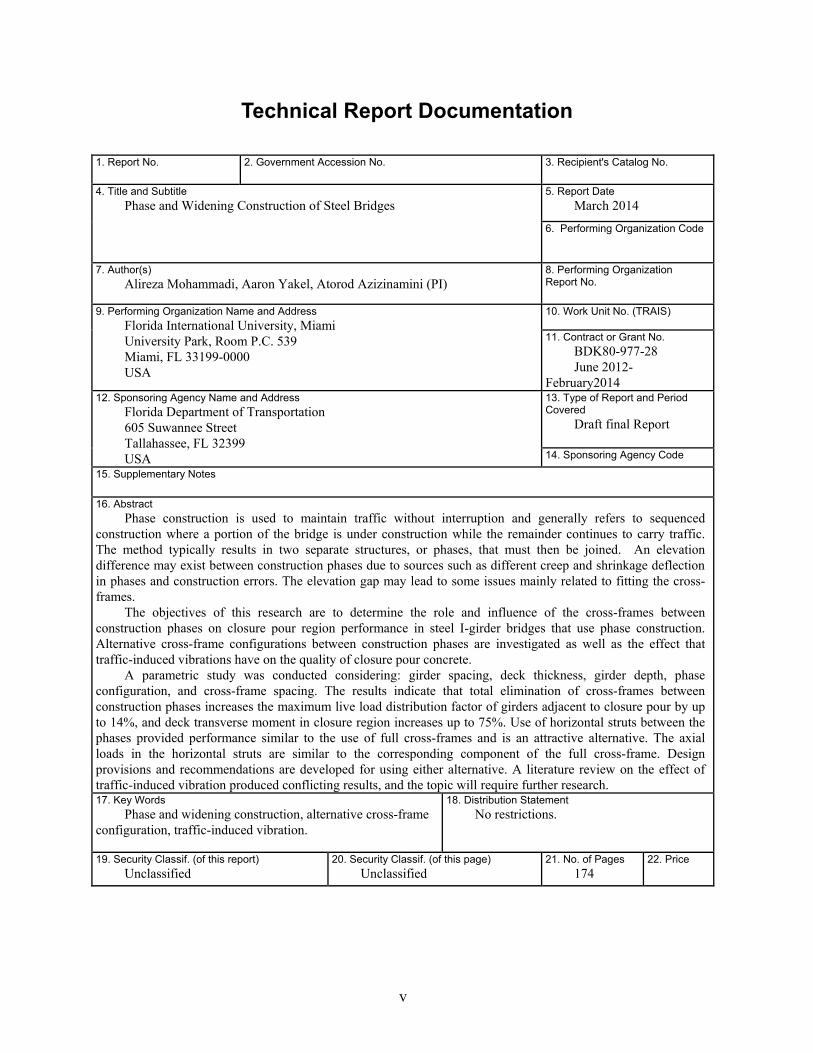
Technical Report Documentation
1. Report No.
2. Government Accession No.
3. Recipient's Catalog No.
4. Title and Subtitle Phase and Widening Construction of Steel Bridges
5. Report Date March 2014
6. Performing Organization Code
7. Author(s) Alireza Mohammadi, Aaron Yakel, Atorod Azizinamini (PI)
8. Performing Organization Report No.
9. Performing Organization Name and Address Florida International University, Miami University Park, Room P.C. 539 Miami, FL 33199-0000 USA
10. Work Unit No. (TRAIS) 11. Contract or Grant No.
BDK80-977-28 June 2012-
February2014 12. Sponsoring Agency Name and Address
Florida Department of Transportation 605 Suwannee Street Tallahassee, FL 32399 USA
13. Type of Report and Period Covered
Draft final Report
14. Sponsoring Agency Code 15. Supplementary Notes
16. Abstract Phase construction is used to maintain traffic without interruption and generally refers to sequenced
construction where a portion of the bridge is under construction while the remainder continues to carry traffic. The method typically results in two separate structures, or phases, that must then be joined. An elevation difference may exist between construction phases due to sources such as different creep and shrinkage deflection in phases and construction errors. The elevation gap may lead to some issues mainly related to fitting the cross-frames.
The objectives of this research are to determine the role and influence of the cross-frames between construction phases on closure pour region performance in steel I-girder bridges that use phase construction. Alternative cross-frame configurations between construction phases are investigated as well as the effect that traffic-induced vibrations have on the quality of closure pour concrete.
A parametric study was conducted considering: girder spacing, deck thickness, girder depth, phase configuration, and cross-frame spacing. The results indicate that total elimination of cross-frames between construction phases increases the maximum live load distribution factor of girders adjacent to closure pour by up to 14%, and deck transverse moment in closure region increases up to 75%. Use of horizontal struts between the phases provided performance similar to the use of full cross-frames and is an attractive alternative. The axial loads in the horizontal struts are similar to the corresponding component of the full cross-frame. Design provisions and recommendations are developed for using either alternative. A literature review on the effect of traffic-induced vibration produced conflicting results, and the topic will require further research. 17. Key Words
Phase and widening construction, alternative cross-frame configuration, traffic-induced vibration.
18. Distribution Statement No restrictions.
19. Security Classif. (of this report) Unclassified
20. Security Classif. (of this page) Unclassified
21. No. of Pages 174
22. Price

vi
Acknowledgements
The authors would like to thank the Florida Department of Transportation (FDOT) and the project manager Ben Goldsberry.
vii
Executive Summary
Public pressure and demand for uninterrupted traffic flow are affecting the process by which bridges are constructed. Rather than closing a roadway while the structure is replaced or widened, the work is performed in phases, allowing traffic flow to remain on the structure, although possibly restricted. The term phase construction generally refers to any sequence of construction where a portion of the structure is being worked on while the remainder of the structure continues in service. The concept of phase construction can be applied to the widening, complete structure replacement, and construction of new bridges. The concept of phase construction itself is so broad that it applies to all bridge types and would even include repair procedures such as deck replacements. However, the research detailed in this report investigated structures with the following characteristics:
• Cast-in-place concrete deck supported by steel I-girders.
• Individual phases are self-supporting structures.
• Connection between the phases consists of a longitudinal (parallel to the supporting girders) cast-in-place strip of concrete referred to as a closure region.
• Transverse reinforcement (perpendicular to the supporting girders) is fully developed within the closure region resulting in continuous behavior of the deck in the transverse direction.
A well-constructed bridge built using phase construction can perform very satisfactorily. Nevertheless, several major issues can arise and need to be properly considered to ensure best performance when phase construction method is used
It is important that the elevations of the phases match along the length of the structure so the phases can be joined properly and the resulting driving surface is smooth and uniform. Since the two phases are constructed independently and at different times, there exists the possibility that they may not align properly when it comes time to connect them. Although one function of the closure pour was to compensate for minor deviations, significant differential elevation can result in major construction problems. The challenges are mainly related to fitting the cross-frames and splicing the transverse reinforcement in the closure pour region.
The main objective of the research is to determine the role and influence of the cross-frames between construction phases on the performance of phase construction steel I-girder bridges and develop preliminary cross-frame configurations and connections to best achieve a smooth fit-up between construction phases. A second objective was to determine the role and influence that cross-frames between construction phases have on the casting, curing, and subsequent durability of the deck in the closure pour region. Finally, we developed recommendations leading to implementation of best practices in the field.
viii
A comprehensive parametric study was conducted to comprehend the effect of cross-frames on the performance of the closure region, specifically, live load distribution and transverse stresses in the deck. In the parametric study, two FDOT phase and widening construction projects were used as prototype bridge models to study the effect of cross-frame elimination and alternative cross-frame configuration. Various parameters of these prototypes were then varied to obtain a suite of models to be analyzed.
The research in this report considered two alternatives. The first alternative was complete elimination of cross-frames between the phases. The second was omission of the diagonal members leaving only the horizontal struts.
The parametric study results showed that elimination of cross-frames between construction phases increased the live load distribution factor of the two girders immediately adjacent to the closure pour bay. The greatest increase occurred in the wider of the two phases. Although these two girders experienced the greatest change in distribution factor, they did not necessarily represent the maximum distribution factor between all interior girders, which would have been used in design. Therefore, for each case the maximum distribution factor among interior girders was obtained for all three cases (original bridge, total frame removal, and horizontal struts). The change in this maximum observed value was then reported. The maximum observed change in distribution factor was 14%. Girder spacing and phase configuration (number of girders in each phase) were the most important parameters affecting the live load distribution factor. The remaining three parameters of deck thickness, girder depth, and cross-frame spacing had minimal effect on the results. For the alternative cross-frame configuration, which uses only horizontal struts, the results showed less than a 2.5% increase in distribution factor, compared to the original structure with full cross-frames.
To investigate the effect of the alternatives on the performance of the deck, the change in transverse deck stresses at the middle and sides (over the girders) of the closure pour were examined. The results indicated a significant increase (up to 65%) in transverse stresses over the middle due to elimination of cross-frames while stresses near the sides decreased. These changes were due to the effective end restraint flexibility at the side of the closure bay. Elimination of cross-frames caused a more flexible condition than for the case with full frames. For the alternative configuration with horizontal strut only, the change in deck stresses was limited to 2.5%. Therefore, using the horizontal strut alternative has a negligible effect on deck stresses.
A literature review of published work was conducted investigating the effects of traffic-induced vibrations on casting the closure pour region. The studies reviewed mainly contained the visual inspection of closure pours in some widening projects and some laboratory tests simulating traffic-induced vibration on early age concrete to observe any adverse effect on bond strength and concrete quality and performance.
The following points summarize the findings obtained from a review of existing literature:

ix
• Elimination of cross-frames between construction phases removes the shear continuity between phases and allows increased differential deflection between phases due to loading such as traffic. This can lead to adverse effect on concrete quality and the bond between concrete and reinforcement.
• Amplitude of traffic-induced vibration, seen as the relative deflection of the phases, can affect both quality of the concrete and bond strength between concrete and reinforcement in the closure region.
• Increasing vibration amplitude is associated with greater bond strength degradation and reduced compressive concrete strength. The studies directly relate the bond strength degradation to vibration amplitude introducing corresponding amplitude threshold; however, these studies of concrete quality and compressive strength used deck curvature over closure pour which includes other properties such as deck thickness and width of closure pour.
• It makes intuitive sense that there is a threshold amplitude of vibration below which no detrimental effect is experienced. However, there is disagreement regarding both threshold amplitude and threshold curvature values below which the effects are negligible. In the literature, the threshold amplitude values vary from 0.05 in. to 0.25 in., and threshold curvature values varied in the range of 1.3 × 10⁻³ /m to 15.4 × 10⁻³ /m.
• Frequency of vibration has no effect on consolidation, bond strength, or compressive strength.
• When cross-frames are to be eliminated, some action may need to be taken to mitigate the traffic-induced vibration. Suggested mitigation strategies include; traffic restriction during casting, temporary connection to provide shear transfer (strong-back or needle-beam), and sequential casting of the closure region.
x
Table of Contents
Disclaimer ....................................................................................................................................... ii Conversion Tables ......................................................................................................................... iii Technical Report Documentation ................................................................................................... v
Acknowledgements ........................................................................................................................ vi Executive Summary ...................................................................................................................... vii Table of Contents ............................................................................................................................ x
List of Figures .............................................................................................................................. xiii List of Tables ............................................................................................................................... xvi Chapter 1 Introduction ............................................................................................................... 1
1.1 Background and Problem Statement ................................................................................ 2
1.1.1 Fit-up Issues between Construction Phases. ............................................................. 5
1.1.1.1 Loading and Outside Influence Effects ............................................................. 6
1.1.1.2 Geometry and Construction Detail Effects ........................................................ 8
1.1.2 Issues with Joining of Phases .................................................................................... 8
1.1.2.1 Response to Misalignment................................................................................. 8
1.1.2.2 Conditions for Casting, Curing, and Durability of the Concrete in the Closure Pour Region ........................................................................................................................ 9
1.1.2.3 Potential Advantages of Eliminating the Cross-frames between Construction Phases ........................................................................................................................... 9
1.2 Objective .......................................................................................................................... 9
1.3 Scope of Work Performed .............................................................................................. 10
1.4 Report Organization ....................................................................................................... 10
Chapter 2 Effect of Traffic-Induced Vibration on Closure Pour ............................................. 12
2.1 Traffic-Induced Differential Deflection ......................................................................... 12
2.2 Effect of traffic-Induced Vibration on Bond Strength ................................................... 12
2.2.1 The Size or Amplitude of the Vibration ................................................................. 13
2.2.2 The Frequency of Vibration and Duration .............................................................. 14
2.3 Effect of Traffic-Induced Vibration on Concrete Strength and Integrity ....................... 14
2.4 Effect of Cross-Frame Elimination on the Quality of Concrete in the Closure Pour ..... 15
Summary ................................................................................................................................... 18
Chapter 3 Finite Element Modeling — Techniques and Verification ..................................... 20
3.1 Modeling ........................................................................................................................ 20
xi
3.2 Load Application ............................................................................................................ 22
3.3 Load Positioning ............................................................................................................ 23
3.4 Calculation of structural Responses ............................................................................... 24
3.4.1 Live Load Distribution Factor ................................................................................ 25
3.4.2 Transverse Stress in the Deck ................................................................................. 31
Chapter 4 Parametric Study ..................................................................................................... 34
4.1 Prototype Bridges ........................................................................................................... 34
4.1.1 Bridge I-95 over SR-421 ......................................................................................... 34
4.1.2 SR-589 Bridge over Waters Avenue ....................................................................... 36
4.2 Data Extraction Methods and Typical Results ............................................................... 38
4.2.1 Distribution Factor .................................................................................................. 39
4.2.2 Transverse Deck Stress / Moment .......................................................................... 41
4.3 Study Results for Individual Parameters ........................................................................ 44
4.3.1 Girder Spacing ........................................................................................................ 45
4.3.1.1 Distribution Factor ........................................................................................... 45
4.3.1.2 Deck Transverse Stresses ................................................................................ 46
4.3.2 Depth of Girders ..................................................................................................... 47
4.3.2.1 Distribution Factor ........................................................................................... 47
4.3.2.2 Deck Transverse Stresses ................................................................................ 48
4.3.3 Thickness of the Deck ............................................................................................. 50
4.3.3.1 Distribution Factor ........................................................................................... 50
4.3.3.2 Deck Transverse Stresses ................................................................................ 51
4.3.4 Longitudinal Stiffness Kg ........................................................................................ 53
4.3.5 Cross-frame Spacing ............................................................................................... 53
4.3.5.1 Distribution Factor ........................................................................................... 53
4.3.5.2 Deck Transverse Stresses ................................................................................ 54
4.3.6 Number of Girders .................................................................................................. 56
4.3.6.1 Distribution Factor ........................................................................................... 56
4.3.6.2 Deck Transverse Stresses ................................................................................ 58
4.3.7 Summary of Results ................................................................................................ 60
4.3.8 Parameter combinations .......................................................................................... 62
4.4 Axial Load in Horizontal Cross-frame Members ........................................................... 63
Chapter 5 Recommended Design Provisions .......................................................................... 65
5.1 Summary of Alternatives ............................................................................................... 65

xii
5.2 Full Cross-frame ............................................................................................................. 67
5.3 Horizontal Struts between Construction Phases ............................................................. 69
5.4 Elimination of Cross-frames between Construction Phases .......................................... 73
5.5 Mitigation of Traffic-Induced Vibration ........................................................................ 74
Chapter 6 Verification Studies ................................................................................................ 76
6.1 Continuity – Bridge SR-589 over Hillsborough Avenue ............................................... 76
6.2 Skew – Bridge I-4 over SR-46 ....................................................................................... 80
6.3 Sample Calculations ....................................................................................................... 84
6.3.1 Flexure in Girder ..................................................................................................... 84
6.3.2 Transverse Moment in the Deck ............................................................................. 89
Chapter 7 Conclusions and Recommendations ....................................................................... 91
Chapter 8 References ............................................................................................................... 94
All Data ............................................................................................................... 96 Appendix AA.1 I-95 over SR-421 ............................................................................................................ 96
A.2 SR-589 over Waters Avenue ........................................................................................ 125

xiii
List of Figures
Figure 1-1. Casting the closure region between phases. ................................................................ 2
Figure 1-2. Typical construction sequences of a bridge replacement using phase construction approach .......................................................................................................................................... 3
Figure 1-3. Typical construction sequences of a bridge widening using phase construction approach .......................................................................................................................................... 4
Figure 1-4. Widening steel girder bridges with and without closure pour .................................... 5
Figure 1-5. Figure displacement of phase I and phase II portion of the bridge ............................. 7
Figure 1-6. Exaggerated differential displacement between phases .............................................. 7
Figure 1-7. Twisting of one phase. ................................................................................................ 8
Figure 2-1. Illustration of differential deflection at a closure pours ............................................ 12
Figure 2-2. Temporary connection between the phases ............................................................... 16
Figure 2-3 Staged casting of closure region ................................................................................ 17
Figure 2-4. Different sequences of casting the closure region (Kwan and Ng, 2006) ................. 18
Figure 3-1. Finite element model of the bridge I-95 over SR-421 .............................................. 21
Figure 3-2. Truck portion of the HL-93 Design Load (a);Placing single truck load in two different transverse locations (b) and (c) ...................................................................................... 23
Figure 3-3. Influence lines of distribution factors for all girders, I-95 Bridge over SR-421 ....... 26
Figure 3-4. The critical positioning for obtaining the distribution factor with: (a) A single truck, (b) Two tracks, (c) Three trucks, (d) Four trucks ......................................................................... 27
Figure 3-5. Position of the points where the stresses of deck were obtained .............................. 31
Figure 3-6. Influence lines – Transverse deck stress ................................................................... 32
Figure 3-7. Bottom middle isolated and loaded for maximum compressive stress ..................... 33
Figure 4-1. Cross-section of the bridge I-95 over SR-421 ........................................................... 35
Figure 4-2. Framing plan of the I-95 Bridge over SR-421 .......................................................... 35
Figure 4-3. Cross-frame details of the I-95 Bridge over SR-421 ................................................ 35
Figure 4-4. Typical details of girders of the I-95 Bridge over SR-421 ........................................ 36
Figure 4-5. Cross-section of the bridge SR-589 over Waters Avenue ........................................ 36
Figure 4-6. Framing plan of the bridge SR-589 over Waters Avenue ......................................... 37
Figure 4-7. Cross-frame details of the bridge SR-589 over Waters Avenue ............................... 37
Figure 4-8. Typical Details of Girders of the Bridge SR-589 over Waters Avenue .................... 37
Figure 4-9. Three different investigated cases for bridge I-95 over SR-421 ............................... 38
xiv
Figure 4-10. BridgeI-95 over SR-421 deformed shape in three different cases: (a) WCF; (b) WOCF; (c) WHCF ........................................................................................................................ 38
Figure 4-11. Distribution factor vs. girder spacing for all girders of bridge I-95 over SR-421 .. 40
Figure 4-12. Transverse stress of the deck in three different cases for I-95 Bridge over SR-42142
Figure 4-13. Deck stresses in 6 points including top and bottom of deck in two side and middle point for a single parameter Girder Spacing =72 in ..................................................................... 43
Figure 4-14. Transverse stress of the deck vs. girder spacing at bottom mid-point .................... 43
Figure 4-15. Transverse stress of the deck vs. girder spacing at top side .................................... 44
Figure 4-16. Distribution Factor vs. Kg for G3bridge I-95 over SR-421 ..................................... 53
Figure 4-17. Difference between models used for bridge SR-589 over Waters Avenue in this section and previous sections ........................................................................................................ 58
Figure 4-18. Difference moment distribution due to different end flexibility condition. ............ 62
Figure 4-19. Axial force at bottom chord over closure bay in two original and alternative cross-frame cases for bridge SR-589 over Waters Avenue .................................................................... 64
Figure 5-1. Field drilled connection ............................................................................................. 68
Figure 5-2. Delayed installation of diagonal elements ................................................................ 69
Figure 5-3. Horizontal struts between construction phases ......................................................... 70
Figure 5-4. Proposed connection detail to accommodate relative vertical displacement ............. 71
Figure 5-5. Radial slotted hole connection to accommodate large movement ............................. 72
Figure 5-6. Elimination of cross-frames between construction phases ....................................... 73
Figure 5-7. Vibration mitigation methods .................................................................................... 75
Figure 6-1. Cross-section of the SR-589 Bridge over Hillsborough Avenue .............................. 76
Figure 6-2. Framing plan of the SR-589 Bridge over Hillsborough Avenue .............................. 77
Figure 6-3. Cross-frame details of the SR-589 Bridge over Hillsborough Avenue..................... 77
Figure 6-4. Girder elevation for the SR-589 Bridge over Hillsborough Avenue ........................ 78
Figure 6-5. Critical longitudinal loading location and corresponding maximum response cross-section for the SR-589 Bridge over Hillsborough Avenue ........................................................... 78
Figure 6-6. SR-589 Bridge over Hillsborough Avenue under truck loading located at critical longitudinal location. .................................................................................................................... 79
Figure 6-7. Cross-section of the bridge SR-589 over Hillsborough Avenue ............................... 80
Figure 6-8. Framing plan of the SR-589 Bridge over Hillsborough Avenue .............................. 81
Figure 6-9. Cross-frame details of the SR-589 Bridge over Hillsborough Avenue..................... 81
Figure 6-10. Typical details of girders of the SR-589 Bridge over Hillsborough Avenue .......... 82

xv
Figure 6-11. Deformed shape of bridge I-4 over SR46 under truck loading located at mid-width and mid-span ................................................................................................................................. 83
Figure 6-12. Details of steel and composite cross-section ........................................................... 87

xvi
List of Tables
Table 3-1. Multiple Presence Factors .......................................................................................... 24
Table 3-2. Results from general procedure for determining maximum distribution factor ......... 30
Table 4-1. Geometrical characteristics of the I-95 Bridge over SR-421. .................................... 34
Table 4-2. Geometrical characteristics of the bridge SR-589 over Waters Avenue .................... 36
Table 4-3. Summarized results related to effect of girder spacing on distribution factor for the I-95 Bridge over SR-421 ................................................................................................................. 41
Table 4-4. Summarized results related to effect of girder spacing on deck transverse stresses for bridge I-95 over SR-421 ............................................................................................................... 44
Table 4-5. Summarized results related to effect of girder spacing on distribution factor ........... 45
Table 4-6. Deck stress (positive bending) vs. girder spacing ...................................................... 46
Table 4-7. Deck stress (negative bending) vs. girder spacing ..................................................... 47
Table 4-8. Summarized results related to effect of depth of girders on distribution factor ......... 48
Table 4-9. Deck stress (positive bending) vs. depth of girders .................................................... 49
Table 4-10. Deck stress (negative bending) vs. depth of girders ................................................. 50
Table 4-11. Summarized results related to effect of deck thickness on distribution factor ......... 51
Table 4-12. Deck stress (positive bending) vs. thickness of deck ............................................... 52
Table 4-13. Deck stress (negative bending) vs thickness of deck ............................................... 52
Table 4-14. Summarized results related to effect of cross-frame spacing on distribution factor 54
Table 4-15. Deck stress (positive bending) vs. cross-frame spacing ........................................... 55
Table 4-16. Deck stress (negative bending) vs. cross-frame spacing .......................................... 56
Table 4-17. Summarized results related to effect of number of girders in phases on distribution factor ............................................................................................................................................. 57
Table 4-18. Deck stress (positive bending) vs. number of girders in phases ............................... 59
Table 4-19. Deck stress (negative bending) vs. number of girders in phases .............................. 60
Table 4-20. Summarized results of parametric study .................................................................. 61
Table 4-21. Summary table of parameters combinations result – WOCF ................................... 63
Table 5-1. Cross-frame alternatives ............................................................................................. 66
Table 6-1. Geometrical characteristics of the SR-589 Bridge over Hillsborough Avenue ......... 76
Table 6-2. Geometrical characteristics of the I-4 Bridge over SR46 ........................................... 80
Table 6-3. DC1 summary ............................................................................................................. 84
Table 6-4. DC2 summary ............................................................................................................. 84
xvii
Table 6-5. DW summary.............................................................................................................. 84
Table 6-6. Analysis results – moment (kip-ft) ............................................................................. 85
Table 6-7. Amplified distribution factor summary ...................................................................... 85
Table 6-8. Strength I load combination moments (kip-ft) ........................................................... 86
Table 6-9. Moment design summary ........................................................................................... 89
Table 6-10. Transverse design moment ....................................................................................... 89
1
Chapter 1 Introduction
Public pressure and demand for uninterrupted traffic flow are affecting the process by which bridges are constructed. Rather than closing a roadway while the structure is replaced or widened, the work is performed in phases allowing traffic flow to remain on the structure, although possibly restricted. The term phase construction generally refers to any sequence of construction where a portion of the structure is being worked on while the remainder of the structure continues in service. The concept of phase construction can be applied to the widening, complete structure replacement, and construction of new bridges. The concept of phase construction itself is so broad that it applies to all bridge types and would even include repair procedures such as deck replacements. However, the research detailed in this report investigated structures with the following characteristics:
• Cast-in-place concrete deck supported by steel I-girders.
• Individual phases are self-supporting structures.
• Connection between the phases consists of a longitudinal (parallel to the supporting girders) cast-in-place strip of concrete referred to as a closure region.
• Transverse reinforcement (perpendicular to the supporting girders) is fully developed within the closure region resulting in continuous behavior of the deck in the transverse direction.
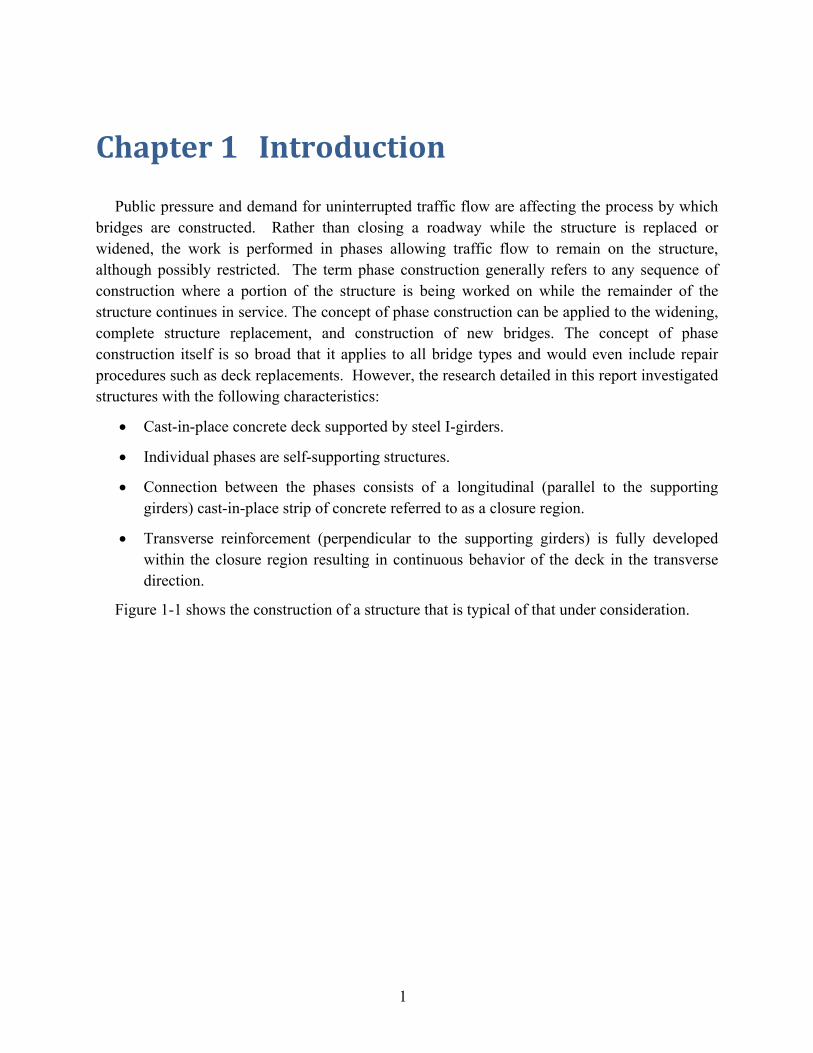
Figure 1-1 shows the construction of a structure that is typical of that under consideration.

2
Figure 1-1. Casting the closure region between phases.
1.1 Background and Problem Statement
A typical construction sequence for bridge replacement using phase construction is shown in Figure 1-2. The first step is to shift traffic to one side. Temporary barriers are placed to contain traffic and a portion of existing bridge is demolished. Phase I of the new structure is then constructed. Temporary barriers are placed and traffic is shifted onto the new phase.
Once traffic is being carried by Phase I of the new structure, Step 2 in Figure 1-2, the remainder of the existing structure is demolished.
Step 3 is to construct Phase II of the new structure. Once complete, the two phases are joined together. The final step is to remove the temporary barriers and allow traffic to occupy the entire bridge.

3
Figure 1-2. Typical construction sequences of a bridge replacement using phase construction approach
Step 1
Step 2
Step 3
Step4 and Final Bridge
Existing bridge
Phase I
Phase II

4
The steps required to widen a structure, shown in Figure 1-3, are similar. As shown in the figure the construction approach begins by shifting traffic to one side and placing temporary barriers to separate the traffic from the construction. Next, a portion of the existing structure is demolished to provide a point of attachment. A new phase is constructed next to the existing. A gap is left between the phases. Finally, the closure region is cast, thereby connecting the two structures. Once complete, the temporary barriers are removed and traffic is allowed onto the entire structure.
Figure 1-3. Typical construction sequences of a bridge widening using phase construction approach
In both scenarios, the decks of the two phases are to be attached properly such to provide continuity in the transverse direction. An alternative not yet mentioned would be to leave the two phases as separate structures. However, past experiences with phase construction and bridge widening projects indicate that an expansion joint between the phases creates a number of maintenances problems (Caltrans, 2010). Thus full attachment must be provided.
Existing bridge
Step 1
Step 2 and final bridge

5
The one exception would be when a bridge is widened by adding a single girder. In this scenario, it can be practical to cast the widened deck up to and connected with the existing deck. The widening of steel girder bridges with and without closure pour is illustrated in Figure 1-4 (Caltrans, 2010). The closure pour provides a smooth transverse transition between the decks of the phases.
Figure 1-4. Widening steel girder bridges with and without closure pour
A well-constructed bridge built using phase construction can perform very satisfactorily. Nevertheless, several major issues (Azizinamini et al., 2003), briefly described in the following section, can arise and need to be properly considered when phase construction method is used to ensure the best performance.
1.1.1 Fit-up Issues between Construction Phases.
It is important that the elevations of the phases match along the length of the structure so the phases can be joined properly and the resulting driving surface is smooth and uniform. Since the two phases are constructed independently, and at different times, there exists the possibility that they may not align properly when it comes time to connect them together. Although one function of the closure pour is to compensate for minor deviations, significant differential elevation can result in major construction problems. The challenges are mainly related to fitting the cross-frames and splicing the transverse reinforcement in the closure pour region.
6
This differential elevation can be caused by a number of factors, including:
• Construction error
• Accumulated construction tolerance
• Time dependent effects such as creep and shrinkage
• Thermal or other meteorological effects
• Mismatched end restraint conditions
• Rotation of phases due to unequal loading or lack of symmetry
These factors can generally be grouped into two categories; those that are a result of loading and outside influence, and those that are a manifestation of the geometry and details of the structures. Additional information regarding several sources is provided in the following sections.
1.1.1.1 Loading and Outside Influence Effects Composite steel sections experience long term displacement due to creep and shrinkage. In a
phase construction project, there can be a significant time lapse between construction of the two phases meaning the two phases experience different long term deflection profiles. However, these independent structures must align properly at the time of the closure operation. Figure 1-5 shows hypothetical displacement profiles of the two Phases due to creep and shrinkage. As indicated in Figure 1-5, construction of the Phase II will start after Phase I has been completed. For this hypothetical case, both phases experience the same creep and shrinkage displacements only at different times. This time lag means that the two phases will have deflected a different amount at the time of closure resulting in an elevation between construction phases. The time at which the closure region is cast will determine how much differential elevation will exist between Phase I and Phase II girders.

7
Figure 1-5. Figure displacement of phase I and phase II portion of the bridge
Figure 1-6. Exaggerated differential displacement between phases
This differential elevation between the two phases can result in fit-up problems for cross-frames in the bay between girders containing the closure pour. Further, once the closure pour region is cast, the two systems will be locked together while Phase II will continue to experience additional long-term displacements. This additional displacement of Phase II, while the two phases are connected, can subject the deck and cross-frames to additional stresses. These additional stresses can be large enough to cause cracking at the cross-frame locations and other damages to the bridge. One potential solution is to omit the cross-frames from the between the phases. However, since cross-frames may have a role in distributing live load, the elimination of cross-frames may affect the live load distribution factors. Further, higher transverse curvature within the bay can consequently subject the deck to additional stresses. What is the level of this additional stresses and its significance are among the questions that needs to be resolved.

8
1.1.1.2 Geometry and Construction Detail Effects In some cases, the steel and deck arrangement in one of the phases is not symmetric. This
asymmetry can cause twisting of the girders after the deck is cast, as shown in Figure 1-7.
Figure 1-7. Twisting of one phase.
Such twist can contribute to the differential deflections along the closure pour region, which will vary along the span. This is a very complex problem, as twist of a phase with an unsymmetrical girder and deck arrangement will change over time, due to creep and shrinkage. Through numerical analysis, it is feasible to assess the effect of such twist and develop approximate influence of such twist and alert the designer to potential consequences. When the effect is minor, one approach to resolve this problem is to use an overlay.
1.1.2 Issues with Joining of Phases
Generally, two phases are connected by placing cross-frames and casting closure pour between construction phases after completion of second phase in phase construction projects. The differential elevation between the two phases can result in major fit up problems for cross-frames in the closure bay between phases. Splicing of transverse reinforcement in the closure pour region is also difficult due to the different elevation.
1.1.2.1 Response to Misalignment Much of the work presented here addresses predicting and preventing differential elevation.
However, when it does occur and regardless of the source, the misalignment must be accommodated. One of the major issues in accommodating misalignment is the presence of cross-frames between the two phases. In fact, even if the two phases are in perfect alignment, accessibility issues can create difficulties with regards to cross-frames between the two phases. Investigating the behavior of these cross-frames was one of the major activities of the research being described in this report.

9
When the deck elevations of the two phases do not match, it is possible that the contractor may attempt to force the two separate phases together. This practice can subject the deck and cross-frames in the closure pour region to additional stresses that are difficult to estimate. These locked in stresses can subject the girder webs in the closure pour regions to very high out of plane stresses resulting in fatigue cracking. Such practices may also jeopardize the service life of deck concrete.
1.1.2.2 Conditions for Casting, Curing, and Durability of the Concrete in the Closure Pour Region
There is debate and conflicting opinion among bridge engineers regarding the conditions under which the closure pour region should be cast. Some contractors prefer to close the structure to traffic completely until the concrete in closure pour region is set, while some believe that vibration caused by traffic, can actually assist consolidation of concrete in the closure pour region. Depending on the particular situation, closure of traffic may not be an option.
1.1.2.3 Potential Advantages of Eliminating the Cross-frames between Construction Phases
Recent studies indicate that cross-frames are mainly needed during construction of straight steel bridges only before the hardening of the concrete (Azizinamini et al., 2002). Cross-frames play a less significant role after the concrete has hardened. The research data indicates that after the concrete has hardened, the stiffness of the deck is mainly responsible to distribute the wheel loads between the girders and the cross-frame contribution to load distribution is negligible. However the elimination of cross-frame, even in a single bay, can increase the strain in the concrete deck and consequently reduce the service life of the bridge.
1.2 Objective
The main objectives of the research being reported are:
Determine the role and influence of the cross-frames between construction phases on the performance of phase construction steel I-girder bridges and develop preliminary cross-frame configurations and connections to best achieve a smooth fit-up between construction phases.
Develop recommendations leading to implementation of best practices in the field.
Conduct a parametric study investigating the effects that cross-frame elimination or alternative cross-frame configurations have on live load distribution and stresses in the deck.
Review existing literature to determine the role and influence that cross-frames between construction phases have on the casting, curing, and subsequent durability of the deck in the closure pour region. Identify available information regarding the effect of traffic-induced vibrations on the closure pour region and how elimination of cross-frames or alternative configurations may further affect the performance.
10
1.3 Scope of Work Performed
A literature review of completed studies was conducted investigating the effects of traffic-induced vibrations on casting the closure pour region. The studies reviewed can be categorized into field studies and laboratory studies. Field studies relied on visual inspection of closure pours in some widening projects to evaluate the performance of closure pours. Laboratory studies attempted to simulate traffic-induced vibration on early age concrete and observe any adverse effect on reinforcement bond strength and the concrete quality and performance.
In this project, finite element modeling techniques were developed to model the type of structure under consideration and extract the necessary results. The general purpose finite element software package ANSYS was chosen for its scripting capabilities that allow automated generation and analysis of multiple structures. These developed techniques were then used throughout the subsequent parametric study.
A comprehensive parametric study was conducted to comprehend the effect of cross-frames on the performance of the closure region, specifically, live load distribution and transverse stresses in the deck. In the parametric study, two FDOT phase and widening construction projects were used as prototype bridge models to study the effect of cross-frame elimination and alternative cross-frame configuration. Various parameters of these prototypes were then varied to obtain a suite of models to be analyzed. Five parameters were considered in the study, including:
• Girder Spacing
• Deck Thickness
• Girder Depth
• Phase Configuration (number of girders in the phases)
• Cross-frame Spacing.
Each parameter was initially investigated independent of the others. Parameters for which a significant change in the performance of the closure region was observed were then studied in combination with other parameters to identify any compound behavior.
The results of the parametric study were then used to develop specific design recommendations. The resulting recommendations were then verified against two additional structures: one two-span continuous bridge and one with significant skew.
1.4 Report Organization
Chapter 2 presents the literature review of published work investigating the effects of traffic-induced vibrations on casting the closure pour region. Details of the finite element modeling techniques are presented in Chapter 3. These techniques were used throughout the investigations that were subsequently performed. Chapter 4 presents the parametric study conducted to comprehend the effect of cross-frames on the performance of the closure region. The results of

11
the parametric study were used to develop design recommendations, which are provided in Chapter 5. The prototype bridges used in the parametric study were simple span, non-skew bridges. Therefore, Chapter 6 investigates both a continuous bridge and one with significant skew to verify the developed provisions are applicable to these cases. A summary of the research with conclusions and recommendations for future research are provided in Chapter 7. The results of the parametric study given in the body of the report are a condensed summary obtained from an extensive number of analysis cases. A complete listing of the results from these analyses is provided in the Appendix.
12
Chapter 2 Effect of Traffic-Induced Vibration on Closure Pour
In phase construction and widening projects one portion, or phase, of the structure carries traffic, while another phase is being constructed. Thus during the casting and curing of the closure region, the phases of the structure may deflect relative to one another due to traffic along the existing phase, due to wind effects as traffic passes below, and also simply due to wind. Traffic and wind speed up air motion beneath the bridge. As a result of the Bernoulli Effect, the pressure beneath the bridge decreases and the resultant suction force pulls the bridge downward. Such relative vertical deflections and vibration may cause detrimental effects on bond strength (between embedded bars and concrete) affecting the performance of the closure region.
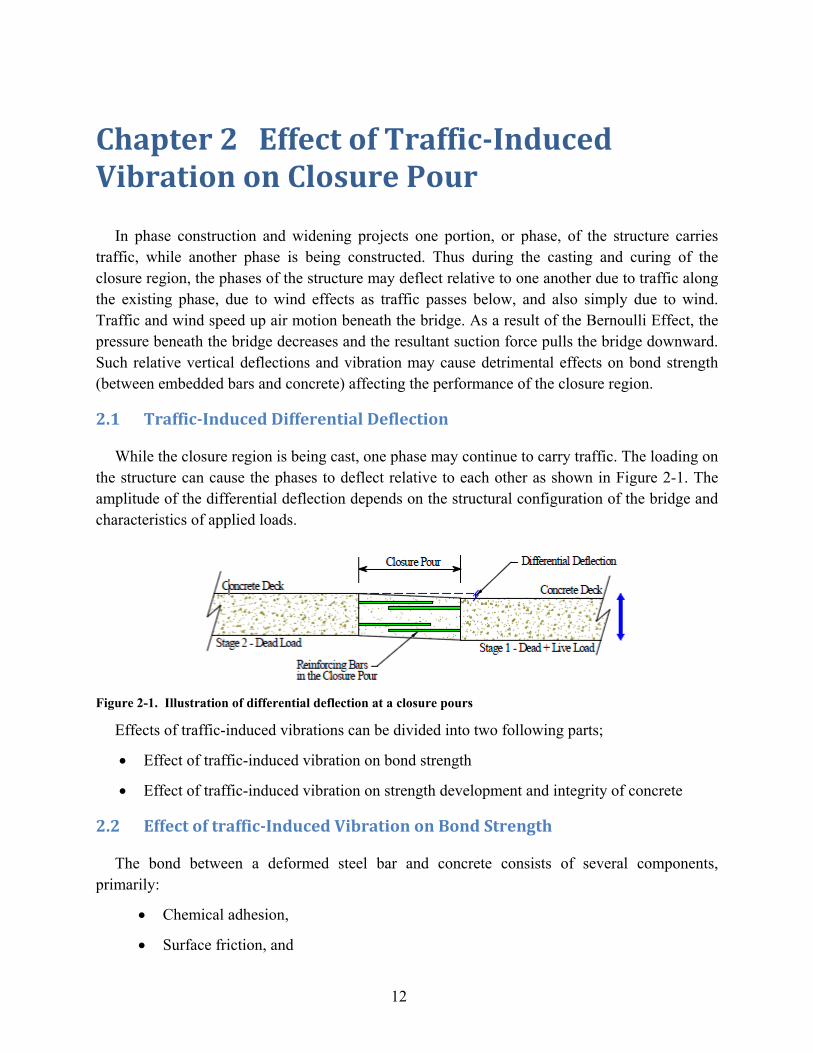
2.1 Traffic-Induced Differential Deflection
While the closure region is being cast, one phase may continue to carry traffic. The loading on the structure can cause the phases to deflect relative to each other as shown in Figure 2-1. The amplitude of the differential deflection depends on the structural configuration of the bridge and characteristics of applied loads.
Figure 2-1. Illustration of differential deflection at a closure pours
Effects of traffic-induced vibrations can be divided into two following parts;
• Effect of traffic-induced vibration on bond strength
• Effect of traffic-induced vibration on strength development and integrity of concrete
2.2 Effect of traffic-Induced Vibration on Bond Strength
The bond between a deformed steel bar and concrete consists of several components, primarily:
• Chemical adhesion,
• Surface friction, and
13
• Mechanical interlock, or bearing between the concrete and the deformations of the bar.
With application of tensile load the first two components, chemical adhesion and surface friction, are eliminated and the mechanical interlock is the only mechanism that provides bond strength (ACI Committee 408, 2005). Thus, the bond strength is related to the formation of the bearing interface around the bar. The quality of this interface is directly related to the quality of curing. Movement and vibration during casting and curing of the concrete may affect the formation, size, and the integrity of the interface.
Degraded performance of the closure region may result from deflection-induced bond strength reduction between the reinforcement and the concrete. As presented in Section 2.3 several studies have investigated the potential for bond strength degradation due to loss of contact area between the steel bars and the concrete when the steel reinforcement moves within fresh concrete during curing. The factors that have been investigated are the size or amplitude of the vibration and the frequency of vibration and duration of the deflections.
2.2.1 The Size or Amplitude of the Vibration
A study carried out in Texas, details observation made from site trials of bridge widening projects and results obtained from laboratory tests (Furr and Fouad, 1981). A visual inspection was performed on 30 prestressed beam bridges, including simple span and continuous bridges with spans in the range of 25 ft. to 110 ft. The observations indicate that the closure pours were in good condition. Although some longitudinal cracking observed in some bridges, the general condition of the decks were fine. The same cracking patterns were observed in both new and existing decks meaning no adverse effect due to construction exposed to traffic-induced vibrations was experienced. From nine of the bridges, numerous cores were taken. More than half were from the region that would have been most affected by traffic-induced vibration during casting, such as near mid-span. The remaining cores were from regions of relative fixity close to supports. Ultrasonic pulse-velocity and compressive strength tests were conducted on the cores. The results obtained did not show any difference between those cores exposed to vibration and the others.
Laboratory tests associated with the same study were conducted on five 7" deep, 12" wide, and 10'-8" long concrete beams with embedded dowel bars. The beams were designed to represent a typical transverse strip of a concrete deck slab. The beams were supported on one end and at mid-span leaving a free cantilever. Cyclic deflections were imposed on two dowel bars protruding from the free end of the beam as the concrete was cast and allowed to cure. Dowel bars in four beams were deflected 0.25” at 5 minute intervals. One specimen was subjected to vibration of 0.02" with 6 Hz fluctuating rate. The core taken from the affected regions of the beams did not indicate any bond damage but slight movement due to vibration was imprinted. The study concluded that in case of straight bars in a closure pour that is longer than 20 time of bar diameter the differential deflections have negligible effect on the strength of the bond between bar and concrete (Furr and Fouad, 1982).

14
The most recent study on the effect that differential deflection has on bond strength was carried out by FHWA. This study included a wide range of amplitude and frequency of the imposed vibrations. The study conducted pull-out tests using 6-inch cubes with #4 rebar (FHWA Report, 2012). The deflections were induced from the time of casting until the material reached final set. The pull-out test was then performed 24 hours after casting or as soon thereafter as possible. The imposed deflections ranged from 0.005 to 0.01 inches and were applied to the cube molds while the rebar was fixed in place. The results show differential deflection equal to or greater than 0.05 inches (1.27 mm) causes a reduction in the bond strength. The reduction was due to displacement of the concrete around the reinforcing bar and consequent loss of contact area between the steel bars and concrete. The test results indicate that deflections of 0.01 in. (0.25 mm) or less had a negligible impact on the bond strength. One concern with this study is the small size of the specimens considered. In a full scale application, the embedded bars will flex along with the concrete to some degree. This flex is not just from the action of the concrete on the bar but also due to the fact that the bars are typically tied together and also tied to longitudinal bars placed in the closure. It is therefore expected that the threshold level of displacement for the actual structure would be greater than the value suggested by the study although additional investigation would be required.
2.2.2 The Frequency of Vibration and Duration
The FHWA tests also investigated the effect of deflection frequency. Two different frequencies were considered – 2 Hz and 5 Hz. The results did not demonstrate any appreciable difference in performance. Thus the frequency of the vibration is not an important factor in bond degradation (FHWA Report, 2012).
2.3 Effect of Traffic-Induced Vibration on Concrete Strength and Integrity
In bridge widening and phase construction projects that are open to traffic during casting of the closure region, the concrete in closure region is subjected to traffic-induced vibration during curing. Vibration may provide additional consolidation of the fresh concrete. However, the additional consolidation by the traffic vibrations is very small in comparison to consolidation by the concrete vibrators (Montero, 1980). On the other hand, the vibration may affect strength and integrity of the closure region that can cause a reduction in shear and flexural strength of the deck.
The amount of the traffic-induced deflection which can be withstood by the curing concrete of the closure region is generally expressed in relation to the threshold curvature (second derivative
of displacement, 𝑑2𝑦
𝑑𝑥2). The threshold curvature is the limiting curvature of the deck after which
deck starts to crack. The studies however, reported a very wide range (1.3 × 10⁻³ /𝑚 to 15.4 × 10⁻³ /𝑚) for the threshold curvature (Kwan and Ng, 2006). Field investigations also resulted in scattered values of threshold curvature due to different site conditions (Montero, 1980).

15
Different studies report different estimates of curvature from traffic-induced differential deflection. Some studies showed that the curvature from traffic-induced differential deflection is very large compared to threshold curvature range and therefore the traffic vibration needs to be reduced using some mitigating measures (Kwan and Ng, 2006 and Ng and Kwan, 2004). These studies propose different traffic vibration mitigating methods including, traffic restriction and using temporary shear connection between two phases. On the other hand Issa (1999) estimated the curvature from traffic-induced differential deflection less than the threshold curvature. Their study emphasized on the importance of on importance of pouring sequence for controlling the curvature due to differential deflection.
The ACI Manual of Concrete Practice (ACI Committee 345, 2005) restricts the dead load or live load induced differential deflection to ¼ inch (6mm) during casting of the closure pour. It recommends taking appropriate considerations for the cases in which the limit is exceeded.
A series of laboratory tests simulating traffic-induced vibration effects on fresh concrete in bridge deck repairs concluded that when high-quality, low-slump concrete is used; traffic-induced vibration does not have detrimental effect on either strength or compressive strength of concrete (Harsh and Darwin, 1984). The study found a slump of 4 to 5 inches as the critical value that provided the predicted bond and compressive strengths. A slump range of 7 to 8 inches resulted in a decrease of bond and compressive strengths by 5% to 10%. It should be noted that the results are related to deck repairs. In phase construction and widening projects the fresh concrete is in the closure region connecting separate structures and may experience larger differential deflections compared to deck repairs that occur on a single structure.
The state of Michigan surveyed numerous bridge widening projects including observation of decks during construction and evaluation of their performance over many years (Arnold et al., 1976). The study identified excess water, defined as the accumulated water separated from the mix due to vibration, as the primary factor in deck deterioration. A small local increase of water-cement ratio increases permeability and consequently the amount of chloride that can penetrate the deck. It was posited that excessive traffic-induced vibration may exacerbate the situation forming weak layers in the deck with high water/cement ratios. The observation of typical fracture plane delamination indicated the presences of weak, high water content zones, participating in the final fracture. The study also observed that shoring during construction to prevent vibration did not improve the concrete quality. In fact, shored span showed more deterioration than unsupported spans.
2.4 Effect of Cross-Frame Elimination on the Quality of Concrete in the
Closure Pour
Elimination of cross-frames between construction phases removes the shear continuity between phases and enables them to deflect independently. This elimination can cause more differential deflection and possibly lead to bond and concrete strength degradation due to
16
movements that occur while the closure region is being cast. When cross-frames are to be eliminated, some action may need to be taken mitigating the traffic-induced vibration. Suggested mitigation strategies include; traffic restriction during casting, temporary connection to provide shear transfer (strong-back or needle-beam), and sequential casting of the closure pour (described below). The goal of these strategies is to reduce the magnitude of the differential deflection.
Utilizing phase construction is a consequence of high traffic demand and the need for uninterrupted traffic; therefore, complete closure of a bridge may not be permitted, even for a short duration. However, some traffic restrictions might be allowable. Closing lanes adjacent to the closure region, restricting heavy vehicles, and lowering speed limits to reduce impact effects could be implemented to mitigate the traffic-induced vibration. One study analyzed several scenarios that considered a combination of lane closure and weight restrictions (Kwan and Ng, 2006). The results showed that the traffic restriction method is quite effective in limiting traffic-induced vibrations. Closing just one third of traffic lanes adjacent to the closure region reduced the vibration amplitude by 57%.
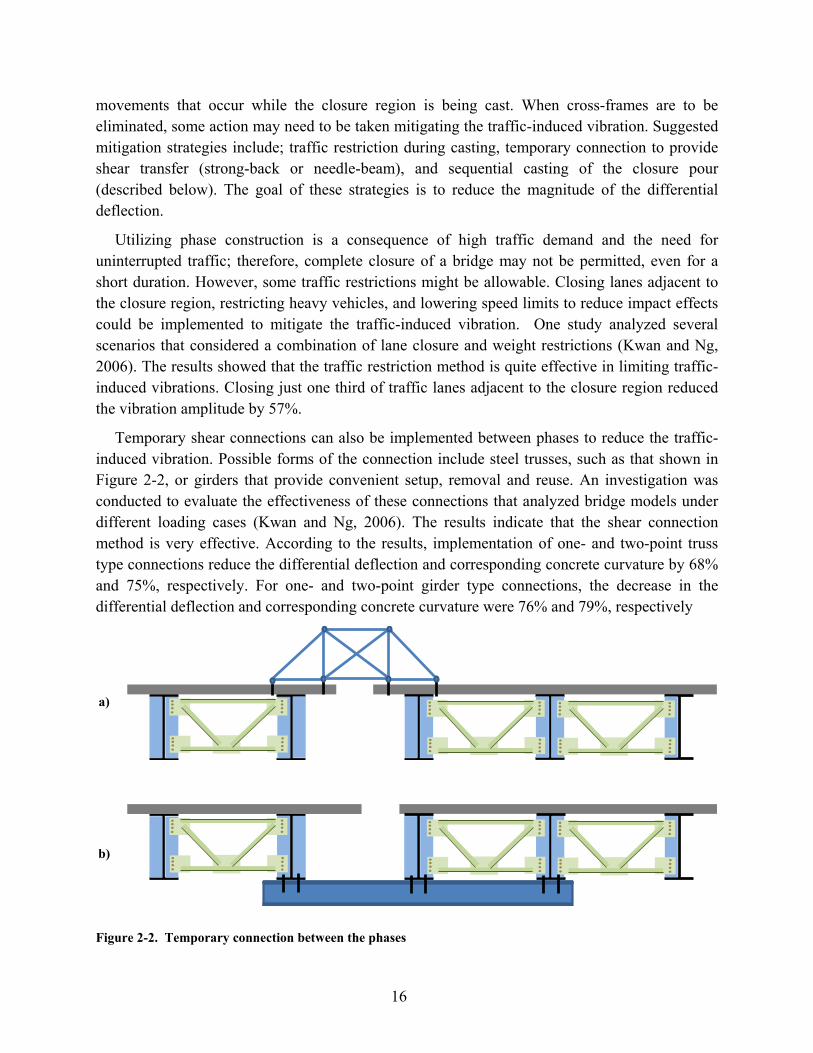
Temporary shear connections can also be implemented between phases to reduce the traffic-induced vibration. Possible forms of the connection include steel trusses, such as that shown in Figure 2-2, or girders that provide convenient setup, removal and reuse. An investigation was conducted to evaluate the effectiveness of these connections that analyzed bridge models under different loading cases (Kwan and Ng, 2006). The results indicate that the shear connection method is very effective. According to the results, implementation of one- and two-point truss type connections reduce the differential deflection and corresponding concrete curvature by 68% and 75%, respectively. For one- and two-point girder type connections, the decrease in the differential deflection and corresponding concrete curvature were 76% and 79%, respectively
a)
b)
Figure 2-2. Temporary connection between the phases

17
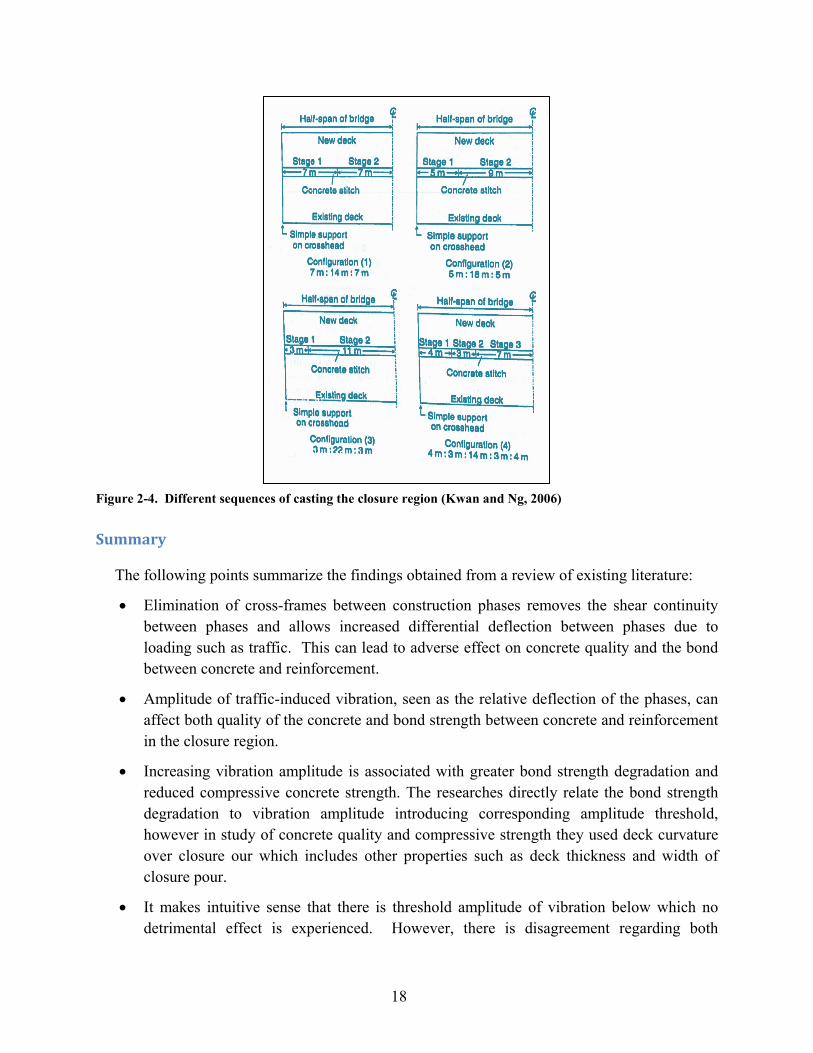
Since the maximum differential deflection occurs in mid-span, the regions near to supports experience much less differential deflection and those regions can be cast without adverse affecting concrete quality. When the concrete in these initial regions hardens it provides some shear stiffness that restricts the differential deflection in the region towards the mid-span. Hence, casting the closure region in stages, shown in Figure 2-3, can limit the differential deflection. An analytical investigation was carried out to find the influence of using sequential casting of the closure region, termed stitching by the original investigators, to mitigate the traffic-induced vibration (Kwan and Ng, 2006). Figure 2-4 shows the four construction sequence configurations studied in a model bridge. The results showed respective decreases of 30%, 46%, 21% and 56% in resultant curvature within the closure pour due to traffic-induced vibration.
c)
Figure 2-3 Staged casting of closure region
SupportSupport
Phase I
Phase II
Plan View
Stage 1 Stage 2 Stage 3 Stage 2 Stage 3
Closure
18
Figure 2-4. Different sequences of casting the closure region (Kwan and Ng, 2006)
Summary
The following points summarize the findings obtained from a review of existing literature:
• Elimination of cross-frames between construction phases removes the shear continuity between phases and allows increased differential deflection between phases due to loading such as traffic. This can lead to adverse effect on concrete quality and the bond between concrete and reinforcement.
• Amplitude of traffic-induced vibration, seen as the relative deflection of the phases, can affect both quality of the concrete and bond strength between concrete and reinforcement in the closure region.
• Increasing vibration amplitude is associated with greater bond strength degradation and reduced compressive concrete strength. The researches directly relate the bond strength degradation to vibration amplitude introducing corresponding amplitude threshold, however in study of concrete quality and compressive strength they used deck curvature over closure our which includes other properties such as deck thickness and width of closure pour.
• It makes intuitive sense that there is threshold amplitude of vibration below which no detrimental effect is experienced. However, there is disagreement regarding both
19
threshold amplitude and threshold curvature values below which the effects are negligible. In the literature, the threshold amplitude values range varies from 0.05 in. to 0.25 in. and threshold curvature values varies in the range of 1.3 × 10⁻³ /m to 15.4 ×10⁻³ /m.
• Frequency of vibration has no effect on consolidation, bond strength, or compressive strength.
• When cross-frames are to be eliminated, some action may need to be taken mitigating the traffic-induced vibration. Suggested mitigation strategies include; traffic restriction during casting, temporary connection to provide shear transfer (strong-back or needle-beam), and sequential casting of the closure region.

20
Chapter 3 Finite Element Modeling — Techniques and Verification
This chapter describes the typical approaches of finite element modeling and analysis used in the research. The modeling and analysis techniques include geometry idealization, element types, meshing, and loading. The procedures to obtain results are also described.
3.1 Modeling
ANSYS 12.0 finite element software was used to perform the FEM analyses. A full 3D FEM model was used for modeling the bridge system as shown in Figure 3-1. The flanges, web, stiffeners, and deck are modeled with shell elements while the cross-frames are modeled with line elements. Connectivity between the top flange and deck is accomplished by modeling them at the same elevation with coincident nodes. The eccentricity between the deck and top flange is handled in the element formulation and with a specified offset used to locate the centroid of deck at the correct distance from the centroid of flange.
A four-node elastic shell element (SHELL181) was used to model the concrete slab, steel girders, and stiffeners. SHELL181 has six degrees of freedom at each node, three translations and three rotations. Cross-frame members were modeled using a two-node 3D beam elements (BEAM188) element. The BEAM188 element has six degrees of freedom at each node – three translations and three rotations. The modulus of elasticity is taken as 29000 ksi for steel and 3600 ksi for concrete. Poisson’s ratio was assumed 0.3 for steel and 0.2 concrete.

21
Girders (web and flange) Stiffeners added
Cross-frames Deck
Full Structure
Figure 3-1. Finite element model of the bridge I-95 over SR-421

22
3.2 Load Application
The focus of the parametric study is the change in bridge response under traffic loading for various structural configurations. Presence of dead load does not affect this behavior and is therefore not modeled. Only live load is investigated in this study. The HS-20 truck load portion from the AASHTO LRFD HL-93 Design Load, shown in Figure 3-2, was used to simulate live loading on the bridge models.
Six point loads corresponding to the six wheels of a truck are applied to the model. The element on which a point load falls is first identified. This point load is then distributed to the four nodes of the shell element depending on the location of the point load within the element. Bi-linear shape functions are used to calculate the portion of a point load to be applied to each node of the element. Figure 3-2 shows the loading corresponding to a single truck load at mid-span in two different transverse locations. The figure shows six loaded shell elements with each shell element having four point loads at their nodes.

23
(a)
(b)
(c)
Figure 3-2. Truck portion of the HL-93 Design Load (a);Placing single truck load in two different transverse locations (b) and (c)
3.3 Load Positioning
To perform the parametric study, it was necessary to find the combination of truck count and positioning on the bridge deck creating the critical value of the desired response. The critical positioning is dependent upon the response variable and point of interest being investigated.
24
For single-span bridge models, mid-span is taken to be the point of interest for the response variables. The longitudinal positioning of the moving loads can be determined analytically for longitudinally based responses, such as bending moment in the primary girders. The same longitudinal position is also used for transverse based responses, such as deck bending moment.
For bridges with multiple spans, the location of the maximum response and load positioning required to generate the maximum are not necessarily at mid-span. However, the study is interested in finding the relative change in the maximum response, not the value of the maximum response itself. It is therefore assumed that the relative change in response at a location near the location of maximum response will be similar to the change in the actual maximum response. Hence, the longitudinal location of maximum response for all response variables and associated longitudinal positioning of load was chosen to be the locations for which maximum bending moment in the girders was observed, which was typically quite near to mid-span.
With the longitudinal location set, the next step was to determine the count and positioning of trucks in the transverse direction. The available travel width, assuming 2 ft. clear spacing from the face of each barrier to the nearest wheel load, was divided into regular 12-inch increments representing the potential centerlines of a truck. A separate analysis was performed with a single truck placed in each of the potential lane locations, and all of the results were saved. Superposition was used during post-processing to create scenarios considering multiple loaded lanes.
The post processing routine was able to consider every possible combination that provided a spacing of at least 12 feet between loaded lanes. Examples of the procedure are provided in the following section. The results obtained were multiplied by a multiple presence factor, given in Table 3-1, based on the number of trucks in the particular combination. The combination resulting in the critical factored response was identified for each of the variables being considered, and the resulting values were stored for further processing.
Table 3-1. Multiple Presence Factors
Number of Loaded Lanes Multiple Presence Factor 1 1.20 2 1.00 3 0.85
>3 0.65
3.4 Calculation of structural Responses
The two structural responses focused upon in this study are live load distribution factor and transverse moment or stress in the deck over the closure bay.

25
3.4.1 Live Load Distribution Factor
The live load distribution factor can be obtained from the longitudinal stresses in the bottom flanges. For each analysis, the live load distribution factor of a girder (𝑖) was obtained using EQ 3.1.
𝐷𝐹 =𝜎𝑖
∑ 𝜎𝑗𝑁1
× 𝑚 EQ 3.1
Where:
𝐷𝐹 = Distribution Factor
𝜎𝑖 = longitudinal stress at bottom flange of girder i in mid-span from the FEM
� 𝜎𝑗𝑁
1
= sum of longitudinal stress at bottom flange of all the girders in mid-span
𝑚 = multiple presence factor (one lane= 1.2; two lanes=1.0; three lanes=0.85; four lanes and more=0.65)
The multiple presence factor in EQ 3.1 takes into consideration the probability that one, two, or more lanes will be simultaneously loaded.
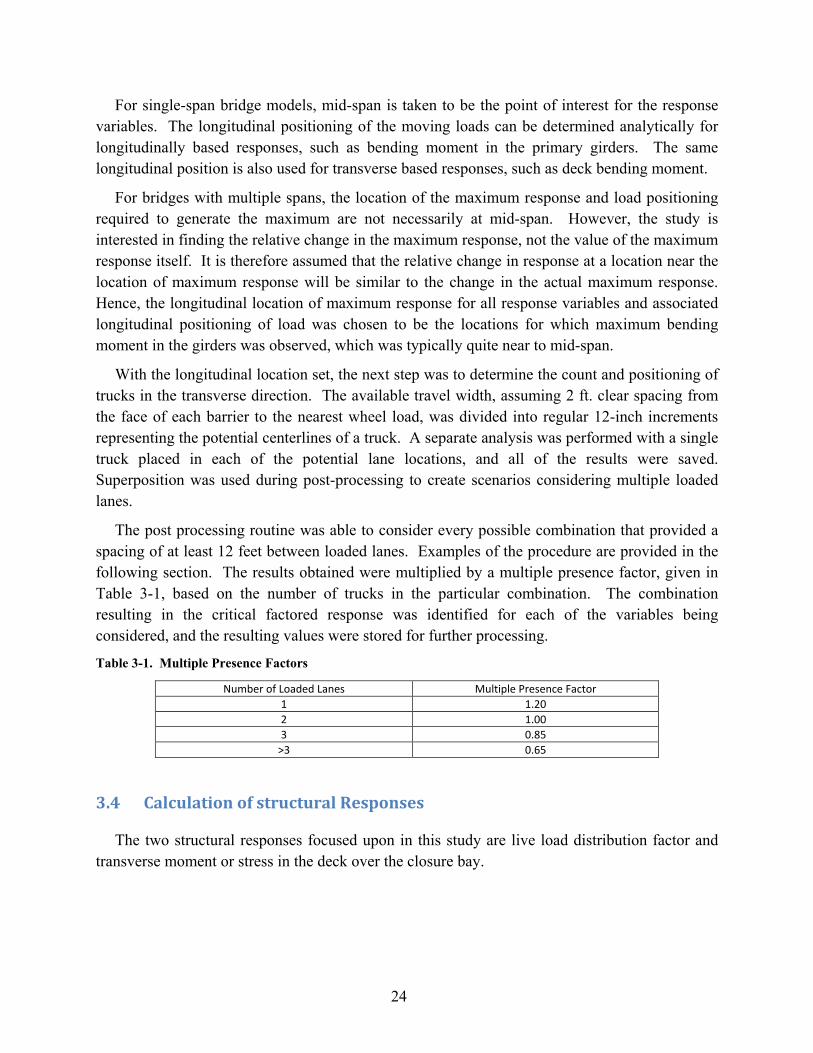
Figure 3-3 presents the influence lines for the distribution factor of each girder in the I-95 over SR-421 Bridge. The x-axis represents the centerline location of a single truck. The y-axis is the distribution factor obtained due to the presence of the truck calculated using EQ 3.1. Note that the values in Figure 3-3 do not yet have the multiple presence factor applied.
26
Figure 3-3. Influence lines of distribution factors for all girders, I-95 Bridge over SR-421
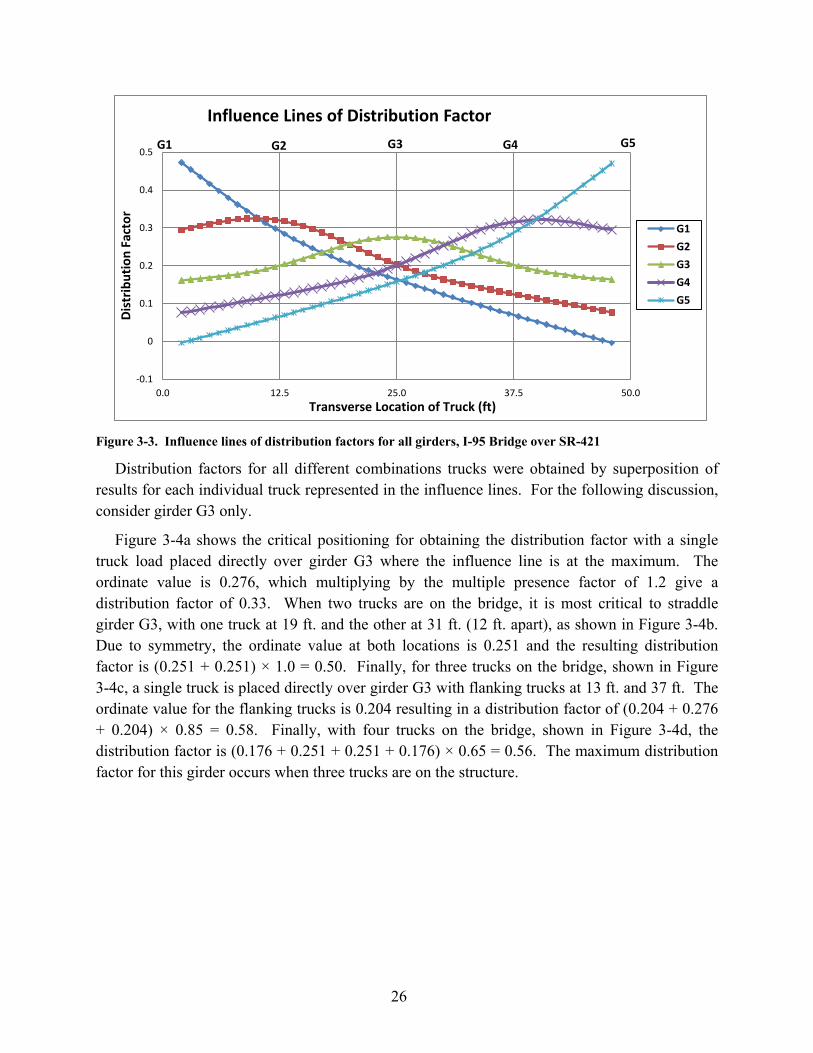
Distribution factors for all different combinations trucks were obtained by superposition of results for each individual truck represented in the influence lines. For the following discussion, consider girder G3 only.
Figure 3-4a shows the critical positioning for obtaining the distribution factor with a single truck load placed directly over girder G3 where the influence line is at the maximum. The ordinate value is 0.276, which multiplying by the multiple presence factor of 1.2 give a distribution factor of 0.33. When two trucks are on the bridge, it is most critical to straddle girder G3, with one truck at 19 ft. and the other at 31 ft. (12 ft. apart), as shown in Figure 3-4b. Due to symmetry, the ordinate value at both locations is 0.251 and the resulting distribution factor is (0.251 + 0.251) × 1.0 = 0.50. Finally, for three trucks on the bridge, shown in Figure 3-4c, a single truck is placed directly over girder G3 with flanking trucks at 13 ft. and 37 ft. The ordinate value for the flanking trucks is 0.204 resulting in a distribution factor of (0.204 + 0.276 + 0.204) × 0.85 = 0.58. Finally, with four trucks on the bridge, shown in Figure 3-4d, the distribution factor is (0.176 + 0.251 + 0.251 + 0.176) × 0.65 = 0.56. The maximum distribution factor for this girder occurs when three trucks are on the structure.
-0.1
0
0.1
0.2
0.3
0.4
0.5
0.0 12.5 25.0 37.5 50.0
Dist
ribut
ion
Fact
or
Transverse Location of Truck (ft)
Influence Lines of Distribution Factor
G1G2G3G4G5
G1 G2 G3 G4 G5
27
(a)
(b)
Figure 3-4. The critical positioning for obtaining the distribution factor with: (a) A single truck, (b) Two tracks, (c) Three trucks, (d) Four trucks
-0.1
0
0.1
0.2
0.3
0.4
0.5
0.0 12.5 25.0 37.5 50.0
Dist
ribut
ion
Fact
or
Transverse Location of Truck (ft)
Influence Lines of Distribution Factor
G1G2G3G4G5
G1 G2 G3 G4 G5
-0.1
0
0.1
0.2
0.3
0.4
0.5
0.0 12.5 25.0 37.5 50.0
Dist
ribut
ion
Fact
or
Transverse Location of Truck (ft)
Influence Lines of Distribution Factor
G1G2G3G4G5
G1 G2 G3 G4 G5

28
(c)
(d)
Figure 3-4. The critical positioning for obtaining the distribution factor with: (a) A single truck, (b) Two tracks, (c) Three trucks, (d) Four trucks – Cont’d
The previously described process is repeated for each girder in the cross-section and must also be repeated for each analysis case considered. The influence line for Girder G3 lends itself to analysis by inspection; however, this is not the case in general. Therefore, the post-processing routine considers every valid combination of positions and selects the maximum observed values. Due to the shape of the influence line for distribution factor, the critical combination of trucks will always be a tightly spaced grouping, which simplifies the analysis since the trucks can be moved as a block across the bridge. However, this does not hold true for analysis of transverse stress in the deck as will be demonstrated in the following section.
-0.1
0
0.1
0.2
0.3
0.4
0.5
0.0 12.5 25.0 37.5 50.0
Dist
ribut
ion
Fact
or
Transverse Location of Truck (ft)
Influence Lines of Distribution Factors for All Girders
G1G2G3G4G5
G1 G2 G3 G4 G5
-0.1
0
0.1
0.2
0.3
0.4
0.5
0.0 12.5 25.0 37.5 50.0
Dist
ribut
ion
Fact
or
Transverse Location of Truck (ft)
Influence Lines of Distribution Factors for All Girders
G1G2G3G4G5
G1 G2 G3 G4 G5
29
To demonstrate the general procedure, Table 3-2 presents complete results obtained for Girder G3 in the I-95 over SR-421 Bridge. The table shows distribution factor for girder G3 for all cases of different number of trucks moving across the bridge. Since the trucks move adjacent to each other, the first column indicates the location of the first truck. Subsequent trucks are spaced at 12 ft. The maximum observed value from all cases is selected as the distribution factor. The values obtained in the sample calculations above have been highlighted. For this example, Table 3-2 shows there were 132 possible combinations of truck positions that were analyzed to get the maximum distribution factor corresponding to each girder. Similar effort was required for every case considered in the parametric study.

30
Table 3-2. Results from general procedure for determining maximum distribution factor
Center Line of Leftmost Truck (ft.)1
Distribution Factor of G3
One Truck Two trucks Three trucks Four trucks
2 0.194 0.372 0.550 0.550 3 0.196 0.382 0.557 0.551 4 0.199 0.392 0.562 0.552 5 0.202 0.402 0.567 0.552 6 0.205 0.413 0.571 0.553 7 0.209 0.424 0.574 0.553 8 0.213 0.435 0.576 0.553 9 0.217 0.446 0.578 0.553
10 0.223 0.456 0.580 0.552 11 0.230 0.464 0.581 0.552 12 0.237 0.472 0.582 0.551 13 0.245 0.480 0.582 14 0.253 0.486 0.582 15 0.262 0.492 0.582 16 0.271 0.496 0.581 17 0.281 0.499 0.580 18 0.291 0.501 0.578 19 0.301 0.501 0.575 20 0.310 0.501 0.572 21 0.317 0.499 0.569 22 0.324 0.497 0.564 23 0.328 0.492 0.559 24 0.330 0.487 0.553 25 0.331 0.481 26 0.330 0.474 27 0.328 0.466 28 0.324 0.457 29 0.317 0.447 30 0.309 0.437 31 0.301 0.426 32 0.291 0.415 33 0.282 0.405 34 0.272 0.394 35 0.263 0.384 36 0.254 0.375 37 0.246 38 0.238 39 0.231 40 0.225 41 0.220 42 0.215 43 0.211 44 0.207 45 0.204 46 0.201 47 0.198 48 0.196
MAX 0.331 0.501 0.582 0.553 Overall Max 0.582
1. The origin is at location of G1 as shown in Figure 3-4

31
3.4.2 Transverse Stress in the Deck
The other response to be investigated was transverse stresses or moment in the deck over the closure bay. Again, the interest is in evaluating the relative change due to the various framing configurations so either stress or moment would be an appropriate variable to consider. The results being presented here make use of stresses.
For each analysis, the transverse stresses were obtained at six locations on the concrete deck illustrated in Figure 3-5. These stresses were found to arise predominately due to flexural action with a negligible minimal membrane component such that at each location the value of stresses from the bottom side were simply the negative of the values obtained on the top side and in direct proportion to the transverse bending moment.
Figure 3-5. Position of the points where the stresses of deck were obtained
Figure 3-6 presents the influence lines for transverse stress obtained for the I-95 over SR-421 Bridge. The x-axis represents the centerline location of a single truck. The y-axis is the transverse stress. The values shown in Figure 3-6 have not been modified by a multiple presence factor. The previously mentioned relationship between top side and bottom side stresses is readily apparent.

32
Figure 3-6. Influence lines – Transverse deck stress
The influence line for stress on the bottom of the slab at the middle of the closure bay has been isolated in Figure 3-7 for further discussion. A positive ordinate value indicates tension along the bottom of the deck, which is typically considered positive bending moment for deck design. Note that the response is more complex than what was obtained for distribution factor. The primary consideration is the wheel location relative to the girders. When a wheel is located directly above a girder, it results in zero stress within the deck. Consider the case when a truck is centered over the closure region (x-value of 31.25 ft.); its wheels are near to the girders, and there is a relative low point observed in the transverse stresses. However, as the truck is moved in either direction, one of the wheels moves towards the midpoint and results in a larger transverse stress.
Negative ordinate values indicate compression on the bottom of the slab, or negative deck flexure. Negative flexure is maximized when the truck is positioned outside of the closure bay. The trucks shown in Figure 3-7 are positioned to generate the maximum compressive stress. Note that the spacing between these trucks is greater than the assumed lane width of 12 ft., with one located at 18 ft. and the other at 45 ft. The total compressive stress due to the loading shown in Figure 3-7 is calculated to be (-0.0279 + -0.0443) × 1.0 = 0.0722. Considering a single truck would give -0.0443×1.2 = 0.53.
-0.4
-0.3
-0.2
-0.1
0
0.1
0.2
0.3
0.4
0.0 12.5 25.0 37.5 50.0
Deck
Tra
nsve
rse
Stre
sses
(ksi
)
Transverse Location of Truck (ft)
Influence Lines of Deck Transverse Stresses in Closure Pour Bay
Top Left Side
Top Middle
Top Right Side
Bottom Left Side
Bottom Middle
Bottom Right Side
G1 G2 G3 G4 G5
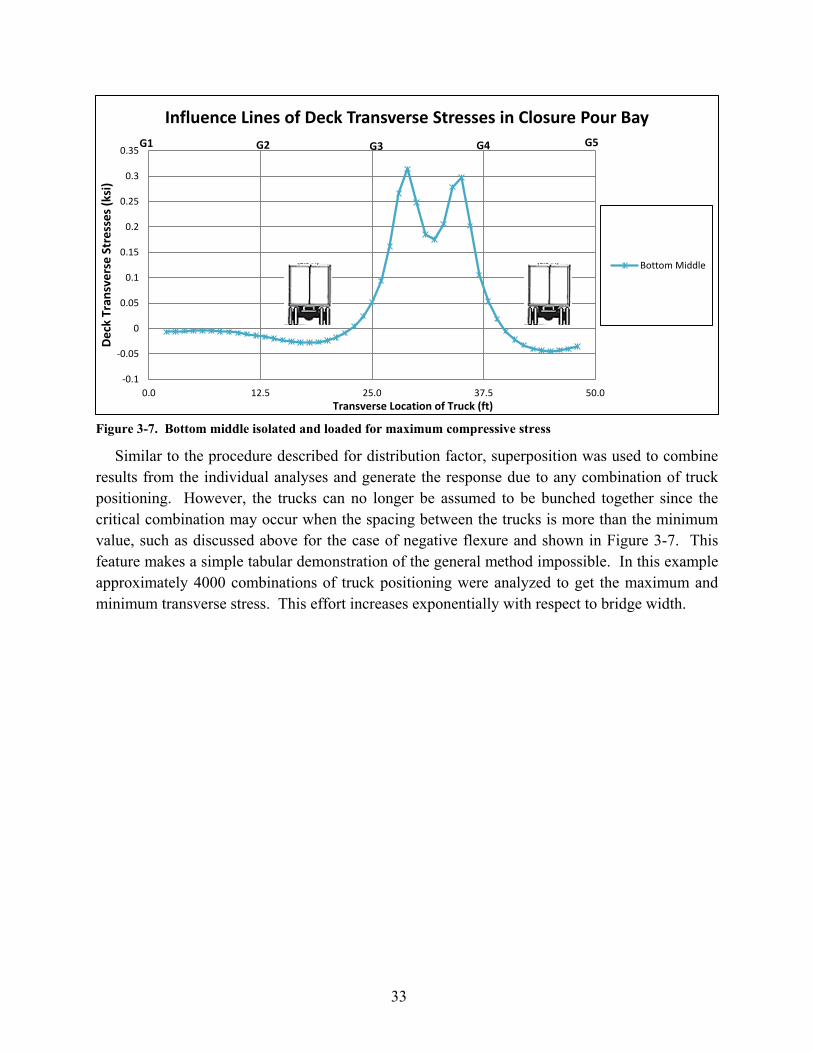
33
Figure 3-7. Bottom middle isolated and loaded for maximum compressive stress
Similar to the procedure described for distribution factor, superposition was used to combine results from the individual analyses and generate the response due to any combination of truck positioning. However, the trucks can no longer be assumed to be bunched together since the critical combination may occur when the spacing between the trucks is more than the minimum value, such as discussed above for the case of negative flexure and shown in Figure 3-7. This feature makes a simple tabular demonstration of the general method impossible. In this example approximately 4000 combinations of truck positioning were analyzed to get the maximum and minimum transverse stress. This effort increases exponentially with respect to bridge width.
-0.1
-0.05
0
0.05
0.1
0.15
0.2
0.25
0.3
0.35
0.0 12.5 25.0 37.5 50.0
Deck
Tra
nsve
rse
Stre
sses
(ksi
)
Transverse Location of Truck (ft)
Influence Lines of Deck Transverse Stresses in Closure Pour Bay
Bottom Middle
G1 G2 G3 G4 G5
34
Chapter 4 Parametric Study
A parametric study was conducted to help comprehend the role that cross-frames in the closure pour region have on the performance of the structure. Specific responses examined were the live load distribution factors of the girders and transverse stress of the deck. The five parameters investigated are: a) Girder spacing, b) Thickness of the deck, c) Depth of the girders, d) Number of girders in phases I and II, e) Cross-frames spacing.
For all analysis cases, the study considered three cross-frame configurations: full cross-frame, complete removal of the frame, and elimination of diagonal elements leaving only horizontal struts.
4.1 Prototype Bridges
The structural models used in the parametric study correspond to actual phase construction projects constructed by FDOT. Two single span, non-skewed (or slightly skewed) bridges – I-95 over SR-421 and SR-589 over Waters Avenue – have been used to conduct the full parametric study. The I-95 Bridge over SR-421 is a bridge replacement project and the SR-589 Bridge over Waters Avenue is double sided widening project. The following section presents detailed information about the bridges.
4.1.1 Bridge I-95 over SR-421
The I-95 Bridge over SR-421 is a 7° skew, steel I-girder bridge. The bridge consists of five steel girders. Three girders were built in Phase I and the other two in Phase II. Table 4-1 and Figure 4-1 to Figure 4-4 depict the geometrical characteristics of the bridge.
Table 4-1. Geometrical characteristics of the I-95 Bridge over SR-421.
Project Span length skew Cross-frame spacing Girder
spacing
Thickness of the
deck
Width of the
deck
I-95 over
SR-421 190 ft. 7° 22 ft. 150 in 8.5 in 59 ft, 1in

35
Figure 4-1. Cross-section of the bridge I-95 over SR-421
5 Figure 4-2. Framing plan of the I-95 Bridge over SR-421
Figure 4-3. Cross-frame details of the I-95 Bridge over SR-421
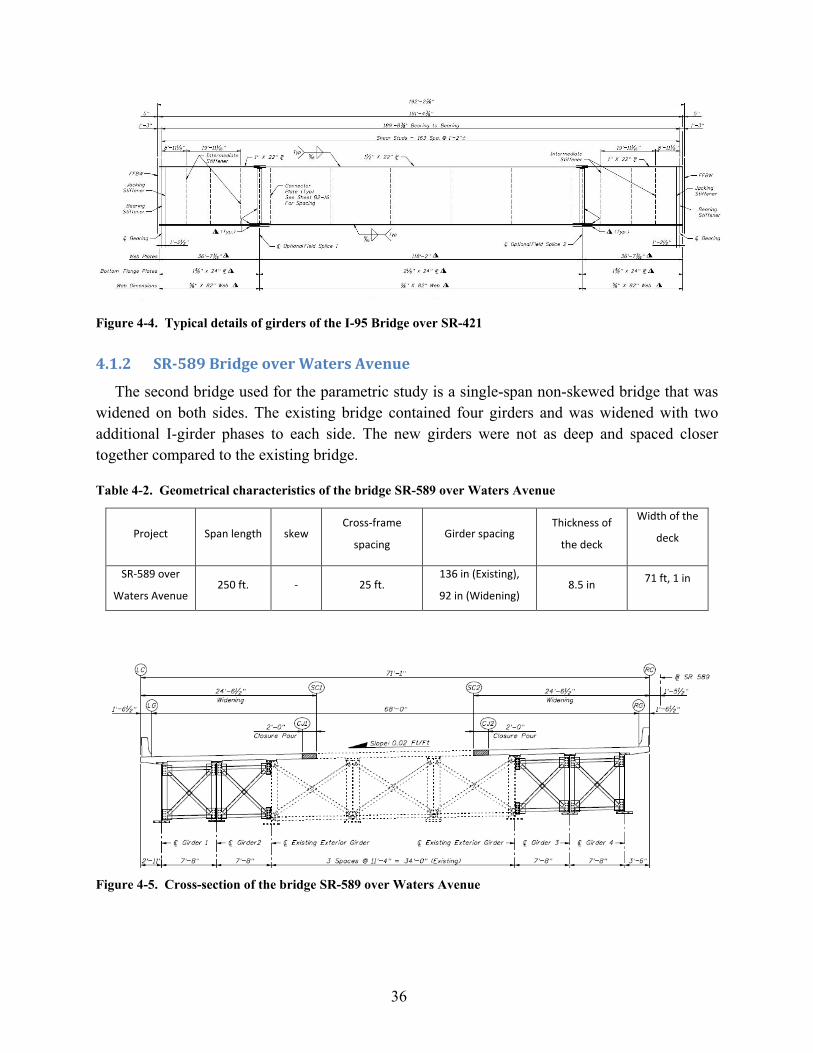
36
Figure 4-4. Typical details of girders of the I-95 Bridge over SR-421
4.1.2 SR-589 Bridge over Waters Avenue
The second bridge used for the parametric study is a single-span non-skewed bridge that was widened on both sides. The existing bridge contained four girders and was widened with two additional I-girder phases to each side. The new girders were not as deep and spaced closer together compared to the existing bridge.
Table 4-2. Geometrical characteristics of the bridge SR-589 over Waters Avenue
Project Span length skew Cross-frame
spacing Girder spacing
Thickness of
the deck
Width of the
deck
SR-589 over
Waters Avenue 250 ft. - 25 ft.
136 in (Existing),
92 in (Widening) 8.5 in 71 ft, 1 in
Figure 4-5. Cross-section of the bridge SR-589 over Waters Avenue

37
Figure 4-6. Framing plan of the bridge SR-589 over Waters Avenue
Figure 4-7. Cross-frame details of the bridge SR-589 over Waters Avenue
Figure 4-8. Typical Details of Girders of the Bridge SR-589 over Waters Avenue
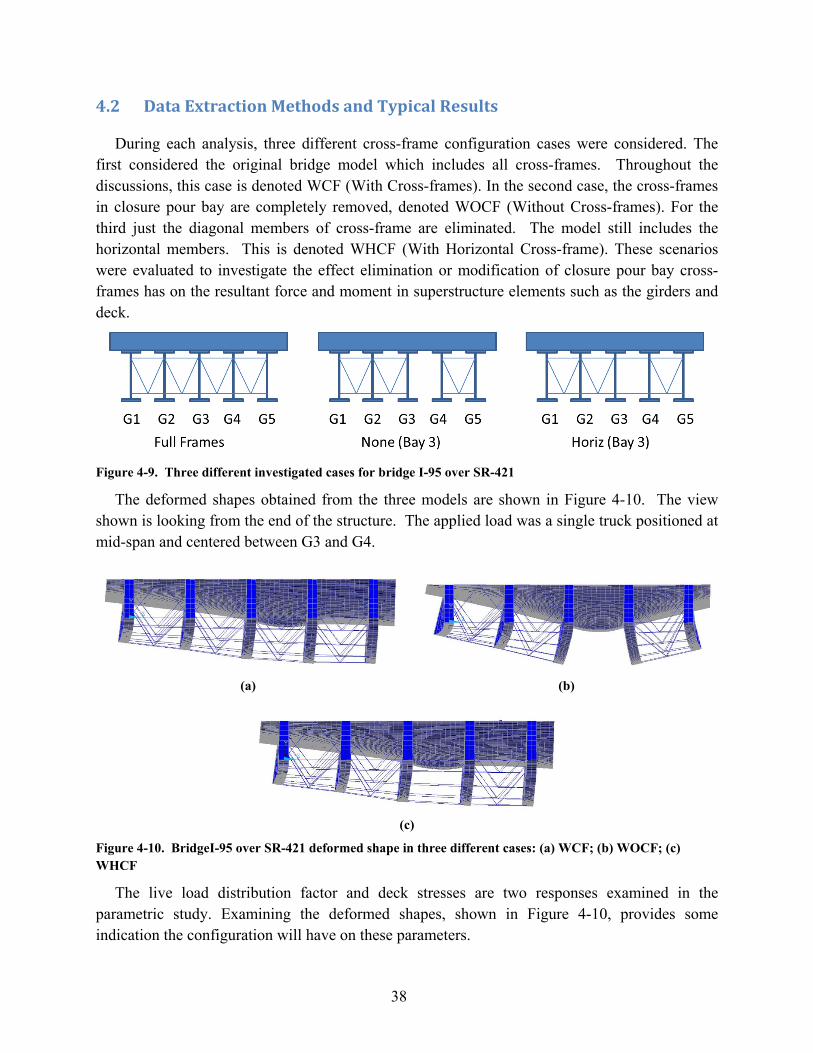
38
4.2 Data Extraction Methods and Typical Results
During each analysis, three different cross-frame configuration cases were considered. The first considered the original bridge model which includes all cross-frames. Throughout the discussions, this case is denoted WCF (With Cross-frames). In the second case, the cross-frames in closure pour bay are completely removed, denoted WOCF (Without Cross-frames). For the third just the diagonal members of cross-frame are eliminated. The model still includes the horizontal members. This is denoted WHCF (With Horizontal Cross-frame). These scenarios were evaluated to investigate the effect elimination or modification of closure pour bay cross-frames has on the resultant force and moment in superstructure elements such as the girders and deck.
Figure 4-9. Three different investigated cases for bridge I-95 over SR-421
The deformed shapes obtained from the three models are shown in Figure 4-10. The view shown is looking from the end of the structure. The applied load was a single truck positioned at mid-span and centered between G3 and G4.
(a) (b)
(c)
Figure 4-10. BridgeI-95 over SR-421 deformed shape in three different cases: (a) WCF; (b) WOCF; (c) WHCF
The live load distribution factor and deck stresses are two responses examined in the parametric study. Examining the deformed shapes, shown in Figure 4-10, provides some indication the configuration will have on these parameters.

39
When the cross-frames are completely removed Figure 4-10b, the two phases tend to rotate independent of each other. This results in greater vertical deflection of the girders immediately adjacent to the closure bay. Since this is a linear elastic analysis of a simply supported structure, greater deflection is indicative of greater moment in the deck and girders.
Consider specifically Phase I of the bridge shown in Figure 4-10 – clockwise rotation of the phase means that G3 deflects more, and consequently carries more load, when the cross-frames are removed than with the cross-frame present. Likewise, the deflection of G1 is less. Distribution factor is the relative measure of load within each girder. Therefore, the distribution factor for G3 will be greater when the cross-frames are removed. As seen in Figure 4-10c the horizontal struts limit the independent rotation of the phases and the deflection profile is similar to the case when the full cross-frames are present. Therefore, there will be little change in distribution factors.
The effect of cross-frame configuration on transverse stress, or moment, in the deck is also readily apparent from the deformed shapes. Independent rotation of the phases due to removal of cross-frames, seen in Figure 4-10b, produces greater curvature in the deck at the midpoint between the two phases. This increased curvature is a direct indication of greater transverse moment (positive deck design moment) at the same location. Also note that this rotation will reduce the curvature/moment (negative deck design moment) at the girder directly adjacent to the closure region. Again, the horizontal struts limit the independent rotation of the phases associated changes in deck moment.
The goal of the parametric study is to quantify the effect described above in relation to various geometric factors. Following is a detailed description of the results obtained. This is presented for only one of the parameters (girder spacing) for demonstration purposes. Brief results for all parameters are provided in Sections 4.3.1 through 4.3.6.
4.2.1 Distribution Factor
Figure 4-11 present typical distribution factor results obtained from all five girders of both phases of the I-95 Bridge over SR 421. The graphs are related to study of girder spacing for The I-95 Bridge over SR 421. First, the graphs show the general trend of increase in distribution factor due to increase in girder spacing. Second, the graphs indicate increase in distribution factor for interior girders due to elimination of cross-frame between construction phases, while for the exterior girders some slight decreases are shown. Last, between interior girders, two girders of different construction phases adjacent to closure pour bay experience significant increase in distribution factor. The graphs indicate a greater distribution factor increase for the girder belonging to Phase I.
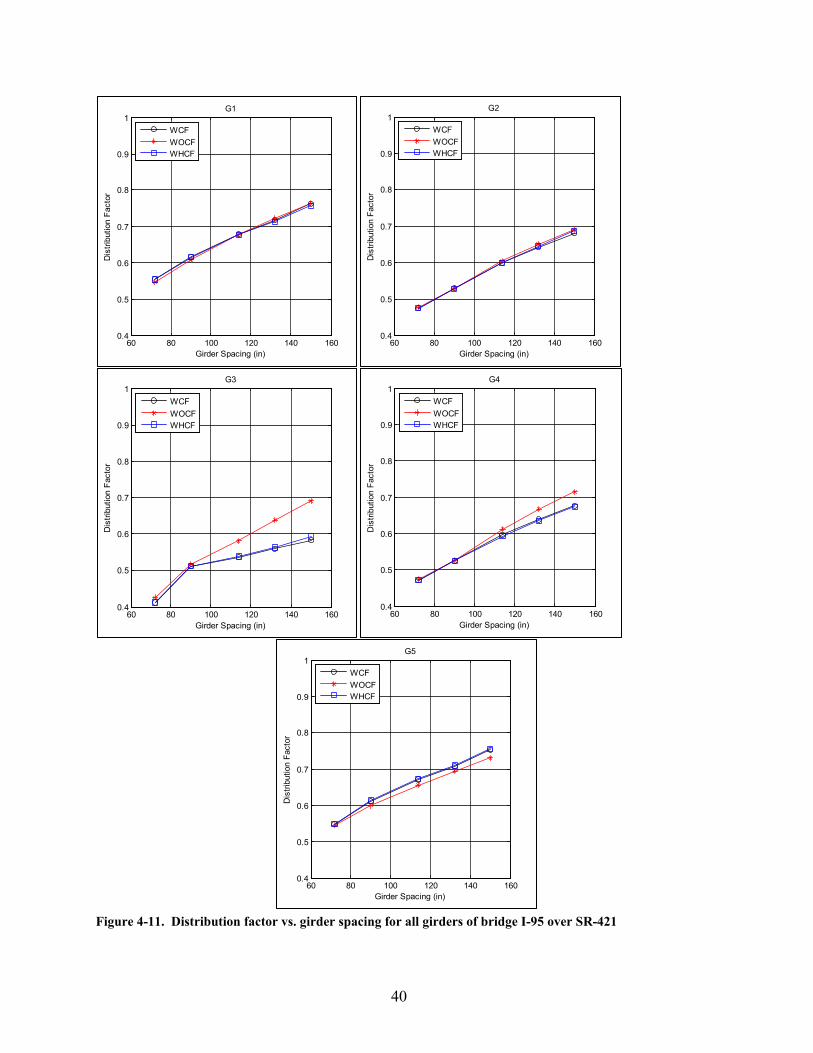
40
Figure 4-11. Distribution factor vs. girder spacing for all girders of bridge I-95 over SR-421
60 80 100 120 140 1600.4
0.5
0.6
0.7
0.8
0.9
1
Girder Spacing (in)
Dis
tribu
tion
Fact
orG1
WCFWOCFWHCF
60 80 100 120 140 1600.4
0.5
0.6
0.7
0.8
0.9
1
Girder Spacing (in)
Dis
tribu
tion
Fact
or
G2
WCFWOCFWHCF
60 80 100 120 140 1600.4
0.5
0.6
0.7
0.8
0.9
1
Girder Spacing (in)
Dis
tribu
tion
Fact
or
G3
WCFWOCFWHCF
60 80 100 120 140 1600.4
0.5
0.6
0.7
0.8
0.9
1
Girder Spacing (in)
Dis
tribu
tion
Fact
orG4
WCFWOCFWHCF
60 80 100 120 140 1600.4
0.5
0.6
0.7
0.8
0.9
1
Girder Spacing (in)
Dis
tribu
tion
Fact
or
G5
WCFWOCFWHCF

41
As concluded from the graphs, elimination of cross-frames between construction phases generally causes an increase in the distribution factor of interior girders and a very slight change in distribution factor of the exterior girders. As shown in graphs, G3 experiences the maximum increase in distribution factor due to elimination of cross-frames. G4 and G3 and other interior girders generally have higher distribution factors. The AASHTO’s approach in calculation of distribution factors includes utilizing the same distribution factor for all interior girders. Therefore, 3D analysis performed in this study will be using the maximum value of distribution factor for all interior girders. For each girder spacing, the maximum distribution factors corresponding to three cases of WCF, WOCF, and WHCF were compared to find the actual change in design distribution factor as shown in Table 4-3. Table 4-3 represents the distribution factors and change percentages for different girder spacing of bridge I-95 over SR-421. As it is shown, the change in the maximum observed distribution factor is 5.2%. Note that the maximum change in an individual girder (G3) was about 20%; however, the distribution factor in this girder was still less that that observed in girder G4.
Table 4-3. Summarized results related to effect of girder spacing on distribution factor for the I-95 Bridge over SR-421
WCF WOCF WHCF
Girder Spacing (inch) Value Value Change (%) Value Change (%)
72 0.475 0.477 0.4 0.475 0.1
90 0.528 0.529 0.1 0.528 -0.1
114 0.599 0.612 2.2 0.6 0.2
132 0.642 0.667 3.9 0.645 0.5
150* 0.68 0.716 5.2 0.686 0.8
* The original girder spacing of bridges
4.2.2 Transverse Deck Stress / Moment
Typical deck stress distributions for the three cross-frame configurations are shown in Figure 4-12. The dark blue color of the contour show compression in top of deck in closure pour bay. In WOCF case, the dark blue is extended over the closure pour bay, which indicates an increase in the transverse moment and corresponding stresses over the closure pour bay due to the elimination of cross-frames between construction phases. For the case with horizontal struts, only slight changes are observed.
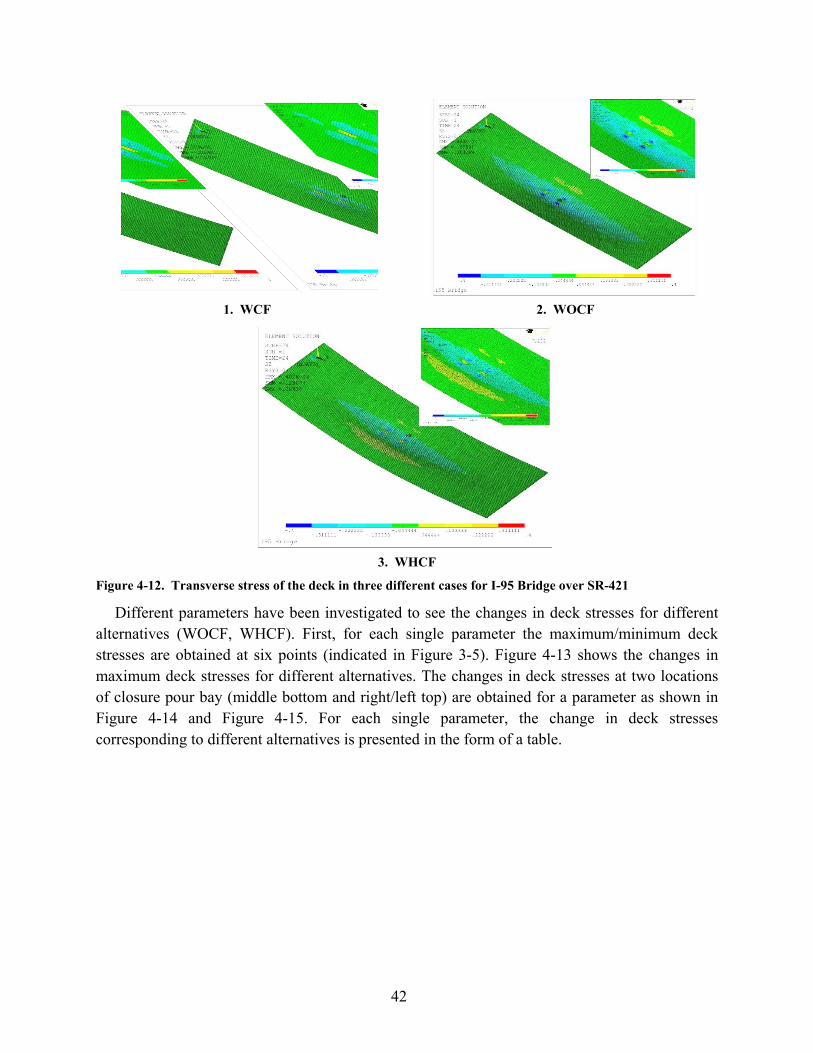
42
1. WCF 2. WOCF
3. WHCF
Figure 4-12. Transverse stress of the deck in three different cases for I-95 Bridge over SR-421
Different parameters have been investigated to see the changes in deck stresses for different alternatives (WOCF, WHCF). First, for each single parameter the maximum/minimum deck stresses are obtained at six points (indicated in Figure 3-5). Figure 4-13 shows the changes in maximum deck stresses for different alternatives. The changes in deck stresses at two locations of closure pour bay (middle bottom and right/left top) are obtained for a parameter as shown in Figure 4-14 and Figure 4-15. For each single parameter, the change in deck stresses corresponding to different alternatives is presented in the form of a table.

43
Figure 4-13. Deck stresses in 6 points including top and bottom of deck in two side and middle point for a single parameter Girder Spacing =72 in
Figure 4-14. Transverse stress of the deck vs. girder spacing at bottom mid-point
Left mid Right-0.4
-0.3
-0.2
-0.1
0
0.1
0.2
0.3
Deck Over Closour Pour Bay
Tran
sver
se S
tress
(ksi
)
Girder Spacing=72 (in)
WCF-TOPWOCF-TOPWHCF-TOPWCF-BOTWOCF-BOTWHCF-BOT
70 80 90 100 110 120 130 140 1500
0.1
0.2
0.3
0.4
0.5
0.6
Girder Spacing (in)
Tran
sver
se S
tress
(ksi
)
Deck Stress – Bottom – Middle of Closure Bay (B/W G3 @ G4)
WCFWOCFWHCF
Deck Over Closure Pour Bay
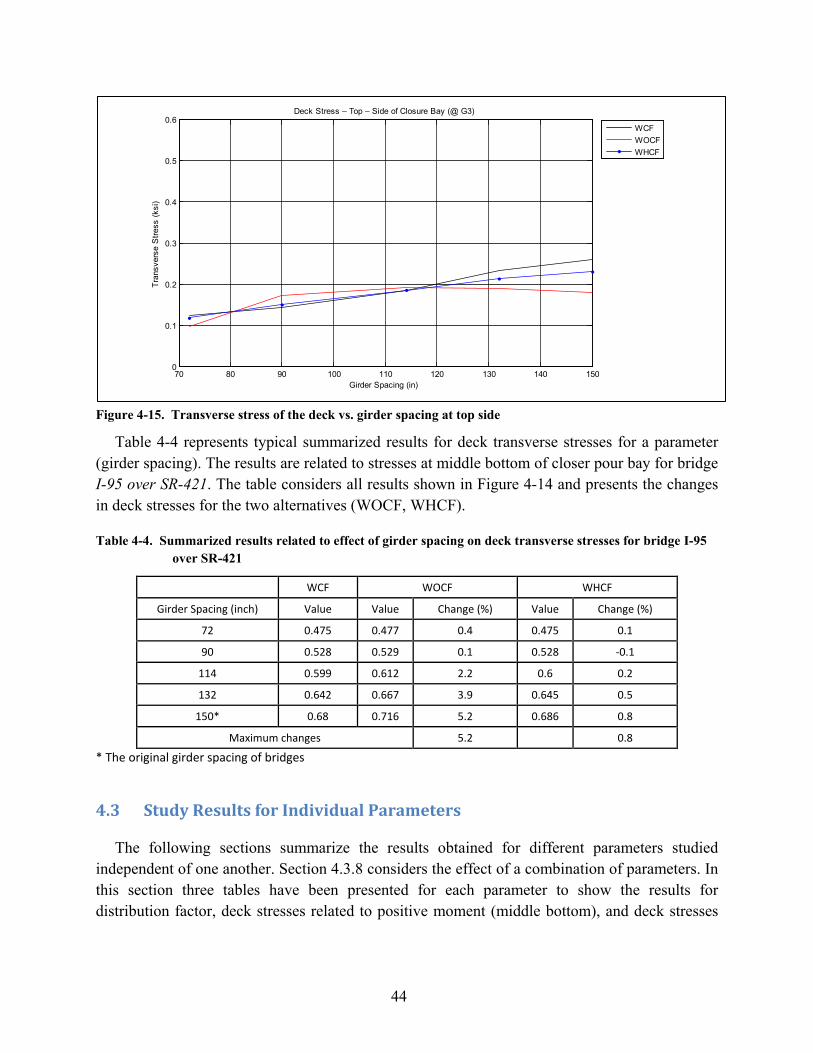
44
Figure 4-15. Transverse stress of the deck vs. girder spacing at top side
Table 4-4 represents typical summarized results for deck transverse stresses for a parameter (girder spacing). The results are related to stresses at middle bottom of closer pour bay for bridge I-95 over SR-421. The table considers all results shown in Figure 4-14 and presents the changes in deck stresses for the two alternatives (WOCF, WHCF).
Table 4-4. Summarized results related to effect of girder spacing on deck transverse stresses for bridge I-95 over SR-421
WCF WOCF WHCF
Girder Spacing (inch) Value Value Change (%) Value Change (%)
72 0.475 0.477 0.4 0.475 0.1
90 0.528 0.529 0.1 0.528 -0.1
114 0.599 0.612 2.2 0.6 0.2
132 0.642 0.667 3.9 0.645 0.5
150* 0.68 0.716 5.2 0.686 0.8
Maximum changes 5.2 0.8
* The original girder spacing of bridges
4.3 Study Results for Individual Parameters
The following sections summarize the results obtained for different parameters studied independent of one another. Section 4.3.8 considers the effect of a combination of parameters. In this section three tables have been presented for each parameter to show the results for distribution factor, deck stresses related to positive moment (middle bottom), and deck stresses
70 80 90 100 110 120 130 140 1500
0.1
0.2
0.3
0.4
0.5
0.6
Girder Spacing (in)
Tran
sver
se S
tress
(ksi
)
Deck Stress – Top – Side of Closure Bay (@ G3)
WCFWOCFWHCF

45
related to negative moment (right/left top) respectively. Detailed results can be found in Appendix A.
4.3.1 Girder Spacing
Girder spacing was the first parameter studied. Five different analyses with different girder spacing were performed for both bridge models (I-95 over SR-421 and SR-589 over Waters Avenue). The results obtained for the live load distribution factor and transverse deck stresses are presented below.
4.3.1.1 Distribution Factor Table 4-5 summarizes the distribution factor results for both bridges. The values shown for
each girder spacing (row) are the maximum distribution factors between the interior girders for the three cases of the original bridge (WCF) and two alternatives (WOCF and WHCF). The changes corresponding to using either alternative also is shown in the table. The results show that the maximum increase in distribution factor when cross-frames are removed (WOCF) is 13.5%. When the horizontal strut is used (WHCF), the maximum increase is less than 2.33%.
Table 4-5. Summarized results related to effect of girder spacing on distribution factor
Dist
ribut
ion
Fact
or
Bridge I-95
WCF WOCF WHCF
Girder Spacing (inch) Value Value Change (%) Value Change (%)
72 0.475 0.477 0.4 0.475 0.1
90 0.528 0.529 0.1 0.528 -0.1
114 0.599 0.612 2.2 0.6 0.2
132 0.642 0.667 3.9 0.645 0.5
150* 0.68 0.716 5.2 0.686 0.8
Maximum changes 5.2 0.8
Bridge SR-589
WCF WOCF WHCF
Girder Spacing (inch)1 Value Value Change (%) Value Change (%)
50-94 0.406 0.422 4 0.404 -0.55
68-112 0.453 0.488 7.6 0.45 -0.69
92-136* 0.501 0.569 13.5 0.5 -0.15
110-154 0.565 0.625 10.7 0.578 2.33
128-172 0.652 0.712 9.3 0.666 2.21
Maximum changes 13.5 2.33
Overall Maximum changes 13.5 2.33
* The original girder spacing of bridges 1Girder spacing in phases are unequal; Phase I girder spacing listed first (Check Figure 4-5)

46
4.3.1.2 Deck Transverse Stresses Table 4-6 and Table 4-7 provide the positive and negative flexural deck stress results obtained
from the two structures. The results in Table 4-6 show that the transverse stresses on the bottom side of the deck at the middle of the closure bay (positive flexure) change significantly due to elimination of cross-frames (46.3% and 50.7% for bridge models I-95 over SR-421and SR-589 over Waters Avenue, respectively). For the case of negative flexure – transverse stress on the top surface of the deck directly above the girder – the two bridge models display different results, which are provided in Table 4-7. While the I-95 over SR-421 Bridge shows up to a 20% increase in the stress, the SR-589 over Waters Avenue Bridge shows more than 30% decrease. The changes observed for the case with horizontal members are less significant with a maximum increase of only 5%.
Table 4-6. Deck stress (positive bending) vs. girder spacing
Deck
stre
sses
- Bot
tom
- Mid
dle
of C
losu
re B
ay
Bridge I-95
WCF WOCF WHCF Girder Spacing
(inch) Value (ksi) Value (ksi) Change (%) Value (ksi) Change (%)
72.00 0.225 0.330 46.2 0.222 -1.4
90.00 0.263 0.397 50.7 0.264 0.2
114.00 0.319 0.470 47.6 0.320 0.3
132.00 0.323 0.477 47.4 0.323 -0.1
150* 0.377 0.532 41.2 0.375 -0.4
Maximum changes 50.7 0.3
Bridge SR-589
WCF WOCF WHCF Girder Spacing
(inch)1 Value (ksi) Value (ksi) Change (%) Value (ksi) Change (%)
50-94 0.26 0.38 46.3 0.26 1.1
68-112 0.29 0.40 40.6 0.29 1.0
92-136* 0.31 0.45 42.3 0.31 -0.8
110-154 0.36 0.49 36.5 0.37 2.3
128-172 0.37 0.50 35.0 0.38 2.2
Maximum changes 46.3 2.3
Overall Maximum changes 50.7 2.3 *Base Girder Spacing 1Girder spacing in phases are unequal; Phase I girder spacing listed first (Check Figure 4-5)

47
Table 4-7. Deck stress (negative bending) vs. girder spacing De
ck st
ress
es- T
op- A
t Sid
es o
ver G
irder
s
Bridge I-95
WCF WOCF WHCF
Girder Spacing (inch) Value (ksi) Value (ksi) Change (%) Value (ksi) Change (%)
72.00 0.124 0.099 -20.5 0.118 -4.6
90.00 0.144 0.173 20.3 0.150 4.4
114.00 0.185 0.193 4.2 0.185 0.1
132.00 0.234 0.189 -19.5 0.214 -8.7
150* 0.260 0.180 -30.6 0.231 -11.1
Maximum changes 20.3 4.4
Bridge SR-589
WCF WOCF WHCF
Girder Spacing (inch)1 Value (ksi) Value (ksi) Change (%) Value (ksi) Change (%)
50-94 0.133 0.087 -34.7 0.112 -15.7
68-112 0.167 0.099 -40.9 0.151 -9.7
92-136* 0.228 0.140 -38.4 0.185 -18.7
110-154 0.271 0.160 -40.7 0.221 -18.4
128-172 0.317 0.203 -35.9 0.258 -18.5
Maximum changes -34.7 -9.7
Overall Maximum changes 20.3 4.4 *Base Girder Spacing 1Girder spacing in phases are unequal; Phase I girder spacing listed first (See Figure 4-5)
4.3.2 Depth of Girders
The second parameter investigated was the girder depth. Five different girder depths were considered. The actual depth of the girder in the prototype bridge was used as the base condition then the girder depth was varied in six-inch increments both increasing and decreasing. As has already been discussed, the individual models, particularly when the depth has been decreased will not necessarily be valid designs. The objective is to assess the sensitivity of the response variable change for the alternate frame configurations to the depth of the girders in the vicinity of the base design.
4.3.2.1 Distribution Factor Table 4-8 provides distribution factor results for both structures. The results show an increase
of up to 11% (4.4% and 11.0% for bridge model I-95 over SR-421and SR-589 over Waters Avenue respectively) due to elimination of cross-frames. The results for the alternative cross-frame (WHCF) indicate a very low change (less than 1.5%) for both girders.
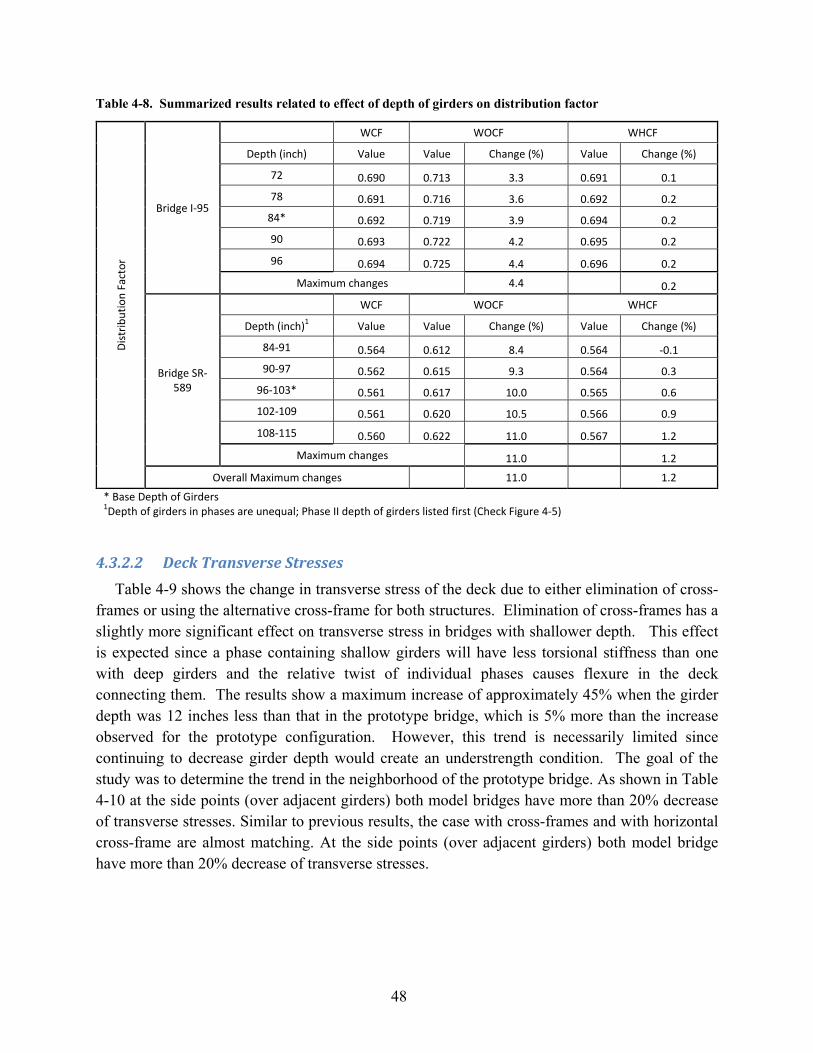
48
Table 4-8. Summarized results related to effect of depth of girders on distribution factor Di
strib
utio
n Fa
ctor
Bridge I-95
WCF WOCF WHCF
Depth (inch) Value Value Change (%) Value Change (%)
72 0.690 0.713 3.3 0.691 0.1 78 0.691 0.716 3.6 0.692 0.2
84* 0.692 0.719 3.9 0.694 0.2 90 0.693 0.722 4.2 0.695 0.2
96 0.694 0.725 4.4 0.696 0.2
Maximum changes 4.4 0.2
Bridge SR-589
WCF WOCF WHCF
Depth (inch)1 Value Value Change (%) Value Change (%)
84-91 0.564 0.612 8.4 0.564 -0.1 90-97 0.562 0.615 9.3 0.564 0.3
96-103* 0.561 0.617 10.0 0.565 0.6 102-109 0.561 0.620 10.5 0.566 0.9
108-115 0.560 0.622 11.0 0.567 1.2
Maximum changes 11.0 1.2
Overall Maximum changes 11.0 1.2
* Base Depth of Girders 1Depth of girders in phases are unequal; Phase II depth of girders listed first (Check Figure 4-5)
4.3.2.2 Deck Transverse Stresses Table 4-9 shows the change in transverse stress of the deck due to either elimination of cross-
frames or using the alternative cross-frame for both structures. Elimination of cross-frames has a slightly more significant effect on transverse stress in bridges with shallower depth. This effect is expected since a phase containing shallow girders will have less torsional stiffness than one with deep girders and the relative twist of individual phases causes flexure in the deck connecting them. The results show a maximum increase of approximately 45% when the girder depth was 12 inches less than that in the prototype bridge, which is 5% more than the increase observed for the prototype configuration. However, this trend is necessarily limited since continuing to decrease girder depth would create an understrength condition. The goal of the study was to determine the trend in the neighborhood of the prototype bridge. As shown in Table 4-10 at the side points (over adjacent girders) both model bridges have more than 20% decrease of transverse stresses. Similar to previous results, the case with cross-frames and with horizontal cross-frame are almost matching. At the side points (over adjacent girders) both model bridge have more than 20% decrease of transverse stresses.
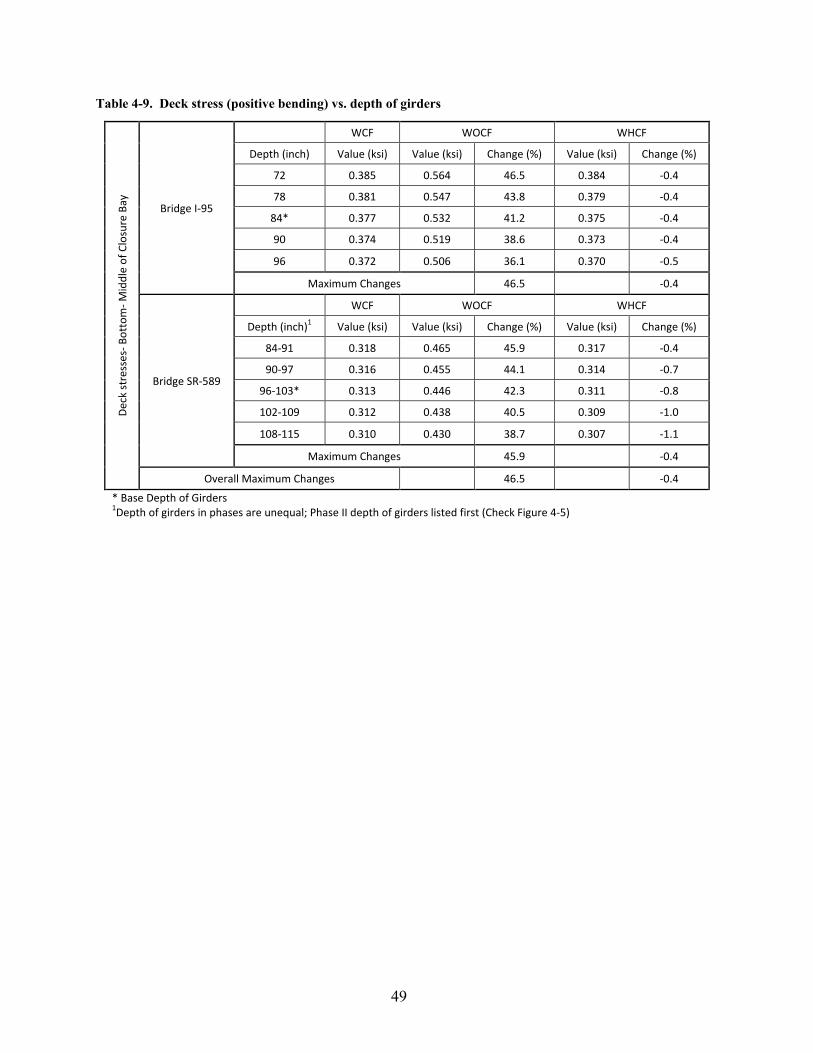
49
Table 4-9. Deck stress (positive bending) vs. depth of girders De
ck st
ress
es- B
otto
m- M
iddl
e of
Clo
sure
Bay
Bridge I-95
WCF WOCF WHCF
Depth (inch) Value (ksi) Value (ksi) Change (%) Value (ksi) Change (%)
72 0.385 0.564 46.5 0.384 -0.4
78 0.381 0.547 43.8 0.379 -0.4
84* 0.377 0.532 41.2 0.375 -0.4
90 0.374 0.519 38.6 0.373 -0.4
96 0.372 0.506 36.1 0.370 -0.5
Maximum Changes 46.5 -0.4
Bridge SR-589
WCF WOCF WHCF
Depth (inch)1 Value (ksi) Value (ksi) Change (%) Value (ksi) Change (%)
84-91 0.318 0.465 45.9 0.317 -0.4
90-97 0.316 0.455 44.1 0.314 -0.7
96-103* 0.313 0.446 42.3 0.311 -0.8
102-109 0.312 0.438 40.5 0.309 -1.0
108-115 0.310 0.430 38.7 0.307 -1.1
Maximum Changes 45.9 -0.4
Overall Maximum Changes 46.5 -0.4
* Base Depth of Girders 1Depth of girders in phases are unequal; Phase II depth of girders listed first (Check Figure 4-5)
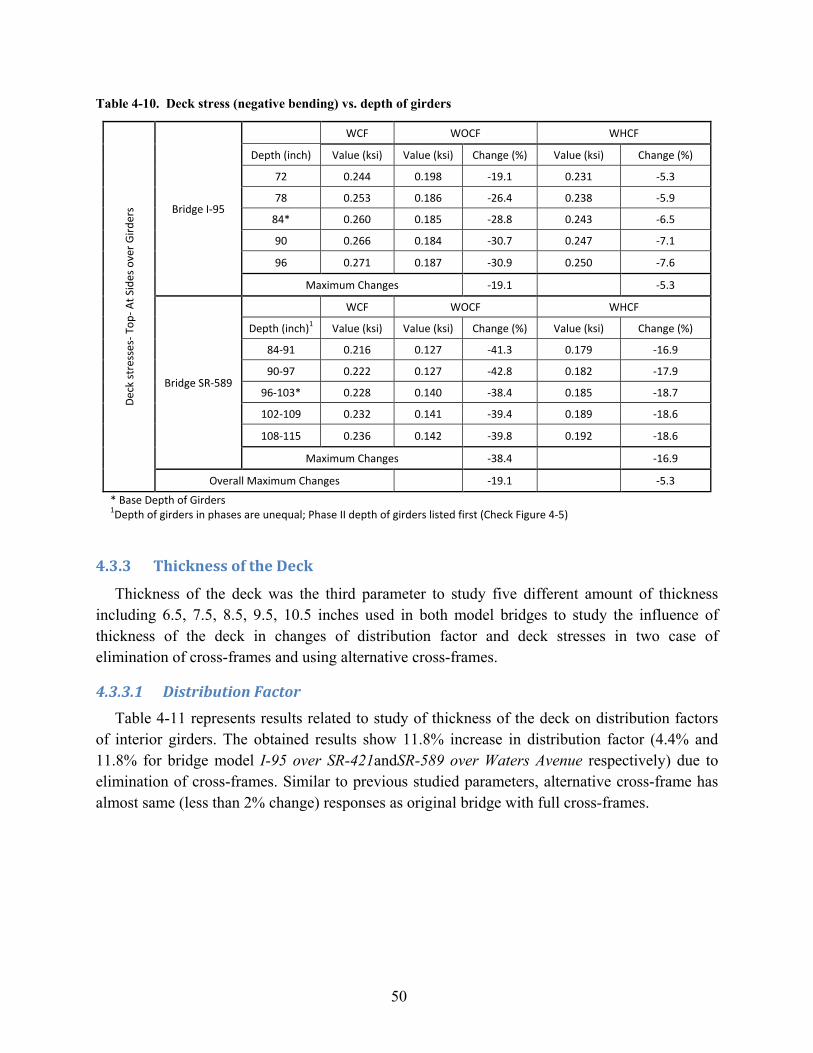
50
Table 4-10. Deck stress (negative bending) vs. depth of girders
Deck
stre
sses
- Top
- At S
ides
ove
r Gird
ers Bridge I-95
WCF WOCF WHCF
Depth (inch) Value (ksi) Value (ksi) Change (%) Value (ksi) Change (%)
72 0.244 0.198 -19.1 0.231 -5.3
78 0.253 0.186 -26.4 0.238 -5.9
84* 0.260 0.185 -28.8 0.243 -6.5
90 0.266 0.184 -30.7 0.247 -7.1
96 0.271 0.187 -30.9 0.250 -7.6
Maximum Changes -19.1 -5.3
Bridge SR-589
WCF WOCF WHCF
Depth (inch)1 Value (ksi) Value (ksi) Change (%) Value (ksi) Change (%)
84-91 0.216 0.127 -41.3 0.179 -16.9
90-97 0.222 0.127 -42.8 0.182 -17.9
96-103* 0.228 0.140 -38.4 0.185 -18.7
102-109 0.232 0.141 -39.4 0.189 -18.6
108-115 0.236 0.142 -39.8 0.192 -18.6
Maximum Changes -38.4 -16.9
Overall Maximum Changes -19.1 -5.3
* Base Depth of Girders 1Depth of girders in phases are unequal; Phase II depth of girders listed first (Check Figure 4-5)
4.3.3 Thickness of the Deck
Thickness of the deck was the third parameter to study five different amount of thickness including 6.5, 7.5, 8.5, 9.5, 10.5 inches used in both model bridges to study the influence of thickness of the deck in changes of distribution factor and deck stresses in two case of elimination of cross-frames and using alternative cross-frames.
4.3.3.1 Distribution Factor Table 4-11 represents results related to study of thickness of the deck on distribution factors
of interior girders. The obtained results show 11.8% increase in distribution factor (4.4% and 11.8% for bridge model I-95 over SR-421andSR-589 over Waters Avenue respectively) due to elimination of cross-frames. Similar to previous studied parameters, alternative cross-frame has almost same (less than 2% change) responses as original bridge with full cross-frames.

51
Table 4-11. Summarized results related to effect of deck thickness on distribution factor Di
strib
utio
n Fa
ctor
Bridge I-95
WCF WOCF WHCF
Thickness (inch) Value Value Change (%) Value Change (%)
6.5 0.690 0.713 3.3 0.691 0.1 7.5 0.691 0.716 3.6 0.692 0.2
8.5* 0.692 0.719 3.9 0.694 0.2 9.5 0.693 0.722 4.2 0.695 0.2
10.5 0.694 0.725 4.4 0.696 0.2
Maximum Changes 4.4 0.2
Bridge SR-589
WCF WOCF WHCF
Thickness (inch) Value Value Change (%) Value Change (%)
6.50 0.563 0.630 11.8 0.574 1.9 7.50 0.562 0.624 11.0 0.569 1.2 8.5* 0.561 0.617 10.0 0.565 0.6 9.50 0.560 0.610 8.9 0.561 0.2
10.50 0.559 0.603 7.8 0.558 -0.1
Maximum Changes 11.8 1.9
Overall Maximum Changes 11.8 1.9
* Base Thickness of Deck
4.3.3.2 Deck Transverse Stresses Table 4-12 represents the results for both model bridges in study of thickness of the deck. As
it is shown, while the result for alternative cross-frame is almost same as original bridge, elimination of cross-frames would cause up to 50% increase (46.5% and 45.9% for bridge model I-95 over SR-421and SR-589 over Waters Avenue respectively) in deck transverse stresses at middle of the bay. Table 4-13 shows the results related to negative moment over girders in sides of closure pour bay. There is a slight increase in negative moment for I-95 over SR-421 however, negative moment decrease significantly for the other structure (SR-589 over Waters Avenue).
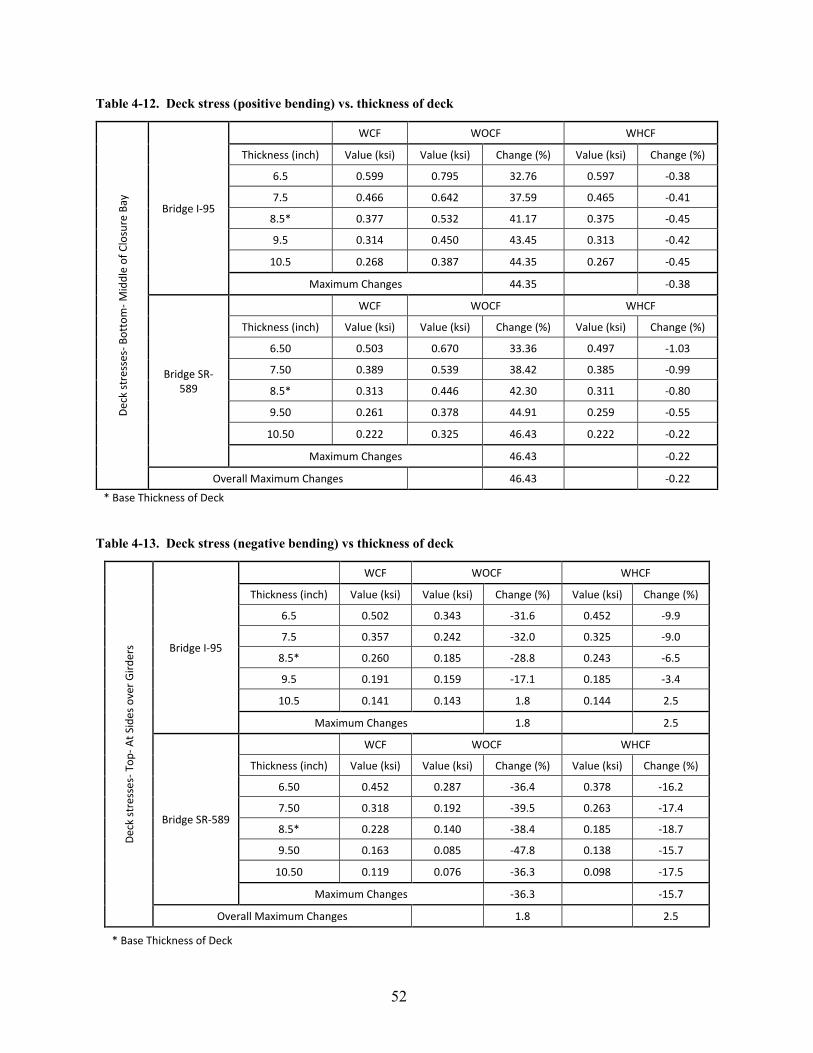
52
Table 4-12. Deck stress (positive bending) vs. thickness of deck De
ck st
ress
es- B
otto
m- M
iddl
e of
Clo
sure
Bay
Bridge I-95
WCF WOCF WHCF
Thickness (inch) Value (ksi) Value (ksi) Change (%) Value (ksi) Change (%)
6.5 0.599 0.795 32.76 0.597 -0.38
7.5 0.466 0.642 37.59 0.465 -0.41
8.5* 0.377 0.532 41.17 0.375 -0.45
9.5 0.314 0.450 43.45 0.313 -0.42
10.5 0.268 0.387 44.35 0.267 -0.45
Maximum Changes 44.35 -0.38
Bridge SR-589
WCF WOCF WHCF
Thickness (inch) Value (ksi) Value (ksi) Change (%) Value (ksi) Change (%)
6.50 0.503 0.670 33.36 0.497 -1.03
7.50 0.389 0.539 38.42 0.385 -0.99
8.5* 0.313 0.446 42.30 0.311 -0.80
9.50 0.261 0.378 44.91 0.259 -0.55
10.50 0.222 0.325 46.43 0.222 -0.22
Maximum Changes 46.43 -0.22
Overall Maximum Changes 46.43 -0.22
* Base Thickness of Deck
Table 4-13. Deck stress (negative bending) vs thickness of deck
Deck
stre
sses
- Top
- At S
ides
ove
r Gird
ers Bridge I-95
WCF WOCF WHCF
Thickness (inch) Value (ksi) Value (ksi) Change (%) Value (ksi) Change (%)
6.5 0.502 0.343 -31.6 0.452 -9.9
7.5 0.357 0.242 -32.0 0.325 -9.0
8.5* 0.260 0.185 -28.8 0.243 -6.5
9.5 0.191 0.159 -17.1 0.185 -3.4
10.5 0.141 0.143 1.8 0.144 2.5
Maximum Changes 1.8 2.5
Bridge SR-589
WCF WOCF WHCF
Thickness (inch) Value (ksi) Value (ksi) Change (%) Value (ksi) Change (%)
6.50 0.452 0.287 -36.4 0.378 -16.2
7.50 0.318 0.192 -39.5 0.263 -17.4
8.5* 0.228 0.140 -38.4 0.185 -18.7
9.50 0.163 0.085 -47.8 0.138 -15.7
10.50 0.119 0.076 -36.3 0.098 -17.5
Maximum Changes -36.3 -15.7
Overall Maximum Changes 1.8 2.5
* Base Thickness of Deck

53
4.3.4 Longitudinal Stiffness Kg
Longitudinal stiffness Kg is a parameter that appears in the AASHTO simplified load distribution factor equations. Kg = n (I+Ae2), where n is modular ratio between steel and concrete, I is girder stiffness, A is girder cross-sectional area, and e is eccentricity between centroids of girder and slab. The result obtained for the two last parameters studied – depth of girders and thickness of the deck – affect the value of Kg. The following chart plots the load distribution factor against Kg. The results indicate that the effect of Kg does not change under the various cross frame configurations that were considered.
Figure 4-16. Distribution Factor vs. Kg for G3bridge I-95 over SR-421
4.3.5 Cross-frame Spacing
The next parameter considered was the longitudinal spacing of the cross-frames. The framing plan for the I-95 Bridge used an even spacing of 22’ throughout the length, and the SR-589 Bridge had 25’ spacing over the center 5 panels and 21’ over the 3 panels at each end. The cross-frame spacing values for the I-95 Bridge were varied by adding or removing cross-frames. For the SR-589 structure, the existing cross-frames (with two different spacing in middle and sides) replaced with same number of cross-frames distributed evenly over whole span.
4.3.5.1 Distribution Factor Table 4-14 shows the results of study of cross-frame spacing on distribution factor of interior
girders. The results show up to 10.1% increase (4.1% and 10.1% for bridge model I-95 over SR-421andSR-589 over Waters Avenue, respectively) in distribution factors due to elimination of cross-frames. The change due to using the horizontal strut alternative is very low (0.8%).
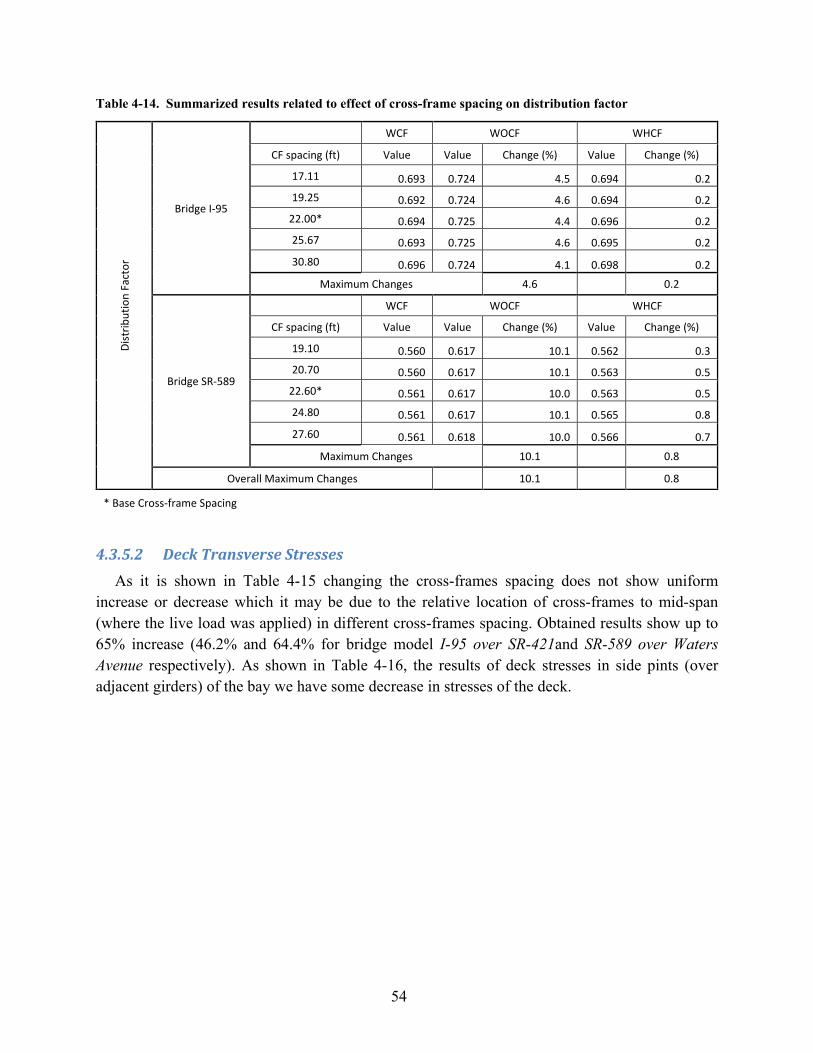
54
Table 4-14. Summarized results related to effect of cross-frame spacing on distribution factor Di
strib
utio
n Fa
ctor
Bridge I-95
WCF WOCF WHCF
CF spacing (ft) Value Value Change (%) Value Change (%)
17.11 0.693 0.724 4.5 0.694 0.2 19.25 0.692 0.724 4.6 0.694 0.2
22.00* 0.694 0.725 4.4 0.696 0.2 25.67 0.693 0.725 4.6 0.695 0.2
30.80 0.696 0.724 4.1 0.698 0.2
Maximum Changes 4.6 0.2
Bridge SR-589
WCF WOCF WHCF
CF spacing (ft) Value Value Change (%) Value Change (%)
19.10 0.560 0.617 10.1 0.562 0.3 20.70 0.560 0.617 10.1 0.563 0.5
22.60* 0.561 0.617 10.0 0.563 0.5 24.80 0.561 0.617 10.1 0.565 0.8
27.60 0.561 0.618 10.0 0.566 0.7
Maximum Changes 10.1 0.8
Overall Maximum Changes 10.1 0.8
* Base Cross-frame Spacing
4.3.5.2 Deck Transverse Stresses As it is shown in Table 4-15 changing the cross-frames spacing does not show uniform
increase or decrease which it may be due to the relative location of cross-frames to mid-span (where the live load was applied) in different cross-frames spacing. Obtained results show up to 65% increase (46.2% and 64.4% for bridge model I-95 over SR-421and SR-589 over Waters Avenue respectively). As shown in Table 4-16, the results of deck stresses in side pints (over adjacent girders) of the bay we have some decrease in stresses of the deck.
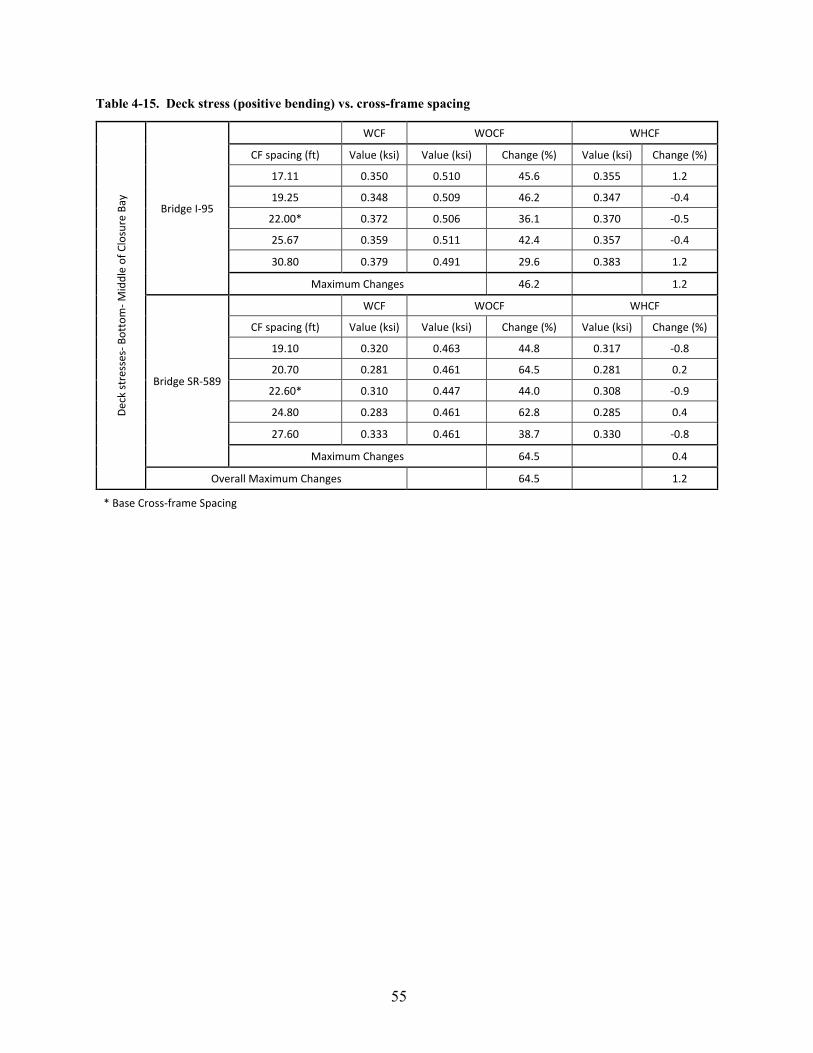
55
Table 4-15. Deck stress (positive bending) vs. cross-frame spacing De
ck st
ress
es- B
otto
m- M
iddl
e of
Clo
sure
Bay
Bridge I-95
WCF WOCF WHCF
CF spacing (ft) Value (ksi) Value (ksi) Change (%) Value (ksi) Change (%)
17.11 0.350 0.510 45.6 0.355 1.2
19.25 0.348 0.509 46.2 0.347 -0.4
22.00* 0.372 0.506 36.1 0.370 -0.5
25.67 0.359 0.511 42.4 0.357 -0.4
30.80 0.379 0.491 29.6 0.383 1.2
Maximum Changes 46.2 1.2
Bridge SR-589
WCF WOCF WHCF
CF spacing (ft) Value (ksi) Value (ksi) Change (%) Value (ksi) Change (%)
19.10 0.320 0.463 44.8 0.317 -0.8
20.70 0.281 0.461 64.5 0.281 0.2
22.60* 0.310 0.447 44.0 0.308 -0.9
24.80 0.283 0.461 62.8 0.285 0.4
27.60 0.333 0.461 38.7 0.330 -0.8
Maximum Changes 64.5 0.4
Overall Maximum Changes 64.5 1.2
* Base Cross-frame Spacing

56
Table 4-16. Deck stress (negative bending) vs. cross-frame spacing De
ck st
ress
es- T
op- A
t Sid
es o
ver G
irder
s Bridge I-95
WCF WOCF WHCF
CF spacing (ft) Value (ksi) Value (ksi) Change (%) Value (ksi) Change (%)
17.11 0.259 0.183 -29.3 0.241 -6.9
19.25 0.270 0.188 -30.6 0.252 -6.6
22.00* 0.271 0.187 -30.9 0.250 -7.6
25.67 0.264 0.187 -29.0 0.249 -5.5
30.80 0.279 0.192 -31.1 0.257 -8.0
Maximum Changes -29.0 -5.5
Bridge SR-589
WCF WOCF WHCF
CF spacing (ft) Value (ksi) Value (ksi) Change (%) Value (ksi) Change (%)
19.10 0.242 0.144 -40.5 0.199 -18.0
20.70 0.233 0.141 -39.3 0.194 -16.5
22.60* 0.230 0.140 -38.9 0.187 -18.6
24.80 0.226 0.141 -37.6 0.189 -16.2
27.60 0.235 0.144 -38.5 0.192 -18.1
Maximum Changes -37.6 -16.2
Overall Maximum Changes -29.0 -5.5
* Base Cross-frame Spacing
4.3.6 Number of Girders
The phase configuration, or number of girders in each phase was the last parameter studied. For bridge I-95 over SR-421, five different cases with different arrangement of number of girders in phase I and II including 3-2 (three girders in phase I and two girders in phase II) , 3-3, 4-2, 4-3, 5-2, 5-3 was considered. Nine different cases of number of girders including 2-3-2 (three girders in existing structure and two girders widening parts in both sides), 3-3-3, 4-3-4, 2-3-2, 3-4-3, 4-4-4,2-5-2, 3-5-3, 4-5-4 were considered for Bridge SR-589 over Waters. All mentioned cases were analyzed for only one side widening. The following represents the results for distribution factor and deck transverse stresses.
4.3.6.1 Distribution Factor Table 4-17 represents the results of study in distribution factor for different arrangement of
number of girders in phases. The results show up to 5.9% increase (5.9% , 5.1% and 1.5% for bridge model I-95 over SR-421and SR-589 over Waters Avenue both case of two and one side widening respectively) in distribution factors due to elimination of cross-frames It is also illustrated that changes due to using alternative cross-frames with horizontal struts is very low(1.3%). The results suggest that the higher number of girders in phases leads to the less increase in distribution factors of interior girders due to elimination of cross-frames between construction phases.
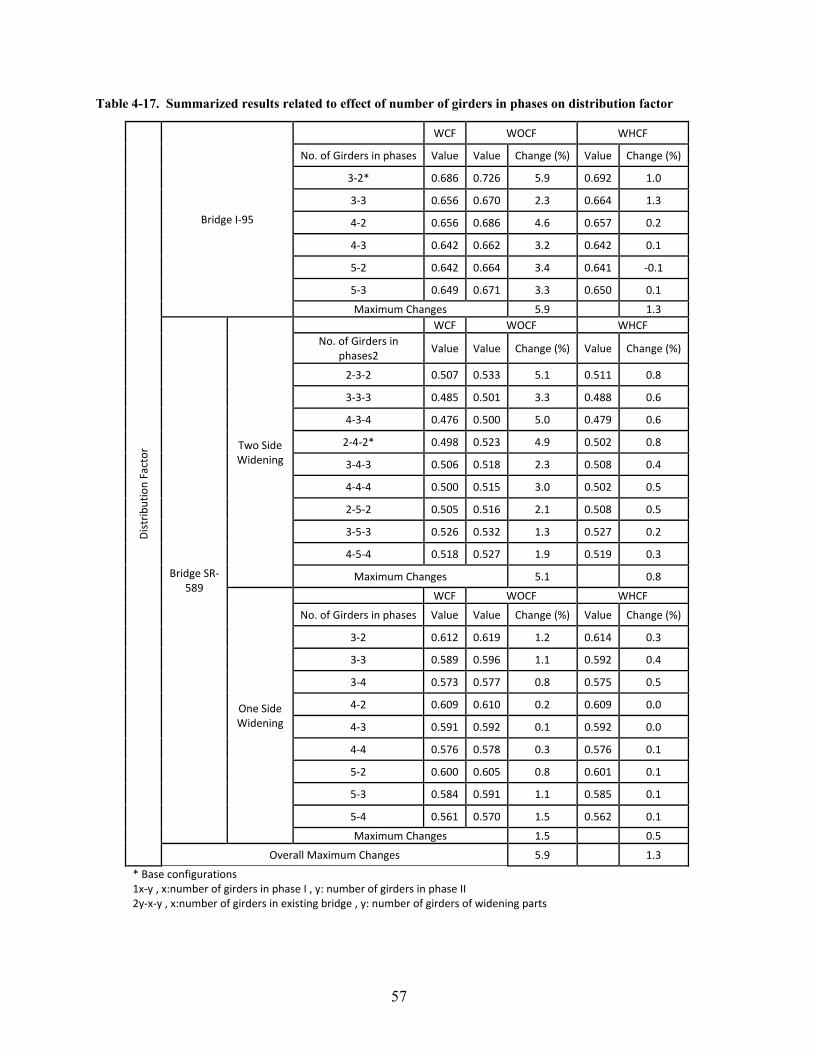
57
Table 4-17. Summarized results related to effect of number of girders in phases on distribution factor
Dist
ribut
ion
Fact
or
Bridge I-95
WCF WOCF WHCF
No. of Girders in phases Value Value Change (%) Value Change (%)
3-2* 0.686 0.726 5.9 0.692 1.0
3-3 0.656 0.670 2.3 0.664 1.3
4-2 0.656 0.686 4.6 0.657 0.2
4-3 0.642 0.662 3.2 0.642 0.1
5-2 0.642 0.664 3.4 0.641 -0.1
5-3 0.649 0.671 3.3 0.650 0.1
Maximum Changes 5.9 1.3
Bridge SR-589
Two Side Widening
WCF WOCF WHCF No. of Girders in
phases2 Value Value Change (%) Value Change (%)
2-3-2 0.507 0.533 5.1 0.511 0.8
3-3-3 0.485 0.501 3.3 0.488 0.6
4-3-4 0.476 0.500 5.0 0.479 0.6
2-4-2* 0.498 0.523 4.9 0.502 0.8
3-4-3 0.506 0.518 2.3 0.508 0.4
4-4-4 0.500 0.515 3.0 0.502 0.5
2-5-2 0.505 0.516 2.1 0.508 0.5
3-5-3 0.526 0.532 1.3 0.527 0.2
4-5-4 0.518 0.527 1.9 0.519 0.3
Maximum Changes 5.1 0.8
One Side Widening
WCF WOCF WHCF
No. of Girders in phases Value Value Change (%) Value Change (%)
3-2 0.612 0.619 1.2 0.614 0.3
3-3 0.589 0.596 1.1 0.592 0.4
3-4 0.573 0.577 0.8 0.575 0.5
4-2 0.609 0.610 0.2 0.609 0.0
4-3 0.591 0.592 0.1 0.592 0.0
4-4 0.576 0.578 0.3 0.576 0.1
5-2 0.600 0.605 0.8 0.601 0.1
5-3 0.584 0.591 1.1 0.585 0.1
5-4 0.561 0.570 1.5 0.562 0.1
Maximum Changes 1.5 0.5
Overall Maximum Changes 5.9 1.3
* Base configurations 1x-y , x:number of girders in phase I , y: number of girders in phase II 2y-x-y , x:number of girders in existing bridge , y: number of girders of widening parts

58
Note that in order to consider the cases with three girders in the existing bridge, (cases 2-3-2, 3-3-3 and 4-3-4 in Table 4-17) different locations of the closure pour are assumed. Figure 4-17 illustrates the location of closure pour in the base bridge model and the model used in this section. A significant change is observed between the increases in distribution factors due to removal of frames between the base model of bridge SR-589 over Waters Avenue and the model used in this section. The models presented in this section showed an approximate 5.0% increase in distribution factor, while the base model used in previous sections showed an 11% increase in distribution factor due to elimination of cross-frames. This difference indicates how significantly the number of girders in the phases, affect the bridge responses. The observation is considered anomalous due to the presence of only two girders in the first phase of the base model, which results in a torsionally weak system. A feature that further complicates the situation is the differing closure bay widths due to the configuration of the prototype structure.
Figure 4-17. Difference between models used for bridge SR-589 over Waters Avenue in this section and previous sections
4.3.6.2 Deck Transverse Stresses Table 4-18 shows the change of deck stresses due to both elimination of cross-frames and
using the alternative cross-frame for bridge models l I-95 over SR-421and SR-589 over Waters Avenue in the middle of the closure bay. It is shown up to 40% increase in deck stresses for the first model (I-95 over SR-421) and up to 70% for the second model. Similar to all other parameters, the alternative cross-frame shows almost the same result as the original bridge with full cross-frame. Table 4-19 shows the results related to negative moment over girders in sides of closure pour bay. Since for I-95 over SR-421 some decreases is shown but the other structure SR-589 over Waters Avenue shows some increases in negative moment.
Model used in study of previous four parameters
Model used in this section

59
Table 4-18. Deck stress (positive bending) vs. number of girders in phases De
ck st
ress
es- B
otto
m- M
iddl
e of
Clo
sure
Bay
Bridge I-95
WCF WOCF WHCF
No. of Girders in phases1 Value (ksi) Value (ksi) Change (%) Value (ksi) Change (%)
3-2* 0.372 0.504 35.5 0.370 -0.5
3-3 0.375 0.487 30.0 0.373 -0.4
4-2 0.355 0.465 31.2 0.353 -0.5
4-3 0.360 0.463 28.7 0.358 -0.6
5-2 0.348 0.482 38.4 0.347 -0.3
5-3 0.352 0.469 33.1 0.351 -0.3
Maximum Changes 38.4 -0.3
Bridge SR-589
WCF WOCF WHCF No. of Girders in
phases2 Value (ksi) Value (ksi) Change (%) Value (ksi) Change (%)
2-3-2 0.150 0.237 58.0 0.149 -0.6
3-3-3 0.156 0.262 68.0 0.156 -0.3
4-3-4 0.191 0.290 51.9 0.195 1.9
2-4-2* 0.149 0.222 49.0 0.152 1.7
3-4-3 0.183 0.284 55.2 0.187 1.9
4-4-4 0.189 0.289 53.4 0.192 2.0
2-5-2 0.162 0.240 48.0 0.161 -0.6
3-5-3 0.169 0.266 57.8 0.168 -0.4
4-5-4 0.173 0.272 57.5 0.174 0.6
Maximum Changes 68.0 2.0
Overall Maximum Changes 68.0 2.0
* Base configurations 1x-y , x:number of girders in phase I , y: number of girders in phase II 2y-x-y , x:number of girders in existing bridge , y: number of girders of widening parts

60
Table 4-19. Deck stress (negative bending) vs. number of girders in phases De
ck st
ress
es- T
op- A
t Sid
es o
ver G
irder
s
Bridge I-95
WCF WOCF WHCF
No. of Girders in phases1 Value (ksi) Value (ksi) Change (%) Value (ksi) Change (%)
3-2* 0.271 0.188 -30.8 0.250 -7.7
3-3 0.246 0.157 -36.0 0.209 -15.0
4-2 0.267 0.187 -30.0 0.244 -8.5
4-3 0.242 0.167 -30.8 0.210 -13.2
5-2 0.244 0.188 -22.9 0.227 -6.8
5-3 0.218 0.162 -25.7 0.195 -10.3
Maximum Changes -22.9 -6.8
Bridge SR-589
WCF WOCF WHCF
No. of Girders in phases2 Value (ksi) Value (ksi) Change (%) Value (ksi) Change (%)
2-3-2 0.110 0.102 -6.8 0.094 -14.7
3-3-3 0.098 0.108 9.8 0.085 -13.6
4-3-4 0.091 0.088 -2.8 0.081 -10.7
2-4-2* 0.111 0.122 10.2 0.101 -9.3
3-4-3 0.099 0.112 13.0 0.095 -3.7
4-4-4 0.093 0.099 6.4 0.085 -9.3
2-5-2 0.111 0.121 9.2 0.099 -10.5
3-5-3 0.100 0.122 22.5 0.099 -1.0
4-5-4 0.094 0.112 19.0 0.087 -7.4
Maximum Changes 22.5 -1.0
Overall Maximum Changes 22.5 -1.0
* Base configurations 1x-y , x:number of girders in phase I , y: number of girders in phase II 2y-x-y , x:number of girders in existing bridge , y: number of girders of widening parts
4.3.7 Summary of Results
The obtained results of parametric study indicate that the elimination of cross-frames between construction phases causes increase in live load distribution factor of the girders. The increase is higher in original structure’s girder (wider phase). It causes increase in transverse deck stresses in the middle of the bay as well. Table 4-20 summarizes the results for the case of elimination of cross-frames in comparison with the original bridge with full bracing. Table 4-20 shows that elimination of cross-frames cause up to 14% increase in the distribution factor in interior girders. The change in distribution factors for exterior girders is very slight. The range of increase which calculated by subtracting the maximum change from the minimum change obtained for different result for a specific parameter. It shows the sensitivity of different parameters to the elimination of cross-frames or in the other words it indicates which parameters are important. Since Girder Spacing and Number of Girders in Phases had the highest increase range they can be considered
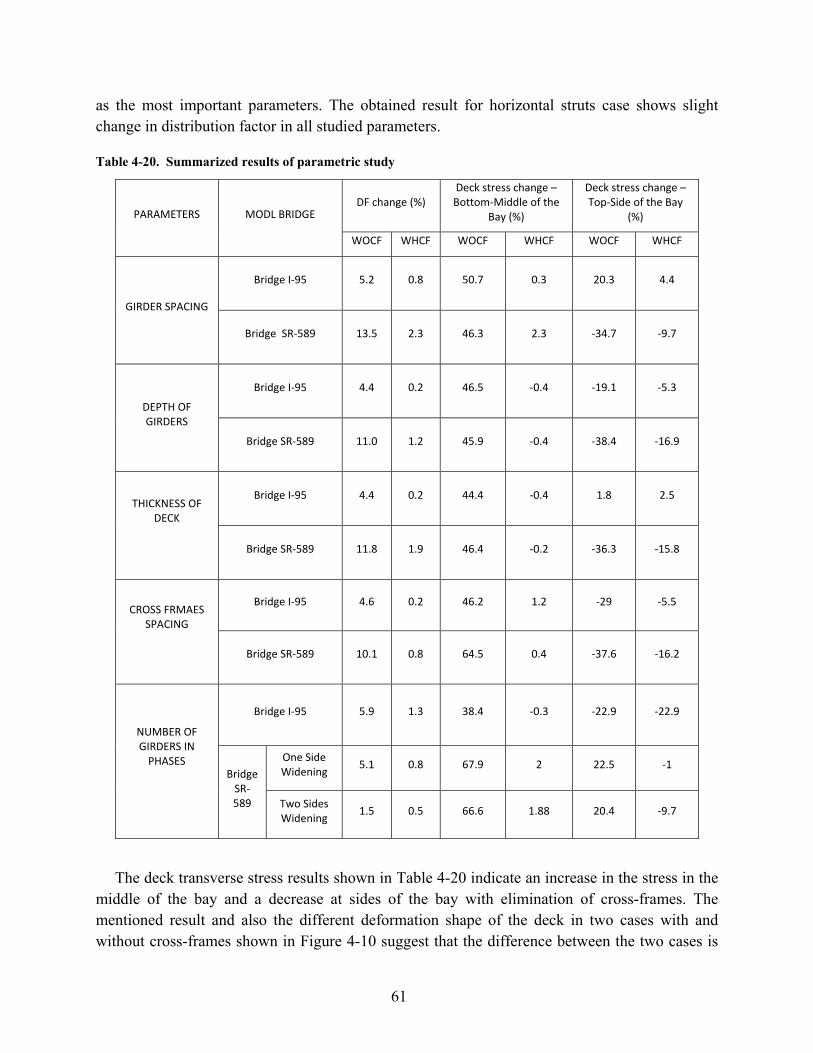
61
as the most important parameters. The obtained result for horizontal struts case shows slight change in distribution factor in all studied parameters.
Table 4-20. Summarized results of parametric study
PARAMETERS MODL BRIDGE DF change (%)
Deck stress change –Bottom-Middle of the
Bay (%)
Deck stress change –Top-Side of the Bay
(%)
WOCF WHCF WOCF WHCF WOCF WHCF
GIRDER SPACING
Bridge I-95 5.2 0.8 50.7 0.3 20.3 4.4
Bridge SR-589 13.5 2.3 46.3 2.3 -34.7 -9.7
DEPTH OF GIRDERS
Bridge I-95 4.4 0.2 46.5 -0.4 -19.1 -5.3
Bridge SR-589 11.0 1.2 45.9 -0.4 -38.4 -16.9
THICKNESS OF DECK
Bridge I-95 4.4 0.2 44.4 -0.4 1.8 2.5
Bridge SR-589 11.8 1.9 46.4 -0.2 -36.3 -15.8
CROSS FRMAES SPACING
Bridge I-95 4.6 0.2 46.2 1.2 -29 -5.5
Bridge SR-589 10.1 0.8 64.5 0.4 -37.6 -16.2
NUMBER OF GIRDERS IN
PHASES
Bridge I-95 5.9 1.3 38.4 -0.3 -22.9 -22.9
Bridge SR-589
One Side Widening 5.1 0.8 67.9 2 22.5 -1
Two Sides Widening 1.5 0.5 66.6 1.88 20.4 -9.7
The deck transverse stress results shown in Table 4-20 indicate an increase in the stress in the middle of the bay and a decrease at sides of the bay with elimination of cross-frames. The mentioned result and also the different deformation shape of the deck in two cases with and without cross-frames shown in Figure 4-10 suggest that the difference between the two cases is

62
corresponding to different end flexibility conditions (as shown in Figure 4-18). With elimination of cross-frames, the end condition of the deck over the bay changes; the end flexibility increases, which causes higher stresses at the middle and lower stresses at the ends.
Figure 4-18. Difference moment distribution due to different end flexibility condition.
The parametric study results related to the alternative cross-frame (Horizontal Struts) indicate that it performs almost the same as the original bridge with full bracing. Increases in distribution factor and deck transverse stresses due to use of the alternative cross-frame were less than 5% for all five investigated parameters (as shown in Table 4-20). This suggested that the horizontal struts were an appropriate alternative in phase and widening projects, which facilitates the construction and has almost the same performance as the fully braced condition.
4.3.8 Parameter combinations
After completion of the study of five parameters independently, a complementary study was conducted considering parameter combinations to determine the effect of parameter interactions. As was concluded in the individual studies, Girder spacing is the most important parameter of the five investigated parameters. To consider the worst combination of parameters, the largest girder spacing in combination with the worst case of the other four parameters for both model bridges, I-95 over SR-421and SR-589 over Waters Avenue, were considered. While these combinations are actually impossible – combining the largest girder spacing and the thinnest deck thickness is definitely an incredible case – but investigating these cases allowed examination of the extreme conditions.
Table 4-21 summarizes the results from the parameter combination investigation. As an example, the maximum observed increase in distribution factor due to removal of the cross-frames from the original structure for the SR-589 Bridge was 5.2%. Next consider the SR-589 Bridge with the girder spacing and girder depth set at the largest value used in the individual parameter studies. The maximum observed increase due to removal of the cross-frames for this structure was 9.0%.
From Table 4-21, it can be seen that the single largest increase in distribution factor was observed for the original configuration of I-95 Bridge and a combination of parameters, even these worst case scenarios do not create a more severe condition.
Moment
Flexible End Condition
Fixed End Condition
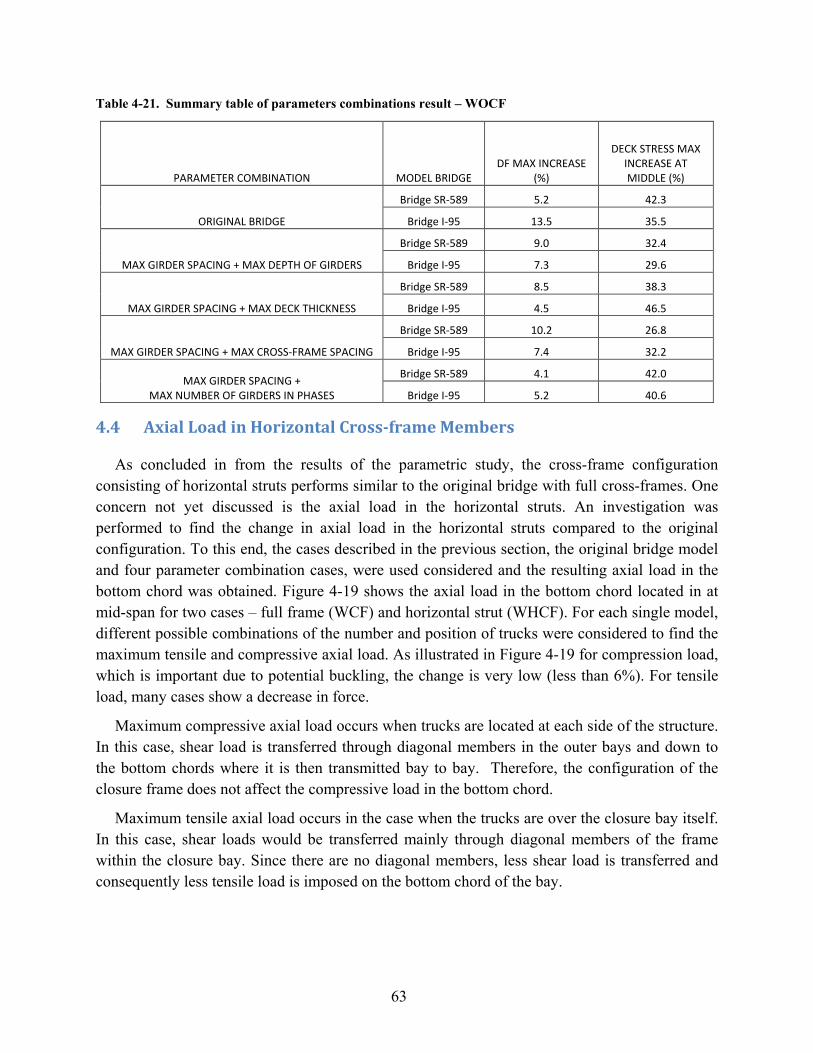
63
Table 4-21. Summary table of parameters combinations result – WOCF
PARAMETER COMBINATION MODEL BRIDGE DF MAX INCREASE
(%)
DECK STRESS MAX INCREASE AT MIDDLE (%)
ORIGINAL BRIDGE
Bridge SR-589 5.2 42.3
Bridge I-95 13.5 35.5
MAX GIRDER SPACING + MAX DEPTH OF GIRDERS
Bridge SR-589 9.0 32.4
Bridge I-95 7.3 29.6
MAX GIRDER SPACING + MAX DECK THICKNESS
Bridge SR-589 8.5 38.3
Bridge I-95 4.5 46.5
MAX GIRDER SPACING + MAX CROSS-FRAME SPACING
Bridge SR-589 10.2 26.8
Bridge I-95 7.4 32.2
MAX GIRDER SPACING + MAX NUMBER OF GIRDERS IN PHASES
Bridge SR-589 4.1 42.0
Bridge I-95 5.2 40.6
4.4 Axial Load in Horizontal Cross-frame Members
As concluded in from the results of the parametric study, the cross-frame configuration consisting of horizontal struts performs similar to the original bridge with full cross-frames. One concern not yet discussed is the axial load in the horizontal struts. An investigation was performed to find the change in axial load in the horizontal struts compared to the original configuration. To this end, the cases described in the previous section, the original bridge model and four parameter combination cases, were used considered and the resulting axial load in the bottom chord was obtained. Figure 4-19 shows the axial load in the bottom chord located in at mid-span for two cases – full frame (WCF) and horizontal strut (WHCF). For each single model, different possible combinations of the number and position of trucks were considered to find the maximum tensile and compressive axial load. As illustrated in Figure 4-19 for compression load, which is important due to potential buckling, the change is very low (less than 6%). For tensile load, many cases show a decrease in force.
Maximum compressive axial load occurs when trucks are located at each side of the structure. In this case, shear load is transferred through diagonal members in the outer bays and down to the bottom chords where it is then transmitted bay to bay. Therefore, the configuration of the closure frame does not affect the compressive load in the bottom chord.
Maximum tensile axial load occurs in the case when the trucks are over the closure bay itself. In this case, shear loads would be transferred mainly through diagonal members of the frame within the closure bay. Since there are no diagonal members, less shear load is transferred and consequently less tensile load is imposed on the bottom chord of the bay.

64
Figure 4-19. Axial force at bottom chord over closure bay in two original and alternative cross-frame cases for bridge SR-589 over Waters Avenue
ORIGINAL GS-CFS GS-DG GS-DT GS-NG -15
-10
-5
0
5
10
15
20
Parameter Combinations
Axi
al L
oad
(kip
s)
Axial Force at Bottom Chord Over Closure bay
WCF-TentionWHCF-TentionWCF-CompressionWHCF-Compression
65
Chapter 5 Recommended Design Provisions
Throughout this study two different alternative cross-frame configurations are considered for use between construction phases of steel I-girder bridges. The first alternative is the total removal of cross-frames between construction phases and the second alternative is the use of horizontal struts between construction phases, which is simply the omission of the diagonal elements of a full cross-frame.
The goal of these alternatives is to alleviate problems associated with placement and alignment of full rigid cross-frames between the two construction phases. At the time of closure the two phases are complete structures with hardened concrete decks and full bracing means physically adjusting their position for the purpose of cross-frame installation is nearly impossible. Further, any forceful adjustment can lead to additional stresses in the girders, deck, and cross-frames.
Use of the alternative cross-frame configurations is not without some disadvantages. First, there can be a change in the load distribution leading to load increases within some members. Second, transverse stresses within the deck can change. Therefore, successful implementation of the suggested alternatives requires careful consideration during design. The following section provides recommended provisions that were determined based on the results of the research.
5.1 Summary of Alternatives
Table 5-1 on the following page presents the alternatives and summarizes the advantages and disadvantages for each. The following sections provide more detailed information and a discussion of each alternative.
Based on the findings of the research, the most highly recommended alternative is elimination of the diagonal elements and use of horizontal struts alone.
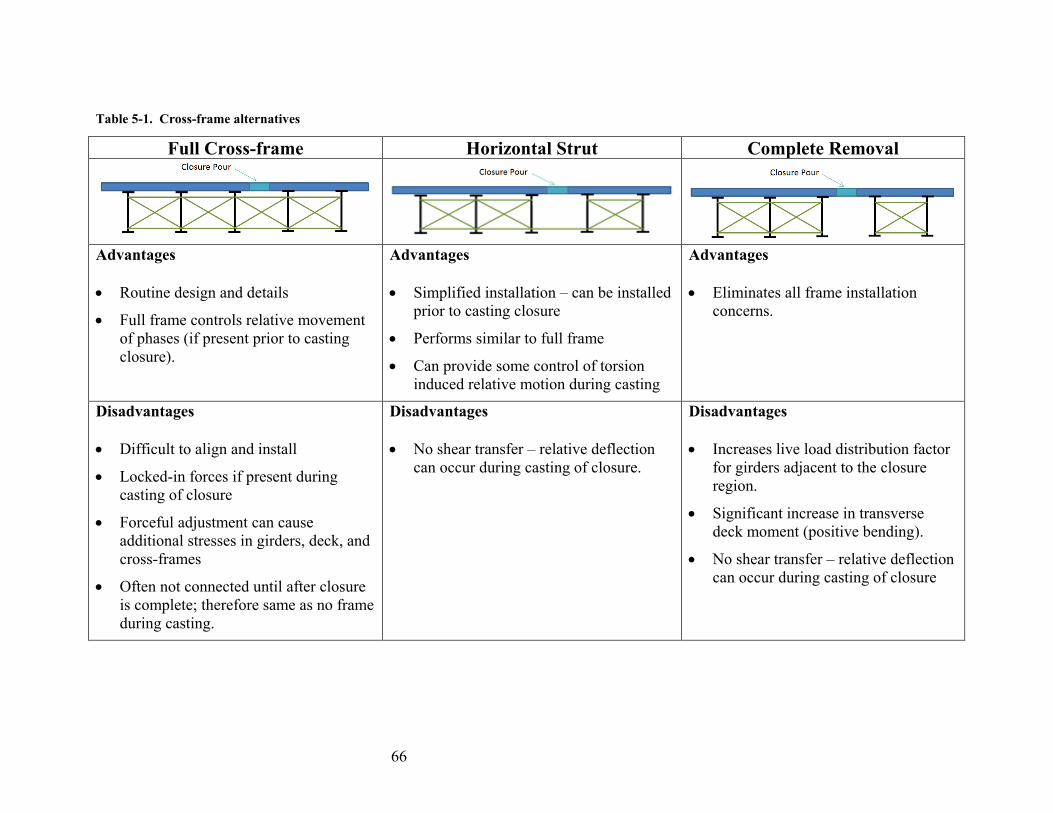
66
Table 5-1. Cross-frame alternatives
Full Cross-frame Horizontal Strut Complete Removal
Advantages • Routine design and details
• Full frame controls relative movement of phases (if present prior to casting closure).
Advantages • Simplified installation – can be installed
prior to casting closure
• Performs similar to full frame
• Can provide some control of torsion induced relative motion during casting
Advantages • Eliminates all frame installation
concerns.
Disadvantages • Difficult to align and install
• Locked-in forces if present during casting of closure
• Forceful adjustment can cause additional stresses in girders, deck, and cross-frames
• Often not connected until after closure is complete; therefore same as no frame during casting.
Disadvantages • No shear transfer – relative deflection
can occur during casting of closure.
Disadvantages • Increases live load distribution factor
for girders adjacent to the closure region.
• Significant increase in transverse deck moment (positive bending).
• No shear transfer – relative deflection can occur during casting of closure

67
5.2 Full Cross-frame
The first option to consider is using a full cross-frame in the closure bay between phases. The most obvious advantage of this option is the fact that it results in a homogenous system where each bay is similarly braced. The final structure is typically assumed to behave as though the entire structure was built at one time.
Use of this alternative requires the designer to decide when the cross-frames are connected to the phases. There are three basic options and one hybrid:
• Prior to casting the deck on the second phase
• Prior to closure
• After closure
• Partial initial connection with completion after
Connecting the frames prior to casting the deck on the second phase is the simplest option since flexibility of the girders can allow for adjustments in positioning. However, deflections due to casting of the deck on the second phase can induce stresses in the frames and cause deformations in the overall cross-section due to the interconnection between the phases. Therefore, this option is only suitable for cases where the dead load deflections are limited due to span length or other considerations such as shored construction.
Once the deck has been cast on the second phase, physical adjustment of the actual phases is often not possible. Therefore, any adjustment required to accomplish installation of the cross-frame must be done to the frame itself. The most common accommodation is through the use of field drilled holes for the connection. This can be done whether the frames are installed prior or after the closure operation. In practice, the frame is typically lifted into place and connected to only one of the phases prior to casting the deck on the second phase, which is shown in Figure 5-1. The other side of the frame is left free and the connecting plate on the free end does not contain holes. Holes may then be drilled in the plate when it is time for the connection to be made. One further consideration is that adequate vertical clearance must be provided to allow for deflections. This means the height of the frame must be less than the height of the girder.
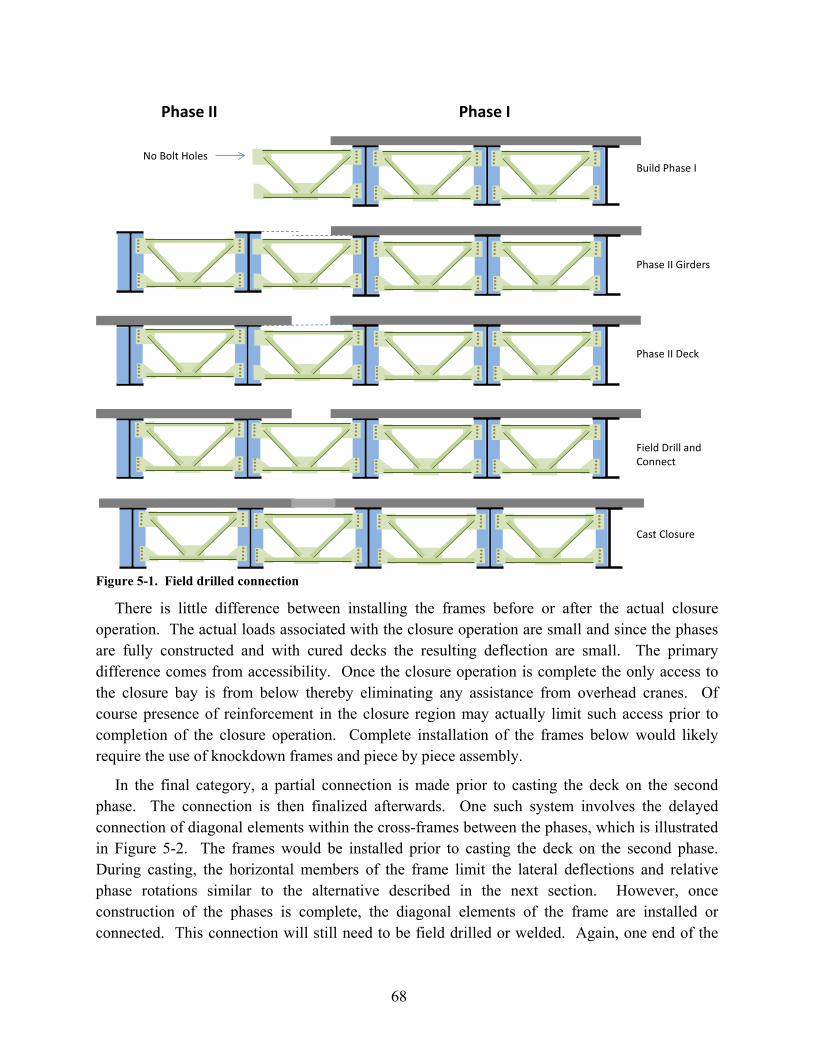
68
Figure 5-1. Field drilled connection
There is little difference between installing the frames before or after the actual closure operation. The actual loads associated with the closure operation are small and since the phases are fully constructed and with cured decks the resulting deflection are small. The primary difference comes from accessibility. Once the closure operation is complete the only access to the closure bay is from below thereby eliminating any assistance from overhead cranes. Of course presence of reinforcement in the closure region may actually limit such access prior to completion of the closure operation. Complete installation of the frames below would likely require the use of knockdown frames and piece by piece assembly.
In the final category, a partial connection is made prior to casting the deck on the second phase. The connection is then finalized afterwards. One such system involves the delayed connection of diagonal elements within the cross-frames between the phases, which is illustrated in Figure 5-2. The frames would be installed prior to casting the deck on the second phase. During casting, the horizontal members of the frame limit the lateral deflections and relative phase rotations similar to the alternative described in the next section. However, once construction of the phases is complete, the diagonal elements of the frame are installed or connected. This connection will still need to be field drilled or welded. Again, one end of the
Phase IPhase II
Build Phase I
Phase II Girders
Phase II Deck
Field Drill andConnect
Cast Closure
No Bolt Holes
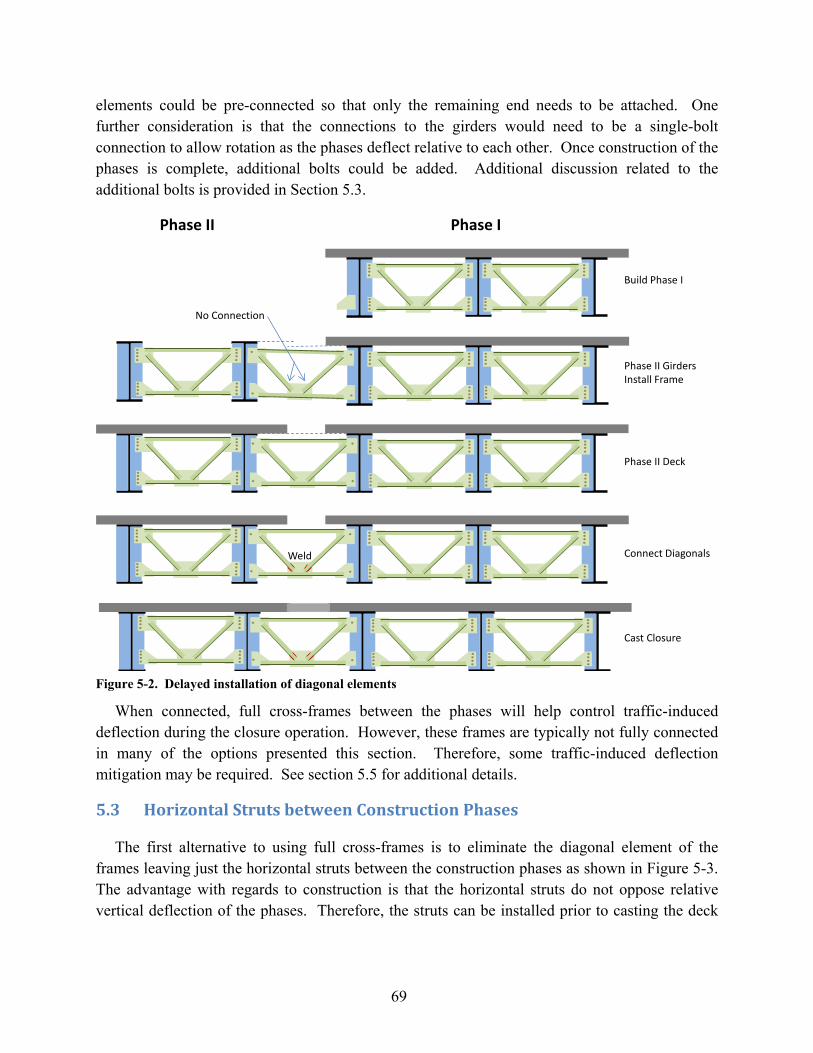
69
elements could be pre-connected so that only the remaining end needs to be attached. One further consideration is that the connections to the girders would need to be a single-bolt connection to allow rotation as the phases deflect relative to each other. Once construction of the phases is complete, additional bolts could be added. Additional discussion related to the additional bolts is provided in Section 5.3.
Figure 5-2. Delayed installation of diagonal elements
When connected, full cross-frames between the phases will help control traffic-induced deflection during the closure operation. However, these frames are typically not fully connected in many of the options presented this section. Therefore, some traffic-induced deflection mitigation may be required. See section 5.5 for additional details.
5.3 Horizontal Struts between Construction Phases
The first alternative to using full cross-frames is to eliminate the diagonal element of the frames leaving just the horizontal struts between the construction phases as shown in Figure 5-3. The advantage with regards to construction is that the horizontal struts do not oppose relative vertical deflection of the phases. Therefore, the struts can be installed prior to casting the deck
Phase IPhase II
Build Phase I
Phase II GirdersInstall Frame
Phase II Deck
Connect Diagonals
Cast Closure
No Connection
Weld

70
on the second phase. Flexibility of the girders without the deck allows small adjustments to accommodate alignment and facilitate installation of the struts.
Note that the top chord is not required in the final condition. Once cured, the stiffness of the deck will be much greater than the top chord and contribution of the strut would be negligible. Thus, when the top cord is not necessary in construction stages, the bottom chord alone can be used in closure pour bay. However, there may be situations where the top chord is useful during construction, such as controlling rotation during casting due to un-symmetric loading. With both struts present, a four-bar linking is created, thereby allowing deflection but preventing rotation.
Figure 5-3. Horizontal struts between construction phases
From a behavioral standpoint under live load, results of the investigations show that there is little difference between the system with a full cross-frame versus the horizontal struts. Therefore, a few adjustments are needed for implementation. One consideration is that the connections to the girders would need to be a single-bolt connection to allow rotation as the phases deflect relative to each other. Once construction of the phases is complete, additional bolts are added or a weld can be added to the connection. Additional long term relative deflections would be accommodated by bending of the struts.
Addition of bolts after casting requires special consideration. The straight forward solution is to field drill the additional holes. However, this results in added field work. Texas has adopted the practice of field welding the final connection after initial fit-up with a single bolt and this would be an acceptable solution.
A connection detail that allows alignment without the need for field drilling is shown in Figure 5-4. A single bolt in a standard hole is used to make the initial connection. This establishes the point of rotation. The locations of the remaining holes are detailed for the final condition after deflection due to casting. These remaining holes are oversize to accommodate camber tolerances and potential differences between predicted and actual deflections. The
Phase IPhase II
Build Phase I
Phase II GirdersInstall Frame
Phase II DeckCast Closure
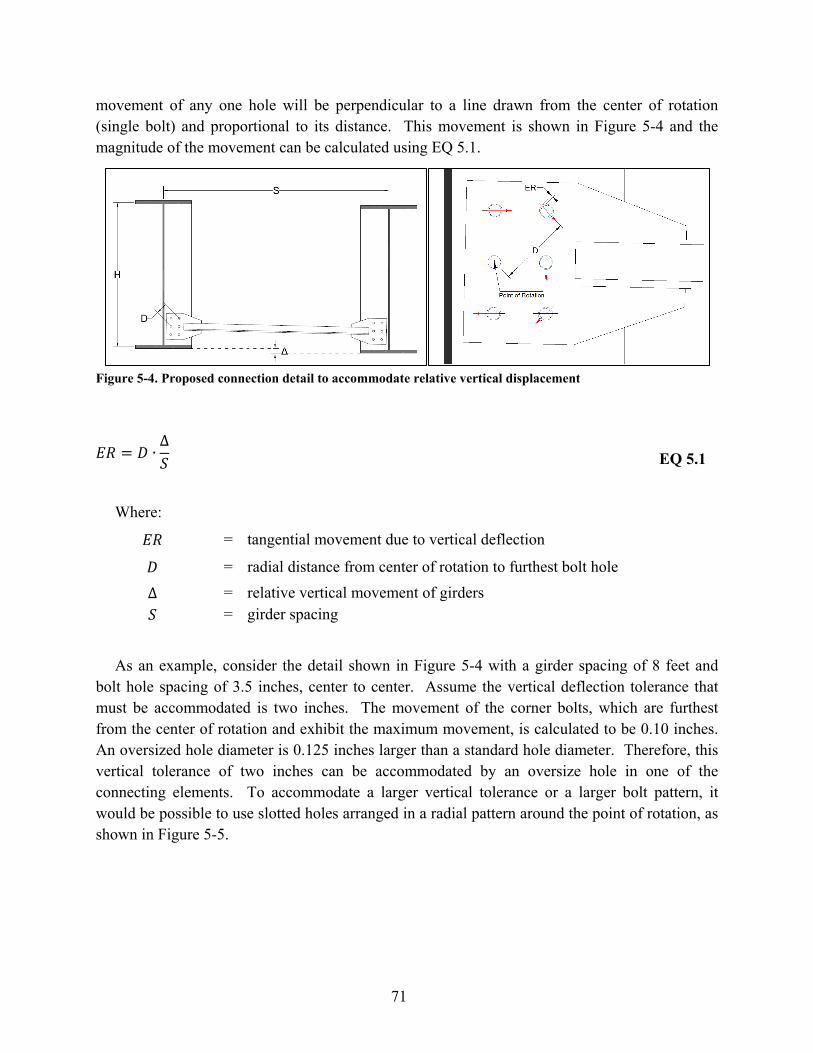
71
movement of any one hole will be perpendicular to a line drawn from the center of rotation (single bolt) and proportional to its distance. This movement is shown in Figure 5-4 and the magnitude of the movement can be calculated using EQ 5.1.
Figure 5-4. Proposed connection detail to accommodate relative vertical displacement
𝐸𝑅 = 𝐷 ∙Δ𝑆
EQ 5.1
Where:
𝐸𝑅 = tangential movement due to vertical deflection
𝐷 = radial distance from center of rotation to furthest bolt hole
Δ = relative vertical movement of girders 𝑆 = girder spacing
As an example, consider the detail shown in Figure 5-4 with a girder spacing of 8 feet and bolt hole spacing of 3.5 inches, center to center. Assume the vertical deflection tolerance that must be accommodated is two inches. The movement of the corner bolts, which are furthest from the center of rotation and exhibit the maximum movement, is calculated to be 0.10 inches. An oversized hole diameter is 0.125 inches larger than a standard hole diameter. Therefore, this vertical tolerance of two inches can be accommodated by an oversize hole in one of the connecting elements. To accommodate a larger vertical tolerance or a larger bolt pattern, it would be possible to use slotted holes arranged in a radial pattern around the point of rotation, as shown in Figure 5-5.
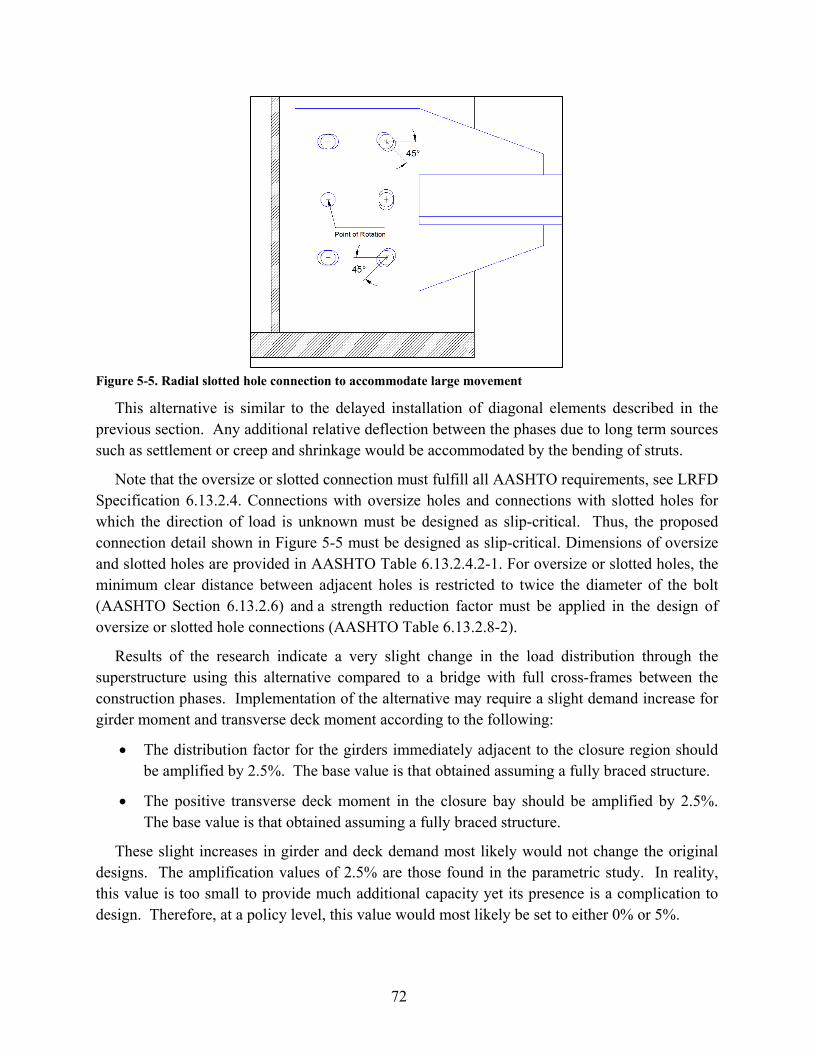
72
Figure 5-5. Radial slotted hole connection to accommodate large movement
This alternative is similar to the delayed installation of diagonal elements described in the previous section. Any additional relative deflection between the phases due to long term sources such as settlement or creep and shrinkage would be accommodated by the bending of struts.
Note that the oversize or slotted connection must fulfill all AASHTO requirements, see LRFD Specification 6.13.2.4. Connections with oversize holes and connections with slotted holes for which the direction of load is unknown must be designed as slip-critical. Thus, the proposed connection detail shown in Figure 5-5 must be designed as slip-critical. Dimensions of oversize and slotted holes are provided in AASHTO Table 6.13.2.4.2-1. For oversize or slotted holes, the minimum clear distance between adjacent holes is restricted to twice the diameter of the bolt (AASHTO Section 6.13.2.6) and a strength reduction factor must be applied in the design of oversize or slotted hole connections (AASHTO Table 6.13.2.8-2).
Results of the research indicate a very slight change in the load distribution through the superstructure using this alternative compared to a bridge with full cross-frames between the construction phases. Implementation of the alternative may require a slight demand increase for girder moment and transverse deck moment according to the following:
• The distribution factor for the girders immediately adjacent to the closure region should be amplified by 2.5%. The base value is that obtained assuming a fully braced structure.
• The positive transverse deck moment in the closure bay should be amplified by 2.5%. The base value is that obtained assuming a fully braced structure.
These slight increases in girder and deck demand most likely would not change the original designs. The amplification values of 2.5% are those found in the parametric study. In reality, this value is too small to provide much additional capacity yet its presence is a complication to design. Therefore, at a policy level, this value would most likely be set to either 0% or 5%.
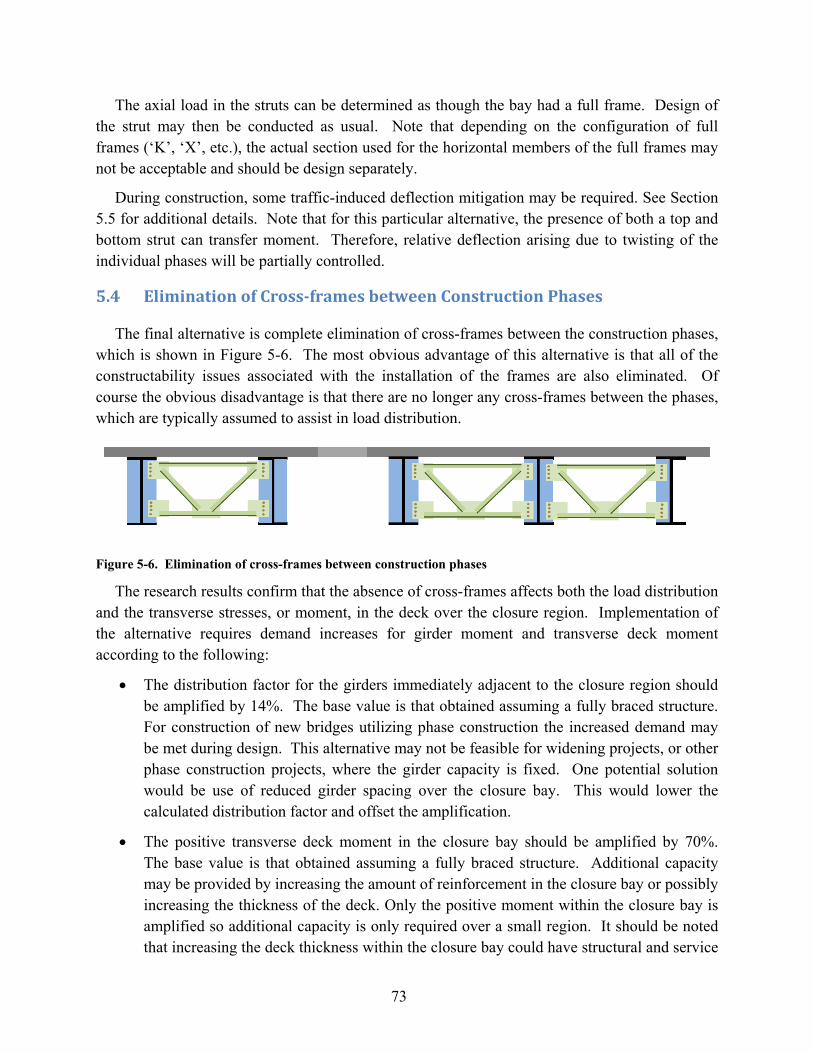
73
The axial load in the struts can be determined as though the bay had a full frame. Design of the strut may then be conducted as usual. Note that depending on the configuration of full frames (‘K’, ‘X’, etc.), the actual section used for the horizontal members of the full frames may not be acceptable and should be design separately.
During construction, some traffic-induced deflection mitigation may be required. See Section 5.5 for additional details. Note that for this particular alternative, the presence of both a top and bottom strut can transfer moment. Therefore, relative deflection arising due to twisting of the individual phases will be partially controlled.
5.4 Elimination of Cross-frames between Construction Phases
The final alternative is complete elimination of cross-frames between the construction phases, which is shown in Figure 5-6. The most obvious advantage of this alternative is that all of the constructability issues associated with the installation of the frames are also eliminated. Of course the obvious disadvantage is that there are no longer any cross-frames between the phases, which are typically assumed to assist in load distribution.
Figure 5-6. Elimination of cross-frames between construction phases
The research results confirm that the absence of cross-frames affects both the load distribution and the transverse stresses, or moment, in the deck over the closure region. Implementation of the alternative requires demand increases for girder moment and transverse deck moment according to the following:
• The distribution factor for the girders immediately adjacent to the closure region should be amplified by 14%. The base value is that obtained assuming a fully braced structure. For construction of new bridges utilizing phase construction the increased demand may be met during design. This alternative may not be feasible for widening projects, or other phase construction projects, where the girder capacity is fixed. One potential solution would be use of reduced girder spacing over the closure bay. This would lower the calculated distribution factor and offset the amplification.
• The positive transverse deck moment in the closure bay should be amplified by 70%. The base value is that obtained assuming a fully braced structure. Additional capacity may be provided by increasing the amount of reinforcement in the closure bay or possibly increasing the thickness of the deck. Only the positive moment within the closure bay is amplified so additional capacity is only required over a small region. It should be noted that increasing the deck thickness within the closure bay could have structural and service
74
life consequences that have not been studied in this project. Reducing the girder spacing is another possible solution since this would reduce the calculated design moment and work to offset the amplification.
The model structure that resulted in the 14% distribution factor increase represents a worst case scenario. The structure was a bridge being widened on both sides, and elimination of frames in both closure bays left only two girders in the middle. This two-girder unit does not possess much torsional stiffness, and it was in the edge girders of this unit that the large increase was observed. Therefore, it may be appropriate to reduce this value to 10%.
Just like the other alternatives, lack of cross-frames between the phases during the closure operation may result in adverse effects due to traffic-induced vibration. During construction, some traffic-induced deflection mitigation may be required. See Section 5.5 for additional details.
5.5 Mitigation of Traffic-Induced Vibration
For each of the alternatives, some mitigation of traffic-induced deflection may be required. Lack of cross-frames or, specifically, lack of diagonal cross-frame members between construction phases removes shear continuity, which can lead to differential deflection under load. Unfortunately, there are no clear guidelines on the threshold value of deflection above which problems can arise. Further, the threshold value will also depend on width of closure. As the closure region becomes smaller, it less relative deflection can be tolerated. Until additional research on the matter is performed, it is suggested that the ACI recommended limit of 0.25 inches be used for closures containing a standard lap splice.
To use this limitation, the maximum edge deflection due to a single truck placed on the active phase must be determined taking into account impact. Note that lateral placement of the truck may introduce twist that can increase the deflection seen at the edge of the closure. This deflection value is then compared to the limiting value. Any construction load on either phase must be taken into consideration as well.
When deemed necessary, traffic restrictions during casting, temporary connection to provide shear transfer (strong-back or needle-beam, Figure 5-7a & b), and staged casting of the closure region ( Figure 5-7c) are some recommended vibration mitigation methods that can be applied to restrict the vibration and avoid adverse effects on concrete in closure pour region.

75
a)
b)
c)
Figure 5-7. Vibration mitigation methods
a & b) Temporary connection c) staged casting of closure
SupportSupport
Phase I
Phase II
Plan View
Stage 1 Stage 2 Stage 3 Stage 2 Stage 3
Closure

76
Chapter 6 Verification Studies
The core parametric studies were conducted on two single-span bridges with no skew. This chapter discusses results from two additional analyses performed to verify the parametric study conclusions for the cases of skewed and continuous bridges. Design calculations are also provided to illustrate the use of the recommended alternative cross-frame configuration.
6.1 Continuity – Bridge SR-589 over Hillsborough Avenue
The SR-589 Bridge over Hillsborough Avenue is a two-span continuous bridge. The original bridge consisted of 5 girders with a spacing of 9 ft – 3 in. The bridge was subsequently widened with the addition of two girders on each side, shown in Figure 6-1. The existing deck was cut back such that the exterior girder from the existing structure became the first girder of the widened phase. The closure region is therefore between the exterior girder and first interior girder of the original structure.
Figure 6-1. Cross-section of the SR-589 Bridge over Hillsborough Avenue
Summary information for the structure is provided in Table 6-1. Detailed information is presented in Figure 6-1 through Figure 6-4.
Table 6-1. Geometrical characteristics of the SR-589 Bridge over Hillsborough Avenue
Project Span length
skew Cross-frame
spacing Girder spacing
Thickness
of the
deck
Width of the
deck Span 1 Span 2
SR-589 over Hillsborough
Ave. 95 ft. 156 ft. - In Average 23 ft.
9 ft 3in (phase1) 7 ft1 1
2 in(phase2-left)
6 ft10 12 in(phase2-
right)
8.0 in 71 ft, 1 in

77
Figure 6-2. Framing plan of the SR-589 Bridge over Hillsborough Avenue
Typical Configuration In-Span Typical Configuration at Support
Figure 6-3. Cross-frame details of the SR-589 Bridge over Hillsborough Avenue

78
Figure 6-4. Girder elevation for the SR-589 Bridge over Hillsborough Avenue
The same modeling and loading techniques described for the parametric study were used to analyze the bridge. The only differences concerned the longitudinal location of the applied truck load and the longitudinal location where the distribution factor and deck stresses were calculated. In the single-span models, the critical longitudinal truck load location could be determined analytically and the location of maximum response was located at mid-span.
The current structure is a two-span bridge with unequal span lengths. Locating the location of maximum response and the critical truck positioning required to obtain the response was obtained by moving a line of trucks along the bridge and monitoring the stress along the bottom flanges to identify the load positioning creating the absolute maximum stress along the length. The trucks were laterally spaced at 12 ft. and centered on the bridge. Figure 6-5 shows the critical load and response locations used in the analysis. The critical positions obtained from this study were then used in the subsequent analyses.
Figure 6-5. Critical longitudinal loading location and corresponding maximum response cross-section for the SR-589 Bridge over Hillsborough Avenue
Figure 6-6 shows the deformed shape of the ANSYS model of the bridge for the WOCF case with the truck at the critical longitudinal location and centered transversely on the bridge.

79
Figure 6-6. SR-589 Bridge over Hillsborough Avenue under truck loading located at critical longitudinal location.
A complete transverse loading analysis similar to the one described in Section 3.3 was performed and results for distribution factor and transverse deck stresses were obtained as described in Section 3.4. For distribution factor, the maximum observed increase for the case of cross-frame removal was 3.2% compared to the original structure with full cross-frames and the maximum increase was only 0.1% for the case using horizontal struts. The corresponding maximum observed increases obtained from the parametric study were 14% and 2.3%, for the cases of cross-frame removal and horizontal strut, respectively.
Considering transverse stress in the deck over the closure region, the maximum observed increase for the case of cross-frame removal was 53.5% compared to the original structure with full cross-frames and the maximum increase was 1.74% for the case using horizontal struts. The corresponding maximum observed increases obtained from the parametric study were 70% and 2.3%, for the cases of cross-frame removal and horizontal strut, respectively.
The maximum observed increases in both distribution factor and transverse deck stress are lower than the values obtained from the parametric study. This result was expected since continuity has little effect on either the load distribution or transverse behavior of the system far from the supports.

80
6.2 Skew – Bridge I-4 over SR-46
The I-4 Bridge over SR46 is a single span bridge with a support skew of 24 degrees. This structure was used to verify the conclusions obtained in the parametric study to bridges with skewed supports. The original bridge consisted of eight girders with a spacing of 10 ft – 8 in. The bridge was widened to one side with the addition of five girders spaced at 11 ft – 1 7/8 in., shown in Figure 6-7. The existing deck was cut back such that the exterior girder from the existing structure became the first girder of the widened phase. The closure region is therefore between the exterior girder and first interior girder of the original structure.
Figure 6-7. Cross-section of the bridge SR-589 over Hillsborough Avenue
Summary information for the structure is provided in Table 6-2. Detailed information is presented in Figure 6-8 through Figure 6-10.
Table 6-2. Geometrical characteristics of the I-4 Bridge over SR46
Project Span length skew Cross-frame
spacing Girder spacing
Thickness
of the
deck
Width of the
deck
I-4 over SR 46. 198 ft. - 25 ft. 10 ft 8in (phase1) 11 ft 1 7
8 I n(phase2) 8.5 in 138 ft, 1 1
4 in
81
Figure 6-8. Framing plan of the SR-589 Bridge over Hillsborough Avenue
Figure 6-9. Cross-frame details of the SR-589 Bridge over Hillsborough Avenue
82
Figure 6-10. Typical details of girders of the SR-589 Bridge over Hillsborough Avenue
The same modeling and loading techniques described for the parametric study were used to analyze the bridge. The only differences concerned the longitudinal location of the applied truck load and the longitudinal location where the distribution factor and deck stresses were calculated. In the single-span models, the critical longitudinal truck load location could be determined analytically and the location of maximum response was located at mid-span. These same assumptions are made for the skewed structure except the locations follow the skew angle across the bridge. The chosen locations do not necessarily result in the absolute most critical distribution or stresses. However, the relative change of values will be similar.
Figure 6-11 shows the deformed shape of the ANSYS model of the bridge for the WOCF case with the truck at the critical longitudinal location and centered transversely on the bridge.
83
Figure 6-11. Deformed shape of bridge I-4 over SR46 under truck loading located at mid-width and mid-span
A complete transverse loading analysis similar to the one described in Section 3.3 was performed, and results for distribution factor and transverse deck stresses were obtained as described in Section 3.4. For distribution factor, the maximum observed increase for the case of cross-frame removal was 3.6%, compared to the original structure with full cross-frames, and the maximum increase was only 0.2% for the case using horizontal struts. The corresponding maximum observed increases obtained from the parametric study were 14% and 2.3% for the cases of cross-frame removal and horizontal strut, respectively.
Considering transverse stress in the deck over the closure region, the maximum observed increase for the case of cross-frame removal was 20.7%, compared to the original structure with full cross-frames, and the maximum increase was 0.1% for the case using horizontal struts. The corresponding maximum observed increases obtained from the parametric study 70% and 2.3% for the cases of cross-frame removal and horizontal strut, respectively.
The maximum observed increases in both distribution factor and transverse deck stress were lower than the values obtained from the parametric study. This result was expected since skew has a diminished effect on load distribution and transverse behavior of the system away from the supports.

84
6.3 Sample Calculations
To illustrate implementation of design recommendations, sample calculation to evaluate the Strength I condition for widening the I-95 Bridge over SR-421 are provided.
6.3.1 Flexure in Girder
The recommendations only affect design of the girders immediately adjacent to the closure region and only the applicable calculations are provided.
The demand calculation includes dead load and live load. Dead load is comprised of DW (Wearing Surface Dead Load) and DC load (component and attachment dead load) which is further divided into DC1, the portion carried by steel section before hardening of the deck, and DC2, the portion carried by composite section. Table 6-3 through Table 6-5 provides a summary of the dead loads assumed in the calculations. The resulting moments are summarized in Table 6-6.
Table 6-3. DC1 summary
Slab = (8.5/12) x (59.083) x (0.150)/5 = 1.255 kips/ft
Girder = 0.485 kips/ft
Cross-frames and misc. steel = 0.06 kips/ft
Total DC1 =1.8 k/ipsft
Table 6-4. DC2 summary
Barriers = (0.450 x 2)/5 = 0.18 kips/ft
Total DC2 =0.180 kips/ft
Table 6-5. DW summary
Wearing surface = (0.015) x (59.083)/5 = 0.177 kips/ft
Total DW = 0.177 kips/ft
The live load was calculated according to AASHTO LRFD (5th Edition, 2010) Specifications (AASHTO 2010) assuming HL-93 loading, which is a combination of the design truck or tandem plus the design lane load. Live loads are applied to the short-term composite section. The live load analysis was performed using QConBridge™. The un-factored and un-distributed results from the moving load analysis are presented in Table 6-6.
85
Table 6-6. Analysis results – moment (kip-ft)
Relative Location
DC (kips-ft) DW (kips-ft) Live load Envelope –HL93 (kips-ft)
0.0 0.0 0.0 0.0 0.0 0.1 2986.0 293.6 0.0 2645.0 0.2 5325.0 522.0 0.0 4683.0 0.3 7001.0 685.1 0.0 6112.0 0.4 8001.0 783.0 0.0 6963.0 0.5 8326.0 815.6 0.0 7221.0 0.6 7975.0 783.0 0.0 6963.0 0.7 6948.0 685.1 0.0 6112.0 0.8 5246.0 522.0 0.0 4683.0 0.9 2909.0 293.6 0.0 2645.0 1.0 0.0 0.0 0.0 0.0
The next step is to calculate the base distribution factors. The equations for an interior girder
provided in Section 4.6.2.2 of the LRFD Specifications were used and the results are provided below.
kg = n�I + Aeg2� = 8 × (172140 + 135.25 × 52.42) = 4,348,032 in4
• One-lane
DF = 0.06 + �S
14�0.4
�SL�
0.3
�Kg
12Lts3�0.1
DF = 0.06 + (12.514
)0.4(12.5192
)0.3(4348032
12 × 192 × 8.53)0.1 = 0.53
• Multi-lane
DF = 0.06 + �S
9.5�0.6
�SL�
0.2
�Kg
12Lts3�0.1
DF = 0.06 + (12.59.5
)0.6(12.5192
)0.2(4348032
12 × 192 × 8.53)0.1 = 0.82
The controlling case is for multiple loaded lanes with a distribution factor of 0.82. This value must now be amplified by the recommended factors based on the alternative being considered. The amplified distribution factors are summarized in Table 6-7
Table 6-7. Amplified distribution factor summary
Base No Frame (WOCF) +14%
Horizontal Struts (WHCF) +2.5%
0.82 0.93 0.84

86
Once the distribution factors are obtained, the final Strength I load combination can be determined for each of the alternative using EQ 6.1. Results of the Strength I load combination are presented in Table 6-8. Also shown is the relative change, which is dependent upon the ratio of dead to live moment in the structure. It can be seen that despite a large amplification of the distribution factor for the case with no frames (14%), the total increase in maximum design moment is only 6.3%.
Strength I: 1.25 × 𝐷𝐶 + 1.5 × 𝐷𝑊 + 1.75 × 𝐿𝐿(1 + 𝐼𝑀) EQ 6.1
Table 6-8. Strength I load combination moments (kip-ft)
Relative Location
Base No Frame (WOCF) Horizontal Strut (WOCF)
Value (kip-ft)
% Increase over Base
Value (kip-ft)
% Increase over Base
0.0 0 0 - 0 - 0.1 7968 8478 6.4 8061 1.2 0.2 14159 15061 6.4 14323 1.2 0.3 18550 19726 6.3 18764 1.2 0.4 21168 22508 6.3 21411 1.2 0.5 21993 23383 6.3 22246 1.1 0.6 21135 22476 6.3 21379 1.2 0.7 18483 19660 6.4 18697 1.2 0.8 14061 14962 6.4 14225 1.2 0.9 7872 8381 6.5 7965 1.2 1.0 0 0 - 0 -
The available flexural capacity of the girders is calculated according to the LRFD Specifications. The structural steel is ASTM A709, Grade 50, and the concrete is normal weight with a compressive strength of 4.5 ksi. The concrete slab is reinforced with nominal Grade 60 reinforcing steel.
First, the required cross-section proportion limits of Article 6.10.2 are checked: Dtw
= 820.625
= 131.2 < 150 (Satisfied)
bf2tf
= 222×1
= 11 < 12 Top flange (Satisfied)
bf2tf
= 242×158
= 7.38 < 12 Bottom flange (Satisfied)
bf = 22, 24 ≥ D6
= 13.66 (Satisfied)
tf = 1, 1.5, 1.625, 2.125 in > 1.1tw = 1.1 × 0.625 = 0.69 in (Satisfied)
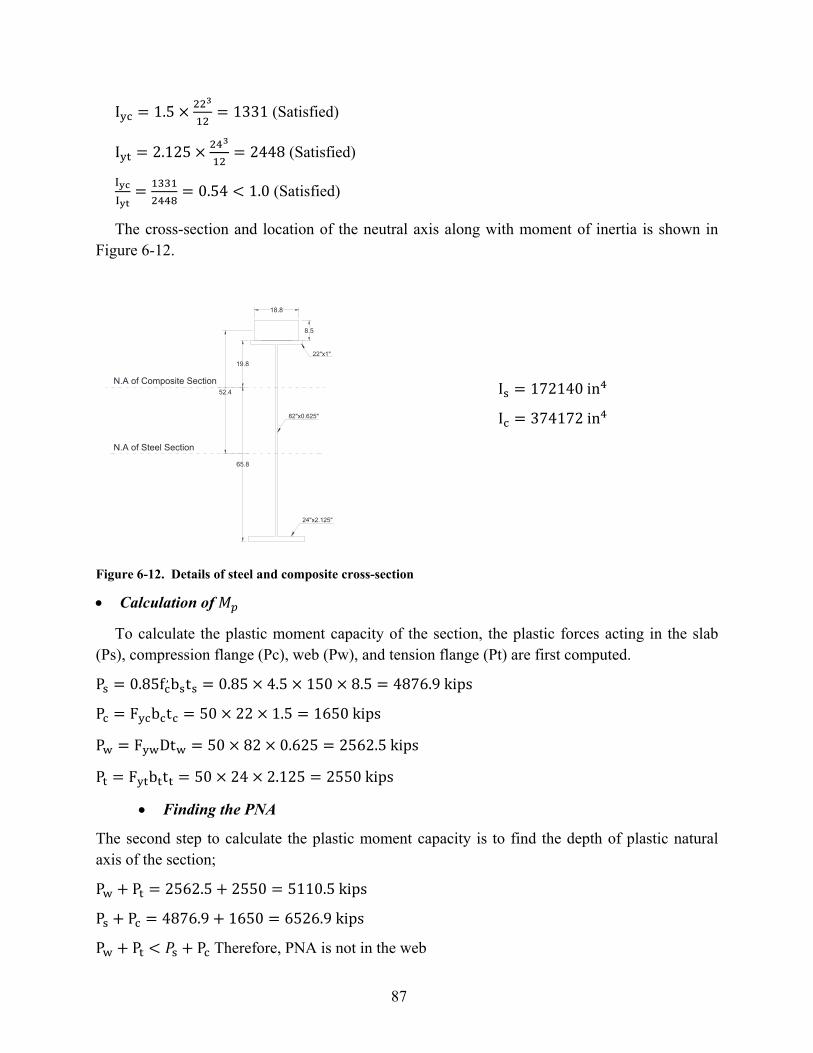
87
Iyc = 1.5 × 223
12= 1331 (Satisfied)
Iyt = 2.125 × 243
12= 2448 (Satisfied)
IycIyt
= 13312448
= 0.54 < 1.0 (Satisfied)
The cross-section and location of the neutral axis along with moment of inertia is shown in Figure 6-12.
19.8
65.8
22"x1"
82"x0.625"
24"x2.125"
18.8
8.5
52.4N.A of Composite Section
N.A of Steel Section
Is = 172140 in4
Ic = 374172 in4
Figure 6-12. Details of steel and composite cross-section
• Calculation of 𝑀𝑝
To calculate the plastic moment capacity of the section, the plastic forces acting in the slab (Ps), compression flange (Pc), web (Pw), and tension flange (Pt) are first computed.
Ps = 0.85fc, bsts = 0.85 × 4.5 × 150 × 8.5 = 4876.9 kips
Pc = Fycbctc = 50 × 22 × 1.5 = 1650 kips
Pw = FywDtw = 50 × 82 × 0.625 = 2562.5 kips
Pt = Fytbttt = 50 × 24 × 2.125 = 2550 kips
• Finding the PNA
The second step to calculate the plastic moment capacity is to find the depth of plastic natural axis of the section;
Pw + Pt = 2562.5 + 2550 = 5110.5 kips
Ps + Pc = 4876.9 + 1650 = 6526.9 kips
Pw + Pt < 𝑃s + Pc Therefore, PNA is not in the web
88
Pw + Pt + Pc = 2562.5 + 2550 + 1650 = 6762.5 kips
Pw + Pt + Pc > 𝑃s Therefore, PNA is in the top flange
Ps + Pc. y� = Pc(1 − y�) + Pw + Pt
4876.9 + 1650. y� = 1650(1 − y�) + 2562.5 + 2550
y� = 0.57 in From the top of the flange
Finally the plastic moment capacity is calculated using the following equation.
Mp = Pw. dw + Pt. dt + Ps. dc + Pc1. ds1 + Psc. ds2
Mp =2562.5 × 41.9 + 2550 × 84 + 4876.9 × 4.8 + 990 × 0.5 + 660 × 0.3
12
Mp = 28806 kips − ft
• Calculation of 𝑀𝑦
Fyt =MD1
SNC+
MD2
SLT+
MAD
SST
50 =1.25 × 7493.4 × 12
172140/37.5+
(1.25 × 832.6 + 1.5 × 815.6) × 12251150/46.4
+MAD
374172/65.8
MAD = 9712 kips − ft
My = 1.25 × 8326 + 1.5 × 815.6 + 9712 = 21343 kips − ft
• Checking the Compactness
Fy = 50ksi < 70𝑘𝑠𝑖(Satisfied)
Dtw
= 820.625
= 131.2 < 150 (Satisfied)
2Dcptw
= 2×0.570.625
= 1.824 < 3.67�EFyc
= 88.38 (Satisfied)
Therefore, the section is compact, and the nominal flexural resistance is based on Article 6.10.7.1.2. Additionally, the following requirement must be evaluated.
Dp ≤ 0.1Dt
Dp = 24.1 in > 0.1Dt = 0.1 × 94.1 = 9.41 in (Not satisfied, Reduce for Ductility)
• Ductility Requirements
Dp ≤ 0.42Dt
Dp = 24.1 in < 0.42Dt = 0.1 × 94.1 = 39.5 in

89
The nominal flexural capacity is determined from the following equation
Mn = Mp(1.07 − 0.7Dp
Dt)
Mn = 28,806 �1.07 − 0.724.194.1�
= 25,658 kips − ft
∅fMn = 1.0 × 25658 = 25658 kips − ft
After calculation of available capacity and demand capacity corresponding to the Strength I limit state. The factored capacity of the section (∅fMn) is checked against the demand (Mu) computed in the previous section. These results are summarized in Table 6-9.
Table 6-9. Moment design summary
Capacity ∅𝐟𝐌𝐧
Demand 𝐌𝐮
Base No Frame (WOCF)
Horizontal Struts (WHCF)
25658 21993 23383 22246 As shown in Table 6-9, the strength of the girder is adequate for all three alternatives. The
next step is to design the deck.
6.3.2 Transverse Moment in the Deck
The strip method is being used for design of the deck for transverse moment. The design recommendations only affect the positive flexure component of the design and therefore, only these calculations will be provided.
The base positive flexural demand due to live load is obtained from Table A4-1 in the LRFD Specifications and found to be 8.28 kip-ft/ft for a girder spacing of 150 inches. This value must be amplified for the alternative frame configuration. The results are summarized in Table 6-10. In the closure bay, the positive moment due to dead load is zero since casting the closure region is the very last step of the process. Subsequent loads, such as from an overlay or future wearing surface may contribute. However, these are not included in the analysis since the resulting additional moment is small.
Table 6-10. Transverse design moment
Base No Frame (WOCF) +70%
Horizontal Struts (WHCF) +2.5%
8.28 14.1 8.49 The base demand can be satisfied using #5 bars at 6 inch centers, which also satisfied the
demand for the case with the horizontal struts.
For the case without cross-frames, the same #5 bars would need to be spaced at 3.75 inches to meet demand. This could be easily achieved by intersetting an additional #5 bar within closure bay. Alternatively, the #5 bars could remain at 6 inch centers if the deck thickness in the middle

90
of the closure were increased 3 inches from 8.5 up to 11.5 inches. Of course other designs mixing a slightly thickened deck with differing bar size or spacing could be obtained.

91
Chapter 7 Conclusions and Recommendations
The main challenges associated with the phase construction of steel I-girder bridges are related to cross-frames between phases and splicing the transverse reinforcement in the closure pour region. First, cross-frames are difficult to install between phases simply due to accessibility. Crane access from above is limited due to the presence of the phases themselves. Difficulties from lack of access are then compounded greatly when there is misalignment between the phases. Vertical misalignment can arise due to several causes including construction tolerance or error and also different time dependent behavior of the phases, which have been constructed at different times and subjected to varying load histories. Even when all construction variables are held equal, creep and shrinkage effects within the phases will be at a different point when the two phases are to be joined.
Alternative Cross-frame Configuration
The research in this report considered two alternatives. The first alternative is complete elimination of cross-frames between the phases. The second is omission of the diagonal members leaving only the horizontal struts.
A parametric study was conducted to evaluate both elimination of cross-frames and implementation of the horizontal strut alternative. Two FDOT projects (one widening and one bridge replacement) were used as the source models in the parametric study. The five parameters considered are: a) Girder Spacing, b) thickness of the deck, c) depth of the girders, d) number of girders in Phases I and II, and e) cross-frame spacing. The major responses investigated were the live load distribution factor and the transverse deck stresses to observe the influence of alternative cross-frames.
Distribution Factor Results
The parametric study results show that elimination of cross-frames between construction phases increases the live load distribution factor of girders adjacent to the closure pour bay. The greatest increase occurs in the wider of the two phases. Since these two girders have the maximum change in distribution factor, but they do not necessarily have the maximum distribution factor between all interior girders which is being used in design. Therefore in each case the maximum distribution factor between interior girders have been compared for all three cases (original bridge, total removal and horizontal struts). The maximum observed change in distribution factor is 14%. Girders spacing and phase configuration (number of girders in each phase) are the most important parameters affecting the live load distribution factor. The remaining three parameters of thickness of the deck, depth of girders and cross-frame spacing
92
have minimal effect on the results. For the alternative cross-frame configuration, which uses only horizontal struts, the results show less than a 2.5% increase in distribution factor.
Deck Transverse Stress
To investigate the effect of the alternatives on the performance of the deck, the change in transverse deck stresses at the middle and sides (over the girders) of the closure pour were examined. The results indicate a significant increase (up to 65%) in stresses over the middle due to elimination of cross-frames while stresses near the sides decreased. These changes are due to the effective end restraint flexibility at the side of the closure bay. Elimination of cross-frames causes a more flexible condition than for the case with full frames. For the alternative configuration with horizontal strut only, the change in deck stresses is limited to 2.5%. Therefore using the horizontal strut alternative has a negligible effect on deck stresses.
Combined Effects
A full combination study considering all possible permutations of parameters was not conducted. However, a limited study was performed that examined the combined effects of parameters showing a sympathetic response to obtain worst-case scenario results. It was found that the combined effect of parameters has only a slight compounding effect. Further, the combination of parameters often resulted in unusual geometry that would not be encountered in a real structure. Therefore, any additional amplification due to a combination of effects is ignored.
Continuity and Skew
The models considered in the base parametric study were single spans with simple supports and no skew. The rationale behind this modeling decision is that the maximum values for the quantities of interest occur near mid-span and are relatively insensitive to the end conditions of the span. To verify the conclusions of the parametric study and investigate potential influence of skew and continuity two additional bridge models were analyzed. One bridge had support skew of 24 degrees and the other was a two-span continuous structure. The results show that change in the distribution factor and deck stresses are within the range obtained in the parametric study.
Force in Horizontal Strut
A concern about the alternative cross-frame configuration with horizontal strut is the axial load within that strut compared to the same member in a full cross-frame. The investigation indicates that the axial load is similar for both the full frame and horizontal strut only. For loading patterns that create tensile load, the force in the strut is nearly identical for both cases while loading patterns resulting in compression actually create lower forces.
Neither of the proposed options, elimination of cross-frames and use of horizontal struts, have diagonal members between construction phases. These diagonals provide shear transfer between phases. Therefore, load-induced differential deflection between the phases can increase and cause potential problems during construction. In particular, there is concern regarding the effect that traffic-induced vibration has on the quality of concrete in the closure region.

93
In a typical sequence using phase construction one of the phases will carry traffic while the closure region is being cast. The fresh concrete is then subjected to vibration during the casting and curing processes. A literature review was conducted to identify the effect these traffic-induced vibrations have on the quality of concrete in closure region.
Although several experimental studies and field investigations have been carried out, the reported results are contradictory. It is intuitively apparent that reinforcement displacing great distance through concrete as it cures will affect the bond quality. However, disagreement arises over the magnitude of displacement at which problems arise. The values range from 0.25 inches down 0.05 inches. The study that obtained 0.05 inches was based on component testing of small scale specimens – six inch cubes. This small scale testing does not account for the flexibility of the reinforcement that will exist when the embedment length is large. It is recommended that results from full scale specimens be used to evaluate the performance. Additional work must be carried out to fully comprehend the effects.
Once a reasonable limit is established, the actual displacement due to traffic can be calculated and compared with the limit value. If the predicted displacements are too great then steps must be taken to mitigate the detrimental effects. Possible solutions include temporary traffic restrictions (weight and/or speed), temporary connection between phases (strong-back or needle-beams), or progressive casting of the closure region. In progressive casting, regions nearest the supports are cast first and allowed to cure before casting the region near mid-span. The partial connection at the ends ties the phases together and reduces the relative deflection at mid-span.

94
Chapter 8 References
AASHTO LRFD Bridge Design Specifications, 5th Edition with 2010 Interims, American Association of State Highway and Transportation Officials, Washington, DC.
ACI Committee 345, ACI 345.2R-13, Guide for Widening Highway Bridges. Farmington Hills, MI; 2005.
ACI Committee 408, Bond and Development of Straight Reinforcing Bars in Tension. Farmington Hills, MI; 2005 Arnold DJ. Concrete Bridge Decks: Does Structural Vibration Plus Excess Water Form the Fracture Plane.; 1980.
AISC Steel Construction Manual, 13th Edition, American Institute of Steel Construction Inc., 200.
Arnold, C. J., Chiunti, M. A., Bancroft, K. S., A Review of Bridge Deck Problems, and a Final Report on the Performance of Several Berrien County Structures that Were Widened under Traffic. Michigan Deportment of State Highway and Transportation, Research Report No. R-1008. 1976.Azizinamini, Atorod, Yakel, Aaron J., and Mans, Patrick. (2002). “Flexural Capacity and Ductility of HPS-70W Bridge Girders”. Engineering Journal, First Quarter, 2002, 38-51.
Azizinamini, A, Yakel, A J, Swendroski, J P, “Development Of a Design Guideline for Phase Construction of Steel Girder Bridges”, Final report submitted to Nebraska Department of Roads, 363 pp, SPR-PL-1(038)P530, Oct 2003
California Department of Transportation, Caltrans Standard Specifications, 2010FHWA Report, Influence of Differential Deflection on Staged Construction Deck-Level Connections, Publication No. FHWA-HRT-12-057, August 2012
Furr H L, Fouad HF. Bridge Slab Concrete Placed Adjacent to Moving Live Loads.; 1981. Report No.: Research Report 266-1F.
H. L. Furr, F. H. Fouad. Effect of moving traffic on fresh concrete during bridge-deck widening.1982 Transportation Research Record, 860 , 28 - 36

95
Harsh S, Darwin D. Effects of Traffic-Induced Vibrations on Bridge Deck Repairs. Lawrence; 1984.
Issa M. A. Investigation of Cracking in Concrete Bridge Decks at Early Age. Journal of Bridge Engineering. 1999 May; 4(2): p. 116-124.
Kwan A. KH., Ng PL. Reducing Damage to Concrete Stitches in Bridge Decks. Bridge Engineering. 2006; (BE2): p. 53-62.
Montero AC. Effect of Maintaining Traffic During Widening of Bridge Decks (A Case Study). Columbus; 1980.
NG P. L. and Kwan A. K. H. Structural failure of concrete stich in bridge widening and its mitigation. Processing of the international conference on structural and foundation failure. Singapore. 2004, pp.113-122.
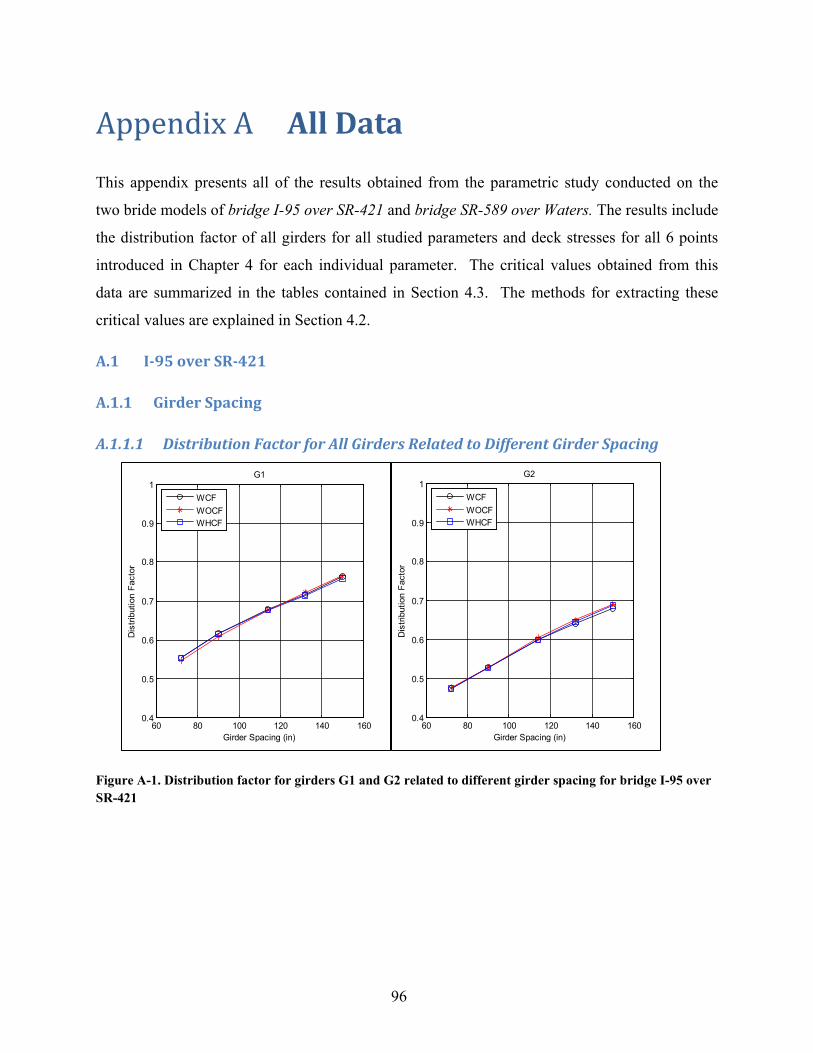
96
All Data Appendix A
This appendix presents all of the results obtained from the parametric study conducted on the
two bride models of bridge I-95 over SR-421 and bridge SR-589 over Waters. The results include
the distribution factor of all girders for all studied parameters and deck stresses for all 6 points
introduced in Chapter 4 for each individual parameter. The critical values obtained from this
data are summarized in the tables contained in Section 4.3. The methods for extracting these
critical values are explained in Section 4.2.
A.1 I-95 over SR-421
A.1.1 Girder Spacing
A.1.1.1 Distribution Factor for All Girders Related to Different Girder Spacing
Figure A-1. Distribution factor for girders G1 and G2 related to different girder spacing for bridge I-95 over SR-421
60 80 100 120 140 1600.4
0.5
0.6
0.7
0.8
0.9
1
Girder Spacing (in)
Dis
tribu
tion
Fact
or
G1
WCFWOCFWHCF
60 80 100 120 140 1600.4
0.5
0.6
0.7
0.8
0.9
1
Girder Spacing (in)
Dis
tribu
tion
Fact
or
G2
WCFWOCFWHCF

97
Figure A-2. Distribution factor for girders G3, G4 and G5 related to different girder spacing for bridge I-95 over SR-421
60 80 100 120 140 1600.4
0.5
0.6
0.7
0.8
0.9
1
Girder Spacing (in)
Dis
tribu
tion
Fact
or
G3
WCFWOCFWHCF
60 80 100 120 140 1600.4
0.5
0.6
0.7
0.8
0.9
1
Girder Spacing (in)
Dis
tribu
tion
Fact
or
G4
WCFWOCFWHCF
60 80 100 120 140 1600.4
0.5
0.6
0.7
0.8
0.9
1
Girder Spacing (in)
Dis
tribu
tion
Fact
or
G5
WCFWOCFWHCF
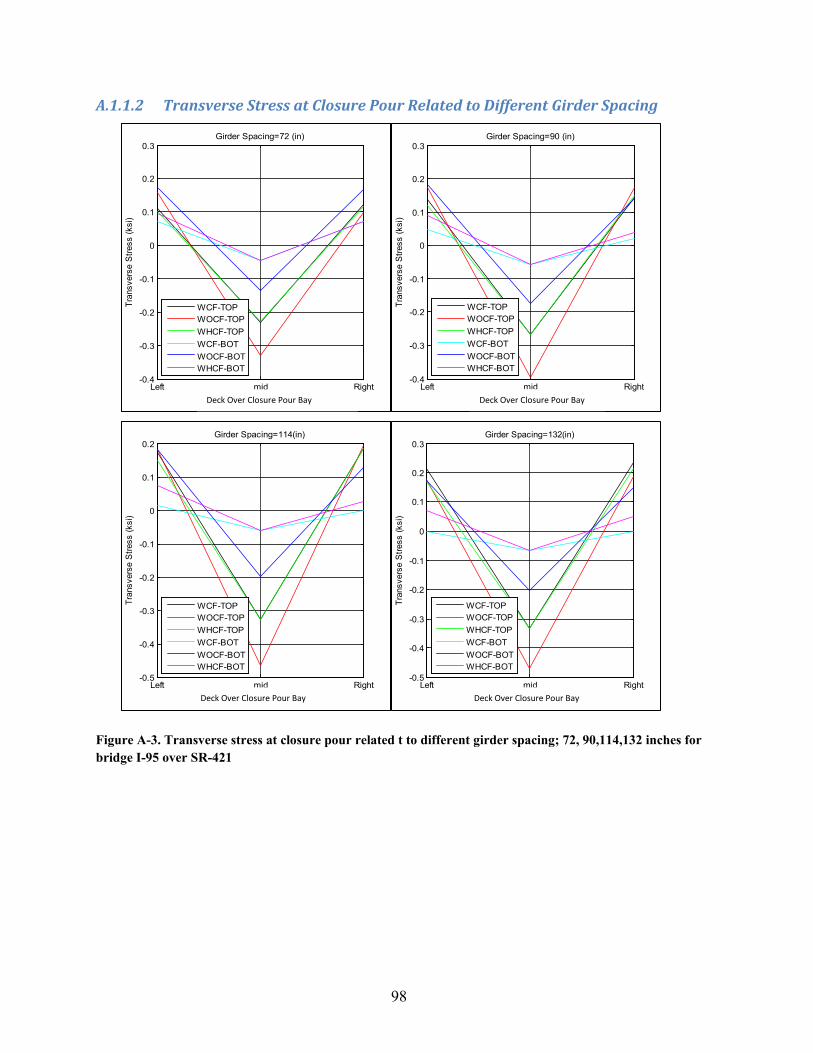
98
A.1.1.2 Transverse Stress at Closure Pour Related to Different Girder Spacing
Figure A-3. Transverse stress at closure pour related t to different girder spacing; 72, 90,114,132 inches for bridge I-95 over SR-421
Left mid Right-0.4
-0.3
-0.2
-0.1
0
0.1
0.2
0.3
Deck Over Closour Pour Bay
Tran
sver
se S
tress
(ksi
)Girder Spacing=72 (in)
WCF-TOPWOCF-TOPWHCF-TOPWCF-BOTWOCF-BOTWHCF-BOT
Left mid Right-0.4
-0.3
-0.2
-0.1
0
0.1
0.2
0.3
Deck Over Closour Pour Bay Tr
ansv
erse
Stre
ss (k
si)
Girder Spacing=90 (in)
WCF-TOPWOCF-TOPWHCF-TOPWCF-BOTWOCF-BOTWHCF-BOT
Left mid Right-0.5
-0.4
-0.3
-0.2
-0.1
0
0.1
0.2
Deck Over Closour Pour Bay
Tran
sver
se S
tress
(ksi
)
Girder Spacing=114(in)
WCF-TOPWOCF-TOPWHCF-TOPWCF-BOTWOCF-BOTWHCF-BOT
Left mid Right-0.5
-0.4
-0.3
-0.2
-0.1
0
0.1
0.2
0.3
Deck Over Closour Pour Bay
Tran
sver
se S
tress
(ksi
)
Girder Spacing=132(in)
WCF-TOPWOCF-TOPWHCF-TOPWCF-BOTWOCF-BOTWHCF-BOT
Deck Over Closure Pour Bay Deck Over Closure Pour Bay
Deck Over Closure Pour Bay Deck Over Closure Pour Bay

99
Figure A-4. Transverse stress at closure pour related to girder spacing; 150 in for bridge I-95 over SR-421
A.1.1.3 Transverse Deck Stresses at Middle and Side of Closure Pour vs. Girder Spacing
Figure A-5. Transverse deck stresses at Bottom -middle of closure pour vs. girder spacing for bridge I-95 over SR-421
Left mid Right-0.6
-0.5
-0.4
-0.3
-0.2
-0.1
0
0.1
0.2
0.3
Deck Over Closour Pour Bay
Tran
sver
se S
tress
(ksi
)
Girder Spacing=150(in)
WCF-TOPWOCF-TOPWHCF-TOPWCF-BOTWOCF-BOTWHCF-BOT
70 80 90 100 110 120 130 140 1500
0.1
0.2
0.3
0.4
0.5
Girder Spacing (in)
Tran
sver
se S
tress
(ksi
)
Deck Stress – Bottom – Middle of Closure Bay (B/W G3 @ G4)
WCFWOCFWHCF
Deck Over Closure Pour Bay

100
Figure A-6. Transverse deck stresses at middle and side of closure pour vs. girder spacing for bridge I-95 over SR-421
70 80 90 100 110 120 130 140 1500
0.1
0.2
0.3
0.4
0.5
Girder Spacing (in)
Tran
sver
se S
tress
(ksi
)
Deck Stress – Top – Side of Closure Bay (@ G3)
WCFWOCFWHCF
70 80 90 100 110 120 130 140 150
-0.5
-0.4
-0.3
-0.2
-0.1
0
Girder Spacing (in)
Tran
sver
se S
tress
(ksi
)
Deck Stress – Bottom – Side of Closure Bay (@ G3)
WCFWOCFWHCF
70 80 90 100 110 120 130 140 150
-0.5
-0.4
-0.3
-0.2
-0.1
0
Girder Spacing (in)
Tran
sver
se S
tress
(ksi
)
Deck Stress – Top – Middle of Closure Bay (B/W G3 @ G4)
WCFWOCFWHCF
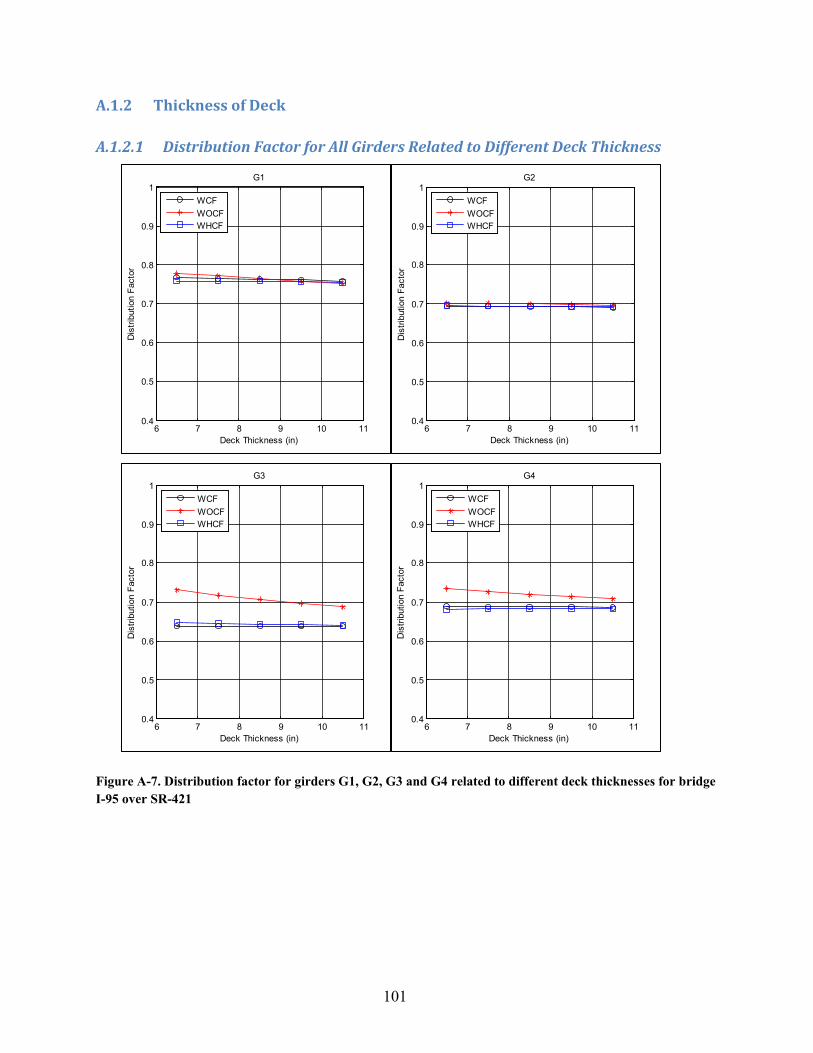
101
A.1.2 Thickness of Deck
A.1.2.1 Distribution Factor for All Girders Related to Different Deck Thickness
Figure A-7. Distribution factor for girders G1, G2, G3 and G4 related to different deck thicknesses for bridge I-95 over SR-421
6 7 8 9 10 110.4
0.5
0.6
0.7
0.8
0.9
1
Deck Thickness (in)
Dis
tribu
tion
Fact
or
G1
WCFWOCFWHCF
6 7 8 9 10 110.4
0.5
0.6
0.7
0.8
0.9
1
Deck Thickness (in)
Dis
tribu
tion
Fact
or
G2
WCFWOCFWHCF
6 7 8 9 10 110.4
0.5
0.6
0.7
0.8
0.9
1
Deck Thickness (in)
Dis
tribu
tion
Fact
or
G3
WCFWOCFWHCF
6 7 8 9 10 110.4
0.5
0.6
0.7
0.8
0.9
1
Deck Thickness (in)
Dis
tribu
tion
Fact
or
G4
WCFWOCFWHCF

102
Figure A-8. Distribution factor for girder G5 related to different deck thicknesses for bridge I-95 over SR-421
A.1.2.2 Transverse Stress at Closure Pour Related to Different Deck Thickness
Figure A-9. Transverse stress at closure pour related to deck thicknesses; 6.5 and 7.5 inches for bridge I-95 over SR-421
6 7 8 9 10 110.4
0.5
0.6
0.7
0.8
0.9
1
Deck Thickness (in)
Dis
tribu
tion
Fact
or
G5
WCFWOCFWHCF
Left mid Right-0.8
-0.6
-0.4
-0.2
0
0.2
0.4
0.6
Deck Over Closour Pour Bay
Tran
sver
se S
tress
(ksi
)
Deck Thickness=6.50(in)
WCF-TOPWOCF-TOPWHCF-TOPWCF-BOTWOCF-BOTWHCF-BOT
Left mid Right-0.8
-0.6
-0.4
-0.2
0
0.2
0.4
0.6
Deck Over Closour Pour Bay
Tran
sver
se S
tress
(ksi
)
Deck Thickness=7.50(in)
WCF-TOPWOCF-TOPWHCF-TOPWCF-BOTWOCF-BOTWHCF-BOT
Deck Over Closure Pour Bay Deck Over Closure Pour Bay

103
Figure A-10. Transverse stress at closure pour related to deck thicknesses; 8.5, 9.5 and 10.5 inches for bridge I-95 over SR-421
Left mid Right-0.6
-0.5
-0.4
-0.3
-0.2
-0.1
0
0.1
0.2
0.3
Deck Over Closour Pour Bay
Tran
sver
se S
tress
(ksi
)
Deck Thickness=8.50(in)
WCF-TOPWOCF-TOPWHCF-TOPWCF-BOTWOCF-BOTWHCF-BOT
Left mid Right-0.5
-0.4
-0.3
-0.2
-0.1
0
0.1
0.2
Deck Over Closour Pour Bay
Tran
sver
se S
tress
(ksi
)
Deck Thickness=9.50(in)
WCF-TOPWOCF-TOPWHCF-TOPWCF-BOTWOCF-BOTWHCF-BOT
Left mid Right-0.4
-0.3
-0.2
-0.1
0
0.1
0.2
0.3
Deck Over Closour Pour Bay
Tran
sver
se S
tress
(ksi
)
Deck Thickness=10.5(in)
WCF-TOPWOCF-TOPWHCF-TOPWCF-BOTWOCF-BOTWHCF-BOT
Deck Over Closure Pour Bay
Deck Over Closure Pour Bay Deck Over Closure Pour Bay

104
A.1.2.3 Transverse Deck Stresses at Middle and Side of Closure Pour vs. Deck Thickness
Figure A-11. Transverse deck stresses at middle and side of closure pour vs. deck thickness for bridge I-95 over SR-421
6.5 7 7.5 8 8.5 9 9.5 10 10.50
0.1
0.2
0.3
0.4
0.5
0.6
0.7
0.8
Deck Thickness (in)
Tran
sver
se S
tress
(ksi
)
Deck Stress – Bottom – Middle of Closure Bay (B/W G3 @ G4)
WCFWOCFWHCF
6.5 7 7.5 8 8.5 9 9.5 10 10.50
0.1
0.2
0.3
0.4
0.5
0.6
0.7
0.8
Deck Thickness (in)
Tran
sver
se S
tress
(ksi
)
Deck Stress – Top – Side of Closure Bay (@ G3)
WCFWOCFWHCF
6.5 7 7.5 8 8.5 9 9.5 10 10.5-0.8
-0.7
-0.6
-0.5
-0.4
-0.3
-0.2
-0.1
0
Deck Thickness (in)
Tran
sver
se S
tress
(ksi
)
Deck Stress – Bottom – Side of Closure Bay (@ G3)
WCFWOCFWHCF

105
Figure A-12. Transverse deck stresses at top-middle of closure pour vs. deck thickness for bridge I-95 over SR-421
A.1.3 Depth of the Girders
A.1.3.1 Distribution Factor for All Girders Related to Different Depth of Girders
Figure A-13. Distribution factor for girders G1 and G2 related to different depth of girders for bridge I-95 over SR-421
6.5 7 7.5 8 8.5 9 9.5 10 10.5-0.8
-0.7
-0.6
-0.5
-0.4
-0.3
-0.2
-0.1
0
Deck Thickness (in)
Tran
sver
se S
tress
(ksi
)
Deck Stress – Top – Middle of Closure Bay (B/W G3 @ G4
WCFWOCFWHCF
70 75 80 85 90 95 1000.4
0.5
0.6
0.7
0.8
0.9
1
Depth of Girders (in)
Dis
tribu
tion
Fact
or
G1
WCFWOCFWHCF
70 75 80 85 90 95 1000.4
0.5
0.6
0.7
0.8
0.9
1
Depth of Girders (in)
Dis
tribu
tion
Fact
or
G2
WCFWOCFWHCF

106
Figure A-14. Distribution factor for girders G2, G3 and G4 related to different depth of girders for bridge I-95 over SR-421
70 75 80 85 90 95 1000.4
0.5
0.6
0.7
0.8
0.9
1
Depth of Girders (in)
Dis
tribu
tion
Fact
or
G3
WCFWOCFWHCF
70 75 80 85 90 95 1000.4
0.5
0.6
0.7
0.8
0.9
1
Depth of Girders (in)
Dis
tribu
tion
Fact
or
G4
WCFWOCFWHCF
70 75 80 85 90 95 1000.4
0.5
0.6
0.7
0.8
0.9
1
Depth of Girders (in)
Dis
tribu
tion
Fact
or
G5
WCFWOCFWHCF

107
A.1.3.2 Transverse Stress at Closure Pour Related to Different Depth of Girders
Figure A-15. Transverse stress at closure pour related to different depth of girders; 72, 78, 84and 90 inches for bridge I-95 over SR-421
Left mid Right-0.6
-0.5
-0.4
-0.3
-0.2
-0.1
0
0.1
0.2
0.3
Deck Over Closour Pour Bay
Tran
sver
se S
tress
(ksi
)Depth of Girders=78(in)
WCF-TOPWOCF-TOPWHCF-TOPWCF-BOTWOCF-BOTWHCF-BOT
Left mid Right-0.6
-0.5
-0.4
-0.3
-0.2
-0.1
0
0.1
0.2
0.3
Deck Over Closour Pour Bay Tr
ansv
erse
Stre
ss (k
si)
Depth of Girders=72(in)
WCF-TOPWOCF-TOPWHCF-TOPWCF-BOTWOCF-BOTWHCF-BOT
Left mid Right-0.6
-0.5
-0.4
-0.3
-0.2
-0.1
0
0.1
0.2
0.3
Deck Over Closour Pour Bay
Tran
sver
se S
tress
(ksi
)
Depth of Girders=84(in)
WCF-TOPWOCF-TOPWHCF-TOPWCF-BOTWOCF-BOTWHCF-BOT
Left mid Right-0.6
-0.5
-0.4
-0.3
-0.2
-0.1
0
0.1
0.2
0.3
Deck Over Closour Pour Bay
Tran
sver
se S
tress
(ksi
)
Depth of Girders=90(in)
WCF-TOPWOCF-TOPWHCF-TOPWCF-BOTWOCF-BOTWHCF-BOT
Deck Over Closure Pour Bay Deck Over Closure Pour Bay
Deck Over Closure Pour Bay Deck Over Closure Pour Bay
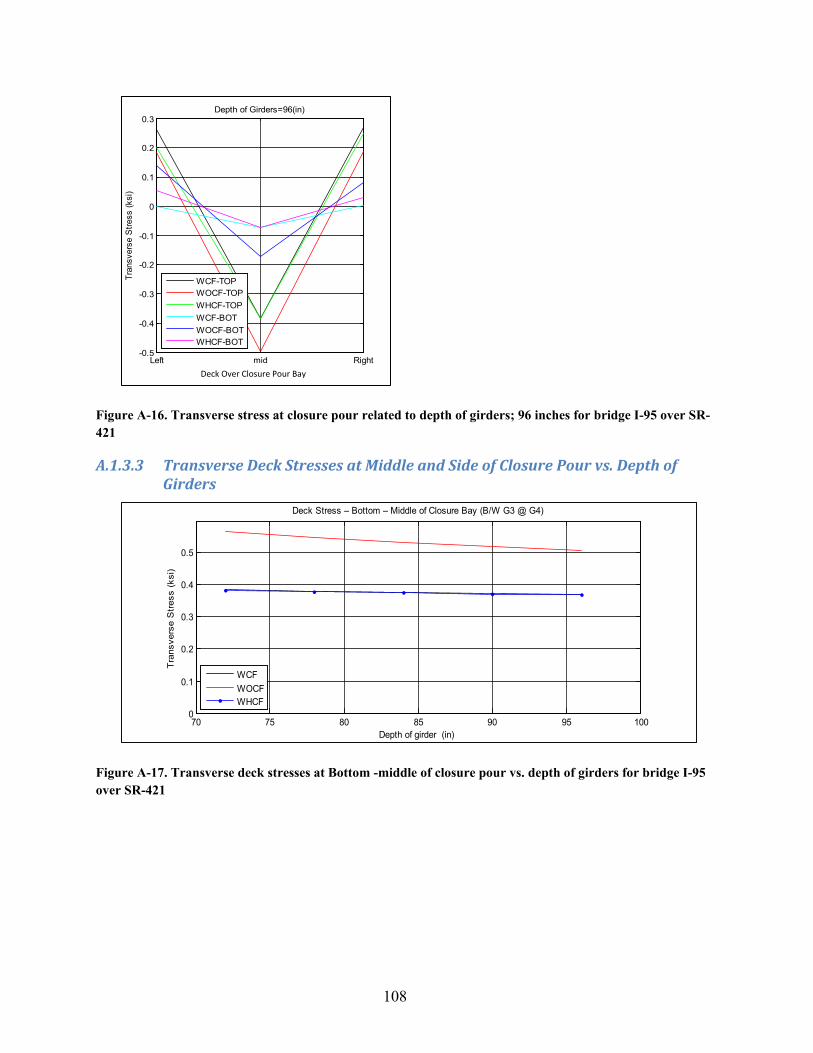
108
Figure A-16. Transverse stress at closure pour related to depth of girders; 96 inches for bridge I-95 over SR-421
A.1.3.3 Transverse Deck Stresses at Middle and Side of Closure Pour vs. Depth of Girders
Figure A-17. Transverse deck stresses at Bottom -middle of closure pour vs. depth of girders for bridge I-95 over SR-421
Left mid Right-0.5
-0.4
-0.3
-0.2
-0.1
0
0.1
0.2
0.3
Deck Over Closour Pour Bay
Tran
sver
se S
tress
(ksi
)
Depth of Girders=96(in)
WCF-TOPWOCF-TOPWHCF-TOPWCF-BOTWOCF-BOTWHCF-BOT
70 75 80 85 90 95 1000
0.1
0.2
0.3
0.4
0.5
Depth of girder (in)
Tran
sver
se S
tress
(ksi
)
Deck Stress – Bottom – Middle of Closure Bay (B/W G3 @ G4)
WCFWOCFWHCF
Deck Over Closure Pour Bay

109
Figure A-18. Transverse deck stresses at middle and side of closure pour vs. depth of girders for bridge I-95 over SR-421
70 75 80 85 90 95 1000
0.1
0.2
0.3
0.4
0.5
Depth of girder (in)
Tran
sver
se S
tress
(ksi
)
Deck Stress – Top – Side of Closure Bay (@ G3)
WCFWOCFWHCF
70 75 80 85 90 95 100
-0.5
-0.4
-0.3
-0.2
-0.1
0
Depth of girder (in)
Tran
sver
se S
tress
(ksi
)
Deck Stress – Bottom – Side of Closure Bay (@ G3)
WCFWOCFWHCF
70 75 80 85 90 95 100
-0.5
-0.4
-0.3
-0.2
-0.1
0
Depth of girder (in)
Tran
sver
se S
tress
(ksi
)
Deck Stress – Top – Middle of Closure Bay (B/W G3 @ G4)
WCFWOCFWHCF

110
A.1.4 Cross-frames Spacing
A.1.4.1 Distribution Factor for All girders Related to Different Cross-frame Spacing
Figure A-19. Distribution factor for girders G1, G2, G3 and G4 related to different cross frame spacing for bridge I-95 over SR-421
15 20 25 30 350.4
0.5
0.6
0.7
0.8
0.9
1
Cross Frame Spacing (ft.)
Dis
tribu
tion
Fact
or
G1
WCFWOCFWHCF
15 20 25 30 350.4
0.5
0.6
0.7
0.8
0.9
1
Cross Frame Spacing (ft.)
Dis
tribu
tion
Fact
or
G2
WCFWOCFWHCF
15 20 25 30 350.4
0.5
0.6
0.7
0.8
0.9
1
Cross Frame Spacing (ft.)
Dis
tribu
tion
Fact
or
G3
WCFWOCFWHCF
15 20 25 30 350.4
0.5
0.6
0.7
0.8
0.9
1
Cross Frame Spacing (ft.)
Dis
tribu
tion
Fact
or
G4
WCFWOCFWHCF

111
Figure A-20. Distribution factor for girder G5 related to different cross frame spacing for bridge I-95 over SR-421
A.1.4.2 Transverse Stress at Closure Pour Related to Different Cross-frame Spacing
Figure A-21. Transverse stress at closure pour related to different cross frame spacing; 17.11 and 19.25 ft. for bridge I-95 over SR-421
15 20 25 30 350.4
0.5
0.6
0.7
0.8
0.9
1
Cross Frame Spacing (ft.)
Dis
tribu
tion
Fact
or
G5
WCFWOCFWHCF
Left mid Right-0.6
-0.5
-0.4
-0.3
-0.2
-0.1
0
0.1
0.2
0.3
Deck Over Closour Pour Bay
Tran
sver
se S
tress
(ksi
)
Cross Frame Spacing=17.11 (ft.)
WCF-TOPWOCF-TOPWHCF-TOPWCF-BOTWOCF-BOTWHCF-BOT
Left mid Right-0.5
-0.4
-0.3
-0.2
-0.1
0
0.1
0.2
0.3
Deck Over Closour Pour Bay
Tran
sver
se S
tress
(ksi
)
Cross Frame Spacing=19.25 (ft.)
WCF-TOPWOCF-TOPWHCF-TOPWCF-BOTWOCF-BOTWHCF-BOT

112
Figure A-22. Transverse stress at closure pour related to different cross frame spacing; 22.0, 25.67 and 30.8 ft. for bridge I-95 over SR-421
Left mid Right-0.5
-0.4
-0.3
-0.2
-0.1
0
0.1
0.2
0.3
Deck Over Closour Pour Bay
Tran
sver
se S
tress
(ksi
)
Cross Frame Spacing=22.00 (ft.)
WCF-TOPWOCF-TOPWHCF-TOPWCF-BOTWOCF-BOTWHCF-BOT
Left mid Right-0.6
-0.5
-0.4
-0.3
-0.2
-0.1
0
0.1
0.2
0.3
Deck Over Closour Pour Bay
Tran
sver
se S
tress
(ksi
)
Cross Frame Spacing=25.67 (ft.)
WCF-TOPWOCF-TOPWHCF-TOPWCF-BOTWOCF-BOTWHCF-BOT
Left mid Right-0.5
-0.4
-0.3
-0.2
-0.1
0
0.1
0.2
0.3
Deck Over Closour Pour Bay
Tran
sver
se S
tress
(ksi
)
Cross Frame Spacing=30.80 (ft.)
WCF-TOPWOCF-TOPWHCF-TOPWCF-BOTWOCF-BOTWHCF-BOT
Deck Over Closure Pour Bay
Deck Over Closure Pour Bay Deck Over Closure Pour Bay

113
A.1.4.3 Transverse Deck Stresses at Middle and Side of Closure Pour vs. Cross-frames Spacing
Figure A-23. Transverse deck stresses at middle and side of closure pour vs. cross-frame spacing for bridge I-95 over SR-421
16 18 20 22 24 26 28 30 320
0.1
0.2
0.3
0.4
0.5
Cross Frame Spacing (ft.)
Tran
sver
se S
tress
(ksi
)
Deck Stress – Bottom – Middle of Closure Bay (B/W G3 @ G4)
WCFWOCFWHCF
16 18 20 22 24 26 28 30 320
0.1
0.2
0.3
0.4
0.5
Cross Frame Spacing (ft.)
Tran
sver
se S
tress
(ksi
)
Deck Stress – Top – Side of Closure Bay (@ G3)
WCFWOCFWHCF
16 18 20 22 24 26 28 30 32
-0.5
-0.4
-0.3
-0.2
-0.1
0
Cross Frame Spacing (ft.)
Tran
sver
se S
tress
(ksi
)
Deck Stress – Top – Middle of Closure Bay (B/W G3 @ G4
WCFWOCFWHCF

114
Figure A-24. Transverse deck stresses at Bottom -side of closure pour vs. cross-frame spacing for bridge I-95 over SR-421
A.1.5 Number of Girders in Phase I and II
A.1.5.1 Distribution Factor for All Girders Related to Different Number of Girders in Phases
Figure A-25. Distribution factor for girders G1 and G2 related to different phase I and II configurations for bridge I-95 over SR-421
16 18 20 22 24 26 28 30 32
-0.5
-0.4
-0.3
-0.2
-0.1
0
Cross Frame Spacing (ft.)
Tran
sver
se S
tress
(ksi
)
Deck Stress – Bottom – Side of Closure Bay (@ G3)
WCFWOCFWHCF
3-1 3-2 3-3 4-1 4-2 4-3 5-1 5-2 5-30
0.1
0.2
0.3
0.4
0.5
0.6
0.7
0.8
0.9
1
Number of Girders in Phases I and II
Dis
tribu
tion
Fact
or
G1
WCFWOCFWHCF
3-1 3-2 3-3 4-1 4-2 4-3 5-1 5-2 5-30
0.1
0.2
0.3
0.4
0.5
0.6
0.7
0.8
0.9
1
Number of Girders in Phases I and II
Dist
ribut
ion
Fact
or
G2
WCFWOCFWHCF

115
Figure A-26. Distribution factor for girders G3, G4, G5 and G6 related to different phase I and II configurations for bridge I-95 over SR-421
3-1 3-2 3-3 4-1 4-2 4-3 5-1 5-2 5-30
0.1
0.2
0.3
0.4
0.5
0.6
0.7
0.8
0.9
1
Number of Girders in Phases I and II
Dist
ribut
ion
Fact
or
G3
WCFWOCFWHCF
3-1 3-2 3-3 4-1 4-2 4-3 5-1 5-2 5-30
0.1
0.2
0.3
0.4
0.5
0.6
0.7
0.8
0.9
1
Number of Girders in Phases I and II
Dis
tribu
tion
Fact
or
G4
WCFWOCFWHCF
3-1 3-2 3-3 4-1 4-2 4-3 5-1 5-2 5-30
0.1
0.2
0.3
0.4
0.5
0.6
0.7
0.8
0.9
1
Number of Girders in Phases I and II
Dis
tribu
tion
Fact
or
G5
WCFWOCFWHCF
3-1 3-2 3-3 4-1 4-2 4-3 5-1 5-2 5-30
0.1
0.2
0.3
0.4
0.5
0.6
0.7
0.8
0.9
1
Number of Girders in Phases I and II
Dis
tribu
tion
Fact
orG6
WCFWOCFWHCF

116
Figure A-27. Distribution factor for girders G7 and G8 related to different phase I and II configurations for bridge I-95 over SR-421
A.1.5.2 Transverse Stress at Closure Pour Related to Different Number of Girders in Phases
Figure A-28. Transverse stress at closure pour related to different number of girders in phase I and II; 3-1 and 3-2 for bridge I-95 over SR-421
3-1 3-2 3-3 4-1 4-2 4-3 5-1 5-2 5-30
0.1
0.2
0.3
0.4
0.5
0.6
0.7
0.8
0.9
1
Number of Girders in Phases I and II
Dis
tribu
tion
Fact
or
G7
WCFWOCFWHCF
3-1 3-2 3-3 4-1 4-2 4-3 5-1 5-2 5-30
0.1
0.2
0.3
0.4
0.5
0.6
0.7
0.8
0.9
1
Number of Girders in Phases I and II
Dis
tribu
tion
Fact
or
G8
WCFWOCFWHCF
Left mid Right-0.5
-0.4
-0.3
-0.2
-0.1
0
0.1
0.2
0.3
Deck Over Closour Pour Bay
Tran
sver
se S
tress
(ksi
)
Number of Girders in Phases=3-1
WCF-TOPWOCF-TOPWHCF-TOPWCF-BOTWOCF-BOTWHCF-BOT
Left mid Right-0.5
-0.4
-0.3
-0.2
-0.1
0
0.1
0.2
0.3
Deck Over Closour Pour Bay
Tran
sver
se S
tress
(ksi
)
Number of Girders in Phases=3-2
WCF-TOPWOCF-TOPWHCF-TOPWCF-BOTWOCF-BOTWHCF-BOT
Deck Over Closure Pour Bay Deck Over Closure Pour Bay

117
Figure A-29. Transverse stress at closure pour related to different number of girders in phase I and II; 3-3, 4-1,4-2 and 4-3 for bridge I-95 over SR-421
Left mid Right-0.5
-0.4
-0.3
-0.2
-0.1
0
0.1
0.2
0.3
Deck Over Closour Pour Bay
Tran
sver
se S
tress
(ksi
)
Number of Girders in Phases=3-3
WCF-TOPWOCF-TOPWHCF-TOPWCF-BOTWOCF-BOTWHCF-BOT
Left mid Right-0.5
-0.4
-0.3
-0.2
-0.1
0
0.1
0.2
0.3
Deck Over Closour Pour Bay
Tran
sver
se S
tress
(ksi
)
Number of Girders in Phases=4-1
WCF-TOPWOCF-TOPWHCF-TOPWCF-BOTWOCF-BOTWHCF-BOT
Left mid Right-0.5
-0.4
-0.3
-0.2
-0.1
0
0.1
0.2
0.3
Deck Over Closour Pour Bay
Tran
sver
se S
tress
(ksi
)
Number of Girders in Phases=4-2
WCF-TOPWOCF-TOPWHCF-TOPWCF-BOTWOCF-BOTWHCF-BOT
Left mid Right-0.5
-0.4
-0.3
-0.2
-0.1
0
0.1
0.2
0.3
Deck Over Closour Pour Bay
Tran
sver
se S
tress
(ksi
)Number of Girders in Phases=4-3
WCF-TOPWOCF-TOPWHCF-TOPWCF-BOTWOCF-BOTWHCF-BOT
Deck Over Closure Pour Bay Deck Over Closure Pour Bay
Deck Over Closure Pour Bay Deck Over Closure Pour Bay
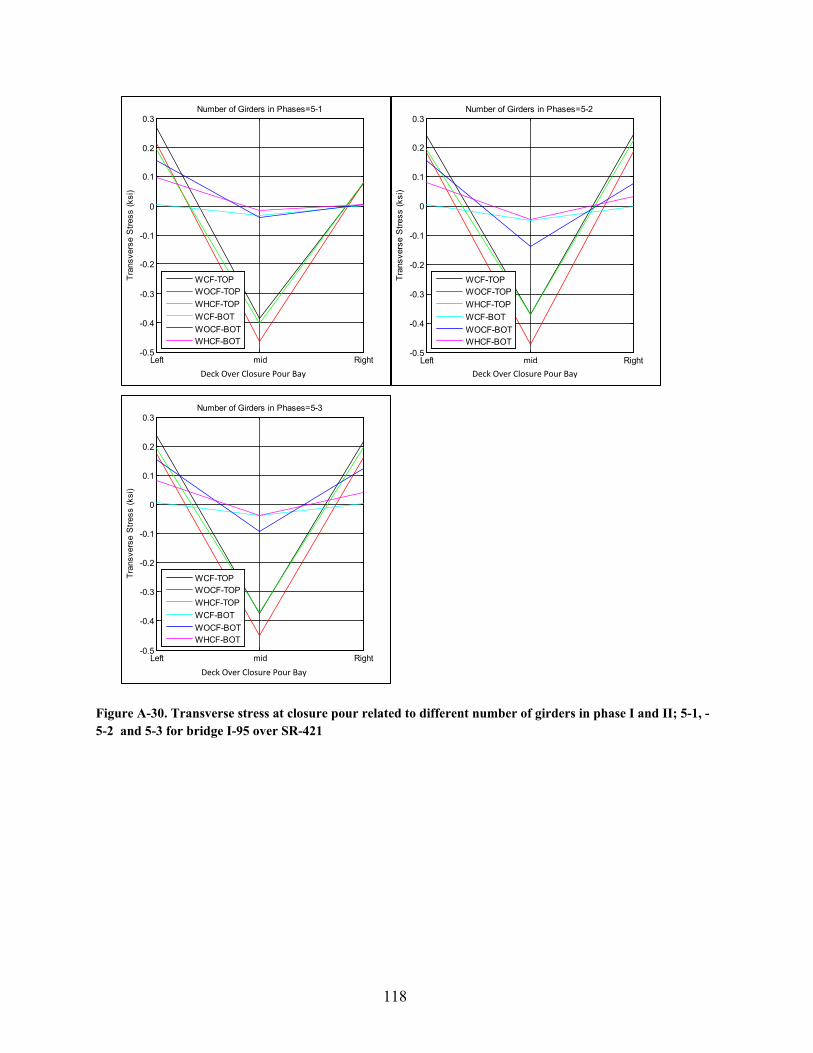
118
Figure A-30. Transverse stress at closure pour related to different number of girders in phase I and II; 5-1, -5-2 and 5-3 for bridge I-95 over SR-421
Left mid Right-0.5
-0.4
-0.3
-0.2
-0.1
0
0.1
0.2
0.3
Deck Over Closour Pour Bay
Tran
sver
se S
tress
(ksi
)
Number of Girders in Phases=5-1
WCF-TOPWOCF-TOPWHCF-TOPWCF-BOTWOCF-BOTWHCF-BOT
Left mid Right-0.5
-0.4
-0.3
-0.2
-0.1
0
0.1
0.2
0.3
Deck Over Closour Pour Bay
Tran
sver
se S
tress
(ksi
)
Number of Girders in Phases=5-2
WCF-TOPWOCF-TOPWHCF-TOPWCF-BOTWOCF-BOTWHCF-BOT
Left mid Right-0.5
-0.4
-0.3
-0.2
-0.1
0
0.1
0.2
0.3
Deck Over Closour Pour Bay
Tran
sver
se S
tress
(ksi
)
Number of Girders in Phases=5-3
WCF-TOPWOCF-TOPWHCF-TOPWCF-BOTWOCF-BOTWHCF-BOT
Deck Over Closure Pour Bay
Deck Over Closure Pour Bay Deck Over Closure Pour Bay
119
A.1.5.3 Transverse Deck Stresses at Middle and Side of Closure Pour vs. Number of Girders in Phases
Figure A-31. Transverse deck stresses at middle and side of closure pour vs. number of girders in phases for bridge I-95 over SR-421
3-2 3-3 4-2 4-3 5-2 5-30
0.1
0.2
0.3
0.4
0.5
Number of Girders in Phases I and II
Tran
sver
se S
tress
(ksi)
Deck Stress – Bottom – Middle of Closure Bay
WCFWOCFWHCF
3-2 3-3 4-2 4-3 5-2 5-30
0.1
0.2
0.3
0.4
0.5
Number of Girders in Phases I and II
Tran
sver
se S
tress
(ksi)
Deck Stress – Top – Side of Closure Bay
WCFWOCFWHCF
3-2 3-3 4-2 4-3 5-2 5-3
-0.5
-0.4
-0.3
-0.2
-0.1
0
Number of Girders in Phases I and II
Tran
sver
se S
tress
(ksi)
Deck Stress – Bottom – Side of Closure Bay
WCFWOCFWHCF

120
Figure A-32. Transverse deck stresses at middle and side of closure pour vs. number of girders in phases for bridge I-95 over SR-421
A.1.6 Parameters Combinations
A.1.6.1 Distribution Factor for All Girders Related to Parameters Combinations
Figure A-33. Distribution factor for girders G1 and G2 related to different Parameter combinations for bridge I-95 over SR-421
3-2 3-3 4-2 4-3 5-2 5-3
-0.5
-0.4
-0.3
-0.2
-0.1
0
Number of Girders in Phases I and II
Tran
sver
se S
tress
(ksi)
Deck Stress – Top – Middle of Closure Bay )
WCFWOCFWHCF
Original GS-CFS GS-DG GS-DT 0
0.1
0.2
0.3
0.4
0.5
0.6
0.7
0.8
0.9
1
Parameter Combinations
Dis
trib
utio
n F
acto
r
G1
WCFWOCFWHCF
Original GS-CFS GS-DG GS-DT 0
0.1
0.2
0.3
0.4
0.5
0.6
0.7
0.8
0.9
1
Parameter Combinations
Dis
trib
utio
n F
acto
r
G2
WCFWOCFWHCF
121
Figure A-34. Distribution factor for girders G3, G4 and G5 related to different Parameter combinations for bridge I-95 over SR-421
Original GS-CFS GS-DG GS-DT 0
0.1
0.2
0.3
0.4
0.5
0.6
0.7
0.8
0.9
1
Parameter Combinations
Dis
trib
utio
n F
acto
r
G3
WCFWOCFWHCF
Original GS-CFS GS-DG GS-DT 0
0.1
0.2
0.3
0.4
0.5
0.6
0.7
0.8
0.9
1
Parameter Combinations
Dis
trib
utio
n F
acto
r
G4
WCFWOCFWHCF
Original GS-CFS GS-DG GS-DT 0
0.1
0.2
0.3
0.4
0.5
0.6
0.7
0.8
0.9
1
Parameter Combinations
Dis
trib
utio
n F
acto
r
G5
WCFWOCFWHCF

122
A.1.6.2 Transverse Stress at Closure Pour Related to Parameters Combinations
Figure A-35. Transverse stress at closure pour related to different parameter combinations for bridge I-95 over SR-421
Left mid Right-0.5
-0.4
-0.3
-0.2
-0.1
0
0.1
0.2
0.3
Deck Over Closour Pour Bay
Tra
nsve
rse
Str
ess
(ksi
)GS-CFS
WCF-TOPWOCF-TOPWHCF-TOPWCF-BOTWOCF-BOTWHCF-BOT
Left mid Right-0.6
-0.5
-0.4
-0.3
-0.2
-0.1
0
0.1
0.2
0.3
Deck Over Closour Pour Bay T
rans
vers
e S
tres
s (k
si)
GS-DG
WCF-TOPWOCF-TOPWHCF-TOPWCF-BOTWOCF-BOTWHCF-BOT
Left mid Right-0.8
-0.6
-0.4
-0.2
0
0.2
0.4
0.6
Deck Over Closour Pour Bay
Tra
nsve
rse
Str
ess
(ksi
)
GS-DT
WCF-TOPWOCF-TOPWHCF-TOPWCF-BOTWOCF-BOTWHCF-BOT
Left mid Right-0.6
-0.5
-0.4
-0.3
-0.2
-0.1
0
0.1
0.2
0.3
Deck Over Closour Pour Bay
Tra
nsve
rse
Str
ess
(ksi
)
GS-NG
WCF-TOPWOCF-TOPWHCF-TOPWCF-BOTWOCF-BOTWHCF-BOT
Deck Over Closure Pour Bay Deck Over Closure Pour Bay
Deck Over Closure Pour Bay Deck Over Closure Pour Bay
123
A.1.6.3 Transverse Deck Stresses at Middle and Side of Closure Pour vs. Parameter Combinations
Figure A-36. Transverse deck stresses at middle and side of closure pour vs. parameter combinations for bridge I-95 over SR-421
Original GS-CFS GS-DG GS-DT GS-NG 0
0.2
0.4
0.6
0.8
1
Parameter Combinations
Tran
sver
se S
tress
(ksi
)
Deck Stress – Bottom – Middle of Closure Bay (B/W G3 @ G4)
WCFWOCFWHCF
Original GS-CFS GS-DG GS-DT GS-NG 0
0.2
0.4
0.6
0.8
1
Parameter Combinations
Tran
sver
se S
tress
(ksi
)
Deck Stress – Top – Side of Closure Bay (@ G3)
WCFWOCFWHCF
Original GS-CFS GS-DG GS-DT GS-NG
-1
-0.8
-0.6
-0.4
-0.2
0
Parameter Combinations
Tran
sver
se S
tress
(ksi
)
Deck Stress – Bottom – Side of Closure Bay (@ G3)
WCFWOCFWHCF
124
Figure A-37. Transverse deck stresses at top -middle of closure pour vs. parameter combinations for bridge I-95 over SR-421
Original GS-CFS GS-DG GS-DT GS-NG
-1
-0.8
-0.6
-0.4
-0.2
0
Parameter Combinations
Tran
sver
se S
tress
(ksi
)
Deck Stress – Top – Middle of Closure Bay (B/W G3 @ G4)
WCFWOCFWHCF

125
A.2 SR-589 over Waters Avenue
A.2.1 Girder Spacing
A.2.1.1 Distribution Factor for All Girders Related to Different Girder Spacing
Figure A-38. Distribution factor for girders G1, G2, G3 and G4 related to different girder spacing for bridge SR-589 over Waters Avenue
50-94 68-112 92-136 110-154 128-1720
0.1
0.2
0.3
0.4
0.5
0.6
0.7
0.8
0.9
1
Girder Spacing (in)
Dis
trib
utio
n F
acto
r
G1
WCFWOCFWHCF
50-94 68-112 92-136 110-154 128-1720
0.1
0.2
0.3
0.4
0.5
0.6
0.7
0.8
0.9
1
Girder Spacing (in)
Dis
trib
utio
n F
acto
r
G2
WCFWOCFWHCF
50-94 68-112 92-136 110-154 128-1720
0.1
0.2
0.3
0.4
0.5
0.6
0.7
0.8
0.9
1
Girder Spacing (in)
Dis
trib
utio
n F
acto
r
G3
WCFWOCFWHCF
50-94 68-112 92-136 110-154 128-1720
0.1
0.2
0.3
0.4
0.5
0.6
0.7
0.8
0.9
1
Girder Spacing (in)
Dis
trib
utio
n F
acto
r
G4
WCFWOCFWHCF
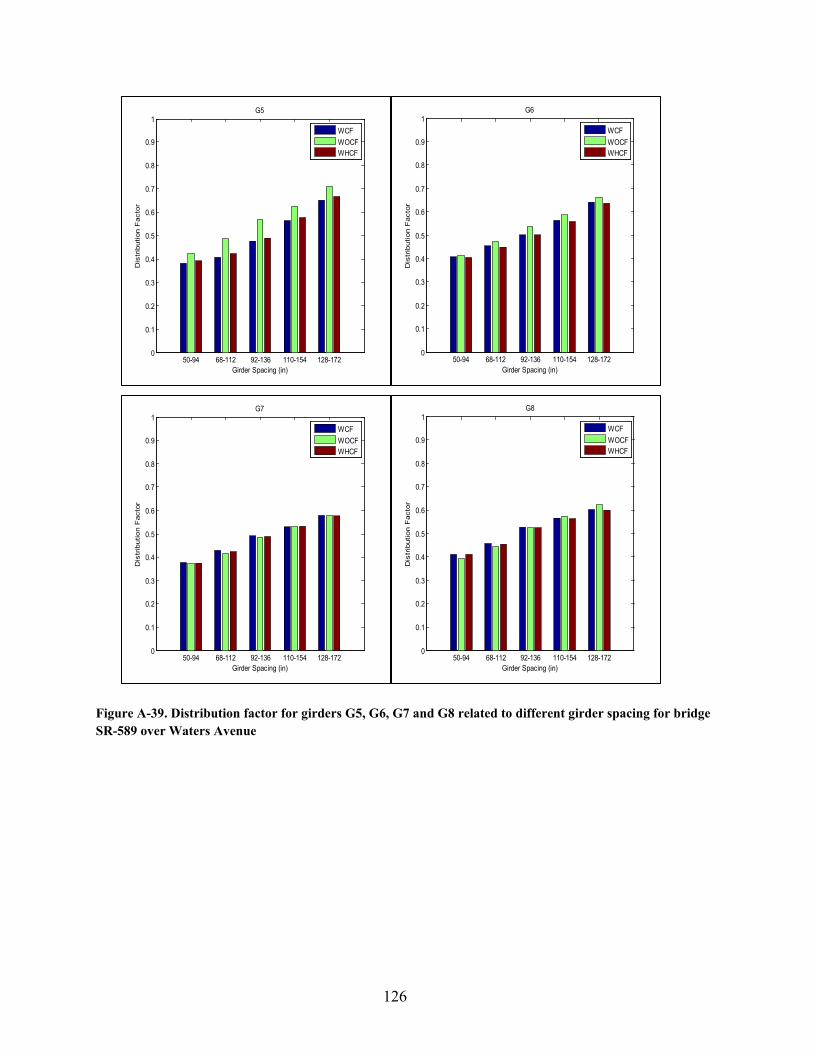
126
Figure A-39. Distribution factor for girders G5, G6, G7 and G8 related to different girder spacing for bridge SR-589 over Waters Avenue
50-94 68-112 92-136 110-154 128-1720
0.1
0.2
0.3
0.4
0.5
0.6
0.7
0.8
0.9
1
Girder Spacing (in)
Dis
trib
utio
n F
acto
r
G5
WCFWOCFWHCF
50-94 68-112 92-136 110-154 128-1720
0.1
0.2
0.3
0.4
0.5
0.6
0.7
0.8
0.9
1
Girder Spacing (in)
Dis
trib
utio
n F
acto
r
G6
WCFWOCFWHCF
50-94 68-112 92-136 110-154 128-1720
0.1
0.2
0.3
0.4
0.5
0.6
0.7
0.8
0.9
1
Girder Spacing (in)
Dis
trib
utio
n F
acto
r
G7
WCFWOCFWHCF
50-94 68-112 92-136 110-154 128-1720
0.1
0.2
0.3
0.4
0.5
0.6
0.7
0.8
0.9
1
Girder Spacing (in)
Dis
trib
utio
n F
acto
rG8
WCFWOCFWHCF

127
A.2.1.2 Transverse Stress at Closure Pour Related to Different Girder Spacing
Figure A-40.Transverse stress at closure pour related to different girder spacing for SR-589 over Waters Avenue
Left mid Right-0.4
-0.3
-0.2
-0.1
0
0.1
0.2
0.3
Deck Over Closour Pour Bay
Tra
nsve
rse
Str
ess
(ksi
)Girder Spacing=50-94(in)
WCF-TOPWOCF-TOPWHCF-TOPWCF-BOTWOCF-BOTWHCF-BOT
Left mid Right-0.4
-0.3
-0.2
-0.1
0
0.1
0.2
0.3
Deck Over Closour Pour Bay T
rans
vers
e S
tres
s (k
si)
Girder Spacing=68-112(in)
WCF-TOPWOCF-TOPWHCF-TOPWCF-BOTWOCF-BOTWHCF-BOT
Left mid Right-0.5
-0.4
-0.3
-0.2
-0.1
0
0.1
0.2
0.3
Deck Over Closour Pour Bay
Tra
nsve
rse
Str
ess
(ksi
)
Girder Spacing=92-136(in)
WCF-TOPWOCF-TOPWHCF-TOPWCF-BOTWOCF-BOTWHCF-BOT
Left mid Right-0.5
-0.4
-0.3
-0.2
-0.1
0
0.1
0.2
0.3
Deck Over Closour Pour Bay
Tra
nsve
rse
Str
ess
(ksi
)
Girder Spacing=110-154(in)
WCF-TOPWOCF-TOPWHCF-TOPWCF-BOTWOCF-BOTWHCF-BOT
Deck Over Closure Pour Bay
Deck Over Closure Pour Bay Deck Over Closure Pour Bay
Deck Over Closure Pour Bay

128
Figure A-40. Transverse stress at closure pour related to different girder spacing for SR-589 over Waters Avenue – Cont’d
A.2.1.3 Transverse Deck Stresses at Middle and Side of Closure Pour vs. Girder Spacing
Figure A-41. Transverse deck stresses at Bottom -middle of closure pour vs. girder spacing for bridge SR-589 over Waters Avenue
Left mid Right-0.5
-0.4
-0.3
-0.2
-0.1
0
0.1
0.2
0.3
0.4
Deck Over Closour Pour Bay
Tra
nsve
rse
Str
ess
(ksi
)
Girder Spacing=128-172(in)
WCF-TOPWOCF-TOPWHCF-TOPWCF-BOTWOCF-BOTWHCF-BOT
50-94 68-112 92-136 110-154 128-1720
0.1
0.2
0.3
0.4
0.5
0.6
Girder Spacing (in)
Tra
nsve
rse
Str
ess
(ksi
)
Deck Stress – Bottom – Middle of Closure Bay
WCFWOCFWHCF
Deck Over Closure Pour Bay

129
Figure A-42. Transverse deck stresses at middle and side of closure pour vs. girder spacing for bridge SR-589 over Waters Avenue
50-94 68-112 92-136 110-154 128-1720
0.1
0.2
0.3
0.4
0.5
0.6
Girder Spacing (in)
Tra
nsve
rse
Str
ess
(ksi
)
Deck Stress – Top – Side of Closure Bay
WCFWOCFWHCF
50-94 68-112 92-136 110-154 128-172
-0.5
-0.4
-0.3
-0.2
-0.1
0
Girder Spacing (in)
Tra
nsve
rse
Str
ess
(ksi
)
Deck Stress – Bottom – Side of Closure Bay
WCFWOCFWHCF
50-94 68-112 92-136 110-154 128-172
-0.5
-0.4
-0.3
-0.2
-0.1
0
Girder Spacing (in)
Tra
nsve
rse
Str
ess
(ksi
)
Deck Stress – Top – Middle of Closure Bay
WCFWOCFWHCF

130
A.2.2 Thickness of Deck
A.2.2.1 Distribution Factor for All Girders Related to Different Deck Thickness
Figure A-43. Distribution factor for girders G1, G2, G3 and G4 related to different deck thicknesses for bridge SR-589 over Waters Avenue
6 7 8 9 10 110.4
0.5
0.6
0.7
0.8
0.9
1
Deck Thickness (in)
Dist
ribut
ion
Fact
or
G1
WCFWOCFWHCF
6 7 8 9 10 110.4
0.5
0.6
0.7
0.8
0.9
1
Deck Thickness (in)
Dist
ribut
ion
Fact
or
G2
WCFWOCFWHCF
6 7 8 9 10 110.4
0.5
0.6
0.7
0.8
0.9
1
Deck Thickness (in)
Dist
ribut
ion
Fact
or
G3
WCFWOCFWHCF
6 7 8 9 10 110.4
0.5
0.6
0.7
0.8
0.9
1
Deck Thickness (in)
Dist
ribut
ion
Fact
or
G4
WCFWOCFWHCF

131
Figure A-44. Distribution factor for girders G5, G6, G7 and G8 related to different deck thicknesses for bridge SR-589 over Waters Avenue
6 7 8 9 10 110.4
0.5
0.6
0.7
0.8
0.9
1
Deck Thickness (in)
Dist
ribut
ion
Fact
or
G5
WCFWOCFWHCF
6 7 8 9 10 110.4
0.5
0.6
0.7
0.8
0.9
1
Deck Thickness (in)
Dist
ribut
ion
Fact
or
G6
WCFWOCFWHCF
6 7 8 9 10 110.4
0.5
0.6
0.7
0.8
0.9
1
Deck Thickness (in)
Dist
ribut
ion
Fact
or
G7
WCFWOCFWHCF
6 7 8 9 10 110.4
0.5
0.6
0.7
0.8
0.9
1
Deck Thickness (in)
Dist
ribut
ion
Fact
orG8
WCFWOCFWHCF

132
A.2.2.2 Transverse Stress at Closure Pour Related to Different Deck Thickness
Figure A-45. Transverse stress at closure pour related to different deck thicknesses for SR-589 over Waters Avenue
Left mid Right-0.8
-0.6
-0.4
-0.2
0
0.2
0.4
0.6
Deck Over Closour Pour Bay
Tra
nsve
rse
Str
ess
(ksi
)Deck Thickness=6.50(in)
WCF-TOPWOCF-TOPWHCF-TOPWCF-BOTWOCF-BOTWHCF-BOT
Left mid Right-0.6
-0.5
-0.4
-0.3
-0.2
-0.1
0
0.1
0.2
0.3
0.4
Deck Over Closour Pour Bay T
rans
vers
e S
tres
s (k
si)
Deck Thickness=7.50(in)
WCF-TOPWOCF-TOPWHCF-TOPWCF-BOTWOCF-BOTWHCF-BOT
Left mid Right-0.5
-0.4
-0.3
-0.2
-0.1
0
0.1
0.2
0.3
Deck Over Closour Pour Bay
Tra
nsve
rse
Str
ess
(ksi
)
Deck Thickness=8.50(in)
WCF-TOPWOCF-TOPWHCF-TOPWCF-BOTWOCF-BOTWHCF-BOT
Left mid Right-0.4
-0.3
-0.2
-0.1
0
0.1
0.2
0.3
Deck Over Closour Pour Bay
Tra
nsve
rse
Str
ess
(ksi
)
Deck Thickness=9.50(in)
WCF-TOPWOCF-TOPWHCF-TOPWCF-BOTWOCF-BOTWHCF-BOT
Deck Over Closure Pour Bay Deck Over Closure Pour Bay
Deck Over Closure Pour Bay Deck Over Closure Pour Bay

133
Figure A-45. Transverse stress at closure pour related to different deck thicknesses for SR-589 over Waters Avenue – Cont’d
A.2.2.3 Transverse Deck Stresses at Middle and Side of Closure Pour vs. Deck Thickness
Figure A-46. Transverse deck stresses at Bottom -middle of closure pour vs. deck thickness for bridge SR-589 over Waters Avenue
Left mid Right-0.35
-0.3
-0.25
-0.2
-0.15
-0.1
-0.05
0
0.05
0.1
0.15
Deck Over Closour Pour Bay
Tra
nsve
rse
Str
ess
(ksi
)
Deck Thickness=10.5(in)
WCF-TOPWOCF-TOPWHCF-TOPWCF-BOTWOCF-BOTWHCF-BOT
6.5 7 7.5 8 8.5 9 9.5 10 10.50
0.1
0.2
0.3
0.4
0.5
0.6
0.7
0.8
Deck Thickness (in)
Tra
nsve
rse
Str
ess
(ksi
)
Deck Stress – Bottom – Middle of Closure Bay
WCFWOCFWHCF
Deck Over Closure Pour Bay

134
Figure A-47. Transverse deck stresses at middle and side of closure pour vs. deck thickness for bridge SR-589 over Waters Avenue
6.5 7 7.5 8 8.5 9 9.5 10 10.50
0.1
0.2
0.3
0.4
0.5
0.6
0.7
0.8
Deck Thickness (in)
Tra
nsve
rse
Str
ess
(ksi
)
Deck Stress – Top – Side of Closure Bay
WCFWOCFWHCF
6.5 7 7.5 8 8.5 9 9.5 10 10.50
0.1
0.2
0.3
0.4
0.5
0.6
0.7
0.8
Deck Thickness (in)
Tra
nsve
rse
Str
ess
(ksi
)
Deck Stress – Top – Side of Closure Bay
WCFWOCFWHCF
6.5 7 7.5 8 8.5 9 9.5 10 10.5-0.8
-0.7
-0.6
-0.5
-0.4
-0.3
-0.2
-0.1
0
Deck Thickness (in)
Tran
sver
se S
tress
(ksi
)
Deck Stress – Top – Middle of Closure Bay
WCFWOCFWHCF
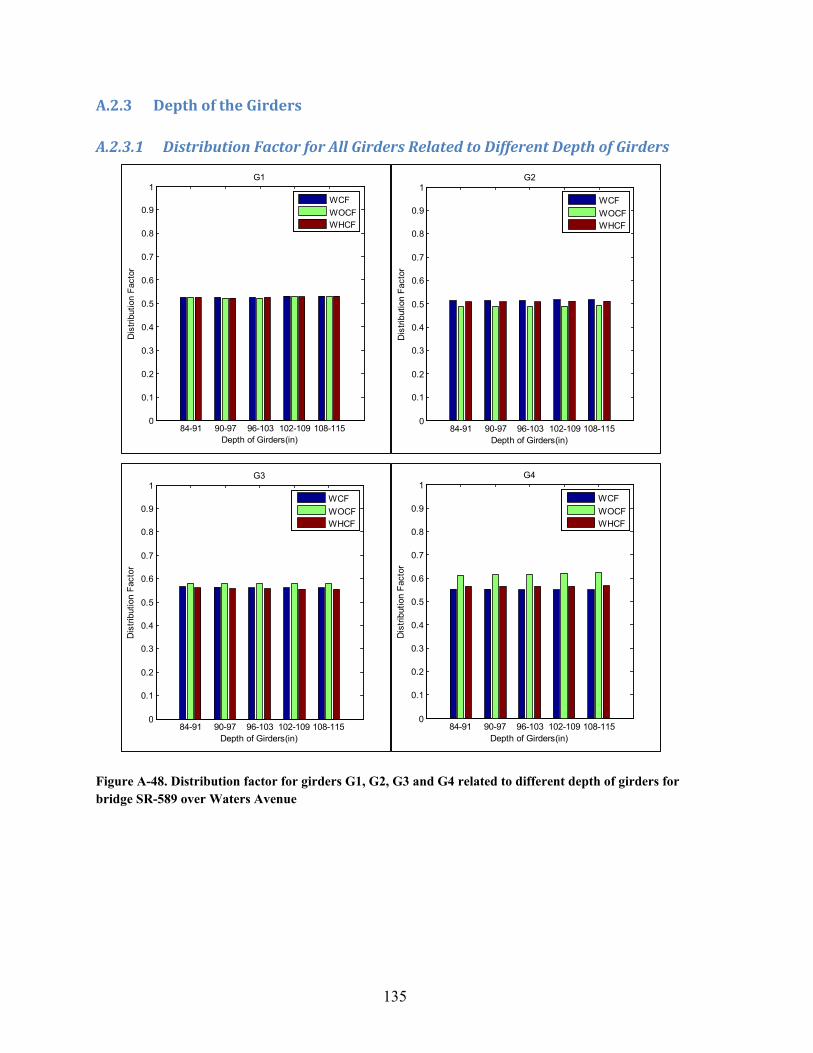
135
A.2.3 Depth of the Girders
A.2.3.1 Distribution Factor for All Girders Related to Different Depth of Girders
Figure A-48. Distribution factor for girders G1, G2, G3 and G4 related to different depth of girders for bridge SR-589 over Waters Avenue
84-91 90-97 96-103 102-109 108-1150
0.1
0.2
0.3
0.4
0.5
0.6
0.7
0.8
0.9
1
Depth of Girders(in)
Dis
tribu
tion
Fact
or
G1
WCFWOCFWHCF
84-91 90-97 96-103 102-109 108-1150
0.1
0.2
0.3
0.4
0.5
0.6
0.7
0.8
0.9
1
Depth of Girders(in)
Dis
tribu
tion
Fact
or
G2
WCFWOCFWHCF
84-91 90-97 96-103 102-109 108-1150
0.1
0.2
0.3
0.4
0.5
0.6
0.7
0.8
0.9
1
Depth of Girders(in)
Dis
tribu
tion
Fact
or
G3
WCFWOCFWHCF
84-91 90-97 96-103 102-109 108-1150
0.1
0.2
0.3
0.4
0.5
0.6
0.7
0.8
0.9
1
Depth of Girders(in)
Dis
tribu
tion
Fact
or
G4
WCFWOCFWHCF

136
Figure A-49. Distribution factor for girders G5, G6, G7 and G8 related to different depth of girders for bridge SR-589 over Waters Avenue
84-91 90-97 96-103 102-109 108-1150
0.1
0.2
0.3
0.4
0.5
0.6
0.7
0.8
0.9
1
Depth of Girders(in)
Dis
tribu
tion
Fact
or
G5
WCFWOCFWHCF
84-91 90-97 96-103 102-109 108-1150
0.1
0.2
0.3
0.4
0.5
0.6
0.7
0.8
0.9
1
Depth of Girders(in)
Dis
tribu
tion
Fact
or
G6
WCFWOCFWHCF
84-91 90-97 96-103 102-109 108-1150
0.1
0.2
0.3
0.4
0.5
0.6
0.7
0.8
0.9
1
Depth of Girders(in)
Dis
tribu
tion
Fact
or
G7
WCFWOCFWHCF
84-91 90-97 96-103 102-109 108-1150
0.1
0.2
0.3
0.4
0.5
0.6
0.7
0.8
0.9
1
Depth of Girders(in)
Dis
tribu
tion
Fact
orG8
WCFWOCFWHCF

137
A.2.3.2 Transverse Stress at Closure Pour Related to Different Depth of Girders
Figure A-50. Transverse stress at closure pour related to different depth of girders for SR-589 over Waters Avenue
Left mid Right-0.5
-0.4
-0.3
-0.2
-0.1
0
0.1
0.2
0.3
Deck Over Closour Pour Bay
Tra
nsve
rse
Str
ess
(ksi
)Depth of girders:84-91
WCF-TOPWOCF-TOPWHCF-TOPWCF-BOTWOCF-BOTWHCF-BOT
Left mid Right-0.5
-0.4
-0.3
-0.2
-0.1
0
0.1
0.2
0.3
Deck Over Closour Pour Bay T
rans
vers
e S
tres
s (k
si)
Depth of girders:90-97
WCF-TOPWOCF-TOPWHCF-TOPWCF-BOTWOCF-BOTWHCF-BOT
Left mid Right-0.5
-0.4
-0.3
-0.2
-0.1
0
0.1
0.2
0.3
Deck Over Closour Pour Bay
Tra
nsve
rse
Str
ess
(ksi
)
Depth of girders:96-103
WCF-TOPWOCF-TOPWHCF-TOPWCF-BOTWOCF-BOTWHCF-BOT
Left mid Right-0.5
-0.4
-0.3
-0.2
-0.1
0
0.1
0.2
0.3
Deck Over Closour Pour Bay
Tra
nsve
rse
Str
ess
(ksi
)
Depth of girders:102-109
WCF-TOPWOCF-TOPWHCF-TOPWCF-BOTWOCF-BOTWHCF-BOT
(in) (in)
(in) (in)
Deck Over Closure Pour Bay Deck Over Closure Pour Bay
Deck Over Closure Pour Bay Deck Over Closure Pour Bay

138
Figure A-50. Transverse stress at closure pour related to different depth of girders for SR-589 over Waters Avenue – Cont’d
A.2.3.3 Transverse deck Stresses at Middle and Side of Closure Pour vs. Depth of Girders
Figure A-51. Transverse deck stresses at Bottom -middle of closure pour vs. depth of girders for bridge SR-589 over Waters Avenue
Left mid Right-0.5
-0.4
-0.3
-0.2
-0.1
0
0.1
0.2
0.3
Deck Over Closour Pour Bay
Tra
nsve
rse
Str
ess
(ksi
)
Depth of girders:108-115
WCF-TOPWOCF-TOPWHCF-TOPWCF-BOTWOCF-BOTWHCF-BOT
84-91 90-97 96-103 102-109 108-1150
0.1
0.2
0.3
0.4
0.5
Depth of Girders(in)
Tran
sver
se S
tress
(ksi
)
Deck Stress – Bottom – Middle of Closure Bay
WCFWOCFWHCF
(in)
Deck Over Closure Pour Bay
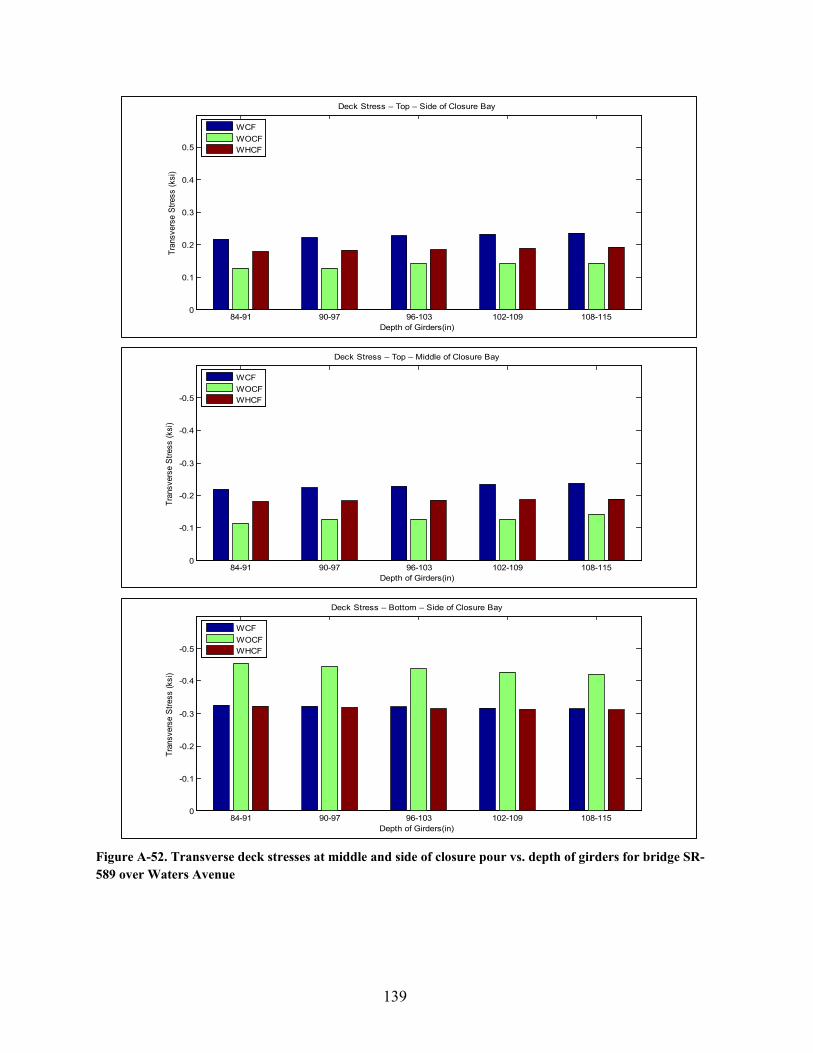
139
Figure A-52. Transverse deck stresses at middle and side of closure pour vs. depth of girders for bridge SR-589 over Waters Avenue
84-91 90-97 96-103 102-109 108-1150
0.1
0.2
0.3
0.4
0.5
Depth of Girders(in)
Tran
sver
se S
tress
(ksi
)
Deck Stress – Top – Side of Closure Bay
WCFWOCFWHCF
84-91 90-97 96-103 102-109 108-115
-0.5
-0.4
-0.3
-0.2
-0.1
0
Depth of Girders(in)
Tran
sver
se S
tress
(ksi
)
Deck Stress – Top – Middle of Closure Bay
WCFWOCFWHCF
84-91 90-97 96-103 102-109 108-115
-0.5
-0.4
-0.3
-0.2
-0.1
0
Depth of Girders(in)
Tran
sver
se S
tress
(ksi
)
Deck Stress – Bottom – Side of Closure Bay
WCFWOCFWHCF
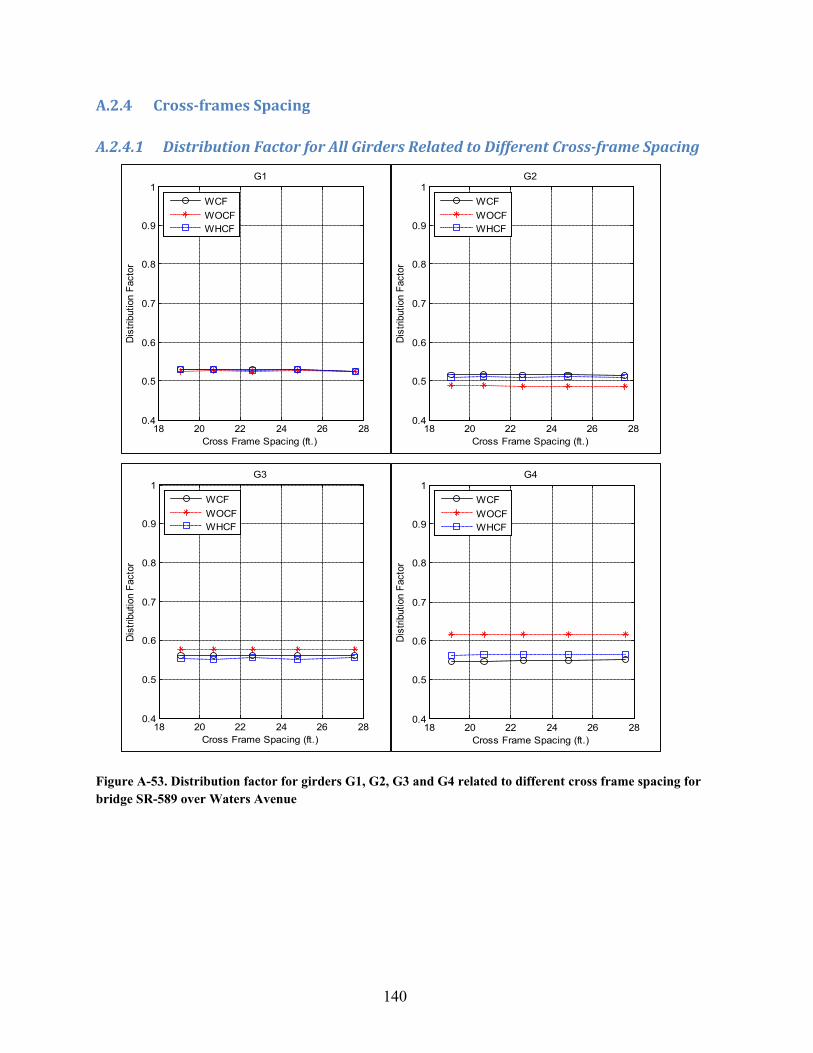
140
A.2.4 Cross-frames Spacing
A.2.4.1 Distribution Factor for All Girders Related to Different Cross-frame Spacing
Figure A-53. Distribution factor for girders G1, G2, G3 and G4 related to different cross frame spacing for bridge SR-589 over Waters Avenue
18 20 22 24 26 280.4
0.5
0.6
0.7
0.8
0.9
1
Cross Frame Spacing (ft.)
Dis
tribu
tion
Fact
or
G1
WCFWOCFWHCF
18 20 22 24 26 280.4
0.5
0.6
0.7
0.8
0.9
1
Cross Frame Spacing (ft.)
Dist
ribut
ion
Fact
or
G2
WCFWOCFWHCF
18 20 22 24 26 280.4
0.5
0.6
0.7
0.8
0.9
1
Cross Frame Spacing (ft.)
Dist
ribut
ion
Fact
or
G3
WCFWOCFWHCF
18 20 22 24 26 280.4
0.5
0.6
0.7
0.8
0.9
1
Cross Frame Spacing (ft.)
Dist
ribut
ion
Fact
or
G4
WCFWOCFWHCF
141
Figure A-54. Distribution factor for girders G5, G6, G7 and G8 related to different cross frame spacing for bridge SR-589 over Waters Avenue
18 20 22 24 26 280.4
0.5
0.6
0.7
0.8
0.9
1
Cross Frame Spacing (ft.)
Dist
ribut
ion
Fact
or
G5
WCFWOCFWHCF
18 20 22 24 26 280.4
0.5
0.6
0.7
0.8
0.9
1
Cross Frame Spacing (ft.)
Dis
tribu
tion
Fact
or
G6
WCFWOCFWHCF
18 20 22 24 26 280.4
0.5
0.6
0.7
0.8
0.9
1
Cross Frame Spacing (ft.)
Dis
tribu
tion
Fact
or
G7
WCFWOCFWHCF
18 20 22 24 26 280.4
0.5
0.6
0.7
0.8
0.9
1
Cross Frame Spacing (ft.)
Dis
tribu
tion
Fact
orG8
WCFWOCFWHCF

142
A.2.4.2 Transverse Stress at Closure Pour Related to Different Cross-frame Spacing
Figure A-55. Transverse stress at closure pour related to different cross-frame spacing for SR-589 over Waters Avenue
Left mid Right-0.5
-0.4
-0.3
-0.2
-0.1
0
0.1
0.2
0.3
Deck Over Closour Pour Bay
Tra
nsve
rse
Str
ess
(ksi
)Cross Frame Spacing=19.1(ft.)
WCF-TOPWOCF-TOPWHCF-TOPWCF-BOTWOCF-BOTWHCF-BOT
Left mid Right-0.5
-0.4
-0.3
-0.2
-0.1
0
0.1
0.2
0.3
Deck Over Closour Pour Bay T
rans
vers
e S
tres
s (k
si)
Cross Frame Spacing=20.7(ft.)
WCF-TOPWOCF-TOPWHCF-TOPWCF-BOTWOCF-BOTWHCF-BOT
Left mid Right-0.5
-0.4
-0.3
-0.2
-0.1
0
0.1
0.2
0.3
Deck Over Closour Pour Bay
Tra
nsve
rse
Str
ess
(ksi
)
Cross Frame Spacing=22.6(ft.)
WCF-TOPWOCF-TOPWHCF-TOPWCF-BOTWOCF-BOTWHCF-BOT
Left mid Right-0.5
-0.4
-0.3
-0.2
-0.1
0
0.1
0.2
0.3
Deck Over Closour Pour Bay
Tra
nsve
rse
Str
ess
(ksi
)
Cross Frame Spacing=22.6(ft.)
WCF-TOPWOCF-TOPWHCF-TOPWCF-BOTWOCF-BOTWHCF-BOT
Deck Over Closure Pour Bay
Deck Over Closure Pour Bay Deck Over Closure Pour Bay
Deck Over Closure Pour Bay
143
Figure A-55. Transverse stress at closure pour related to different cross-frame spacing for SR-589 over Waters Avenue – Cont’d
A.2.4.3 Transverse Deck stresses at Middle and Side of Closure Pour vs. Cross-frames Spacing
Figure A-56. Transverse deck stresses at Bottom-middle of closure pour vs. cross-frame spacing for bridge SR-589 over Waters Avenue
Left mid Right-0.5
-0.4
-0.3
-0.2
-0.1
0
0.1
0.2
0.3
Deck Over Closour Pour Bay
Tra
nsve
rse
Str
ess
(ksi
)
Cross Frame Spacing=24.8(ft.)
WCF-TOPWOCF-TOPWHCF-TOPWCF-BOTWOCF-BOTWHCF-BOT
19 20 21 22 23 24 25 26 27 28
-0.5
-0.4
-0.3
-0.2
-0.1
0
Cross Frame Spacing (ft.)
Tran
sver
se S
tress
(ksi
)
Deck Stress – Top – Middle of Closure Bay
WCFWOCFWHCF
Deck Over Closure Pour Bay

144
Figure A-57. Transverse deck stresses at middle and side of closure pour vs. cross-frame spacing for bridge SR-589 over Waters Avenue
19 20 21 22 23 24 25 26 27 280
0.1
0.2
0.3
0.4
0.5
Cross Frame Spacing (ft.)
Tran
sver
se S
tress
(ksi
)
Deck Stress – Top – Side of Closure Bay
WCFWOCFWHCF
19 20 21 22 23 24 25 26 27 280
0.1
0.2
0.3
0.4
0.5
Cross Frame Spacing (ft.)
Tran
sver
se S
tress
(ksi
)
Deck Stress – Bottom – Middle of Closure Bay
WCFWOCFWHCF
19 20 21 22 23 24 25 26 27 28
-0.5
-0.4
-0.3
-0.2
-0.1
0
Cross Frame Spacing (ft.)
Tra
nsve
rse
Str
ess
(ksi
)
Deck Stress – Top – Middle of Closure Bay
WCFWOCFWHCF
145
A.2.5 Number of Girders in Phase I and II
A.2.5.1 Distribution Factor for All Girders Related to Different Number of Girders in Phases
Figure A-58. Distribution factor for girders G1, G2, G3 and G4 related to different configuration of phases for bridge SR-589 over Waters Avenue
2-3-2 3-3-3 4-3-4 2-4-2 3-4-3 4-4-4 2-5-2 3-5-3 4-5-40
0.1
0.2
0.3
0.4
0.5
0.6
0.7
0.8
0.9
1
Number of Girders in Phases I and II
Dis
trib
utio
n F
acto
r
G1
WCFWOCFWHCF
2-3-2 3-3-3 4-3-4 2-4-2 3-4-3 4-4-4 2-5-2 3-5-3 4-5-40
0.1
0.2
0.3
0.4
0.5
0.6
0.7
0.8
0.9
1
Number of Girders in Phases I and II
Dis
trib
utio
n F
acto
r
G2
WCFWOCFWHCF
2-3-2 3-3-3 4-3-4 2-4-2 3-4-3 4-4-4 2-5-2 3-5-3 4-5-40
0.1
0.2
0.3
0.4
0.5
0.6
0.7
0.8
0.9
1
Number of Girders in Phases I and II
Dis
trib
utio
n F
acto
r
G3
WCFWOCFWHCF
2-3-2 3-3-3 4-3-4 2-4-2 3-4-3 4-4-4 2-5-2 3-5-3 4-5-40
0.1
0.2
0.3
0.4
0.5
0.6
0.7
0.8
0.9
1
Number of Girders in Phases I and II
Dis
trib
utio
n F
acto
r
G4
WCFWOCFWHCF

146
Figure A-59. Distribution factor for girders G5, G6, G7 and G8 related to different configuration of phases for bridge SR-589 over Waters Avenue
2-3-2 3-3-3 4-3-4 2-4-2 3-4-3 4-4-4 2-5-2 3-5-3 4-5-40
0.1
0.2
0.3
0.4
0.5
0.6
0.7
0.8
0.9
1
Number of Girders in Phases I and II
Dis
trib
utio
n F
acto
r
G5
WCFWOCFWHCF
2-3-2 3-3-3 4-3-4 2-4-2 3-4-3 4-4-4 2-5-2 3-5-3 4-5-40
0.1
0.2
0.3
0.4
0.5
0.6
0.7
0.8
0.9
1
Number of Girders in Phases I and II
Dis
trib
utio
n F
acto
r
G6
WCFWOCFWHCF
2-3-2 3-3-3 4-3-4 2-4-2 3-4-3 4-4-4 2-5-2 3-5-3 4-5-40
0.1
0.2
0.3
0.4
0.5
0.6
0.7
0.8
0.9
1
Number of Girders in Phases I and II
Dis
trib
ution F
acto
r
G7
WCFWOCFWHCF
2-3-2 3-3-3 4-3-4 2-4-2 3-4-3 4-4-4 2-5-2 3-5-3 4-5-40
0.1
0.2
0.3
0.4
0.5
0.6
0.7
0.8
0.9
1
Number of Girders in Phases I and II
Dis
trib
utio
n F
acto
rG8
WCFWOCFWHCF

147
Figure A-60. Distribution factor for girders G9, G10, G11 and G12 related to different configuration of phases for bridge SR-589 over Waters Avenue
2-3-2 3-3-3 4-3-4 2-4-2 3-4-3 4-4-4 2-5-2 3-5-3 4-5-40
0.1
0.2
0.3
0.4
0.5
0.6
0.7
0.8
0.9
1
Number of Girders in Phases I and II
Dis
trib
utio
n F
acto
r
G9
WCFWOCFWHCF
2-3-2 3-3-3 4-3-4 2-4-2 3-4-3 4-4-4 2-5-2 3-5-3 4-5-40
0.1
0.2
0.3
0.4
0.5
0.6
0.7
0.8
0.9
1
Number of Girders in Phases I and II
Dis
trib
utio
n F
acto
r
G10
WCFWOCFWHCF
2-3-2 3-3-3 4-3-4 2-4-2 3-4-3 4-4-4 2-5-2 3-5-3 4-5-40
0.1
0.2
0.3
0.4
0.5
0.6
0.7
0.8
0.9
1
Number of Girders in Phases I and II
Dis
trib
utio
n F
acto
r
G11
WCFWOCFWHCF
2-3-2 3-3-3 4-3-4 2-4-2 3-4-3 4-4-4 2-5-2 3-5-3 4-5-40
0.1
0.2
0.3
0.4
0.5
0.6
0.7
0.8
0.9
1
Number of Girders in Phases I and II
Dis
trib
utio
n F
acto
rG12
WCFWOCFWHCF

148
Figure A-61. Distribution factor for girder G13 related to different configuration of phases for bridge SR-589 over Waters Avenue
A.2.5.2 Transverse Stress at Closure Pour Related to Different Number of Girders in Phases
Figure A-62. Transverse stress at closure pour related to different number of girders in phases for SR-589 over Waters Avenue
2-3-2 3-3-3 4-3-4 2-4-2 3-4-3 4-4-4 2-5-2 3-5-3 4-5-40
0.1
0.2
0.3
0.4
0.5
0.6
0.7
0.8
0.9
1
Number of Girders in Phases I and II
Dis
trib
utio
n F
acto
r
G13
WCFWOCFWHCF
Left mid Right-0.25
-0.2
-0.15
-0.1
-0.05
0
0.05
0.1
0.15
Deck Over Closour Pour Bay
Tra
nsve
rse
Str
ess
(ksi
)
Number of Girders in Phases=2-3-2
WCF-TOPWOCF-TOPWHCF-TOPWCF-BOTWOCF-BOTWHCF-BOT
Left mid Right-0.3
-0.25
-0.2
-0.15
-0.1
-0.05
0
0.05
0.1
0.15
Deck Over Closour Pour Bay
Tra
nsve
rse
Str
ess
(ksi
)
Number of Girders in Phases=3-3-3
WCF-TOPWOCF-TOPWHCF-TOPWCF-BOTWOCF-BOTWHCF-BOT
Deck Over Closure Pour Bay Deck Over Closure Pour Bay

149
Figure A-62. Transverse stress at closure pour related to different number of girders in phases for SR-589 over Waters Avenue – Cont’d
Left mid Right-0.3
-0.25
-0.2
-0.15
-0.1
-0.05
0
0.05
0.1
0.15
0.2
Deck Over Closour Pour Bay
Tra
nsve
rse
Str
ess
(ksi
)
Number of Girders in Phases=4-3-4
WCF-TOPWOCF-TOPWHCF-TOPWCF-BOTWOCF-BOTWHCF-BOT
Left mid Right-0.25
-0.2
-0.15
-0.1
-0.05
0
0.05
0.1
0.15
Deck Over Closour Pour Bay
Tra
nsve
rse
Str
ess
(ksi
)
Number of Girders in Phases=2-4-2
WCF-TOPWOCF-TOPWHCF-TOPWCF-BOTWOCF-BOTWHCF-BOT
Left mid Right-0.3
-0.25
-0.2
-0.15
-0.1
-0.05
0
0.05
0.1
0.15
0.2
Deck Over Closour Pour Bay
Tra
nsve
rse
Str
ess
(ksi
)
Number of Girders in Phases=3-4-3
WCF-TOPWOCF-TOPWHCF-TOPWCF-BOTWOCF-BOTWHCF-BOT
Left mid Right-0.3
-0.25
-0.2
-0.15
-0.1
-0.05
0
0.05
0.1
0.15
0.2
Deck Over Closour Pour Bay
Tra
nsvers
e S
tress (
ksi)
Number of Girders in Phases=4-4-4
WCF-TOPWOCF-TOPWHCF-TOPWCF-BOTWOCF-BOTWHCF-BOT
Deck Over Closure Pour Bay Deck Over Closure Pour Bay
Deck Over Closure Pour Bay Deck Over Closure Pour Bay

150
Figure A-62. Transverse stress at closure pour related to different number of girders in phases for SR-589 over Waters Avenue – Cont’d
Left mid Right-0.25
-0.2
-0.15
-0.1
-0.05
0
0.05
0.1
0.15
Deck Over Closour Pour Bay
Tra
nsve
rse
Str
ess
(ksi
)
Number of Girders in Phases=2-5-2
WCF-TOPWOCF-TOPWHCF-TOPWCF-BOTWOCF-BOTWHCF-BOT
Left mid Right-0.3
-0.25
-0.2
-0.15
-0.1
-0.05
0
0.05
0.1
0.15
0.2
Deck Over Closour Pour Bay
Tra
nsvers
e S
tress (
ksi)
Number of Girders in Phases=3-5-3
WCF-TOPWOCF-TOPWHCF-TOPWCF-BOTWOCF-BOTWHCF-BOT
Left mid Right-0.3
-0.25
-0.2
-0.15
-0.1
-0.05
0
0.05
0.1
0.15
0.2
Deck Over Closour Pour Bay
Tra
nsve
rse
Str
ess
(ksi
)
Number of Girders in Phases=4-5-4
WCF-TOPWOCF-TOPWHCF-TOPWCF-BOTWOCF-BOTWHCF-BOT
Deck Over Closure Pour Bay Deck Over Closure Pour Bay
Deck Over Closure Pour Bay
151
A.2.5.3 Transverse Deck Stresses at Middle and Side of Closure Pour vs. Number of Girders in Phases
Figure A-63. Transverse deck stresses at middle and side of closure pour vs. number of girders in phases for bridge SR-589 over Waters Avenue
2-3-2 3-3-3 4-3-4 2-4-2 3-4-3 4-4-4 2-5-2 3-5-3 4-5-40
0.1
0.2
0.3
0.4
0.5
0.6
Number of Girders in Phases I and II
Tra
nsvers
e S
tress (
ksi)
Deck Stress – Bottom – Middle of Closure Bay
WCFWOCFWHCF
2-3-2 3-3-3 4-3-4 2-4-2 3-4-3 4-4-4 2-5-2 3-5-3 4-5-40
0.1
0.2
0.3
0.4
0.5
Number of Girders in Phases I and II
Tra
nsve
rse
Str
ess
(ksi
)
Deck Stress – Top – Side of Closure Bay
WCFWOCFWHCF
2-3-2 3-3-3 4-3-4 2-4-2 3-4-3 4-4-4 2-5-2 3-5-3 4-5-4
-0.5
-0.4
-0.3
-0.2
-0.1
0
Number of Girders in Phases I and II
Tra
nsve
rse
Str
ess
(ksi
)
Deck Stress – Bottom – Side of Closure Bay
WCFWOCFWHCF

152
Figure A-64. Transverse deck stresses at top -middle of closure pour vs. number of girders in phases for bridge SR-589 over Waters Avenue
A.2.6 Parameters Combinations
A.2.6.1 Distribution Factor for All Girders Related to Parameters Combinations
Figure A-65. Distribution factor for girders G1 and G2 related to different parameter combinations for bridge SR-589 over Waters Avenue
2-3-2 3-3-3 4-3-4 2-4-2 3-4-3 4-4-4 2-5-2 3-5-3 4-5-4
-0.5
-0.4
-0.3
-0.2
-0.1
0
Number of Girders in Phases I and II
Tra
nsve
rse
Str
ess
(ksi
)
Deck Stress – Top – Middle of Closure Bay
WCFWOCFWHCF
Original GS-CFS GS-DG GS-DT 0
0.1
0.2
0.3
0.4
0.5
0.6
0.7
0.8
0.9
1
Parameter Combinations
Dis
trib
utio
n F
acto
r
G1
WCFWOCFWHCF
Original GS-CFS GS-DG GS-DT 0
0.1
0.2
0.3
0.4
0.5
0.6
0.7
0.8
0.9
1
Parameter Combinations
Dis
trib
utio
n F
acto
r
G2
WCFWOCFWHCF

153
Figure A-66. Distribution factor for girders G3, G4 and G5 related to different parameter combinations for bridge SR-589 over Waters Avenue
Original GS-CFS GS-DG GS-DT 0
0.1
0.2
0.3
0.4
0.5
0.6
0.7
0.8
0.9
1
Parameter Combinations
Dis
trib
utio
n F
acto
r
G3
WCFWOCFWHCF
Original GS-CFS GS-DG GS-DT 0
0.1
0.2
0.3
0.4
0.5
0.6
0.7
0.8
0.9
1
Parameter Combinations
Dis
trib
utio
n F
acto
r
G4
WCFWOCFWHCF
Original GS-CFS GS-DG GS-DT 0
0.1
0.2
0.3
0.4
0.5
0.6
0.7
0.8
0.9
1
Parameter Combinations
Dis
trib
utio
n F
acto
r
G5
WCFWOCFWHCF

154
A.2.6.2 Transverse Stress at Closure Pour Related to Parameters Combinations
Figure A-67. Transverse stress at closure pour related to different parameter combinations for SR-589 over Waters Avenue
Left mid Right-0.6
-0.5
-0.4
-0.3
-0.2
-0.1
0
0.1
0.2
0.3
0.4
Deck Over Closour Pour Bay
Tran
sver
se S
tress
(ksi
)
GS-CFS
WCF-TOPWOCF-TOPWHCF-TOPWCF-BOTWOCF-BOTWHCF-BOT
Left mid Right-0.6
-0.5
-0.4
-0.3
-0.2
-0.1
0
0.1
0.2
0.3
0.4
Deck Over Closour Pour Bay
Tran
sver
se S
tress
(ksi
)
GS-DG
WCF-TOPWOCF-TOPWHCF-TOPWCF-BOTWOCF-BOTWHCF-BOT
Left mid Right-0.8
-0.6
-0.4
-0.2
0
0.2
0.4
0.6
0.8
Deck Over Closour Pour Bay
Tran
sver
se S
tress
(ksi
)
GS-DT
WCF-TOPWOCF-TOPWHCF-TOPWCF-BOTWOCF-BOTWHCF-BOT
Left mid Right-0.5
-0.4
-0.3
-0.2
-0.1
0
0.1
0.2
0.3
Deck Over Closour Pour Bay
Tran
sver
se S
tress
(ksi
)
GS-NG
WCF-TOPWOCF-TOPWHCF-TOPWCF-BOTWOCF-BOTWHCF-BOT
Deck Over Closure Pour Bay Deck Over Closure Pour Bay
Deck Over Closure Pour Bay Deck Over Closure Pour Bay
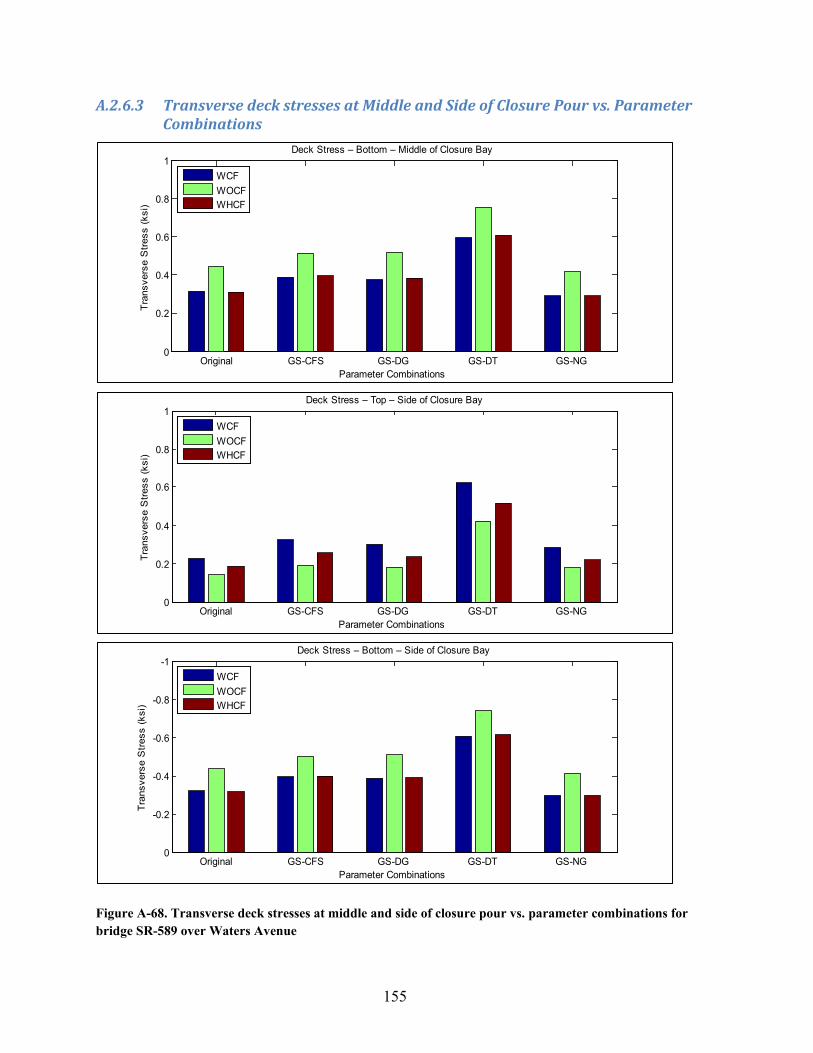
155
A.2.6.3 Transverse deck stresses at Middle and Side of Closure Pour vs. Parameter Combinations
Figure A-68. Transverse deck stresses at middle and side of closure pour vs. parameter combinations for bridge SR-589 over Waters Avenue
Original GS-CFS GS-DG GS-DT GS-NG 0
0.2
0.4
0.6
0.8
1
Parameter Combinations
Tran
sver
se S
tress
(ksi
) Deck Stress – Bottom – Middle of Closure Bay
WCFWOCFWHCF
Original GS-CFS GS-DG GS-DT GS-NG 0
0.2
0.4
0.6
0.8
1
Parameter Combinations
Tran
sver
se S
tress
(ksi
)
Deck Stress – Top – Side of Closure Bay
WCFWOCFWHCF
Original GS-CFS GS-DG GS-DT GS-NG
-1
-0.8
-0.6
-0.4
-0.2
0
Parameter Combinations
Tran
sver
se S
tress
(ksi
)
Deck Stress – Bottom – Side of Closure Bay
WCFWOCFWHCF
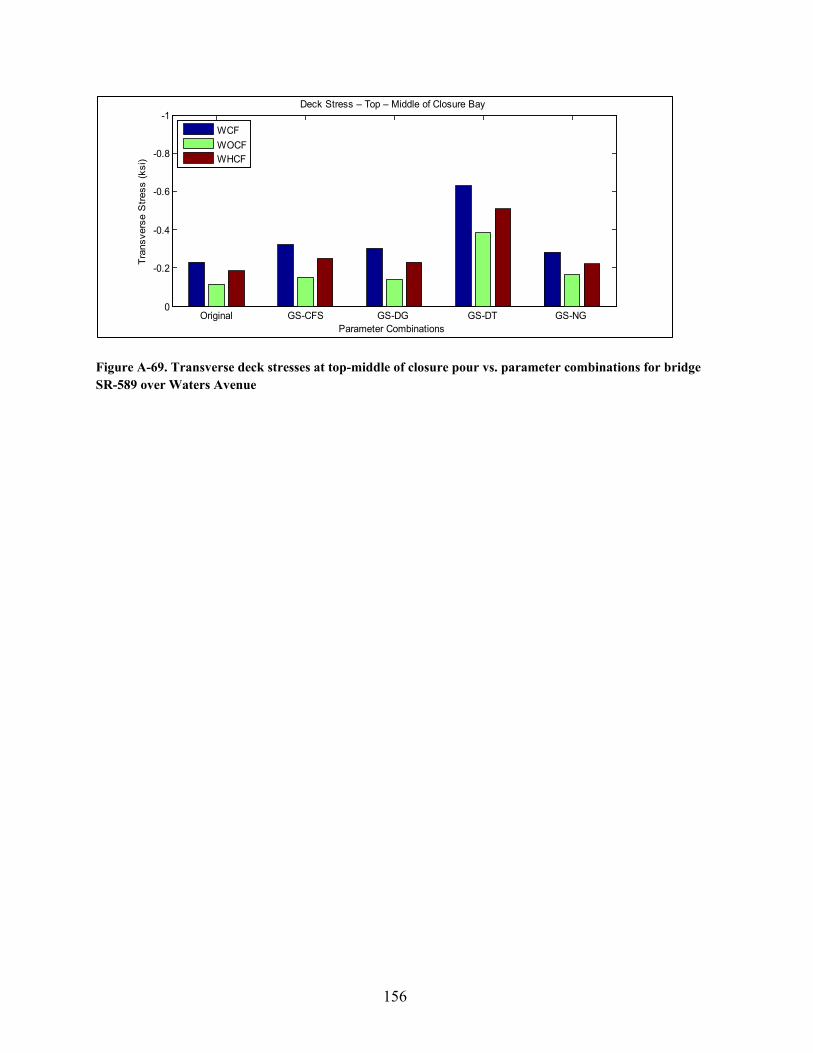
156
Figure A-69. Transverse deck stresses at top-middle of closure pour vs. parameter combinations for bridge SR-589 over Waters Avenue
Original GS-CFS GS-DG GS-DT GS-NG
-1
-0.8
-0.6
-0.4
-0.2
0
Parameter Combinations
Tran
sver
se S
tress
(ksi
)
Deck Stress – Top – Middle of Closure Bay
WCFWOCFWHCF