bdv30-977-06 final report
TRANSCRIPT
1
FINAL REPORT For the Florida Department of Transportation
Evaluation of Florida Asphalt Mixes for Crack Resistance
Properties using the Laboratory Overlay Test Procedure
FDOT Research Contract No: BDV30 TWO 977-06
FSU Research Project No: OMNI 034114
by
Researcher: Biqing Sheng Principal Investigator: Wei-Chou Virgil Ping, P.E.
Department of Civil & Environmental Engineering Florida State University Tallahassee, FL 32310
January 2016

2
DISCLAIMER
The opinions, findings and conclusions expressed in this publication are those of the
authors and not necessarily those of the State of Florida Department of Transportation or the
U.S. Department of Transportation. This report is prepared in cooperation with the State of
Florida Department of Transportation and the U.S. Department of Transportation.
3
METRIC CONVERSIONS
inches = 25.4 millimeters
feet = 0.305 meters
square inches = 645.1 millimeters squared
square feet = 0.093 meters squared
cubic feet = 0.028 meter cubed
pounds = 0.454 kilograms
poundforce = 4.45 newtons
poundforce per square inch = 6.89 kilopascals
pound per cubic inch = 16.02 kilograms per meters cubed
1 psi = 6.89475 kPa
1/psi = 0.145×10⁶/GPa
4
Technical Report Documentation Page 1. Report No. FDOT BDV30 TWO 977-06
2. Government Accession No.
3. Recipient's Catalog No.
4. Title and Subtitle Evaluation of Florida Asphalt Mixes for Crack Resistance Properties using the Laboratory Overlay Test Procedure
5. Report Date January 29, 2016
6. Performing Organization Code
7. Author(s) Biqing Sheng and W. V. Ping
8. Performing Organization Report No. FSU No. OMNI 034114
9. Performing Organization Name and Address Department of Civil & Environmental Engineering Florida State University 2525 Pottsdamer Street Tallahassee, Florida 32310-6046
10. Work Unit No. (TRAIS)
11. Contract or Grant No. FDOT BDV30 TWO 977-06
12. Sponsoring Agency Name and Address Florida Department of Transportation Research Center 605 Suwannee Street Tallahassee, Florida 32399-0450
13. Type of Report and Period Covered Final Report January 2014 – January 2016
14. Sponsoring Agency Code
15. Supplementary Notes
16. Abstract
The primary objective of this research study is to evaluate the applicability of using the overlay test to characterize common asphalt mixtures for crack resistance in flexible pavement design in Florida. Cracking performance of common Florida asphalt mixtures were evaluated using laboratory Overlay Test (OT) procedure. Nine standard mixes for traffic level C & E, which included SP-12.5, SP-9.5, and SP-4.75 mix designs, were selected to conduct the overlay test. The mixtures were prepared using both PG 67-22 virgin asphalt binder and PG 76-22 polymer modified asphalt (PMA) binder. The effects of material characteristics, polymer modifier, and reclaimed asphalt pavement (RAP) on the crack resistance of Florida asphalt mixtures were evaluated. The test results had a good agreement on the three replicate samples. The coefficients of variation (COV) were less than 20% for all types of mixtures. It was found that SP-9.5 mixtures had the best cracking performance compared to SP-12.5 and SP-4.75 mixtures when RAP was included. Considerable effects were found on the asphalt binder and RAP. Crack resistance of asphalt mixtures was significantly improved if PMA binder was used. However, the crack resistance was decreased when 20% RAP was included in the mix designs. A simplified fracture mechanics analysis was conducted to obtain the fracture properties from Paris’ Law. Crack indices, which can be easily obtained from the OT test results, are introduced and correlated to fracture properties.
17. Key Word Overlay Test, Asphalt Mixture, Cracking, Asphalt Binder, Reclaimed Asphalt Pavement, Fracture Mechanics, Crack Index
18. Distribution Statement
19. Security Classif. (of this report) Unclassified
20. Security Classif. (of this page) Unclassified
21. No. of Pages 176
22. Price
Form DOT F 1700.7 (8-72) Reproduction of completed page authorized

5
ACKNOWLEDGEMENTS
Funding for this research was provided by the Florida Department of Transportation
(FDOT) and Federal Highway Administration (FHWA) through the FDOT Research Center.
Darryll Dockstader, Ph.D., Director of the Research Center, and his staff provided financial and
contractual support to the research project. Gregory A. Sholar, P.E., State Bituminous Engineer,
was Project Manager of the research study. Sungho Kim, Ph.D., P.E., Bituminous Research
Engineer, acted as a former Project Manager. The Project Research Panel consisted of the
following members: James Musselman, P.E., Gregory Sholar, P.E., Jamie Greene, P.E., and
Tanya Nash. In addition, engineers and staff at the Bituminous Materials Section provided
significant support to this research study. Their strong support and contributions to the research
have been critical to the success of this study.
Pavement Analytics LLC (PA), working as a subcontractor for the Florida State University
(FSU), provided expert advisory review and assisted in every phase of the research. Bruce
Dietrich, P.E., oversaw the experimental design and assisted in the development of the laboratory
overlay test plan. Denise Hoyt provided support in the purchase of the overlay tester and assisted
in the literature review phase. A draft overlay test procedure was also prepared by PA personnel.
The laboratory experimental program was carried out by the FSU research team, including
significant contributions by Biqing Sheng and Ed Mallory. The overlay specimen cutting fixture
was designed and fabricated primarily by Ed Mallory with assistance from the FSU research
team.
6
EXECUTIVE SUMMARY
Cracking is a primary distress on flexible pavements in Florida. With the increased use of
reclaimed asphalt pavement (RAP) in mixtures, known issues with the Asphalt Rubber
Membrane Inter-layers (ARMI) and a push for more in-place recycling and recycled asphalt
shingles (RAS) materials, there is a critical need to be able to quickly and effectively evaluate
the crack resistance of proposed asphalt mixtures. The traditional method used to characterize the
asphalt mixtures for flexible pavement design in Florida is the Indirect Diametral Test (IDT). On
the other hand, the overlay test (OT), which was developed by the Texas Transportation Institute
(TTI), can also be adopted as an effective way to evaluate the crack resistance of an asphalt
mixture.
The primary objective of this research study is to evaluate the applicability of using the
overlay test to characterize common asphalt mixtures for crack resistance in flexible pavement
design in Florida. The overlay test procedure, as currently available, will be revisited and
evaluated to see if it is appropriate for Florida mixtures. An overlay test procedure suitable for
application with Florida asphalt mixtures will be developed to evaluate the crack resistance of
asphalt mixtures with various mix designs. The goals for these experiments are to evaluate the
effects of material characteristics, polymer modifier, and RAP content on the crack resistance of
Florida asphalt mixtures.
To achieve these objectives and goals, cracking performance of common Florida asphalt
mixtures were evaluated using laboratory OT procedure. Nine standard mix designs for traffic
level C & E, which included SP-12.5, SP-9.5, and SP-4.75 mix designs, were selected to conduct
the OT. Granites, which were from different sources, were used as the aggregate in the mixtures.
In addition, the mixtures were prepared using both virgin asphalt binder (PG 67-22) and
7
polymer-modified asphalt (PMA) binder (PG 76-22). Additionally, a lower maximum opening
displacement, 0.0125 inches, was tried out on one type of mixture (SP-12.5 with 20% RAP) to
determine the significance of displacement rate on the crack resistance of the Florida asphalt
mixture. Three replicate samples were tested for each type of mixture.
The applicability of overlay test on Florida asphalt mixtures was verified. The test results
had good agreement among the three replicate samples. The coefficients of variation (COV)
were less than 20%. It was found that obtaining granite from different aggregate sources did not
have a strong influence on the test results, while the nominal maximum aggregate size did have a
significant effect. SP-9.5 mixtures had the best cracking performance compared to SP-12.5 and
SP-4.75 mixtures for the mixes with 20% RAP. Considerable effects were found on the asphalt
binder type and RAP content. Crack resistance of Florida asphalt mixtures was significantly
improved if PG 76-22 (PMA) binder was used instead of PG 67-22 virgin asphalt binder.
However, the crack resistance was reduced when 20% RAP content was included in the mix
designs.
Fracture mechanics analysis was conducted on the overlay test results based on Paris’
Law. A simplified analysis procedure was developed to obtain the fracture properties of
mixtures. In addition to fracture properties A and n, crack indices A’ and n’, which can be easily
obtained from the overlay test load reduction curve, were introduced to evaluate the crack
resistance of asphalt mixtures. The correlation relationships between the crack indices and the
fracture properties were developed. It was found that the asphalt mixtures with greater n’ or n
values had better crack resistance than the asphalt mixtures with lower n’ or n. It is
recommended to use the crack indices to evaluate the crack resistance of asphalt mixtures to
reduce the discrepancies among different analysis procedures in OT.

8
The research program may be expanded to evaluate the other types of Florida asphalt
mixtures. Asphalt mixture with other types of aggregates, such as limestone, can be evaluated
using the OT procedure. Mixtures with different aggregate sizes, asphalt binder types, or RAP
contents can also be evaluated. A database can be built to record the test parameters, test results,
and fracture properties for different types of mix designs. The fracture properties obtained from
the OT-based analysis procedure can be compared to the results from the other tests. Correlation
relationships can be developed to compare these tests from the database, which can be further
used to evaluate the crack resistance of other types of mixtures. Then, the laboratory test results
can be compared to the field observations to better predict the cracking performance of asphalt
mixtures in the field. Some criteria based on the field-calibrated laboratory test results can be
adopted into the design guide to evaluate the cracking performance of the asphalt mixtures.
9
TABLE OF CONTENTS
LIST OF TABLES ......................................................................................................................... xi LIST OF FIGURES ...................................................................................................................... xii LIST OF ABBREVIATIONS ...................................................................................................... xvi 1. INTRODUCTION ......................................................................................................................1 1.1 Background ..........................................................................................................................1 1.2 Objective of Study ...............................................................................................................2 1.3 Scope of Work .....................................................................................................................2 1.4 Process of Project .................................................................................................................3 1.5 Organization of Report ........................................................................................................4
2. LITERATURE REVIEW............................................................................................................5 2.1 Introduction ..........................................................................................................................5 2.2 Mechanism of Reflective Cracking .....................................................................................5 2.3 Cracking Models ..................................................................................................................7 2.4 Crack Resistance Evaluation..............................................................................................12
2.5 Overlay Test .......................................................................................................................17 3. LABORATORY EXPERIMENTAL PROGRAM .................................................................28 3.1 General ...............................................................................................................................28 3.2 Preliminary Experimental Study ........................................................................................28
3.3 Laboratory Experimental Study .........................................................................................37 4. PRESENTATION OF LABORATORY TEST RESULTS ...................................................43 4.1 Specimen Measurements ...................................................................................................43 4.2 Overlay Test Results ..........................................................................................................46 5. ANALYSIS OF LABORATORY TEST RESULTS .............................................................60
10
5.1 General ...............................................................................................................................60 5.2 Statistical ANOVA Analysis .............................................................................................60 5.3 Evaluation of Factors on Test Results ...............................................................................62
5.4 Fracture Mechanics Analysis .............................................................................................68 6. SUMMARY AND CONCLUSIONS .....................................................................................78 6.1 Summary ............................................................................................................................78 6.2 Findings and Conclusions ..................................................................................................78
6.3 Recommendations ..............................................................................................................79
REFERENCES ..............................................................................................................................81 APPENDICES ...............................................................................................................................87 A. FLORIDA METHOD OF TEST FOR OVERLAY TEST .......................................................87 B. DETAILS OF LABORATORY EXPERIMENTS ...................................................................95 C. DETAILS OF LABORATORY EXPERIMENTAL RESULTS ............................................111 D. ASPHALT MIX DESIGN ......................................................................................................134
11
LIST OF TABLES
Table 1.1. Proposed Test Plan for Laboratory Evaluation using Overlay Tester ............................4 Table 2.1. Crack Resistance Evaluation Test Protocols ................................................................15 Table 3.1. Mix Designs for Preliminary Study ..............................................................................29 Table 3.2. Percentage by Weight of Total Aggregate Passing Sieves ...........................................29 Table 3.3. Test Results of the Second Batch Specimens ...............................................................35 Table 3.4. Number of Samples in the Proposed Test Plan ............................................................37 Table 3.5. Superpave Mix Designs ................................................................................................41 Table 3.6. Percentage by Weight of Total Aggregate Passing Sieves ...........................................42 Table 4.1. Average Width and Thickness of Tested Specimens ....................................................43 Table 4.2. Volumetric Properties of Test Specimens ....................................................................44 Table 4.3. Summary of OT Results on Number of Cycles to Failure ............................................48 Table 4.4. Average Number of Cycles to Failure of Mixtures for the Test Plan ...........................49 Table 5.1. ANOVA Analysis of Factors on OT Number of Cycles to Failure ..............................61 Table 5.2. OT Number of Cycles to Failure for SP-12.5 Mix Designs .........................................61 Table 5.3. OT Number of Cycles to Failure for Mixtures with GA185 and PG 76-22 .................62 Table 5.4. OT Number of Cycles to Failure for Mixtures with GA553 and 20% RAP ................62 Table 5.5. Fracture Properties of the Asphalt Mixtures in the OT ................................................77 Table C-1. Width and Thickness Measurements of Test Specimens ...........................................111 Table C-2. OT Temperature for Each Specimen .........................................................................116
12
LIST OF FIGURES
Figure 1.1. Reflective Cracking of Asphalt Concrete Pavement .....................................................1 Figure 2.1. Mechanism of Reflective Cracking ...............................................................................6 Figure 2.2. Overlay M-E Design Flow Chart ..................................................................................8 Figure 2.3. Illustration of Cohesive Zone Model .............................................................................9 Figure 2.4. Illustration of Stress Intensity Factor ..........................................................................10 Figure 2.5. 2-D Edge Crack in a Finite Plate under Uniaxial Stress .............................................11 Figure 2.6. Indirect Diametral Test ................................................................................................14 Figure 2.7. Schematic of Overlay Tester Apparatus ......................................................................18 Figure 2.8. Illustration of Tensile Stress Distribution of AC under 0.015 inch Opening ..............18 Figure 2.9. Typical Overlay Tester Result .....................................................................................19 Figure 2.10. OT Interpretation of the Results ................................................................................19 Figure 2.11. Effect of Opening Displacement on OT Cycles ........................................................25 Figure 2.12. Effect of Opening Displacement on OT Cycles for Three Types of Mixture ...........26 Figure 3.1. 0.45 Power Gradation Curve for SP11-9525B ............................................................30 Figure 3.2. 0.45 Power Gradation Curve for SPM 12-10934A .....................................................30 Figure 3.3. 0.45 Power Gradation Curve for SPM 12-10131A .....................................................30 Figure 3.4. Diamond Product® CC800M Single Blade Saw with Specimen Cutting Jig .............31 Figure 3.5. Overlay Tester Setup plate and Specimen Plates ........................................................32 Figure 3.6. Samples on the Specimen Plates and the Setup Plate after Curing of Epoxy .............33 Figure 3.7. Troxler Model 5950 Overlay Tester ............................................................................34 Figure 3.8. OverlayTest Software Screenshot ...............................................................................34 Figure 3.9. Load versus Number of Cycles Curves of SPM 12-10131A Specimens ....................35
13
Figure 3.10. Specimen Cracking after the OT ...............................................................................36 Figure 3.11. 0.45 Power Gradation Curve for Mix Design SPM 13-11076A ...............................38 Figure 3.12. Aluminum Cutting Table ...........................................................................................39 Figure 3.13. Threaded Rod for Displacement Control ..................................................................39 Figure 4.1. Load Reduction Curve for Each Type of Mix Design ................................................50 Figure 4.2. Representative Specimen after Cracking.....................................................................58 Figure 4.3. Broken Parts of Specimen after Failure.......................................................................58 Figure 4.4. Load Reduction Curve for Supplemental Test ............................................................59 Figure 5.1. OT Results on Different Type of Granite ....................................................................63 Figure 5.2. OT Results on SP-12.5 and SP-9.5 Mix Designs with GA185 and Pg 76-22 .............63 Figure 5.3. OT Results on SP-12.5 and SP-4.75 Mix Designs with GA553 and RAP ..................64 Figure 5.4. OT Results on SP-9.5 and SP-4.75 Mix Designs with PG 76-22 and RAP ................65 Figure 5.5. OT Results of Mixtures without RAP for Both Binders .............................................65 Figure 5.6. OT Results of Mixtures with RAP for Both Binders ..................................................66 Figure 5.7. RAP Effect on OT Results of Mixtures with PG 67-22 ..............................................67 Figure 5.8. RAP Effect on OT Results of Mixtures with PG 76-22 ..............................................67 Figure 5.9. Effect of Displacement Rate on OT Results on SPM 12-10895A ..............................68 Figure 5.10. Stress Intensity Factor Calculation around Crack Tip ...............................................69 Figure 5.11. Flow Chart of OT Analysis Procedure ......................................................................72 Figure 5.12. Relationships between Crack Index or Fracture Property and OT Results ...............73 Figure 5.13. Framework to Correlate OT and IDT ........................................................................76 Figure B-1. First Side Cutting ........................................................................................................95 Figure B-2. Second Side Cutting ...................................................................................................95
14
Figure B-3. First Height Cutting / Top Cutting .............................................................................95 Figure B-4. Second Height Cutting / Bottom Cutting ...................................................................97 Figure B-5. Cutting Template ........................................................................................................98 Figure B-6. Specimen Alignment - 1 .............................................................................................98 Figure B-7. Specimen Alignment – 2 ............................................................................................99 Figure B-8. Cutting Mark Aligned to the Edge of Blade ...............................................................99 Figure B-9. First Side Cutting ......................................................................................................100 Figure B-10. Second Side Cutting ...............................................................................................100 Figure B-11. Specimen after Side Cuttings .................................................................................101 Figure B-12. Cutting Marks for Thickness Cutting .....................................................................101 Figure B-13. Specimen Alignment for Thickness Cutting ..........................................................102 Figure B-14. First Thickness Cutting...........................................................................................102 Figure B-15. Second Side Cutting ...............................................................................................103 Figure B-16. Specimen after Cutting ...........................................................................................103 Figure B-17. 0.45 Power Gradation Curves for Mix Designs .....................................................106 Figure C-1. Crack on SPM 13-11076A (SP-12.5, No RAP) Specimens after OT ......................117 Figure C-2. Crack on SPM 12-10895A (SP-12.5, 20%RAP) Specimens after OT .....................118 Figure C-3. Crack on SPM 13-11035A (SP-12.5, No RAP) Specimens after OT ......................119 Figure C-4. Crack on SPM 14-12576A (SP-12.5, 20%RAP) Specimens after OT .....................120 Figure C-5. Crack on SPM 14-12199A (SP-12.5, No RAP) Specimens after OT ......................121 Figure C-6. Crack on SP 14-12171B (SP-12.5, 20%RAP) Specimens after OT.........................122 Figure C-7. Crack on SP-9.5 Specimens after OT .......................................................................123 Figure C-8. Crack on LD 12-2653A (SP-4.75, 20%RAP) Specimens after OT .........................124

15
Figure C-9. Crack on SPM 12-10895A Specimen after OT with 0.0125” OD ...........................125 Figure C-10. Pictures of LD 12-2653A Mix with PG 67-22 after OT – Sample 1 .....................126 Figure C-11. Pictures of LD 12-2653A Mix with PG 67-22 after OT – Sample 2 .....................128 Figure C-12. Pictures of LD 12-2653A Mix with PG 67-22 after OT – Sample 3 .....................130 Figure C-13. Pictures of LD 12-2653A Mix with PG 76-22 after OT ........................................132

16
LIST OF ABBREVIATIONS
AASHTO American Association of State Highway and Transportation Officials AC Asphalt Concrete ALF Accelerated Loading Facility ARMI Asphalt Rubber Membrane Interlayer COV Coefficients of Variation CZM Cohesive Zone Model DSTT Disk-Shaped Compaction Tension Test DT Direct Tension Test FDOT Florida Department of Transportation FE Finite Element FHWA Federal Highway Administration Gmb Bulk Specific Gravity GTR Ground Tire Rubber HMA Hot Mix Asphalt IDT Indirect Diametral Tensile Test JMF Job Mix Formula MEPDG Mechanistic-Empirical Pavement Design Guide M-IDT Monotonic Indirect Diametral test MTS Material Testing System NCAT National Center for Asphalt Technology NMAS Nominal Maximum Aggregate Size OT Overlay Test
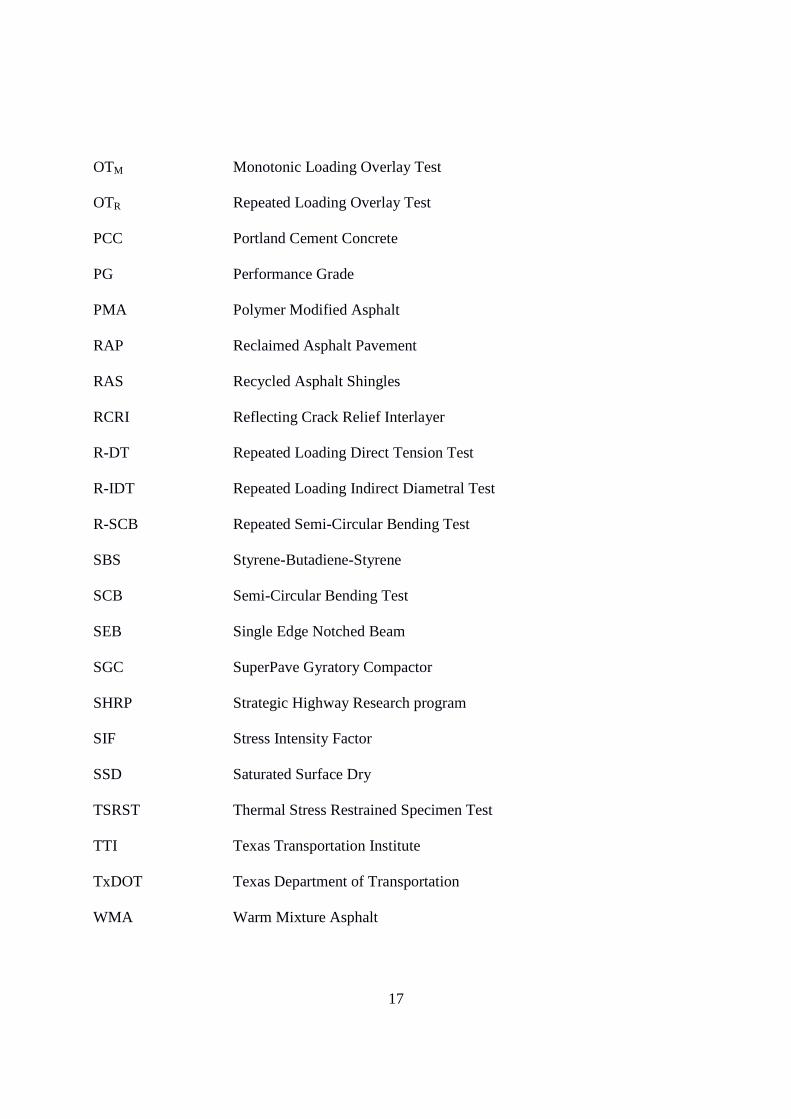
17
OTM Monotonic Loading Overlay Test OTR Repeated Loading Overlay Test PCC Portland Cement Concrete PG Performance Grade PMA Polymer Modified Asphalt RAP Reclaimed Asphalt Pavement RAS Recycled Asphalt Shingles RCRI Reflecting Crack Relief Interlayer R-DT Repeated Loading Direct Tension Test R-IDT Repeated Loading Indirect Diametral Test R-SCB Repeated Semi-Circular Bending Test SBS Styrene-Butadiene-Styrene SCB Semi-Circular Bending Test SEB Single Edge Notched Beam SGC SuperPave Gyratory Compactor SHRP Strategic Highway Research program SIF Stress Intensity Factor SSD Saturated Surface Dry TSRST Thermal Stress Restrained Specimen Test TTI Texas Transportation Institute TxDOT Texas Department of Transportation WMA Warm Mixture Asphalt
The quality of flexible pavements on Florida’s State Highway System has significantly
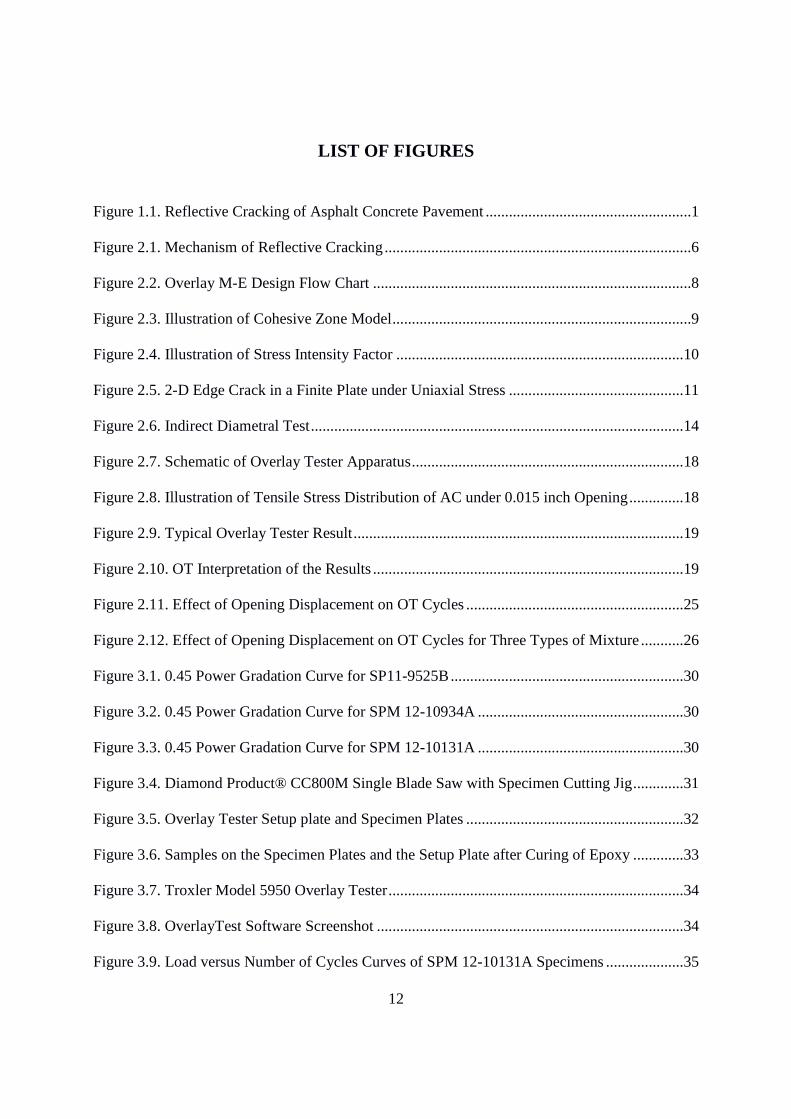
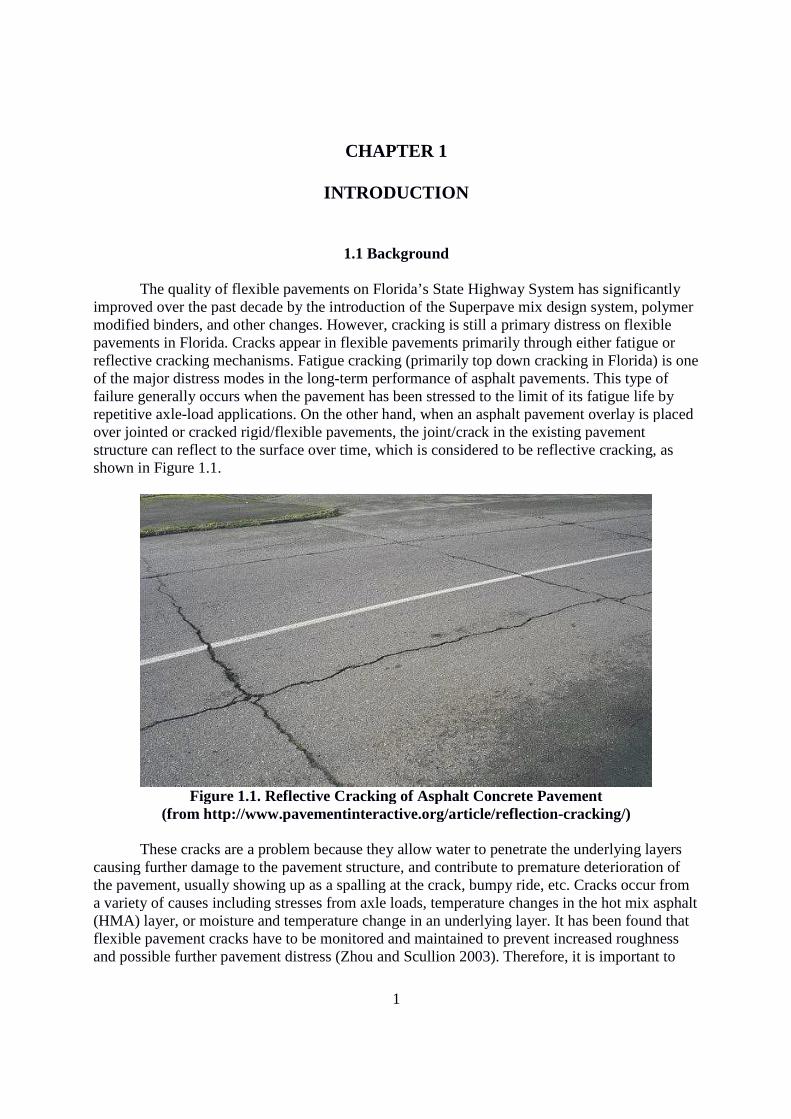
improved over the past decade by the introduction of the Superpave mix design system, polymer modified binders, and other changes. However, cracking is still a primary dipavements in Florida. Cracks appear in flexible pavements primarily through either fatigue or reflective cracking mechanisms. Fatigue cracking (primarily top down cracking in Florida) is one of the major distress modes in the longfailure generally occurs when the pavement has been stressed to the limit of its fatigue life by repetitive axle-load applications. On the other hand, when an asphalt pavement overlay is placed over jointed or cracked rigid/flexible pavements, the joint/crack in the existing pavement structure can reflect to the surface over time, which is considered to be reflective cracking, as shown in Figure 1.1.
Figure 1.1. Reflective Cracking of Asphalt Concrete Paveme(from http://www.pavementinteractive.org/article/reflection
These cracks are a problem because they allow water to penetrate the underlying layers
causing further damage to the pavement structure, and contribute to premature deterioration ofthe pavement, usually showing up as a spalling at the crack, bumpy ride, etc. Cracks occur from a variety of causes including stresses from axle loads, temperature changes in the hot mix asphalt (HMA) layer, or moisture and temperature change in an underlflexible pavement cracks have to be monitored and maintained to prevent increased roughness and possible further pavement distress (Zhou and Scullion 2003). Therefore, it is important to
1
CHAPTER 1
INTRODUCTION
1.1 Background
The quality of flexible pavements on Florida’s State Highway System has significantly improved over the past decade by the introduction of the Superpave mix design system, polymer modified binders, and other changes. However, cracking is still a primary dipavements in Florida. Cracks appear in flexible pavements primarily through either fatigue or reflective cracking mechanisms. Fatigue cracking (primarily top down cracking in Florida) is one of the major distress modes in the long-term performance of asphalt pavements. This type of failure generally occurs when the pavement has been stressed to the limit of its fatigue life by
load applications. On the other hand, when an asphalt pavement overlay is placed cracked rigid/flexible pavements, the joint/crack in the existing pavement
structure can reflect to the surface over time, which is considered to be reflective cracking, as
Figure 1.1. Reflective Cracking of Asphalt Concrete Paveme(from http://www.pavementinteractive.org/article/reflection
These cracks are a problem because they allow water to penetrate the underlying layers causing further damage to the pavement structure, and contribute to premature deterioration ofthe pavement, usually showing up as a spalling at the crack, bumpy ride, etc. Cracks occur from a variety of causes including stresses from axle loads, temperature changes in the hot mix asphalt (HMA) layer, or moisture and temperature change in an underlying layer. It has been found that flexible pavement cracks have to be monitored and maintained to prevent increased roughness and possible further pavement distress (Zhou and Scullion 2003). Therefore, it is important to
The quality of flexible pavements on Florida’s State Highway System has significantly improved over the past decade by the introduction of the Superpave mix design system, polymer modified binders, and other changes. However, cracking is still a primary distress on flexible pavements in Florida. Cracks appear in flexible pavements primarily through either fatigue or reflective cracking mechanisms. Fatigue cracking (primarily top down cracking in Florida) is one
erformance of asphalt pavements. This type of failure generally occurs when the pavement has been stressed to the limit of its fatigue life by
load applications. On the other hand, when an asphalt pavement overlay is placed cracked rigid/flexible pavements, the joint/crack in the existing pavement
structure can reflect to the surface over time, which is considered to be reflective cracking, as
Figure 1.1. Reflective Cracking of Asphalt Concrete Pavement
(from http://www.pavementinteractive.org/article/reflection-cracking/)
These cracks are a problem because they allow water to penetrate the underlying layers causing further damage to the pavement structure, and contribute to premature deterioration of the pavement, usually showing up as a spalling at the crack, bumpy ride, etc. Cracks occur from a variety of causes including stresses from axle loads, temperature changes in the hot mix asphalt
ying layer. It has been found that flexible pavement cracks have to be monitored and maintained to prevent increased roughness and possible further pavement distress (Zhou and Scullion 2003). Therefore, it is important to
2
accurately identify the type of cracking which a pavement exhibits in order to accurately assess the causes for the cracking and subsequently identify the proper repair techniques. To evaluate the cracking performance of flexible pavements, it is important to evaluate the crack resistance of asphalt mixtures. With the increased use of reclaimed asphalt pavement (RAP) in mixtures, known issues with the Asphalt Rubber Membrane Inter-layers (ARMI) and a push for more in-place recycling and recycled asphalt shingles (RAS) materials, there is a critical need to be able to quickly and effectively evaluate the crack resistance of proposed asphalt mixtures.
Crack resistance is an important parameter to be considered, because to perform well in
the field, asphalt mixes must have a good balance of both rut and crack resistance properties. The traditional method used to characterize the asphalt mixtures for flexible pavement design in Florida is the Indirect Diametral Test (IDT). The IDT method has been shown to be an expedient and reliable way of obtaining mixture properties. However, complicated data processing and skilled technicians are required for the test. Another effective way to evaluate the crack resistance of asphalt mixtures is the overlay test (OT), which was developed by the Texas Transportation Institute (TTI). The OT has also gained significant popularity with a number of states as a method to evaluate the cracking potential of asphalt mixtures. The ability of the overlay test to predict cracking has been verified by studies using the Federal Highway Administration (FHWA) Accelerated Loading Facility as well as various field evaluations (Zhou et al. 2007). To implement the OT into flexible pavement design in Florida, it is necessary to evaluate the applicability of the OT on the Florida asphalt mixtures. A comparison study should be conducted in the future to correlate the Indirect Diametral Test results and the OT results for the Florida asphalt mixtures.
1.2 Objective of Study
The primary objective of this research study is to evaluate the applicability of using the overlay test to characterize common asphalt mixtures for crack resistance in flexible pavement design in Florida. The OT procedure, as currently available, will be revisited and evaluated to see if it is appropriate for Florida mixtures. A modified overlay test procedure suitable for application in Florida asphalt mixtures will be developed. Different types of asphalt mixture which are commonly used in Florida will be tested using the overlay tester. The cracking performance of Florida asphalt mixtures using the OT will be identified and evaluated using fracture mechanics analysis. The effects of material characteristics, polymer modifier, and RAP on the crack resistance of Florida asphalt mixtures will also be evaluated based on the comparative study.
1.3 Scope of Work
To achieve these objectives, a series of asphalt mix designs were selected for testing. An experimental program was developed to measure the fracture properties of asphalt mixtures in the laboratory using the OT procedure. To reduce the variability within the test, one type of aggregate, granite, was selected for the asphalt mixtures, since granite is the most commonly used aggregate in the state highway system in Florida. The majority of testing was conducted on
3
Superpave asphalt mixtures with 12.5 mm (SP-12.5) and 9.5 mm (SP-9.5) nominal maximum aggregate sizes (NMAS). In addition to the SP-9.5 and SP-12.5 mixtures, the newly introduced SP-4.75 mixture was also evaluated as a crack relief layer. Two types of asphalt binders, PG 67-22 and PG 76-22 Polymer Modified Asphalt (PMA), were evaluated to find the effect of polymer modifier. To find the effect of RAP material on the crack resistance of asphalt mixtures, the virgin asphalt mixtures were compared to the asphalt mixtures with 20% RAP. Due to the limitations of this research study, the asphalt mixtures were only evaluated using the overlay test procedure. The experimental program with IDT may be accomplished in the future.
Fracture mechanics analysis will then be conducted on the overlay test results for the
tested asphalt mixtures. An OT-based analysis procedure will be developed to calculate the fracture properties for each type of mixture. The crack resistance of each type of mixture can then be characterized by the fracture properties.
1.4 Process of Project
This research study was undertaken to evaluate typical FDOT asphalt mixtures for crack resistance using the overlay test procedure. A comprehensive literature review (Task 1) was conducted on the evaluation of crack resistance of asphalt mixtures. At the first, the TxDOT standard OT test Tex-248-F was recommended for testing Florida asphalt mixtures. Subsequently, the TxDOT OT procedure was modified to better suit Florida asphalt mixtures. Some Florida test methods on asphalt concrete mixing and compaction, maximum theoretical specific gravity measurement, air void measurement, and sample preparations were used in conjunction with the modified test procedure. A preliminary experimental study (Task 2) was then carried out to evaluate several Florida asphalt mixtures using the overlay test in 2014.
Based on the preliminary study, a test plan was developed, shown in Table 1.1, to
evaluate the crack resistance of common Florida asphalt mixtures. The number of mix designs to be evaluated is indicated in the table. The test plan was subsequently approved in a meeting held on July 31, 2014, at the FDOT Central Office in Tallahassee. The standard 0.025-inch opening width, which is approximately equal to the displacement experienced by Portland Cement Concrete pavements undergoing 30ºF changes in pavement temperature, was used in the OT tests throughout the laboratory evaluation phase. In addition, a lower maximum opening displacement, 0.0125-inch, was tried out on one type of mixture (SP-12.5 with 20% RAP) to determine the significance of displacement rate on the cracking performance of Florida asphalt mixture. A total of 51 overlay specimens were tested for the Task 3 laboratory evaluation phase of the project. A Task 3 Deliverable report summarizing the laboratory OT test results with preliminary analyses was submitted to the FDOT dated June 14, 2015.
Subsequently, cracking performance of the typical Florida asphalt mixtures was further
evaluated in the Task 4 analysis phase. Statistical analysis of the laboratory test results was performed to study the significance of test factors on test results. The effects of material characteristics, polymer modifier, RAP content, and displacement rate on the crack resistance of Florida asphalt mixtures were further evaluated through comparative study. Fracture mechanics

4
analysis was also conducted to evaluate the fracture properties of tested asphalt mixture based on the OT results.
Table 1.1. Proposed Test Plan for Laboratory Evaluation using Overlay Tester
Asphalt Mixture Binder PG 67-22 PG 76-22 (PMA)
RAP Content 0% 20% 0% 20%
12.5 mm
Granite 3 3+1* 3 3
NMAS 9.5 mm
Granite 0 0 1 1 4.75
mm Granite 0 1 0 1
*One type of mixture was tested with 0.0125-inch opening displacement (OD).
1.5 Organization of Report
This report summarizes the study to evaluate the crack resistance of Florida asphalt mixtures using laboratory overlay test procedure. The report is organized as follows: Chapter 1 introduces the background, problem statement, objective, and scope of study. Chapter 2 gives a comprehensive literature review on the evaluation of reflective cracking of asphalt mixtures. Mechanisms of reflective cracking, crack models, and crack resistance evaluation were reviewed based on research studies performed by other researchers. Chapter 3 introduces the development of the laboratory experimental program. Detailed testing methods and procedures are specified. Chapter 4 presents the results from OT for three sources of granite aggregate, three levels of gradation, two asphalt binders, and 0% or 20% RAP content. Chapter 5 analyzes the OT results in detail to evaluate the effects of aggregate source, gradation, asphalt binder, and RAP content on crack resistance of asphalt mixtures. Fracture mechanics analysis procedures are presented. Chapter 6 summarizes the study. Conclusions are presented.

5
CHAPTER 2
LITERATURE REVIEW
2.1 Introduction
A comprehensive literature review was conducted on the evaluation of reflective cracking of asphalt mixtures. Mechanisms of reflective cracking, crack models, and crack resistance evaluation was reviewed based on research studies performed by other researchers. The ability of OT for characterizing the cracking performance of asphalt mixtures was methodically reviewed. Available information, such as test procedures, results, and findings, were collected and examined. The variability and effects of different factors on the OT, such as test setup, opening width, sample thickness, asphalt binder, and RAP content, were also evaluated. The following sections provide an explanation of the basic mechanisms and approaches used to evaluate the cracking performance of asphalt mixtures.
2.2 Mechanism of Reflective Cracking
Reflective cracking occurs due to breaks or cracks in underlying layers because of movement at the original crack. At this location, stresses concentrate and the crack propagates and reflects to the pavement surface over time. The common sources of reflective cracking could be joints/cracks in rigid/flexible pavement, low-temperature or shrinkage cracks in asphalt pavements, longitudinal joint failures, fatigue cracks, or subgrade shrinkage and subsidence over culvert or other utilities. Although reflective cracks are generally not load induced, loading does accelerate the rate and severity of deterioration.
The basic mechanism of reflective cracking is strain concentration in the overlay due to
the movement in the existing pavement at the vicinity of joints/cracks. This movement may be induced by bending or shearing action resulting from traffic loads or daily and seasonal temperature change. A basic schematic is shown in Figure 2.1 (Nunn 1989). Mode 1 shows the loading results from loads that are applied normally to the crack plane (thermal and traffic loading). Mode 2 shows the loading results from in-plane shear loading, which leads to crack faces sliding against each other normally to the leading edge of the crack (traffic loading). Mode 3 shows the loading (tearing mode) results from out-of-plane shear loading parallel to the crack leading edge, while this tearing load is negligible for pavements. In fact, the majority of reflective cracking is caused by the combination of all these mechanisms. In addition, crack initiation and propagation are also influenced by other factors such as the existing pavement’s structural geometry and asphalt mixture overlay fracture properties, specifically, the load transfer efficiency at joints and cracks. Thus, the combination of all these three mechanisms (bending, shearing, and thermal) should be considered in the reflective cracking study (Hu et al. 2010).
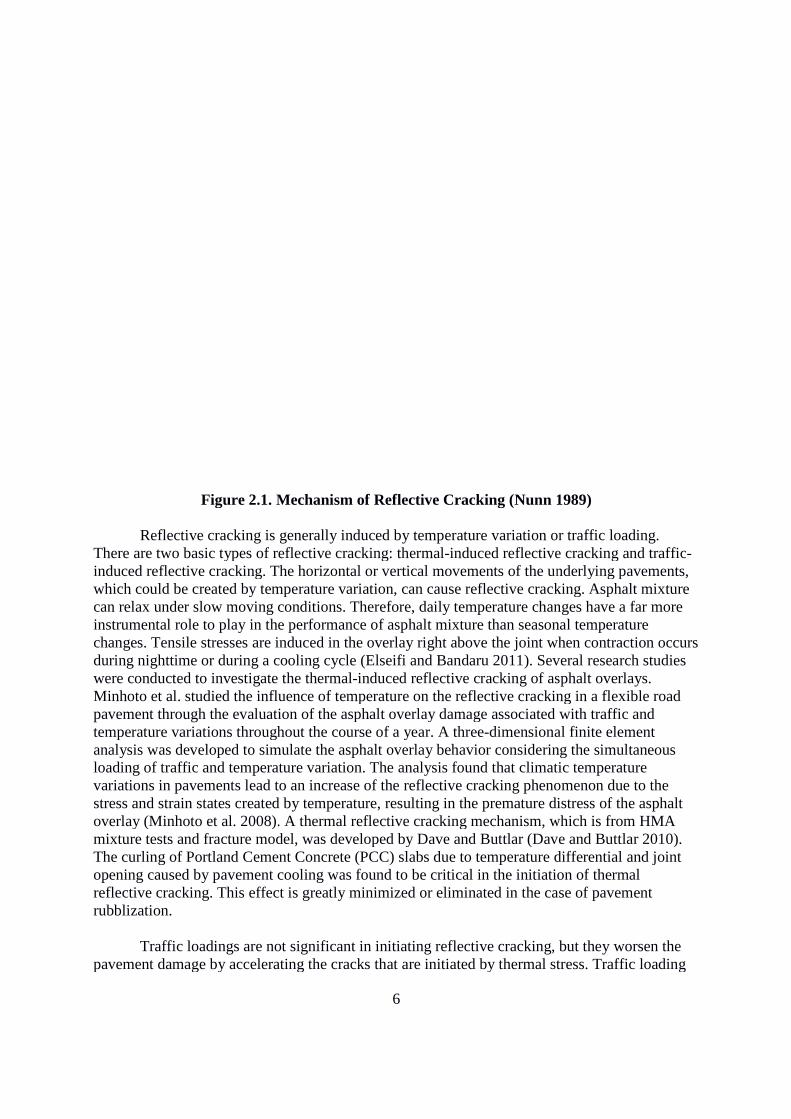
Figure 2.1. Mechanism of Reflective Cracking (Nunn 1989) Reflective cracking is generally induced by temperature variation or traffic loading.
There are two basic types of reflective cracking: thermalinduced reflective cracking. The horizontal or vertical movements of the underlying pavements, which could be created by temperature variation, can cause reflective cracking. Asphalt mixture can relax under slow moving conditions. Therefore, daily temperature changinstrumental role to play in the performance of asphalt mixture than seasonal temperature changes. Tensile stresses are induced in the overlay right above the joint when contraction occurs during nighttime or during a cooling cycle (Elsewere conducted to investigate the thermalMinhoto et al. studied the influence of temperature on the reflective cracking in a flexible road pavement through the evaluation of the asphalt overlay damage associated with traffic and temperature variations throughout the course of a year. A threeanalysis was developed to simulate the asphalt overlay behavior considering the simultaneous loading of traffic and temperature variation. The analysis found that climatic temperature variations in pavements lead to an increase of the reflective cracking phenomenon due to the stress and strain states created by temperature, resulting in the prematuoverlay (Minhoto et al. 2008). A thermal reflective cracking mechanism, which is from HMA mixture tests and fracture model, was developed by Dave and Buttlar (Dave and Buttlar 2010). The curling of Portland Cement Concrete (PCC) opening caused by pavement cooling was found to be critical in the initiation of thermal reflective cracking. This effect is greatly minimized or eliminated in the case of pavement rubblization.
Traffic loadings are not significant in initiating reflective cracking, but they worsen the pavement damage by accelerating the cracks that are initiated by thermal stress. Traffic loading
6
Figure 2.1. Mechanism of Reflective Cracking (Nunn 1989)
Reflective cracking is generally induced by temperature variation or traffic loading. There are two basic types of reflective cracking: thermal-induced reflective cracking and traffic
eflective cracking. The horizontal or vertical movements of the underlying pavements, which could be created by temperature variation, can cause reflective cracking. Asphalt mixture can relax under slow moving conditions. Therefore, daily temperature changinstrumental role to play in the performance of asphalt mixture than seasonal temperature changes. Tensile stresses are induced in the overlay right above the joint when contraction occurs during nighttime or during a cooling cycle (Elseifi and Bandaru 2011). Several research studies were conducted to investigate the thermal-induced reflective cracking of asphalt overlays. Minhoto et al. studied the influence of temperature on the reflective cracking in a flexible road
e evaluation of the asphalt overlay damage associated with traffic and temperature variations throughout the course of a year. A three-dimensional finite element analysis was developed to simulate the asphalt overlay behavior considering the simultaneous oading of traffic and temperature variation. The analysis found that climatic temperature variations in pavements lead to an increase of the reflective cracking phenomenon due to the stress and strain states created by temperature, resulting in the premature distress of the asphalt overlay (Minhoto et al. 2008). A thermal reflective cracking mechanism, which is from HMA mixture tests and fracture model, was developed by Dave and Buttlar (Dave and Buttlar 2010). The curling of Portland Cement Concrete (PCC) slabs due to temperature differential and joint opening caused by pavement cooling was found to be critical in the initiation of thermal reflective cracking. This effect is greatly minimized or eliminated in the case of pavement
dings are not significant in initiating reflective cracking, but they worsen the pavement damage by accelerating the cracks that are initiated by thermal stress. Traffic loading
Figure 2.1. Mechanism of Reflective Cracking (Nunn 1989)
Reflective cracking is generally induced by temperature variation or traffic loading. induced reflective cracking and traffic-
eflective cracking. The horizontal or vertical movements of the underlying pavements, which could be created by temperature variation, can cause reflective cracking. Asphalt mixture can relax under slow moving conditions. Therefore, daily temperature changes have a far more instrumental role to play in the performance of asphalt mixture than seasonal temperature changes. Tensile stresses are induced in the overlay right above the joint when contraction occurs
ifi and Bandaru 2011). Several research studies induced reflective cracking of asphalt overlays.
Minhoto et al. studied the influence of temperature on the reflective cracking in a flexible road e evaluation of the asphalt overlay damage associated with traffic and
dimensional finite element analysis was developed to simulate the asphalt overlay behavior considering the simultaneous oading of traffic and temperature variation. The analysis found that climatic temperature variations in pavements lead to an increase of the reflective cracking phenomenon due to the
re distress of the asphalt overlay (Minhoto et al. 2008). A thermal reflective cracking mechanism, which is from HMA mixture tests and fracture model, was developed by Dave and Buttlar (Dave and Buttlar 2010).
slabs due to temperature differential and joint opening caused by pavement cooling was found to be critical in the initiation of thermal reflective cracking. This effect is greatly minimized or eliminated in the case of pavement
dings are not significant in initiating reflective cracking, but they worsen the pavement damage by accelerating the cracks that are initiated by thermal stress. Traffic loading
7
causes the opening and shearing actions at the tip of a crack in an overlay placed on a cracked pavement. It also creates vertical movement in PCC slabs due to poor load transfer efficiency at the joints. These movements create bending and/or shear stress underneath the asphalt overlay at the location of joints, which in the course of time reflects to the surface (Bennert et al. 2009). Recently, a neural network methodology has been used to model the cracks as they grow upward through an HMA overlay as a result of both load and thermal effects, which can be used to efficiently predict a 20-year reflection cracking of a typical overlay (Ceylan et al. 2011).
2.3 Cracking Models
Various models have been developed to analyze or predict reflective cracking (Owusu-Antwi et al. 1998, Sousa et al. 2002, Sousa et al. 2005, and Tsai et al. 2010). An empirical model is used in the Mechanistic-Empirical Design Guide (MEPDG) under the National Highway Cooperative Research Program (NCHRP) Project 1-37A (NCHRP 2004). Some extended multi-layer linear elastic models and equilibrium equation-based models were also developed (Van Gurp and Molenaar 1989, Treybig et al. 1977, and Seeds et al. 1985). Due to the simplicity of these models, they cannot be used to accurately simulate the reflective cracking phenomenon. In recent years, with the application of computer technology, some advanced mechanistic-based models were developed to simulate the reflective cracking behavior. These models include traditional fatigue model with finite element analysis, Paris’ law-based fracture mechanics model, cohesive cracking/zone model, and non-local continuum damage model (Zhou et al. 2009). Some commonly used reflective cracking models are discussed below.
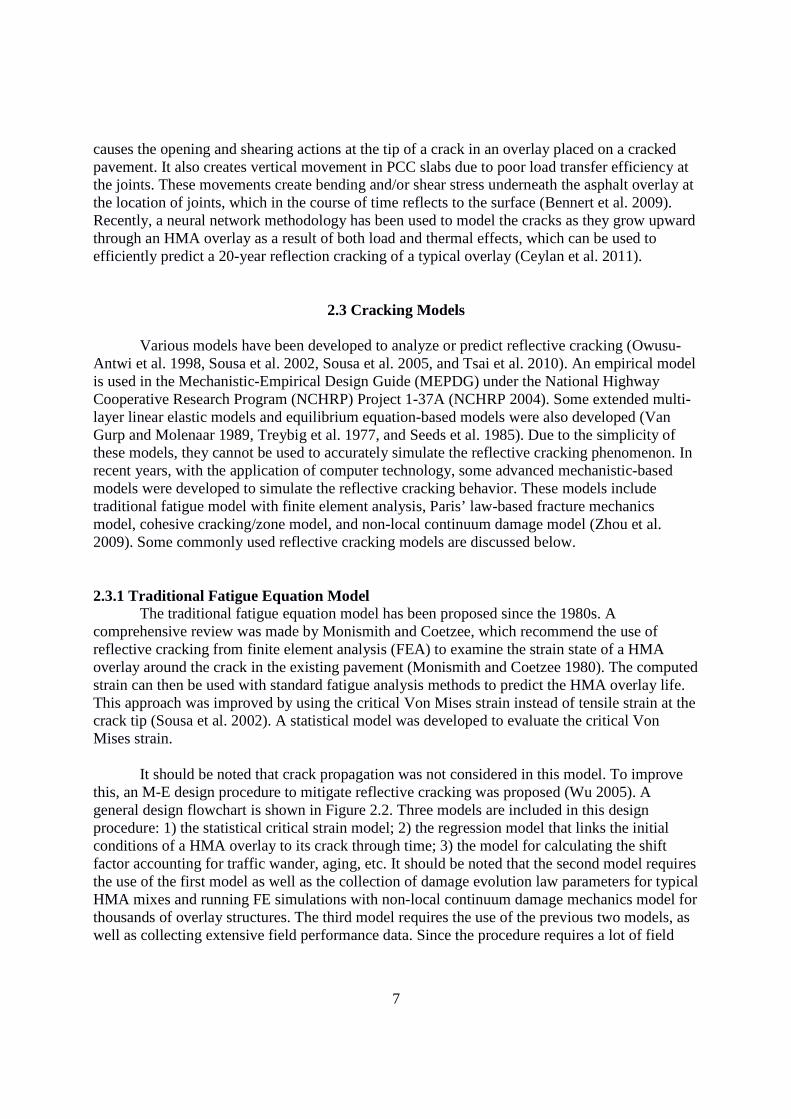
2.3.1 Traditional Fatigue Equation Model The traditional fatigue equation model has been proposed since the 1980s. A
comprehensive review was made by Monismith and Coetzee, which recommend the use of reflective cracking from finite element analysis (FEA) to examine the strain state of a HMA overlay around the crack in the existing pavement (Monismith and Coetzee 1980). The computed strain can then be used with standard fatigue analysis methods to predict the HMA overlay life. This approach was improved by using the critical Von Mises strain instead of tensile strain at the crack tip (Sousa et al. 2002). A statistical model was developed to evaluate the critical Von Mises strain.
It should be noted that crack propagation was not considered in this model. To improve
this, an M-E design procedure to mitigate reflective cracking was proposed (Wu 2005). A general design flowchart is shown in Figure 2.2. Three models are included in this design procedure: 1) the statistical critical strain model; 2) the regression model that links the initial conditions of a HMA overlay to its crack through time; 3) the model for calculating the shift factor accounting for traffic wander, aging, etc. It should be noted that the second model requires the use of the first model as well as the collection of damage evolution law parameters for typical HMA mixes and running FE simulations with non-local continuum damage mechanics model for thousands of overlay structures. The third model requires the use of the previous two models, as well as collecting extensive field performance data. Since the procedure requires a lot of field
8
data collection work, the researchers just finished establishing the first statistical critical strain model. Significant work is still needed to develop this M-E design procedure.
Figure 2.2. Overlay M-E Design Flowchart
2.3.2 Cohesive Crack/Zone Model
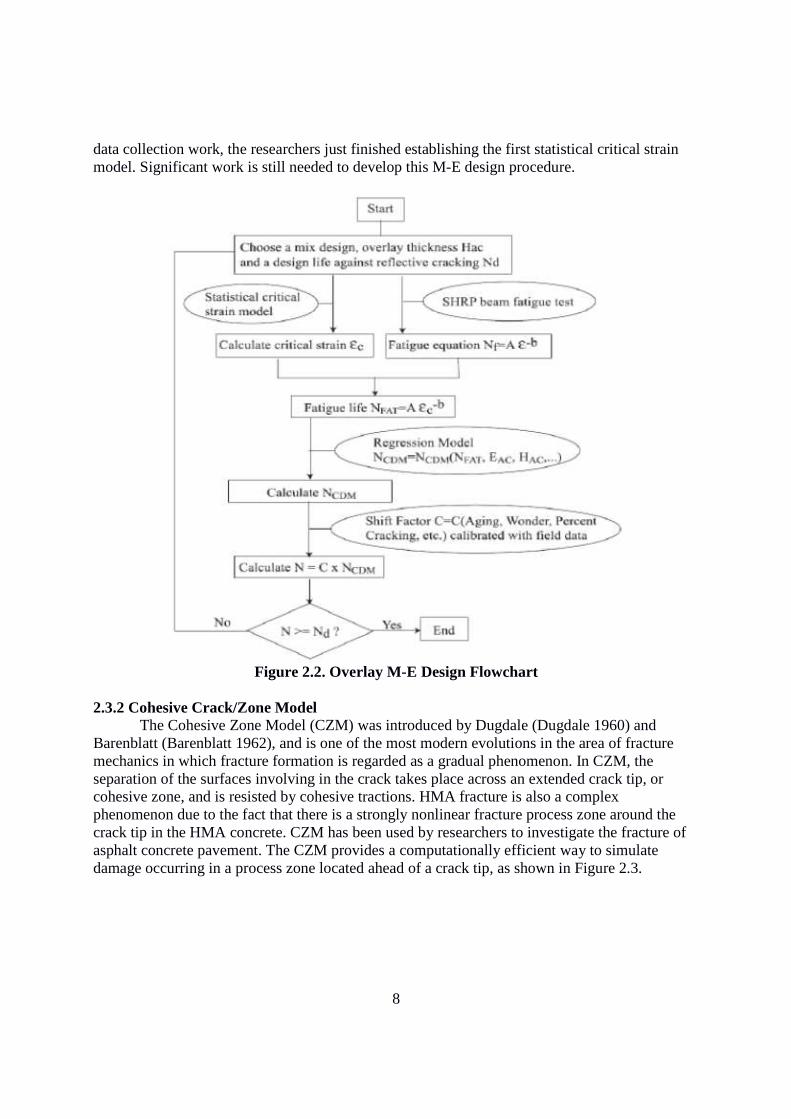
The Cohesive Zone Model (CZM) was introduced by Dugdale (Dugdale 1960) and Barenblatt (Barenblatt 1962), and is one of the most modern evolutions in the area of fracture mechanics in which fracture formation is regarded as a gradual phenomenon. In CZM, the separation of the surfaces involving in the crack takes place across an extended crack tip, or cohesive zone, and is resisted by cohesive tractions. HMA fracture is also a complex phenomenon due to the fact that there is a strongly nonlinear fracture process zone around the crack tip in the HMA concrete. CZM has been used by researchers to investigate the fracture of asphalt concrete pavement. The CZM provides a computationally efficient way to simulate damage occurring in a process zone located ahead of a crack tip, as shown in Figure 2.3.
9
Figure 2.3. Illustration of Cohesive Zone Model (Song et al. 2006)
Jenq and Perng developed a CZM model for asphalt concrete mixtures, which consider the material beyond the cohesive zone linear elastic. The parameters of the model at different temperatures were determined by Indirect Tensile Test and Single-Edge notched Beam test. The model was used to simulate the low temperature fracture of asphalt overlay on old PCC road (Jenq and Perng 1991). Soares et al. applied the CZM constitutive relation to investigate the crack propagation of IDT specimen in Superpave projects (Soares et al. 2003). It was found that the crack propagation behavior was independent of temperature and loading rate. Asphalt mixture was considered a two-phase material: gravel and asphalt, which were considered to be linear elastic materials. Paulino et al. proposed an intrinsic cohesive model based on the energy potential approach (Paulino et al. 2004). In this model, the material out of the cohesive zone was considered linear elastic, and crack propagation behavior had nothing to do with temperature and loading rate. Through IDT and SEB (Single Edge Notched Beam) tests, the strength and cohesive energy of the material were attained. The crack propagation of the IDT specimen was simulated using a finite element program with the parameters validated by SEB test. A potential-based cohesive zone model was developed and implemented using ABAQUS software and was subsequently employed to simulate crack propagation observed in asphalt concrete laboratory fracture tests conducted with an SEB apparatus (Song et al. 2006). Mixed-mode crack propagation simulation was performed using the calibrated cohesive parameters. The crack trajectory predicted by the numerical simulation was found to compare favorably to experimental results. Li and Niu investigated the cracks produced by abrupt temperature drop using CZM to simulate the fracture part of AC combined with viscoelastic constitutive model (Li and Niu 2013). The Thermal Stress Restrained Specimen Test (TSRST) was selected to verify the CZM model. Through parameter sensitivity analysis, it was found that the relaxation of asphalt concrete (AC) materials retards the fracture procedure. The modulus and Poisson’s ratio are the key parameters to avoid crack during abrupt temperature dropping.
However, the application of cohesive zone model to HMA is still in preliminary stage.
Most of the models only applied the CZM to cracking under monotonic loading. The effect of temperature and loading rate were not considered in these models. Therefore, additional material parameters describing damage accumulation under unloading and reloading cycles are needed to extend the CZM to repeated loading and crack propagation. In general, the CZM is still in its
10
infancy and not readily applicable for routine HMA overlay designs and analyses (Zhou et al. 2010).
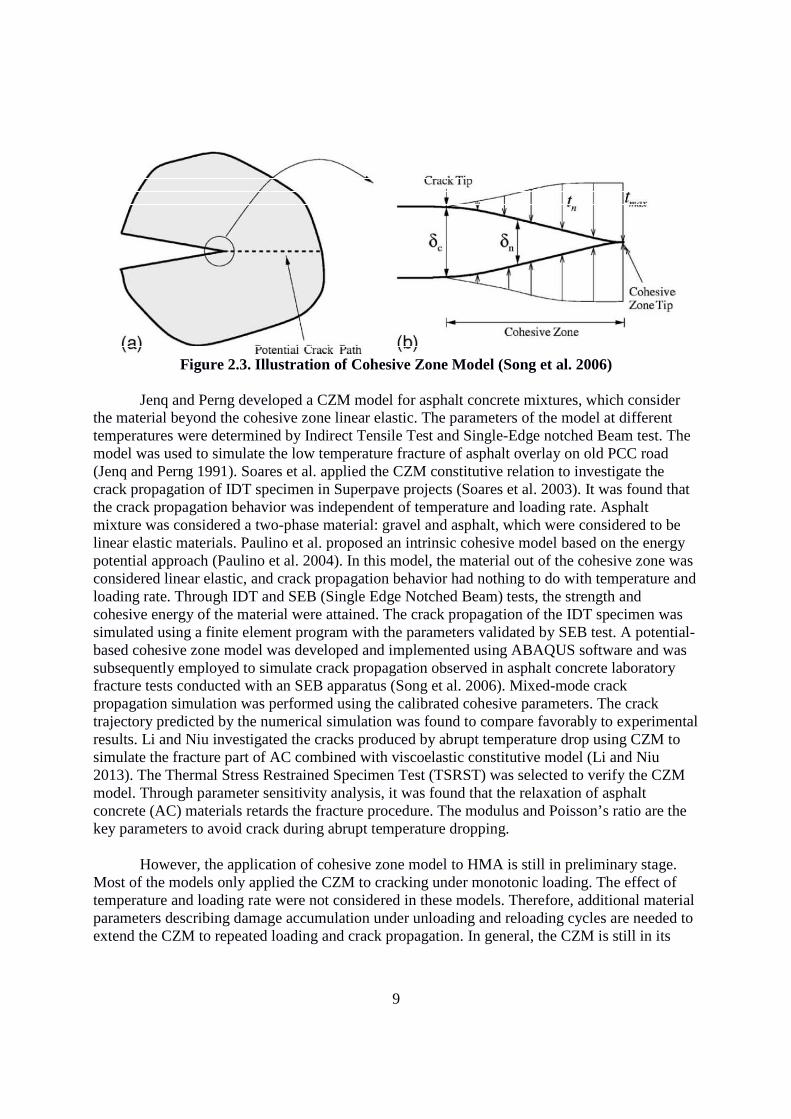
2.3.3 Paris’ Law-Based Fracture Mechanics Model Fracture mechanics plays an important role in the study of the propagation of cracks in
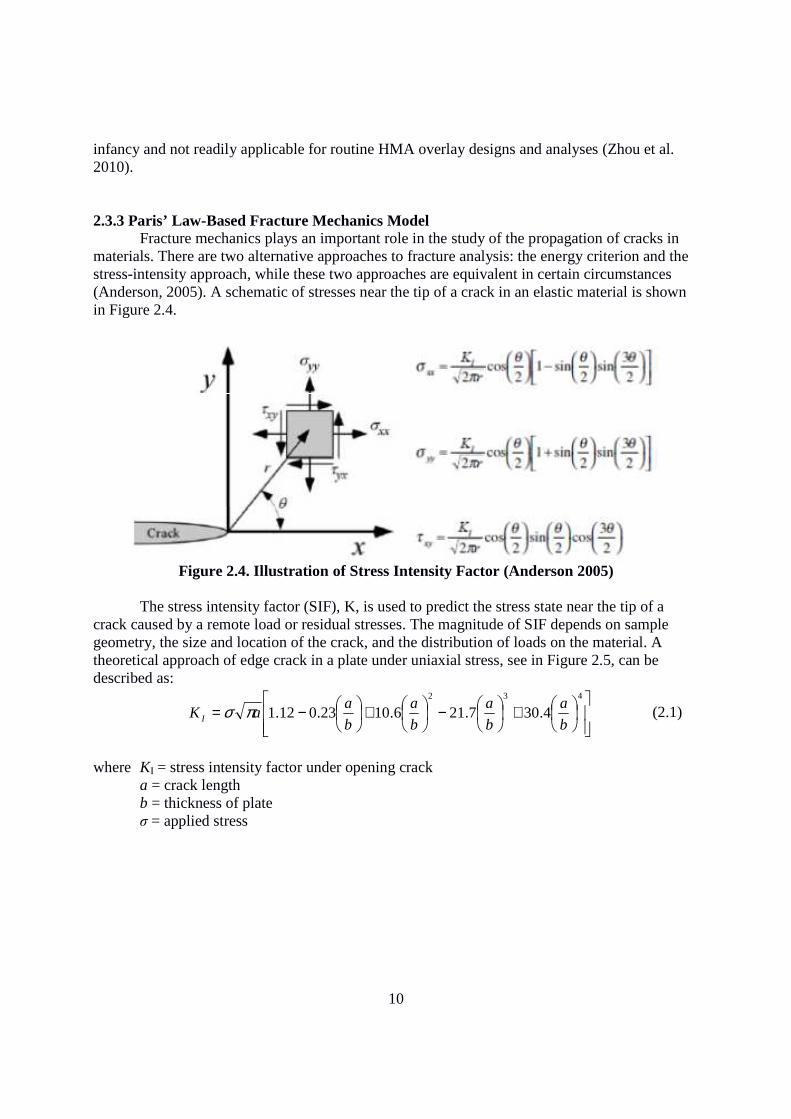
materials. There are two alternative approaches to fracture analysis: the energy criterion and the stress-intensity approach, while these two approaches are equivalent in certain circumstances (Anderson, 2005). A schematic of stresses near the tip of a crack in an elastic material is shown in Figure 2.4.
Figure 2.4. Illustration of Stress Intensity Factor (Anderson 2005)
The stress intensity factor (SIF), K, is used to predict the stress state near the tip of a
crack caused by a remote load or residual stresses. The magnitude of SIF depends on sample geometry, the size and location of the crack, and the distribution of loads on the material. A theoretical approach of edge crack in a plate under uniaxial stress, see in Figure 2.5, can be described as:
+
−
+
−=432
4.307.216.1023.012.1b
a
b
a
b
a
b
aaK I πσ (2.1)
where KI = stress intensity factor under opening crack a = crack length
b = thickness of plate σ = applied stress
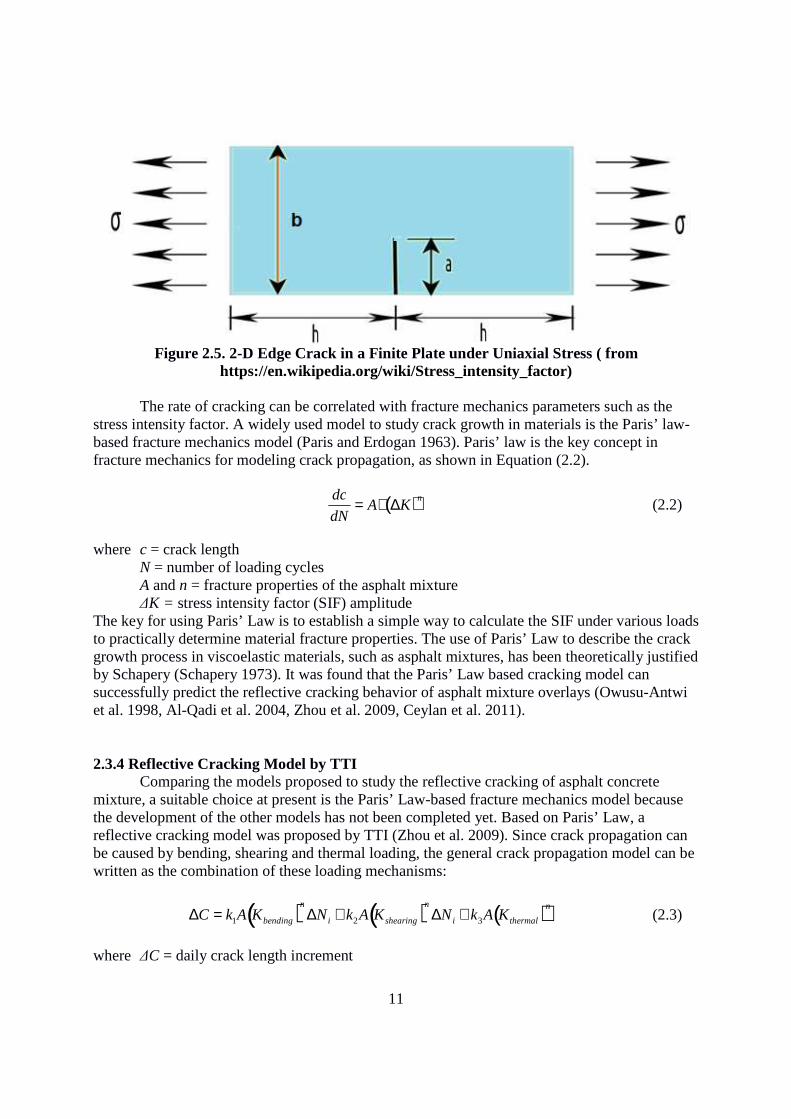
11
Figure 2.5. 2-D Edge Crack in a Finite Plate under Uniaxial Stress ( from
https://en.wikipedia.org/wiki/Stress_intensity_factor)
The rate of cracking can be correlated with fracture mechanics parameters such as the stress intensity factor. A widely used model to study crack growth in materials is the Paris’ law-based fracture mechanics model (Paris and Erdogan 1963). Paris’ law is the key concept in fracture mechanics for modeling crack propagation, as shown in Equation (2.2).
dc
dN= A⋅ ∆K( )n
(2.2)
where c = crack length N = number of loading cycles A and n = fracture properties of the asphalt mixture ∆K = stress intensity factor (SIF) amplitude The key for using Paris’ Law is to establish a simple way to calculate the SIF under various loads to practically determine material fracture properties. The use of Paris’ Law to describe the crack growth process in viscoelastic materials, such as asphalt mixtures, has been theoretically justified by Schapery (Schapery 1973). It was found that the Paris’ Law based cracking model can successfully predict the reflective cracking behavior of asphalt mixture overlays (Owusu-Antwi et al. 1998, Al-Qadi et al. 2004, Zhou et al. 2009, Ceylan et al. 2011).
2.3.4 Reflective Cracking Model by TTI Comparing the models proposed to study the reflective cracking of asphalt concrete mixture, a suitable choice at present is the Paris’ Law-based fracture mechanics model because the development of the other models has not been completed yet. Based on Paris’ Law, a reflective cracking model was proposed by TTI (Zhou et al. 2009). Since crack propagation can be caused by bending, shearing and thermal loading, the general crack propagation model can be written as the combination of these loading mechanisms:
∆C = k1A Kbending( )n
∆Ni + k2A Kshearing( )n
∆Ni + k3A Kthermal( )n (2.3)
where ∆C = daily crack length increment
12
∆N = daily load repetitions Kbending, Kshearing, Kthermal = SIFs caused by bending, shearing, and thermal loadings k1, k2, k3 = calibration factors The reflective cracking damage can be calculated using Equation (2.4)
D = ∆C /h∑ (2.4)
where D = damage ratio h = overlay thickness
∆C∑ = total crack length
A sigmoidal model shown in Equation 2.5 is used to describe the development of the reflective cracking amount:
RCR=100
1+ eC1 logD (2.5)
where RCR = reflective cracking rate (%) C1 = -7.0 from empirical analysis (Zhou et al. 2009) D = damage ratio Therefore, the two key issues of the proposed reflective cracking models are how to quickly compute the SIFs under various traffic and thermal loads, and to practically determine the HMA fracture properties (A and n) (Zhou et al. 2005, Zhou et al. 2010). Currently, a semi-analytical FE method-based crack propagation program named SA-CrackPro was developed by TTI for SIF computation (Zhou et al. 2010). SA-CrackPro is essentially a 2-D SIF calculation program that incorporates a Semi-Analytical method to provide the same satisfactory computations and results as a 3-D FE program at a much faster speed and with much fewer computer resource requirements. With known SIF (K) and crack growth rate (dc/dN) from laboratory testing, the fracture properties (A and n) can be readily determined.
2.4 Crack Resistance Evaluation
Numerous studies have attempted to reduce or prevent reflective cracking of asphalt mixture overlays by increasing the thickness of the asphalt mixture overlay, the use of stress-absorbing membranes between layers, the use of fabric and geotextile membranes, and fracturing of the existing concrete slabs. Crack resistance is an important parameter to be considered because to perform well in the field, an asphalt overlay must have a good balance of both rut and crack resistance properties. Stiffer binders and good stone-to-stone contact may provide improved rut resistance, but they may also reduce mix flexibility and crack resistance. In order to characterize the crack resistance of asphalt mixtures, it is crucial to simulate the horizontal opening and closing of subsurface joints or cracks (Zhou and Scullion 2003). In recent years, many research efforts were conducted to evaluate the reflective cracking performance of asphalt mixtures. Field and laboratory studies were evaluated on the highways in both New Jersey and Massachusetts (Bennert and Maher 2008, Bennert et al. 2009). Extensive field-testing including falling weight deflectometer and weigh-in-motion sensors were used. The results illustrated the benefit of using a reflective crack relief interlayer (RCRI) to minimize reflective cracking

13
potential. A study of reflective cracking of asphalt overlays that are used in conjunction with interlayer systems for reflective-crack control was also completed in Illinois (Kim et al. 2009). Visual field crack surveys and a series of advanced laboratory tests were conducted. Thermal reflective cracking mechanisms were also studied using recently developed HMA tests and fracture models (Dave and Buttlar 2010). A series of FE-based pavement simulations were performed in an effort to better understand thermal reflective cracking mechanisms as a function of several key material and pavement structure variables. The effect of density on fatigue cracking and rutting performance of hot mix asphalt mixtures was also evaluated by Mogawer et al. (Mogawer et al. 2011). The testing analysis and MEPDG predictions indicated that higher density specimens yielded improved fatigue and rutting performance.
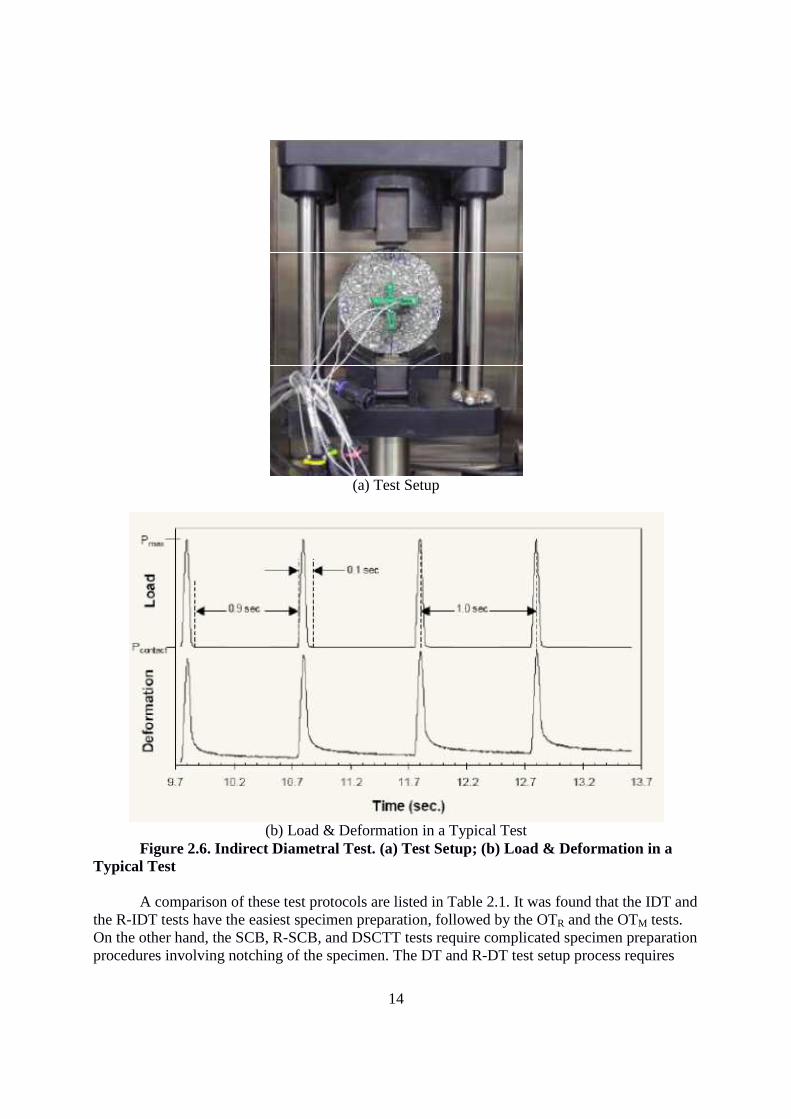
The IDT test is used extensively by Florida highway and other agencies for routine tests.
The test is usually conducted on cylindrical specimens subjected to a compressive load along two opposite generators resulting in a relatively uniform tensile stress acting perpendicular to and along the diametral plane (Ping and Xiao 2009). The resilient modulus (MR) of asphalt mixtures can be determined by the dynamic load and deformation, which has been used in the AASHTO Design Guide (AASHTO 1993). The test is defined as a Roque and Buttlar developed a measurement and analysis system to determine asphalt mixture properties, primarily thermal cracking, using the indirect tensile testing mode (Roque and Buttlar 1992). Further modifications and improvements on the Strategic Highway Research Program (SHRP) IDT system for characterizing relevant asphalt mixture properties were then made (Roque et al. 1997). Recently, a research study was conducted to evaluate the fracture properties of hot mix asphalt mixture and to study the correlation between the dynamic modulus test and the IDT test for Superpave mixtures (Ping and Xiao 2009). The effects of aggregate type, aggregate gradation, and polymer modifier on fracture properties of asphalt concrete were evaluated.
The test is defined as a repetitive 0.1 second haversine load followed by a 0.9 second rest period, continued at 1.0 Hz intervals. The prepared specimens were placed in a controlled temperature chamber to the specified test temperature. Similar to the splitting tensile test of PCC specimen, the IDT specimen was placed into the loading apparatus and the loading strips were positioned to be parallel and centered on the vertical diametral plane (Figure 2.6). The specimen was preconditioned by applying a repeated haversine or other suitable waveform load without impact for a minimum period sufficient to obtain uniform deformation readout. Resilient modulus evaluation will usually include tests at three temperatures at one or more loading frequencies. The horizontal and vertical deformations were continuously monitored during the test.
Several comparative laboratory tests were conducted in Texas to evaluate hot mix asphalt concrete crack resistance (Jamison 2010, Walubita et al. 2013). The tests used to evaluate asphalt mixture cracking included 1) the standard repeated overlay test (OTR) and monotonic loading overlay test (OTM); 2) the monotonic indirect diametral test (IDT) and repeated loading indirect diametral test (R-IDT); 3) the monotonic semi-circular bending test (SCB) and repeated SCB (R-SCB) test; 4) the monotonic direct tension test (DT) and repeated loading DT (R-DT) test; 5) the disk-shaped compaction tension test (DSCTT).
14
(a) Test Setup
(b) Load & Deformation in a Typical Test
Figure 2.6. Indirect Diametral Test. (a) Test Setup; (b) Load & Deformation in a Typical Test
A comparison of these test protocols are listed in Table 2.1. It was found that the IDT and
the R-IDT tests have the easiest specimen preparation, followed by the OTR and the OTM tests. On the other hand, the SCB, R-SCB, and DSCTT tests require complicated specimen preparation procedures involving notching of the specimen. The DT and R-DT test setup process requires
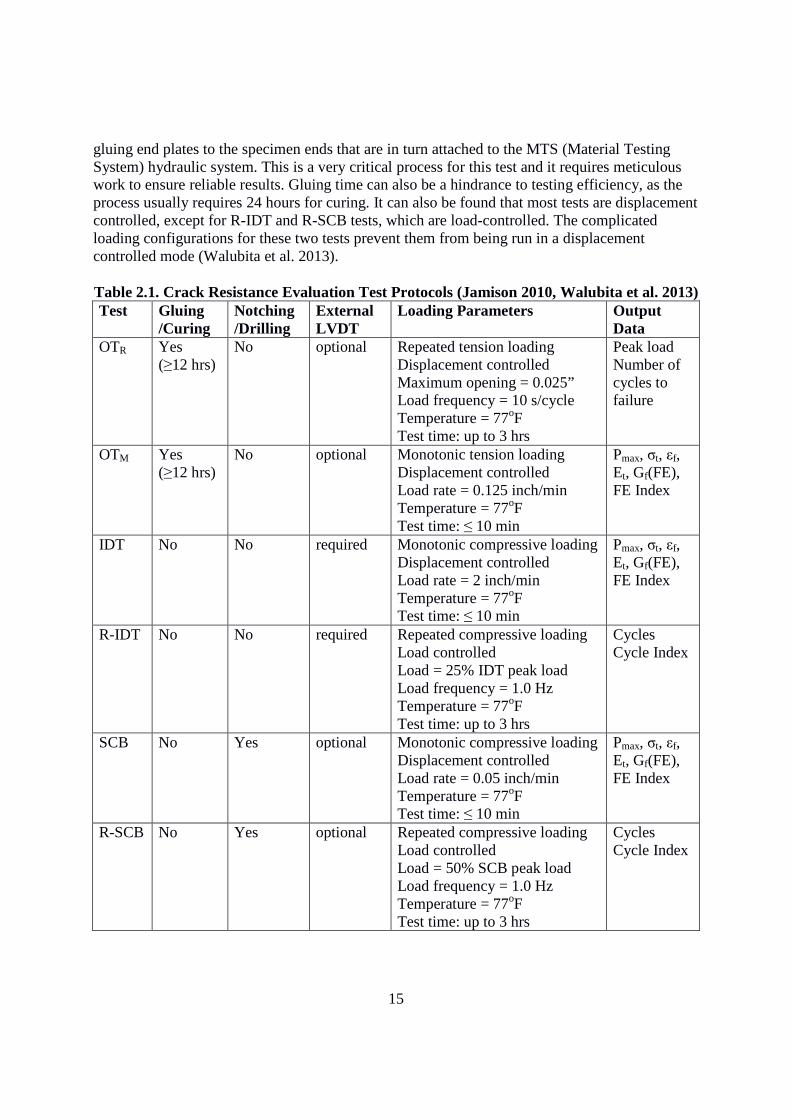
15
gluing end plates to the specimen ends that are in turn attached to the MTS (Material Testing System) hydraulic system. This is a very critical process for this test and it requires meticulous work to ensure reliable results. Gluing time can also be a hindrance to testing efficiency, as the process usually requires 24 hours for curing. It can also be found that most tests are displacement controlled, except for R-IDT and R-SCB tests, which are load-controlled. The complicated loading configurations for these two tests prevent them from being run in a displacement controlled mode (Walubita et al. 2013). Table 2.1. Crack Resistance Evaluation Test Protocols (Jamison 2010, Walubita et al. 2013) Test Gluing
/Curing Notching /Drilling
External LVDT
Loading Parameters Output Data
OTR Yes (≥12 hrs)
No optional Repeated tension loading Displacement controlled Maximum opening = 0.025” Load frequency = 10 s/cycle Temperature = 77oF Test time: up to 3 hrs
Peak load Number of cycles to failure
OTM Yes (≥12 hrs)
No optional Monotonic tension loading Displacement controlled Load rate = 0.125 inch/min Temperature = 77oF Test time: ≤ 10 min
Pmax, σt, εf, Et, Gf(FE), FE Index
IDT No No required Monotonic compressive loading Displacement controlled Load rate = 2 inch/min Temperature = 77oF Test time: ≤ 10 min
Pmax, σt, εf, Et, Gf(FE), FE Index
R-IDT No No required Repeated compressive loading Load controlled Load = 25% IDT peak load Load frequency = 1.0 Hz Temperature = 77oF Test time: up to 3 hrs
Cycles Cycle Index
SCB No Yes optional Monotonic compressive loading Displacement controlled Load rate = 0.05 inch/min Temperature = 77oF Test time: ≤ 10 min
Pmax, σt, εf, Et, Gf(FE), FE Index
R-SCB No Yes optional Repeated compressive loading Load controlled Load = 50% SCB peak load Load frequency = 1.0 Hz Temperature = 77oF Test time: up to 3 hrs
Cycles Cycle Index

16
Table 2.1. Crack Resistance Evaluation Test Protocols - Continued Test Gluing
/Curing Notching /Drilling
External LVDT
Loading Parameters Output Data
DT Yes (≥24 hrs)
No required Monotonic tension loading Displacement controlled Load rate = 0.05 inch/min Temperature = 77oF Test time: ≤ 10 min
Pmax, σt, εf, Et, Gf(FE), FE Index
R-DT Yes (≥24 hrs)
No required Repeated tension loading Displacement controlled Input strain =35% DT strain Load frequency = 1.0 Hz Temperature = 77oF Test time: up to 3 hrs
Peak load Number of cycles to failure
DSCTT No Yes required Monotonic tension loading Displacement controlled Load rate = 0.04 inch/min Temperature = 77oF Test time: ≤ 10 min
Pmax, σt, εf, Et, Gf(FE), FE Index
*Pmax = maximum peak load, σt = tensile strength, εf = tensile strain at peak failure mode, Et = tensile modulus, Gf(FE) = fracture energy, FE Index = fracture energy index.
A comparative study based on the test setup, loading configurations, and failure modes
was conducted (Walubita et al. 2013). It was observed that the OTM and OTR tests are simple testing considering loading configurations and overall test setup. The monotonic loading tests (IDT and SCB) are simpler than their repeated loading tests (R-IDT and R-SCB). On the other hand, the R-IDT and the R-SCB tests involve complicated testing procedures using the Material Testing System (MTS) machine setup to accomplish the repeated loading mode and require skilled technicians. The remaining tests, DT, R-DT, and DSCTT, are also complicated test procedures requiring the MTS and skillful handling. In terms of failure modes, all the tests are aimed at cracking the specimen through application of load or displacement. Ideally, the failure should occur in a single crack path. However, in some cases, multiple cracking could be observed.
Test repeatability of OT, IDT, and SCB tests were all studied by TTI. Both the monotonic
and repeated loading tests were conducted. Six types of asphalt concrete mixtures were used in this study. Each type of specimen was tested three times for each type of test, respectively. It could be found that among the monotonic loading tests, the OTM and IDT are much more repeatable than the SCB. In the case of repeated loading tests, the OTR is the most repeatable test compared to the R-IDT and the R-SCB.
A comparative evaluation of the crack test methods were conducted and correlated with field data. Based on this comparative evaluation, a cracking test ranking, practicality, and implementation was proposed by TTI (Jamison 2010, Walubita et al. 2013). It was found that the repeated loading overlay test exhibited statistical superiority in terms of repeatability, variability, potential to differentiate and screen mixes, and sensitivity to changes in asphalt content

17
variations compared to the other repeated loading crack tests (R-IDT and R-SCB). Although the test results were unreliably variable when considering the coarse-grade mixes, the OTR tentatively qualifies to be used as a routine crack test for HMA mix-designs and screening purposes, subject to improving the test procedure. The OTM and IDT, through the use of the FE index concept, exhibited promising potential both in terms of repeatability and mix screening capabilities. Due to the cost-effectiveness of these tests, the OTM and/or IDT test methods can be conducted as supplementary tests to the OTR test method. However, validation with field data still remains one of the key challenges. Therefore, performance monitoring of field test sections should be continued so as to validate these crack test methods and develop some screening criteria.
2.5 Overlay Test
2.5.1 Introduction The first asphalt overlay tester was developed at TTI in 1970’s (Germann and Lytton 1979). Recently, the overlay test procedure has been widely used by other researchers (Chen 2007, Zhou et al. 2007, Hu et al. 2011, Mogawer et al. 2011, Walubita et al. 2011, Walubita et al. 2013). It has been found that the asphalt overlay tester is an efficient test method used to evaluate the crack resistance of asphalt mixtures. Considerable work has been done to evaluate the crack performance of asphalt mixtures in Texas and some other states. A test procedure (Tex-248-F) to evaluate the asphalt mixtures using OT was developed and being updated in Texas (TxDOT 2014), which provided a baseline test protocol to conduct the OT test in the other states. There were two overlay testers at TTI: one is a small overlay tester for a specimen size of 15 inches long by 3 inches wide with variable height; the other is a large overlay tester for a larger size specimen of 20 inches long by 6 inches wide with variable height. The limitation with these overlay testers was that long beam samples were required, which are relatively difficult to fabricate in the laboratory and more difficult to get from the field. To develop the overlay test concept into a practical laboratory test for routine pavement design, an upgraded TTI overlay tester was developed with the goal of being able to test samples that could be easily fabricated in the lab using a gyratory compactor or obtained from standard field cores.
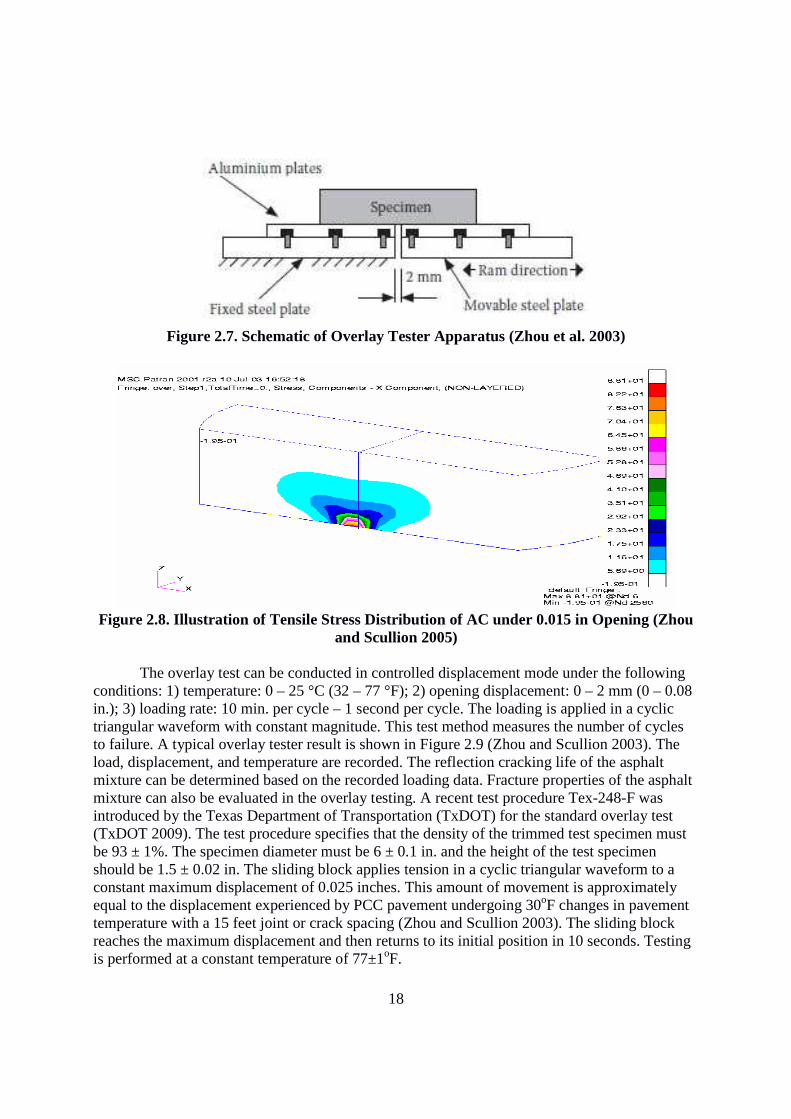
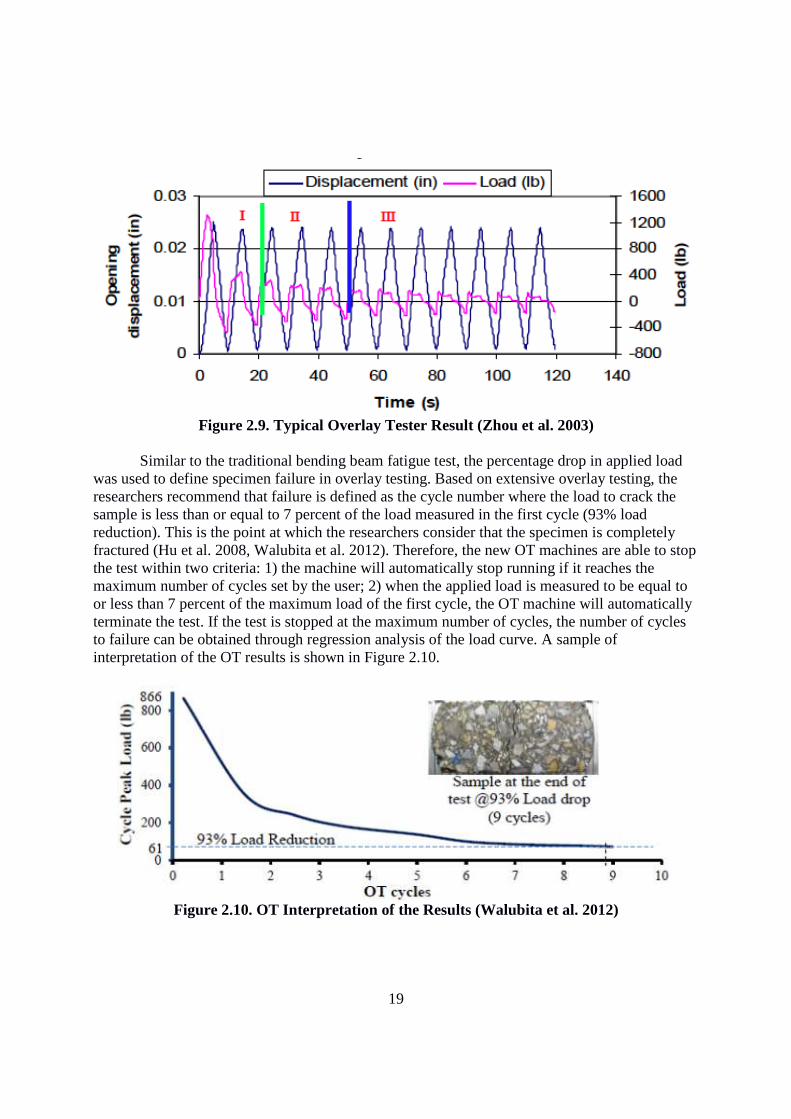
The schematic of the upgraded overlay tester apparatus is shown in Figure 2.7 (Zhou and Scullion 2003). This overlay tester is a computer controlled electrohydraulic system that applies repeated direct tension load to HMA specimens. It consists of two steel plates, one fixed and the other movable horizontally to simulate the opening and closing of joints or cracks in the old pavements beneath an overlay. The specimen size is 150 mm (6 in.) long by 75 mm (3 in.) wide with a height of 38 mm (1.5 in.), which can be readily fabricated from Superpave Gyratory Compactor (SGC) or cut from field cores to make the overlay tester more practical and easier to use. The specimen size was determined based on the fact that both 2-inch-thick asphalt overlays and 6-inch diameter core drills have been used statewide in Texas. From 2-inch-thick field cores, it is easy to get a 1.5-inch high overlay tester specimen after trimming the tack coat layer and underseal. Furthermore, the 3-D finite element program was used to analyze the stress distribution of different sizes of specimens. As shown in Figure 2.8, the main tensile stress of asphalt concrete is limited to the middle 2.5-inch portion of the specimen. Therefore, it is reasonable to use a 6-inch-long specimen in the OT (Zhou and Scullion 2005).
18
Figure 2.7. Schematic of Overlay Tester Apparatus (Zhou et al. 2003)
Figure 2.8. Illustration of Tensile Stress Distribution of AC under 0.015 in Opening (Zhou
and Scullion 2005) The overlay test can be conducted in controlled displacement mode under the following
conditions: 1) temperature: 0 – 25 °C (32 – 77 °F); 2) opening displacement: 0 – 2 mm (0 – 0.08 in.); 3) loading rate: 10 min. per cycle – 1 second per cycle. The loading is applied in a cyclic triangular waveform with constant magnitude. This test method measures the number of cycles to failure. A typical overlay tester result is shown in Figure 2.9 (Zhou and Scullion 2003). The load, displacement, and temperature are recorded. The reflection cracking life of the asphalt mixture can be determined based on the recorded loading data. Fracture properties of the asphalt mixture can also be evaluated in the overlay testing. A recent test procedure Tex-248-F was introduced by the Texas Department of Transportation (TxDOT) for the standard overlay test (TxDOT 2009). The test procedure specifies that the density of the trimmed test specimen must be 93 ± 1%. The specimen diameter must be 6 ± 0.1 in. and the height of the test specimen should be 1.5 ± 0.02 in. The sliding block applies tension in a cyclic triangular waveform to a constant maximum displacement of 0.025 inches. This amount of movement is approximately equal to the displacement experienced by PCC pavement undergoing 30oF changes in pavement temperature with a 15 feet joint or crack spacing (Zhou and Scullion 2003). The sliding block reaches the maximum displacement and then returns to its initial position in 10 seconds. Testing is performed at a constant temperature of 77±1oF.
19
Figure 2.9. Typical Overlay Tester Result (Zhou et al. 2003)
Similar to the traditional bending beam fatigue test, the percentage drop in applied load
was used to define specimen failure in overlay testing. Based on extensive overlay testing, the researchers recommend that failure is defined as the cycle number where the load to crack the sample is less than or equal to 7 percent of the load measured in the first cycle (93% load reduction). This is the point at which the researchers consider that the specimen is completely fractured (Hu et al. 2008, Walubita et al. 2012). Therefore, the new OT machines are able to stop the test within two criteria: 1) the machine will automatically stop running if it reaches the maximum number of cycles set by the user; 2) when the applied load is measured to be equal to or less than 7 percent of the maximum load of the first cycle, the OT machine will automatically terminate the test. If the test is stopped at the maximum number of cycles, the number of cycles to failure can be obtained through regression analysis of the load curve. A sample of interpretation of the OT results is shown in Figure 2.10.
Figure 2.10. OT Interpretation of the Results (Walubita et al. 2012)
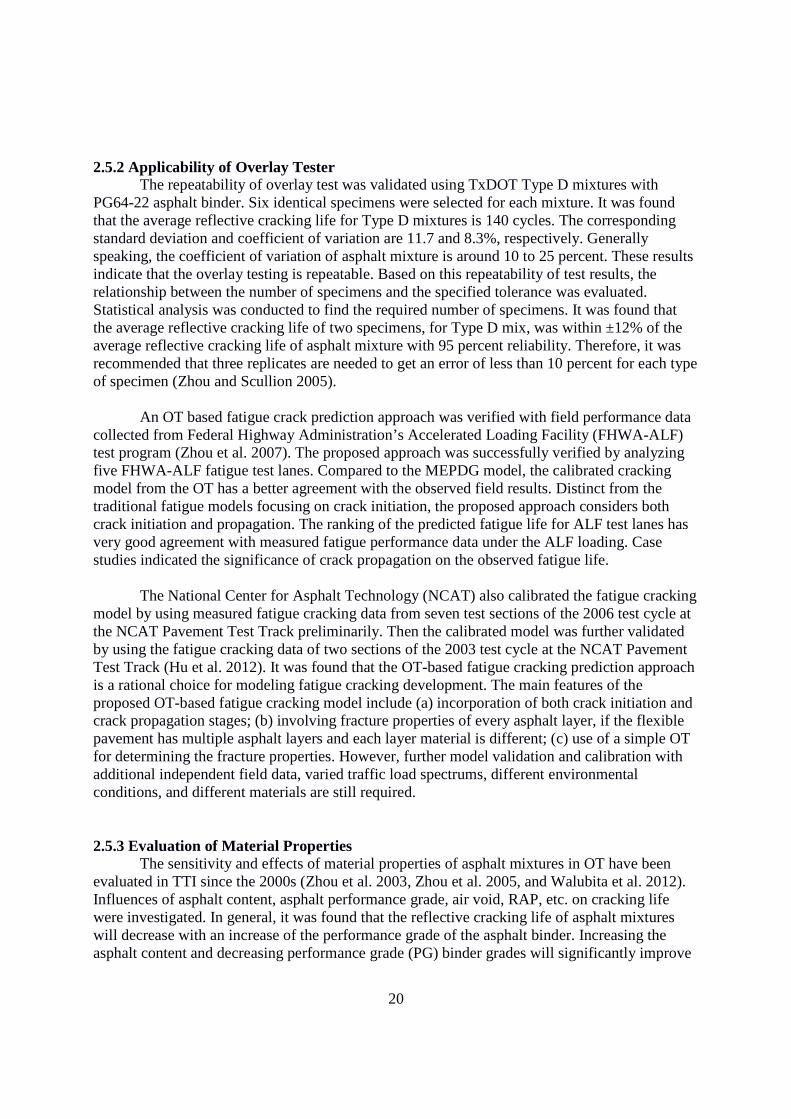
20
2.5.2 Applicability of Overlay Tester
The repeatability of overlay test was validated using TxDOT Type D mixtures with PG64-22 asphalt binder. Six identical specimens were selected for each mixture. It was found that the average reflective cracking life for Type D mixtures is 140 cycles. The corresponding standard deviation and coefficient of variation are 11.7 and 8.3%, respectively. Generally speaking, the coefficient of variation of asphalt mixture is around 10 to 25 percent. These results indicate that the overlay testing is repeatable. Based on this repeatability of test results, the relationship between the number of specimens and the specified tolerance was evaluated. Statistical analysis was conducted to find the required number of specimens. It was found that the average reflective cracking life of two specimens, for Type D mix, was within ±12% of the average reflective cracking life of asphalt mixture with 95 percent reliability. Therefore, it was recommended that three replicates are needed to get an error of less than 10 percent for each type of specimen (Zhou and Scullion 2005).
An OT based fatigue crack prediction approach was verified with field performance data
collected from Federal Highway Administration’s Accelerated Loading Facility (FHWA-ALF) test program (Zhou et al. 2007). The proposed approach was successfully verified by analyzing five FHWA-ALF fatigue test lanes. Compared to the MEPDG model, the calibrated cracking model from the OT has a better agreement with the observed field results. Distinct from the traditional fatigue models focusing on crack initiation, the proposed approach considers both crack initiation and propagation. The ranking of the predicted fatigue life for ALF test lanes has very good agreement with measured fatigue performance data under the ALF loading. Case studies indicated the significance of crack propagation on the observed fatigue life.
The National Center for Asphalt Technology (NCAT) also calibrated the fatigue cracking
model by using measured fatigue cracking data from seven test sections of the 2006 test cycle at the NCAT Pavement Test Track preliminarily. Then the calibrated model was further validated by using the fatigue cracking data of two sections of the 2003 test cycle at the NCAT Pavement Test Track (Hu et al. 2012). It was found that the OT-based fatigue cracking prediction approach is a rational choice for modeling fatigue cracking development. The main features of the proposed OT-based fatigue cracking model include (a) incorporation of both crack initiation and crack propagation stages; (b) involving fracture properties of every asphalt layer, if the flexible pavement has multiple asphalt layers and each layer material is different; (c) use of a simple OT for determining the fracture properties. However, further model validation and calibration with additional independent field data, varied traffic load spectrums, different environmental conditions, and different materials are still required.
2.5.3 Evaluation of Material Properties The sensitivity and effects of material properties of asphalt mixtures in OT have been evaluated in TTI since the 2000s (Zhou et al. 2003, Zhou et al. 2005, and Walubita et al. 2012). Influences of asphalt content, asphalt performance grade, air void, RAP, etc. on cracking life were investigated. In general, it was found that the reflective cracking life of asphalt mixtures will decrease with an increase of the performance grade of the asphalt binder. Increasing the asphalt content and decreasing performance grade (PG) binder grades will significantly improve
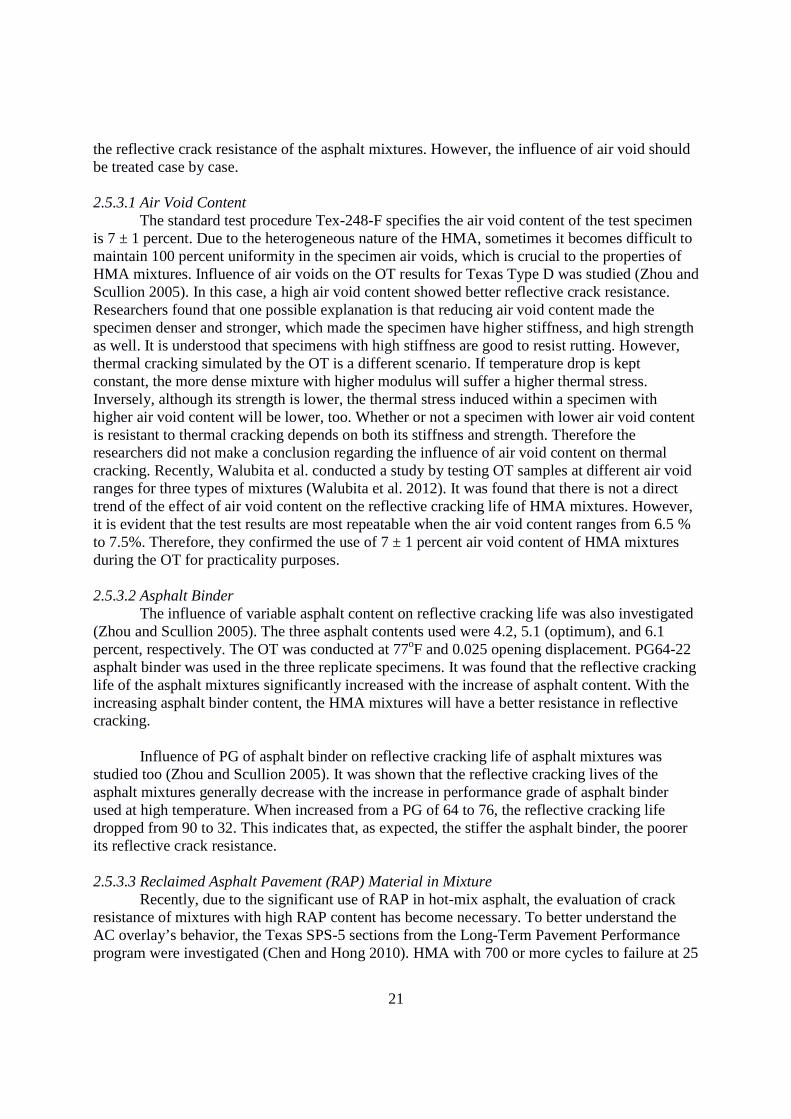
21
the reflective crack resistance of the asphalt mixtures. However, the influence of air void should be treated case by case. 2.5.3.1 Air Void Content
The standard test procedure Tex-248-F specifies the air void content of the test specimen is 7 ± 1 percent. Due to the heterogeneous nature of the HMA, sometimes it becomes difficult to maintain 100 percent uniformity in the specimen air voids, which is crucial to the properties of HMA mixtures. Influence of air voids on the OT results for Texas Type D was studied (Zhou and Scullion 2005). In this case, a high air void content showed better reflective crack resistance. Researchers found that one possible explanation is that reducing air void content made the specimen denser and stronger, which made the specimen have higher stiffness, and high strength as well. It is understood that specimens with high stiffness are good to resist rutting. However, thermal cracking simulated by the OT is a different scenario. If temperature drop is kept constant, the more dense mixture with higher modulus will suffer a higher thermal stress. Inversely, although its strength is lower, the thermal stress induced within a specimen with higher air void content will be lower, too. Whether or not a specimen with lower air void content is resistant to thermal cracking depends on both its stiffness and strength. Therefore the researchers did not make a conclusion regarding the influence of air void content on thermal cracking. Recently, Walubita et al. conducted a study by testing OT samples at different air void ranges for three types of mixtures (Walubita et al. 2012). It was found that there is not a direct trend of the effect of air void content on the reflective cracking life of HMA mixtures. However, it is evident that the test results are most repeatable when the air void content ranges from 6.5 % to 7.5%. Therefore, they confirmed the use of 7 ± 1 percent air void content of HMA mixtures during the OT for practicality purposes.
2.5.3.2 Asphalt Binder The influence of variable asphalt content on reflective cracking life was also investigated (Zhou and Scullion 2005). The three asphalt contents used were 4.2, 5.1 (optimum), and 6.1 percent, respectively. The OT was conducted at 77oF and 0.025 opening displacement. PG64-22 asphalt binder was used in the three replicate specimens. It was found that the reflective cracking life of the asphalt mixtures significantly increased with the increase of asphalt content. With the increasing asphalt binder content, the HMA mixtures will have a better resistance in reflective cracking. Influence of PG of asphalt binder on reflective cracking life of asphalt mixtures was studied too (Zhou and Scullion 2005). It was shown that the reflective cracking lives of the asphalt mixtures generally decrease with the increase in performance grade of asphalt binder used at high temperature. When increased from a PG of 64 to 76, the reflective cracking life dropped from 90 to 32. This indicates that, as expected, the stiffer the asphalt binder, the poorer its reflective crack resistance. 2.5.3.3 Reclaimed Asphalt Pavement (RAP) Material in Mixture
Recently, due to the significant use of RAP in hot-mix asphalt, the evaluation of crack resistance of mixtures with high RAP content has become necessary. To better understand the AC overlay’s behavior, the Texas SPS-5 sections from the Long-Term Pavement Performance program were investigated (Chen and Hong 2010). HMA with 700 or more cycles to failure at 25

22
oC is classified as an excellent material to resist reflective cracking. Field cores from three virgin AC sections and three RAP sections were evaluated the using overlay tester. The test specimens for the OT were 6 inches long, 3 inches wide, and 3 inches high, and were cut from the 6-inch diameter field cores collected in October 2008. OT results showed that all cores from three virgin AC sections exceeded 2000 cycles. However, the OT results from the three RAP sections lasted 414, 8, and 6 cycles, respectively. Although the RAP sections had low OT results, they have performed satisfactorily for over 17 years. The OT results ranked the AC overlay well with the field performance data, as cores from the virgin AC sections have a significantly higher number of cycles to failure than those from the RAP sections.
Vahidi et al. studied the effects of ground tire rubber (GTR) and treated ground tire
rubber (TGTR) on asphalt binder and high-RAP mixtures using the overlay test in Massachusetts (Vahidi et al. 2014). A standard 0.025 inch opening displacement was used throughout the study. It can be found that OT cycles decreased significantly with the GTR/TGTR and RAP materials added into the mixture. Reflective Cracking Results show that incorporating RAP and rubber made the mixtures more prone to reflective cracking.
It could be found that very stiff asphalt mixtures (i.e., high RAP mixtures) might fail in a
low number of cycles with an opening width of 0.025 in. On the other hand, the 0.025 in. opening displacement was derived under 30oF daily temperature variation in Texas. The mixtures used in other states might experience different climatic conditions. Therefore, the maximum opening displacement may need to be varied to simulate conditions. NCAT studied the resistance of five mixtures both with and without RAP content to reflective cracking using the Tex-248-F test procedure, except that the maximum displacement was 0.013 in. instead of 0.025 in. (Tran et al. 2012 and Willis et al. 2013). It was found that the virgin mix had the highest average number of cycles to failure and that the result was statistically different from those of the recycled mixes. Among the recycled mixtures, the 20% RAP plus 5% RAS mix with rejuvenator had the highest average number of cycles to failure, followed by 50% RAP mix with rejuvenator, 20% RAP plus 5% RAS mix, and 50% RAP mix; however, the differences in the number of cycles to failure among the recycled mixes were not statistically significant (Tran et al. 2012).
NCAT also studied RAP mixtures using the overlay tester to determine the optimal way
to improve the durability of RAP mixtures. OT results of asphalt mixtures with 10%, 25%, and 50% RAP were evaluated, respectively. It was found that increasing the RAP content beyond 10 percent drastically decreased the cycles to failure in this extremely high-strain test. Incorporating warm mixture asphalt (WMA) technology in the mixture had minimal effect on the mixture performance. A softer binder can improve the performance of mixtures more than WMA (Willis et al. 2013).
Kodippily et al. studied the performance of recycled asphalt pavement mixes in New
Zealand (Kodippily et al. 2014). Samples were prepared from three mixes containing 15% RAP, 30% RAP, and a control mix. It can be found that the overlay test cycles reached in the 15% RAP mix were similar to the virgin HMA mix, where in the 15% RAP mix all three samples reached close to 1200 loading cycles. In contrast, the samples from the 30% RAP mix reached significantly lower number of cycles in comparison to the other two mixes, which is
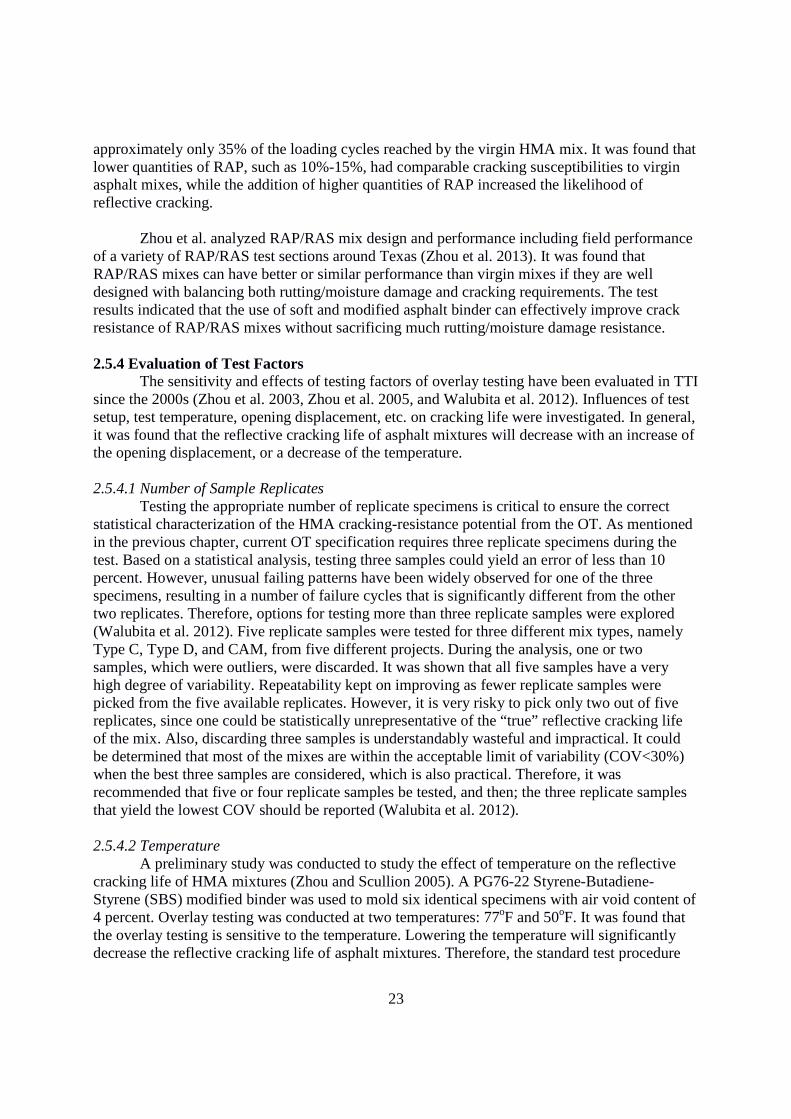
23
approximately only 35% of the loading cycles reached by the virgin HMA mix. It was found that lower quantities of RAP, such as 10%-15%, had comparable cracking susceptibilities to virgin asphalt mixes, while the addition of higher quantities of RAP increased the likelihood of reflective cracking.
Zhou et al. analyzed RAP/RAS mix design and performance including field performance
of a variety of RAP/RAS test sections around Texas (Zhou et al. 2013). It was found that RAP/RAS mixes can have better or similar performance than virgin mixes if they are well designed with balancing both rutting/moisture damage and cracking requirements. The test results indicated that the use of soft and modified asphalt binder can effectively improve crack resistance of RAP/RAS mixes without sacrificing much rutting/moisture damage resistance. 2.5.4 Evaluation of Test Factors
The sensitivity and effects of testing factors of overlay testing have been evaluated in TTI since the 2000s (Zhou et al. 2003, Zhou et al. 2005, and Walubita et al. 2012). Influences of test setup, test temperature, opening displacement, etc. on cracking life were investigated. In general, it was found that the reflective cracking life of asphalt mixtures will decrease with an increase of the opening displacement, or a decrease of the temperature. 2.5.4.1 Number of Sample Replicates
Testing the appropriate number of replicate specimens is critical to ensure the correct statistical characterization of the HMA cracking-resistance potential from the OT. As mentioned in the previous chapter, current OT specification requires three replicate specimens during the test. Based on a statistical analysis, testing three samples could yield an error of less than 10 percent. However, unusual failing patterns have been widely observed for one of the three specimens, resulting in a number of failure cycles that is significantly different from the other two replicates. Therefore, options for testing more than three replicate samples were explored (Walubita et al. 2012). Five replicate samples were tested for three different mix types, namely Type C, Type D, and CAM, from five different projects. During the analysis, one or two samples, which were outliers, were discarded. It was shown that all five samples have a very high degree of variability. Repeatability kept on improving as fewer replicate samples were picked from the five available replicates. However, it is very risky to pick only two out of five replicates, since one could be statistically unrepresentative of the “true” reflective cracking life of the mix. Also, discarding three samples is understandably wasteful and impractical. It could be determined that most of the mixes are within the acceptable limit of variability (COV<30%) when the best three samples are considered, which is also practical. Therefore, it was recommended that five or four replicate samples be tested, and then; the three replicate samples that yield the lowest COV should be reported (Walubita et al. 2012).
2.5.4.2 Temperature
A preliminary study was conducted to study the effect of temperature on the reflective cracking life of HMA mixtures (Zhou and Scullion 2005). A PG76-22 Styrene-Butadiene-Styrene (SBS) modified binder was used to mold six identical specimens with air void content of 4 percent. Overlay testing was conducted at two temperatures: 77oF and 50oF. It was found that the overlay testing is sensitive to the temperature. Lowering the temperature will significantly decrease the reflective cracking life of asphalt mixtures. Therefore, the standard test procedure
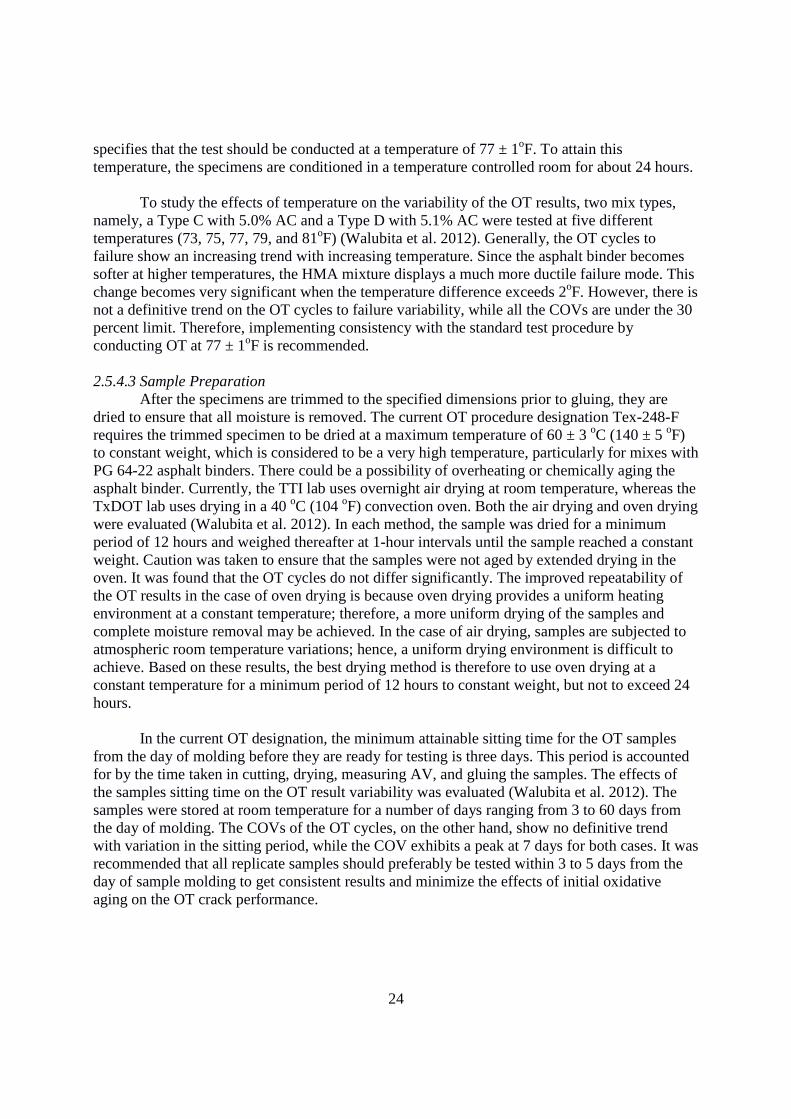
24
specifies that the test should be conducted at a temperature of 77 ± 1oF. To attain this temperature, the specimens are conditioned in a temperature controlled room for about 24 hours.
To study the effects of temperature on the variability of the OT results, two mix types,
namely, a Type C with 5.0% AC and a Type D with 5.1% AC were tested at five different temperatures (73, 75, 77, 79, and 81oF) (Walubita et al. 2012). Generally, the OT cycles to failure show an increasing trend with increasing temperature. Since the asphalt binder becomes softer at higher temperatures, the HMA mixture displays a much more ductile failure mode. This change becomes very significant when the temperature difference exceeds 2oF. However, there is not a definitive trend on the OT cycles to failure variability, while all the COVs are under the 30 percent limit. Therefore, implementing consistency with the standard test procedure by conducting OT at 77 ± 1oF is recommended. 2.5.4.3 Sample Preparation After the specimens are trimmed to the specified dimensions prior to gluing, they are dried to ensure that all moisture is removed. The current OT procedure designation Tex-248-F requires the trimmed specimen to be dried at a maximum temperature of 60 ± 3 oC (140 ± 5 oF) to constant weight, which is considered to be a very high temperature, particularly for mixes with PG 64-22 asphalt binders. There could be a possibility of overheating or chemically aging the asphalt binder. Currently, the TTI lab uses overnight air drying at room temperature, whereas the TxDOT lab uses drying in a 40 oC (104 oF) convection oven. Both the air drying and oven drying were evaluated (Walubita et al. 2012). In each method, the sample was dried for a minimum period of 12 hours and weighed thereafter at 1-hour intervals until the sample reached a constant weight. Caution was taken to ensure that the samples were not aged by extended drying in the oven. It was found that the OT cycles do not differ significantly. The improved repeatability of the OT results in the case of oven drying is because oven drying provides a uniform heating environment at a constant temperature; therefore, a more uniform drying of the samples and complete moisture removal may be achieved. In the case of air drying, samples are subjected to atmospheric room temperature variations; hence, a uniform drying environment is difficult to achieve. Based on these results, the best drying method is therefore to use oven drying at a constant temperature for a minimum period of 12 hours to constant weight, but not to exceed 24 hours. In the current OT designation, the minimum attainable sitting time for the OT samples from the day of molding before they are ready for testing is three days. This period is accounted for by the time taken in cutting, drying, measuring AV, and gluing the samples. The effects of the samples sitting time on the OT result variability was evaluated (Walubita et al. 2012). The samples were stored at room temperature for a number of days ranging from 3 to 60 days from the day of molding. The COVs of the OT cycles, on the other hand, show no definitive trend with variation in the sitting period, while the COV exhibits a peak at 7 days for both cases. It was recommended that all replicate samples should preferably be tested within 3 to 5 days from the day of sample molding to get consistent results and minimize the effects of initial oxidative aging on the OT crack performance.
25
2.5.4.4 Epoxy Gluing The current test designation Tex-248-F requires using 2-part, 2-ton epoxy for gluing the
samples to the overlay testing plates. While it specifies the detailed properties of the glue type, it does not have any specific instructions on the amount of glue to be used or how the glue should be applied. Therefore, three different glue quantities were investigated for a CAM mix (Walubita et al. 2012). It was found that both the average OT cycles and COV reach optimum level when about 16 g of the 2-part, 2-ton epoxy was used to glue the sample to the OT plates. For the OT plate utilized, 14 g was found to be insufficient, while 18 g was too excessive and wasteful with too much spillage. The researchers also investigated different glue types. Based on the test results, the 2-part 2-ton epoxy at 16 ± 0.5 g is the best choice considering economy, workability, performance, and consistency in the OT results. However, in the current Texas test procedure, it was specified that 12 g of the 2-part, 2-ton epoxy should be used to glue the sample to the OT plates.
2.5.4.5 Opening Displacement
The opening displacement is another major factor affecting the reflective cracking. A PG76-22 SBS modified binder was used to mold six identical specimens with the target air void content of 4 percent. Overlay testing was conducted at 77oF with opening displacement of 0.025 in and 0.035 in, respectively (Zhou and Scullion 2005). This indicates that overlay testing results are sensitive to the opening displacement. With increasing opening displacement, the reflective cracking life of asphalt mixtures decreases.
Walubita et al. also tested the effect of the opening displacement on the OT results and
OT result variability (Walubita et al. 2012). A Type C plant mix (5.0 percent AC) was tested at three different opening displacements (0.015, 0.020, 0.025 in), which is shown in Figure 2.11. It is clear that the average OT cycles decrease significantly with increasing opening displacement. However, OT variability does not show any definitive trend of variation with changing opening displacement. It was concluded that decreasing the opening displacement from 0.025 in. to 0.015 in. improves performance, but without major changes in the peak load or variability. However, reducing the test opening displacement erroneously will pass a poor crack-resistance mix and requires validation with field data.
Figure 2.11. Effect of Opening Displacement on OT Cycles (Walubita et al. 2012)
26
Walubita et al. then tested three types of mixtures with the opening displacement varying
from 0.0125 in. to 0.025 in. applied at a loading frequency of 10 s/cycle and a test temperature of 77oF (Walubita et al. 2013). The results are shown in Figure 2.12. It was found that there is a significant impact on the OT cycles with decreasing opening displacement, while there is no definitive trend or consistent effect on variability in terms of the COV. Ma et al. proposed some improvements to overlay test to determine the crack resistance of asphalt mixtures (Ma et al. 2014). Five mixtures used in the bottom asphalt layers of the five test sections of the Group Experiment in the 2009 research cycle of the NCAT Pavement Test Track were included. Some mixtures had 50% RAP content. The overlay test was conducted in the Asphalt Mixture Performance Tester (AMPT) with three levels of maximum opening displacement (0.015 in. 0.0125 in., and 0.01 in.). Cracks are often seen propagated through the entire thickness of the specimen long before the applied load is reduced by 93% of the initiated load. Therefore, an alternative “normalized load × cycle” method was recommended to be used to determine the failure point instead of 93% load reduction method. The failure point for the overlay test can be determined in three steps: 1) the “normalized load × cycle” (NLC) is determined for each load cycle; 2) the NLC is plotted against the number of cycles; 3) the failure point is determined corresponding to the peak of the NLC curve. The results agreed with the previous research study that the opening displacement has a significant effect on the reflective cracking life of asphalt mixtures.
Figure 2.12. Effect of Opening Displacement on OT Cycles for Three Types of Mixture
(Walubita et al. 2013)
2.5.4.6 Sample Thickness Three HMA mixes were evaluated to study the effect of sample thickness on the OT
results (Walubita et al. 2013). The sample thickness was varied from 1.0 to 2.5 inches. The
27
standard OT parameters were utilized. For each mix and sample thickness, the research team molded and tested five replicate samples. The best three were selected in the analysis. It was found that the laboratory OT cracking performance of the mixes significantly improved with increasing sample thickness. However, no consistency or definitive trend was found on variability as measured in terms of COV. A sensitivity analysis was also conducted to compare the strain profile contours above the crack (Walubita et al. 2013). The results showed that, in the specimen thicker than 1.5 inches, the upper part of the specimen will be in the compression or very small tensile strains. Therefore, as a crack enters these low tensile strain or compressive zones, the crack growth rate decreases significantly. Based on these results, 1.5-inch thickness was recommended in the OT.
2.5.4.7 Loading Frequency
Walubita et al. also studied the effect of loading frequency on the OT results (Walubita et al. 2013). The loading frequency was varied from 5 to 20 seconds/cycle whiling maintain the displacement and test temperature at 0.025 inches and 77oF, respectively. Samples from the same batch for each mix type were specifically molded and tested. Although changing the loading frequency has some effect on the number of OT cycles, it offers little benefit in terms of optimizing repeatability and minimizing variability in the test results. Therefore, the current specification of 10 s/cycles should be maintained.
Since the overlay test conducted at small opening displacement could take much more
time than the standard test, it was suggested to increase the loading frequency from 0.1 Hz to 1.0 Hz (Ma et al. 2014). It was found that the overlay test may be conducted at 1.0 Hz to reduce testing time without significantly affecting the test variability. Although the test results conducted at 0.1 and 1.0 Hz are not statistically different, only one frequency should be used to evaluate different mixes in a project, while further evaluation needs to be performed to validate these findings for the overlay test.
28
CHAPTER 3
LABORATORY EXPERIMENTAL PROGRAM
3.1 General
The method of evaluating cracking performance of asphalt mixture in this research study was the OT. The test was reviewed in more detail in Chapter 2. Originally, the OT was specified by Tex-248-F. The test procedure has been revisited and improved to accommodate the Florida test methods on asphalt mixtures, which is shown in Appendix A. Some Florida test methods measuring asphalt concrete mixing and compaction, maximum theoretical specific gravity measurement, air void measurement, and sample preparations were adopted in the test procedure. In this study, a Servopac Gyratory Compactor and a Troxler Model 5950 Overlay Tester were used to compact the asphalt mixtures and measure the cracking performance of asphalt concrete, respectively.
The experimental program involved two stages: preliminary experimental study and
laboratory testing. During the preliminary experimental study, a relatively small amount of laboratory effort with several types of mix design was performed to verify the overlay test procedure currently available. A test plan was then formulated for implementing the subsequent laboratory evaluation. An overall test procedure was developed from the beginning of sample preparation to include the following steps: mixing and compacting of Superpave gyratory specimen, cutting of OT specimen, preparing of OT specimen on test plates, and conducting the OT.
The experimental program involved nine standard mix designs: three SP-12.5 mix
designs without RAP content, three SP-12.5 mix designs with 20% RAP; one SP-9.5 mix design without RAP content, one SP-9.5 mix design with 20% RAP; one SP-4.75 mix design with 20% RAP. In addition, the standard Superpave mixtures were also prepared using virgin asphalt binder (PG 67-22) and polymer-modified asphalt binder (PG 76-22) to evaluate the effect of polymer modification on the crack resistance of asphalt concrete mixtures. The physical characteristics of the materials used, including their aggregate properties, aggregate gradation, and mixture design series, are presented in detail in the following sections.
3.2 Preliminary Experimental Study
3.2.1 Mix Design For the purpose of preliminary study, one Georgia granite (GA 553) was selected as the
aggregate for the control mix in the overlay test. Three types of mix design for traffic level C & D were selected to represent commonly used Superpave mixtures in Florida. All of the aggregates and preliminary mix design formulas were obtained from C. W. Roberts Contracting, Inc. in Leon County, FL. One type of asphalt binder, PG 67-22 asphalt binder, was selected for the mix designs. The details of the mix designs are presented in Table 3.1. The job mix formulas
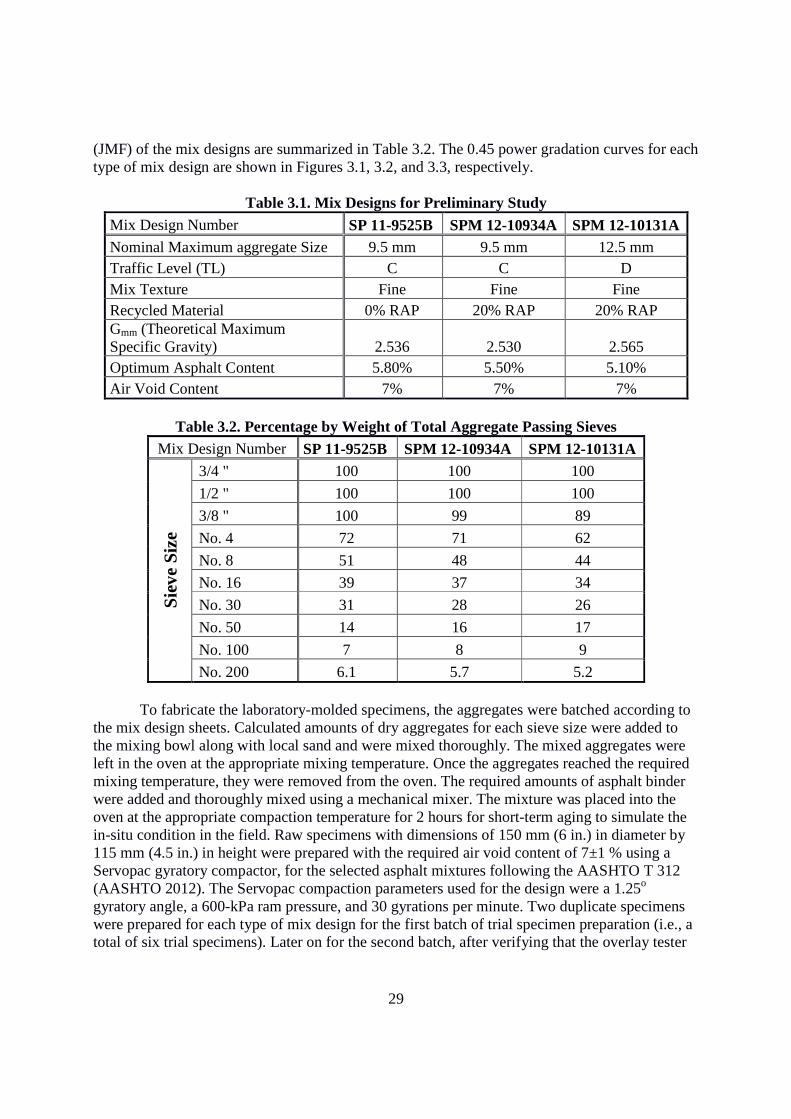
29
(JMF) of the mix designs are summarized in Table 3.2. The 0.45 power gradation curves for each type of mix design are shown in Figures 3.1, 3.2, and 3.3, respectively.
Table 3.1. Mix Designs for Preliminary Study
Mix Design Number SP 11-9525B SPM 12-10934A SPM 12-10131A Nominal Maximum aggregate Size 9.5 mm 9.5 mm 12.5 mm Traffic Level (TL) C C D Mix Texture Fine Fine Fine Recycled Material 0% RAP 20% RAP 20% RAP Gmm (Theoretical Maximum Specific Gravity) 2.536 2.530 2.565 Optimum Asphalt Content 5.80% 5.50% 5.10% Air Void Content 7% 7% 7%
Table 3.2. Percentage by Weight of Total Aggregate Passing Sieves
Mix Design Number SP 11-9525B SPM 12-10934A SPM 12-10131A
Sie
ve S
ize
3/4 " 100 100 100
1/2 " 100 100 100
3/8 " 100 99 89
No. 4 72 71 62
No. 8 51 48 44
No. 16 39 37 34
No. 30 31 28 26
No. 50 14 16 17
No. 100 7 8 9
No. 200 6.1 5.7 5.2
To fabricate the laboratory-molded specimens, the aggregates were batched according to the mix design sheets. Calculated amounts of dry aggregates for each sieve size were added to the mixing bowl along with local sand and were mixed thoroughly. The mixed aggregates were left in the oven at the appropriate mixing temperature. Once the aggregates reached the required mixing temperature, they were removed from the oven. The required amounts of asphalt binder were added and thoroughly mixed using a mechanical mixer. The mixture was placed into the oven at the appropriate compaction temperature for 2 hours for short-term aging to simulate the in-situ condition in the field. Raw specimens with dimensions of 150 mm (6 in.) in diameter by 115 mm (4.5 in.) in height were prepared with the required air void content of 7±1 % using a Servopac gyratory compactor, for the selected asphalt mixtures following the AASHTO T 312 (AASHTO 2012). The Servopac compaction parameters used for the design were a 1.25o gyratory angle, a 600-kPa ram pressure, and 30 gyrations per minute. Two duplicate specimens were prepared for each type of mix design for the first batch of trial specimen preparation (i.e., a total of six trial specimens). Later on for the second batch, after verifying that the overlay tester

was up running, an additional three duplicate specimens were prepared for the 12.5 mm mix design SPM 12-10131A.
Figure 3.1. 0.45 Power Gradation Curve for SP 11
Figure 3.2. 0.45 Power Gradation Curve for
Figure 3.3. 0.45 Power Gradation Curve for SPM 12
30
was up running, an additional three duplicate specimens were prepared for the 12.5 mm mix
Figure 3.1. 0.45 Power Gradation Curve for SP 11-9525B
Figure 3.2. 0.45 Power Gradation Curve for SPM 12-10934A
Figure 3.3. 0.45 Power Gradation Curve for SPM 12-10131A
was up running, an additional three duplicate specimens were prepared for the 12.5 mm mix
9525B
10934A
10131A
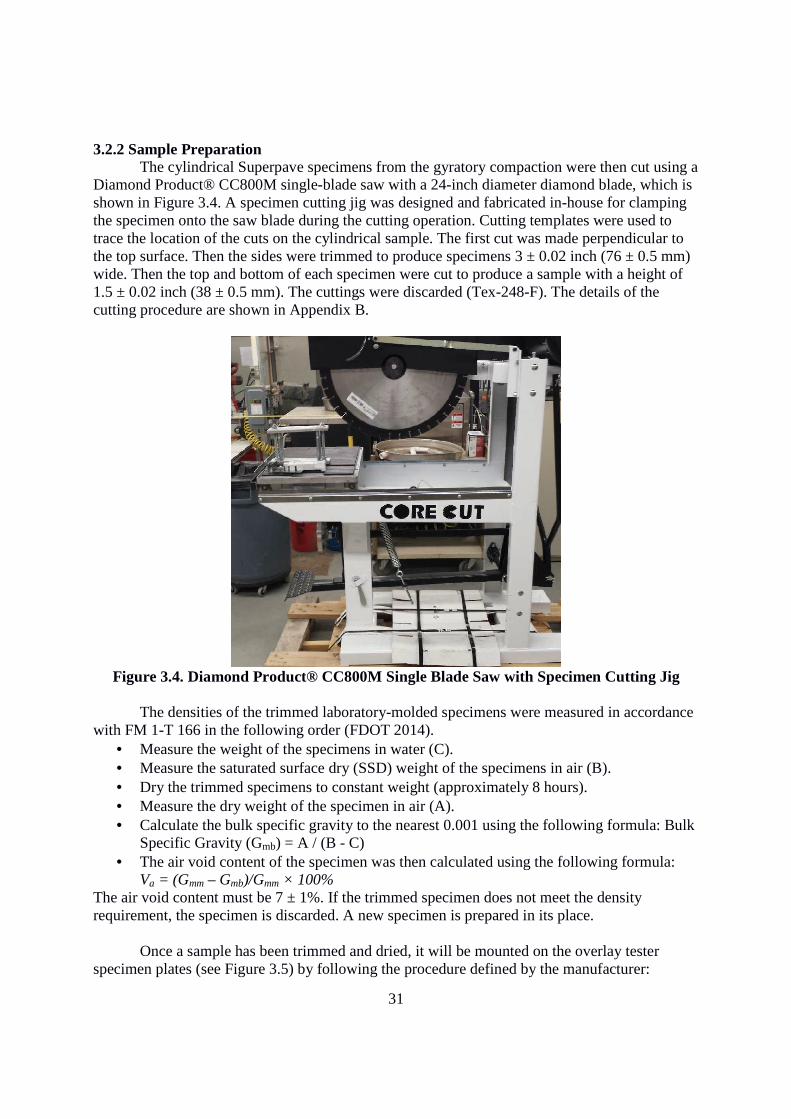
31
3.2.2 Sample Preparation The cylindrical Superpave specimens from the gyratory compaction were then cut using a
Diamond Product® CC800M single-blade saw with a 24-inch diameter diamond blade, which is shown in Figure 3.4. A specimen cutting jig was designed and fabricated in-house for clamping the specimen onto the saw blade during the cutting operation. Cutting templates were used to trace the location of the cuts on the cylindrical sample. The first cut was made perpendicular to the top surface. Then the sides were trimmed to produce specimens 3 ± 0.02 inch (76 ± 0.5 mm) wide. Then the top and bottom of each specimen were cut to produce a sample with a height of 1.5 ± 0.02 inch (38 ± 0.5 mm). The cuttings were discarded (Tex-248-F). The details of the cutting procedure are shown in Appendix B.
Figure 3.4. Diamond Product® CC800M Single Blade Saw with Specimen Cutting Jig
The densities of the trimmed laboratory-molded specimens were measured in accordance
with FM 1-T 166 in the following order (FDOT 2014). • Measure the weight of the specimens in water (C). • Measure the saturated surface dry (SSD) weight of the specimens in air (B). • Dry the trimmed specimens to constant weight (approximately 8 hours). • Measure the dry weight of the specimen in air (A). • Calculate the bulk specific gravity to the nearest 0.001 using the following formula: Bulk
Specific Gravity (Gmb) = A / (B - C) • The air void content of the specimen was then calculated using the following formula:
Va = (Gmm – Gmb)/Gmm × 100% The air void content must be 7 ± 1%. If the trimmed specimen does not meet the density requirement, the specimen is discarded. A new specimen is prepared in its place.
Once a sample has been trimmed and dried, it will be mounted on the overlay tester specimen plates (see Figure 3.5) by following the procedure defined by the manufacturer:
32
1. Place the setup plate assembly on a flat, stable surface. 2. Remove the straight edge from the setup plate using a 5/32” Allen wrench. Set the
straight edge and screws aside. 3. Place one of the specimen plates onto the setup plate so the middle holes line up. 4. Reattach the straight edge and tighten the screws. 5. Add the other specimen plate to the other side of the setup plate. 6. Place a piece of tape (Scotch® Magic Tape ¾ in.) over the gap between the plates and
over the two middle holes of either specimen plate. This will ensure that adhesive does not seep between the plates and into the middle holes.
7. Insert the eight thumb screws and hand tighten to secure the assembly. 8. Spread 12g Devcon® 2-Part 2-ton epoxy on the large side of the sample to glue the
sample to the specimen plates. Ensure that each specimen is centered and aligned parallel to the edge of the specimen plates.
9. Place a 10 lb (4.5 kg) block on the sample to ensure a complete bond is formed. 10. Allow the epoxy to cure (12 – 24 hours), so that the sample can be lifted from the mount
(Figure 3.6).
Figure 3.5. Overlay Tester Setup Plate and Specimen Plates

33
Figure 3.6. Samples on the Specimen Plates and the Setup Plate after Curing of Epoxy
3.2.3 Overlay Test The overlay test was conducted using the Troxler Model 5950 Overlay Tester. A photo
and drawing of the overlay tester is shown in Figure 3.7. The overlay tester is a computer controlled electrohydraulic system that applies a repeated direct tension load to asphalt mixture specimens. It consists of two steel plates, one fixed and the other movable horizontally to simulate the opening and closing of joints or cracks in the old pavement beneath an overlay. The overlay test can be conducted in controlled displacement mode under the following conditions: 1) temperature: 41 – 104°F (5 – 40°C); 2) opening displacement: 0 – 0.08 inch (0 – 2 mm); 3) loading rate: 10 min. per cycle – 1 second per cycle. The loading is applied in a cyclic triangular waveform with constant magnitude. This test method measures the number of cycles to failure. The load, displacement, and temperature are recorded. A recent test procedure Tex-248-F was introduced by TxDOT for the standard overlay test (TxDOT 2014). The test procedure specifies that the density of the trimmed test specimen must be 93 ± 1%. The specimen diameter must be 6 ± 0.1 in. and the height of the test specimen should be 1.5 ± 0.02 in. The sliding block applies tension in a cyclic triangular waveform to a constant maximum displacement of 0.025 inch. The sliding block reaches the maximum displacement and then returns to its initial position within 10 seconds. Testing is performed at a constant temperature of 77±1oF. The Troxler Model 5950 Overlay Tester is controlled entirely through preinstalled software on the included laptop. A visual representation of the software is shown in Figure 3.8.
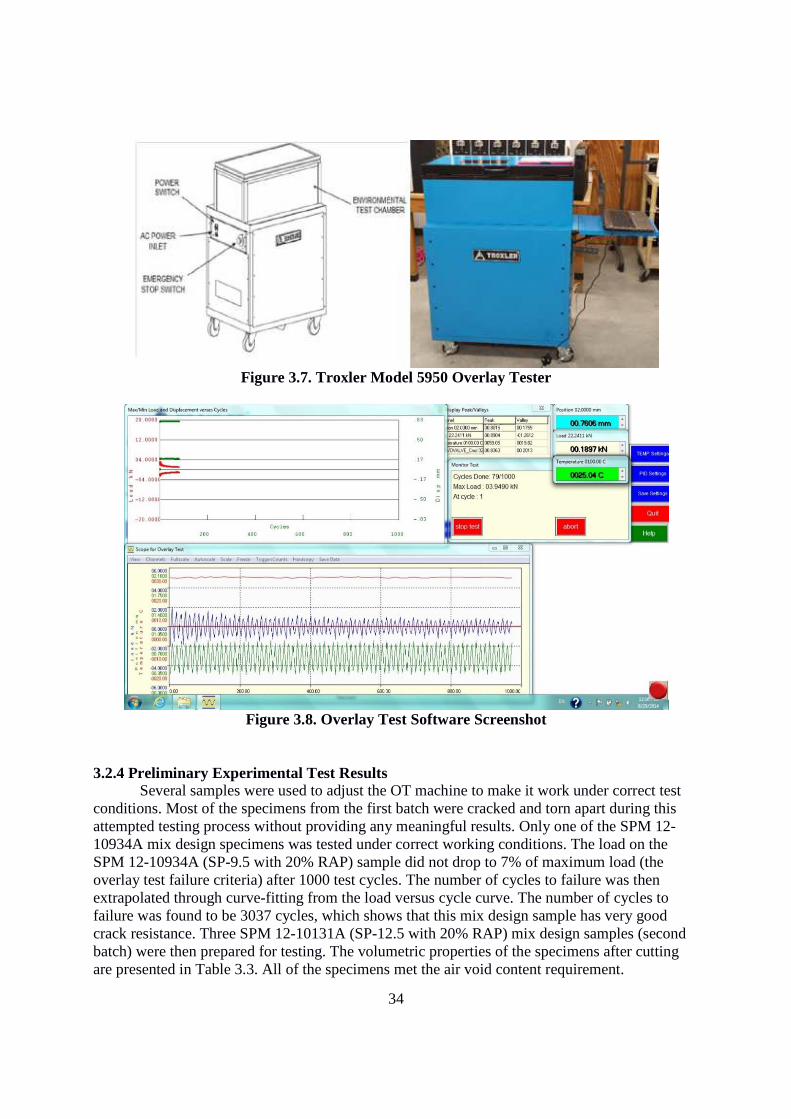
34
Figure 3.7. Troxler Model 5950 Overlay Tester
Figure 3.8. Overlay Test Software Screenshot
3.2.4 Preliminary Experimental Test Results Several samples were used to adjust the OT machine to make it work under correct test
conditions. Most of the specimens from the first batch were cracked and torn apart during this attempted testing process without providing any meaningful results. Only one of the SPM 12-10934A mix design specimens was tested under correct working conditions. The load on the SPM 12-10934A (SP-9.5 with 20% RAP) sample did not drop to 7% of maximum load (the overlay test failure criteria) after 1000 test cycles. The number of cycles to failure was then extrapolated through curve-fitting from the load versus cycle curve. The number of cycles to failure was found to be 3037 cycles, which shows that this mix design sample has very good crack resistance. Three SPM 12-10131A (SP-12.5 with 20% RAP) mix design samples (second batch) were then prepared for testing. The volumetric properties of the specimens after cutting are presented in Table 3.3. All of the specimens met the air void content requirement.
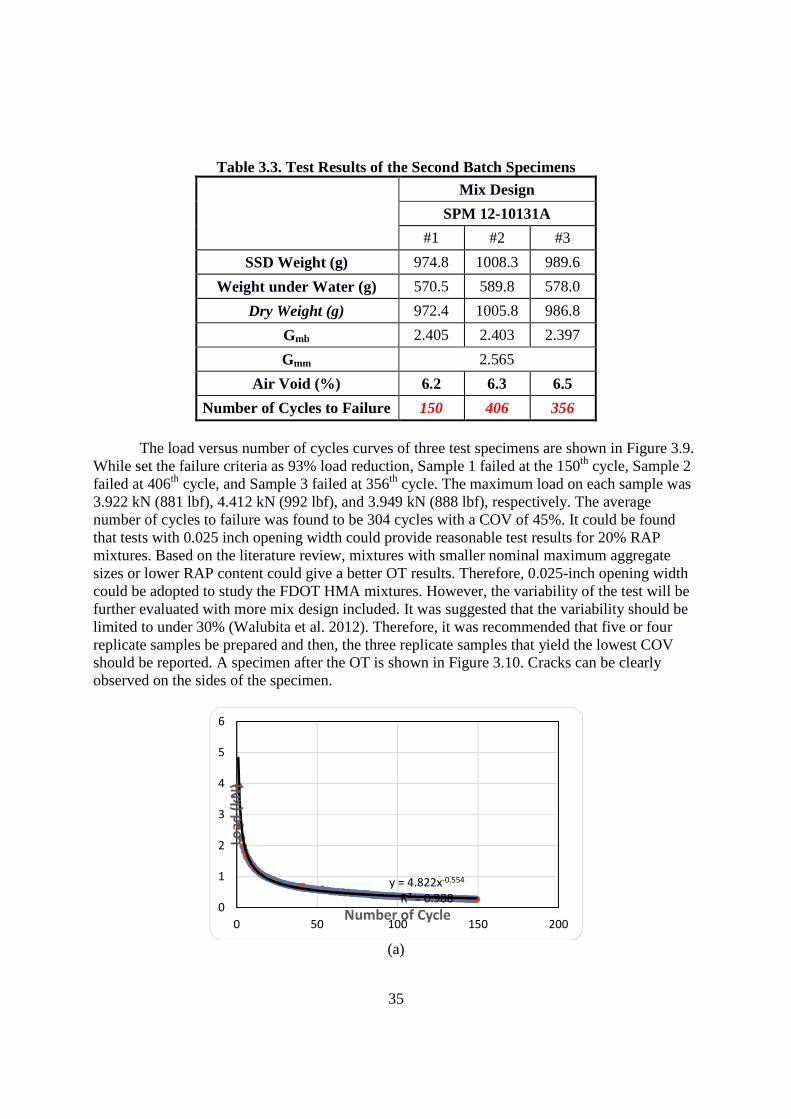
35
Table 3.3. Test Results of the Second Batch Specimens
Mix Design
SPM 12-10131A
#1 #2 #3
SSD Weight (g) 974.8 1008.3 989.6
Weight under Water (g) 570.5 589.8 578.0
Dry Weight (g) 972.4 1005.8 986.8
Gmb 2.405 2.403 2.397
Gmm 2.565
Air Void (%) 6.2 6.3 6.5
Number of Cycles to Failure 150 406 356
The load versus number of cycles curves of three test specimens are shown in Figure 3.9.
While set the failure criteria as 93% load reduction, Sample 1 failed at the 150th cycle, Sample 2 failed at 406th cycle, and Sample 3 failed at 356th cycle. The maximum load on each sample was 3.922 kN (881 lbf), 4.412 kN (992 lbf), and 3.949 kN (888 lbf), respectively. The average number of cycles to failure was found to be 304 cycles with a COV of 45%. It could be found that tests with 0.025 inch opening width could provide reasonable test results for 20% RAP mixtures. Based on the literature review, mixtures with smaller nominal maximum aggregate sizes or lower RAP content could give a better OT results. Therefore, 0.025-inch opening width could be adopted to study the FDOT HMA mixtures. However, the variability of the test will be further evaluated with more mix design included. It was suggested that the variability should be limited to under 30% (Walubita et al. 2012). Therefore, it was recommended that five or four replicate samples be prepared and then, the three replicate samples that yield the lowest COV should be reported. A specimen after the OT is shown in Figure 3.10. Cracks can be clearly observed on the sides of the specimen.
(a)
y = 4.822x-0.554
R² = 0.9880
1
2
3
4
5
6
0 50 100 150 200
Loa
d (
kN
)
Number of Cycle
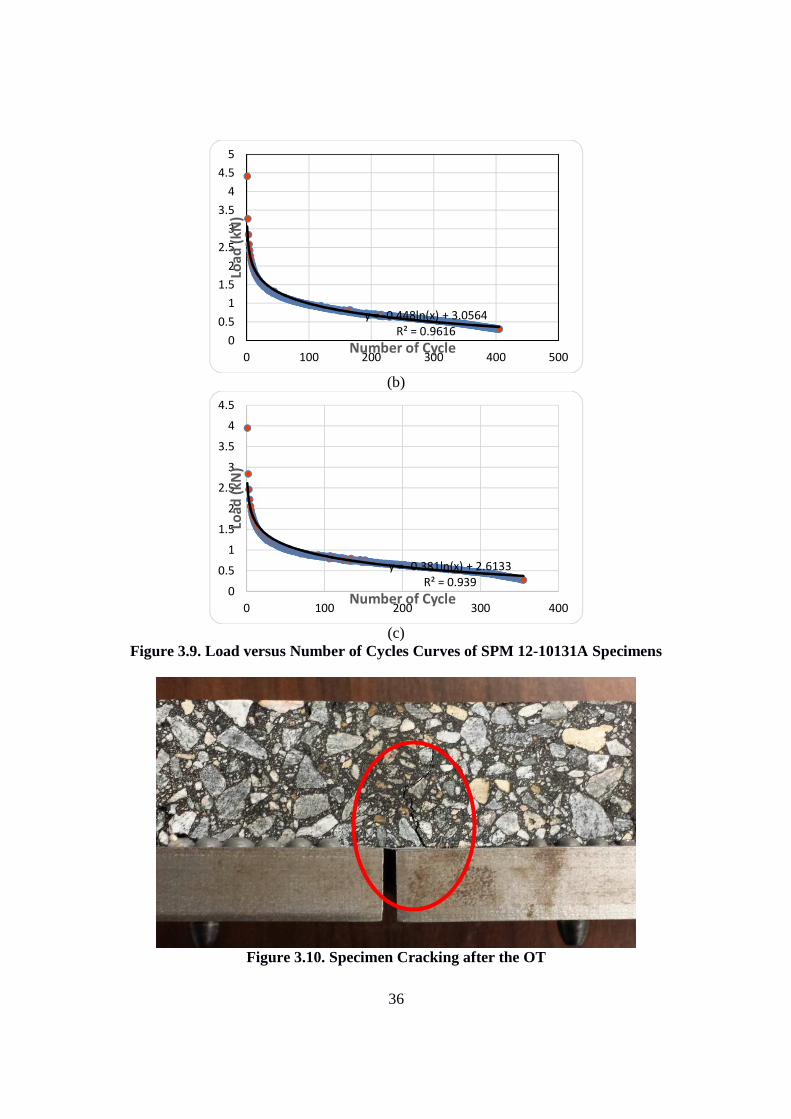
36
(b)
(c)
Figure 3.9. Load versus Number of Cycles Curves of SPM 12-10131A Specimens
Figure 3.10. Specimen Cracking after the OT
y = -0.448ln(x) + 3.0564
R² = 0.96160
0.5
1
1.5
2
2.5
3
3.5
4
4.5
5
0 100 200 300 400 500
Loa
d (
kN
)
Number of Cycle
y = -0.381ln(x) + 2.6133
R² = 0.9390
0.5
1
1.5
2
2.5
3
3.5
4
4.5
0 100 200 300 400
Loa
d (
kN
)
Number of Cycle
37
3.2.5 Test Plan A test plan for the research study was developed based on the preliminary experimental work to evaluate common Florida asphalt mixtures using the OT. The proposed test plan was discussed in detail and subsequently approved in a meeting held on July 31, 2014, at the FDOT Central Office in Tallahassee. The proposed test plan and the significant factors for evaluation are presented in Table 1.1. Granite will be used as the aggregates for the asphalt mixtures. The number of mix designs to be evaluated is indicated in the parentheses. The effects of nominal maximum aggregate size, asphalt binder type, and RAP content will be evaluated. The required number of overlay test samples is summarized in Table 3.4. A total of 51 (48+3) overlay specimens will be tested for the laboratory evaluation phase of the project. The 0.025-inch opening width will be used in the OT throughout the evaluation of FDOT asphalt mixtures. In addition, the OT will be conducted on one mix design using a 0.0125-inch displacement to evaluate the effect of opening displacement.
Table 3.4. Number of Samples in the Proposed Test Plan
Mix # NMAS
(Granite) Asphalt Binder RAP # of OT
Specimen Comment 1, 2, 3 12.5 mm PG 67-22 0% 9 Control 4, 5, 6 12.5 mm PG 67-22 20% 9 7, 8, 9 12.5 mm PG 76-22 (PMA) 0% 9
10, 11, 12 12.5 mm PG 76-22 (PMA) 20% 9 13 9.5 mm PG 76-22 (PMA) 0 3 14 9.5 mm PG 76-22 (PMA) 20% 3 15 4.75 mm PG 67-22 20% 3 16 4.75 mm PG 76-22 (PMA) 20% 3
TOTAL 48
3.3 Laboratory Experimental Study
3.3.1 Superpave Specimen Preparation Two Georgia granites (GA553 and GA185) and one Nova Scotia granite (NS315) were
selected as the aggregate for the mixtures in the mix designs, respectively. The mix designs for traffic level C& E were selected to represent commonly used Superpave mixtures in Florida, which are shown in Appendix D. The aggregates and preliminary mix design formulas were obtained from four asphalt plants: Anderson Columbia Company, Inc. in Lake City (GA553), Tampa Pavement Constructors in Tampa (NS315), Atlantic Coast Asphalt in Jacksonville (GA185), and Middlesex Asphalt, LLC in Orlando (GA553). Two types of asphalt binder from Mariani Asphalt, PG 67-22 virgin asphalt binder and PG 76-22 polymer modified binder (PMA), were selected for the mix designs. The details of the mix designs are presented in Table 3.5. The job mix formulas (JMF) of the mix designs are summarized in Table 3.6. A representative 0.45 power gradation curve of mix design is shown in Figures 3.11. The detailed 0.45 power gradation curves for the mix designs are shown in Appendix B. The grade of asphalt cement used in mixtures is also an important factor that can affect the crack resistance of asphalt mixtures.
38
The unmodified asphalt binder PG 67-22 report and the polymer-modified asphalt binder PG 76-22 report are summarized in Appendix Tables B-1 and B-2, respectively.
Figure 3.11. 0.45 Power Gradation Curve for Mix Design SPM 13-11076A
To fabricate the laboratory-molded specimens, the aggregates were batched according to
the mix design sheets. Calculated amounts of dry aggregates for each sieve size were added to the mixing bowl and mixed thoroughly. The mixed aggregates were left in the oven at the appropriate mixing temperature. Once the aggregates reached the required mixing temperature, they were removed from the oven. The required amounts of asphalt binder were added and thoroughly mixed using a mechanical mixer. The mixture was placed into the oven at the appropriate compaction temperature for two hours for short-term aging to simulate the in-situ condition in the field. Raw specimens with dimensions of 150 mm (6 in.) in diameter by 115 mm (4.5 in.) in height were prepared with the required air void content of 9 % (to achieve 7 % air void in the middle part for OT) using a Servopac gyratory compactor. Three duplicate specimens were prepared for each type of mix design. The maximum theoretical specific gravities were measured using Rice maximum theoretical specific gravity method specified in FM 1-T 209 test method (FDOT 2015).
3.3.2 Overlay Test The Superpave gyratory compacted specimens were then cut following the same
procedure developed in the preliminary experimental study. A new specimen-cutting fixture was also designed and fabricated in-house for a precise cutting on the OT specimens. This new aluminum cutting table consists of a movable plate on a fixed plate, as shown in Figure 3.12. The displacement of the movable table can be accurately controlled by a threaded rod, which is shown in Figure 3.13. One rotation of the handle equals to 0.05-inch movement of the table.
39
Cutting templates were used to trace the location of the cuts on the cylindrical sample. The details of the new cutting procedure are also shown in Appendix B.
Figure 3.12. Aluminum Cutting Table
Figure 3.13. Threaded Rod for Displacement Control

40
The overlay test was conducted using the Troxler Model 5950 Overlay Tester. This test method measures the number of cycles to failure. The failure criteria is 93% peak load reduction, which means the peak load drops below 7% of the peak load at the first cycle. The limit of the test cycle was set to 1000 cycles. The test stops at 93% load reduction if the number of cycles to failure is less than 1000 cycles. If the load reduction is less than 93% at the 1000th cycle, then the test stops at the 1000th cycle. The peak load at each cycle, displacement at each cycle, number of cycles, and test temperature are recorded. Based on the test procedure, three replicate specimens are needed for each type of mixture. The OT has to be finished within five days after the compaction of Superpave specimen. It usually takes one to two weeks to finish the tests for each type of mixture.
3.3.3 Supplemental Overlay Test Supplemental tests were conducted on SP-4.75 asphalt mixtures (LD12-2653A) with PG
67-22 and PG 76-22 (PMA) binders during the week of July 13 through July 17, 2015 to verify the test results on SP-4.75 mixtures obtained earlier. Three specimens were prepared for PG 67-22 mixtures, and one specimen was prepared for PG 76-22 (PMA) mixture. All four specimens were mixed with 20% RAP. The dimensions of the specimens are shown in Appendix Table C-1 (F).

41
Table 3.5. Superpave Mix Designs
Mix Design SPM 13-11076A
SPM 12-10895A
SPM 13-11035A
SPM 14-12576A
SPM 14-12199A
SP 14-12171B
SPM 14-12201A
SPM 14-12247A
LD 12-2653A
Asphalt Plant Anderson Columbia
Company, Inc. Tampa Pavement
Constructors Atlantic Coast
Asphalt Atlantic Coast
Asphalt
Middlesex Asphalt,
LLC Aggregate Type GA553 NS315 GA 185 GA 185 GA553
Nominal Maximum
Aggregate Size 12.5 mm 12.5 mm 12.5 mm 12.5 mm 12.5 mm 12.5 mm 9.5 mm 9.5 mm 4.75 mm
Traffic Level (TL) C E C E C C C C C Mix Texture Fine Fine Fine Fine Fine Fine Fine Fine Fine
Recycled Material 0% 20% 0% 20% 0% 20% 0% 20% 20% Gse 2.738 2.714 2.603 2.610 2.687 2.672 2.681 2.665 2.687
Gmm PG 67-22 2.562 2.557 2.449 2.462 2.513 2.513 2.493 PG 76-22 2.565 2.557 2.446 2.464 2.515 2.514 2.481 2.500 2.495
Mix Design Air Void Content
4.0% 4.0% 4.0% 4.0% 4.0% 4.0% 4.0% 4.0% 5.0%
Optimum Asphalt Content
5.2% 5.0% 5.6% 5.1% 5.5% 5.0% 6.1% 5.6% 6.4%

42
Table 3.6. Percentage by Weight of Total Aggregate Passing Sieves
Sieve Size SPM 13-11076A
SPM 12-10895A
SPM 13-11035A
SPM 14-12576A
SPM 14-12199A
SP 14-12171B
3/4" (19 mm) 100 100 100 100 100 100
1/2" (12.5 mm) 100 100 99 99 99 99 3/8" (9.5 mm) 88 88 89 89 89 89
No. 4 (4.75 mm) 66 65 67 69 70 58
No. 8 (2.36 mm) 45 47 47 54 50 39
No. 16 (1.18 mm) 32 34 33 40 35 29 No. 30 (600 μm) 23 25 25 31 25 23 No. 50 (300 µm) 15 17 16 22 18 18
No. 100 (150 µm) 9 10 8 9 9 9 No. 200 (75 µm) 5.2 5.0 4.0 5.3 4.1 4.4
Sieve Size SPM 14-12201A
SPM 14-12247A LD 12-2653A
3/4" (19 mm) 100 100 100 1/2" (12.5 mm) 100 100 100
3/8" (9.5 mm) 100 99 99 No. 4 (4.75 mm) 74 70 96
No. 8 (2.36 mm) 50 47 77
No. 16 (1.18 mm) 35 35 56 No. 30 (600 µm) 25 27 44
No. 50 (300 µm) 18 21 32
No. 100 (150 µm) 9 10 15
No. 200 (75 µm) 3.9 4.2 8.7
43
CHAPTER 4
PRESENTATION OF LABORATORY TEST RESULTS
4.1 Specimen Measurements
The average width and thickness of the tested specimen are summarized in Table 4.1. A detailed measurement of width and height of each specimen was listed in Appendix Table C-1. The average width was the mean value of three measurements (both ends and middle). The average height was the mean value of six measurements (four corners and two middles). It was shown that all the specimens tested in the test program met the tolerance requirement of width and thickness in the test procedure.
Table 4.1. Average Width and Thickness of Tested Specimens (in inches)
Mix Design Asphalt Binder Average Width Average Thickness
SPM 13-11076A PG 67-22 3.008 3.004 2.993 1.496 1.492 1.489 SPM 13-11076A PG 76-22 3.014 2.982 3.001 1.496 1.507 1.480 SPM 12-10895A PG 67-22 3.007 2.986 2.985 1.489 1.481 1.505 SPM 12-10895A PG 76-22 3.002 2.985 3.014 1.501 1.493 1.516 SPM 13-11035A PG 67-22 3.004 3.008 2.999 1.506 1.514 1.500 SPM 13-11035A PG 76-22 2.987 2.984 2.989 1.510 1.509 1.491 SPM 14-12576A PG 67-22 2.985 3.016 3.016 1.514 1.510 1.498 SPM 14-12576A PG 76-22 3.007 3.012 3.007 1.516 1.508 1.493 SPM 14-12199A PG 67-22 2.989 2.993 3.014 1.482 1.485 1.486 SPM 14-12199A PG 76-22 2.991 2.982 2.985 1.490 1.488 1.482 SP 14-12171B PG 67-22 2.996 3.010 3.017 1.515 1.513 1.493 SP 14-12171B PG 76-22 2.984 3.001 2.991 1.504 1.509 1.502 SPM 14-12201A PG 76-22 2.986 3.001 2.995 1.490 1.499 1.484 SPM 14-12247A PG 76-22 2.995 3.010 2.985 1.492 1.503 1.505 LD 12-2653A PG 67-22 2.985 3.000 2.992 1.488 1.490 1.513 LD 12-2653A PG 76-22 3.014 2.988 3.010 1.501 1.503 1.486 SPM 12-10895A* PG 67-22 2.999 2.988 2.999 1.513 1.515 1.488 LD 12-2653A** PG 67-22 2.984 3.003 3.006 1.519 1.514 1.515
LD 12-2653A** PG 76-22 3.001 - - 1.494 - - * This mixture was tested with 0.0125-inch opening displacement ** Supplemental Test The volumetric properties of the specimens after cutting are presented in Table 4.2. Each
of the three specimens in each type of mixture had air void content within the tolerance of 7 ±
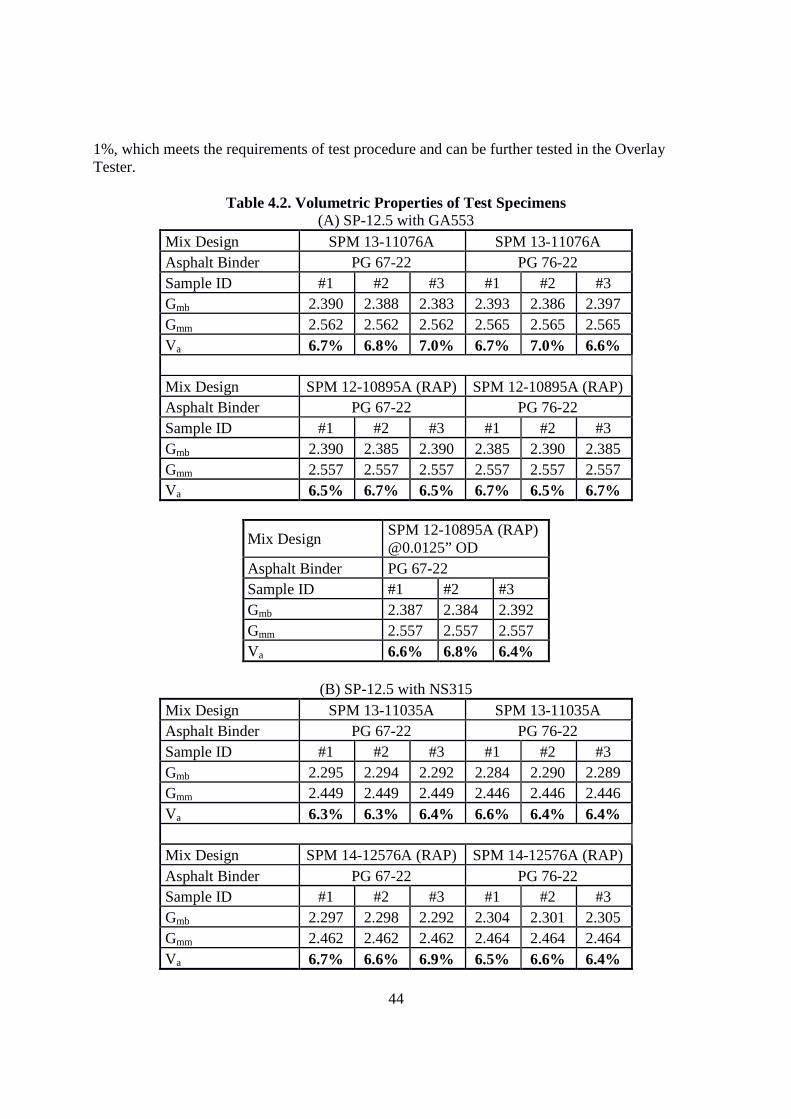
44
1%, which meets the requirements of test procedure and can be further tested in the Overlay Tester.
Table 4.2. Volumetric Properties of Test Specimens
(A) SP-12.5 with GA553 Mix Design SPM 13-11076A SPM 13-11076A Asphalt Binder PG 67-22 PG 76-22 Sample ID #1 #2 #3 #1 #2 #3 Gmb 2.390 2.388 2.383 2.393 2.386 2.397 Gmm 2.562 2.562 2.562 2.565 2.565 2.565 Va 6.7% 6.8% 7.0% 6.7% 7.0% 6.6%
Mix Design SPM 12-10895A (RAP) SPM 12-10895A (RAP) Asphalt Binder PG 67-22 PG 76-22 Sample ID #1 #2 #3 #1 #2 #3 Gmb 2.390 2.385 2.390 2.385 2.390 2.385 Gmm 2.557 2.557 2.557 2.557 2.557 2.557 Va 6.5% 6.7% 6.5% 6.7% 6.5% 6.7%
Mix Design SPM 12-10895A (RAP) @0.0125” OD
Asphalt Binder PG 67-22 Sample ID #1 #2 #3 Gmb 2.387 2.384 2.392 Gmm 2.557 2.557 2.557 Va 6.6% 6.8% 6.4%
(B) SP-12.5 with NS315
Mix Design SPM 13-11035A SPM 13-11035A Asphalt Binder PG 67-22 PG 76-22 Sample ID #1 #2 #3 #1 #2 #3 Gmb 2.295 2.294 2.292 2.284 2.290 2.289 Gmm 2.449 2.449 2.449 2.446 2.446 2.446 Va 6.3% 6.3% 6.4% 6.6% 6.4% 6.4%
Mix Design SPM 14-12576A (RAP) SPM 14-12576A (RAP) Asphalt Binder PG 67-22 PG 76-22 Sample ID #1 #2 #3 #1 #2 #3 Gmb 2.297 2.298 2.292 2.304 2.301 2.305 Gmm 2.462 2.462 2.462 2.464 2.464 2.464 Va 6.7% 6.6% 6.9% 6.5% 6.6% 6.4%

45
Table 4.2. Volumetric Properties of Test Specimens – Continued (C) SP-12.5 from GA185
Mix Design SPM 14-12199A SPM 14-12199A Asphalt Binder PG 67-22 PG 76-22 Sample ID #1 #2 #3 #1 #2 #3 Gmb 2.345 2.348 2.348 2.354 2.353 2.351 Gmm 2.513 2.513 2.513 2.515 2.515 2.515 Va 6.7% 6.6% 6.6% 6.6% 6.7% 6.5%
Mix Design SP 14-12171B (RAP) SP 14-12171B (RAP) Asphalt Binder PG 67-22 PG 76-22 Sample ID #1 #2 #3 #1 #2 #3 Gmb 2.346 2.346 2.349 2.352 2.354 2.348 Gmm 2.513 2.513 2.513 2.514 2.514 2.514 Va 6.6% 6.7% 6.5% 6.4% 6.4% 6.6%
(D) SP-9.5 with GA185
Mix Design SPM 14-12201A SPM 14-12247A (RAP) Asphalt Binder PG 76-22 PG 76-22 Sample ID #1 #2 #3 #1 #2 #3 Gmb 2.315 2.316 2.317 2.324 2.318 2.316 Gmm 2.481 2.481 2.481 2.500 2.500 2.500 Va 6.7% 6.7% 6.6% 7.0% 7.3% 7.4%
(E) SP-4.75 from with GA553
Mix Design LD 12-2653A (RAP) LD 12-2653A (RAP) Asphalt Binder PG 67-22 PG 76-22 Sample ID #1 #2 #3 #1 #2 #3 Gmb 2.307 2.317 2.311 2.308 2.306 2.310 Gmm 2.493 2.493 2.493 2.495 2.495 2.495 Va 7.5% 7.1% 7.3% 7.5% 7.6% 7.4%
(F) Supplemental Test (SP-4.75)
Mix Design LD 12-2653A (RAP) LD 12-2653A (RAP) Asphalt Binder PG 67-22 PG 76-22 Sample ID #1 #2 #3 #1 Gmb 2.311 2.305 2.308 2.313 Gmm 2.493 2.493 2.493 2.495 Va 7.3% 7.5% 7.4% 7.3%
46
4.2 Overlay Test Results
4.2.1 Original Test Results The OT was conducted in the environmental chamber under a test temperature within 25
± 0.5 ºC. The test temperature for each specimen is listed in Appendix Table C-2. The test was stopped once the load reduction reached 93% or the number of cycles reached 1000. Load reduction curve, which shows the nominal maximum load versus the number of cycles, was also obtained through OT. The nominal maximum load is the percentage of maximum load at each cycle divided by the maximum load at the first cycle. The load reduction curve for each type of mixture is shown in Figure 4.1. It was found that, in general, most mix designs with RAP included did not perform as good as the mix designs without RAP content. Most specimens with RAP content failed before the 1000th cycle. However, all the specimens without RAP content did not fail after 1000 cycles of loading.
A summary of the number of cycles to failure for each type of mixture is shown in Table
4.3. The load reduction when the test was stopped was also listed in the table. If the specimen did not fail at the 1000th cycle, the number of cycles to failure was extrapolated from the load reduction curve through the regression analysis. It was suggested that the variability should be limited to less than 30% (Walubita et al. 2012). It was found that the COV for all types of mixture are less than 20%, which means the three specimens in each type of mixture have a good agreement with each other. It was also found that the numbers of cycles to failure are more than a hundred for all types of mixture. Therefore, a 0.025-inch opening displacement could be applied to study the Florida HMA mixtures with granite. The average number of cycles to failure was also summarized in Table 4.4 according to the test plan.
Only one crack was observed on each tested specimen after the OT. A representative
specimen after the OT is shown in Figure 4.2. The pictures of the specimens for each type of mix design are shown in Appendix C. Cracks can be clearly observed on the sides of the specimen. It was found that most cracks initiated and propagated along the edge of aggregates when granite was used. The specimen was broken apart to see the inside of mixture. A representative two parts of the specimen after failure are shown in Figure 4.3. It was found that the specimen was well mixed and compacted. Crack initiated and propagated mostly through the asphalt binder.
4.2.2 Supplemental Test Results The load-reduction curves are shown in Figure 4.4 for the supplemental tests. The
pictures of specimens after the supplemental tests are shown in Appendix C. The numbers of load cycles to failure of PG 67-22 mixtures were 189 cycles, 160 cycles, and 155 cycles, respectively, with an average value of 168 load cycles to failure. The number of load cycles to failure of PG 76-22 (PMA) mixture was 2421 cycles based on regression analysis. These supplemental test results are compared with the original tests conducted previously as shown in Table 4.4.
For the PG 76-22 (PMA) mixtures, the previous test results were 2021, 2330, 1734 cycles
for three specimens with an average value of 2028 cycles, as shown in Table 4.3. The value of
47
2421 cycles from supplemental test is within the tolerance limit of coefficient of variation (COV) requirement (< 30% COV). Therefore, it may be stated that the PMA mixtures are repeatable.
For the PG 67-22 mixtures, a summary table of both original and supplemental test
results is shown in Table 4.5. A statistical analysis was conducted as follows: As shown from the analysis, both sets of data have coefficient of variation (COV) less than 30%. Assuming that the null hypothesis is that there is no significant difference between the means of two sets of data, the P-value obtained from ANOVA analysis was 0.0449, which denotes that there is a 4.49% risk to reject the null hypothesis when it is true. The difference between means is considered significant under a 0.05 significance level (95% confidence interval). However, if a 0.02 significance level is used (98% confidence interval), then the difference is considered insignificant.
If all six samples are grouped together, the overall average value of load cycles to failure
of six samples is 144, and the overall coefficient of variation is 22%. Since the two batches of sample are prepared at different times and include 20% RAP material, the supplemental test can still be considered a repeat test for the original one. Therefore, the PG 67-22 mixtures are also repeatable using the laboratory overlay test procedure.
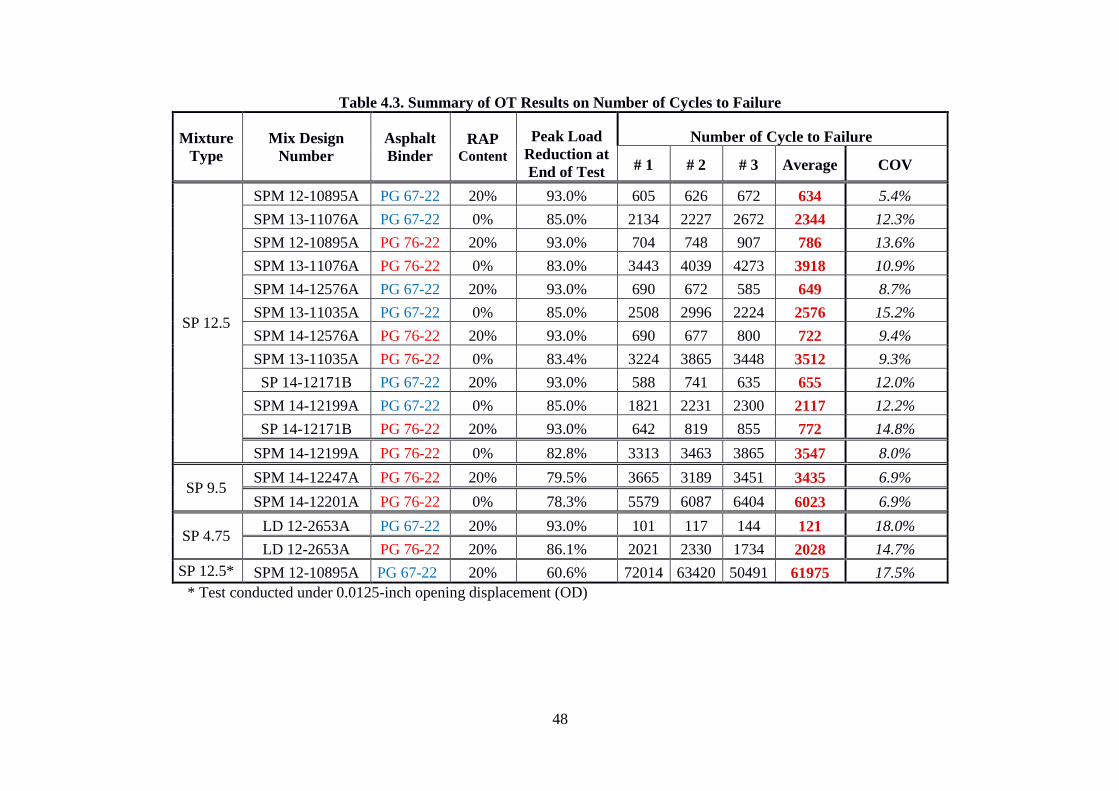
48
Table 4.3. Summary of OT Results on Number of Cycles to Failure
Mixture Type
Mix Design Number
Asphalt Binder
RAP Content
Peak Load Reduction at End of Test
Number of Cycle to Failure
# 1 # 2 # 3 Average COV
SP 12.5
SPM 12-10895A PG 67-22 20% 93.0% 605 626 672 634 5.4%
SPM 13-11076A PG 67-22 0% 85.0% 2134 2227 2672 2344 12.3%
SPM 12-10895A PG 76-22 20% 93.0% 704 748 907 786 13.6%
SPM 13-11076A PG 76-22 0% 83.0% 3443 4039 4273 3918 10.9%
SPM 14-12576A PG 67-22 20% 93.0% 690 672 585 649 8.7%
SPM 13-11035A PG 67-22 0% 85.0% 2508 2996 2224 2576 15.2%
SPM 14-12576A PG 76-22 20% 93.0% 690 677 800 722 9.4%
SPM 13-11035A PG 76-22 0% 83.4% 3224 3865 3448 3512 9.3%
SP 14-12171B PG 67-22 20% 93.0% 588 741 635 655 12.0%
SPM 14-12199A PG 67-22 0% 85.0% 1821 2231 2300 2117 12.2%
SP 14-12171B PG 76-22 20% 93.0% 642 819 855 772 14.8%
SPM 14-12199A PG 76-22 0% 82.8% 3313 3463 3865 3547 8.0%
SP 9.5 SPM 14-12247A PG 76-22 20% 79.5% 3665 3189 3451 3435 6.9%
SPM 14-12201A PG 76-22 0% 78.3% 5579 6087 6404 6023 6.9%
SP 4.75 LD 12-2653A PG 67-22 20% 93.0% 101 117 144 121 18.0%
LD 12-2653A PG 76-22 20% 86.1% 2021 2330 1734 2028 14.7%
SP 12.5* SPM 12-10895A PG 67-22 20% 60.6% 72014 63420 50491 61975 17.5% * Test conducted under 0.0125-inch opening displacement (OD)

49
Table 4.4. Average Number of Cycles to Failure of Mixtures in the Test Plan (0.025-inch OD)
Asphalt Mixtures Binder PG 67-22 PG 76-22 PMA
RAP Content
0% 20% 0% 20%
NMAS
12.5 mm
GA553 2344 634 3918 786
NS315 2576 649 3512 722
GA185 2117 655 3547 772
9.5 mm GA185 - - 6023 3435
4.75 mm GA553 - 121 (168)* - 2028
(2421)** *Average number of load cycles to failure of three supplemental tests conducted in July 2015. **Number of load cycles to failure of one supplemental test conducted in July 2015.

(a) SP-
(b) SP-Figure 4.1. Load Reduction Curve for Each Type of Mix Design
50
-12.5 SPM 13-11076A with PG 67-22 Binder
-12.5 SPM 13-11076A with PG 76-22 BinderFigure 4.1. Load Reduction Curve for Each Type of Mix Design
22 Binder
22 Binder
Figure 4.1. Load Reduction Curve for Each Type of Mix Design

I SP-12.5 SPM 12
(d) SP-12.5 SPM 12
51
12.5 SPM 12-10895A with PG 67-22 and 20% RAP
12.5 SPM 12-10895A with PG 76-22 and 20% RAPFigure 4.1. – Continued
22 and 20% RAP
22 and 20% RAP

I SP-12.5 SPM
(f) SP-12.5 SPM 13
52
12.5 SPM 13-11035A with PG 67-22 Binder
12.5 SPM 13-11035A with PG 76-22 Binder Figure 4.1. – Continued

(g) SP-12.5 SPM 14
(h) SP-12.5 SPM 14
53
12.5 SPM 14-12576A with PG 67-22 and 20% RAP
12.5 SPM 14-12576A with PG 76-22 and 20% RAPFigure 4.1. – Continued
22 and 20% RAP
22 and 20% RAP

(i) SP
(j) SP
54
(i) SP-12.5 SPM 14-12199A with PG 67-22
(j) SP-12.5 SPM 14-12199A with PG 76-22 Figure 4.1. – Continued

(k) SP-12.5 SP 14
(l) SP-12.5 SP 14
55
12.5 SP 14-12171B with PG 67-22 and 20% RAP
12.5 SP 14-12171B with PG 76-22 and 20% RAPFigure 4.1. – Continued
22 and 20% RAP
22 and 20% RAP

(m) SP
(n) SP-9.5 SPM 14
56
(m) SP-9.5 SPM 14-12201A with PG 76-22
9.5 SPM 14-12247A with PG 76-22 and 20% RAPFigure 4.1. – Continued
22 and 20% RAP
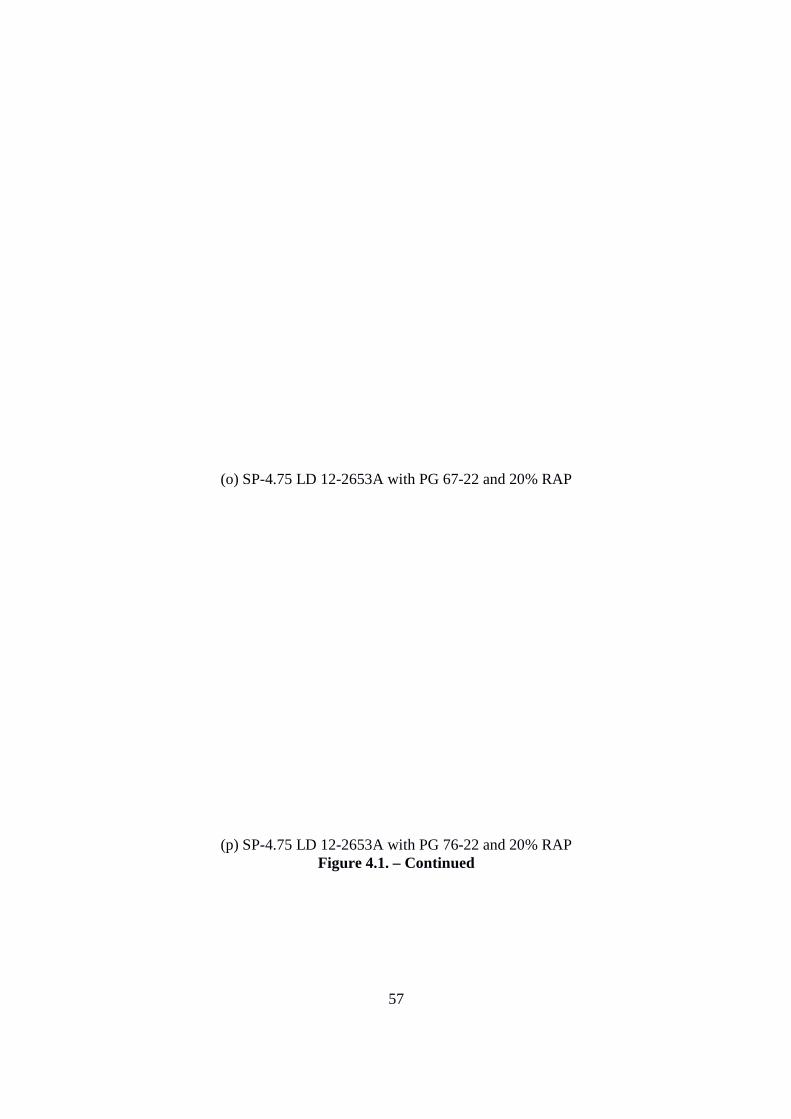
(o) SP-4.75 LD 12
(p) SP-4.75 LD 12
57
4.75 LD 12-2653A with PG 67-22 and 20% RAP
4.75 LD 12-2653A with PG 76-22 and 20% RAPFigure 4.1. – Continued
22 and 20% RAP
22 and 20% RAP
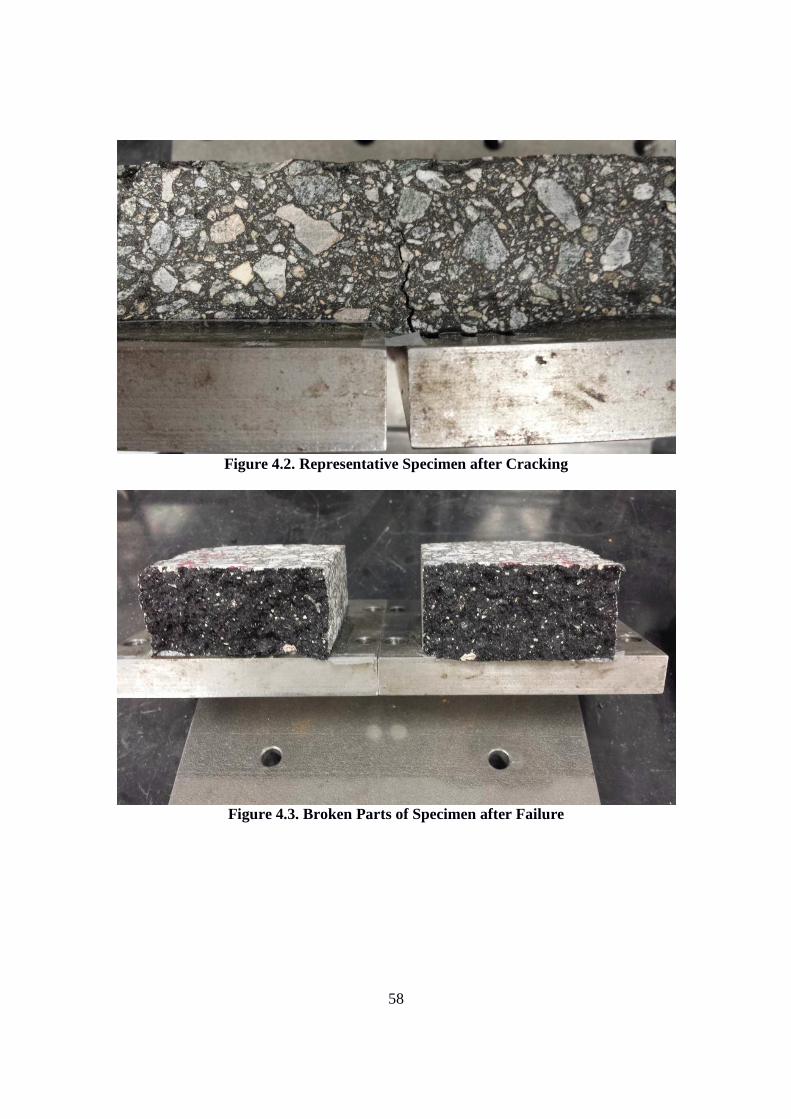
58
Figure 4.2. Representative Specimen after Cracking
Figure 4.3. Broken Parts of Specimen after Failure
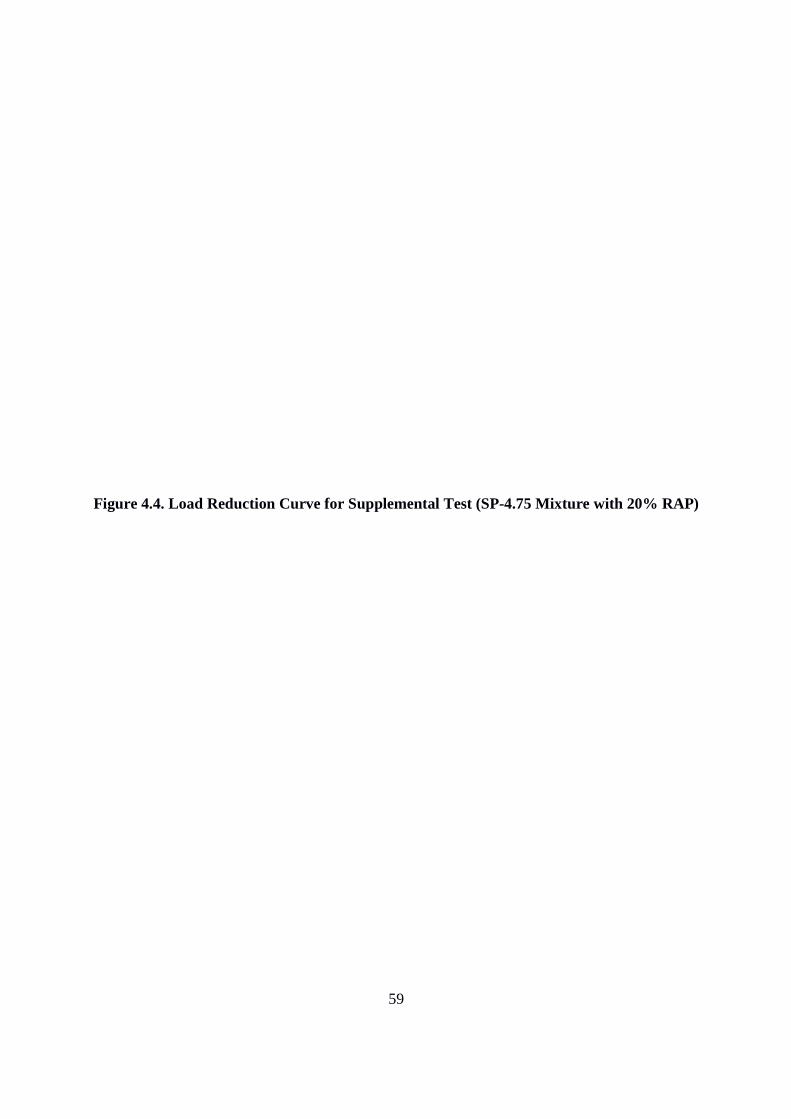
Figure 4.4. Load Reduction Curve for Supplemental Test (SP
59
Figure 4.4. Load Reduction Curve for Supplemental Test (SP-4.75 Mixture with 20% RAP)
4.75 Mixture with 20% RAP)
60
CHAPTER 5
ANALYSIS OF LABORATORY TEST RESULTS
5.1 General
Based on the overlay test results, it was found that the number of cycles to failure varied for different types of mixture. Generally, the mixtures without RAP content have better cracking performance than the mixtures with RAP included. To evaluate the effects of aggregate source, NMAS, asphalt binder type, and RAP content on the cracking performance of Florida mixtures, comparative studies were conducted. Analysis of Variance (ANOVA), which is commonly used in statistical hypothesis testing on experimental results, was applied to compare the experimental data using statistical software, R. Furthermore, fracture mechanics analysis was conducted on the overlay test results based on Paris’ Law. Both fracture properties, A and n, were computed through theoretical derivations. In addition to A and n, two parameters called crack indices A’ and n’, which can be easily obtained from the overlay test load-reduction curve, were introduced to evaluate the crack resistance of asphalt mixtures. Since supplemental test results have verified the results obtained earlier, all the analysis was conducted on original test results obtained from Task 3 laboratory evaluation phase.
5.2 Statistical ANOVA Analysis The purpose of the statistical analysis is to find if there is significant difference between the average numbers of cycles to failure for different types of mixtures. ANOVA is a collection of statistical models to test for significant differences between means by analysis of variance. Compared to the t-test, ANOVA is useful in testing more than two groups. Therefore, ANOVA is a widely used statistical hypothesis testing method in the analysis of experimental data.
An overall ANOVA analysis was conducted on the whole set of data. Main effects and interaction effects were evaluated through ANOVA analysis. The probabilities derived from the ANOVA analysis, assuming the null hypothesis was that the effect was insignificant, are shown in Table 5.1. If the probability value was less than 0.05, the null hypothesis was rejected. Thus, that factor should have a significant effect on the test results. It was found that asphalt binder type, NMAS, and RAP content had significant effects on the OT results. The interaction effect between asphalt binder type and NMAS and the interaction effect between asphalt binder type and RAP content also had strong effects on the OT results. However, the influence of factors related to granite source was not significant.
An ANOVA analysis was conducted on these four groups of data, as shown in Table 5.2,
to find the effect of granite source on the OT results. The probabilities of the result, assuming that the null hypothesis was no significant difference on the mean of test results among three types of granite, were 0.284, 0.357, 0.915, and 0.718, respectively. All the probabilities were greater than 0.05, which failed to reject the null hypothesis. ANOVA analysis also showed that there is no significant difference on OT results for the granites from different sources. A two-
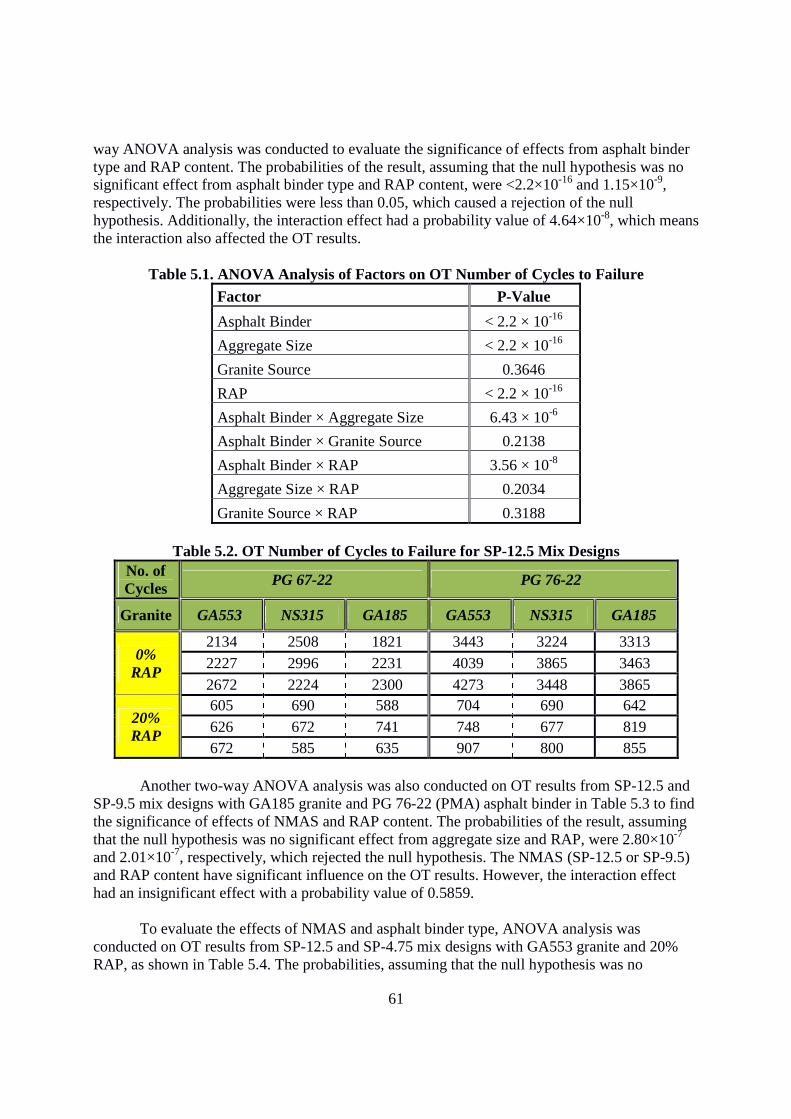
61
way ANOVA analysis was conducted to evaluate the significance of effects from asphalt binder type and RAP content. The probabilities of the result, assuming that the null hypothesis was no significant effect from asphalt binder type and RAP content, were <2.2×10⁻¹⁶ and 1.15×10⁻⁹, respectively. The probabilities were less than 0.05, which caused a rejection of the null hypothesis. Additionally, the interaction effect had a probability value of 4.64×10⁻⁸, which means the interaction also affected the OT results.
Table 5.1. ANOVA Analysis of Factors on OT Number of Cycles to Failure
Factor P-Value
Asphalt Binder < 2.2 × 10⁻¹⁶
Aggregate Size < 2.2 × 10⁻¹⁶
Granite Source 0.3646
RAP < 2.2 × 10⁻¹⁶
Asphalt Binder × Aggregate Size 6.43 × 10⁻⁶
Asphalt Binder × Granite Source 0.2138
Asphalt Binder × RAP 3.56 × 10⁻⁸
Aggregate Size × RAP 0.2034
Granite Source × RAP 0.3188
Table 5.2. OT Number of Cycles to Failure for SP-12.5 Mix Designs No. of Cycles PG 67-22 PG 76-22
Granite GA553 NS315 GA185 GA553 NS315 GA185
0% RAP
2134 2508 1821 3443 3224 3313 2227 2996 2231 4039 3865 3463 2672 2224 2300 4273 3448 3865
20% RAP
605 690 588 704 690 642 626 672 741 748 677 819 672 585 635 907 800 855
Another two-way ANOVA analysis was also conducted on OT results from SP-12.5 and
SP-9.5 mix designs with GA185 granite and PG 76-22 (PMA) asphalt binder in Table 5.3 to find the significance of effects of NMAS and RAP content. The probabilities of the result, assuming that the null hypothesis was no significant effect from aggregate size and RAP, were 2.80×10⁻⁷ and 2.01×10⁻⁷, respectively, which rejected the null hypothesis. The NMAS (SP-12.5 or SP-9.5) and RAP content have significant influence on the OT results. However, the interaction effect had an insignificant effect with a probability value of 0.5859.
To evaluate the effects of NMAS and asphalt binder type, ANOVA analysis was
conducted on OT results from SP-12.5 and SP-4.75 mix designs with GA553 granite and 20% RAP, as shown in Table 5.4. The probabilities, assuming that the null hypothesis was no
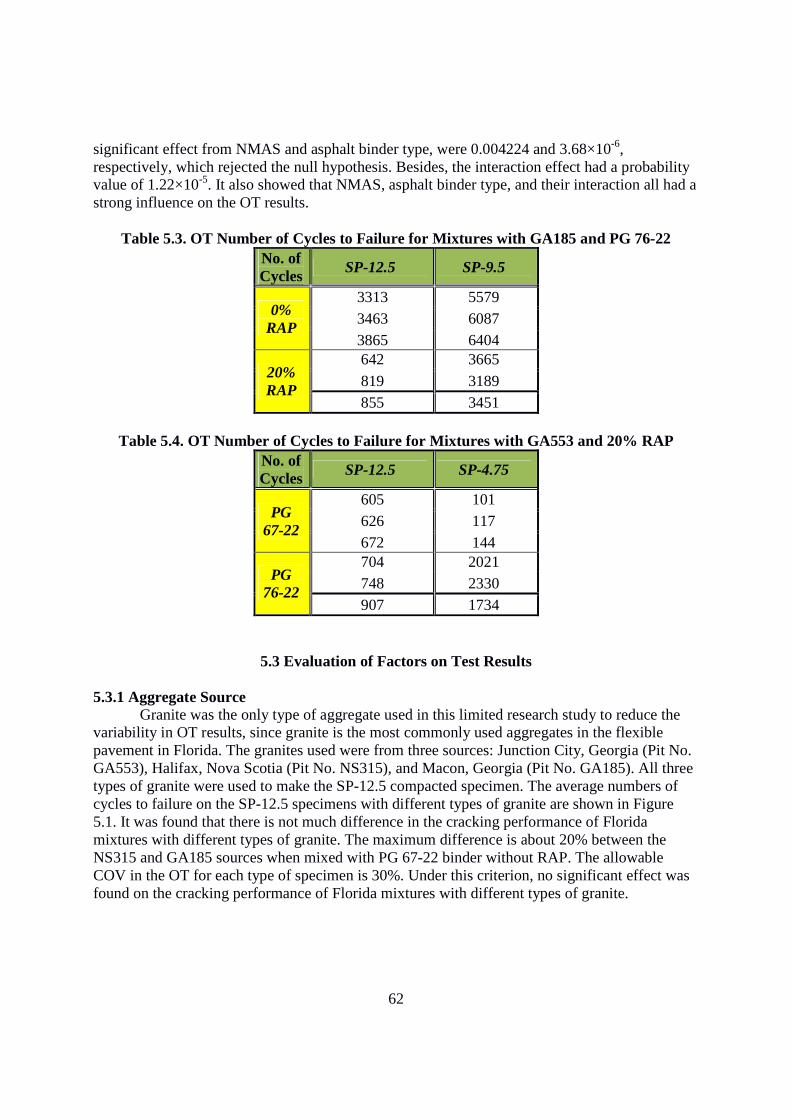
62
significant effect from NMAS and asphalt binder type, were 0.004224 and 3.68×10⁻⁶, respectively, which rejected the null hypothesis. Besides, the interaction effect had a probability value of 1.22×10⁻⁵. It also showed that NMAS, asphalt binder type, and their interaction all had a strong influence on the OT results.
Table 5.3. OT Number of Cycles to Failure for Mixtures with GA185 and PG 76-22
No. of Cycles SP-12.5 SP-9.5
0% RAP
3313 5579 3463 6087 3865 6404
20% RAP
642 3665
819 3189 855 3451
Table 5.4. OT Number of Cycles to Failure for Mixtures with GA553 and 20% RAP
No. of Cycles SP-12.5 SP-4.75
PG 67-22
605 101 626 117 672 144
PG 76-22
704 2021 748 2330 907 1734
5.3 Evaluation of Factors on Test Results
5.3.1 Aggregate Source Granite was the only type of aggregate used in this limited research study to reduce the
variability in OT results, since granite is the most commonly used aggregates in the flexible pavement in Florida. The granites used were from three sources: Junction City, Georgia (Pit No. GA553), Halifax, Nova Scotia (Pit No. NS315), and Macon, Georgia (Pit No. GA185). All three types of granite were used to make the SP-12.5 compacted specimen. The average numbers of cycles to failure on the SP-12.5 specimens with different types of granite are shown in Figure 5.1. It was found that there is not much difference in the cracking performance of Florida mixtures with different types of granite. The maximum difference is about 20% between the NS315 and GA185 sources when mixed with PG 67-22 binder without RAP. The allowable COV in the OT for each type of specimen is 30%. Under this criterion, no significant effect was found on the cracking performance of Florida mixtures with different types of granite.

Figure 5.1. OT Results on Different Type of Granite 5.3.2 Nominal Maximum Aggregate Size
Three nominal maximum aggregate sizes were used for the mix designs to fabricate the Superpave specimens: SP-12.5, SPused for the SP-12.5 mix design. GA185 granite was used for the SPGA553 granite was used for the SPcracking performance of Florida mixtures, comparisons were made under several groups.
Figure 5.2. OT Results on SP OT results on SP-12.5 and SP
GA185 granite aggregates was chosen to be compared with SPaggregates are from the same source. PG 76of specimens. It was found that NMAS has a significant effect on the cracking performance of
63
Figure 5.1. OT Results on Different Type of Granite
5.3.2 Nominal Maximum Aggregate Size nominal maximum aggregate sizes were used for the mix designs to fabricate the
12.5, SP-9.5, and SP-4.75. GA553, GA185, and NS315 granites were 12.5 mix design. GA185 granite was used for the SP-9.5 mix design, and
GA553 granite was used for the SP-4.75 mix design. To study the effect of aggregate size on the cracking performance of Florida mixtures, comparisons were made under several groups.
Figure 5.2. OT Results on SP-12.5 and SP-9.5 Mix Designs with GA185 an
12.5 and SP-9.5 mix designs are shown in Figure 5.2. The SPGA185 granite aggregates was chosen to be compared with SP-9.5 mix design since the aggregates are from the same source. PG 76-22 (PMA) was the asphalt bindeof specimens. It was found that NMAS has a significant effect on the cracking performance of
Figure 5.1. OT Results on Different Type of Granite
nominal maximum aggregate sizes were used for the mix designs to fabricate the 4.75. GA553, GA185, and NS315 granites were
9.5 mix design, and 4.75 mix design. To study the effect of aggregate size on the
cracking performance of Florida mixtures, comparisons were made under several groups.
9.5 Mix Designs with GA185 and PG 76-22
9.5 mix designs are shown in Figure 5.2. The SP-12.5 with 9.5 mix design since the
22 (PMA) was the asphalt binder used for this group of specimens. It was found that NMAS has a significant effect on the cracking performance of
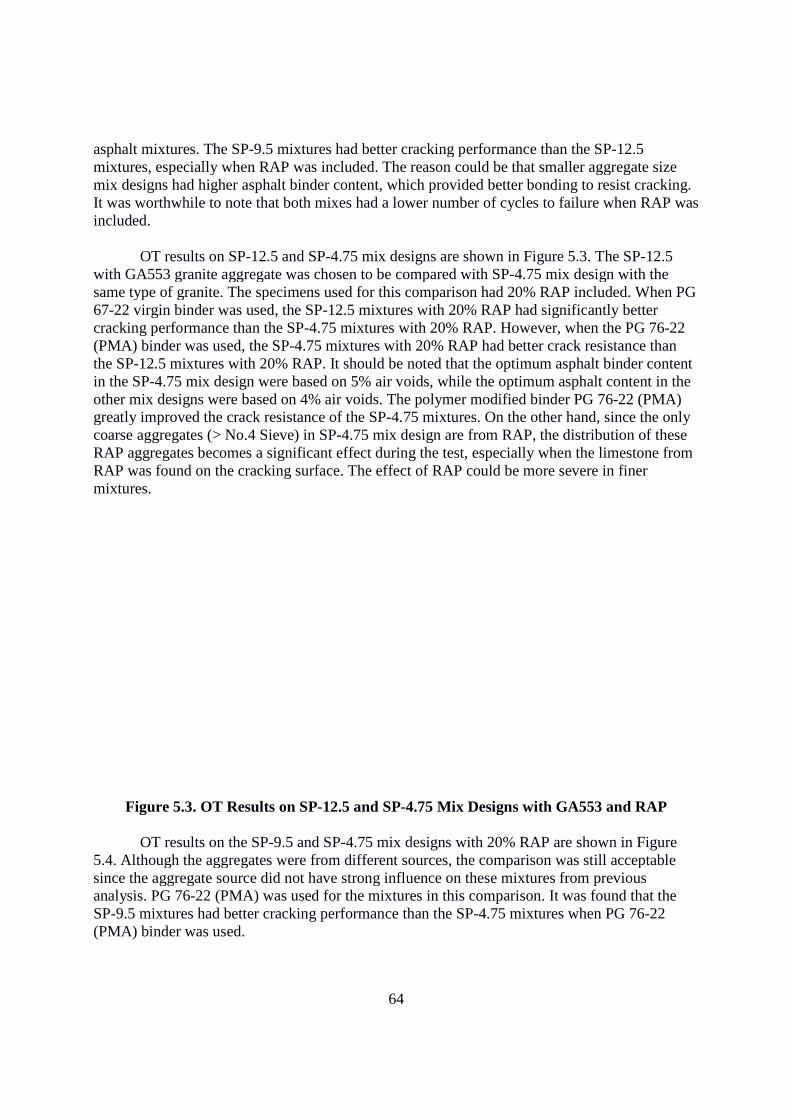
asphalt mixtures. The SP-9.5 mixtures had better cracking performance than the SPmixtures, especially when RAP was included. The reasonmix designs had higher asphalt binder content, which provided better bonding to resist cracking. It was worthwhile to note that both mixes had a lower number of cycles to failure when RAP was included.
OT results on SP-12.5 and SP
with GA553 granite aggregate was chosen to be compared with SPsame type of granite. The specimens used for this comparison had 20% RAP included. When PG 67-22 virgin binder was used, the SPcracking performance than the SP(PMA) binder was used, the SPthe SP-12.5 mixtures with 20% RAP. It should be noted that the optimum asphalt binder content in the SP-4.75 mix design were based on 5% air voids, while the optimum asphalt content in the other mix designs were based on 4% air voids. The polymer modifiegreatly improved the crack resistance of the SPcoarse aggregates (> No.4 Sieve) in SPRAP aggregates becomes a significant effRAP was found on the cracking surface. The effect of RAP could be more severe in finer mixtures.
Figure 5.3. OT Results on SP OT results on the SP-9
5.4. Although the aggregates were from different sources, the comparison was still acceptable since the aggregate source did not have strong influence on these mixtures from previous analysis. PG 76-22 (PMA) was used for the mixtures in this comparison. It was found that the SP-9.5 mixtures had better cracking performance than the SP(PMA) binder was used.
64
9.5 mixtures had better cracking performance than the SPmixtures, especially when RAP was included. The reason could be that smaller aggregate size mix designs had higher asphalt binder content, which provided better bonding to resist cracking. It was worthwhile to note that both mixes had a lower number of cycles to failure when RAP was
12.5 and SP-4.75 mix designs are shown in Figure 5.3. The SPwith GA553 granite aggregate was chosen to be compared with SP-4.75 mix design with the same type of granite. The specimens used for this comparison had 20% RAP included. When PG
gin binder was used, the SP-12.5 mixtures with 20% RAP had significantly better cracking performance than the SP-4.75 mixtures with 20% RAP. However, when the PG 76(PMA) binder was used, the SP-4.75 mixtures with 20% RAP had better crack resistance tha
12.5 mixtures with 20% RAP. It should be noted that the optimum asphalt binder content 4.75 mix design were based on 5% air voids, while the optimum asphalt content in the
other mix designs were based on 4% air voids. The polymer modified binder PG 76greatly improved the crack resistance of the SP-4.75 mixtures. On the other hand, since the only coarse aggregates (> No.4 Sieve) in SP-4.75 mix design are from RAP, the distribution of these RAP aggregates becomes a significant effect during the test, especially when the limestone from RAP was found on the cracking surface. The effect of RAP could be more severe in finer
Figure 5.3. OT Results on SP-12.5 and SP-4.75 Mix Designs with GA553 and RAP
9.5 and SP-4.75 mix designs with 20% RAP are shown in Figure 5.4. Although the aggregates were from different sources, the comparison was still acceptable since the aggregate source did not have strong influence on these mixtures from previous
22 (PMA) was used for the mixtures in this comparison. It was found that the 9.5 mixtures had better cracking performance than the SP-4.75 mixtures when PG 76
9.5 mixtures had better cracking performance than the SP-12.5 could be that smaller aggregate size
mix designs had higher asphalt binder content, which provided better bonding to resist cracking. It was worthwhile to note that both mixes had a lower number of cycles to failure when RAP was
4.75 mix designs are shown in Figure 5.3. The SP-12.5 4.75 mix design with the
same type of granite. The specimens used for this comparison had 20% RAP included. When PG 12.5 mixtures with 20% RAP had significantly better
4.75 mixtures with 20% RAP. However, when the PG 76-22 4.75 mixtures with 20% RAP had better crack resistance than
12.5 mixtures with 20% RAP. It should be noted that the optimum asphalt binder content 4.75 mix design were based on 5% air voids, while the optimum asphalt content in the
d binder PG 76-22 (PMA) 4.75 mixtures. On the other hand, since the only
4.75 mix design are from RAP, the distribution of these ect during the test, especially when the limestone from
RAP was found on the cracking surface. The effect of RAP could be more severe in finer
4.75 Mix Designs with GA553 and RAP
4.75 mix designs with 20% RAP are shown in Figure 5.4. Although the aggregates were from different sources, the comparison was still acceptable since the aggregate source did not have strong influence on these mixtures from previous
22 (PMA) was used for the mixtures in this comparison. It was found that the 4.75 mixtures when PG 76-22

Figure 5.4. OT Results on SP Based on the OT results on the number of cycles to failure for the mixtures with different
nominal maximum aggregate sizes, it was found that the SPresistance compared to the SPmixes. The SP-4.75 mixtures had better cracking performance than the SP76-22 (PMA) binder was used instead of PG 67
5.3.3 Asphalt Binder Type
Two types of asphalt binder were used PG 76-22 PMA. To study the effect of asphalt binder on the cracking performance of Florida mixtures, comparisons were made in two groups: mixtures without RAP and mixtures with RAP. OT results of mixtures without RAP are shown in Figure 5.5. It was found that the PG 76(PMA) binder had a strong influence on the crack resistance of mixtures without RAP. The number of cycles to failure was improved by 50% to 100% when PG 76
Figure 5.5. OT Results of Mixtures without RAP for Both Binders
65
Figure 5.4. OT Results on SP-9.5 and SP-4.75 Mix Designs with PG 76
Based on the OT results on the number of cycles to failure for the mixtures with different nominal maximum aggregate sizes, it was found that the SP-9.5 mixtures had the best crack resistance compared to the SP-12.5 and SP-4.75 mixtures when 20% RAP was included in the
4.75 mixtures had better cracking performance than the SP-22 (PMA) binder was used instead of PG 67-22 virgin binder.
Two types of asphalt binder were used in this study: PG 67-22 virgin asphalt binder and 22 PMA. To study the effect of asphalt binder on the cracking performance of Florida
mixtures, comparisons were made in two groups: mixtures without RAP and mixtures with RAP. ithout RAP are shown in Figure 5.5. It was found that the PG 76
(PMA) binder had a strong influence on the crack resistance of mixtures without RAP. The number of cycles to failure was improved by 50% to 100% when PG 76-22 (PMA) was used.
OT Results of Mixtures without RAP for Both Binders
PG 76-22 and 20% RAP
Based on the OT results on the number of cycles to failure for the mixtures with different 9.5 mixtures had the best crack
es when 20% RAP was included in the -12.5 mixtures if PG
22 virgin asphalt binder and 22 PMA. To study the effect of asphalt binder on the cracking performance of Florida
mixtures, comparisons were made in two groups: mixtures without RAP and mixtures with RAP. ithout RAP are shown in Figure 5.5. It was found that the PG 76-22
(PMA) binder had a strong influence on the crack resistance of mixtures without RAP. The 22 (PMA) was used.
OT Results of Mixtures without RAP for Both Binders
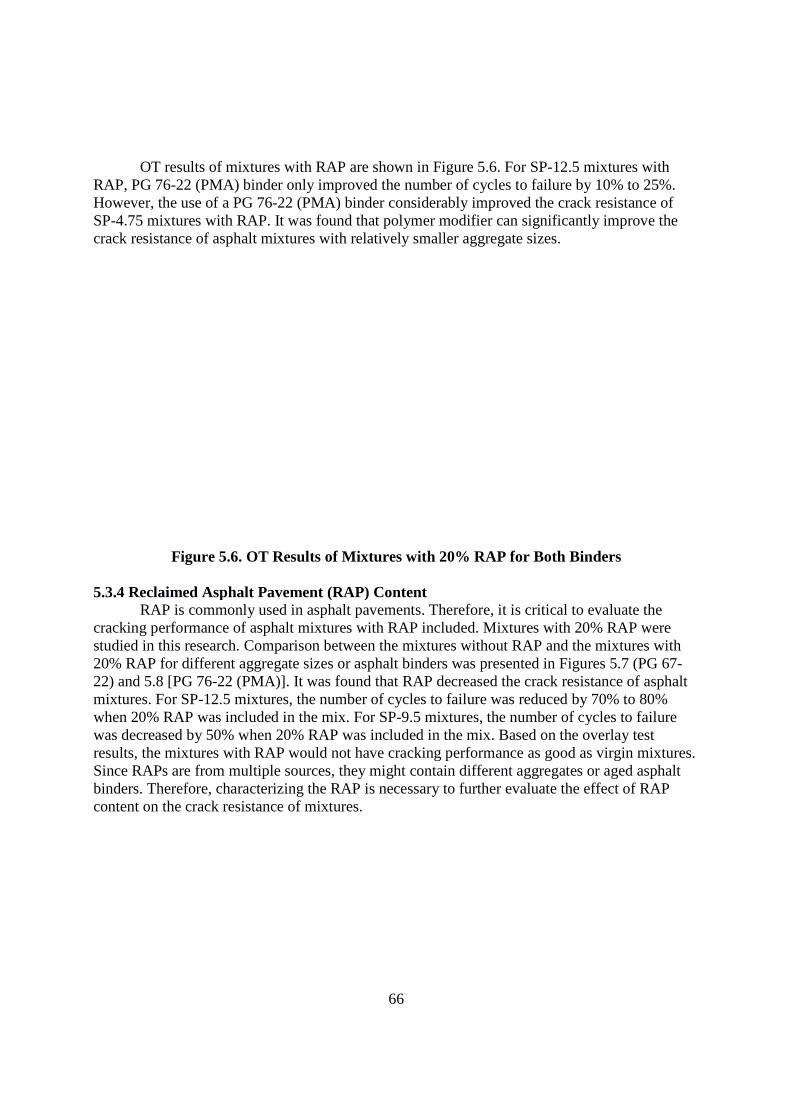
OT results of mixtures with RAP are shown in Figure 5.6. For SP
RAP, PG 76-22 (PMA) binder only improved the number of cycles to failure by 10% to 25%. However, the use of a PG 76-22 SP-4.75 mixtures with RAP. It was found that polymer modifier can significantly improve the crack resistance of asphalt mixtures with relatively smaller aggregate sizes.
Figure 5.6. OT Results 5.3.4 Reclaimed Asphalt Pavement (RAP) Content RAP is commonly used in asphalt pavements. Therefore, it is critical to evaluate the cracking performance of asphalt mixtures with RAP included. Mixtures with 20% RAstudied in this research. Comparison between the mixtures without RAP and the mixtures with 20% RAP for different aggregate sizes or asphalt binders was presented in Figures 5.7 (PG 6722) and 5.8 [PG 76-22 (PMA)]. It was found that RAP decreased thmixtures. For SP-12.5 mixtures, the number of cycles to failure was reduced by 70% to 80% when 20% RAP was included in the mix. For SPwas decreased by 50% when 20% RAP was includeresults, the mixtures with RAP would not have cracking performance as good as virgin mixtures. Since RAPs are from multiple sources, they might contain different aggregates or aged asphalt binders. Therefore, characterizing the RAP is necessary to further evaluate the effect of RAP content on the crack resistance of mixtures.
66
OT results of mixtures with RAP are shown in Figure 5.6. For SP-12.5 mixtures with 22 (PMA) binder only improved the number of cycles to failure by 10% to 25%.
22 (PMA) binder considerably improved the crack resistance of 4.75 mixtures with RAP. It was found that polymer modifier can significantly improve the
crack resistance of asphalt mixtures with relatively smaller aggregate sizes.
Figure 5.6. OT Results of Mixtures with 20% RAP for Both Binders
5.3.4 Reclaimed Asphalt Pavement (RAP) Content RAP is commonly used in asphalt pavements. Therefore, it is critical to evaluate the
cracking performance of asphalt mixtures with RAP included. Mixtures with 20% RAstudied in this research. Comparison between the mixtures without RAP and the mixtures with 20% RAP for different aggregate sizes or asphalt binders was presented in Figures 5.7 (PG 67
22 (PMA)]. It was found that RAP decreased the crack resistance of asphalt 12.5 mixtures, the number of cycles to failure was reduced by 70% to 80%
when 20% RAP was included in the mix. For SP-9.5 mixtures, the number of cycles to failure was decreased by 50% when 20% RAP was included in the mix. Based on the overlay test results, the mixtures with RAP would not have cracking performance as good as virgin mixtures. Since RAPs are from multiple sources, they might contain different aggregates or aged asphalt
erizing the RAP is necessary to further evaluate the effect of RAP content on the crack resistance of mixtures.
12.5 mixtures with 22 (PMA) binder only improved the number of cycles to failure by 10% to 25%.
(PMA) binder considerably improved the crack resistance of 4.75 mixtures with RAP. It was found that polymer modifier can significantly improve the
crack resistance of asphalt mixtures with relatively smaller aggregate sizes.
of Mixtures with 20% RAP for Both Binders
RAP is commonly used in asphalt pavements. Therefore, it is critical to evaluate the cracking performance of asphalt mixtures with RAP included. Mixtures with 20% RAP were studied in this research. Comparison between the mixtures without RAP and the mixtures with 20% RAP for different aggregate sizes or asphalt binders was presented in Figures 5.7 (PG 67-
e crack resistance of asphalt 12.5 mixtures, the number of cycles to failure was reduced by 70% to 80%
9.5 mixtures, the number of cycles to failure d in the mix. Based on the overlay test
results, the mixtures with RAP would not have cracking performance as good as virgin mixtures. Since RAPs are from multiple sources, they might contain different aggregates or aged asphalt
erizing the RAP is necessary to further evaluate the effect of RAP
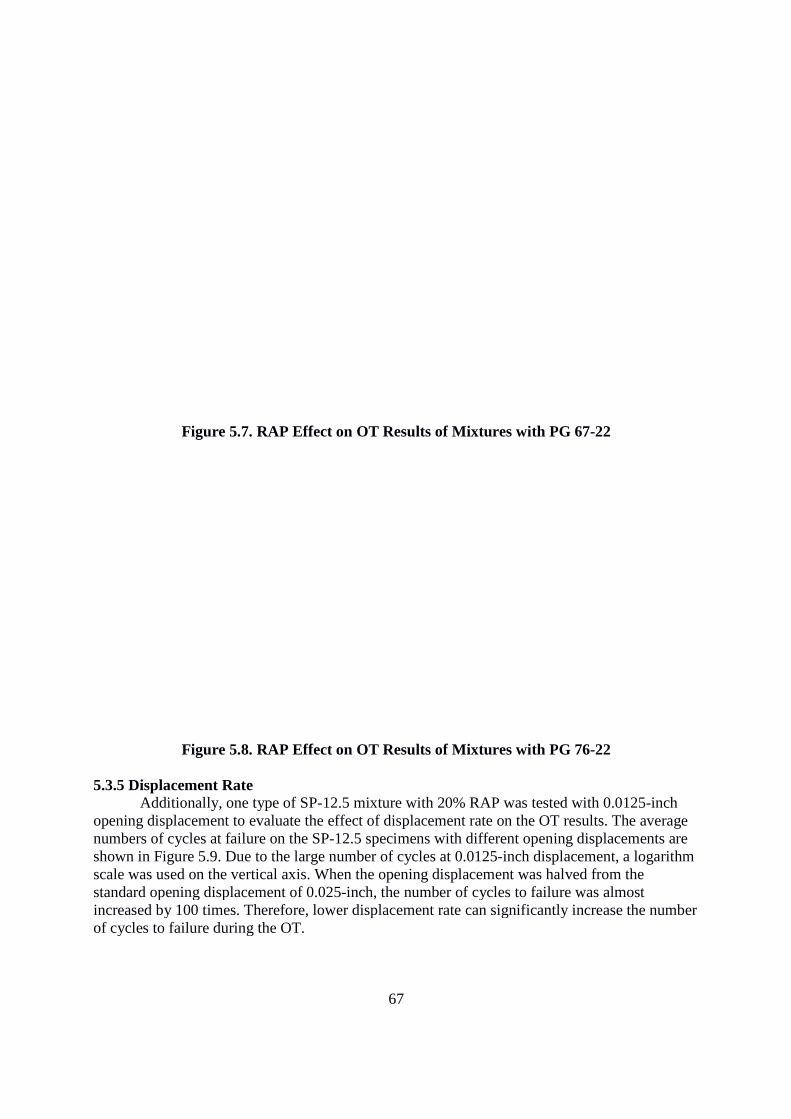
Figure 5.7. RAP Effect on OT Results of Mixtures with PG 67
Figure 5.8. RAP Effect on OT Results of Mixtures with PG 76
5.3.5 Displacement Rate Additionally, one type of SP
opening displacement to evaluate the effect of displacement rate on the OT results. The average numbers of cycles at failure on the SPshown in Figure 5.9. Due to the large number of cycles at 0.0125scale was used on the vertical axis. When the opening displacement was halved from the standard opening displacement of 0.025increased by 100 times. Therefore, lower displacement rate can significantly increase the number of cycles to failure during the OT.
67
Figure 5.7. RAP Effect on OT Results of Mixtures with PG 67
Figure 5.8. RAP Effect on OT Results of Mixtures with PG 76
Additionally, one type of SP-12.5 mixture with 20% RAP was tested with 0.0125opening displacement to evaluate the effect of displacement rate on the OT results. The average numbers of cycles at failure on the SP-12.5 specimens with different opening displacements are shown in Figure 5.9. Due to the large number of cycles at 0.0125-inch displacement, a logarithm scale was used on the vertical axis. When the opening displacement was halved from the standard opening displacement of 0.025-inch, the number of cycles to failure was almost increased by 100 times. Therefore, lower displacement rate can significantly increase the number of cycles to failure during the OT.
Figure 5.7. RAP Effect on OT Results of Mixtures with PG 67-22
Figure 5.8. RAP Effect on OT Results of Mixtures with PG 76-22
12.5 mixture with 20% RAP was tested with 0.0125-inch opening displacement to evaluate the effect of displacement rate on the OT results. The average
rent opening displacements are inch displacement, a logarithm
scale was used on the vertical axis. When the opening displacement was halved from the h, the number of cycles to failure was almost
increased by 100 times. Therefore, lower displacement rate can significantly increase the number
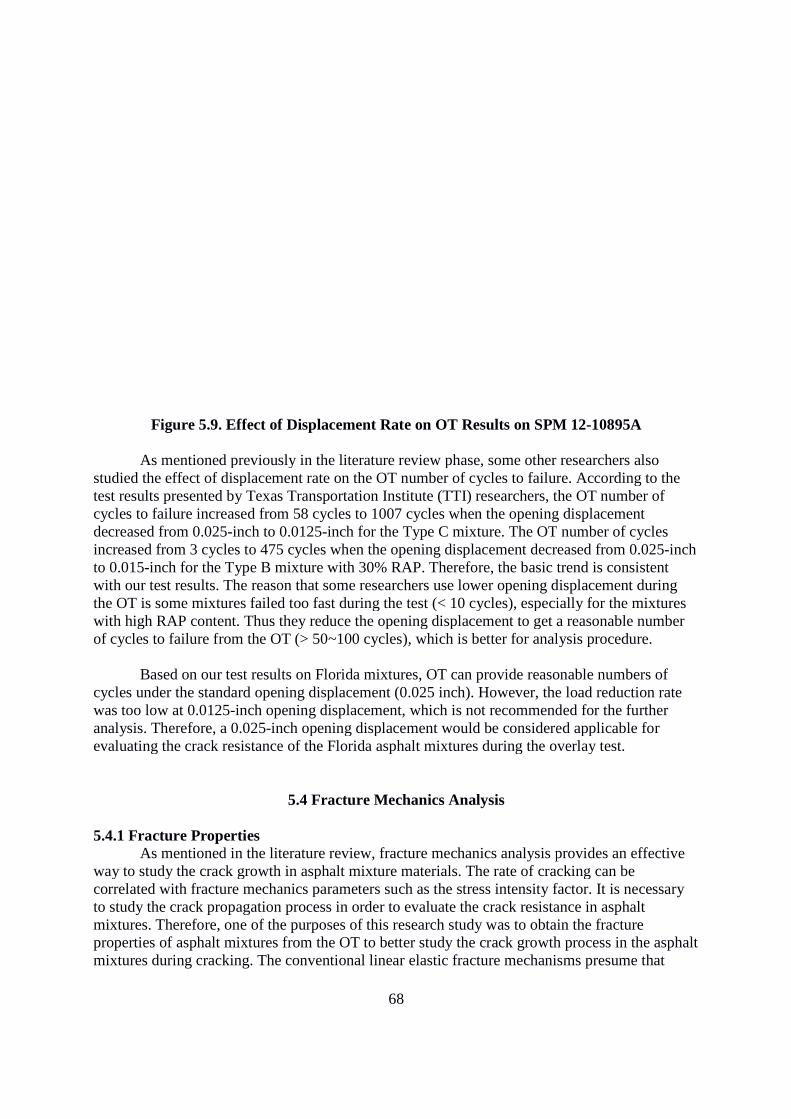
Figure 5.9. Effect of Displacement Rate on OT Results on SPM 12 As mentioned previously in the literature review phase, some other researchers also
studied the effect of displacement rate on the OT number of cycles to failure. According to the test results presented by Texas Transportation Institute (TTI) researchers, thcycles to failure increased from 58 cycles to 1007 cycles when the opening displacement decreased from 0.025-inch to 0.0125increased from 3 cycles to 475 cycles when the opening displacemto 0.015-inch for the Type B mixture with 30% RAP. Therefore, the basic trend is consistent with our test results. The reason that some researchers use lower opening displacement during the OT is some mixtures failed too fast with high RAP content. Thus they reduce the opening displacement to get a reasonable number of cycles to failure from the OT (> 50~100 cycles), which is better for analysis procedure.
Based on our test results on Florida mixtures, OT can provide reasonable numbers of
cycles under the standard opening displacement (0.025 inch). However, the load reduction rate was too low at 0.0125-inch opening displacement, which is not recommended for the further analysis. Therefore, a 0.025-inch opening displacement would be considered applicable for evaluating the crack resistance of the Florida asphalt mixtures during the overlay test.
5.4.1 Fracture Properties As mentioned in the literature review, fracture mechanics analysis provides an effective way to study the crack growth in asphalt mixture materials. The rate of cracking can be correlated with fracture mechanics parameters such as the stress intensity factto study the crack propagation process in order to evaluate the crack resistance in asphalt mixtures. Therefore, one of the purposes of this research study was to obtain the fracture properties of asphalt mixtures from the OT to better mixtures during cracking. The conventional linear elastic fracture mechanisms presume that
68
Figure 5.9. Effect of Displacement Rate on OT Results on SPM 12
mentioned previously in the literature review phase, some other researchers also studied the effect of displacement rate on the OT number of cycles to failure. According to the test results presented by Texas Transportation Institute (TTI) researchers, thcycles to failure increased from 58 cycles to 1007 cycles when the opening displacement
inch to 0.0125-inch for the Type C mixture. The OT number of cycles increased from 3 cycles to 475 cycles when the opening displacement decreased from 0.025
inch for the Type B mixture with 30% RAP. Therefore, the basic trend is consistent with our test results. The reason that some researchers use lower opening displacement during the OT is some mixtures failed too fast during the test (< 10 cycles), especially for the mixtures with high RAP content. Thus they reduce the opening displacement to get a reasonable number of cycles to failure from the OT (> 50~100 cycles), which is better for analysis procedure.
test results on Florida mixtures, OT can provide reasonable numbers of cycles under the standard opening displacement (0.025 inch). However, the load reduction rate
inch opening displacement, which is not recommended for the further inch opening displacement would be considered applicable for
evaluating the crack resistance of the Florida asphalt mixtures during the overlay test.
5.4 Fracture Mechanics Analysis
As mentioned in the literature review, fracture mechanics analysis provides an effective way to study the crack growth in asphalt mixture materials. The rate of cracking can be correlated with fracture mechanics parameters such as the stress intensity factto study the crack propagation process in order to evaluate the crack resistance in asphalt mixtures. Therefore, one of the purposes of this research study was to obtain the fracture properties of asphalt mixtures from the OT to better study the crack growth process in the asphalt mixtures during cracking. The conventional linear elastic fracture mechanisms presume that
Figure 5.9. Effect of Displacement Rate on OT Results on SPM 12-10895A
mentioned previously in the literature review phase, some other researchers also studied the effect of displacement rate on the OT number of cycles to failure. According to the test results presented by Texas Transportation Institute (TTI) researchers, the OT number of cycles to failure increased from 58 cycles to 1007 cycles when the opening displacement
inch for the Type C mixture. The OT number of cycles ent decreased from 0.025-inch
inch for the Type B mixture with 30% RAP. Therefore, the basic trend is consistent with our test results. The reason that some researchers use lower opening displacement during
during the test (< 10 cycles), especially for the mixtures with high RAP content. Thus they reduce the opening displacement to get a reasonable number of cycles to failure from the OT (> 50~100 cycles), which is better for analysis procedure.
test results on Florida mixtures, OT can provide reasonable numbers of cycles under the standard opening displacement (0.025 inch). However, the load reduction rate
inch opening displacement, which is not recommended for the further inch opening displacement would be considered applicable for
evaluating the crack resistance of the Florida asphalt mixtures during the overlay test.
As mentioned in the literature review, fracture mechanics analysis provides an effective way to study the crack growth in asphalt mixture materials. The rate of cracking can be correlated with fracture mechanics parameters such as the stress intensity factor. It is necessary to study the crack propagation process in order to evaluate the crack resistance in asphalt mixtures. Therefore, one of the purposes of this research study was to obtain the fracture
study the crack growth process in the asphalt mixtures during cracking. The conventional linear elastic fracture mechanisms presume that
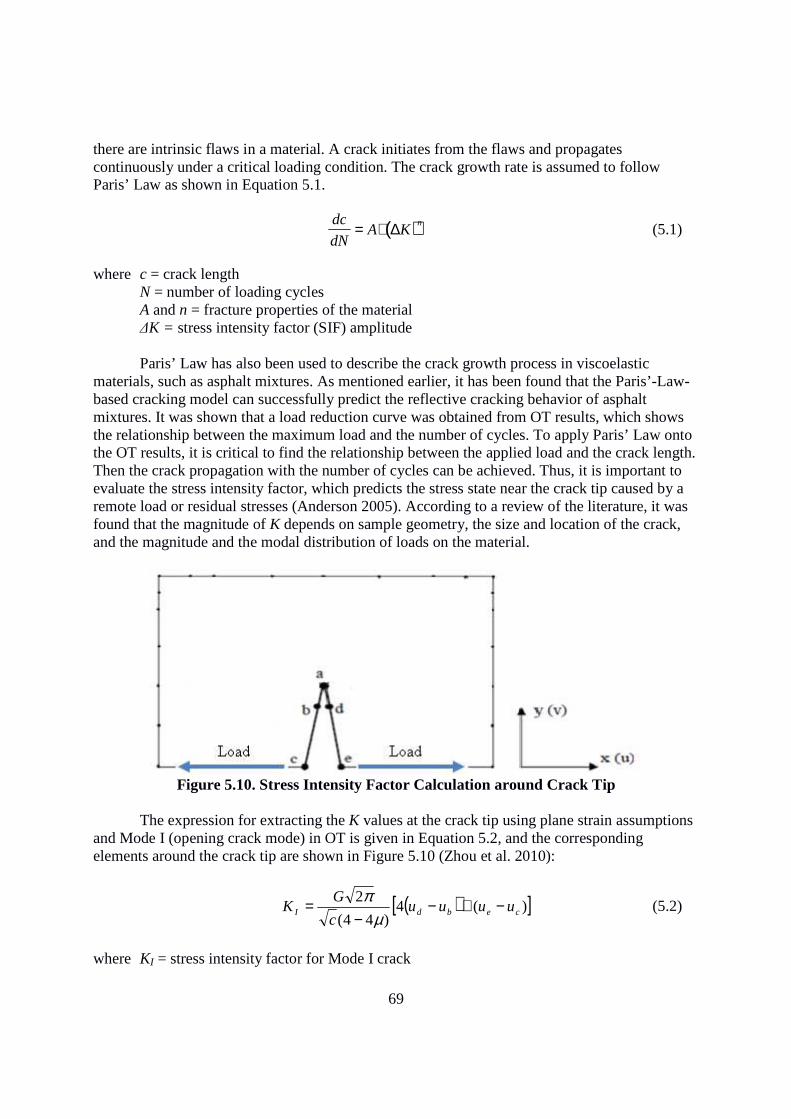
69
there are intrinsic flaws in a material. A crack initiates from the flaws and propagates continuously under a critical loading condition. The crack growth rate is assumed to follow Paris’ Law as shown in Equation 5.1.
dc
dN= A⋅ ∆K( )n
(5.1)
where c = crack length N = number of loading cycles A and n = fracture properties of the material ∆K = stress intensity factor (SIF) amplitude
Paris’ Law has also been used to describe the crack growth process in viscoelastic materials, such as asphalt mixtures. As mentioned earlier, it has been found that the Paris’-Law-based cracking model can successfully predict the reflective cracking behavior of asphalt mixtures. It was shown that a load reduction curve was obtained from OT results, which shows the relationship between the maximum load and the number of cycles. To apply Paris’ Law onto the OT results, it is critical to find the relationship between the applied load and the crack length. Then the crack propagation with the number of cycles can be achieved. Thus, it is important to evaluate the stress intensity factor, which predicts the stress state near the crack tip caused by a remote load or residual stresses (Anderson 2005). According to a review of the literature, it was found that the magnitude of K depends on sample geometry, the size and location of the crack, and the magnitude and the modal distribution of loads on the material.
Figure 5.10. Stress Intensity Factor Calculation around Crack Tip
The expression for extracting the K values at the crack tip using plane strain assumptions
and Mode I (opening crack mode) in OT is given in Equation 5.2, and the corresponding elements around the crack tip are shown in Figure 5.10 (Zhou et al. 2010):
( )[ ])(4)44(
2cebdI uuuu
c
GK −+−
−=
µπ
(5.2)
where KI = stress intensity factor for Mode I crack
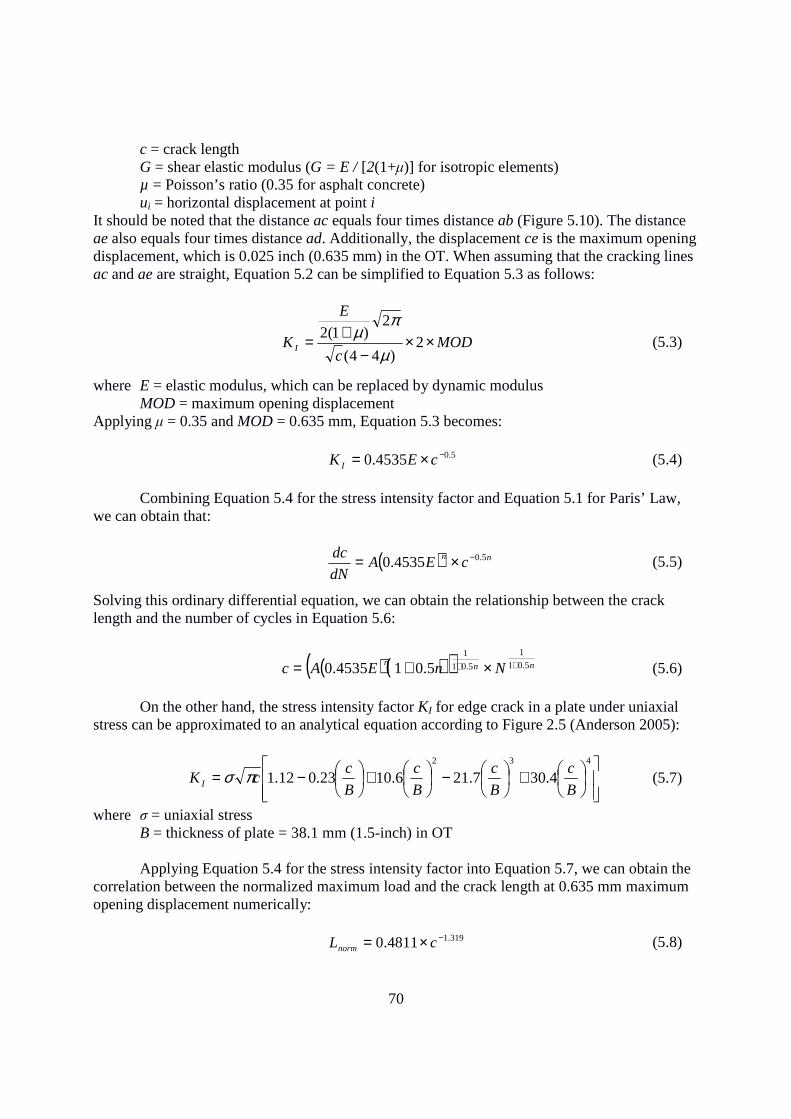
70
c = crack length G = shear elastic modulus (G = E / [2(1+µ)] for isotropic elements) µ = Poisson’s ratio (0.35 for asphalt concrete) ui = horizontal displacement at point i It should be noted that the distance ac equals four times distance ab (Figure 5.10). The distance ae also equals four times distance ad. Additionally, the displacement ce is the maximum opening displacement, which is 0.025 inch (0.635 mm) in the OT. When assuming that the cracking lines ac and ae are straight, Equation 5.2 can be simplified to Equation 5.3 as follows:
MODc
E
K I ××−
+= 2)44(
2)1(2
µ
πµ
(5.3)
where E = elastic modulus, which can be replaced by dynamic modulus MOD = maximum opening displacement Applying µ = 0.35 and MOD = 0.635 mm, Equation 5.3 becomes:
5.04535.0 −×= cEK I (5.4)
Combining Equation 5.4 for the stress intensity factor and Equation 5.1 for Paris’ Law, we can obtain that:
( ) nn cEAdN
dc 5.04535.0 −×= (5.5)
Solving this ordinary differential equation, we can obtain the relationship between the crack length and the number of cycles in Equation 5.6:
( ) ( )( ) nnn NnEAc 5.01
1
5.01
1
5.014535.0 ++ ×+= (5.6)
On the other hand, the stress intensity factor KI for edge crack in a plate under uniaxial stress can be approximated to an analytical equation according to Figure 2.5 (Anderson 2005):
+
−
+
−=432
4.307.216.1023.012.1B
c
B
c
B
c
B
ccK I πσ (5.7)
where σ = uniaxial stress B = thickness of plate = 38.1 mm (1.5-inch) in OT
Applying Equation 5.4 for the stress intensity factor into Equation 5.7, we can obtain the correlation between the normalized maximum load and the crack length at 0.635 mm maximum opening displacement numerically: 319.14811.0 −×= cLnorm (5.8)
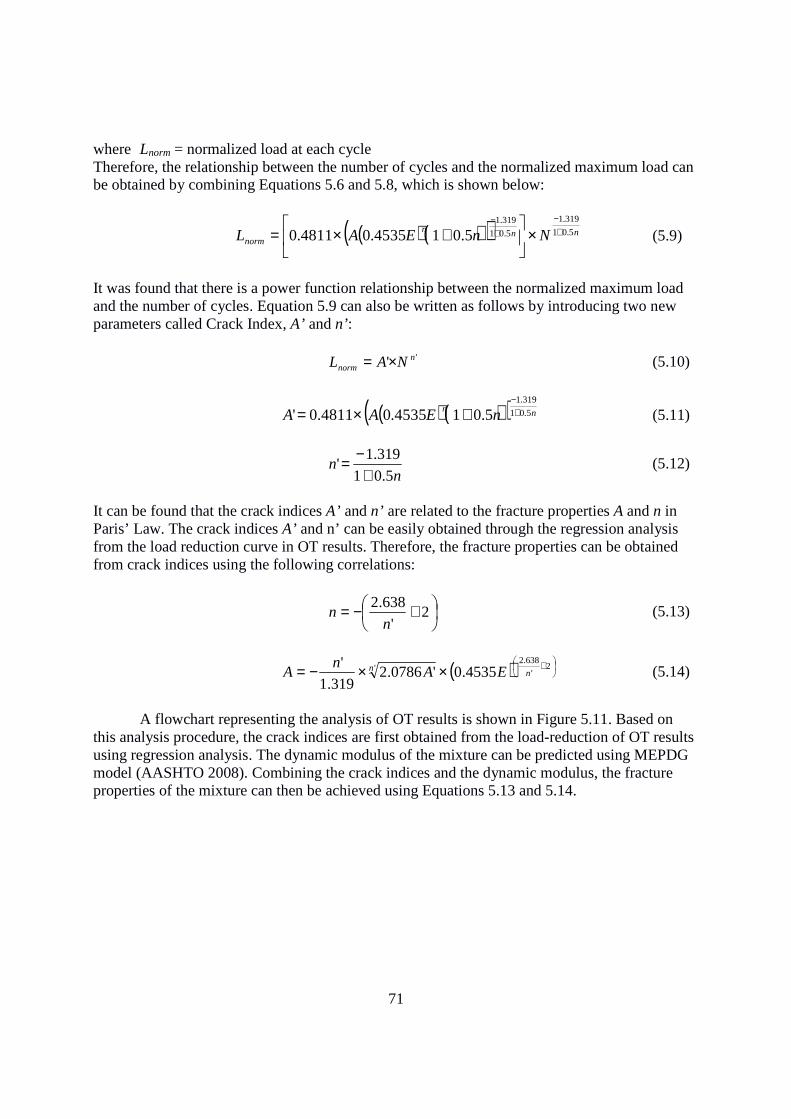
71
where Lnorm = normalized load at each cycle Therefore, the relationship between the number of cycles and the normalized maximum load can be obtained by combining Equations 5.6 and 5.8, which is shown below:
( ) ( )( ) nnnnorm NnEAL 5.01
319.1
5.01
319.1
5.014535.04811.0 +−
+−
×
+×= (5.9)
It was found that there is a power function relationship between the normalized maximum load and the number of cycles. Equation 5.9 can also be written as follows by introducing two new parameters called Crack Index, A’ and n’:
'' nnorm NAL ×= (5.10)
( ) ( )( ) nn nEAA 5.01
319.1
5.014535.04811.0' +−
+×= (5.11)
nn
5.01
319.1'
+−= (5.12)
It can be found that the crack indices A’ and n’ are related to the fracture properties A and n in Paris’ Law. The crack indices A’ and n’ can be easily obtained through the regression analysis from the load reduction curve in OT results. Therefore, the fracture properties can be obtained from crack indices using the following correlations:
+−= 2'
638.2
nn (5.13)
( )
+××−= 2'
638.2' 4535.0'0786.2
319.1
'n
n EAn
A (5.14)
A flowchart representing the analysis of OT results is shown in Figure 5.11. Based on this analysis procedure, the crack indices are first obtained from the load-reduction of OT results using regression analysis. The dynamic modulus of the mixture can be predicted using MEPDG model (AASHTO 2008). Combining the crack indices and the dynamic modulus, the fracture properties of the mixture can then be achieved using Equations 5.13 and 5.14.
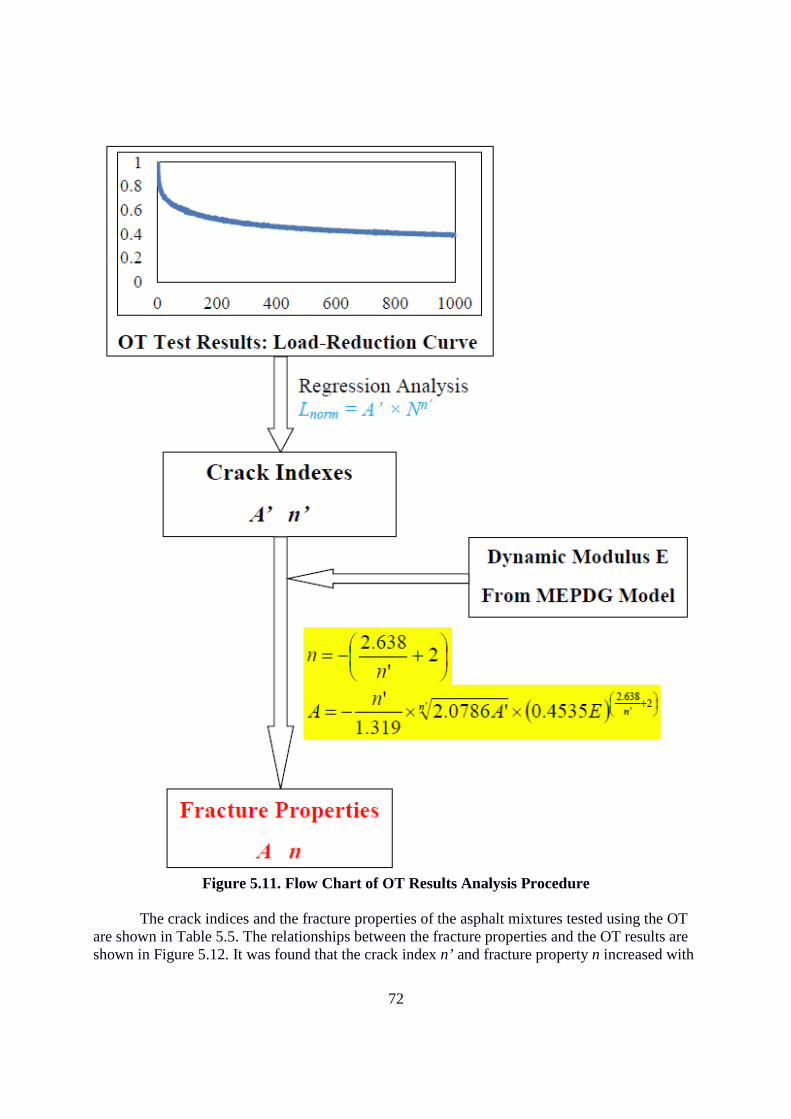
72
Figure 5.11. Flow Chart of OT Results Analysis Procedure
The crack indices and the fracture properties of the asphalt mixtures tested using the OT
are shown in Table 5.5. The relationships between the fracture properties and the OT results are shown in Figure 5.12. It was found that the crack index n’ and fracture property n increased with
the increase of number of cycles to failure for the mixtures. Based on a comparative study, the asphalt mixtures with greater n’with lower n’ or n. Therefore, teither the crack indices or the fracture properties.
(a) Crack Index
(b) Fracture Property
73
the increase of number of cycles to failure for the mixtures. Based on a comparative study, the n’ or n values had better crack resistance than the asphalt mixtures
. Therefore, the crack resistance of an asphalt mixture can be evaluated using either the crack indices or the fracture properties.
(a) Crack Index n’ with the Number of Cycles to Failure
(b) Fracture Property n with the Number of Cycles to Failure
the increase of number of cycles to failure for the mixtures. Based on a comparative study, the values had better crack resistance than the asphalt mixtures
he crack resistance of an asphalt mixture can be evaluated using
with the Number of Cycles to Failure
with the Number of Cycles to Failure
(c) Crack Index
(d) Fracture Property Figure 5.12. Relationships between Crack Index or Fracture Property and OT Results
It should be noted that the fracture properties were c
analysis procedure with a 2D opening crack model based on a theoretical approach. However, it could introduce some discrepancies in the fracture properties if a different analysis procedure or a different model were used by trecommended to use the crack indices, which can be directly obtained from the test results, to represent the ability to resist cracking for asphalt concrete during the overlay testing. Theindices can also be used to compare the crack resistance among different types of asphalt mixtures.
74
) Crack Index A’ with the Number of Cycles to Failure
(d) Fracture Property A with the Number of Cycles to FailureFigure 5.12. Relationships between Crack Index or Fracture Property and OT Results
It should be noted that the fracture properties were computed using this simplified analysis procedure with a 2D opening crack model based on a theoretical approach. However, it could introduce some discrepancies in the fracture properties if a different analysis procedure or a different model were used by the other researchers. Therefore, to reduce the discrepancies, it is recommended to use the crack indices, which can be directly obtained from the test results, to represent the ability to resist cracking for asphalt concrete during the overlay testing. Theindices can also be used to compare the crack resistance among different types of asphalt
with the Number of Cycles to Failure
with the Number of Cycles to Failure
Figure 5.12. Relationships between Crack Index or Fracture Property and OT Results
omputed using this simplified analysis procedure with a 2D opening crack model based on a theoretical approach. However, it could introduce some discrepancies in the fracture properties if a different analysis procedure or
he other researchers. Therefore, to reduce the discrepancies, it is recommended to use the crack indices, which can be directly obtained from the test results, to represent the ability to resist cracking for asphalt concrete during the overlay testing. The crack indices can also be used to compare the crack resistance among different types of asphalt
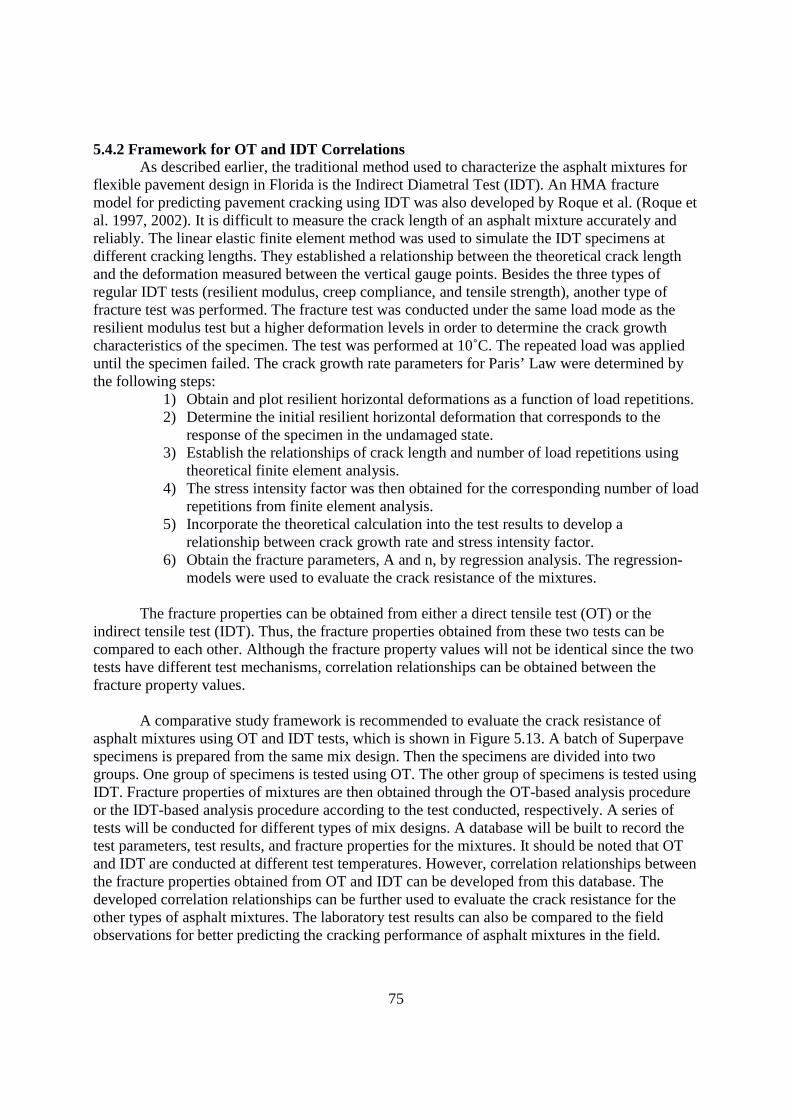
75
5.4.2 Framework for OT and IDT Correlations As described earlier, the traditional method used to characterize the asphalt mixtures for flexible pavement design in Florida is the Indirect Diametral Test (IDT). An HMA fracture model for predicting pavement cracking using IDT was also developed by Roque et al. (Roque et al. 1997, 2002). It is difficult to measure the crack length of an asphalt mixture accurately and reliably. The linear elastic finite element method was used to simulate the IDT specimens at different cracking lengths. They established a relationship between the theoretical crack length and the deformation measured between the vertical gauge points. Besides the three types of regular IDT tests (resilient modulus, creep compliance, and tensile strength), another type of fracture test was performed. The fracture test was conducted under the same load mode as the resilient modulus test but a higher deformation levels in order to determine the crack growth characteristics of the specimen. The test was performed at 10˚C. The repeated load was applied until the specimen failed. The crack growth rate parameters for Paris’ Law were determined by the following steps:
1) Obtain and plot resilient horizontal deformations as a function of load repetitions. 2) Determine the initial resilient horizontal deformation that corresponds to the
response of the specimen in the undamaged state. 3) Establish the relationships of crack length and number of load repetitions using
theoretical finite element analysis. 4) The stress intensity factor was then obtained for the corresponding number of load
repetitions from finite element analysis. 5) Incorporate the theoretical calculation into the test results to develop a
relationship between crack growth rate and stress intensity factor. 6) Obtain the fracture parameters, A and n, by regression analysis. The regression-
models were used to evaluate the crack resistance of the mixtures.
The fracture properties can be obtained from either a direct tensile test (OT) or the indirect tensile test (IDT). Thus, the fracture properties obtained from these two tests can be compared to each other. Although the fracture property values will not be identical since the two tests have different test mechanisms, correlation relationships can be obtained between the fracture property values.
A comparative study framework is recommended to evaluate the crack resistance of
asphalt mixtures using OT and IDT tests, which is shown in Figure 5.13. A batch of Superpave specimens is prepared from the same mix design. Then the specimens are divided into two groups. One group of specimens is tested using OT. The other group of specimens is tested using IDT. Fracture properties of mixtures are then obtained through the OT-based analysis procedure or the IDT-based analysis procedure according to the test conducted, respectively. A series of tests will be conducted for different types of mix designs. A database will be built to record the test parameters, test results, and fracture properties for the mixtures. It should be noted that OT and IDT are conducted at different test temperatures. However, correlation relationships between the fracture properties obtained from OT and IDT can be developed from this database. The developed correlation relationships can be further used to evaluate the crack resistance for the other types of asphalt mixtures. The laboratory test results can also be compared to the field observations for better predicting the cracking performance of asphalt mixtures in the field.
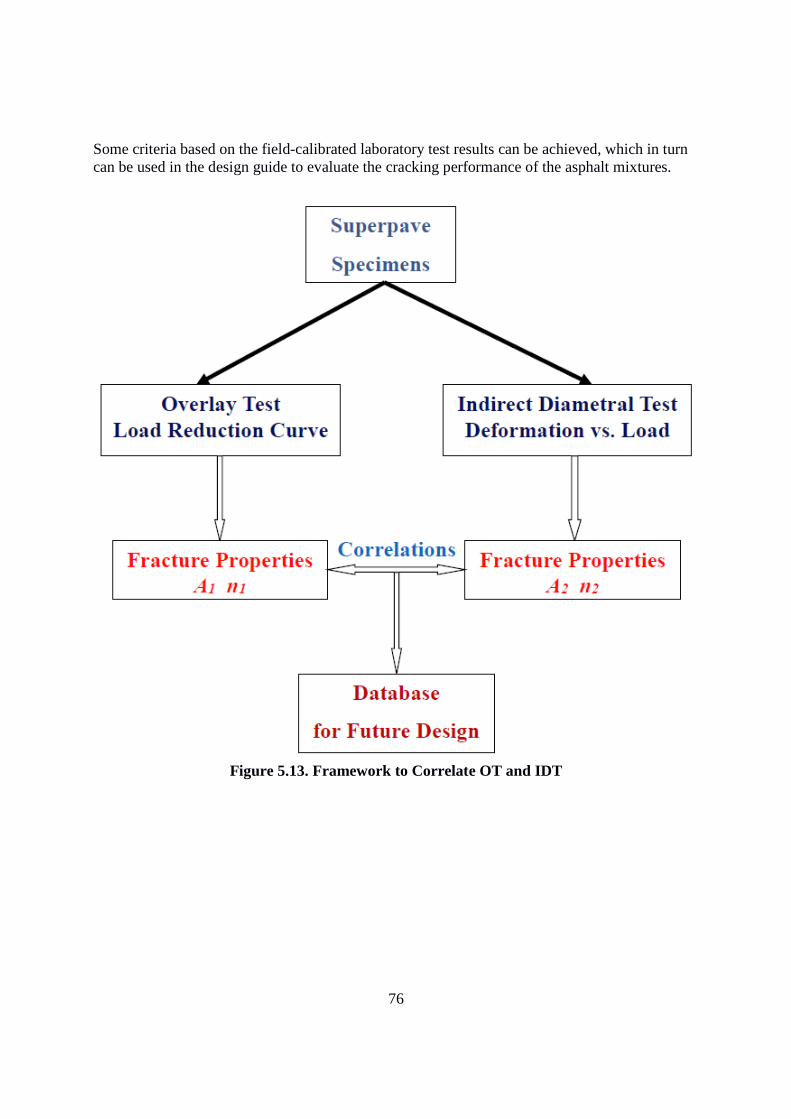
76
Some criteria based on the field-calibrated laboratory test results can be achieved, which in turn can be used in the design guide to evaluate the cracking performance of the asphalt mixtures.
Figure 5.13. Framework to Correlate OT and IDT
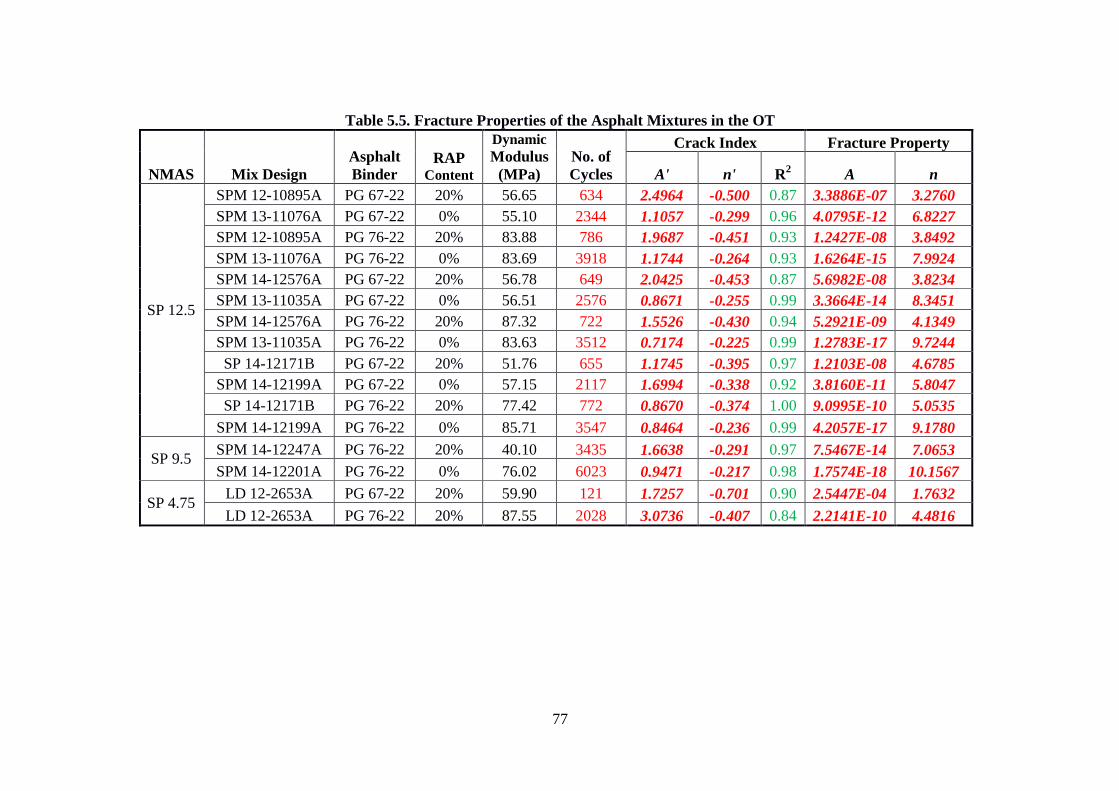
77
Table 5.5. Fracture Properties of the Asphalt Mixtures in the OT
NMAS Mix Design Asphalt Binder
RAP Content
Dynamic Modulus (MPa)
No. of Cycles
Crack Index Fracture Property
A' n' R2 A n
SP 12.5
SPM 12-10895A PG 67-22 20% 56.65 634 2.4964 -0.500 0.87 3.3886E-07 3.2760 SPM 13-11076A PG 67-22 0% 55.10 2344 1.1057 -0.299 0.96 4.0795E-12 6.8227 SPM 12-10895A PG 76-22 20% 83.88 786 1.9687 -0.451 0.93 1.2427E-08 3.8492 SPM 13-11076A PG 76-22 0% 83.69 3918 1.1744 -0.264 0.93 1.6264E-15 7.9924 SPM 14-12576A PG 67-22 20% 56.78 649 2.0425 -0.453 0.87 5.6982E-08 3.8234 SPM 13-11035A PG 67-22 0% 56.51 2576 0.8671 -0.255 0.99 3.3664E-14 8.3451 SPM 14-12576A PG 76-22 20% 87.32 722 1.5526 -0.430 0.94 5.2921E-09 4.1349 SPM 13-11035A PG 76-22 0% 83.63 3512 0.7174 -0.225 0.99 1.2783E-17 9.7244 SP 14-12171B PG 67-22 20% 51.76 655 1.1745 -0.395 0.97 1.2103E-08 4.6785
SPM 14-12199A PG 67-22 0% 57.15 2117 1.6994 -0.338 0.92 3.8160E-11 5.8047 SP 14-12171B PG 76-22 20% 77.42 772 0.8670 -0.374 1.00 9.0995E-10 5.0535
SPM 14-12199A PG 76-22 0% 85.71 3547 0.8464 -0.236 0.99 4.2057E-17 9.1780
SP 9.5 SPM 14-12247A PG 76-22 20% 40.10 3435 1.6638 -0.291 0.97 7.5467E-14 7.0653 SPM 14-12201A PG 76-22 0% 76.02 6023 0.9471 -0.217 0.98 1.7574E-18 10.1567
SP 4.75 LD 12-2653A PG 67-22 20% 59.90 121 1.7257 -0.701 0.90 2.5447E-04 1.7632 LD 12-2653A PG 76-22 20% 87.55 2028 3.0736 -0.407 0.84 2.2141E-10 4.4816
78
CHAPTER 6
SUMMARY AND CONCLUSIONS
6.1 Summary
The primary objective of this research study was to evaluate the applicability of using overlay test to characterize common asphalt mixtures for crack resistance in the flexible pavement design in Florida. The crack resistance of common Florida asphalt mixtures was evaluated using laboratory overlay test procedure. An overlay test procedure based on Texas test procedure Tex-248-F was adopted to accommodate Florida test methods on asphalt mixtures. Some FDOT test methods on asphalt concrete mixing and compaction, maximum theoretical specific gravity measurement, air void measurement, and sample preparations, were adopted in the test procedure.
Nine standard mixes were selected for this study, which represent some of the most
commonly used mixtures in Florida. The mixes include three SP-12.5 mixes without RAP content, three SP-12.5 mixes with 20% RAP, one SP-9.5 mix without RAP content, one SP-9.5 mix with 20% RAP, and one SP-4.75 mix with 20% RAP. Due to the limit of this research study, mix designs with granite as aggregates were selected. Three types of granite, GA553, NS315, and GA185, were used as the aggregate in the mixtures. In addition, the mixtures were prepared using both virgin asphalt binder (PG 67-22) and polymer-modified asphalt binder (PG 76-22).
The load reduction curve, which shows the nominal maximum load at each load cycle,
was obtained from the overlay test data file. The number of cycles to failure, which represents the cracking performance of the asphalt mixture, was obtained through the load reduction curve. The test results had a good agreement on the three replicate samples for each type of mixture. The COV were less than 20%. The 0.025-inch opening width was used in the OT throughout the evaluation of FDOT asphalt mixtures. In addition, a lower maximum opening displacement, 0.0125-inch, was also studied on one type of mixture (SP-12.5 with 20% RAP) to evaluate the effect of displacement rate on the overlay test. A total of 51 overlay specimens were tested for the laboratory evaluation phase of the project.
6.2 Findings and Conclusions
The effects of material characteristics, polymer modifier, and RAP content on the crack resistance of Florida asphalt mixtures were evaluated. Conclusions were drawn as follows:
1. It was found that the type of granite did not have a significant effect on the cracking
performance of mixtures. The mixtures with different type of granite had similar performance on crack resistance.
2. It was shown that the SP-9.5 mixtures had the best crack resistance compared to the SP-
12.5 and SP-4.75 mixtures when 20% RAP was included in the mixes. When a PG 67-22

79
virgin binder was used, the SP-4.75 mixtures had poor cracking performance, with roughly 100 cycles to failure. However, the SP-4.75 mixtures could have better cracking performance than the SP-12.5 mixtures if a PG 76-22 (PMA) binder was used instead of a PG 67-22 virgin binder.
3. Two types of asphalt binder, PG 67-22 and PG 76-22 (PMA) binders were used to study
the polymer modifier effects on the crack resistance of mixtures. For SP-12.5 mix designs without RAP, PMA binder (PG76-22) could improve the number of cycles to failure by 50% to 100%. For SP-12.5 mix designs with 20% RAP, PMA binder only improved the number of cycles to failure by 10% to 25%. However, use of a PMA binder could significantly improve the cracking performance of the SP-4.75 mixture with 20% RAP included.
4. It was found that RAP reduced the crack resistance of asphalt mixtures. For the SP-12.5
mixtures, the number of cycles to failure in OT was reduced to 20% to 30% when 20% RAP was included in the mix. For the SP-9.5 mixtures, the number of cycles to failure in OT was decreased by 50% when 20% RAP was included in the mix. To further evaluate the effect of RAP content on the crack resistance of mixtures, it is necessary to characterize the RAP.
5. The effect of opening displacement rate was also evaluated. It was found that the lower
displacement rate would significantly increase the number of cycles to failure during the OT. When the opening displacement was halved, the number of cycles to failure was almost increased by 100 times. According to the experimental results, 0.025-inch standard opening displacement is a reasonable parameter value, which is recommended for Florida mixtures in OT. Fracture mechanics analysis was conducted on the overlay test results based on Paris’
Law. A simplified analysis procedure was developed to calculate the fracture properties, A and n, through theoretical and numerical derivations. In addition to A and n, crack indices A’ and n’, which can be easily obtained from the overlay test load reduction curve, were introduced to evaluate the crack resistance of asphalt mixtures. Correlation relationships between the crack indices and the fracture properties were developed. Based on a comparative study, the asphalt mixtures with greater n’ or n values had better crack resistance than the asphalt mixtures with lower n’ or n. It was found that the crack resistance of asphalt mixture can be evaluated using either the crack indices or the fracture properties. To reduce the discrepancies in the analysis results from different analysis procedures, use of the crack indices to evaluate the crack resistance of asphalt mixture in OT is recommended.
6.3 Recommendations
Based on the conclusions and limitations of this research study, the primary recommendations are described as follows:
The experimental program can be expanded to the other types of asphalt mixtures.
Asphalt mixture with other types of aggregates, such as limestone, can be evaluated using the OT

80
procedure. Mixtures with different aggregate sizes, asphalt binder types, or RAP contents can also be evaluated. A database can be built to record the test parameters, test results, and fracture properties for different types of mix designs. The fracture properties obtained from the OT-based analysis procedure can be compared to the results from the other tests. Correlation relationships can be developed to compare these tests from the database, which can be further used to evaluate the crack resistance of other types of mixtures. Then, the laboratory test results can be compared to the field observations to better predict the cracking performance of asphalt mixtures in the field. Some criteria based on the field-calibrated laboratory test results can be adopted into the design guide to evaluate the cracking performance of the asphalt mixtures.

81
REFERENCES Al-Qadi, I.L., Elseifi, M.A., and Leonard, D. (2004). “Development of an Overlay Design Model
for Reflective Cracking with and without Steel Reinforcement.” Journal of the Association of Asphalt Pavement Technologists, 72, 388-423.
American Association of State Highway and Transportation Officials (AASHTO). (1993). Guide
for Design of Pavement Structures. Washington, D. C. American Association of State Highway and Transportation Officials (AASHTO). (2010).
Mechanistic-Empirical Pavement Design Guide: A Manual of Practice. AASHTO Designation: MEPDG-1. Washington, D. C.
American Association of State Highway and Transportation Officials (AASHTO). (2010).
“Standard Method of Test for Bulk Specific Gravity of Compacted Hot-Mix Asphalt Using Saturated Surface-Dry Specimens.” AASHTO T 166-10, Washington, D. C.
American Association of State Highway and Transportation Officials (AASHTO). (2012).
“Standard Method of Test for Preparing and Determining the Density of Hot-Mix Asphalt (HMA) Specimens by Means of the Superpave Gyratory Compactor.” AASHTO T 312-12, Washington, D. C.
Anderson T. L. (2005). Fracture Mechanics: Fundamentals and Applications, CRC Press, Tylor
& Francis Group. Bennert, T., and Maher, A. (2008). “Field and Laboratory Evaluation of a Reflective Crack
Interlayer in New Jersey.” Transportation Research Record (2084), 114-123. Bennert, T., Worden, M., and Turo, M. (2009). “Field and Laboratory Forensic Analysis of
Reflective Cracking on Massachusetts Interstate 495.” Transportation Research Record (2126), 27-38.
Ceylan, H., Gopalakrishnan, K., and Lytton, R. L. (2011). “Neural Networks Modeling of Stress
Growth in Asphalt Overlays due to Load and Thermal Effects during Reflection Cracking.” J Mater Civil Eng, 23(3), 221-229.
Chen, D. H. (2007). “Using rolling dynamic deflectometer and overlay tester to determine the
reflective cracking potential.” Journal of Testing and Evaluation, 35(6), 644-654. Chen, D. H., and Hong F. (2010) “Lessons Learned from RAP Sections with 17 Years of
Service.” Journal of Testing and Evaluation, 38(4), p JTE102464. Dave, E. V., and Buttlar, W. G. (2010). “Thermal reflective cracking of asphalt concrete
overlays.” International Journal of Pavement Engineering, 11(6), 477-488.
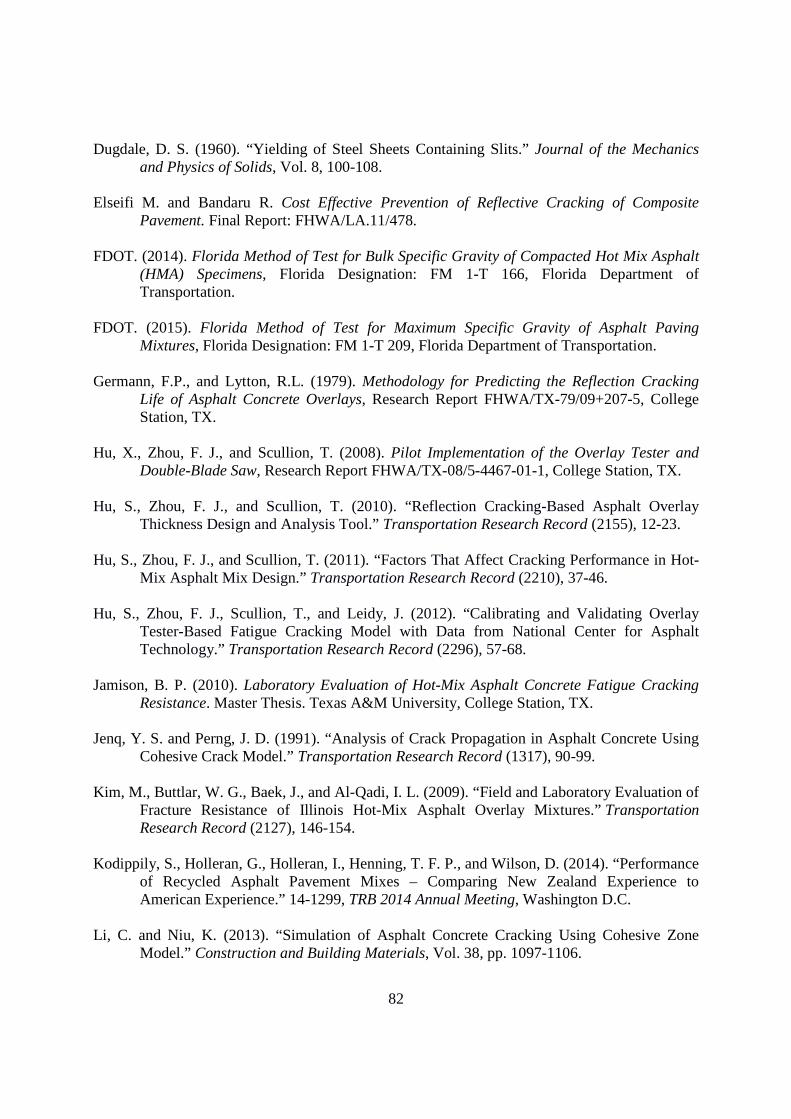
82
Dugdale, D. S. (1960). “Yielding of Steel Sheets Containing Slits.” Journal of the Mechanics and Physics of Solids, Vol. 8, 100-108.
Elseifi M. and Bandaru R. Cost Effective Prevention of Reflective Cracking of Composite
Pavement. Final Report: FHWA/LA.11/478. FDOT. (2014). Florida Method of Test for Bulk Specific Gravity of Compacted Hot Mix Asphalt
(HMA) Specimens, Florida Designation: FM 1-T 166, Florida Department of Transportation.
FDOT. (2015). Florida Method of Test for Maximum Specific Gravity of Asphalt Paving
Mixtures, Florida Designation: FM 1-T 209, Florida Department of Transportation. Germann, F.P., and Lytton, R.L. (1979). Methodology for Predicting the Reflection Cracking
Life of Asphalt Concrete Overlays, Research Report FHWA/TX-79/09+207-5, College Station, TX.
Hu, X., Zhou, F. J., and Scullion, T. (2008). Pilot Implementation of the Overlay Tester and
Double-Blade Saw, Research Report FHWA/TX-08/5-4467-01-1, College Station, TX. Hu, S., Zhou, F. J., and Scullion, T. (2010). “Reflection Cracking-Based Asphalt Overlay
Thickness Design and Analysis Tool.” Transportation Research Record (2155), 12-23. Hu, S., Zhou, F. J., and Scullion, T. (2011). “Factors That Affect Cracking Performance in Hot-
Mix Asphalt Mix Design.” Transportation Research Record (2210), 37-46. Hu, S., Zhou, F. J., Scullion, T., and Leidy, J. (2012). “Calibrating and Validating Overlay
Tester-Based Fatigue Cracking Model with Data from National Center for Asphalt Technology.” Transportation Research Record (2296), 57-68.
Jamison, B. P. (2010). Laboratory Evaluation of Hot-Mix Asphalt Concrete Fatigue Cracking
Resistance. Master Thesis. Texas A&M University, College Station, TX. Jenq, Y. S. and Perng, J. D. (1991). “Analysis of Crack Propagation in Asphalt Concrete Using
Cohesive Crack Model.” Transportation Research Record (1317), 90-99. Kim, M., Buttlar, W. G., Baek, J., and Al-Qadi, I. L. (2009). “Field and Laboratory Evaluation of
Fracture Resistance of Illinois Hot-Mix Asphalt Overlay Mixtures.” Transportation Research Record (2127), 146-154.
Kodippily, S., Holleran, G., Holleran, I., Henning, T. F. P., and Wilson, D. (2014). “Performance
of Recycled Asphalt Pavement Mixes – Comparing New Zealand Experience to American Experience.” 14-1299, TRB 2014 Annual Meeting, Washington D.C.
Li, C. and Niu, K. (2013). “Simulation of Asphalt Concrete Cracking Using Cohesive Zone
Model.” Construction and Building Materials, Vol. 38, pp. 1097-1106.
83
Lytton, R. L. (1989). “Use of Geotextiles for Reinforcement and Strain Relief in Asphaltic
Concrete.” Geotextiles and Geomembranes, Vol. 8, pp. 217-237. Ma, W., Tran, N. H., Taylor, A. J., and Li, X. (2014). “Proposed Improvements to Overlay Test
for Determining Cracking Resistance of Asphalt Mixtures.” 14-3183, TRB 2014 Annual Meeting, Washington D.C.
Minhoto, M. J. C., Pais, J. C., and Pereira, P. A. A. (2008). “The Temperature Effect on the
Reflective Cracking of Asphalt Overlays.” Road Materials and Pavement Design, 9(4), 615-632.
Mogawer, W. S., Austerman, A. J., Daniel, J. S., Zhou, F. J., and Bennert, T. (2011). “Evaluation
of the effects of hot mix asphalt density on mixture fatigue performance, rutting performance and MEPDG distress predictions.” International Journal of Pavement Engineering, 12(2), 161-175.
Monismith, C. L. and Coetzee, N. F. (1980). “Reflection Cracking: Analysis, Laboratory Studies
and Design Consideration.” Proceedings of Association of Asphalt Paving Technologist, Vol. 49, pp. 268-313.
NCHRP 1-37A (2004). Mechanistic-Empirical Design of New and Rehabilitated Pavement
Structures. Nunn, M. (1989). “An investigation of Reflection Cracking in Composite Pavements in the
United Kingdom.” Proceedings of 1st International RILEM Conference on Reflective Cracking in Pavements, Assessment and Control, Liege University, Belgium.
Owusu-Antwi, E. B., Khazanovich, L., Titus-Glover, L., Council, N. R., and Natl Res, C. (1998).
“Mechanistic-based model for predicting reflective cracking in asphalt concrete-overlaid pavements.” Design and Rehabilitation of Pavements 1998(1629), 234-241.
Paris, P.C., and Erdogan, E. (1963). “A Critical Analysis of Crack Propagation Laws.” Journal
of Basic Engineering, 85, 528-883. Paulino, G. H., Song, S. H., and Buttlar, W. G. (2004). “Cohesive Zone Modeling of Fracture in
Asphalt Concrete.” Proceedings of the 5th International RILEM Conference on Cracking in Pavements: Mitigation, Risk Assessment, and Prevention, pp. 63-70.
Ping, W. V., and Xiao, Y., (2009). Effects of Aggregate Gradation, Aggregate Type, and SBS
Polymer Modified Binder on Florida HMAC Fracture Energy Properties. Research Report No. FL/DOT/RMC/BD-543-20, Final Report of the Florida Department of Transportation, Florida State University, Tallahassee, FL.

84
Roque, R., and Buttlar, W. G. (1992). “The Development of a Measurement and Analysis System to Accurately Determine Asphalt Concrete Properties Using the Indirect Tensile Mode.” Journal of the Association of Asphalt Paving Technologies, Vol. 61, pp. 304-332.
Roque, R., Buttlar, W. G., Ruth, B. E., Tia, M., Dickson, S. W., and Reid, B. (1997). Evaluation
of SHRP Indirect Tension Tester to Mitigate Cracking in Asphalt Pavement and Overlays. Final Report of the Florida Department of Transportation, University of Florida, Gainesville, FL.
Roque, R., Birgisson, B., Sangpetgnam, B., and Zhang, Z. (2002). “Hot Mix Asphalt Fracture
Mechanics: A Fundamental Crack Growth Law for Asphalt Mixtures.” Journal of the Association of Asphalt Paving Technologies, Vol. 71, 2002, pp. 816-828.
Schapery, R. A. (1973). A Theory of Crack Growth in Visco-Elastic Media, Report MM 2764-73-
1, Mechanics and Materials Research Centre, Texas A&M University. Seeds, S.B., McCullough, B.F., and Carmichael, F. (1985). “Asphalt Concrete Overlay Design
Procedure for Portland Cement Concrete Pavements.” Transportation Research Record (1007), Washington, D.C., 26-36.
Soares, J. B.de Freitas, F. A. C., and Allen, D. H. (2003). ‘Crack Modeling of Asphaltic Mixtures
Considering Heterogeneity of the Material.” Transportation Research Record (1832), 113-120.
Song, S. H., Paulino, G. H., and Buttlar, W. G. (2006). “Simulation of Crack Propagation in
Asphalt Concrete Using an Intrinsic Cohesive Zone Model.” Journal of Engineering Mechanics, Vol. 132, pp. 1215-1223.
Sousa, J. B., Pais, J. C., Saim, R., Way, G. B., Stubstad, R. N., and Trb, T. R. B. (2002).
“Mechanistic-empirical overlay design method for reflective cracking.” Design and Rehabilitation of Pavements 2002: Pavement Design, Management, and Performance (1809), 209-217.
Sousa, J. B., Pais, J. C., and Way, G. B. (2005). “A mechanistic-empirical based overlay design
method for reflective cracking.” Road Materials and Pavement Design, 6(3), 339-363. TxDOT. (2014). Test Procedure for Overlay Test, TxDOT Designation: Tex-248-F, Texas
Department of Transportation. Tsai, F.-L., Lytton, R. L., and Lee, S. (2010). “Prediction of Reflection Cracking in Hot-Mix
Asphalt Overlays.” Transportation Research Record (2155), 43-54. Tran, N. H., Taylor, A., and Willis, R. (2012). Effect of Rejuvenator on Performance Properties
of HMA Mixtures with High RAP and RAP Contents, NCAT Report 12-05, National Center for Asphalt Technology, Auburn, AL.
85
Treybig, H.J., McCullough, B.F., Smith, P., and Von Quintus, H. (1977). Overlay Design and
Reflection Cracking Analysis for Rigid Pavements, U.S. Federal Highway Administration Report Nos. FHWA-RD-77-66 and 67.
Troxler Electronic Laboratories, Inc. (2012). Manual of Operation and Instruction Model 5950
Overlay Tester (Beta), Research Triangle Park, NC. Vahidi, S., Mogawer, W. S., and Booshehrian, A. (2014). “Effects of GTR and Treated GTR on
Asphalt Binder and High-RAP Mixtures.” Journal of Materials in Civil Engineering, 26: 721-727.
Van Gurp, A.P.M., and Molenaar, A.A.A. (1989). “Simplified Method to Predict Reflective
Cracking in Asphalt Overlays.” RILEM Conference on Reflective Cracking in Pavements, Leige, Belgium, 190-198.
Walubita, L. F., Jamison, B. P., Das, G., Scullion, T., Martin, A. E., Rand, D., and Mikhail, M.
(2011). “Search for a Laboratory Test to Evaluate Crack Resistance of Hot-Mix Asphalt.” Transportation Research Record (2210), 73-80.
Walubita, L. F., Faruk, A. N., Das, G., Tanvir, H. A., Zhang, J., and Scullion, T. (2012). The
Overlay Tester: A Sensitivity Study to Improve Repeatability and Minimize Variability in the Test Results. Research Report No. FHWA/TX-12/0-6607-1, Texas Department of Transportation, Austin, TX.
Walubita, L. F., Faruk, A. M., Alvarez, A. E., and Scullion, T. (2013). “The Overlay Tester
(OT): Using the Fracture Energy Index concept to analyze the OT monotonic loading test data.” Construction Build Materials, 40, 802-811.
Walubita, L. F., Faruk, A. N., Koohi, Y., Luo, R., Scullion, T., and Lytton, R. L. (2013). The
Overlay Tester (OT): Comparison with Other Crack Test Methods and Recommendations for Surrogate Crack Test. Research Report No. FHWA/TX-13/0-6607-2, Texas Department of Transportation, Austin, TX.
Willis, J. R., Turner, P., Julian, G., Tran, N. H., and Padula, F. G. (2013). Alternative Methods
for Increasing the Durability of RAP Mixtures, NCAT Report 13-08, National Center for Asphalt Technology, Auburn, AL.
Wu, R. (2005). Finite Element Analysis of Reflective Cracking in Asphalt Concrete Overlays,
Ph.D. Dissertation, University of California, Berkeley, December 2005. Yang, E., Ping, W.V., Qiu, Y., and Sheng, B., “A Predictive Approach of Dynamic Modulus for
Characterizing Florida Hot Mix Asphalt Mixtures,” International Journal of Forensic Engineering, Vol. 2, No. 3, 2015, pp. 209-230.
86
Zhou, F. and Scullion, T. (2003). Upgrade Overlay Tester and Its Application to Characterize Reflection Cracking Resistance of Asphalt Mixtures. Research Report No. FHWA/TX-04/0-4467-1, Texas Department of Transportation, Austin, TX.
Zhou, F. and Scullion, T. (2005). Overlay Tester: A Rapid Performance Related Crack
Resistance Test. Research Report No. FHWA/TX-05/0-4467-2, Texas Department of Transportation, Austin, TX.
Zhou, F. J., Hu, S., Chen, D. H., and Scullion, T. (2007). Development and Verification of the
Overlay Tester Based Fatigue Cracking Prediction Approach, Research Report No. FHWA/TX-07/9-1502-01-8, Texas Department of Transportation, Austin, TX.
Zhou, F. J., Hu, S., Chen, D. H., and Scullion, T. (2007). “Overlay tester – Simple performance
test for fatigue cracking.” Transportation Research Record (2001), 1-8. Zhou F., Hu, S., Hu, X., and Scullion, T. (2009). Mechanistic-Empirical Asphalt Overlay
Thickness Design and Analysis System. Research Report No. FHWA/TX-09/0-5123-3, Texas Department of Transportation, Austin, TX.
Zhou, F. J., Hu, S., Hu, X. D., Scullion, T., Mikhail, M., and Walubita, L. F. (2010).
“Development, Calibration, and Verification of a New Mechanistic-Empirical Reflective Cracking Model for HMA Overlay Thickness Design and Analysis.” J Transp Eng-Asce, 136(4), 353-369.
Zhou, F., Fernando, E., and Scullion, T. (2010). Development, Calibration, and Validation of
Performance Prediction Models for the Texas M-E Flexible Pavement Design System. Research Report No. FHWA/TX-10/0-5798-2, Texas Department of Transportation, Austin, TX.
Zhou F., Hu, S., and Scullion, T. (2013). Balanced RAP/RAS Mix Design and Performance
Evaluation System for Project-Specific Service Conditions, Research Report No. FHWA/TX-13/0-6092-3, Texas Department of Transportation, Austin, TX.
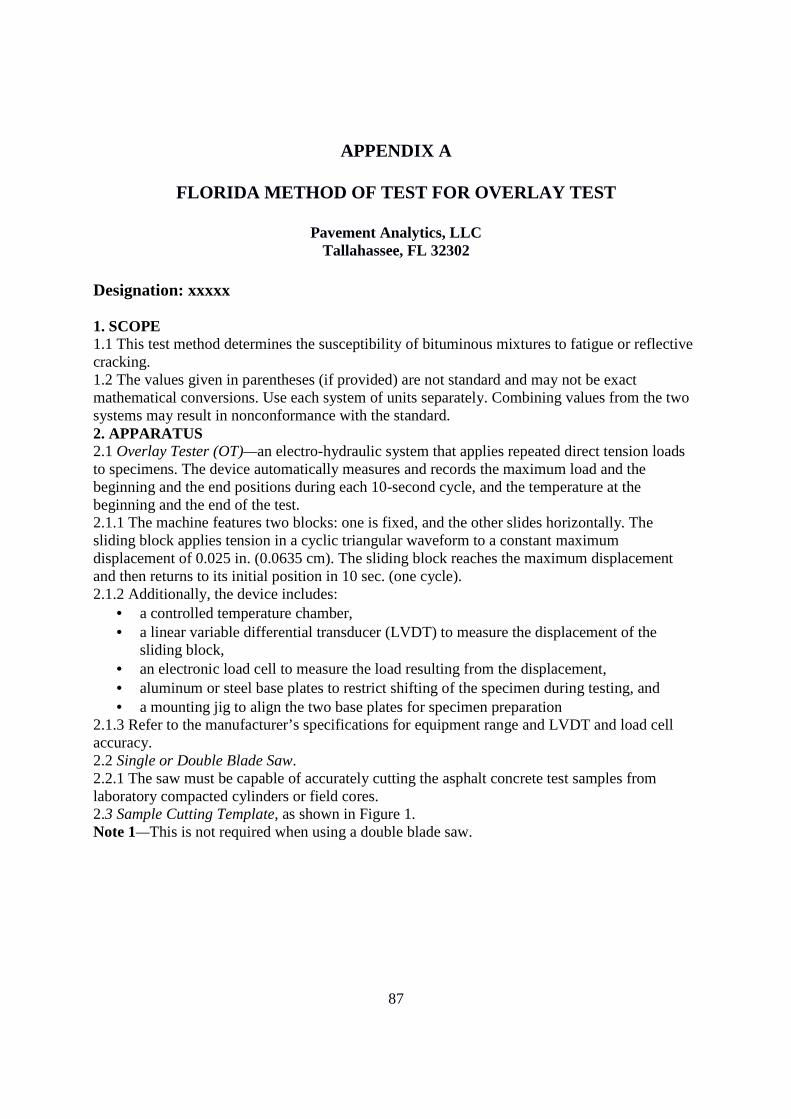
87
APPENDIX A
FLORIDA METHOD OF TEST FOR OVERLAY TEST
Pavement Analytics, LLC Tallahassee, FL 32302
Designation: xxxxx 1. SCOPE 1.1 This test method determines the susceptibility of bituminous mixtures to fatigue or reflective cracking. 1.2 The values given in parentheses (if provided) are not standard and may not be exact mathematical conversions. Use each system of units separately. Combining values from the two systems may result in nonconformance with the standard. 2. APPARATUS 2.1 Overlay Tester (OT)—an electro-hydraulic system that applies repeated direct tension loads to specimens. The device automatically measures and records the maximum load and the beginning and the end positions during each 10-second cycle, and the temperature at the beginning and the end of the test. 2.1.1 The machine features two blocks: one is fixed, and the other slides horizontally. The sliding block applies tension in a cyclic triangular waveform to a constant maximum displacement of 0.025 in. (0.0635 cm). The sliding block reaches the maximum displacement and then returns to its initial position in 10 sec. (one cycle). 2.1.2 Additionally, the device includes:
• a controlled temperature chamber, • a linear variable differential transducer (LVDT) to measure the displacement of the
sliding block, • an electronic load cell to measure the load resulting from the displacement, • aluminum or steel base plates to restrict shifting of the specimen during testing, and • a mounting jig to align the two base plates for specimen preparation
2.1.3 Refer to the manufacturer’s specifications for equipment range and LVDT and load cell accuracy. 2.2 Single or Double Blade Saw. 2.2.1 The saw must be capable of accurately cutting the asphalt concrete test samples from laboratory compacted cylinders or field cores. 2.3 Sample Cutting Template, as shown in Figure 1. Note 1—This is not required when using a double blade saw.

88
Figure 1—Sample Cutting Template
2.4 Apparatus used in FM 1-T 166, Bulk Specific Gravity of Compacted Hot Mix Specimens. 2.5 Temperature Chamber or Heating Oven (optional), capable of maintaining 77 ± 1°F (25 ± 0.5°C). The temperature chamber of the overlay tester may be used. 2.6 Vacuum Device (optional), such as CoreDry. 2.7 Spatula and Dish, disposable, for mixing epoxy. 2.8 Weights, 10 lb. (4.5 kg) each. Note 2—As shown in Figure 2, one weight must rest on top of each specimen without overlapping the sides. 2.9 3/8-in.Socket Drive Torque Wrench, with a 3-in. extension, capable of applying a 15 lb.-in. torque.
Figure 2—Weighted Specimens on Base Plates and Mounting Jigs
89
3. MATERIALS 3.1 Two-Part Epoxy, with a minimum 24-hr. tensile strength of 600 psi (4.1 MPa) and 24-hr. shear strength of 2,000 psi (13.8 MPa) as specified by the manufacturer. 3.2 Paint or Permanent Marker. 3.3 Lubricant (optional), such as grease or oil. 4. TEST SPECIMENS 4.1 Laboratory-Molded Specimens—Prepare three specimens for a specific mix in accordance with the FDOT State Materials Office Materials Manual, section 334, Superpave Hot Mix Asphalt, Section 3.2.3, Gyratory Compaction. Specimen diameter must be 6 in. (150 mm), and height must be 4.5 ± 0.2 in. (115 ± 5 mm). Test specimens within 5 days of molding. Note 3—Cure warm-mix asphalt (WMA) mixtures at 275°F (135.0°C) for 4 hr. ± 5 min. before molding. WMA is defined as HMA that is produced within a target temperature discharge range of 215°F (101.7°C) to 275°F (135.0°C) using WMA additives or processes. 4.1.1 Density of the trimmed test specimen must be 93 ± 1%, except for Permeable Friction Course (PFC) mixtures. Note 4—Laboratory-molded specimens with 91 ± 1% density usually result in trimmed test specimens that meet the 93 ± 1% density requirement. This is only a guide; use prior experience and knowledge of the specific materials. Note 5—Mixture weights for laboratory-molded specimens that achieve the density requirement typically vary between 4200 and 4500 g. 4.1.2 For PFC mixtures, mold test specimens to 50 gyrations (Ndesign). Note 6—Select the mixture weight for the molded PFC specimen based on the weights used in the mix design. 4.2 Core Specimens—Specimen diameter must be 6 ± 0.1 in. (150 ± 2 mm), and height must be a minimum of 1.5 in. (38 mm). There is not a specific density requirement for core specimens. 5. PROCEDURE 5.1 Preparing Specimens: 5.2 Obtain three cylindrical specimens meeting the requirements of Section 4. Note 7—Test roadway cores for informational purposes only. 5.2.1 Refer to the sawing device manufacturer's instructions, if provided, for trimming specimens. 5.2.2 When using a single-blade saw, use a cutting template to trace the location of the cuts on the cylindrical specimen with paint or permanent marker. 5.2.3 Cutting the specimens perpendicular to the top surface, trim the sides to produce specimens 3 ± 0.02 in. (76 ± 0.5 mm) wide, as shown in Figures 3 and 4. When using a single-blade saw, follow the lines traced using the template. Discard the cuttings. 5.2.4 Trim the top and bottom of each specimen to produce a sample with a height of 1.5 ± 0.02 in. (38 ± 0.5 mm), as shown in Figures 5 and 6. Discard the cuttings. Note 8— The cutting in steps 5.2.3 and 5.2.4 can be done in the reverse order, as best fits the saw and cutting jig configuration. However, once the cutting order is determined, the same cutting order should be consistently used for all samples.
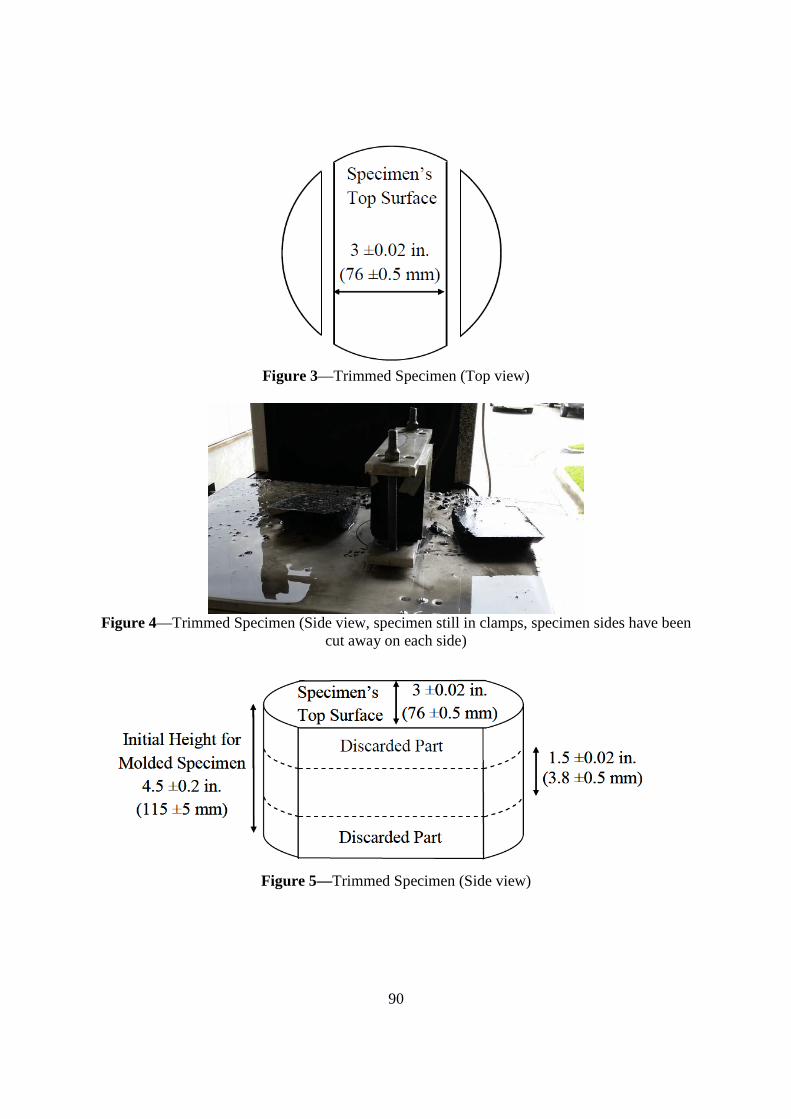
90
Figure 3—Trimmed Specimen (Top view)
Figure 4—Trimmed Specimen (Side view, specimen still in clamps, specimen sides have been
cut away on each side)
Figure 5—Trimmed Specimen (Side view)
91
Figure 6—Trimmed Specimen (Side view, specimen still in clamps, specimen top and bottom
have been cut away on each side) 5.2.5 Calculate the density of the trimmed laboratory-molded specimens in accordance with FM 1-T166, Bulk Specific Gravity of Compacted Hot Mix Asphalt (HMA) Specimens, in the following order. Note 9—Do not measure the density of trimmed PFC specimens. 5.2.5.1 Record the dry mass of the specimen. 5.2.5.2 Calculate the weight of the specimen in water. 5.2.5.3 Calculate the saturated surface dry (SSD) weight of the specimen in air. 5.2.5.4 Air dry the trimmed specimen to remove excess moisture until the specimen reaches to constant weight (measure the weight of specimen every 15 minutes). It usually takes at least 8 hours to dry the specimen. 5.2.5.5 Relative density must be 93 ± 1%. If using a laboratory prepared specimen, discard and prepare a new specimen if the trimmed specimen does not meet the density requirement. Note 10—The density for specimens trimmed from roadway cores is for informational purposes only. 5.3 Mounting and Conditioning Specimens: 5.3.1 Ensure that the base plates are clean, completely removing any dirt or epoxy left from previous samples from the tops and the bottoms of the plates. 5.3.2 Mount and secure the base plates to the mounting jig. If not controlled by the mounting jig, insure that the sides of the two base plates are perfectly aligned. Cover the gap between the plates with clear adhesive tape no wider than the minimum necessary to cover the gap. Note 11—The gap between the two base plates during specimen mounting is automatically controlled by the mounting jig. 5.3.3 Prepare approximately 12 g of the two-part epoxy for each test specimen following the manufacturer’s instructions. Do not prepare epoxy for more than three specimens in one batch. 5.3.4 Spread the epoxy evenly onto the bottom of the trimmed specimen, making sure that the epoxy covers the bottom completely and making sure that the epoxy goes all the way to the curved ends of the specimen. Note 12—Complete Sections 5.3.4–5.3.6 in under 2 min. 5.3.5 Adhere the specimens to the base plates. Ensure that each specimen is centered and aligned parallel to the edges of the base plates. See Figure 7.
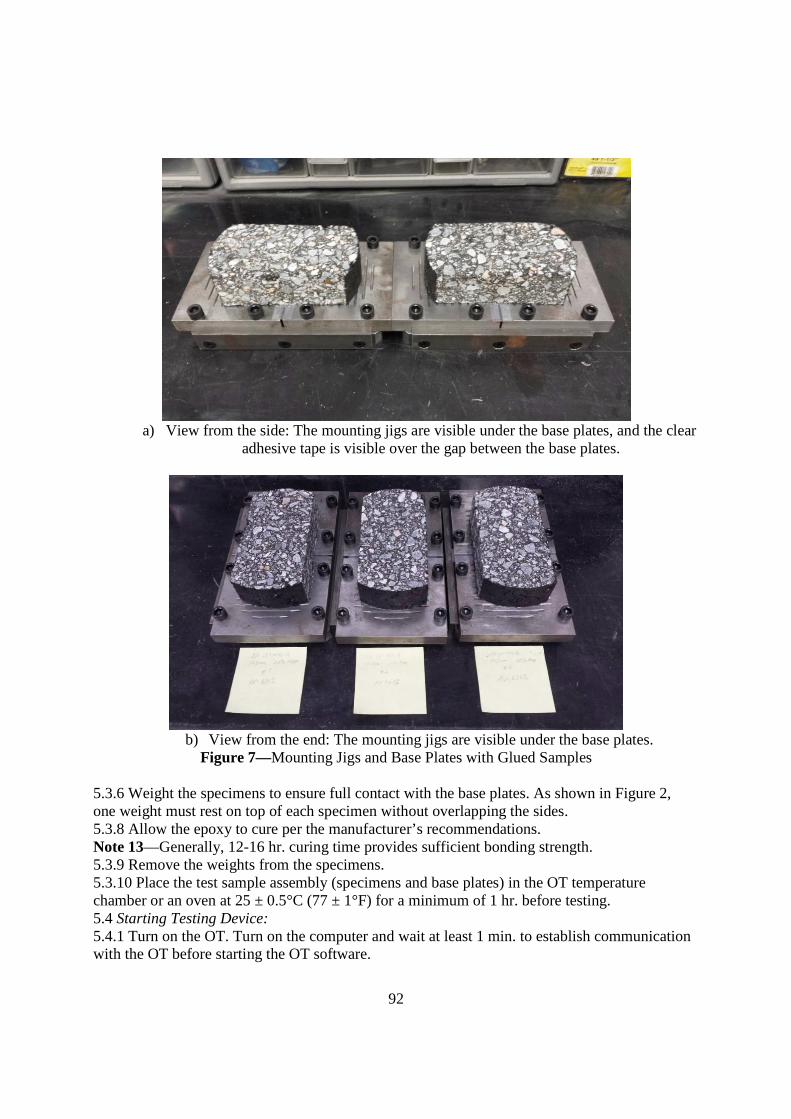
92
a) View from the side: The mounting jigs are visible under the base plates, and the clear
adhesive tape is visible over the gap between the base plates.
b) View from the end: The mounting jigs are visible under the base plates.
Figure 7—Mounting Jigs and Base Plates with Glued Samples 5.3.6 Weight the specimens to ensure full contact with the base plates. As shown in Figure 2, one weight must rest on top of each specimen without overlapping the sides. 5.3.8 Allow the epoxy to cure per the manufacturer’s recommendations. Note 13—Generally, 12-16 hr. curing time provides sufficient bonding strength. 5.3.9 Remove the weights from the specimens. 5.3.10 Place the test sample assembly (specimens and base plates) in the OT temperature chamber or an oven at 25 ± 0.5°C (77 ± 1°F) for a minimum of 1 hr. before testing. 5.4 Starting Testing Device: 5.4.1 Turn on the OT. Turn on the computer and wait at least 1 min. to establish communication with the OT before starting the OT software.
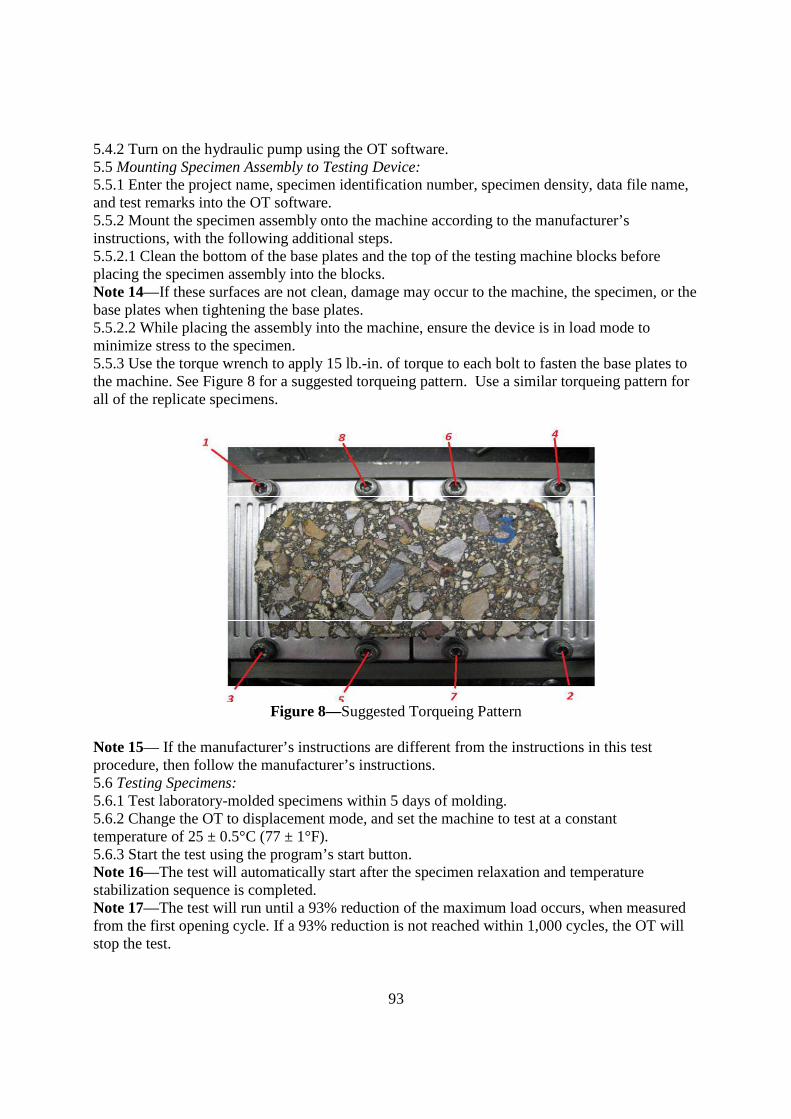
93
5.4.2 Turn on the hydraulic pump using the OT software. 5.5 Mounting Specimen Assembly to Testing Device: 5.5.1 Enter the project name, specimen identification number, specimen density, data file name, and test remarks into the OT software. 5.5.2 Mount the specimen assembly onto the machine according to the manufacturer’s instructions, with the following additional steps. 5.5.2.1 Clean the bottom of the base plates and the top of the testing machine blocks before placing the specimen assembly into the blocks. Note 14—If these surfaces are not clean, damage may occur to the machine, the specimen, or the base plates when tightening the base plates. 5.5.2.2 While placing the assembly into the machine, ensure the device is in load mode to minimize stress to the specimen. 5.5.3 Use the torque wrench to apply 15 lb.-in. of torque to each bolt to fasten the base plates to the machine. See Figure 8 for a suggested torqueing pattern. Use a similar torqueing pattern for all of the replicate specimens.
Figure 8—Suggested Torqueing Pattern
Note 15— If the manufacturer’s instructions are different from the instructions in this test procedure, then follow the manufacturer’s instructions. 5.6 Testing Specimens: 5.6.1 Test laboratory-molded specimens within 5 days of molding. 5.6.2 Change the OT to displacement mode, and set the machine to test at a constant temperature of 25 ± 0.5°C (77 ± 1°F). 5.6.3 Start the test using the program’s start button. Note 16—The test will automatically start after the specimen relaxation and temperature stabilization sequence is completed. Note 17—The test will run until a 93% reduction of the maximum load occurs, when measured from the first opening cycle. If a 93% reduction is not reached within 1,000 cycles, the OT will stop the test.
94
5.6.4 Open the OT data file and record the starting and final loads, percent decline in load, temperature, and number of cycles to failure. 5.6.5 Remove the specimen assembly upon completion of the test. Turn off the OT if needed. 5.6.6 Visually count the number of cracks at the top of the specimens. Record zero, single, or multiple cracks in the comments section of the test report. 6. REPORT 6.1 Report the following for each specimen:
• trimmed specimen density, • test temperature • starting load, • final load, • percent decline in load, • number of cycles to failure, • number of observed cracks, and • additional comments.
7. PRECISION 7.1 Coefficient of variation (COV) between the test results of 3 specimens from a specific mix must be ≤ 30%. If the variability (COV) in the cycles to failure is ˃ 30%, then two additional specimens will be fabricated and tested. All five test results will be reported, but the three test results with the lowest COV will be used for the final test result. *The following Texas TXDOT specification was used as the template for writing this Florida specification: TxDOT Designation: Tex-248-F Test Procedure for OVERLAY TEST Effective Date: February 2014
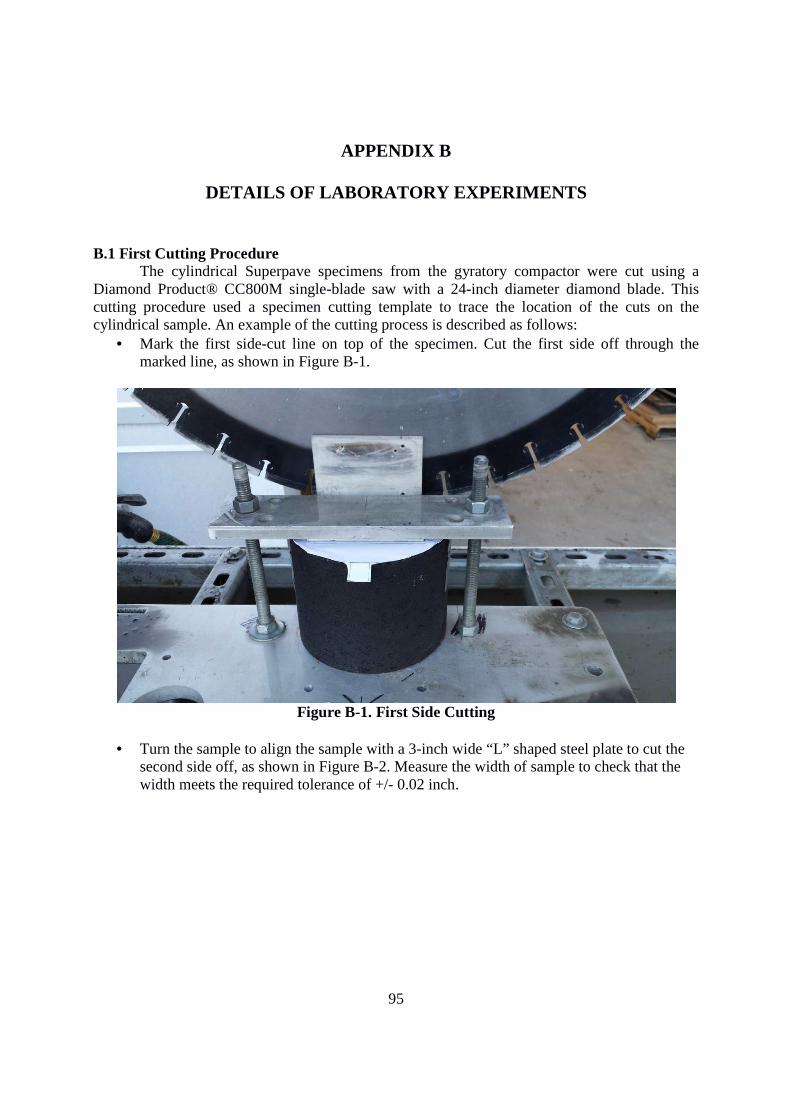
95
APPENDIX B
DETAILS OF LABORATORY EXPERIMENTS
B.1 First Cutting Procedure The cylindrical Superpave specimens from the gyratory compactor were cut using a
Diamond Product® CC800M single-blade saw with a 24-inch diameter diamond blade. This cutting procedure used a specimen cutting template to trace the location of the cuts on the cylindrical sample. An example of the cutting process is described as follows:
• Mark the first side-cut line on top of the specimen. Cut the first side off through the marked line, as shown in Figure B-1.
Figure B-1. First Side Cutting
• Turn the sample to align the sample with a 3-inch wide “L” shaped steel plate to cut the
second side off, as shown in Figure B-2. Measure the width of sample to check that the width meets the required tolerance of +/- 0.02 inch.
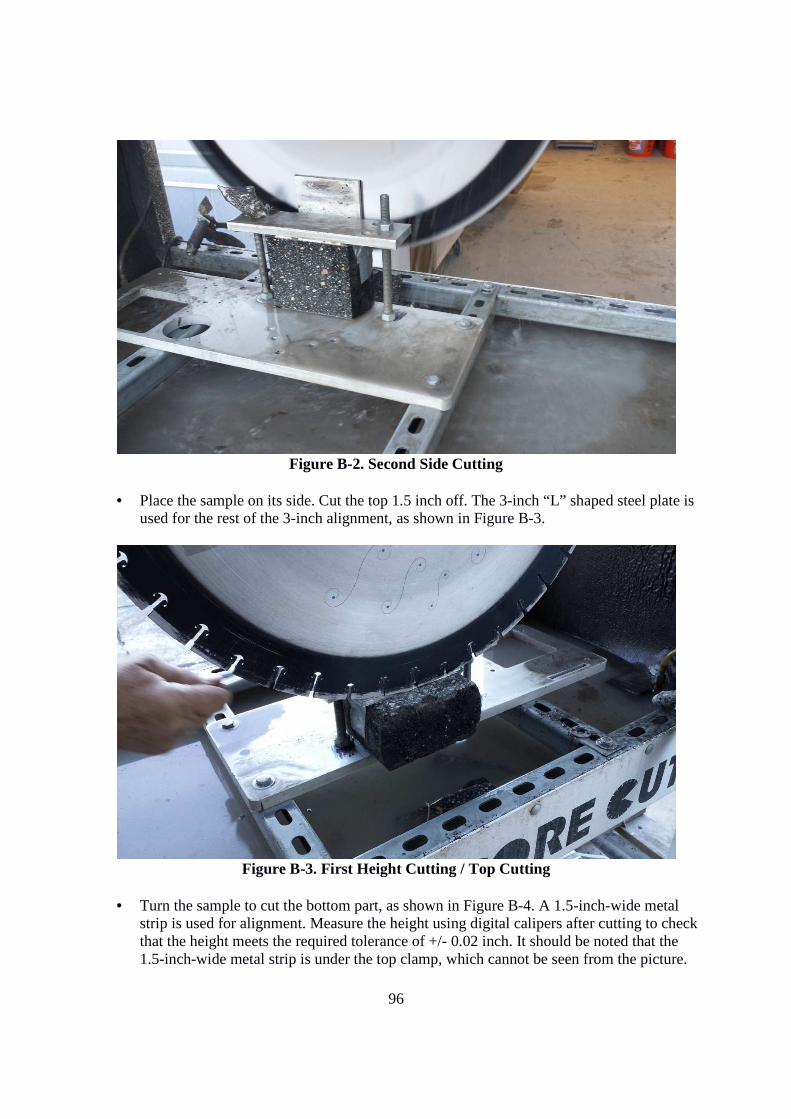
96
Figure B-2. Second Side Cutting
• Place the sample on its side. Cut the top 1.5 inch off. The 3-inch “L” shaped steel plate is
used for the rest of the 3-inch alignment, as shown in Figure B-3.
Figure B-3. First Height Cutting / Top Cutting
• Turn the sample to cut the bottom part, as shown in Figure B-4. A 1.5-inch-wide metal
strip is used for alignment. Measure the height using digital calipers after cutting to check that the height meets the required tolerance of +/- 0.02 inch. It should be noted that the 1.5-inch-wide metal strip is under the top clamp, which cannot be seen from the picture.
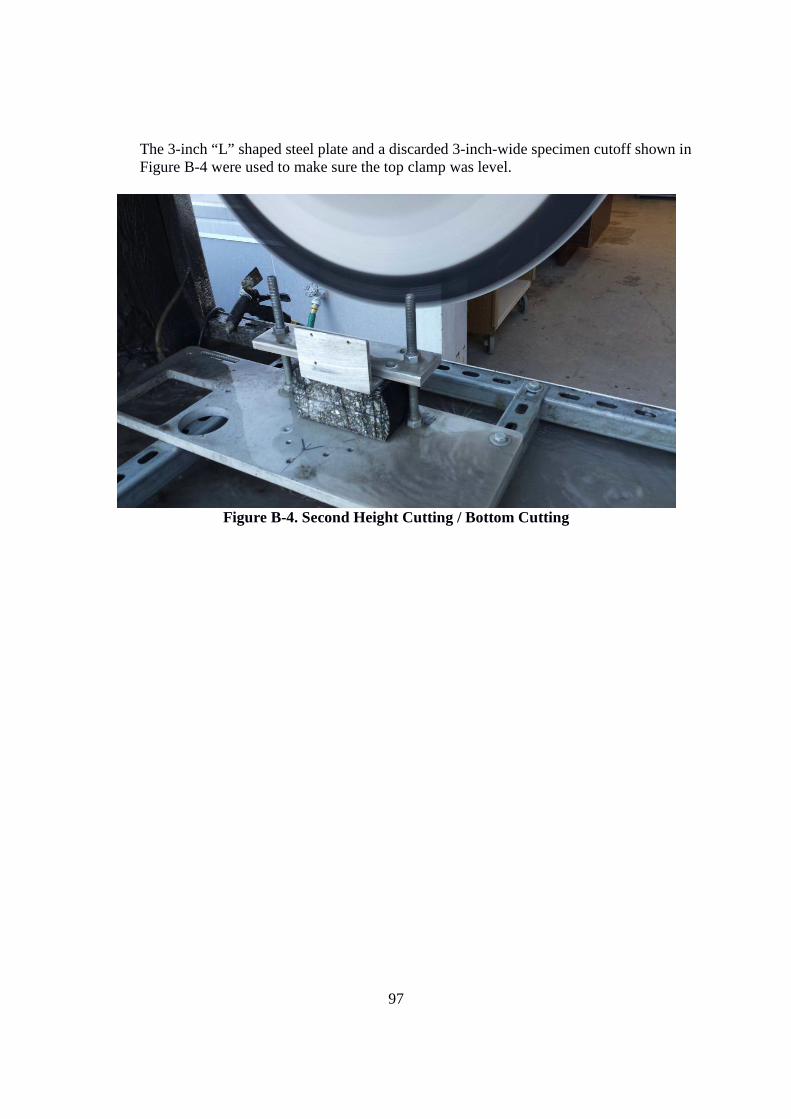
97
The 3-inch “L” shaped steel plate and a discarded 3-inch-wide specimen cutoff shown in Figure B-4 were used to make sure the top clamp was level.
Figure B-4. Second Height Cutting / Bottom Cutting
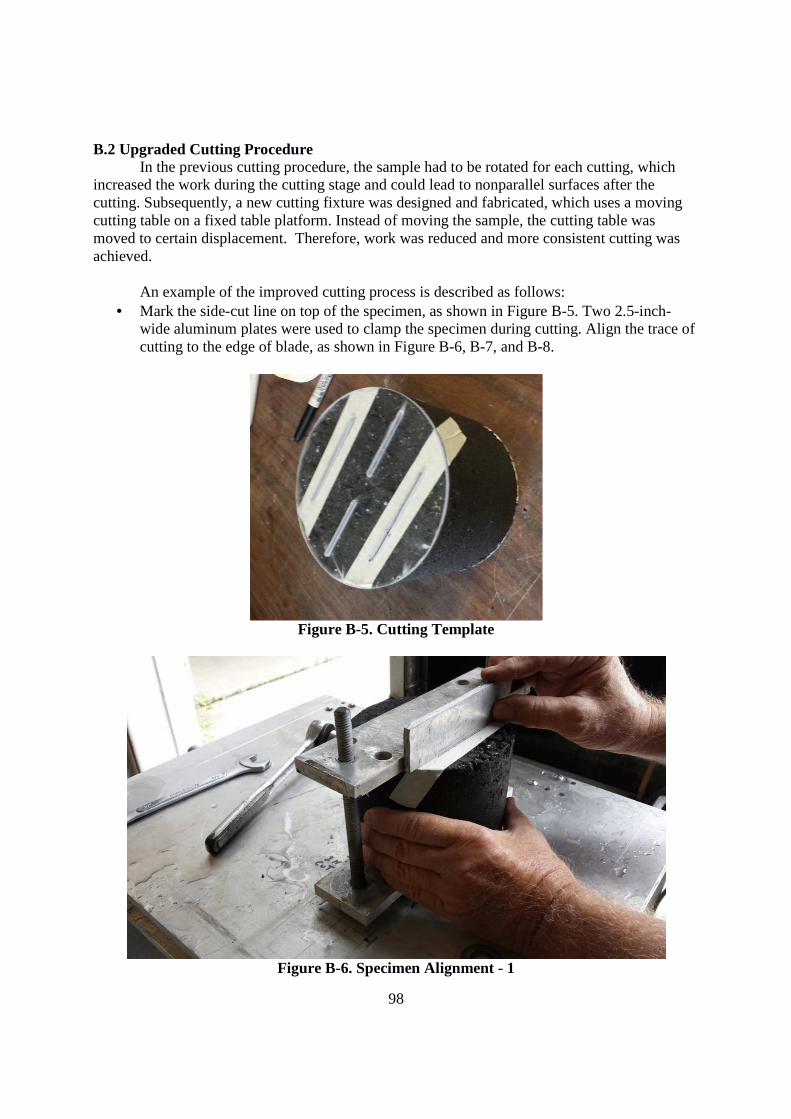
98
B.2 Upgraded Cutting Procedure In the previous cutting procedure, the sample had to be rotated for each cutting, which
increased the work during the cutting stage and could lead to nonparallel surfaces after the cutting. Subsequently, a new cutting fixture was designed and fabricated, which uses a moving cutting table on a fixed table platform. Instead of moving the sample, the cutting table was moved to certain displacement. Therefore, work was reduced and more consistent cutting was achieved.
An example of the improved cutting process is described as follows:
• Mark the side-cut line on top of the specimen, as shown in Figure B-5. Two 2.5-inch-wide aluminum plates were used to clamp the specimen during cutting. Align the trace of cutting to the edge of blade, as shown in Figure B-6, B-7, and B-8.
Figure B-5. Cutting Template
Figure B-6. Specimen Alignment - 1
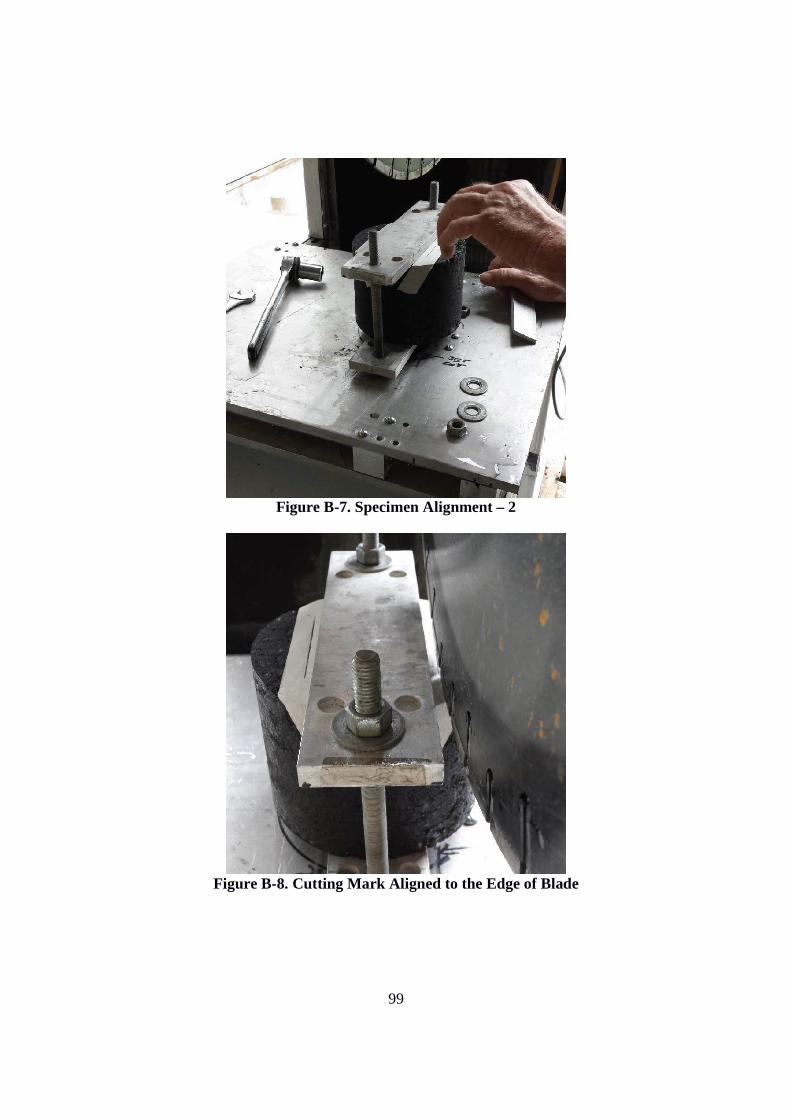
99
Figure B-7. Specimen Alignment – 2
Figure B-8. Cutting Mark Aligned to the Edge of Blade
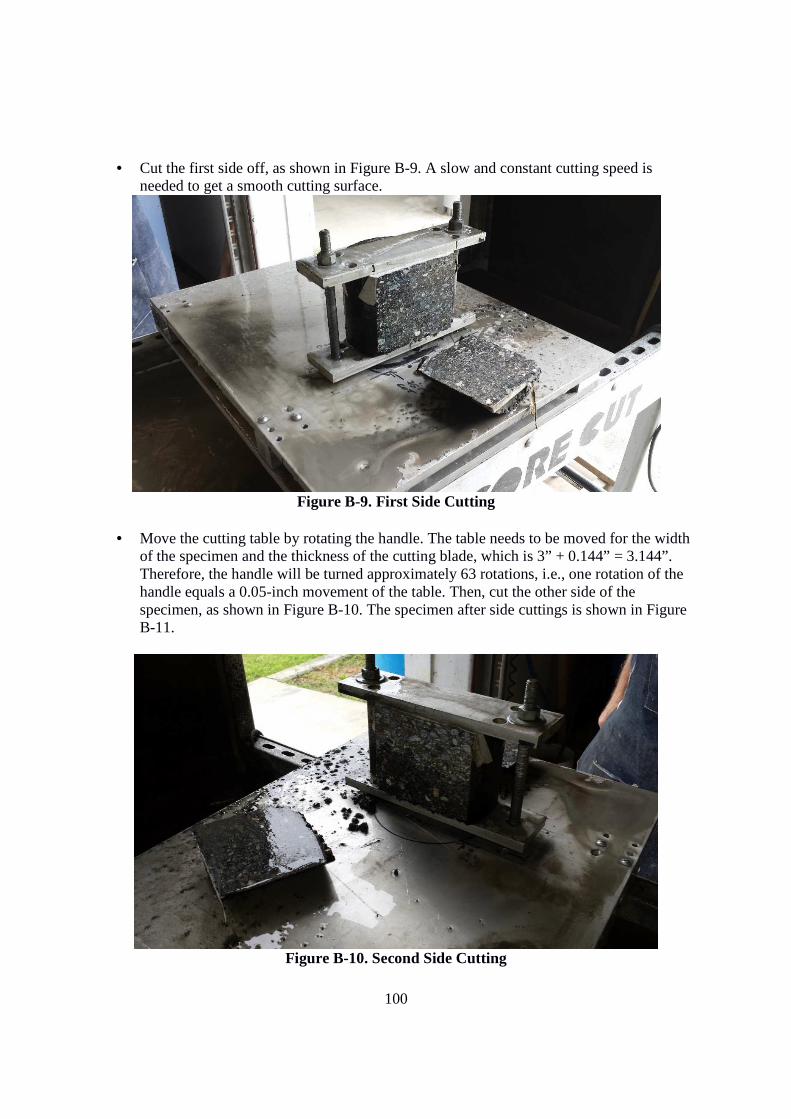
100
• Cut the first side off, as shown in Figure B-9. A slow and constant cutting speed is
needed to get a smooth cutting surface.
Figure B-9. First Side Cutting
• Move the cutting table by rotating the handle. The table needs to be moved for the width
of the specimen and the thickness of the cutting blade, which is 3” + 0.144” = 3.144”. Therefore, the handle will be turned approximately 63 rotations, i.e., one rotation of the handle equals a 0.05-inch movement of the table. Then, cut the other side of the specimen, as shown in Figure B-10. The specimen after side cuttings is shown in Figure B-11.
Figure B-10. Second Side Cutting
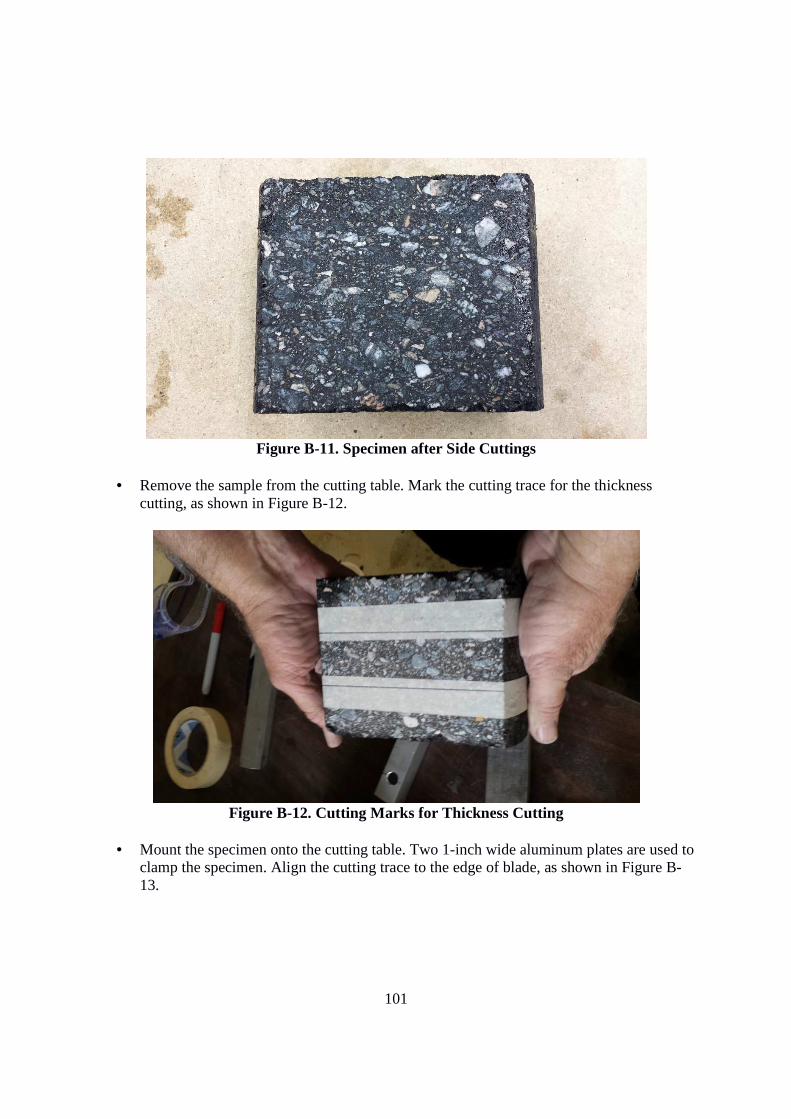
101
Figure B-11. Specimen after Side Cuttings
• Remove the sample from the cutting table. Mark the cutting trace for the thickness
cutting, as shown in Figure B-12.
Figure B-12. Cutting Marks for Thickness Cutting
• Mount the specimen onto the cutting table. Two 1-inch wide aluminum plates are used to
clamp the specimen. Align the cutting trace to the edge of blade, as shown in Figure B-13.
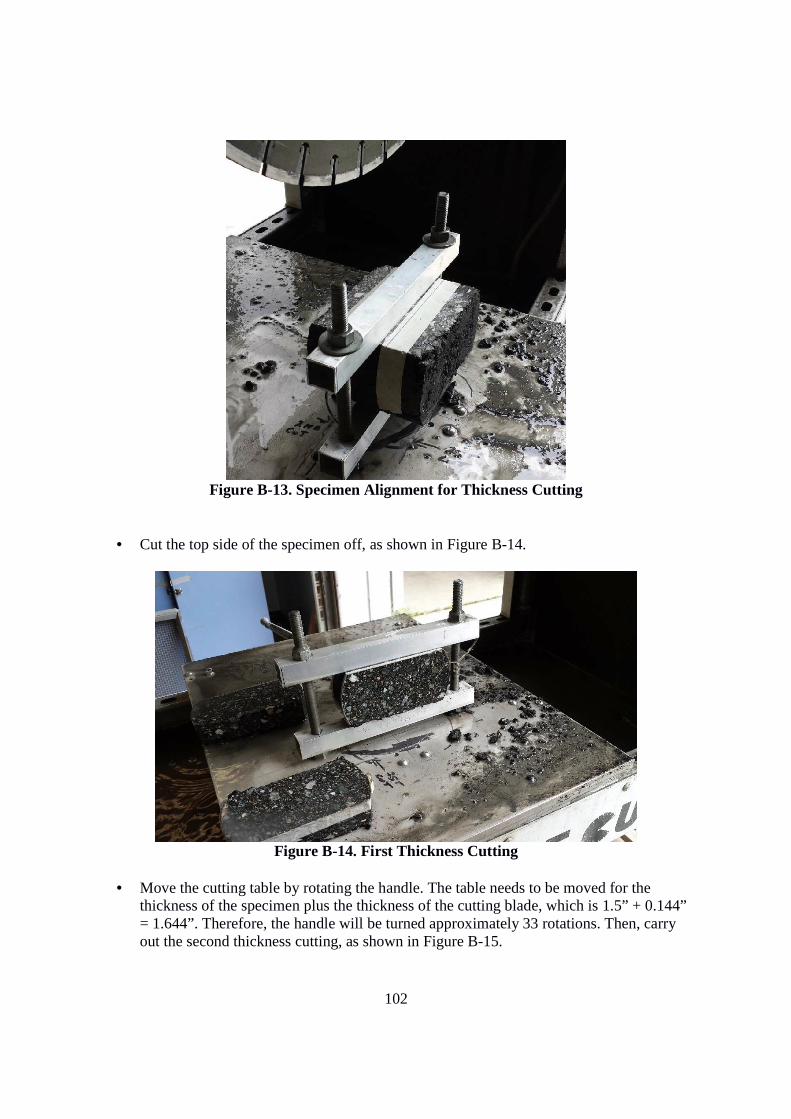
102
Figure B-13. Specimen Alignment for Thickness Cutting
• Cut the top side of the specimen off, as shown in Figure B-14.
Figure B-14. First Thickness Cutting
• Move the cutting table by rotating the handle. The table needs to be moved for the
thickness of the specimen plus the thickness of the cutting blade, which is 1.5” + 0.144” = 1.644”. Therefore, the handle will be turned approximately 33 rotations. Then, carry out the second thickness cutting, as shown in Figure B-15.
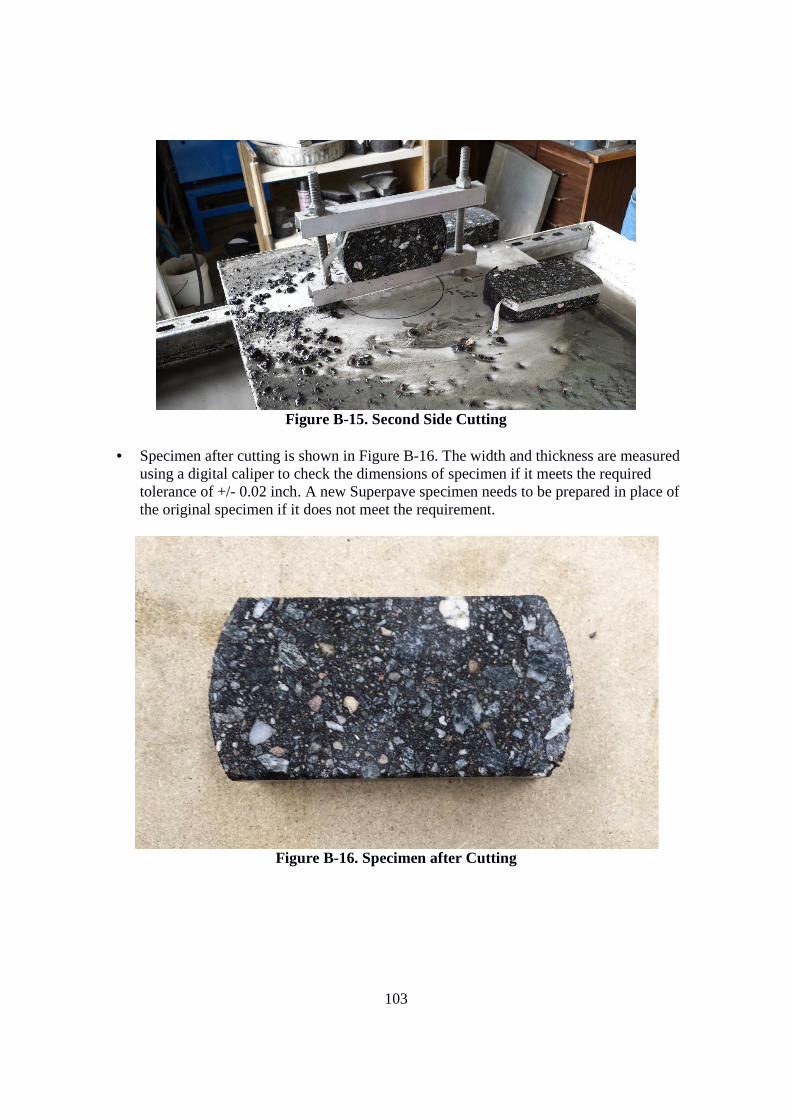
103
Figure B-15. Second Side Cutting
• Specimen after cutting is shown in Figure B-16. The width and thickness are measured
using a digital caliper to check the dimensions of specimen if it meets the required tolerance of +/- 0.02 inch. A new Superpave specimen needs to be prepared in place of the original specimen if it does not meet the requirement.
Figure B-16. Specimen after Cutting
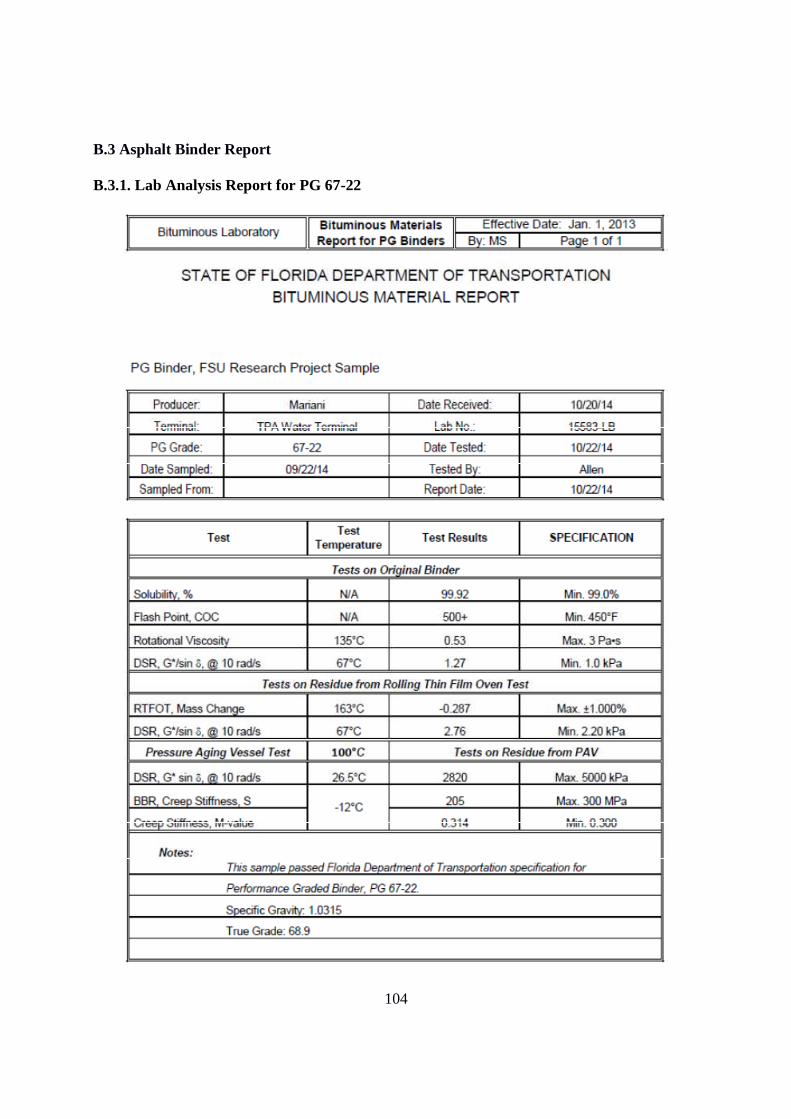
104
B.3 Asphalt Binder Report
B.3.1. Lab Analysis Report for PG 67-22
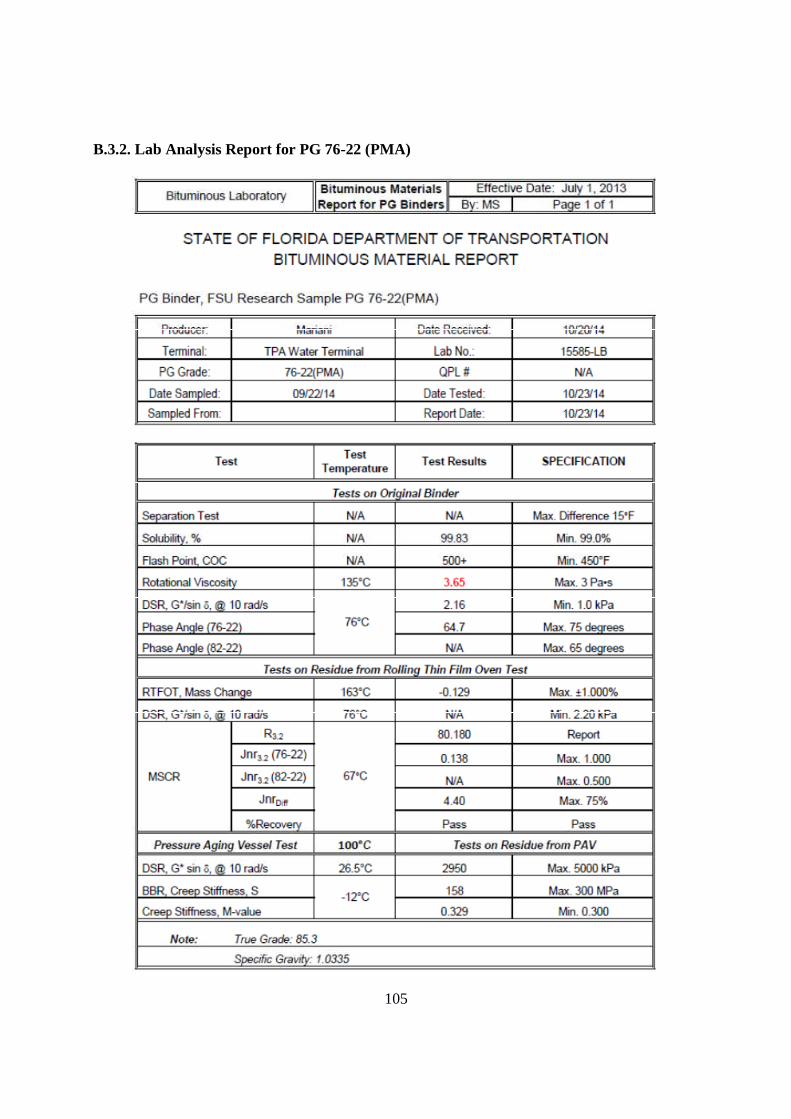
105
B.3.2. Lab Analysis Report for PG 76-22 (PMA)
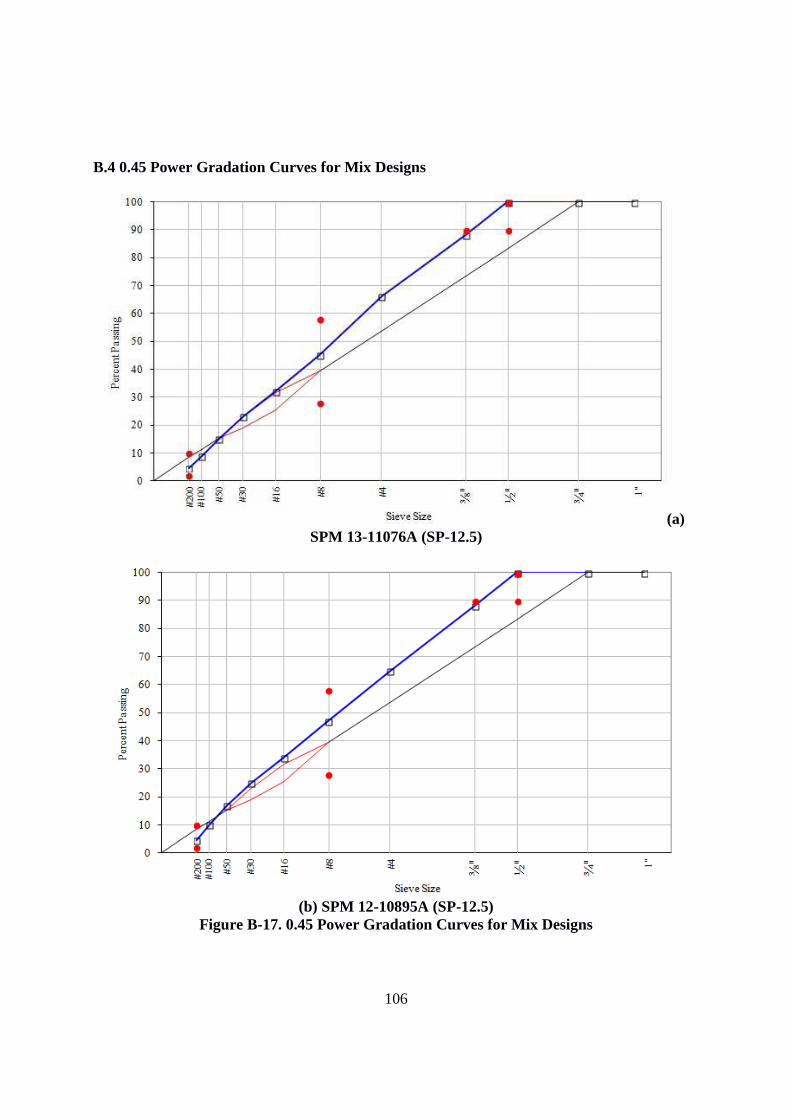
106
B.4 0.45 Power Gradation Curves for Mix Designs
(a) SPM 13-11076A (SP-12.5)
(b) SPM 12-10895A (SP-12.5)
Figure B-17. 0.45 Power Gradation Curves for Mix Designs
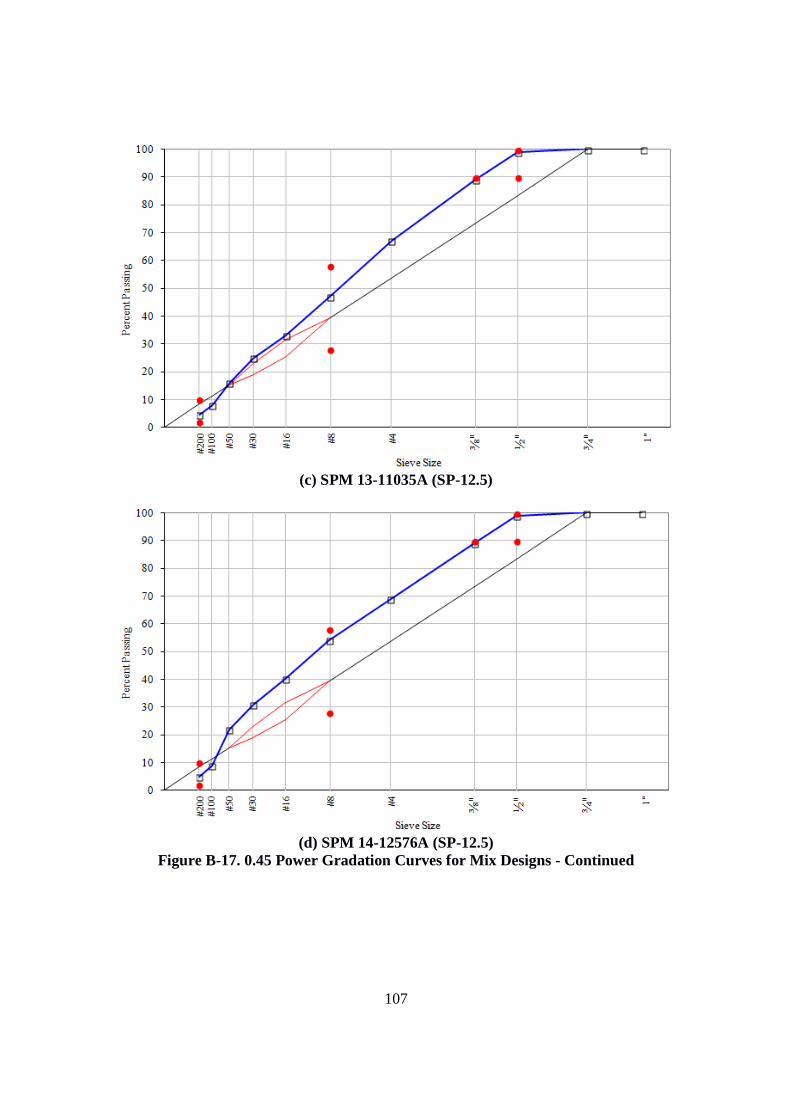
107
(c) SPM 13-11035A (SP-12.5)
(d) SPM 14-12576A (SP-12.5)
Figure B-17. 0.45 Power Gradation Curves for Mix Designs - Continued
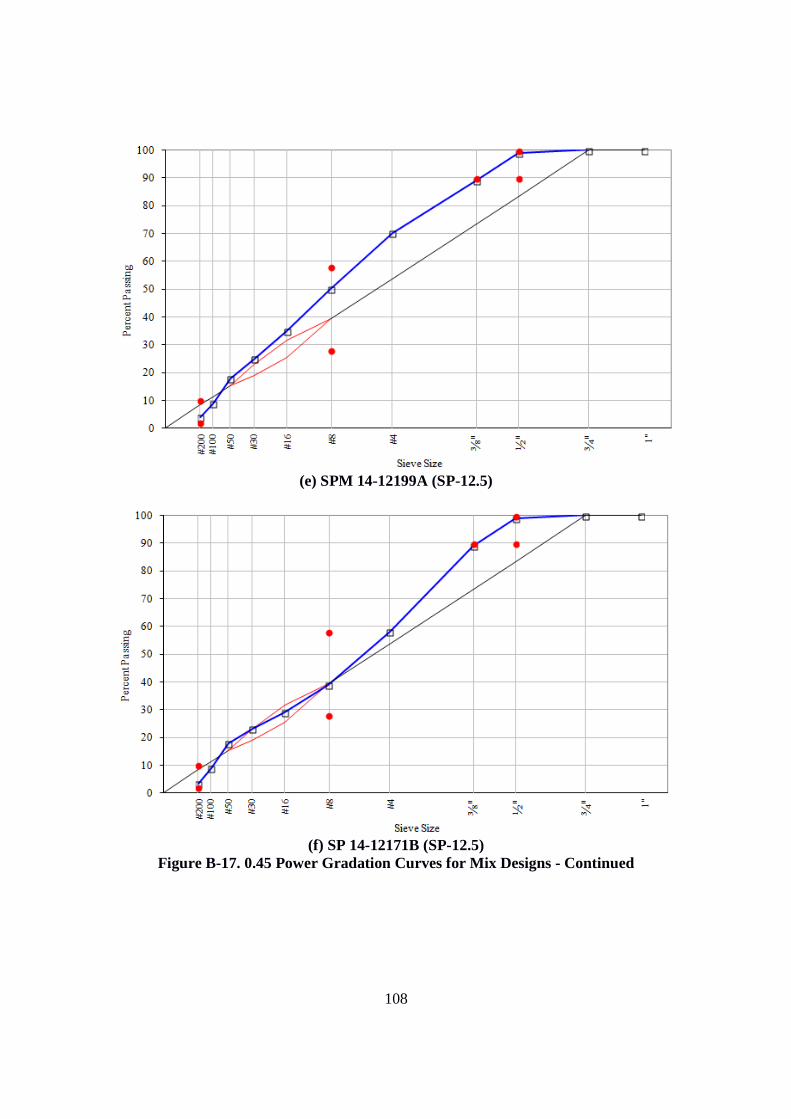
108
(e) SPM 14-12199A (SP-12.5)
(f) SP 14-12171B (SP-12.5)
Figure B-17. 0.45 Power Gradation Curves for Mix Designs - Continued
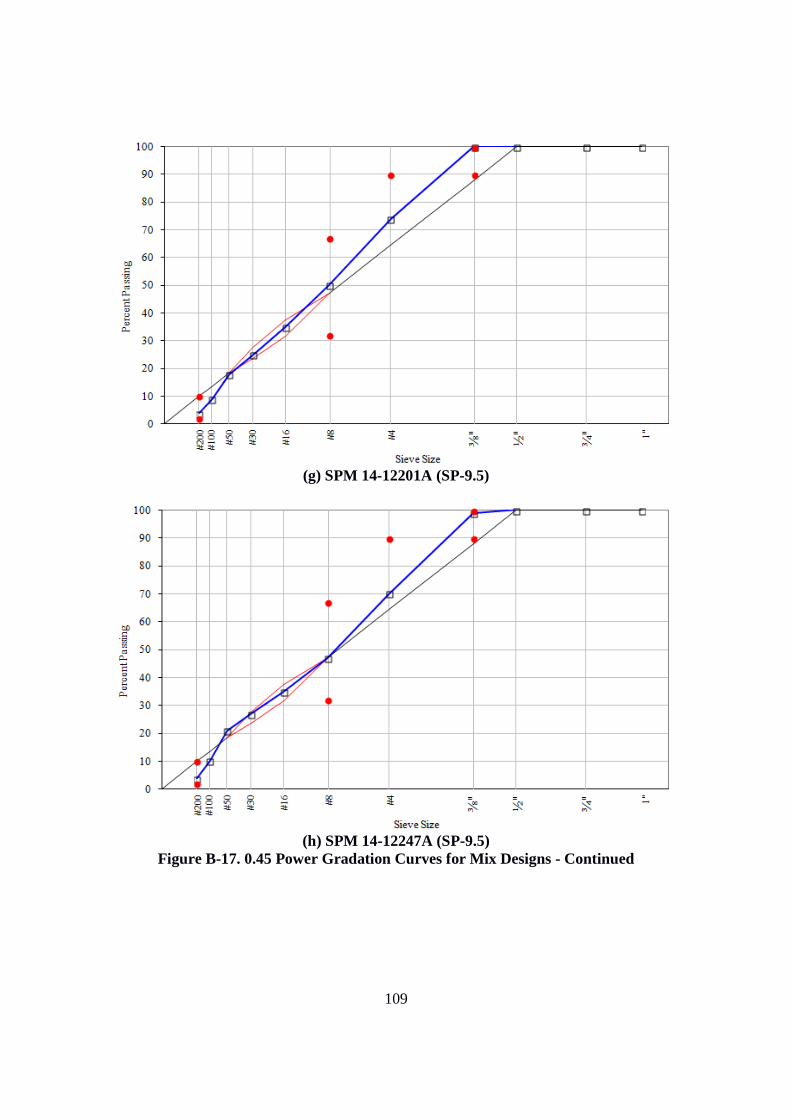
109
(g) SPM 14-12201A (SP-9.5)
(h) SPM 14-12247A (SP-9.5)
Figure B-17. 0.45 Power Gradation Curves for Mix Designs - Continued

Figure B-17. 0.45 Power
110
(i) LD 12-2653A (SP-4.75) . 0.45 Power Gradation Curves for Mix Designs -
- Continued
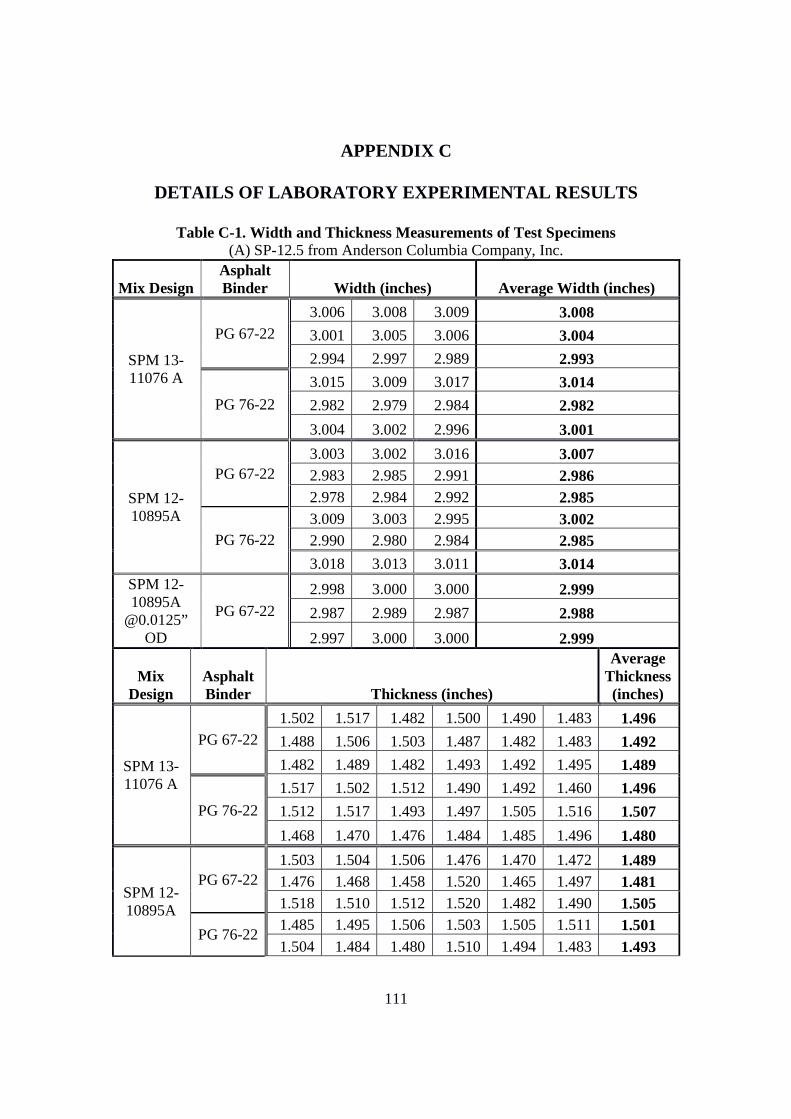
111
APPENDIX C
DETAILS OF LABORATORY EXPERIMENTAL RESULTS
Table C-1. Width and Thickness Measurements of Test Specimens (A) SP-12.5 from Anderson Columbia Company, Inc.
Mix Design Asphalt Binder Width (inches) Average Width (inches)
SPM 13-11076 A
PG 67-22 3.006 3.008 3.009 3.008
3.001 3.005 3.006 3.004
2.994 2.997 2.989 2.993
PG 76-22
3.015 3.009 3.017 3.014
2.982 2.979 2.984 2.982
3.004 3.002 2.996 3.001
SPM 12-10895A
PG 67-22 3.003 3.002 3.016 3.007 2.983 2.985 2.991 2.986 2.978 2.984 2.992 2.985
PG 76-22 3.009 3.003 2.995 3.002 2.990 2.980 2.984 2.985
3.018 3.013 3.011 3.014 SPM 12-10895A
@0.0125” OD
PG 67-22
2.998 3.000 3.000 2.999
2.987 2.989 2.987 2.988
2.997 3.000 3.000 2.999
Mix Design
Asphalt Binder Thickness (inches)
Average Thickness (inches)
SPM 13-11076 A
PG 67-22 1.502 1.517 1.482 1.500 1.490 1.483 1.496
1.488 1.506 1.503 1.487 1.482 1.483 1.492
1.482 1.489 1.482 1.493 1.492 1.495 1.489
PG 76-22
1.517 1.502 1.512 1.490 1.492 1.460 1.496
1.512 1.517 1.493 1.497 1.505 1.516 1.507
1.468 1.470 1.476 1.484 1.485 1.496 1.480
SPM 12-10895A
PG 67-22 1.503 1.504 1.506 1.476 1.470 1.472 1.489 1.476 1.468 1.458 1.520 1.465 1.497 1.481 1.518 1.510 1.512 1.520 1.482 1.490 1.505
PG 76-22 1.485 1.495 1.506 1.503 1.505 1.511 1.501 1.504 1.484 1.480 1.510 1.494 1.483 1.493
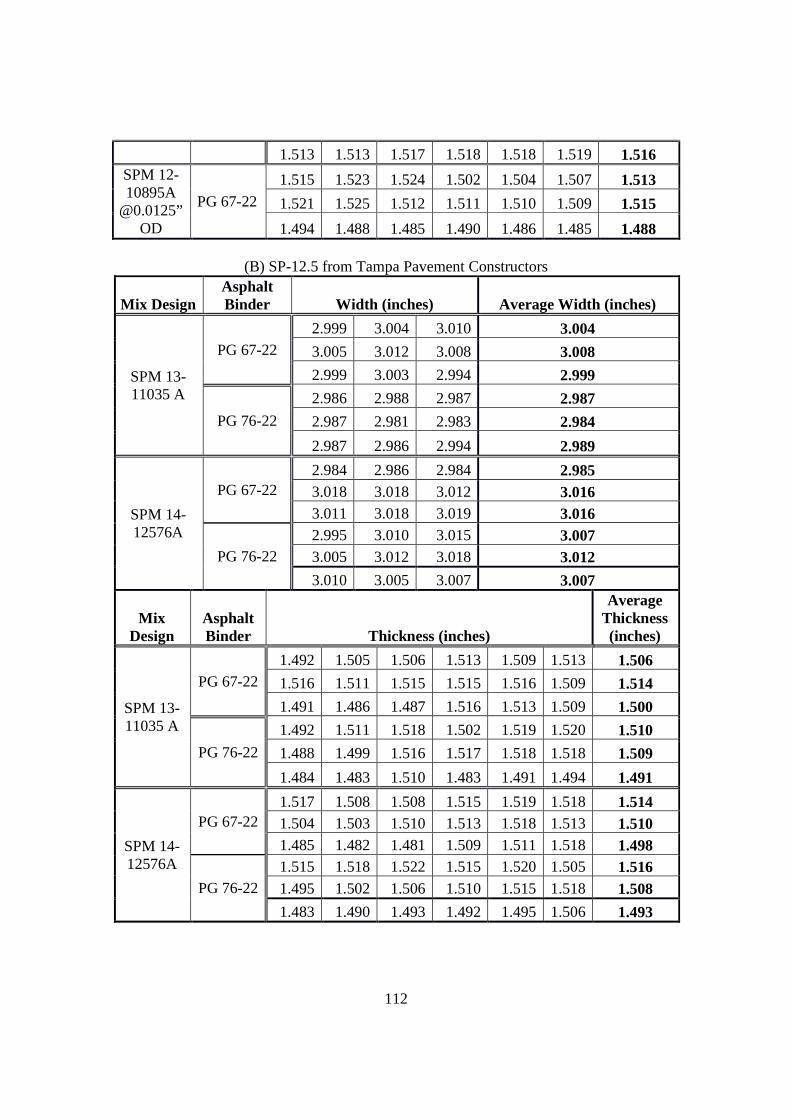
112
1.513 1.513 1.517 1.518 1.518 1.519 1.516 SPM 12-10895A
@0.0125” OD
PG 67-22
1.515 1.523 1.524 1.502 1.504 1.507 1.513
1.521 1.525 1.512 1.511 1.510 1.509 1.515
1.494 1.488 1.485 1.490 1.486 1.485 1.488
(B) SP-12.5 from Tampa Pavement Constructors
Mix Design Asphalt Binder Width (inches) Average Width (inches)
SPM 13-11035 A
PG 67-22 2.999 3.004 3.010 3.004
3.005 3.012 3.008 3.008
2.999 3.003 2.994 2.999
PG 76-22
2.986 2.988 2.987 2.987
2.987 2.981 2.983 2.984
2.987 2.986 2.994 2.989
SPM 14-12576A
PG 67-22 2.984 2.986 2.984 2.985 3.018 3.018 3.012 3.016 3.011 3.018 3.019 3.016
PG 76-22 2.995 3.010 3.015 3.007 3.005 3.012 3.018 3.012
3.010 3.005 3.007 3.007
Mix Design
Asphalt Binder Thickness (inches)
Average Thickness (inches)
SPM 13-11035 A
PG 67-22 1.492 1.505 1.506 1.513 1.509 1.513 1.506
1.516 1.511 1.515 1.515 1.516 1.509 1.514
1.491 1.486 1.487 1.516 1.513 1.509 1.500
PG 76-22
1.492 1.511 1.518 1.502 1.519 1.520 1.510
1.488 1.499 1.516 1.517 1.518 1.518 1.509
1.484 1.483 1.510 1.483 1.491 1.494 1.491
SPM 14-12576A
PG 67-22 1.517 1.508 1.508 1.515 1.519 1.518 1.514 1.504 1.503 1.510 1.513 1.518 1.513 1.510 1.485 1.482 1.481 1.509 1.511 1.518 1.498
PG 76-22 1.515 1.518 1.522 1.515 1.520 1.505 1.516 1.495 1.502 1.506 1.510 1.515 1.518 1.508
1.483 1.490 1.493 1.492 1.495 1.506 1.493
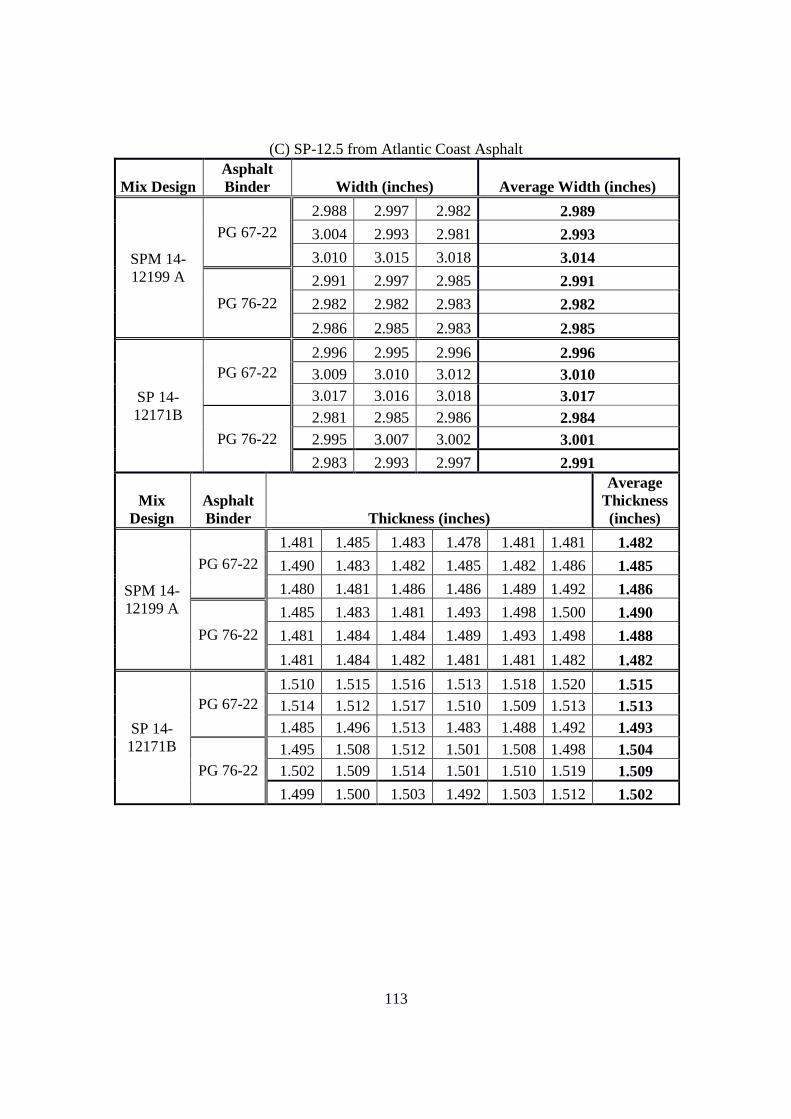
113
(C) SP-12.5 from Atlantic Coast Asphalt
Mix Design Asphalt Binder Width (inches) Average Width (inches)
SPM 14-12199 A
PG 67-22 2.988 2.997 2.982 2.989
3.004 2.993 2.981 2.993
3.010 3.015 3.018 3.014
PG 76-22
2.991 2.997 2.985 2.991
2.982 2.982 2.983 2.982
2.986 2.985 2.983 2.985
SP 14-12171B
PG 67-22 2.996 2.995 2.996 2.996 3.009 3.010 3.012 3.010 3.017 3.016 3.018 3.017
PG 76-22 2.981 2.985 2.986 2.984 2.995 3.007 3.002 3.001
2.983 2.993 2.997 2.991
Mix Design
Asphalt Binder Thickness (inches)
Average Thickness (inches)
SPM 14-12199 A
PG 67-22 1.481 1.485 1.483 1.478 1.481 1.481 1.482
1.490 1.483 1.482 1.485 1.482 1.486 1.485
1.480 1.481 1.486 1.486 1.489 1.492 1.486
PG 76-22
1.485 1.483 1.481 1.493 1.498 1.500 1.490
1.481 1.484 1.484 1.489 1.493 1.498 1.488
1.481 1.484 1.482 1.481 1.481 1.482 1.482
SP 14-12171B
PG 67-22 1.510 1.515 1.516 1.513 1.518 1.520 1.515 1.514 1.512 1.517 1.510 1.509 1.513 1.513 1.485 1.496 1.513 1.483 1.488 1.492 1.493
PG 76-22 1.495 1.508 1.512 1.501 1.508 1.498 1.504 1.502 1.509 1.514 1.501 1.510 1.519 1.509
1.499 1.500 1.503 1.492 1.503 1.512 1.502
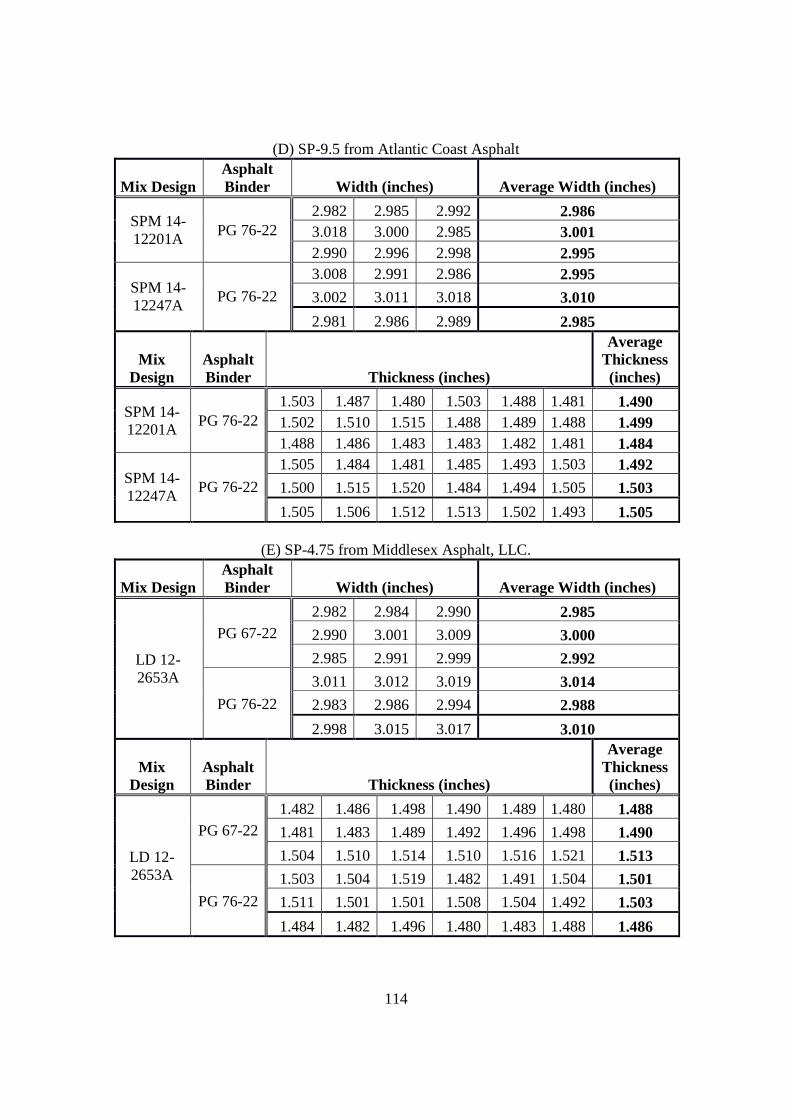
114
(D) SP-9.5 from Atlantic Coast Asphalt
Mix Design Asphalt Binder Width (inches) Average Width (inches)
SPM 14-12201A
PG 76-22 2.982 2.985 2.992 2.986 3.018 3.000 2.985 3.001 2.990 2.996 2.998 2.995
SPM 14-12247A
PG 76-22
3.008 2.991 2.986 2.995
3.002 3.011 3.018 3.010
2.981 2.986 2.989 2.985
Mix Design
Asphalt Binder Thickness (inches)
Average Thickness (inches)
SPM 14-12201A
PG 76-22 1.503 1.487 1.480 1.503 1.488 1.481 1.490 1.502 1.510 1.515 1.488 1.489 1.488 1.499 1.488 1.486 1.483 1.483 1.482 1.481 1.484
SPM 14-12247A
PG 76-22
1.505 1.484 1.481 1.485 1.493 1.503 1.492
1.500 1.515 1.520 1.484 1.494 1.505 1.503
1.505 1.506 1.512 1.513 1.502 1.493 1.505
(E) SP-4.75 from Middlesex Asphalt, LLC.
Mix Design Asphalt Binder Width (inches) Average Width (inches)
LD 12-2653A
PG 67-22 2.982 2.984 2.990 2.985
2.990 3.001 3.009 3.000
2.985 2.991 2.999 2.992
PG 76-22
3.011 3.012 3.019 3.014
2.983 2.986 2.994 2.988
2.998 3.015 3.017 3.010
Mix Design
Asphalt Binder Thickness (inches)
Average Thickness (inches)
LD 12-2653A
PG 67-22 1.482 1.486 1.498 1.490 1.489 1.480 1.488
1.481 1.483 1.489 1.492 1.496 1.498 1.490
1.504 1.510 1.514 1.510 1.516 1.521 1.513
PG 76-22
1.503 1.504 1.519 1.482 1.491 1.504 1.501
1.511 1.501 1.501 1.508 1.504 1.492 1.503
1.484 1.482 1.496 1.480 1.483 1.488 1.486
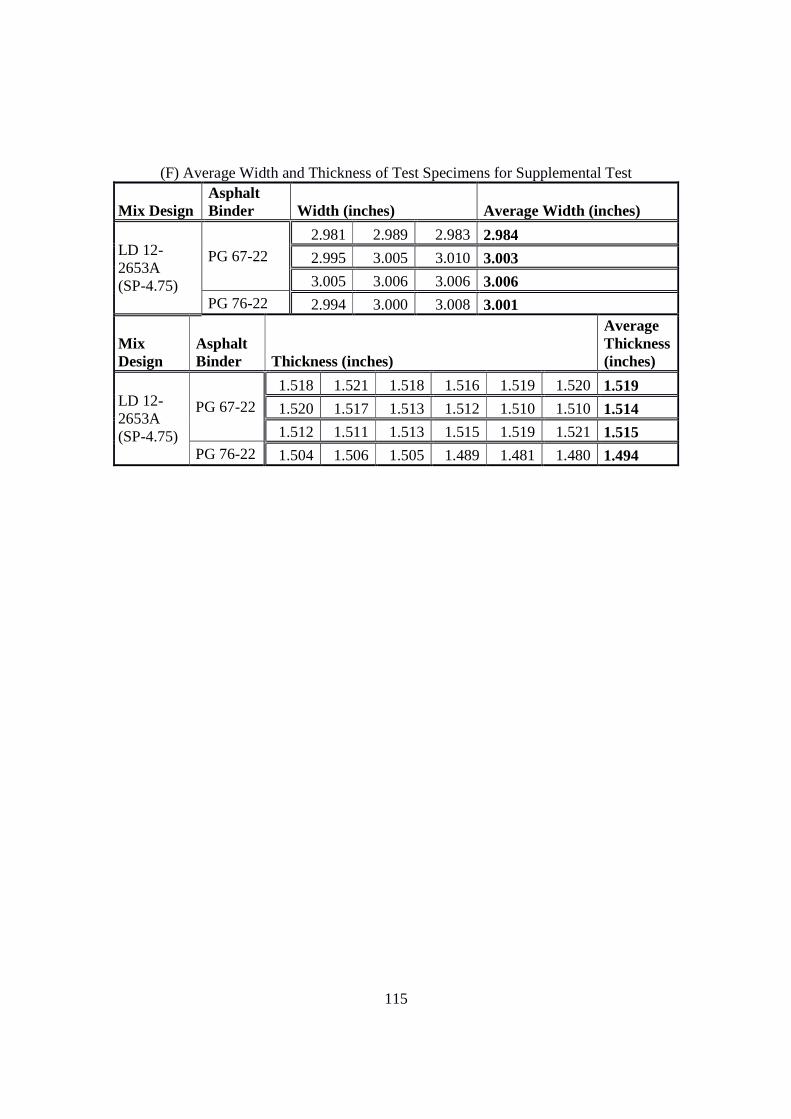
115
(F) Average Width and Thickness of Test Specimens for Supplemental Test
Mix Design Asphalt Binder Width (inches) Average Width (inches)
LD 12-2653A (SP-4.75)
PG 67-22 2.981 2.989 2.983 2.984
2.995 3.005 3.010 3.003
3.005 3.006 3.006 3.006 PG 76-22 2.994 3.000 3.008 3.001
Mix Design
Asphalt Binder Thickness (inches)
Average Thickness (inches)
LD 12-2653A (SP-4.75)
PG 67-22 1.518 1.521 1.518 1.516 1.519 1.520 1.519
1.520 1.517 1.513 1.512 1.510 1.510 1.514
1.512 1.511 1.513 1.515 1.519 1.521 1.515 PG 76-22 1.504 1.506 1.505 1.489 1.481 1.480 1.494
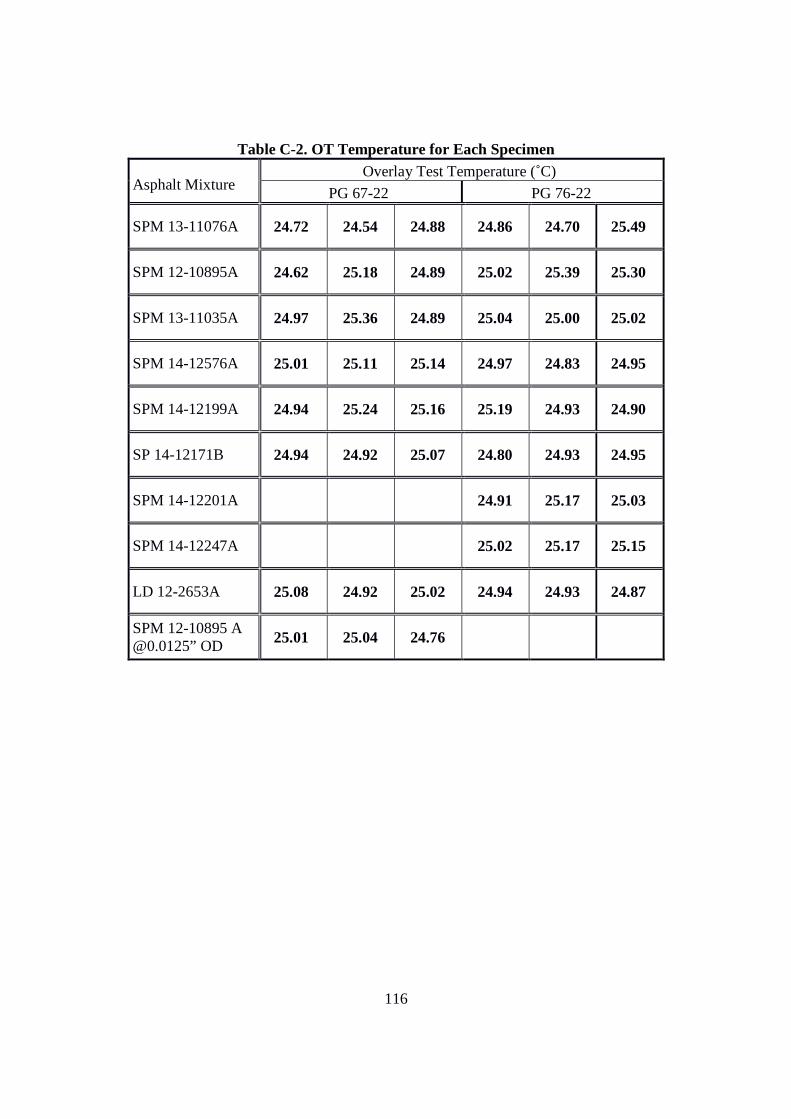
116
Table C-2. OT Temperature for Each Specimen
Asphalt Mixture Overlay Test Temperature (˚C)
PG 67-22 PG 76-22
SPM 13-11076A 24.72 24.54 24.88 24.86 24.70 25.49
SPM 12-10895A 24.62 25.18 24.89 25.02 25.39 25.30
SPM 13-11035A 24.97 25.36 24.89 25.04 25.00 25.02
SPM 14-12576A 25.01 25.11 25.14 24.97 24.83 24.95
SPM 14-12199A 24.94 25.24 25.16 25.19 24.93 24.90
SP 14-12171B 24.94 24.92 25.07 24.80 24.93 24.95
SPM 14-12201A 24.91 25.17 25.03
SPM 14-12247A 25.02 25.17 25.15
LD 12-2653A 25.08 24.92 25.02 24.94 24.93 24.87
SPM 12-10895 A @0.0125” OD 25.01 25.04 24.76
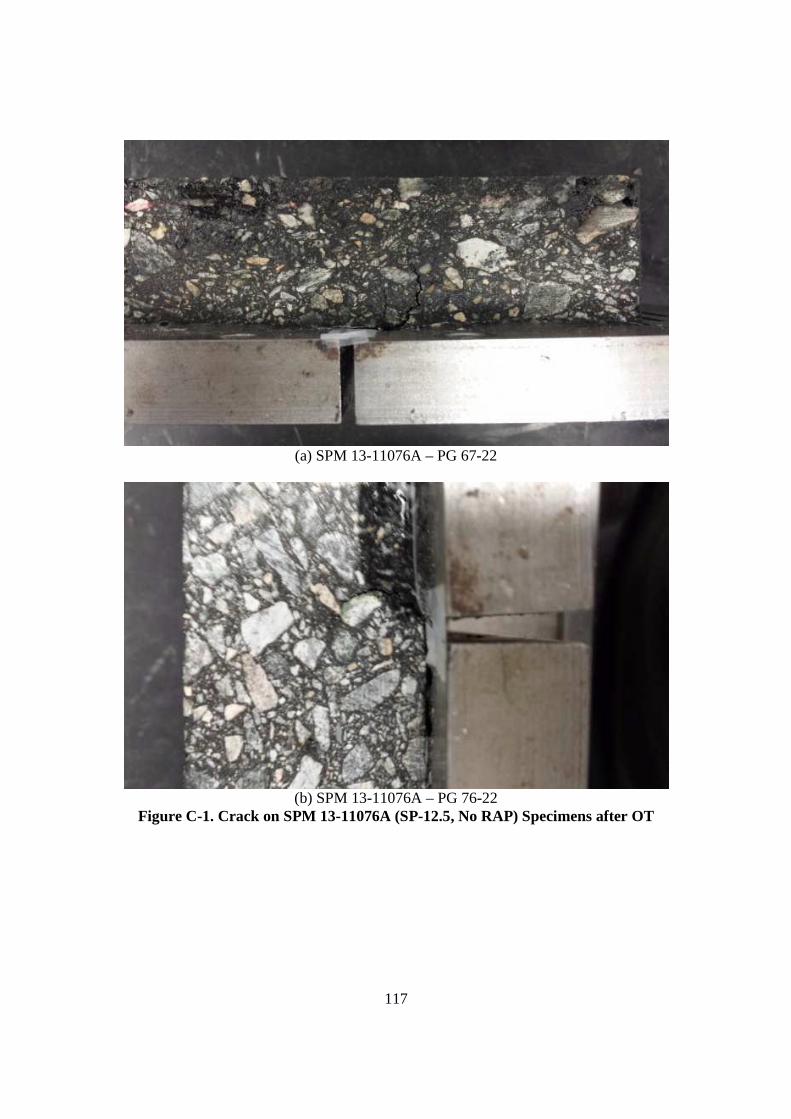
117
(a) SPM 13-11076A – PG 67-22
(b) SPM 13-11076A – PG 76-22
Figure C-1. Crack on SPM 13-11076A (SP-12.5, No RAP) Specimens after OT
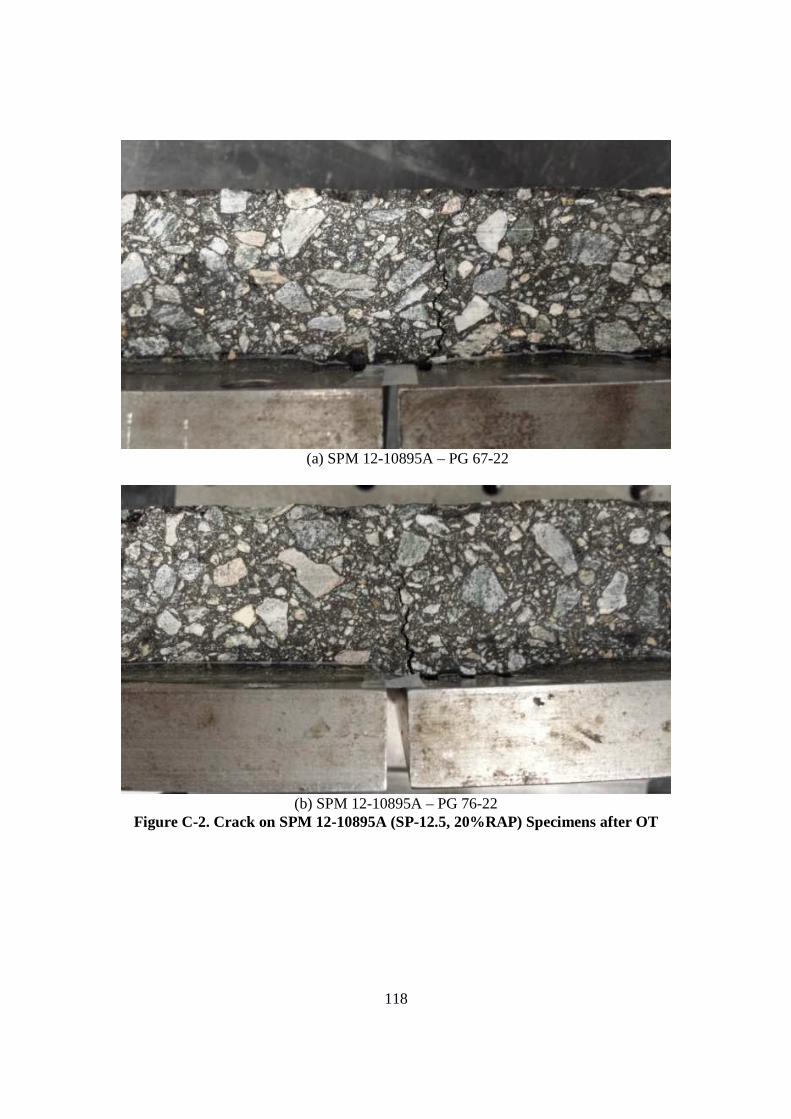
118
(a) SPM 12-10895A – PG 67-22
(b) SPM 12-10895A – PG 76-22
Figure C-2. Crack on SPM 12-10895A (SP-12.5, 20%RAP) Specimens after OT

119
(a) SPM 13-11035A – PG 67-22
(b) SPM 13-11035A – PG 76-22
Figure C-3. Crack on SPM 13-11035A (SP-12.5, No RAP) Specimens after OT
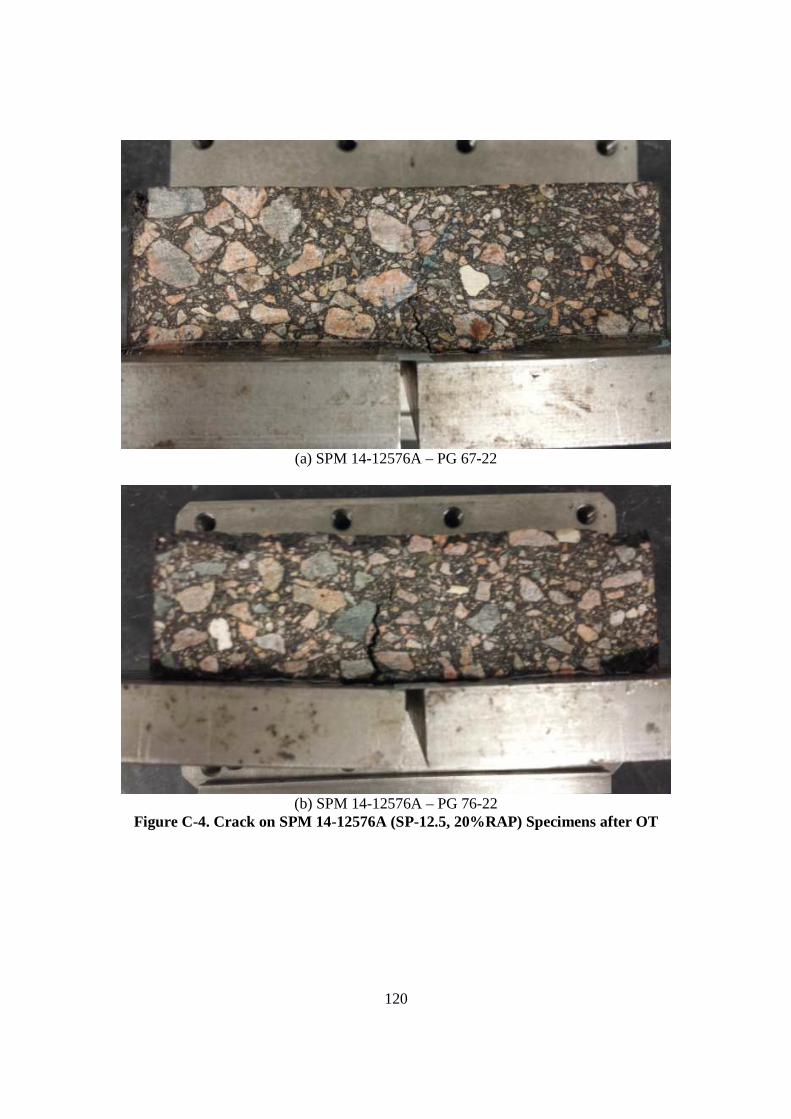
120
(a) SPM 14-12576A – PG 67-22
(b) SPM 14-12576A – PG 76-22
Figure C-4. Crack on SPM 14-12576A (SP-12.5, 20%RAP) Specimens after OT

121
(a) SPM 14-12199A – PG 67-22
(b) SPM 14-12199A – PG 76-22
Figure C-5. Crack on SPM 14-12199A (SP-12.5, No RAP) Specimens after OT

122
(a) SP 14-12171B – PG 67-22
(b) SP 14-12171B – PG 76-22
Figure C-6. Crack on SP 14-12171B (SP-12.5, 20%RAP) Specimens after OT
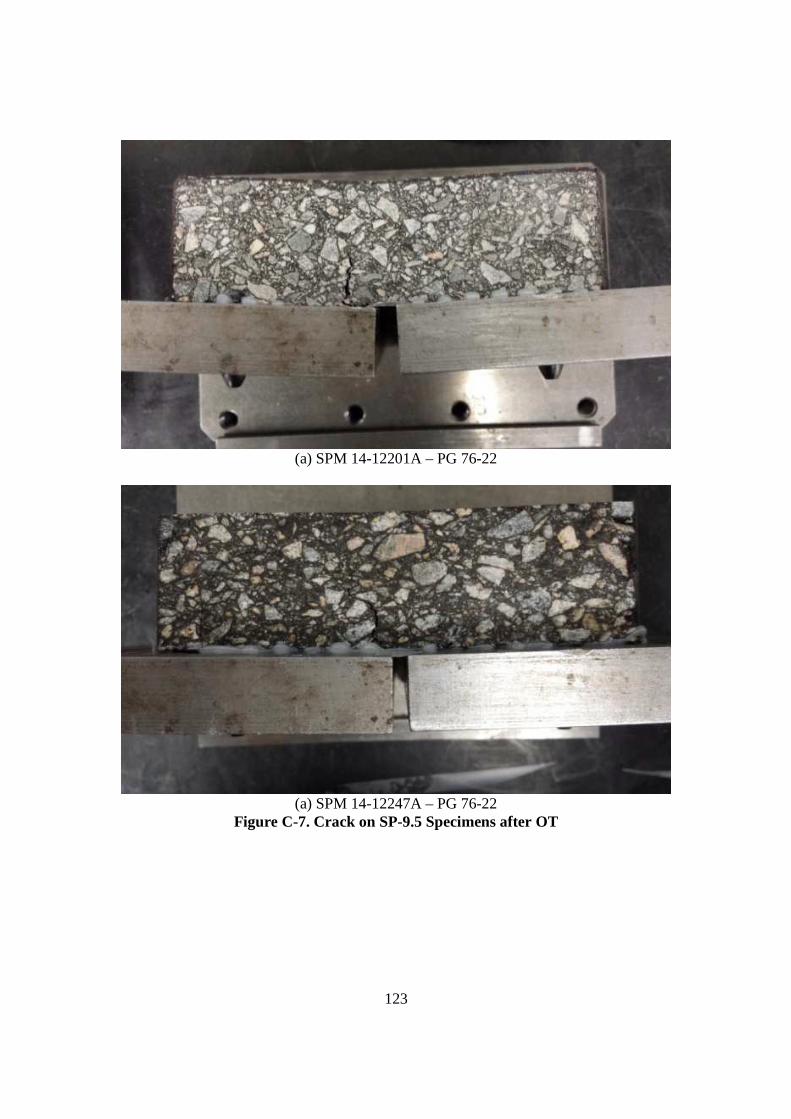
123
(a) SPM 14-12201A – PG 76-22
(a) SPM 14-12247A – PG 76-22
Figure C-7. Crack on SP-9.5 Specimens after OT
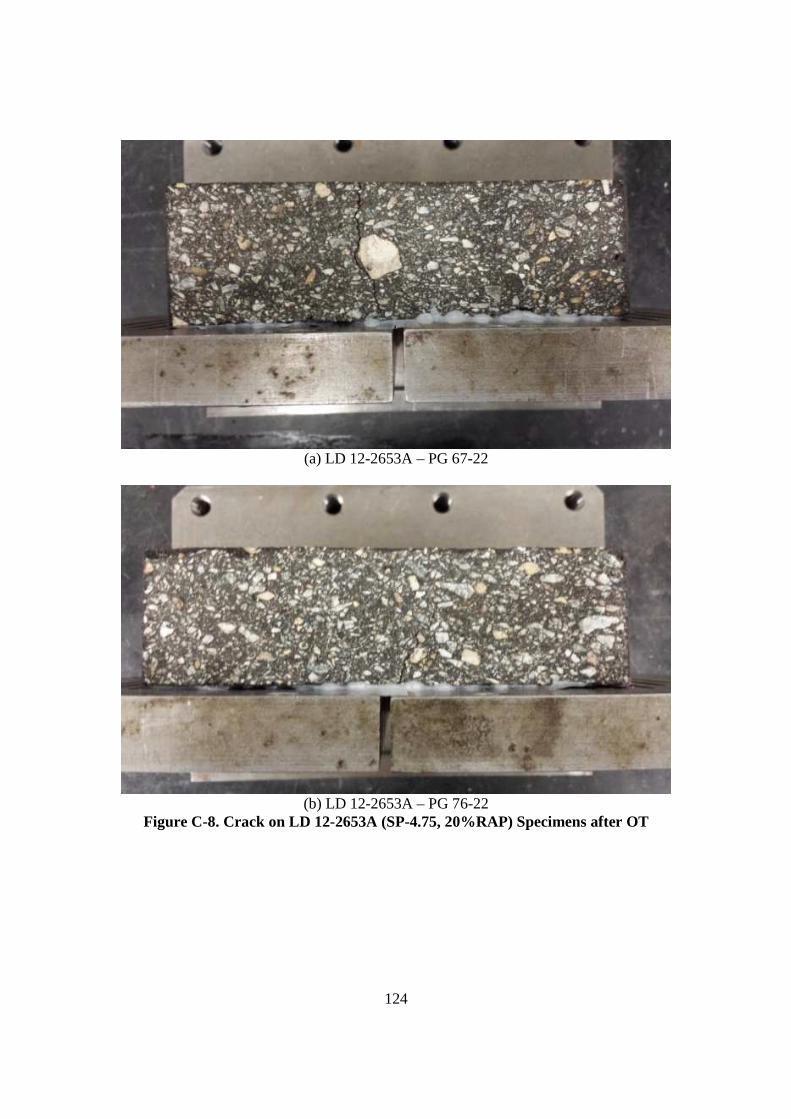
124
(a) LD 12-2653A – PG 67-22
(b) LD 12-2653A – PG 76-22
Figure C-8. Crack on LD 12-2653A (SP-4.75, 20%RAP) Specimens after OT
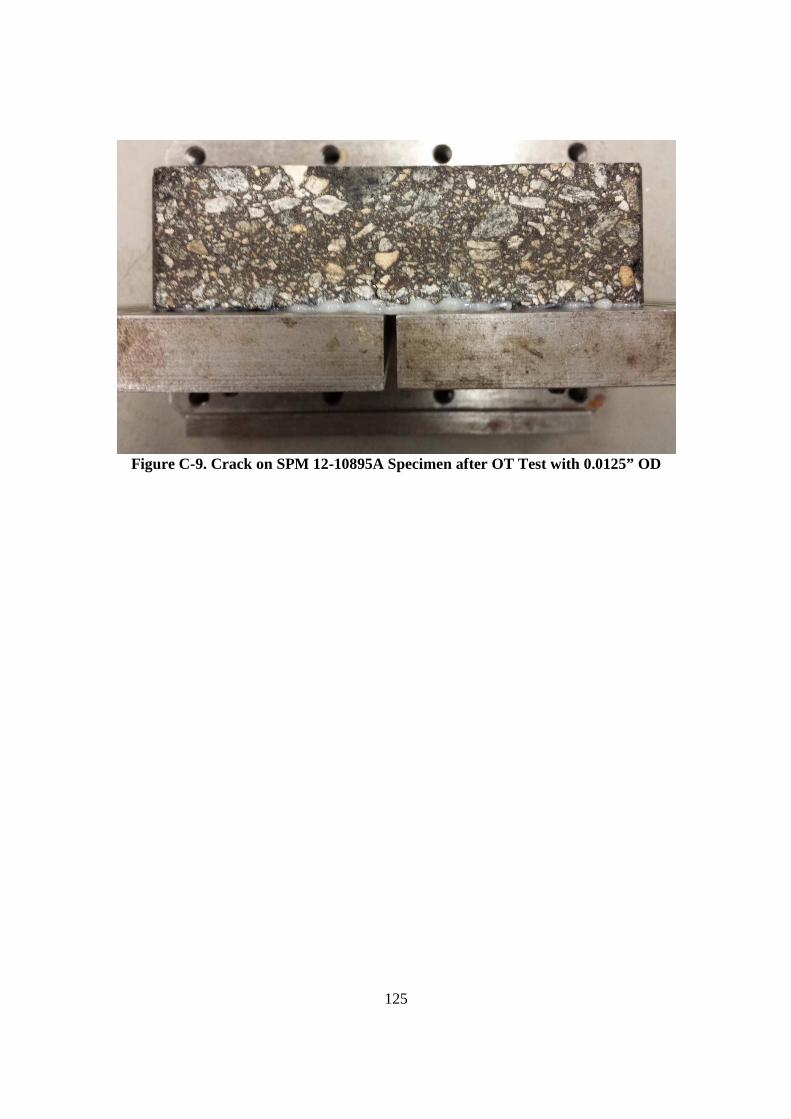
125
Figure C-9. Crack on SPM 12-10895A Specimen after OT Test with 0.0125” OD
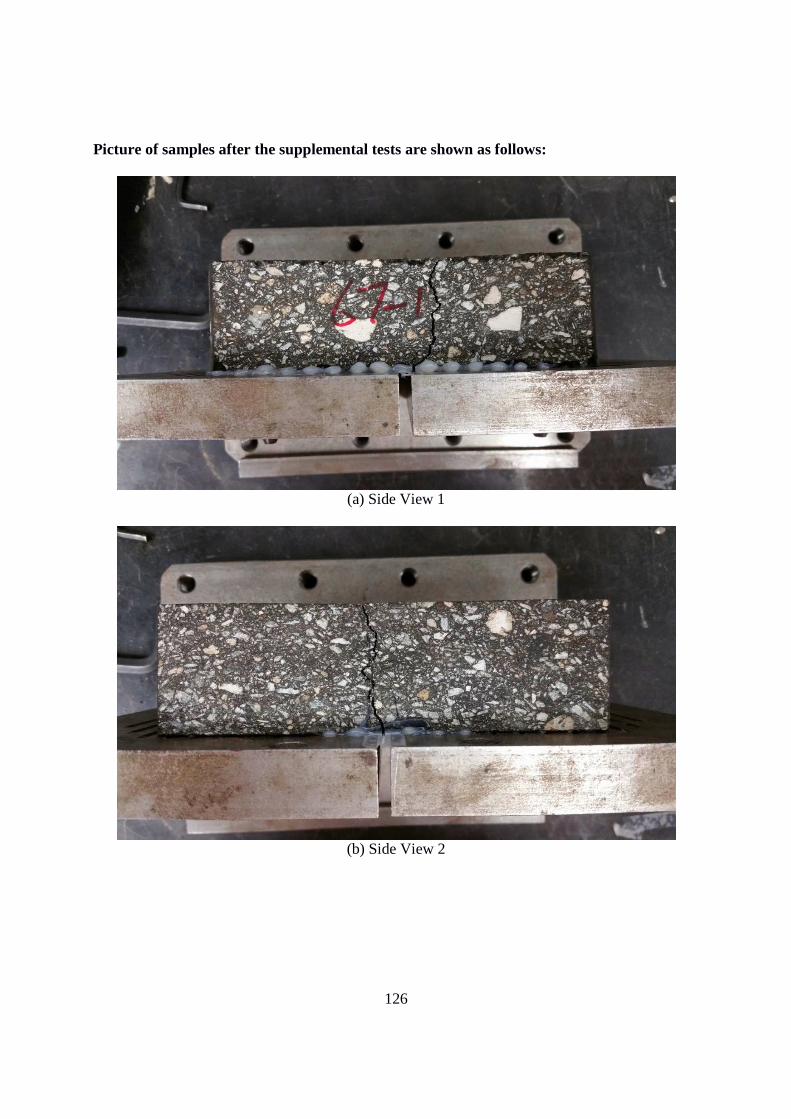
126
Picture of samples after the supplemental tests are shown as follows:
(a) Side View 1
(b) Side View 2

127
(c) Top View
(d) Specimen After Being Broken Apart
Figure C-10. Pictures of LD 12-2653A Mix with PG 67-22 after OT – Sample 1

128
(a) Side View 1
(b) Side View 2
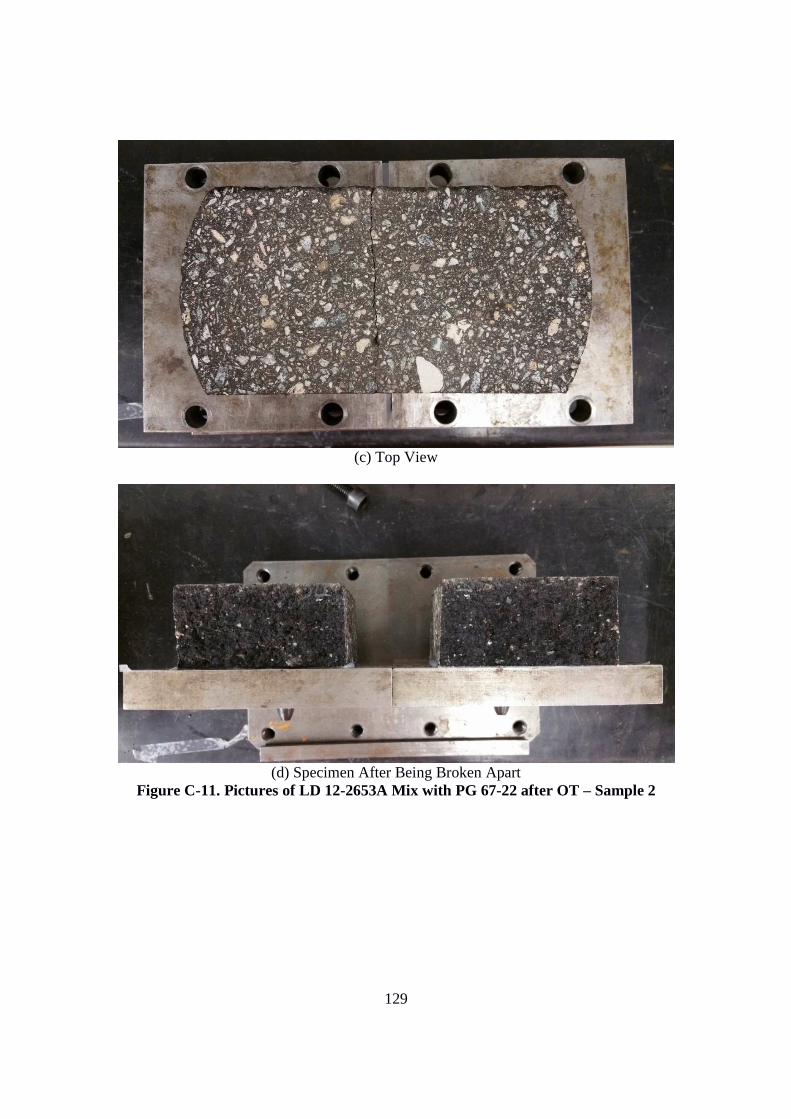
129
(c) Top View
(d) Specimen After Being Broken Apart
Figure C-11. Pictures of LD 12-2653A Mix with PG 67-22 after OT – Sample 2
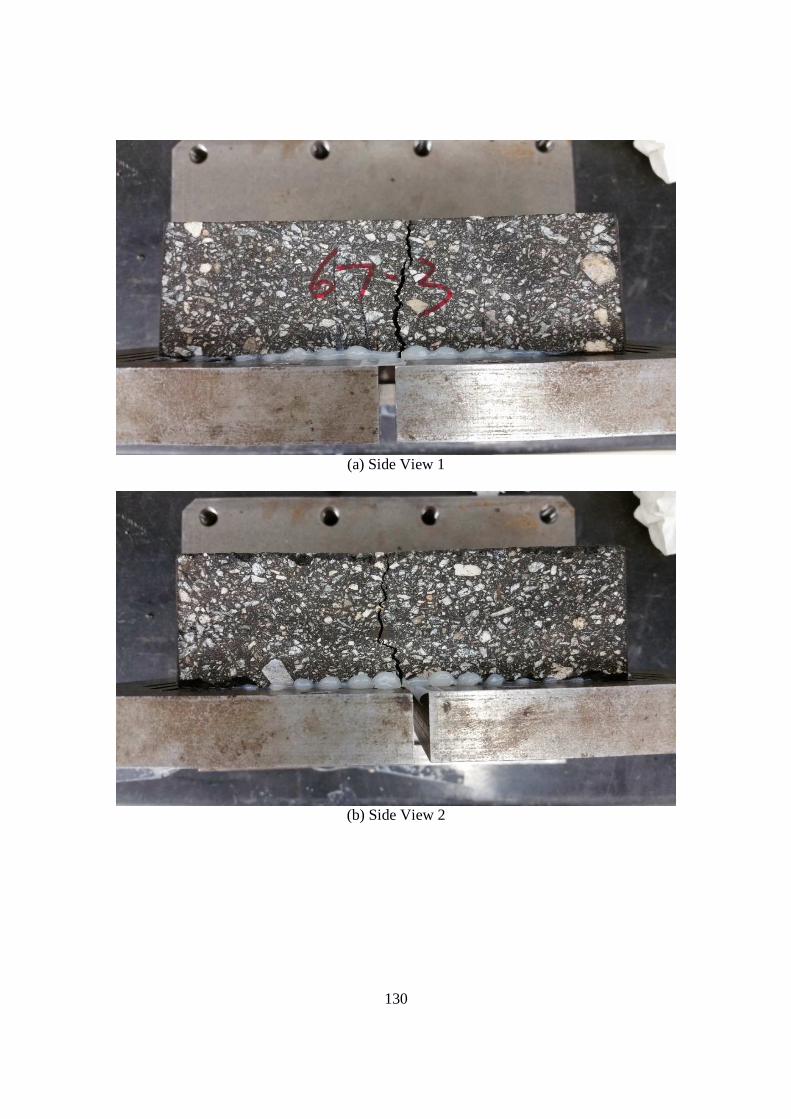
130
(a) Side View 1
(b) Side View 2
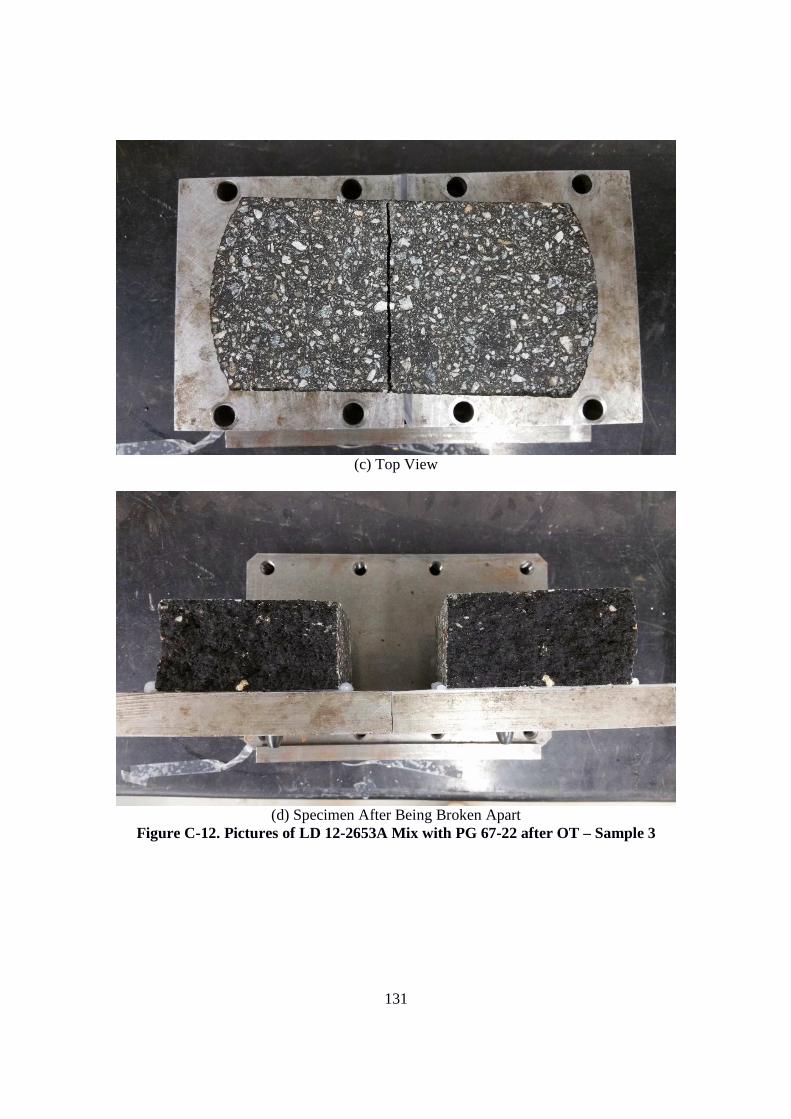
131
(c) Top View
(d) Specimen After Being Broken Apart
Figure C-12. Pictures of LD 12-2653A Mix with PG 67-22 after OT – Sample 3

132
(a) Side View 1
(b) Side View 2
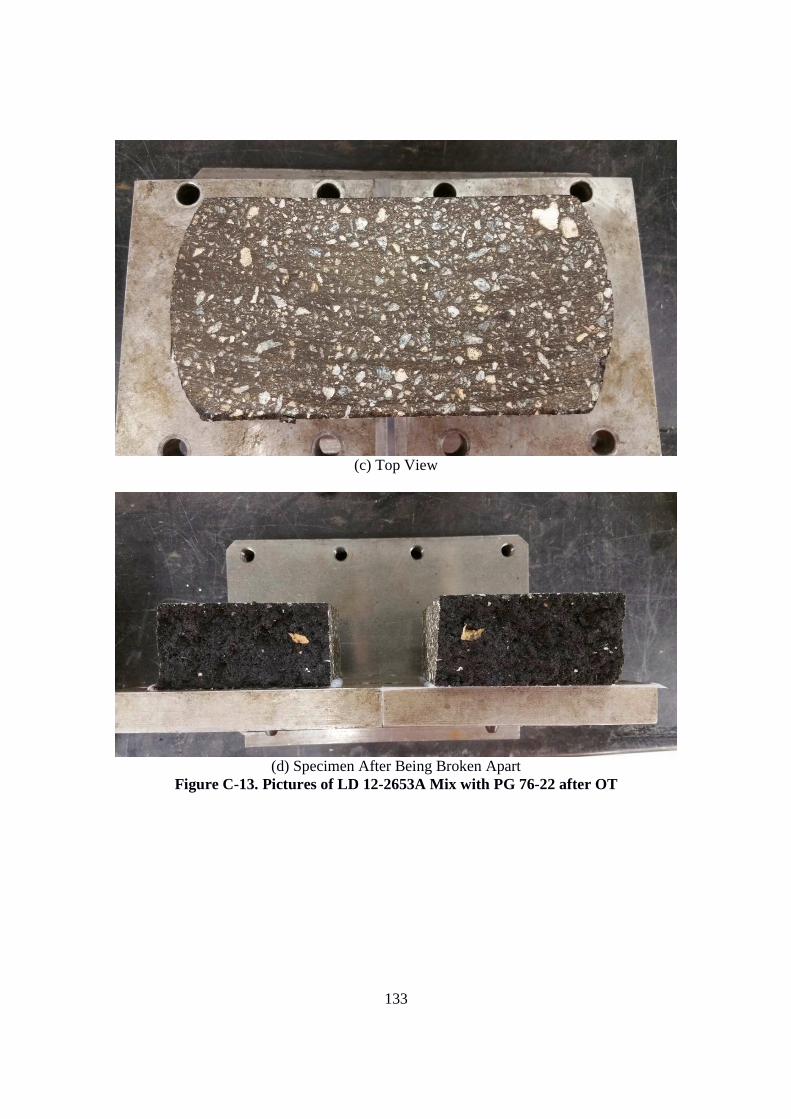
133
(c) Top View
(d) Specimen After Being Broken Apart
Figure C-13. Pictures of LD 12-2653A Mix with PG 76-22 after OT
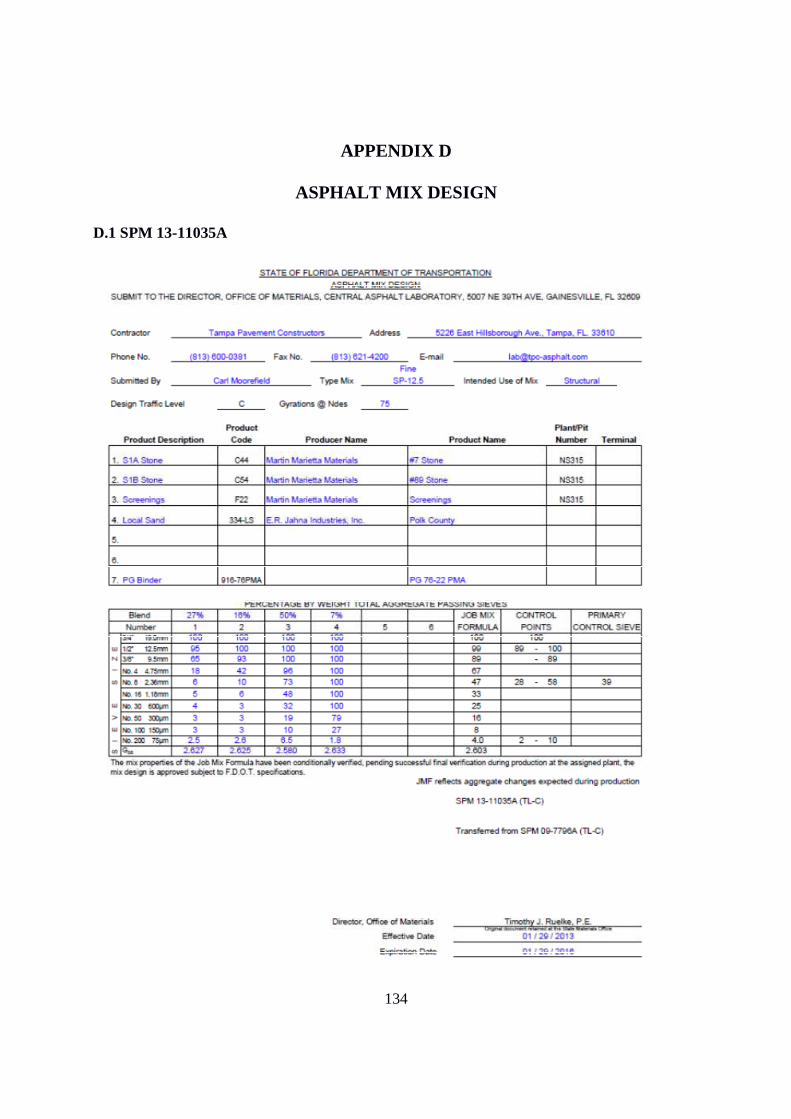
134
APPENDIX D
ASPHALT MIX DESIGN
D.1 SPM 13-11035A
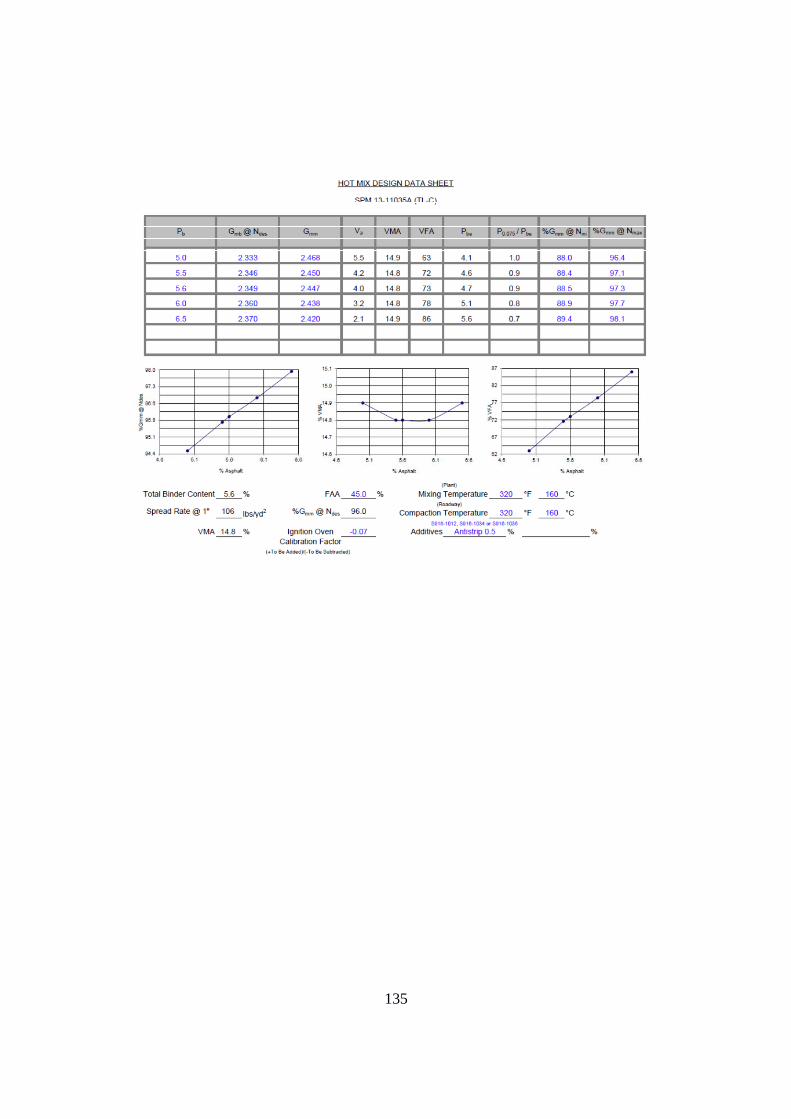
135
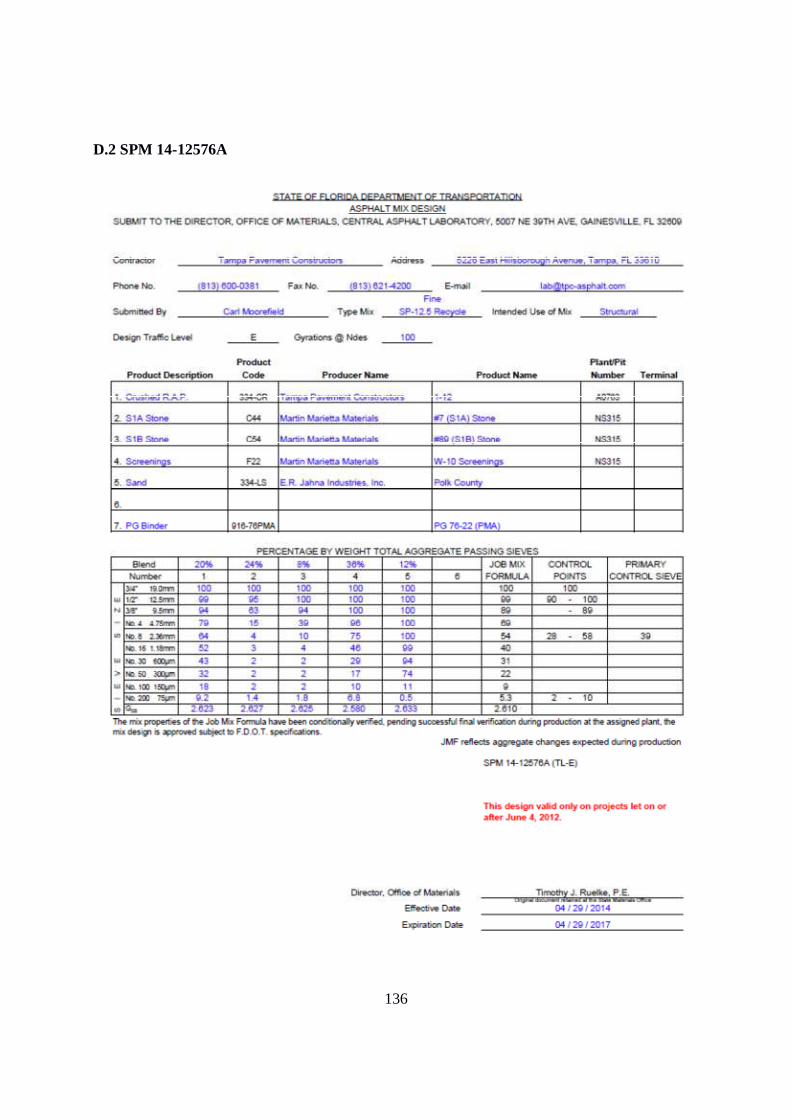
136
D.2 SPM 14-12576A
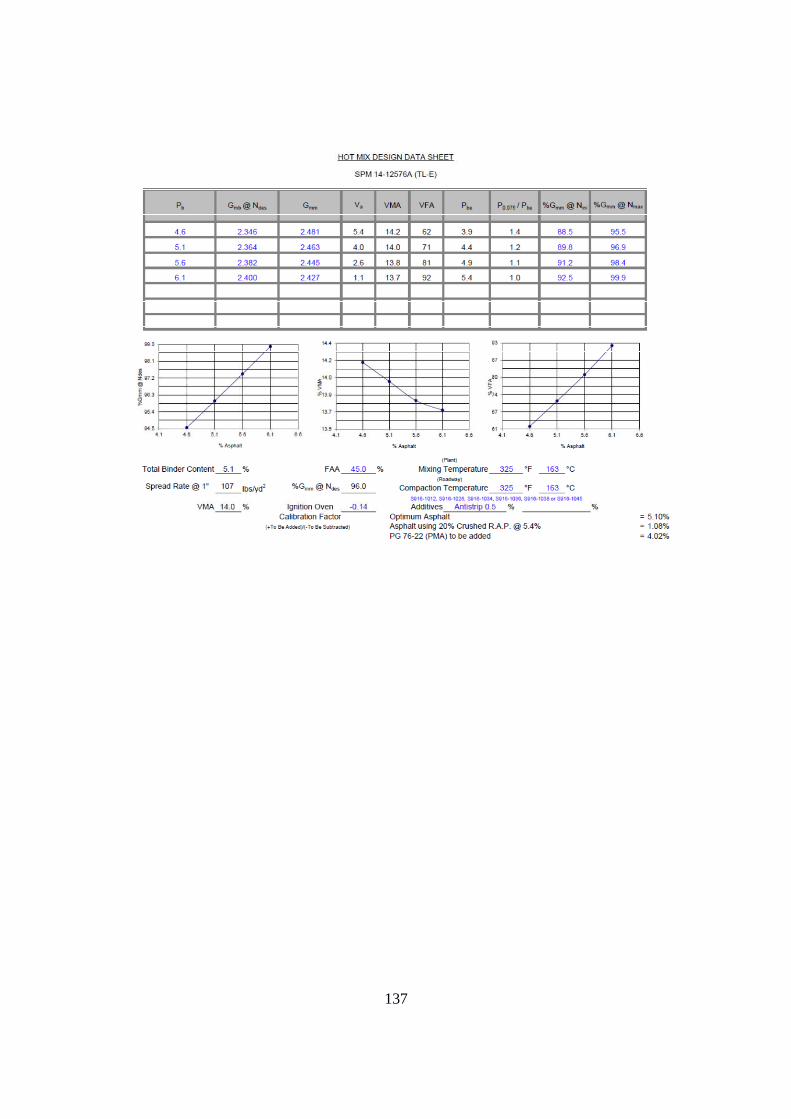
137
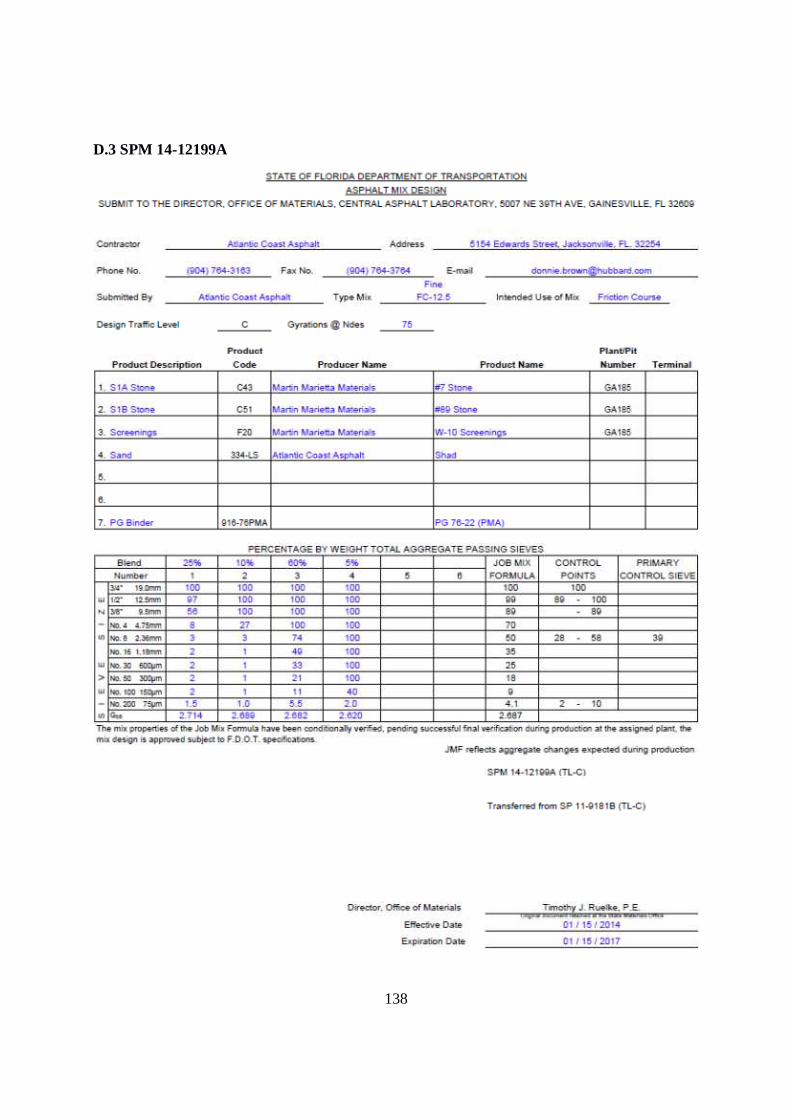
138
D.3 SPM 14-12199A
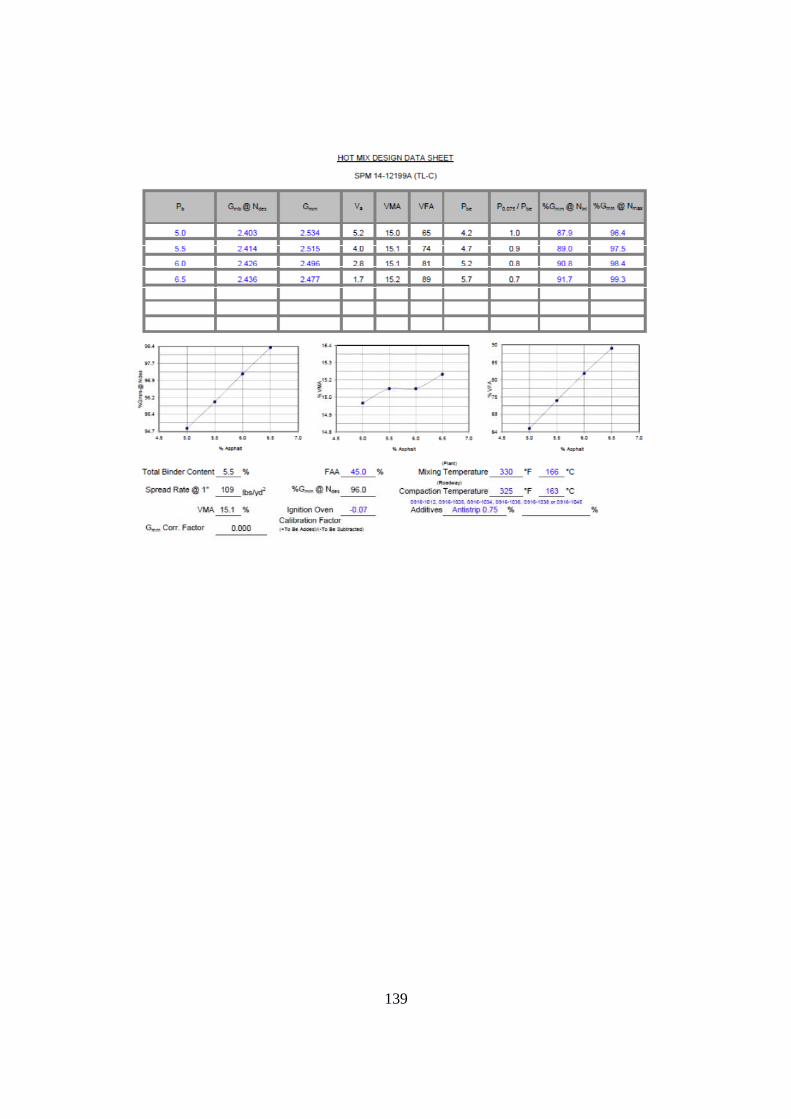
139

140
D.4 SP 14-12171B
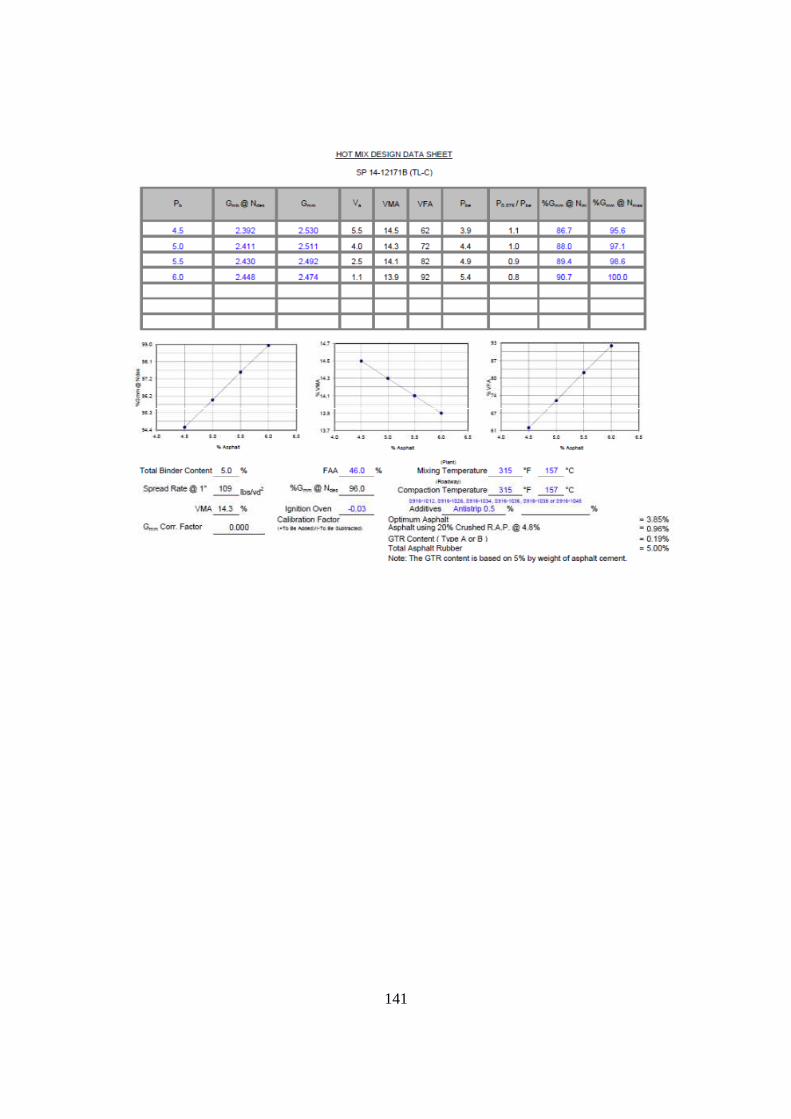
141
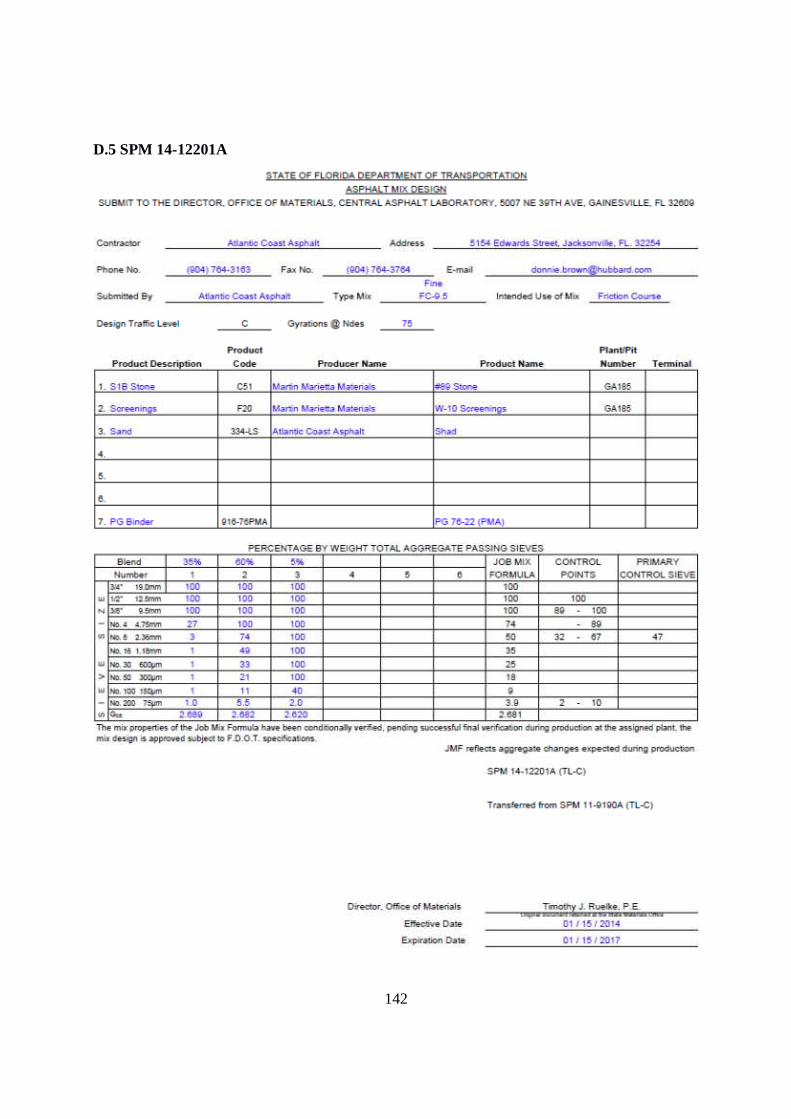
142
D.5 SPM 14-12201A
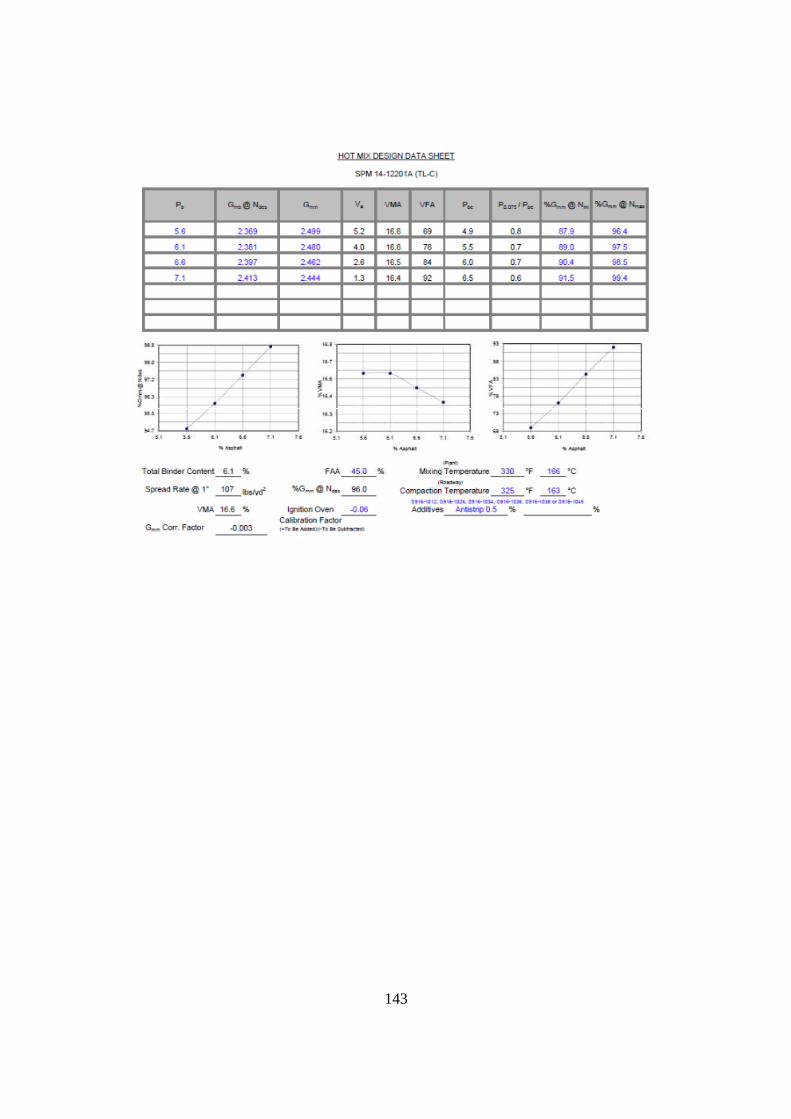
143
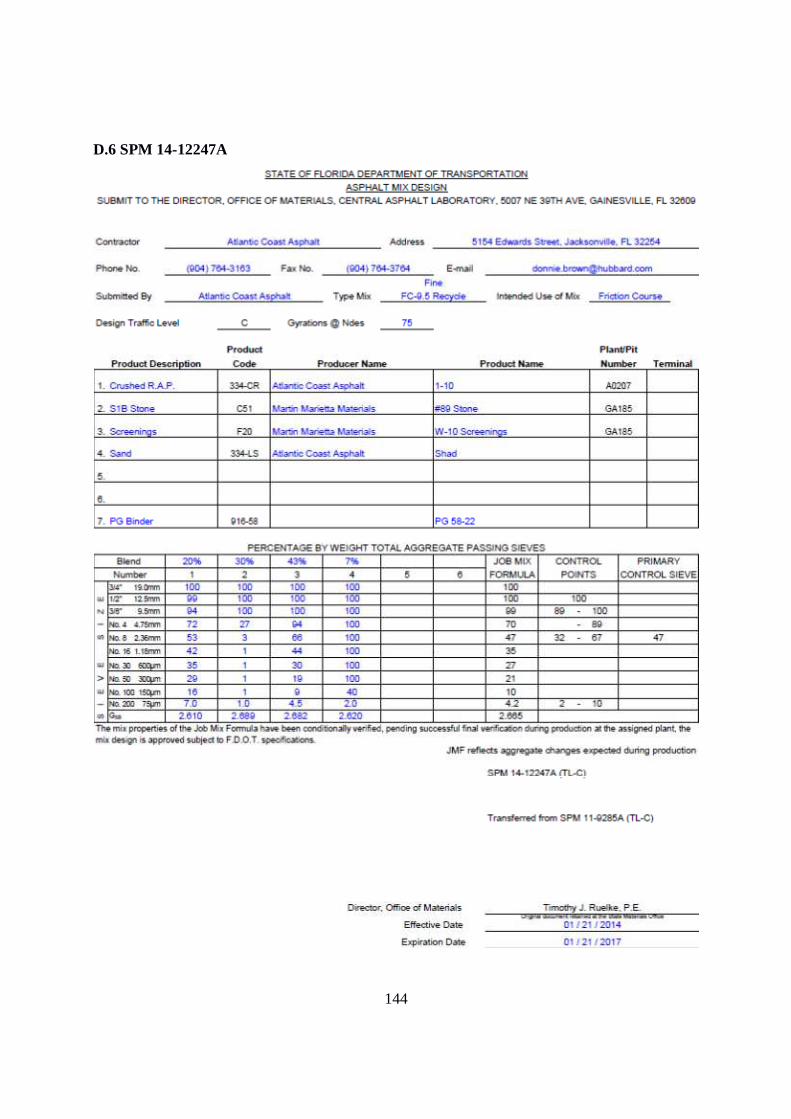
144
D.6 SPM 14-12247A

145
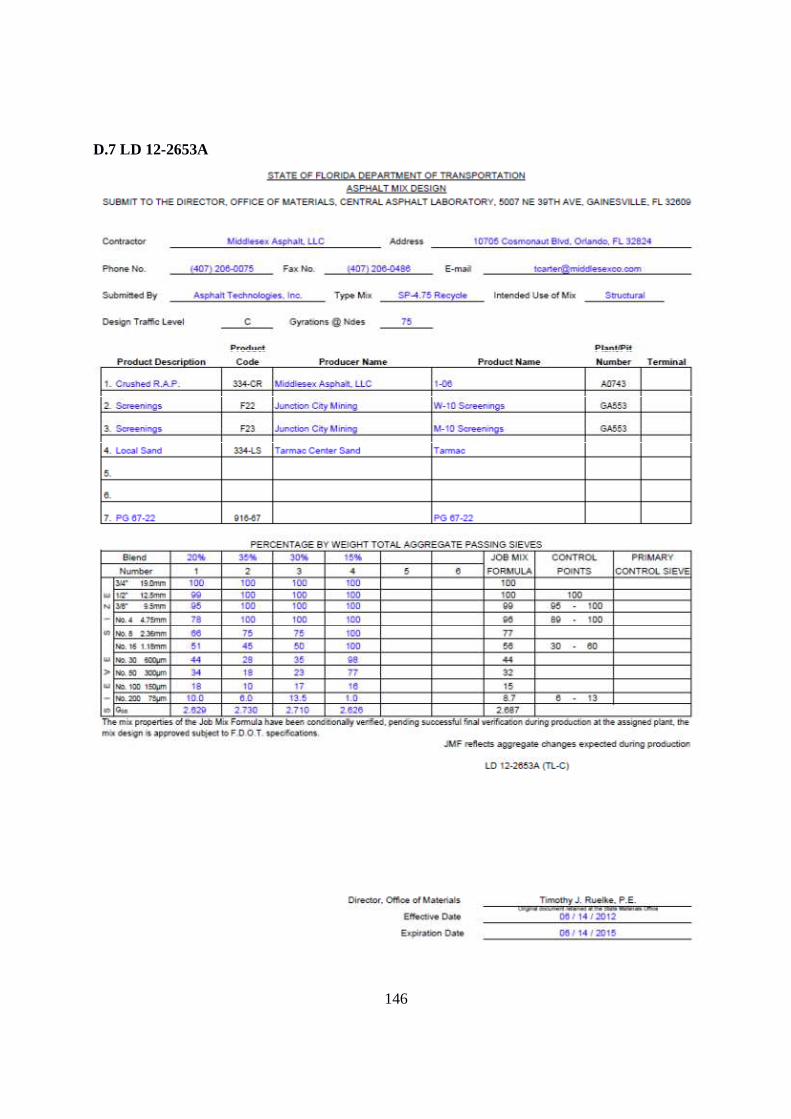
146
D.7 LD 12-2653A

147