field study of industrial high frequency battery...
TRANSCRIPT

Field Study of Industrial High Frequency Battery Chargers
09/08/2017
Contract # 72746
Conservation Applied Research and Development (CARD) FINAL Report
Prepared for: Minnesota Department of Commerce, Division of Energy Resources
Prepared by: Franklin Energy Services, LLC

Prepared by: Joe Plummer Mark Francis Dean Laube Franklin Energy Services, LLC 2303 Wycliff St SE, Suite 2E St. Paul, MN, 55114 Phone: 612-284-3663 website: www.franklinenergy.com © 2017 Franklin Energy Services, LLC. All rights reserved.
Contract Number: 72746
Prepared for Minnesota Department of Commerce, Division of Energy Resources:
Mike Rothman, Commissioner, Department of Commerce
Bill Grant, Deputy Commissioner, Department of Commerce, Division of Energy Resources
Mark Garofano, Project Manager 651-539-1864 [email protected]
ACKNOWLEGEMENTS
This project was supported in part by a grant from the Minnesota Department of Commerce, Division of Energy Resources, through the Conservation Applied Research and Development (CARD) program, which is funded by Minnesota ratepayers.
The authors would also like to thank the following individuals and organizations for their contributions to this project: Paul Twite and Energy Insight, Inc. for their critical roles as subcontractors, which included finding test sites, installing equipment and setting up instrumentation; Minnesota Industrial Battery, for generously lending high frequency chargers for the study; and Rick Berry and Tom Syring, former colleagues at Franklin Energy for their early contributions to this study.
DISCLAIMER
This report does not necessarily represent the view(s), opinion(s), or position(s) of the Minnesota Department of Commerce (Commerce), its employees or the State of Minnesota (State). When applicable, the State will evaluate the results of this research for inclusion in Conservation Improvement Program (CIP) portfolios and communicate its recommendations in separate document(s).
Commerce, the State, its employees, contractors, subcontractors, project participants, the organizations listed herein, or any person on behalf of any of the organizations mentioned herein make no warranty, express or implied, with respect to the use of any information, apparatus, method, or process disclosed in this document. Furthermore, the aforementioned parties assume no liability for the information in this report with respect to the use of, or damages resulting from the use of, any information, apparatus, method, or process disclosed in this document; nor does any party represent that the use of this information will not infringe upon privately owned rights.

Field Study of Industrial High Frequency Battery Chargers Franklin Energy Services, LLC 1
Table of Contents
Table of Contents ...............................................................................................................................1
List of Figures .....................................................................................................................................2
List of Tables ......................................................................................................................................2
Executive Summary ............................................................................................................................3
Introduction ......................................................................................................................................5
Background .......................................................................................................................................7
Technology Description ............................................................................................................................. 7
Ferroresonant (FR) Chargers ................................................................................................................. 7
Silicon-controlled Rectifier (SCR) Chargers ........................................................................................... 7
Hybrid Chargers .................................................................................................................................... 8
High Frequency (HF) Chargers .............................................................................................................. 8
Technology Summary ............................................................................................................................ 9
Energy Efficiency Metrics .......................................................................................................................... 9
Review of Past Studies ............................................................................................................................ 10
Inclusion in DSM programs ..................................................................................................................... 12
Methodology ................................................................................................................................... 14
Field Testing Procedure ........................................................................................................................... 14
Customer Interviews ............................................................................................................................... 15
Findings and Analysis ....................................................................................................................... 16
AC Input Power ........................................................................................................................................ 16
Power Conversion Efficiency ................................................................................................................... 20
Interview Results ..................................................................................................................................... 21
Conclusions and Recommendations.................................................................................................. 23
References ....................................................................................................................................... 24
Appendix A. Interview Summaries .................................................................................................... 25
Site 8. ....................................................................................................................................................... 25
Site 9. ....................................................................................................................................................... 27

Field Study of Industrial High Frequency Battery Chargers Franklin Energy Services, LLC 2
List of Figures
Figure 1. Single-phase Ferroresonant Battery Charger Circuit ........................................................... 7
Figure 2. Single-Phase SCR Battery Charger Circuit ............................................................................. 8
Figure 3. Single-Phase HF Battery Charger Circuit ............................................................................... 8
Figure 4. Battery Monitoring Device and Embedded Test Assembly .............................................. 15
List of Tables
Table 1. Summary of battery charger technologies ............................................................................... 9
Table 2. PG&E Test Results by Charger Technology .......................................................................... 11
Table 3. PG&E Average Savings Results by Number of Lift-Truck Shifts ....................................... 11
Table 4. Summary of Prescriptive Offerings for HF Industrial Battery Chargers .......................... 13
Table 5. Field results for Sites 1-2. Changes Pre-Post summarize changes in key parameters between the pre- and post-periods, with green highlighting significant increases, and red highlighting significant decreases. ........................................................................................................ 18
Table 6. Field test results for Sites 3-6 ................................................................................................... 19
Table 7. Field test results for Sites 7-9 ................................................................................................... 20
Table 8. Conversion Efficiency Results for Site 8. Results demonstrate a higher conversion efficiency with the HF charger. .............................................................................................................. 21
Table 9. Summary Information on Interview Sites ............................................................................. 21

Field Study of Industrial High Frequency Battery Chargers Franklin Energy Services, LLC 3
Executive Summary
Battery-powered lift-trucks are utilized throughout manufacturing facilities, airports, warehouses, and
retail buildings for material handling. The number of battery-powered lift-trucks used in Minnesota is
quite large: in the industrial sector alone, it is our experience that the typical manufacturer has at least
one battery-powered lift-truck, and the state of Minnesota has approximately 7,300 businesses that are
classified by NAICS code as manufacturing1.
There are three types of battery chargers commonly used to power lift-trucks: ferroresonant (FR),
silicon-controlled rectifier (SCR), and high frequency (HF). Local suppliers estimate that the vast majority
of industrial battery chargers used in Minnesota today are silicon-controlled rectifier (SCR) or
ferroresonant (FR) chargers. These battery charging types have long been in existence and proven to be
very reliable for high power applications. However, high frequency (HF) chargers, the newest technology
of the three, have quickly gained a market foothold in recent years. HF chargers are typically promoted
as being more energy efficient than conventional chargers, and are usually sold at a higher cost. A
landmark study by the Pacific Gas and Electric Company (PG&E) in 2009 (Ecos 2009) involving
standardized testing of a large number of industrial battery chargers demonstrated that HF chargers can
offer significant energy efficiency improvements over FR or SCR chargers.
Some manufacturers also promote HF chargers as providing opportunity charging capability, in which
batteries are charged at a very high rate during breaks in the workday. In contrast, under a conventional
charging approach, batteries are run down to low levels, then slowly charged overnight and/or during
off-peak hours. Opportunity charging can offer productivity and safety benefits for some businesses by
avoiding the need to change batteries when depleted.
This study set out to evaluate the actual performance of HF chargers in the field. Field testing was
completed at a total of 9 facilities across Minnesota and South Dakota, comprising a total of 13 charging
stations. At each site, energy loggers were installed to monitor existing FR or SCR chargers for a period
of two weeks of normal production activity. Next, HF chargers were installed, and energy loggers were
installed to monitor the new HF chargers over an additional two weeks of normal production activity.
The resulting pre- and post- energy logging data was then analyzed to determine energy savings. We
also analyzed the data to detect any impacts on peak demand from installing the HF chargers, which
could occur if lift-truck operators switched to opportunity charging.
The field test results were puzzling. Installing HF chargers did not consistently reduce the energy
consumed per charge cycle, or total energy use per day, which would have been expected from the
PG&E results; in some sites, energy consumption actually increased with the HF chargers. There was also
no consistent impact on peak demand, though operators generally did not take advantage of the ability
to opportunity charge with the new HF chargers. However, the testing arrangements generally had
1 US Census, 2011 County Business Patterns.

Field Study of Industrial High Frequency Battery Chargers Franklin Energy Services, LLC 4
significant limitations, which make it difficult to draw conclusions from our results on the actual impacts
on energy and peak demand.
Many utilities currently offer custom incentives for HF industrial battery chargers. Because of the
limitations of this study, there is insufficient evidence from our findings alone to discontinue this
practice, especially given the previous work by PG&E demonstrating significant energy savings on
average for replacement of FR and SCR chargers. However, the PG&E results indicate significant
variability in key energy efficiency metrics across each charger type. This suggests that HF chargers are
not necessarily be a cost-effective investment option for every business. Proposed installations should
be carefully evaluated in relation to existing charger performance to ensure that minimum return on
investment requirements will be achieved. If opportunity charging is desired, special consideration
should be given to potential peak demand impacts as a result of the faster rate of charging.
Field Study of Industrial High Frequency Battery Chargers Franklin Energy Services, LLC 5
Introduction
Battery-powered lift-trucks are utilized throughout manufacturing facilities, airports, warehouses, and
retail buildings for material handling. The number of battery-powered lift-trucks used in Minnesota is
quite large: in the industrial sector alone, it is our experience that the typical manufacturer has at least
one battery-powered lift-truck, and the state of Minnesota has approximately 7,300 businesses that are
classified by NAICS code as manufacturing2.
The energy needed to power a battery-powered lift-truck is substantial: according to one estimate, the
typical charger consumes approximately 15,000 kWh per year, resulting in a total utility cost of $1,500
annually (Ecos 2009)3. For a large facility with many lift-trucks, the total cost can be very large relative to
other end-use equipment often targeted for energy efficiency improvements.
Local suppliers confirm that the vast majority of industrial battery chargers in use today are silicon-
controlled rectifier or ferroresonant chargers. These battery charging types, collectively referred to as
“conventional” chargers in this report, have long been in existence and proven to be very reliable for
high power applications. However, high frequency chargers, the most recent entrant to the industrial
battery charging market, are available and have quickly gained a market foothold in recent years. High
frequency chargers are typically promoted as being more energy efficient than conventional chargers,
and are usually sold at a higher cost.
Some manufacturers have also promoted high frequency chargers as offering faster charging capability
than conventional chargers, allowing users to “opportunity charge” during breaks in the workday and
still maintain sufficient battery power. In contrast, conventional charging has traditionally meant
running batteries down to approximately 20% capacity, and then recharging slowly (typically during off-
peak/overnight hours) to 80% capacity. Some facilities with very heavy lift-truck usage are forced to
swap out batteries daily to maintain lift-truck usage due to the slow charging rates under conventional
charging. This is a non-value added activity that increases maintenance costs and impacts productivity.
Standardized tests developed under the auspices of the California Energy Commission have
demonstrated the potential for significant energy savings through replacement of conventional chargers
with HF chargers. However, there is relatively little information in the public domain on the actual
performance of HF chargers in the field. This study set out to evaluate the performance of HF chargers
deployed across manufacturing facilities located in Minnesota and South Dakota.4 Of special interest
was whether the ability to opportunity charge would have a detrimental impact on a facility’s peak
demand charges, offsetting any savings from the higher energy efficiency of HF chargers. We also
2 US Census, 2011 County Business Patterns. 3 Assumes a blended rate of $0.10 per kWh, in our experience an average rate for Midwest utilities. 4 All but one facility was in Minnesota. The South Dakota facility was chosen because of the facility manager was interested in evaluating high frequency charger performance, and the facility had heavy lift-truck usage, so we anticipated being able to capture a large number of charging cycles.

Field Study of Industrial High Frequency Battery Chargers Franklin Energy Services, LLC 6
wanted to understand what non-energy benefits, if any, the HF chargers offered to the facilities through
faster charging capability.

Field Study of Industrial High Frequency Battery Chargers Franklin Energy Services, LLC 7
Background
Technology Description
There are four types of industrial battery chargers: ferroresonant (FR), silicon-controlled rectifier (SCR),
hybrid, and high frequency (HF). FR and SCR are the most common types in use today, though the
market share of HF chargers is growing. Every type of charger performs the same basic function:
conversion of alternating current (AC) electricity from the utility to direct current (DC) electricity at the
battery terminals; for large industrial battery chargers, three phase AC power is usually supplied.
However, the specific way power is converted and delivered to the battery varies by technology.
Ferroresonant (FR) Chargers
Ferroresonant (FR) charger designs utilize a ferroresonant transformer circuit. A representational circuit
schematic is shown in Figure 1. While they have a proven track record of reliability, FR chargers have
relatively low power conversion efficiencies, averaging approximately 85% (Ecos 2009). Eddy current
and magnetic saturation losses in the transformer core are responsible for the low conversion
efficiencies. Despite this shortcoming, FR chargers are still widely used today, owing to their relatively
low cost and proven reliability.
Figure 1. Single-phase Ferroresonant Battery Charger Circuit
Silicon-controlled Rectifier (SCR) Chargers
This type of charger uses a silicon-controlled rectifier to regulate voltage and current to the battery, as
indicated in Figure 2. Like FR chargers, SCR chargers are a mature technology with proven reliability in
high power applications. However, conversation efficiency is generally lower than HF chargers, owing to
the limited switching speed of the SCR.

Field Study of Industrial High Frequency Battery Chargers Franklin Energy Services, LLC 8
Figure 2. Single-Phase SCR Battery Charger Circuit
Hybrid Chargers
Hybrid chargers are similar to FR chargers, but use a switching circuit in place of the capacitor shown in
Figure 1. While more efficient than FR or SCR on average, hybrid chargers are not widely used.
High Frequency (HF) Chargers
HF chargers, illustrated in Figure 3, include a switching circuit built from insulated gate bipolar
transistors (IGBTs), which are capable of much faster switching than SCRs. They are capable of achieving
higher power conversion efficiency than FR or SCR technology, in excess of 90% according to studies by
the Pacific Gas and Electric Company (PG&E) (Ecos 2009). These studies also found that HF chargers
produce higher power factors on average than conventional chargers, which can be an important
consideration for facilities with a large number of chargers and heavy lift-truck usage.
While HF chargers are the newest large battery charging technology on the market, they have been
commercially available since at least 1996 (Stanbury 2013). It was not until the late 2000s that utilities
began widely promoting HF chargers as an energy efficiency measure, however, following adoption of a
standardized test procedure for industrial battery chargers by the California Energy Commission. More
information is provided on this project under Review of Past Studies.
Figure 3. Single-Phase HF Battery Charger Circuit

Field Study of Industrial High Frequency Battery Chargers Franklin Energy Services, LLC 9
Technology Summary
Table 1 provides a synopsis of the four types of industrial battery chargers with typical power conversion
efficiencies, cost, and estimated market share.
Table 1. Summary of battery charger technologies5
Technology
Approx. Percent of
Existing Stock6
Average Power
Conversion Efficiency Cost
Ferroresonant (FR) 50% 85% $1,500-$2,300
Silicon-Controlled Rectifier (SCR) 30% 85% $1,300-$2,700
Hybrid 5% 86% $2,000-$3,500
High Frequency (HF) 10% 92% $2,000-$3,500
Energy Efficiency Metrics
Test procedures developed by the California Energy Commission identified several energy efficiency
metrics which characterize industrial battery chargers:
Charge Return Factor, the ratio of amp-hours returned during a charge cycle to amp-hours delivered by the battery during discharge. This factor characterizes how well a charger controls charging according to a battery’s depth of discharge (DOD); the ideal range is 1.05 to 1.15 for battery health. Overcharging beyond 1.15 hurts the life of the battery and wastes energy.
Power Conversion Efficiency, the ratio of DC output power to AC input power.
Maintenance Power, the average AC power consumed by the charger when the battery is connected but not actively charging.
No Battery Power, the average AC power consumed by the charger with no battery connected.
Power Factor, the ratio of active (useful) power in Watts to apparent power in Volt-Amperes for AC electricity. Power factor varies between 0 and 1 and measures the extent to which the voltage and current phases are coincident. From a utility standpoint, the ideal Power Factor is 1.
For most installations, charge return factor and power conversion efficiency are the most impactful
energy efficiency metrics. Charge return factor, maintenance power, and no battery power primarily
related to how well the charger control circuitry is designed; any one product can be designed to
perform well in these metrics regardless of the underlying technology type (HF, FR, or SCR). However, HF
5 All figures are from the 2009 Ecos Consulting study of industrial battery chargers on behalf of PG&E (Ecos 2009). 6 Feedback from the three main Minnesota suppliers of industrial battery chargers indicated that the estimated distribution of charger types in California was similar to what Minnesota has.

Field Study of Industrial High Frequency Battery Chargers Franklin Energy Services, LLC 10
chargers tend to have an inherent advantage in terms of power conversion efficiency and power factor
over FR and SCR chargers (Ecos 2009).
Review of Past Studies
Much of the information on the energy efficiency of HF industrial battery chargers in the public domain
is the result of standardized testing performed by PG&E through its Emerging Technologies Program.
These efforts grew out of a 2003 initiative of the California Energy Commission’s (CEC) Public Interest
Research Program to develop a standardized test procedure for small consumer battery chargers for
products such as power tools, electric toothbrushes and shavers. The test procedure for consumer
battery chargers is conceptually similar to industrial battery chargers in that similar energy efficiency
metrics are measured such as power conversion efficiency and maintenance power.
While development of the consumer battery charger testing standard was ongoing, PG&E and Southern
California Edison (SCE) began collaborating on development of a modified test procedure for large three
phase industrial battery chargers. This procedure was eventually formalized and combined with the
consumer battery charger procedure. The combined document was then reviewed through a formal
rulemaking process and officially adopted by the CEC in December 2008 (Ecos 2009).
Using the new test procedure, PG&E completed a study of 28 industrial battery chargers covering all
four types with the goal of evaluating relative energy efficiency performance. The results, summarized in
Table 2, indicated that HF chargers were on average 5%-6% more efficient than FR or SCR chargers in
power conversion efficiency. With regard to charge return factor, the other factor most closely linked to
energy consumption, all charger types had an average value within the ideal 1.05-1.15 range except SCR.
HF chargers had the highest average power factor, though the range of FR power factors was similar.
The average values for each parameter were used to estimate average savings and paybacks for
replacement of FR, SCR, and Hybrid chargers with HF as indicated in Table 3.

Field Study of Industrial High Frequency Battery Chargers Franklin Energy Services, LLC 11
Table 2. PG&E Test Results by Charger Technology7
Orange fill indicates within ideal range
Yellow fill indicates best (highest or lowest)
Technology
Charge Return Factor
Power Conversion Efficiency
Maintenance Power (W)
No Battery Power (W)
Average Power Factor
FR
Range 1.12 - 1.21 84% - 87% 7.0 - 293.5 7.0 - 39.5 0.91 - 0.97
Average 1.15 85% 81.7 18.2 0.92
SCR
Range 1.09 - 1.35 81% - 88% 10.0 - 262.8 10.0 - 285.0 0.60 - 0.85
Average 1.18 85% 137.1 125.3 0.76
Hybrid
Range 1.10 - 1.14 80% - 89% 53.0 - 73.9 6.0 - 19.0 0.87 - 0.97
Average 1.12 86% 62.3 14.1 0.91
HF
Range 1.06 - 1.29 91% - 92% 23.8 - 108.0 23.8 - 108.0 0.93 - 0.99
Average 1.15 92% 48.4 48.4 0.96
Table 3. PG&E Average Savings Results by Number of Lift-Truck Shifts
Technology
Replaced Average Savings Achieved from HF Charger (per Unit)
(1) 8-hour shift
(2) 8-hour shifts
(3) 8-hour shifts
FR
Annual kWh Savings 1,035 2,125 2,911
Peak kW Savings 1.3 1.3 1.3
Payback: Incremental Cost (years) 8.5 4.2 3.0
Payback: Full Replacement Cost (years) 16.2 7.9 5.7
SCR
Annual kWh Savings 2,169 3,627 4,849
Peak kW Savings 0.4 0.4 0.4
Payback: Incremental Cost (years) 2.5 1.5 1.1
Payback: Full Replacement Cost (years) 8.8 5.3 3.9
Hybrid
Annual kWh Savings 149 439 575
Peak kW Savings 1.1 1.1 1.1
Payback: Incremental Cost (years) 16.3 5.5 4.2
Payback: Full Replacement Cost (years) 155.3 52.6 40.2
While the California standard was under development, the Electric Power Research Institute (EPRI) was
undertaking research on the benefits of fast charging in large manufacturing facilities. Demonstration
projects were completed in 2002-2004 of fast charging in automobile assembly plants in Illinois,
Alabama and Tennessee, all facilities with heavy lift-truck usage where batteries were changed daily
(EPRI 2002, EPRI 2003, EPRI 2004). New chargers with fast charging capability were installed in each
7 Source: (Ecos 2009).

Field Study of Industrial High Frequency Battery Chargers Franklin Energy Services, LLC 12
facility in order to test acceptance of the technology and evaluate the impact on productivity. The
results were very positive. Major findings included:
Increased productivity and reduced labor costs from not having to change batteries between shifts or at the end of the day
Improved safety through reduced risk of injury associated with battery change-outs, and reduced risk of vehicle collisions in battery changing areas
Parts and maintenance savings generated by not having to purchase extra batteries and better part protection
Battery and part protection, as batteries were less likely to go below 20% of charge capacity, which can damage batteries, brushes and connection points
It should be emphasized that the facilities in the EPRI studies were large automobile assembly plants
with very heavy lift-truck usage. As such, they are not representative of the typical facility using electric
lift-trucks. Many small to mid-sized facilities, which are most numerous in Minnesota, have only 1-2 lift-
trucks that are used daily but on a much more sporadic basis. Even facilities with regular lift-truck usage
may not need to change batteries daily. In both types of situations, the case for HF chargers is less
compelling from an O&M standpoint.
Inclusion in DSM programs
As a result of the PG&E studies, many utilities began to promote HF industrial battery chargers, typically
through custom incentive programs. A handful of utilities currently offer prescriptive rebates for HF
industrial battery chargers, as listed in Table 4.

Field Study of Industrial High Frequency Battery Chargers Franklin Energy Services, LLC 13
Table 4. Prescriptive Offerings for HF Industrial Battery Chargers
Utility Program States Incentive
ComEd Energy Impact Illinois IL
Up to $230 per charger for newer technology industrial battery charger (minimum power conversion efficiency of 92% and minimum 8-hour shift operation five days per week). New charger must replace either a Ferro resonant or SCR charger.
Consumers Energy Business Energy Efficiency Programs MI $350 per HF charger per shift.
Energy Smart - C&I, offered to 20 Municipal Utilities in Michigan MI $100 per HF charger per shift.
Missouri River Energy Services Bright Energy Solutions IA, MN, ND, SD
$100 per HF charger replacing FR or SCR charger (1 or 2 shifts fork lift operation). $300 per HF charger replacing FR or SCR charger (24-hour forklift operation).
Northwestern Energy ePlus MT $25 per unit for HF battery charger
PNM Commercial Energy Efficiency Rebate Program NM
$200 per unit for 3-Phase HF industrial battery charger

Field Study of Industrial High Frequency Battery Chargers Franklin Energy Services, LLC 14
Methodology
Field Testing Procedure
The objective of this study was to evaluate actual charger performance in the field. Testing took place in
a total of 9 industrial facilities located throughout Minnesota and South Dakota that utilized electric lift-
trucks. There were a total of 13 charging stations metered across the 9 facilities; the number of metered
charging stations per site varied from one to three. The participating facilities were recruited with help
from utilities and our subcontractor. Early in the study, we also reached out to local distributors for help
with leads but struggled to get traction.
The intent of field testing was to perform a pre- and post-comparison of energy use between a facility’s
existing chargers and new HF chargers under actual operating conditions. The pre- and post-monitoring
periods were to include all modes of operation: active charging, maintenance power, and no battery
power. Following the pre-monitoring period, HF frequency chargers would be installed, and post-
monitoring would commence under similar conditions. The pre-and post-monitoring period durations
were intended to be a minimum of two weeks each.
AC input power was measured using a three-phase energy logging device such as a Fluke 1730 combined
with current transducer (CT) clamps which could be fitted around the power cables within each charger
assembly. The AC input power to each charger was logged at either 1 minute or 5 minute intervals,
depending on the specific instrumentation used at each site. The parameters recorded by the loggers
included voltage, current, and power factor. Following completion of pre- and post-monitoring at each
site, the data from each logger was exported and opened in Microsoft Excel for analysis.
The field testing protocol also called for measuring the power conversion efficiency of the existing and
new chargers. This would have required simultaneous monitoring of the DC output power from each
charger. However, we struggled to find an instrument with this capability that could be safely installed
with minimal impact. Eventually, we discovered that the Douglas DataTrac, a small battery monitoring
device, could be used for this purpose, albeit with some limitations. A cable assembly, shown in Figure 4,
was rigged around the DataTrac and embedded in one of the two lift-trucks in Site 8. Unfortunately, the
DataTrac could not provide interval data, but by comparing the device’s time-stamped event summary
of amp-hours delivered per charge to the AC log data, it was possible to get a rough estimate of the
power conversion efficiency over each charging cycle.

Field Study of Industrial High Frequency Battery Chargers Franklin Energy Services, LLC 15
Figure 4. Battery Monitoring Device and Embedded Test Assembly
Customer Interviews
Facility managers at Sites 8 and 9 were interviewed to assess operator acceptance of the HF chargers
and to gather information on any productivity and other non-energy benefits from the ability to
opportunity charge using the new HF chargers. Summaries of the interviews at each facility are included
in Appendix A, with the customer names and facility locations removed for privacy.

Field Study of Industrial High Frequency Battery Chargers Franklin Energy Services, LLC 16
Findings and Analysis
Finding good test sites was a major challenge during this study. Many potential sites were rejected for
not meeting minimum conditions, and many of the sites we did select were less than ideal.
The ideal test site would have been a small manufacturer or warehouse with regular lift-truck and
charger usage. It would have had only 1-2 chargers that would each be replaced with new HF chargers
following pre-monitoring. To the extent that the total energy expended by the lift-trucks during the pre-
and post-monitoring was equivalent, an accurate determination of the energy savings from switching to
HF chargers could have been made.
In addition, the ideal test site would have shifted from conventional charging to opportunity charging
with the new HF chargers. This would have allowed us to assess the peak demand and productivity
impacts of opportunity charging compared to conventional charging.
Unfortunately, none of the test sites met all of these criteria. One shortcoming was that we were not
able to disable all existing chargers at each station and replace them all with HF chargers for the post-
monitoring: we generally just had one HF “loaner” charger to work with. This meant that operators
could still use one or more old chargers during the post-monitoring phase, confounding the energy
savings calculations. If the battery charger output could have been monitored directly, then energy
consumption could have been normalized by energy delivered, which would allow for correcting for
differences in charger usages between the pre- and post-periods. However, as we describe under the
Field Testing Procedure, we were not able to find a test instrument with this capability that could be
installed in the charger without voiding the manufacturer’s warranty.
Furthermore, of the two sites interviewed, only Site 9 had a possible need for opportunity charging; Site
8 had relatively light lift-truck usage. Neither site changed its charging behavior to take advantage of
opportunity charging with the HF chargers so we were unable to assess productivity or other non-energy
impacts.
AC Input Power
Table 5, Table 6 and Table 7 summarize the AC power data collected at each site. For two of the sites,
Site 5 and Site 7, we were not able to complete both pre- and post-monitoring. Site 5 had only one lift-
truck that was used sporadically and no charging was performed during pre-monitoring. At Site 7, there
was an expectation that the customer would be installing HF chargers, which would have allowed us to
do post-monitoring, but this did not occur. Pre- and post-monitoring was completed at the remaining
sites. Key metrics were calculated from the logging data including average power factor, peak demand,
estimated kWh per charge, and estimated kWh per day. In the tables, Changes Pre-Post summarizes
changes in key parameters between the pre- and post-periods, with green highlighting significant
increases, and red highlighting significant decreases.

Field Study of Industrial High Frequency Battery Chargers Franklin Energy Services, LLC 17
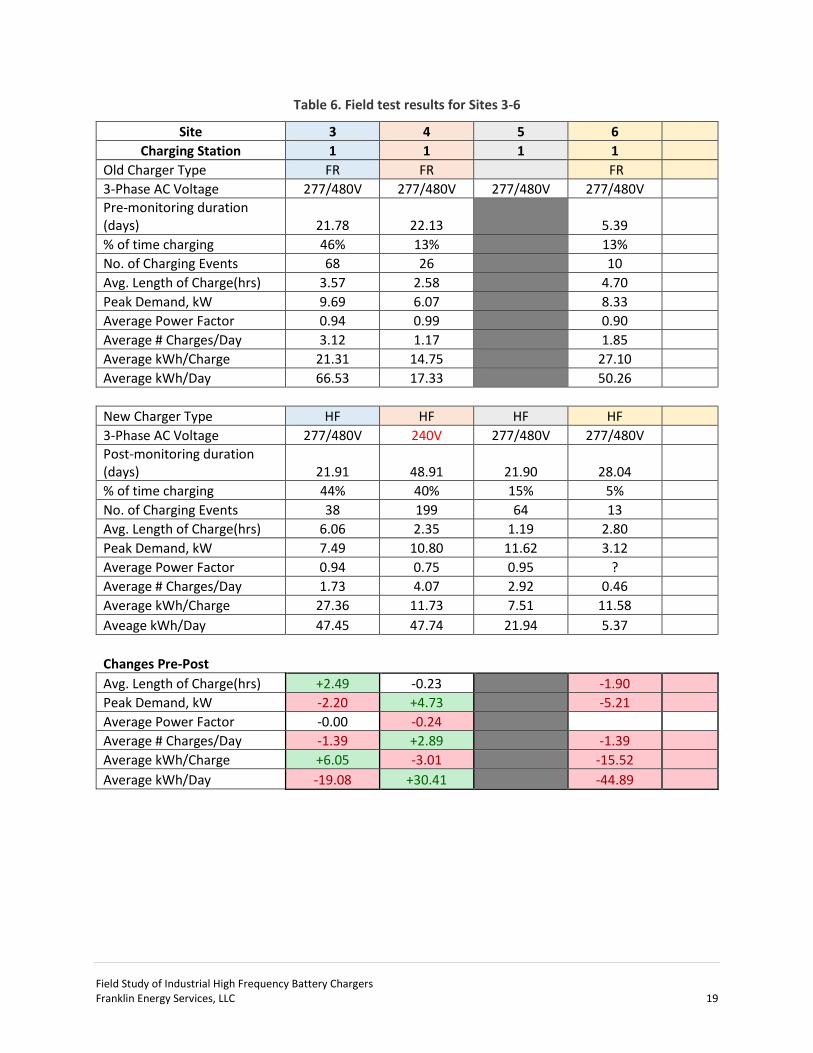
A careful review of the site by site results yields some puzzling observations. First, the average kWh
consumed per charge was not consistently lower with the HF chargers; while significant reductions
occurred at Site 1/Station 1 and Sites 3, 6, 8, and 9, it changed minimally or increased significantly at
other sites. This finding is counter to the expectation that HF chargers have higher conversion
efficiencies than FR or SCR chargers. An increase in the average time per charge cycle could be one
explanation for higher average kWh per charge: a longer average charge cycle may imply that batteries
were in a more depleted state on average at the start of each charge cycle. However, there is no
consistent relationship between changes in the average length of charge and the average kWh per
charge.
Second, our findings did not show a consistent advantage for the HF charger power factors over the
incumbent chargers: at Sites 1, 3, 4, and 6 the existing FR chargers had a high power factor of 0.90 or
greater, and a significant increase in power factor for the HF charger was only seen at Site 9. This is
actually not surprising since the PG&E findings in Table 2 show overlapping ranges for FR and HF power
factor values. However, the very low power factors measured for the HF chargers at Sites 4 and 8 (0.75
and 0.62) are quite surprising as they are significantly lower than minimum HF values in the PG&E
results.
Finally, there was no consistent relationship between change in average charging time and change in
peak demand: if the average charging time decreases, then it might be expected that the peak demand
would increase accordingly because the same energy would be delivered to the battery in less time.
There are at least three possible explanations for this. First, the HF charger may not have had faster
charging capability than the existing charger; in the course of our research, we found several examples
of FR or SCR chargers that are marketed as having fast charging and/or opportunity charging capability.
Second, some HF chargers used in the study were later discovered to have an opportunity charging
mode that was not enabled in all cases, limiting the unit to conventional charging speeds. Finally, there
may have been differences in the average starting charge level of batteries between the pre- and post-
phases; as cited previously, this factor could not be controlled under the testing protocols for this study.

Field Study of Industrial High Frequency Battery Chargers Franklin Energy Services, LLC 18
Table 5. Field results for Sites 1-2.
Site 1 2
Charging Station 1 2 1 2 3
Old Charger Type FR FR FR FR FR
3-Phase AC Voltage 240V 240V 277/480V 277/480V 277/480V
Pre-monitoring duration (days) 31.17 31.17 6.37 6.74 6.85
% of time charging 44% 35% 7% 29% 26%
No. of Charging Events 134 122 4 6 6
Avg. Length of Charge(hrs) 2.43 2.14 2.58 7.69 7.14
Peak Demand, kW 8.95 10.15 4.37 4.51 4.48
Average Power Factor 0.97 0.98 0.84 0.90 0.89
Average # Charges/Day 4.30 3.91 0.63 0.89 0.88
Average kWh/Charge 11.53 11.18 9.93 25.92 26.58
Average kWh/Day 49.56 43.78 6.24 23.08 23.28
New Charger Type HF HF HF HF HF
3-Phase AC Voltage 240V 240V 277/480V 277/480V 277/480V
Post-monitoring duration (days) 17.41 17.41 6.40 6.77 6.99
% of time charging 13% 33% 27% 22% 25%
No. of Charging Events 37 63 7 7 7
Avg. Length of Charge(hrs) 1.43 2.20 5.86 5.06 5.24
Peak Demand, kW 10.80 10.80 7.64 7.65 7.63
Average Power Factor 0.93 0.96 0.90 0.90 0.90
Average # Charges/Day 2.13 3.62 1.09 1.03 1.00
Average kWh/Charge 6.79 12.31 30.54 29.23 30.11
Average kWh/Day 14.44 44.57 33.42 30.23 30.17
Changes Pre-Post Avg. Length of Charge(hrs) -1.00 +0.06 +3.29 -2.63 -1.90
Peak Demand, kW +1.85 +0.65 +3.26 +3.14 +3.15
Average Power Factor -0.03 -0.02 +0.06 -0.00 +0.01
Average # Charges/Day -2.17 -0.30 +0.47 +0.14 +0.13
Average kWh/Charge -4.74 +1.13 +20.61 +3.31 +3.52
Average kWh/Day -35.12 +0.80 +27.19 +7.15 +6.89
Field Study of Industrial High Frequency Battery Chargers Franklin Energy Services, LLC 19
Table 6. Field test results for Sites 3-6
Site 3 4 5 6
Charging Station 1 1 1 1
Old Charger Type FR FR FR
3-Phase AC Voltage 277/480V 277/480V 277/480V 277/480V
Pre-monitoring duration (days) 21.78 22.13 5.39
% of time charging 46% 13% 13%
No. of Charging Events 68 26 10
Avg. Length of Charge(hrs) 3.57 2.58 4.70
Peak Demand, kW 9.69 6.07 8.33
Average Power Factor 0.94 0.99 0.90
Average # Charges/Day 3.12 1.17 1.85
Average kWh/Charge 21.31 14.75 27.10
Average kWh/Day 66.53 17.33 50.26
New Charger Type HF HF HF HF
3-Phase AC Voltage 277/480V 240V 277/480V 277/480V
Post-monitoring duration (days) 21.91 48.91 21.90 28.04
% of time charging 44% 40% 15% 5%
No. of Charging Events 38 199 64 13
Avg. Length of Charge(hrs) 6.06 2.35 1.19 2.80
Peak Demand, kW 7.49 10.80 11.62 3.12
Average Power Factor 0.94 0.75 0.95 ?
Average # Charges/Day 1.73 4.07 2.92 0.46
Average kWh/Charge 27.36 11.73 7.51 11.58
Aveage kWh/Day 47.45 47.74 21.94 5.37
Changes Pre-Post
Avg. Length of Charge(hrs) +2.49 -0.23 -1.90
Peak Demand, kW -2.20 +4.73 -5.21
Average Power Factor -0.00 -0.24
Average # Charges/Day -1.39 +2.89 -1.39
Average kWh/Charge +6.05 -3.01 -15.52
Average kWh/Day -19.08 +30.41 -44.89

Field Study of Industrial High Frequency Battery Chargers Franklin Energy Services, LLC 20
Table 7. Field test results for Sites 7-9
Site 7 8 9
Charging Station 1 2 1 1
Old Charger Type SCR SCR SCR FR
3-Phase AC Voltage 277/480V 277/480V 277/480V 277/480V
Pre-monitoring duration (days) 13.93 13.92 6.94 14.75
% of time charging 91% 33% 7% 20%
No. of Charging Events 10 10 3 9
Avg. Length of Charge(hrs) 1.26 1.86 4.02 8.00
Peak Demand, kW 8.22 1.77 11.76 7.02
Average Power Factor 0.65 0.65 0.85 0.68
Average # Charges/Day 0.72 0.72 0.43 0.61
Average kWh/Charge 6.93 2.21 45.89 48.37
Average kWh/Day 4.97 1.59 29.55 26.22
New Charger Type HF HF
3-Phase AC Voltage 277/480V 277/480V
Post-monitoring duration (days) 28.00 18.11
% of time charging 4% 14%
No. of Charging Events 4 9
Avg. Length of Charge(hrs) 6.10 6.99
Peak Demand, kW 3.46 7.09
Average Power Factor 0.62 0.93
Average # Charges/Day 0.14 0.50
Average kWh/Charge 18.79 32.36
Average kWh/Day 17.65 16.08
Changes Pre-Post
Avg. Length of Charge(hrs) +2.09 -1.01
Peak Demand, kW -8.30 +0.07
Average Power Factor -0.23 +0.24
Average # Charges/Day -0.29 -0.11
Average kWh/Charge -27.10 -16.01
Average kWh/Day -11.90 -10.14
Power Conversion Efficiency
Power conversion efficiency, the ratio of output power delivered to input power consumed, was
measured for the existing SCR charger and new HF charger at Site 8 by combining the AC log data with
the time-stamped event summary from the Douglas DataTrac, which was embedded in one of the lift-
Field Study of Industrial High Frequency Battery Chargers Franklin Energy Services, LLC 21
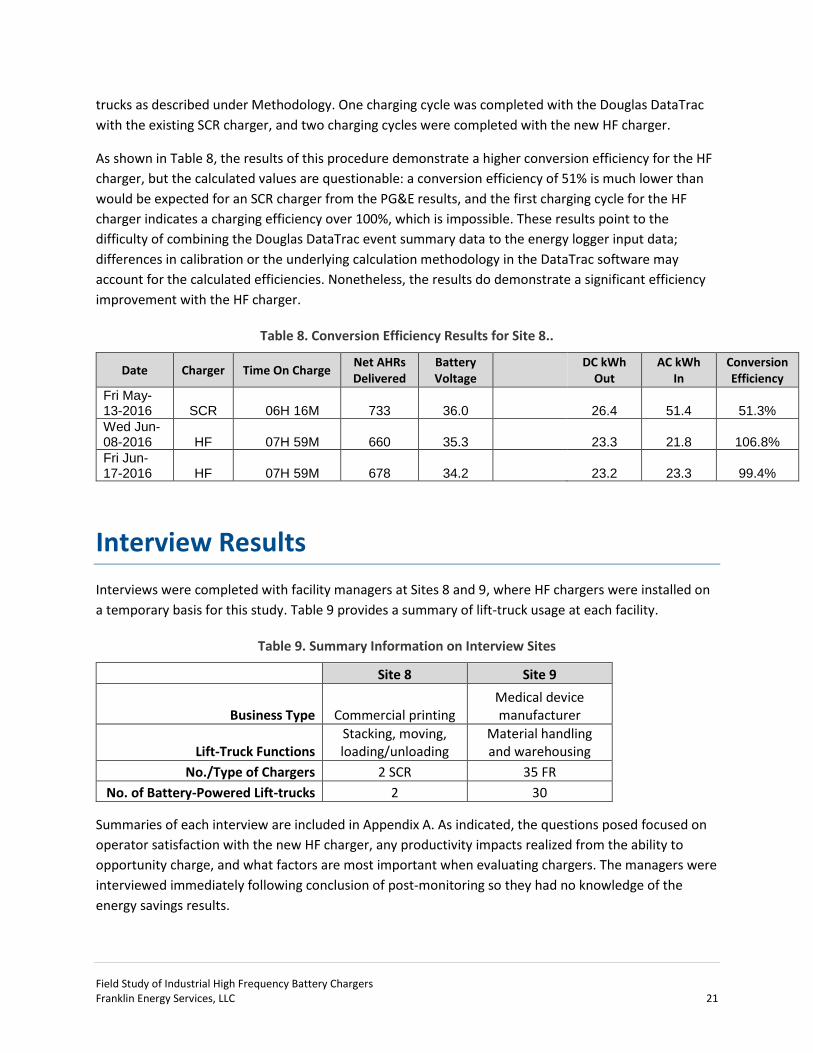
trucks as described under Methodology. One charging cycle was completed with the Douglas DataTrac
with the existing SCR charger, and two charging cycles were completed with the new HF charger.
As shown in Table 8, the results of this procedure demonstrate a higher conversion efficiency for the HF
charger, but the calculated values are questionable: a conversion efficiency of 51% is much lower than
would be expected for an SCR charger from the PG&E results, and the first charging cycle for the HF
charger indicates a charging efficiency over 100%, which is impossible. These results point to the
difficulty of combining the Douglas DataTrac event summary data to the energy logger input data;
differences in calibration or the underlying calculation methodology in the DataTrac software may
account for the calculated efficiencies. Nonetheless, the results do demonstrate a significant efficiency
improvement with the HF charger.
Table 8. Conversion Efficiency Results for Site 8..
Date Charger Time On Charge Net AHRs Delivered
Battery Voltage
DC kWh Out
AC kWh In
Conversion Efficiency
Fri May-13-2016 SCR 06H 16M 733 36.0
26.4 51.4 51.3%
Wed Jun-08-2016 HF 07H 59M 660 35.3
23.3 21.8 106.8%
Fri Jun-17-2016 HF 07H 59M 678 34.2
23.2 23.3 99.4%
Interview Results
Interviews were completed with facility managers at Sites 8 and 9, where HF chargers were installed on
a temporary basis for this study. Table 9 provides a summary of lift-truck usage at each facility.
Table 9. Summary Information on Interview Sites
Site 8 Site 9
Business Type Commercial printing Medical device manufacturer
Lift-Truck Functions Stacking, moving, loading/unloading
Material handling and warehousing
No./Type of Chargers 2 SCR 35 FR
No. of Battery-Powered Lift-trucks 2 30
Summaries of each interview are included in Appendix A. As indicated, the questions posed focused on
operator satisfaction with the new HF charger, any productivity impacts realized from the ability to
opportunity charge, and what factors are most important when evaluating chargers. The managers were
interviewed immediately following conclusion of post-monitoring so they had no knowledge of the
energy savings results.
Field Study of Industrial High Frequency Battery Chargers Franklin Energy Services, LLC 22
Regarding satisfaction with the HF charger, operators were generally indifferent because they simply
continued charging as they normally would with their old chargers. One operator at Site 8 was unhappy
with the HF charger because it was programmed to only charge to 85% instead of 100%; the distributor
had set it up this way prior to installation as it is common to set a maximum charge level of 80% or 85%
for battery protection (for any charger type). No productivity changes were seen at either site with the
HF chargers because no opportunity charging occurred, though managers were made aware of our
desire to study this approach. Apprehension over potential battery damage and a general reluctance to
change their charging habits and risk impacting production appear to have been possible reasons.
Regarding what factors are most important for considering new chargers, both respondents indicated
that reliability was their chief concern. Site 9 indicated that better battery life and energy savings were
also important, but expressed concern regarding the serviceability of HF chargers by their in-house
technicians, who were not familiar with the technology. This respondent also expressed interest in
higher charging speed as a consideration given they are a 24/7 operation, but indicated that they
needed to investigate HF products more closely to ensure charging speeds would be high enough to
meet demand if they switched to opportunity charging.

Field Study of Industrial High Frequency Battery Chargers Franklin Energy Services, LLC 23
Conclusions and Recommendations
Considering the conflicting results seen across the test sites and the testing limitations described
previously, it is difficult to draw any conclusions on the actual performance of HF chargers in the field
from this study alone. The Site 8 combined test results do indicate a higher conversion efficiency for the
HF charger over the existing SCR charger. It is also difficult to draw any conclusions on what impact HF
chargers might have on peak demand in the field. Moreover, the premise that HF chargers alone enable
opportunity charging, which could potentially increase peak demand, may be flawed, given that there
appear to be FR and SCR chargers available that provide this capability as well.
Power factor is one parameter where our results are more robust. We found that there was no clear
advantage for the HF chargers over the conventional chargers in this area. We also found a wide range
of variation in this parameter. Facilities with heavy lift-truck usage should evaluate proposed equipment
to ensure that their power factor requirements will be met, rather than making an assumption based on
HF technology or sales literature.
Given the uncertainty in our results and the existing body of research showing high energy savings
potential for HF chargers, we would not recommend utilities discontinue rebates for HF units as a
replacement for FR or SCR chargers. However, technology type alone should not be used as the basis for
rebate eligibility.
Rebates for high efficiency chargers may best be handled on a custom basis given the many variables
that affect energy consumption, from energy efficiency metrics such as power conversion efficiency to
operational factors such as average charge cycles per day. The performance of both the old and new
chargers should be carefully modeled to ensure that cost-effective savings will be produced before any
rebate is approved.
Prescriptive rebates for high efficiency chargers and/or Technical Reference Manual (TRM) inclusion
could be considered as long as special attention is given to rebate eligibility requirements, both for the
proposed equipment as well as the operating conditions. Technology-neutral minimum requirements for
charger performance should be set including power conversion efficiency, charge return factor, and
power factor to ensure that cost-effective savings are produced. These parameters should be rated
using the test procedures established by the State of California.
Field Study of Industrial High Frequency Battery Chargers Franklin Energy Services, LLC 24
References
“Industrial 3-Phase High Frequency Battery Charger”, Consumers Energy Business Solutions, Issued April
28, 2012, Revision 1.
Ford Chicago Assembly Fast Charging Project: Final Report, EPRI, Palo Alto, CA: 2002. 1007258.
Mercedes-Benz U.S. International: Fast Charging Demonstration Project, EPRI, Palo Alto, CA, Alabama
Power, Birmingham, AL, Bellenger Consulting, Mt. Olive, AL, EPRIsolutions, Palo Alto, CA: 2003. 1002248.
GM-Spring Hill Manufacturing Operations General Assembly Plant: A Fast Charging Demonstration, EPRI,
Palo Alto, CA, and Tennessee Valley Authority, Chattanooga, TN: 2004.
“Measuring Energy Efficiency Improvements in Industrial Battery Chargers”, Ryan Matley. Proceedings of
the Thirty-First Industrial Energy Technology Conference, May 2009.
Pacific Gas and Electric Company (PG&E) Energy Technologies Program Application Assessment Report
#0808: Industrial Battery Charger Energy Savings Opportunities, Ecos Consulting. PG&E, San Francisco,
CA: 2009.
“Infinity High Frequency Chargers”, Stanbury Electrical Engineering. Microsoft PowerPoint presentation,
2013.

Appendix A: Interview Summaries
Field Study of Industrial High Frequency Battery Chargers Franklin Energy Services, LLC 25
Appendix A. Interview Summaries
Site 8.
1. Please describe how forklifts are currently used in your business operations.
Stacking, bins, bales, loading unloading trucks. Lifting cages.
2. How convenient was the new charger to use?
☐Extremely convenient
☐Very convenient
☒Moderately convenient
☐Slightly convenient
☐Not at all convenient
3. Please describe how the charger is more (or less) convenient.
No difference.
4. What do you see as the primary benefits of your HF charger?
None- we do not do opportunity charging. We like to let it run down and then charge. We
wonder whether it is good for the battery to do opportunity charging.
5. Are there any drawbacks of the HF charger versus your SCR chargers?
We didn’t see any, except that one operator didn’t like how it only charged to 85%.
6. How does the new charger’s speed compare to your previous charger’s speed for charging
applications?
We didn’t notice any difference because we charge overnight.
7. How have forklift operators changed their charging habits, if it all, with the new HF charger?
They didn’t change their habits.
8. Has the HF charger produced a net impact on productivity?
☐Much higher productivity
☐Somewhat higher
☒No change
☐Somewhat lower
☐Much lower productivity
Appendix A: Interview Summaries
Field Study of Industrial High Frequency Battery Chargers Franklin Energy Services, LLC 26
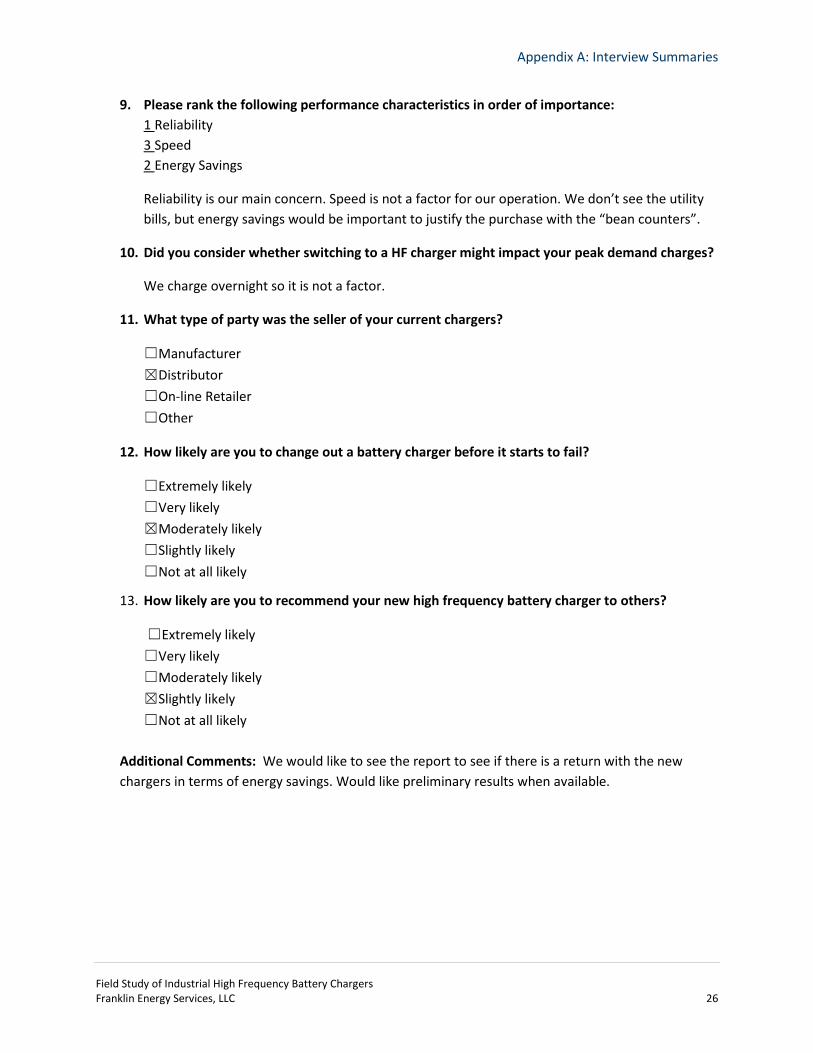
9. Please rank the following performance characteristics in order of importance:
1 Reliability
3 Speed
2 Energy Savings
Reliability is our main concern. Speed is not a factor for our operation. We don’t see the utility
bills, but energy savings would be important to justify the purchase with the “bean counters”.
10. Did you consider whether switching to a HF charger might impact your peak demand charges?
We charge overnight so it is not a factor.
11. What type of party was the seller of your current chargers?
☐Manufacturer
☒Distributor
☐On-line Retailer
☐Other
12. How likely are you to change out a battery charger before it starts to fail?
☐Extremely likely
☐Very likely
☒Moderately likely
☐Slightly likely
☐Not at all likely
13. How likely are you to recommend your new high frequency battery charger to others?
☐Extremely likely
☐Very likely
☐Moderately likely
☒Slightly likely
☐Not at all likely
Additional Comments: We would like to see the report to see if there is a return with the new
chargers in terms of energy savings. Would like preliminary results when available.

Appendix A: Interview Summaries
Field Study of Industrial High Frequency Battery Chargers Franklin Energy Services, LLC 27
Site 9.
1. Please describe how forklifts are currently used in your business operations.
Handling and transportation of semi-finished and finished materials between manufacturing
lines and warehouse.
2. How convenient was the new charger to use?
☐Extremely convenient
☒Very convenient
☐Moderately convenient
☐Slightly convenient
☐Not at all convenient
3. Please describe how the charger is more (or less) convenient.
It was no more or less convenient than our existing Ferro chargers. Employees plugged in
batteries and walked away.
4. What do you see as the primary benefits of your HF charger?
Possibly better battery life and energy savings.
5. Are there any drawbacks of your HF charger versus your Ferro or SCR chargers?
Possibly serviceability by our in house technician. Technology would be new for us. Actual
product life unknown. The existing Ferro chargers are tried and tested.
6. How does the new charger’s speed compare to your previous charger’s speed for charging
applications?
☐Much faster
☐Faster
☒About the same
☐Slower
☐Much slower
7. How have forklift operators changed their charging habits, if at all, with the new HF charger?
No noticeable change during trial.

Appendix A: Interview Summaries
Field Study of Industrial High Frequency Battery Chargers Franklin Energy Services, LLC 28
8. Has the HF charger affected forklift driving habits, and if so, how?
No noticeable change during trial.
9. Has the HF charger produced a net impact on productivity? Please select from the following
options:
☐Much higher productivity
☐Somewhat higher productivity
☐No change
☐Somewhat lower
☐Much lower productivity
10. Please rank the following performance characteristics in order of importance, with 1 being
most important:
___ Reliability
___ Speed
___ Energy Savings
11. Have you considered whether switching to a HF charger might impact your peak demand
charges? Please explain. Yes – but we’re a 24/7 operation. There is some concern that not
charging during the day will create a shortage on fully charged batteries. We need to study the
possible benefits more.
12. What type of part was your seller?
☐Manufacturer
☒Distributor
☐On-line Retailer
☐Other ___________________________________________
13. How likely are you to change out a battery charger before it starts to fail?
☐Extremely likely
☐Very likely
☐Moderately likely
☒Slightly likely
☐Not at all likely
14. Overall, how satisfied are you with the new charger?
☐Extremely satisfied
☐Moderately satisfied
☒Neither satisfied nor dissatisfied

Appendix A: Interview Summaries
Field Study of Industrial High Frequency Battery Chargers Franklin Energy Services, LLC 29
☐Moderately dissatisfied
☐Extremely dissatisfied
15. How likely are you to recommend your new high frequency battery charger to people you
know?
☐Extremely likely
☐Very likely
☐Moderately likely
☒Slightly likely
☐Not at all likely
Additional comments: When reviewing the above information, please keep in mind we had the HF
charger for only 2 to 3 weeks so our data and experience with the unit is limited. As such, I
intentionally did not answer question #9 and #10. At the time of this writing, final performance data
had not yet been reviewed.