ferrochrome market overview 2017 - meraferesources.co.za · outlook on global fecr supply source:...
TRANSCRIPT

Ferrochrome Market Overview 2017
Presented by:
Mark BeveridgePrincipal Consultant
CRU Nickel, Chrome, Stainless Steel Group

▪Which factors define the chrome market?
1. Chinese demand and the stainless steel cycle
- Chinese credit creation
- Inventory levels
- Trade
- Real demand
2. Chinese Production costs
3. South African Cr ore supply and price
▪Explaining recent events
▪Outlook global demand and supply
▪Conclusions
Key Themes
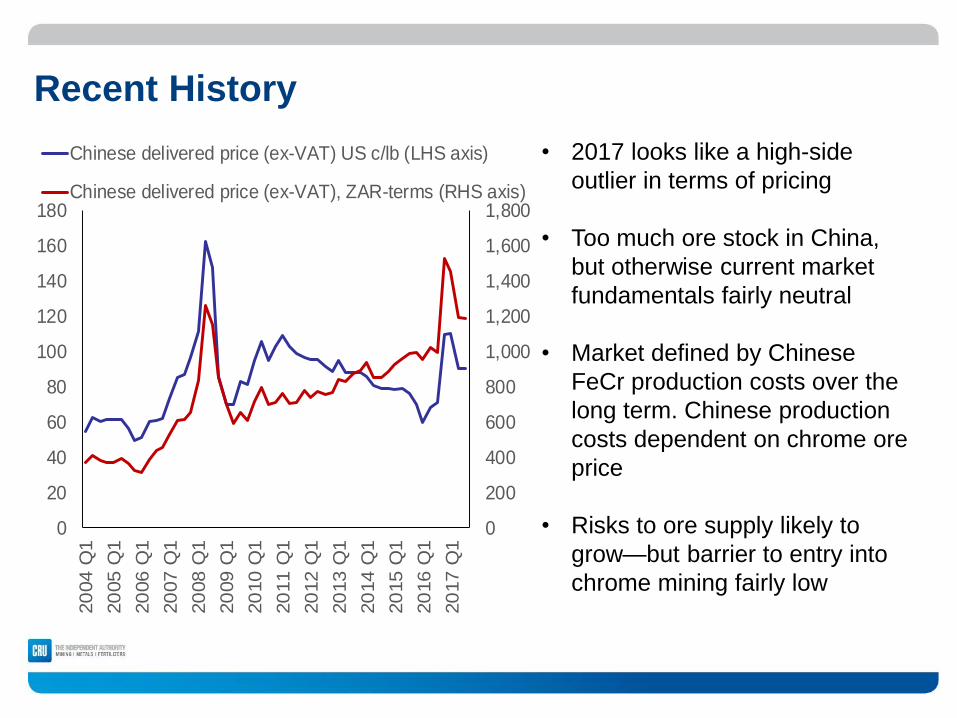
Recent History
• 2017 looks like a high-side
outlier in terms of pricing
• Too much ore stock in China,
but otherwise current market
fundamentals fairly neutral
• Market defined by Chinese
FeCr production costs over the
long term. Chinese production
costs dependent on chrome ore
price
• Risks to ore supply likely to
grow—but barrier to entry into
chrome mining fairly low
0
200
400
600
800
1,000
1,200
1,400
1,600
1,800
0
20
40
60
80
100
120
140
160
180
20
04
Q1
20
05
Q1
20
06
Q1
20
07
Q1
20
08
Q1
20
09
Q1
20
10
Q1
20
11
Q1
20
12
Q1
20
13
Q1
20
14
Q1
20
15
Q1
20
16
Q1
20
17
Q1
Chinese delivered price (ex-VAT) US c/lb (LHS axis)
Chinese delivered price (ex-VAT), ZAR-terms (RHS axis)
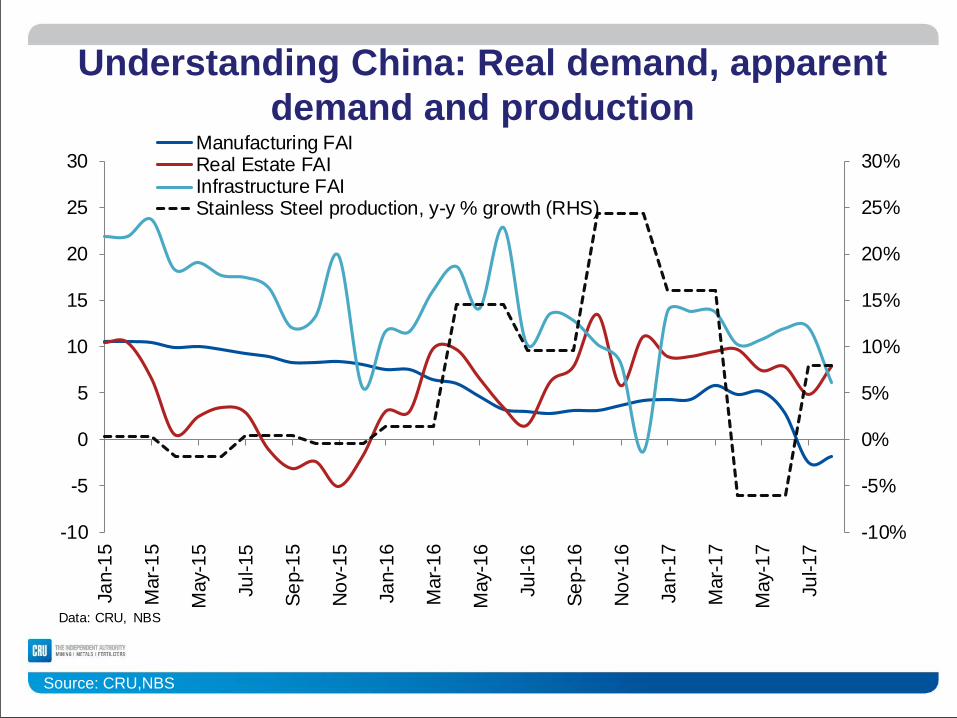
Understanding China: Real demand, apparent
demand and production
Source: CRU,NBS
-10%
-5%
0%
5%
10%
15%
20%
25%
30%
-10
-5
0
5
10
15
20
25
30
Ja
n-1
5
Mar-
15
May-1
5
Ju
l-15
Se
p-1
5
No
v-1
5
Ja
n-1
6
Mar-
16
May-1
6
Ju
l-16
Se
p-1
6
No
v-1
6
Ja
n-1
7
Mar-
17
May-1
7
Ju
l-17
Manufacturing FAIReal Estate FAIInfrastructure FAIStainless Steel production, y-y % growth (RHS)
Data: CRU, NBS

Chinese apparent stainless steel demand and the
credit cycle
Source: CRU
-20
-10
0
10
20
30
40
10
12
14
16
18
20
22
Jan-1
2
Ap
r-1
2
Jul-12
Oct
-12
Jan-1
3
Ap
r-1
3
Jul-13
Oct
-13
Jan-1
4
Ap
r-1
4
Jul-14
Oct
-14
Jan-1
5
Ap
r-1
5
Jul-15
Oct
-15
Jan-1
6
Ap
r-1
6
Jul-16
Oct
-16
Jan-1
7
Ap
r-1
7
Jul-17
Stock of TSF + Local govt bonds (LHS)
Qtrly Crude SS Apparent Consumption (RHS)
Allowing for some lag, there is correlation between credit creation growth and
apparent consumption of stainless steel in China y/y % change

Understanding China: real vs. apparent demand
Source: CRU
0
2
4
6
8
10
12
14
16
20
10
Q1
20
10
Q3
20
11
Q1
20
11
Q3
20
12
Q1
20
12
Q3
20
13
Q1
20
13
Q3
20
14
Q1
20
14
Q3
20
15
Q1
20
15
Q3
20
16
Q1
20
16
Q3
20
17
Q1
20
17
Q3
China’s stainless steel inventory cycle—not yet carrying excessively high stock
Stainless steel stocks, crude steel basis, week's supply in hand
Long-term average stock levels

Understanding China: stainless steel production
and the stocking cycle
Source: CRU
Q-Q volatility in Chinese stainless steel production well reflected in the changing stock levels
-15%
-10%
-5%
0%
5%
10%
15%
20%
25%
30%
0
2
4
6
8
10
12
14
16
2014Q1
2014Q2
2014Q3
2014Q4
2015Q1
2015Q2
2015Q3
2015Q4
2016Q1
2016Q2
2016Q3
2016Q4
2017Q1
2017Q2
2017Q3
China, stainless steel stocks, wks supply on hand (LHS axis)
China, quarterly crude SS apparent consumption, y-y % change (RHS)
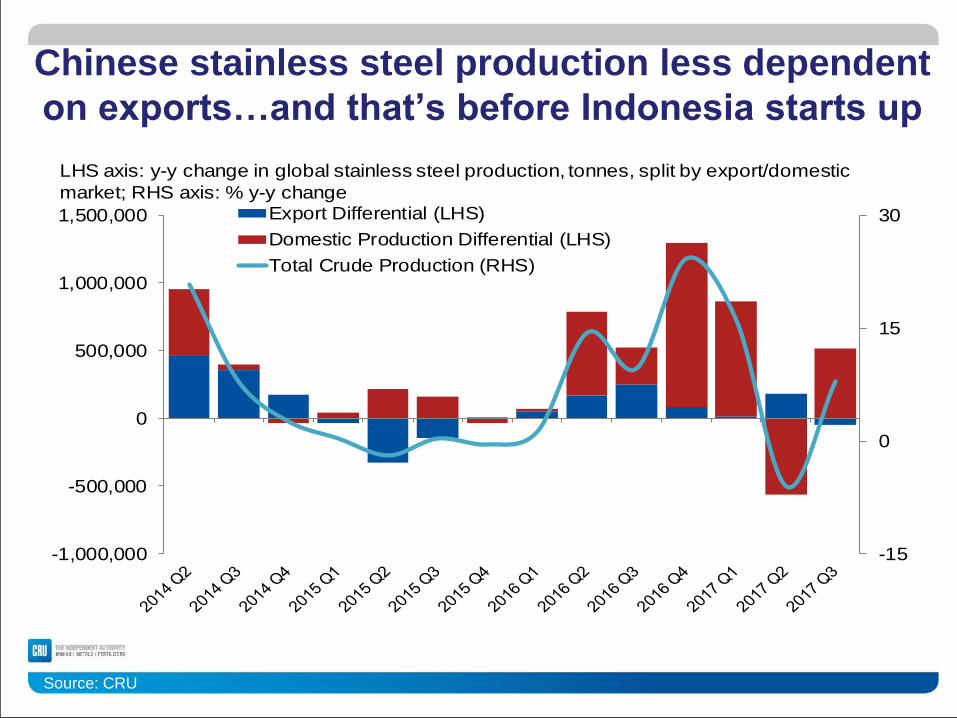
Chinese stainless steel production less dependent
on exports…and that’s before Indonesia starts up
Source: CRU
-15
0
15
30
-1,000,000
-500,000
0
500,000
1,000,000
1,500,000 Export Differential (LHS)
Domestic Production Differential (LHS)
Total Crude Production (RHS)
LHS axis: y-y change in global stainless steel production, tonnes, split by export/domestic
market; RHS axis: % y-y change
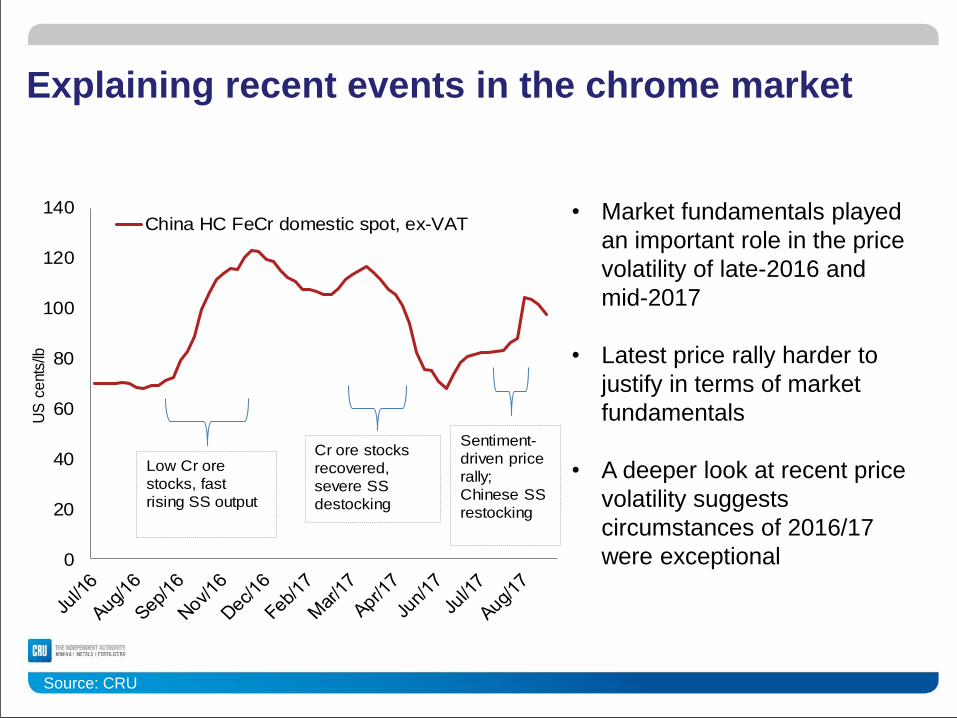
Explaining recent events in the chrome market
Source: CRU
• Market fundamentals played
an important role in the price
volatility of late-2016 and
mid-2017
• Latest price rally harder to
justify in terms of market
fundamentals
• A deeper look at recent price
volatility suggests
circumstances of 2016/17
were exceptional 0
20
40
60
80
100
120
140
US
ce
nts
/lb
China HC FeCr domestic spot, ex-VAT
Cr ore stocks
recovered,
severe SS
destocking
Sentiment-
driven price
rally;
Chinese SS
restocking
Low Cr ore
stocks, fast
rising SS output
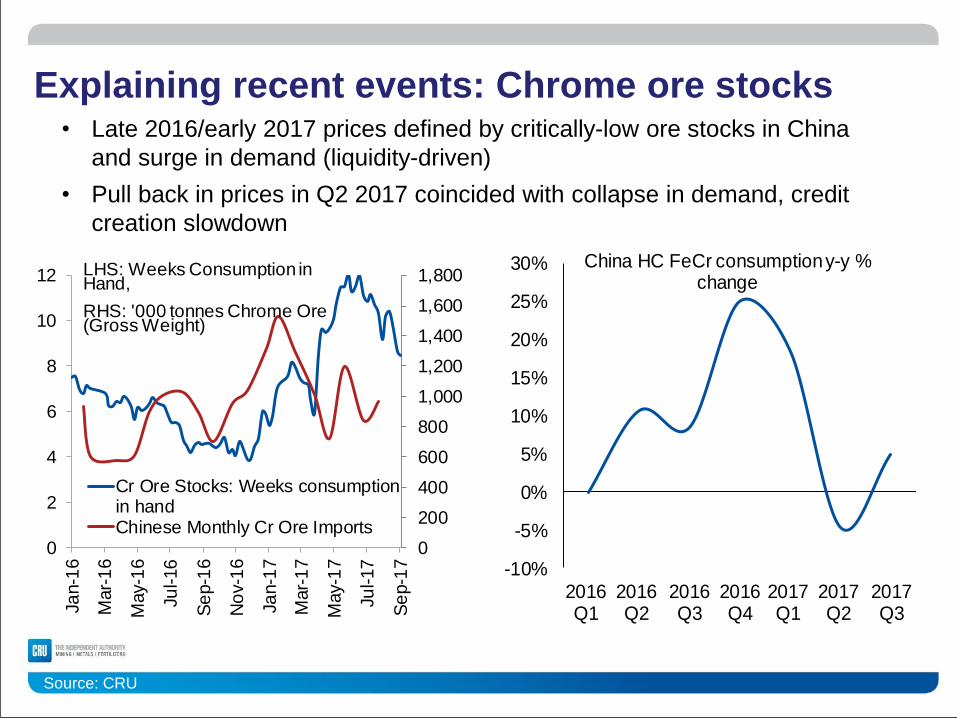
Explaining recent events: Chrome ore stocks
Source: CRU
• Late 2016/early 2017 prices defined by critically-low ore stocks in China
and surge in demand (liquidity-driven)
• Pull back in prices in Q2 2017 coincided with collapse in demand, credit
creation slowdown
0
200
400
600
800
1,000
1,200
1,400
1,600
1,800
0
2
4
6
8
10
12
Jan-1
6
Mar-
16
May-
16
Jul-16
Se
p-1
6
No
v-1
6
Jan-1
7
Mar-
17
May-
17
Jul-17
Se
p-1
7
Cr Ore Stocks: Weeks consumptionin handChinese Monthly Cr Ore Imports
LHS: Weeks Consumption in Hand,
RHS: '000 tonnes Chrome Ore (Gross Weight)
-10%
-5%
0%
5%
10%
15%
20%
25%
30%
2016Q1
2016Q2
2016Q3
2016Q4
2017Q1
2017Q2
2017Q3
China HC FeCr consumption y-y % change

Explaining recent events: Stainless steel stocks
Source: CRU
• China’s stainless steel
inventories also had a role to
play—they grew rapidly in Q4
2016/Q1 2017; then fell in Q2
2017
• CRU doesn’t believe that
stocks are currently close to
problematic levels—even with
large SS output in Q3,
stainless steel stock only
slightly higher than the long-
term average0
2
4
6
8
10
12
14
16
20
10
Q1
20
10
Q3
20
11
Q1
20
11
Q3
20
12
Q1
20
12
Q3
20
13
Q1
20
13
Q3
20
14
Q1
20
14
Q3
20
15
Q1
20
15
Q3
20
16
Q1
20
16
Q3
20
17
Q1
20
17
Q3
Stainless steel stocks, crude steel basis, week's supply
in hand
Long-term average
stock levels
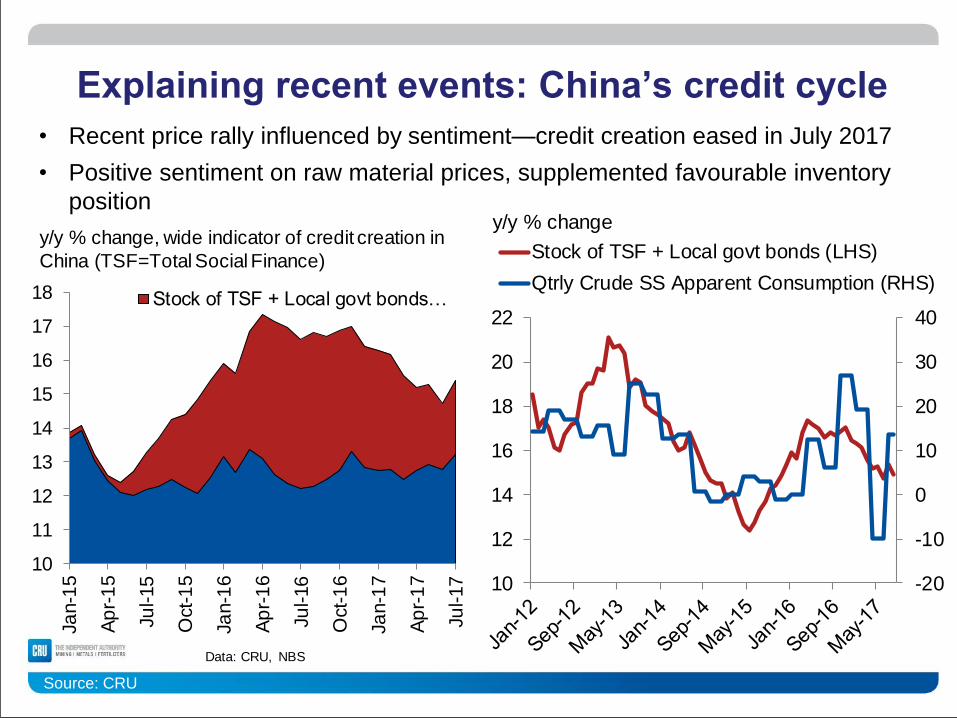
Explaining recent events: China’s credit cycle
Source: CRU
• Recent price rally influenced by sentiment—credit creation eased in July 2017
• Positive sentiment on raw material prices, supplemented favourable inventory
position
10
11
12
13
14
15
16
17
18
Ja
n-1
5
Ap
r-1
5
Ju
l-15
Oct-
15
Ja
n-1
6
Ap
r-1
6
Ju
l-16
Oct-
16
Ja
n-1
7
Ap
r-1
7
Ju
l-17
Stock of TSF + Local govt bonds…
Data: CRU, NBS
y/y % change, wide indicator of credit creation in
China (TSF=Total Social Finance)
-20
-10
0
10
20
30
40
10
12
14
16
18
20
22
Stock of TSF + Local govt bonds (LHS)
Qtrly Crude SS Apparent Consumption (RHS)
y/y % change

Explaining recent events: BM price moves
Source: CRU
EU charge chrome benchmark has stuck to established trend
40
60
80
100
120
140
160
180
Ja
n/1
6
Fe
b/1
6
Ma
r/1
6
Ma
r/1
6
Ap
r/1
6
Ma
y/1
6
Ju
n/1
6
Ju
l/1
6
Au
g/1
6
Se
p/1
6
Oct/
16
No
v/1
6
De
c/1
6
Ja
n/1
7
Fe
b/1
7
Ma
r/1
7
Ma
r/1
7
Ap
r/1
7
Ma
y/1
7
Ju
n/1
7
Ju
l/1
7
Au
g/1
7
Se
p/1
7
Oct/
17
EU BM (gross)
China HC FeCr domestic spot, ex-VAT

Outlook on FeCr demand: China
Source: CRU
• Credit tightening, FAI slowdown contribute to slowing stainless steel demand growth
• Output growth to move in range between 3-5% y-y, 2018-21
4.0
4.5
5.0
5.5
6.0
6.5
7.0
7.5
20
16
Q1
20
16
Q2
20
16
Q3
20
16
Q4
20
17
Q1
20
17
Q2
20
17
Q3
20
17
Q4
20
18
Q1
20
18
Q2
20
18
Q3
20
18
Q4
y-y
% c
hang
e
Chinese IP
0
2
4
6
8
10
12
14
16
18
Y-y
% c
hang
e
Chinese IP
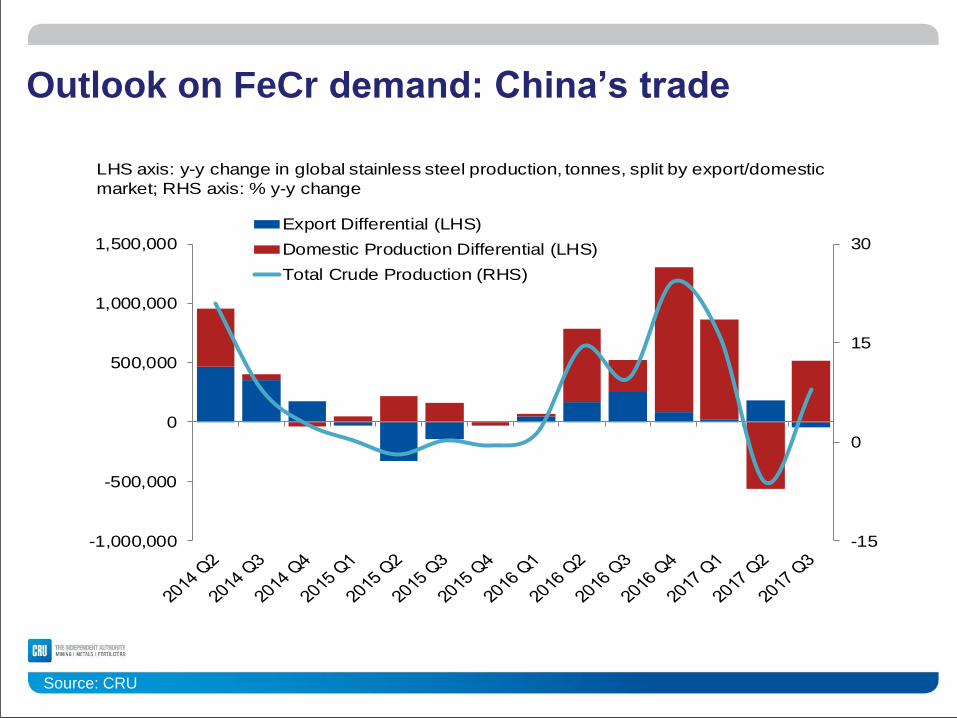
Outlook on FeCr demand: China’s trade
Source: CRU
-15
0
15
30
-1,000,000
-500,000
0
500,000
1,000,000
1,500,000
Export Differential (LHS)
Domestic Production Differential (LHS)
Total Crude Production (RHS)
LHS axis: y-y change in global stainless steel production, tonnes, split by export/domestic
market; RHS axis: % y-y change
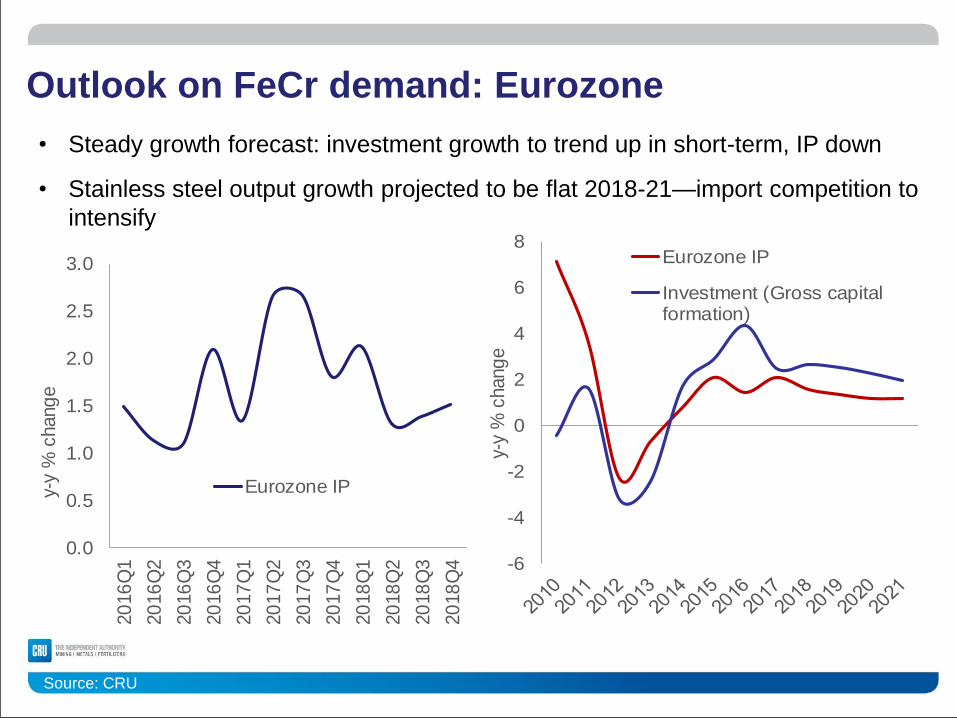
Outlook on FeCr demand: Eurozone
Source: CRU
• Steady growth forecast: investment growth to trend up in short-term, IP down
• Stainless steel output growth projected to be flat 2018-21—import competition to
intensify
0.0
0.5
1.0
1.5
2.0
2.5
3.0
20
16
Q1
20
16
Q2
20
16
Q3
20
16
Q4
20
17
Q1
20
17
Q2
20
17
Q3
20
17
Q4
20
18
Q1
20
18
Q2
20
18
Q3
20
18
Q4
y-y
% c
hang
e
Eurozone IP
-6
-4
-2
0
2
4
6
8
y-y
% c
hang
e
Eurozone IP
Investment (Gross capitalformation)
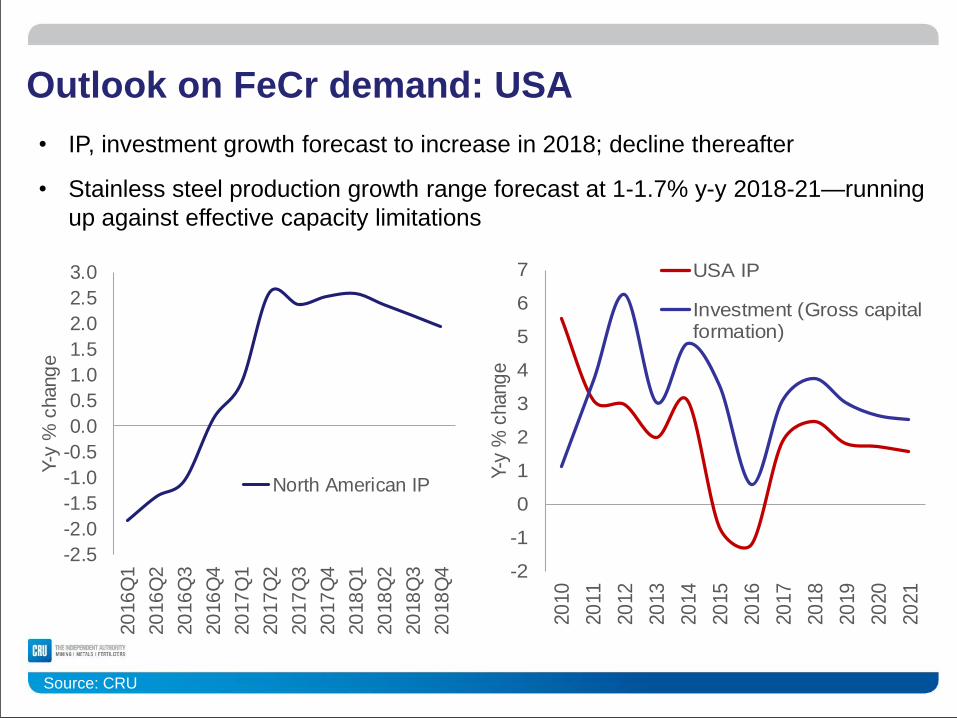
Outlook on FeCr demand: USA
Source: CRU
• IP, investment growth forecast to increase in 2018; decline thereafter
• Stainless steel production growth range forecast at 1-1.7% y-y 2018-21—running
up against effective capacity limitations
-2.5
-2.0
-1.5
-1.0
-0.5
0.0
0.5
1.0
1.5
2.0
2.5
3.0
20
16
Q1
20
16
Q2
20
16
Q3
20
16
Q4
20
17
Q1
20
17
Q2
20
17
Q3
20
17
Q4
20
18
Q1
20
18
Q2
20
18
Q3
20
18
Q4
Y-y
% c
hang
e
North American IP
-2
-1
0
1
2
3
4
5
6
7
20
10
20
11
20
12
20
13
20
14
20
15
20
16
20
17
20
18
20
19
20
20
20
21
Y-y
% c
hang
e
USA IP
Investment (Gross capitalformation)

Outlook on Global HC FeCr demand
Source: CRU
• The combination of Chinese, Indonesian and Indian demand will define HC
FeCr market in coming years
• HC FeCr demand growth forecast to be relatively flat over forecast period
2,000
4,000
6,000
8,000
10,000
12,000
14,000
2010 2012 2014 2016 2018 2020
China India
RoW Indonesia
HC FeCr consumption, '000 tonnes gross weight
-10%
-5%
0%
5%
10%
15%
20%
25%
30%China
India
RoW (ex-Indonesia)
RoW including Indonesia
HC FeCr consumption, y-y % change
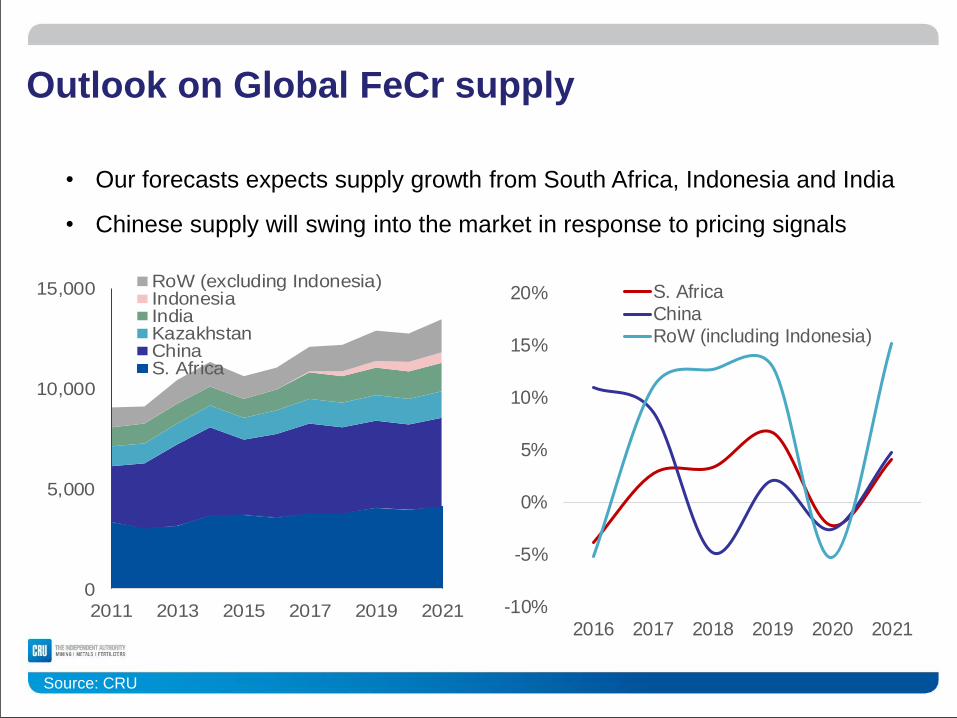
Outlook on Global FeCr supply
Source: CRU
• Our forecasts expects supply growth from South Africa, Indonesia and India
• Chinese supply will swing into the market in response to pricing signals
0
5,000
10,000
15,000
2011 2013 2015 2017 2019 2021
RoW (excluding Indonesia)IndonesiaIndiaKazakhstanChinaS. Africa
-10%
-5%
0%
5%
10%
15%
20%
2016 2017 2018 2019 2020 2021
S. AfricaChinaRoW (including Indonesia)

Global HC FeCr supply/demand balance
Source: CRU
• Global HC FeCr will tend
towards oversupply over
the forecast period
• However, deficits will be
required in order to
prevent excessive stock
accumulation
• Chinese supply will swing
in and out of the market
depending on pricing
signals-500
-400
-300
-200
-100
0
100
200
300
400
500
600
2010 2012 2014 2016 2018 2020
Market balance

Production costs
Source: CRU
• Rising power costs in South Africa (ZAR-terms) will push up
production costs; effect will be offset by depreciating currency
• But South African marginal production costs will not be as important
for global prices as Chinese production costs
12.00
12.50
13.00
13.50
14.00
14.50
15.00
15.50
16.00
-8%-6%-4%-2%0%2%4%6%8%
10%12%14%
2016 2017 2018 2019 2020 2021
ZA power price increase in US$ terms (15%LC y-y increase post-2017)
ZAR nominal ex-rate vs US$ (RHS)
0
10
20
30
40
50
60
70
80
90
100
0 1,000 2,000 3,000 4,000
Thousands
ZA FeCr producers, delivered costs, US c/lb
(ex-VAT), 2021 projection
Data: CRU
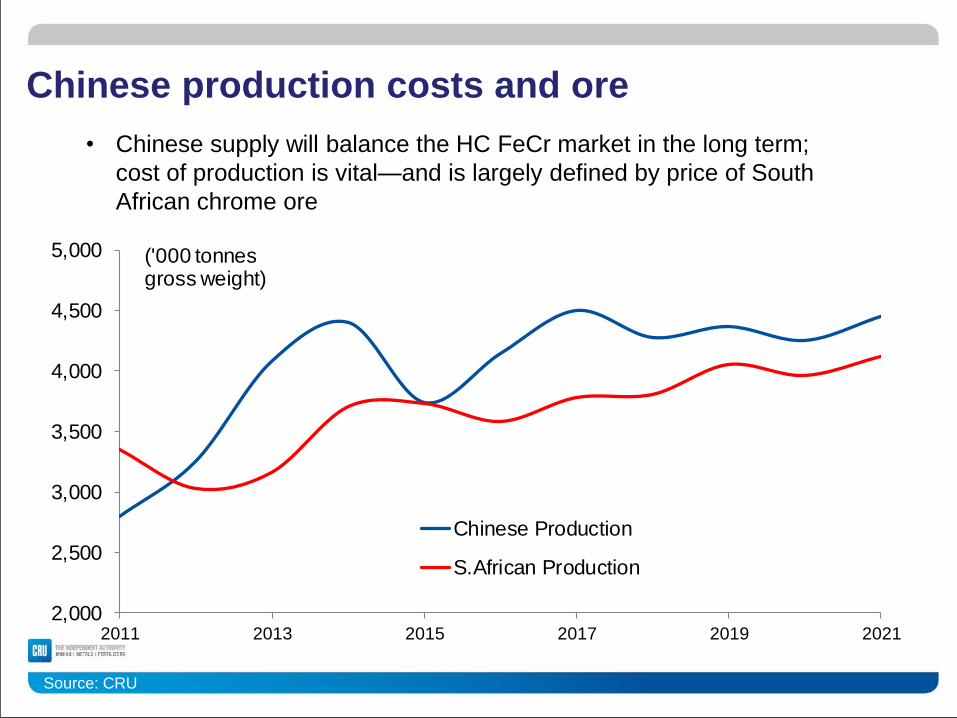
Chinese production costs and ore
Source: CRU
• Chinese supply will balance the HC FeCr market in the long term;
cost of production is vital—and is largely defined by price of South
African chrome ore
2,000
2,500
3,000
3,500
4,000
4,500
5,000
2011 2013 2015 2017 2019 2021
('000 tonnes gross weight)
Chinese Production
S.African Production
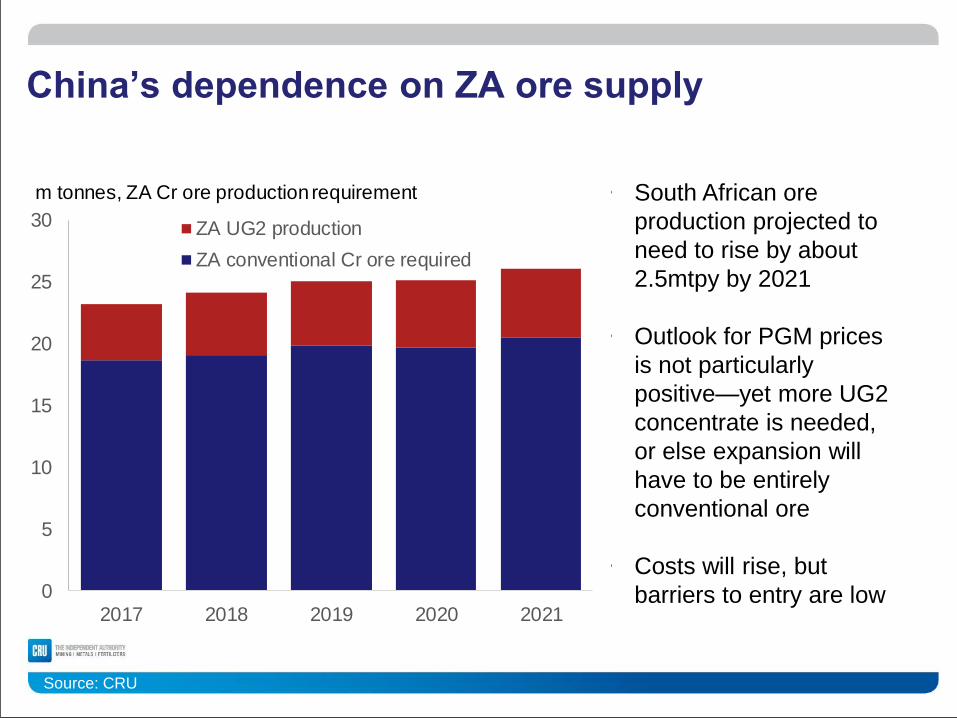
China’s dependence on ZA ore supply
Source: CRU
• South African ore
production projected to
need to rise by about
2.5mtpy by 2021
• Outlook for PGM prices
is not particularly
positive—yet more UG2
concentrate is needed,
or else expansion will
have to be entirely
conventional ore
• Costs will rise, but
barriers to entry are low 0
5
10
15
20
25
30
2017 2018 2019 2020 2021
ZA UG2 production
ZA conventional Cr ore required
m tonnes, ZA Cr ore production requirement
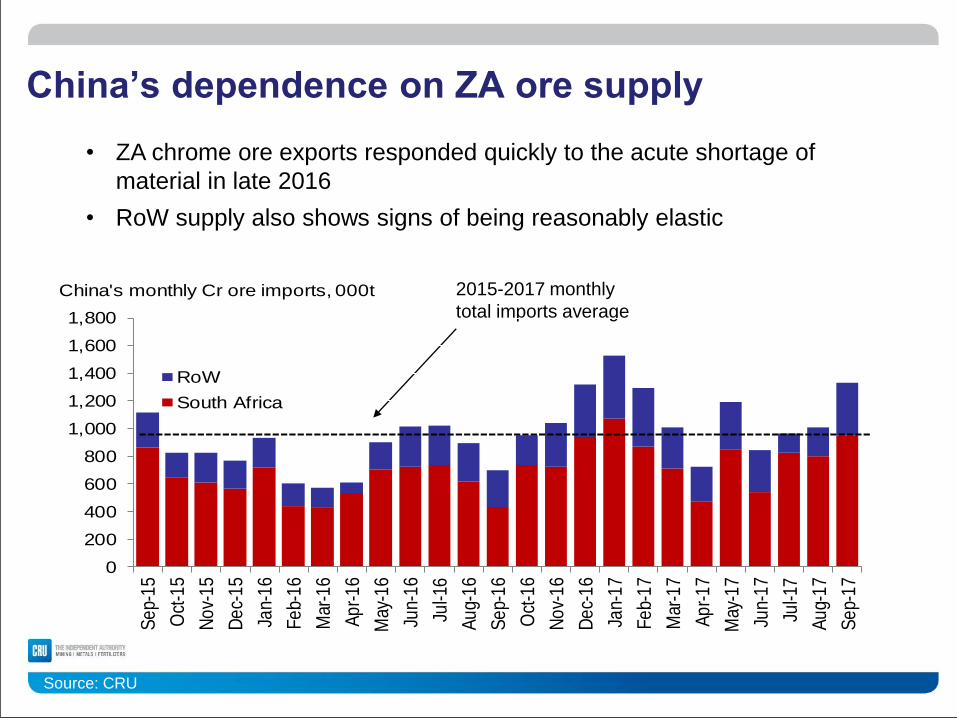
China’s dependence on ZA ore supply
Source: CRU
• ZA chrome ore exports responded quickly to the acute shortage of
material in late 2016
• RoW supply also shows signs of being reasonably elastic
2015-2017 monthly
total imports average
0
200
400
600
800
1,000
1,200
1,400
1,600
1,800
Se
p-1
5
Oct
-15
No
v-1
5
De
c-1
5
Jan-
16
Fe
b-1
6
Mar
-16
Ap
r-1
6
May
-16
Jun-
16
Jul-1
6
Au
g-1
6
Se
p-1
6
Oct
-16
No
v-1
6
De
c-1
6
Jan-
17
Fe
b-1
7
Mar
-17
Ap
r-1
7
May
-17
Jun-
17
Jul-1
7
Au
g-1
7
Se
p-1
7
RoW
South Africa
China's monthly Cr ore imports, 000t
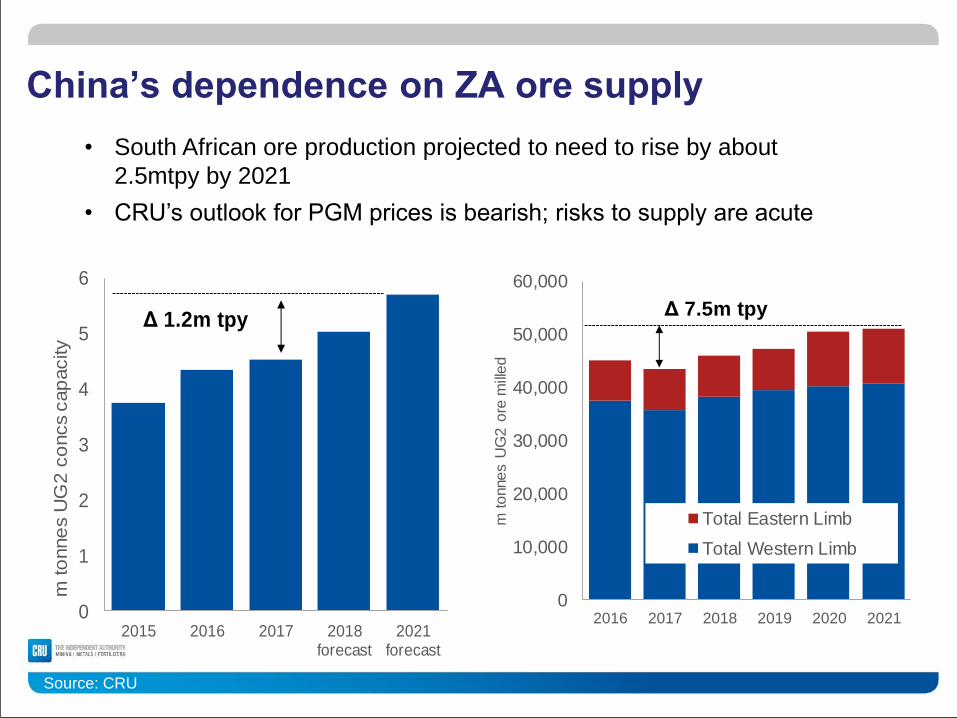
China’s dependence on ZA ore supply
Source: CRU
• South African ore production projected to need to rise by about
2.5mtpy by 2021
• CRU’s outlook for PGM prices is bearish; risks to supply are acute
0
1
2
3
4
5
6
2015 2016 2017 2018forecast
2021forecast
m to
nne
s U
G2
co
ncs c
ap
acity
Δ 1.2m tpy
0
10,000
20,000
30,000
40,000
50,000
60,000
2016 2017 2018 2019 2020 2021
m t
onne
s U
G2
ore
mill
ed
Total Eastern Limb
Total Western Limb
Δ 7.5m tpy

Conclusions:
26
• Short-term outlook dominated by chrome ore stocks in China
• Chinese stainless steel stock levels not overly worrying at the
moment—but there is the twin threat posed by bullish nickel market and
Indonesian imports
• Long-term trend towards lower global stainless steel production growth,
but it retains late-cycle commodity characteristics
• Chinese stainless steel cycle will determine when domestic Chinese HC
FeCr production is required to swing into the market.
• HC FeCr production cost in China will be key—and that will be
determined by ore availability and price
• South African chrome ore is the key variable in the Chinese production
cost calculation