fema p-58 and the sp3 software for mortgage due-diligence ... · asce 41 (mostly safety -only,...
TRANSCRIPT
1
Curt B. Haselton, PhD, PEProfessor of Civil Engineering @ CSU, Chico
Co-Founder @ Seismic Performance Prediction Program (SP3)
www.hbrisk.com
Resilience-Based Design & Risk Management using FEMA P-58
FEMA P-58 and the SP3 Software for Mortgage Due-Diligence (PML+)
2
© HB Risk Group
Overview of FEMA P-58Overview of SP3 Software Questions and discussion (lots of time for this; can
do both at end and throughout)
Quick Agenda
3
© HB Risk Group
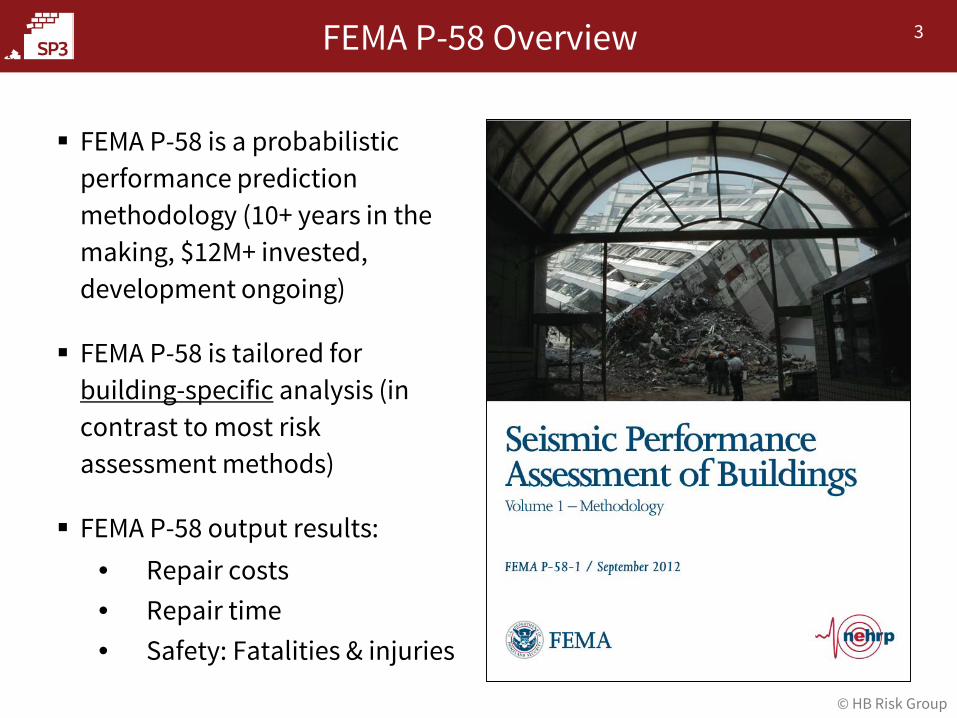
FEMA P-58 is a probabilistic performance prediction methodology (10+ years in the making, $12M+ invested, development ongoing)
FEMA P-58 is tailored for building-specific analysis (in contrast to most risk assessment methods)
FEMA P-58 output results:• Repair costs• Repair time• Safety: Fatalities & injuries
FEMA P-58 Overview

4
© HB Risk Group
FEMA P-58 Overview
Ground Motion Hazard
Component DamageEconomic Loss
Casualties
Repair Time
Structural Response

5
© HB Risk Group
FEMA P-58: Benefits
Comprehensive and credible: $12M, 10 years to develop, team of 100+ really smart researchers and practitioners Transparent and open-source: FEMA P-58 is open to the public. Building-specific: The analysis incorporates the specific
nuances of the building, rather than being based on building class. Standardized and repeatable: Consistent FEMA P-58 damage
and repair cost databases are used consistently for all analyses (created based on 20+ years of research).
6
© HB Risk Group
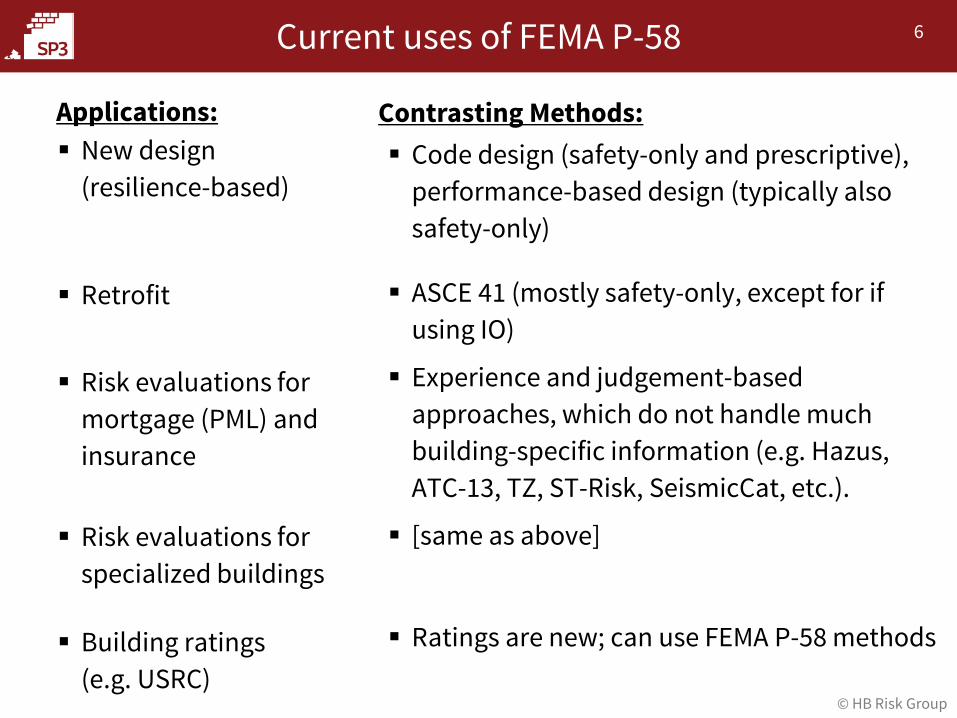
Current uses of FEMA P-58
New design (resilience-based)
Retrofit
Risk evaluations for mortgage (PML) and insurance
Risk evaluations for specialized buildings
Building ratings (e.g. USRC)
Applications: Code design (safety-only and prescriptive),
performance-based design (typically also safety-only)
ASCE 41 (mostly safety-only, except for if using IO)
Experience and judgement-based approaches, which do not handle much building-specific information (e.g. Hazus, ATC-13, TZ, ST-Risk, SeismicCat, etc.).
[same as above]
Ratings are new; can use FEMA P-58 methods
Contrasting Methods:

7
© HB Risk Group
FEMA P-58: More Details Under the Hood
Ground Motion Hazard
Component DamageEconomic Loss
Casualties
Repair Time
Structural Response
8
© HB Risk Group
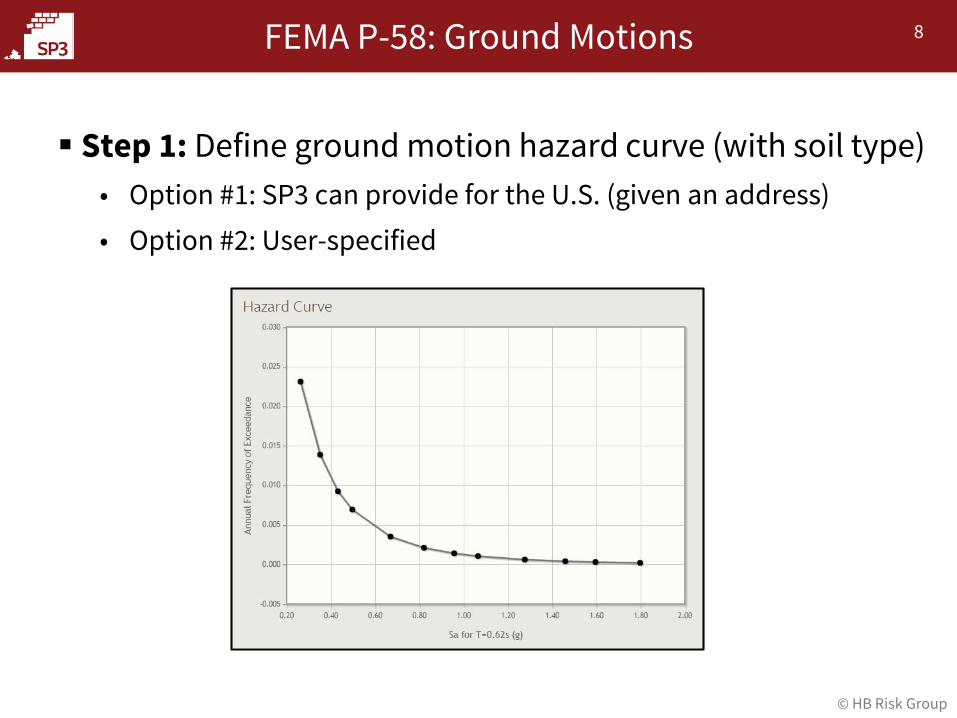
FEMA P-58: Ground Motions
Step 1: Define ground motion hazard curve (with soil type)• Option #1: SP3 can provide for the U.S. (given an address)• Option #2: User-specified
9
© HB Risk Group
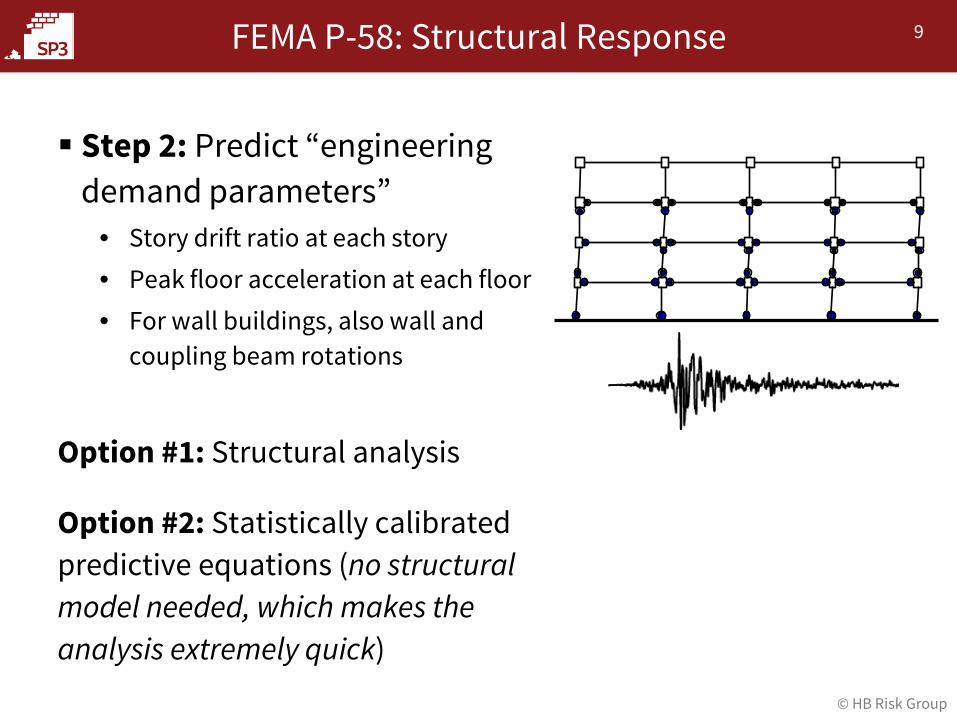
FEMA P-58: Structural Response
Step 2: Predict “engineering demand parameters”
• Story drift ratio at each story• Peak floor acceleration at each floor• For wall buildings, also wall and
coupling beam rotations
Option #1: Structural analysis
Option #2: Statistically calibrated predictive equations (no structural model needed, which makes the analysis extremely quick)
10
© HB Risk Group
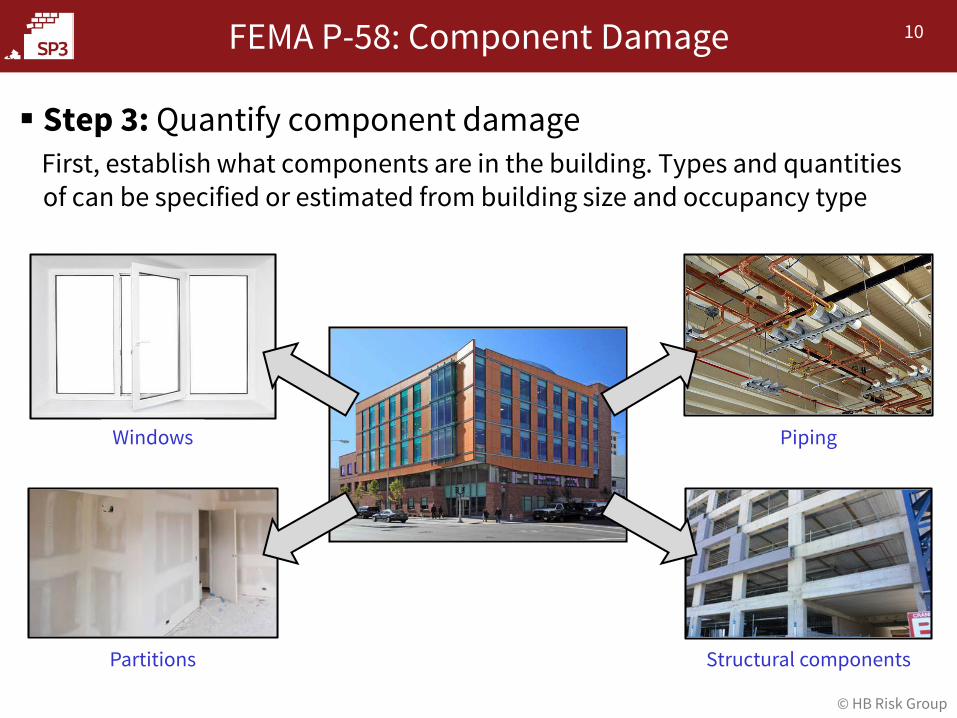
FEMA P-58: Component Damage
Step 3: Quantify component damageFirst, establish what components are in the building. Types and quantities of can be specified or estimated from building size and occupancy type
Windows Piping
Partitions Structural components

11
© HB Risk Group
We end up with a list of component types, quantities and locations
FEMA P-58: Component Damage
Step 3: Quantify component damage

12
© HB Risk Group
Each component type has a “fragility function” that specifies the probability that a structural demand causes damage
FEMA P-58: Component Damage
Step 3: Quantify component damage
13
© HB Risk Group
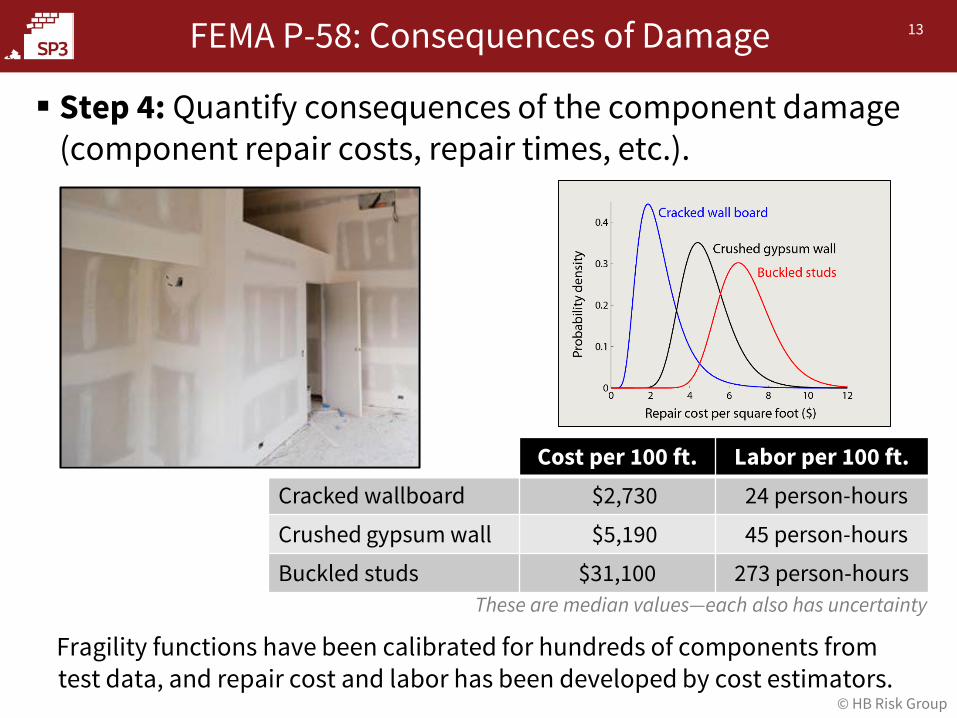
FEMA P-58: Consequences of Damage
Fragility functions have been calibrated for hundreds of components from test data, and repair cost and labor has been developed by cost estimators.
Cost per 100 ft. Labor per 100 ft.Cracked wallboard $2,730 24 person-hours
Crushed gypsum wall $5,190 45 person-hours
Buckled studs $31,100 273 person-hoursThese are median values—each also has uncertainty
Step 4: Quantify consequences of the component damage (component repair costs, repair times, etc.).
14
© HB Risk Group
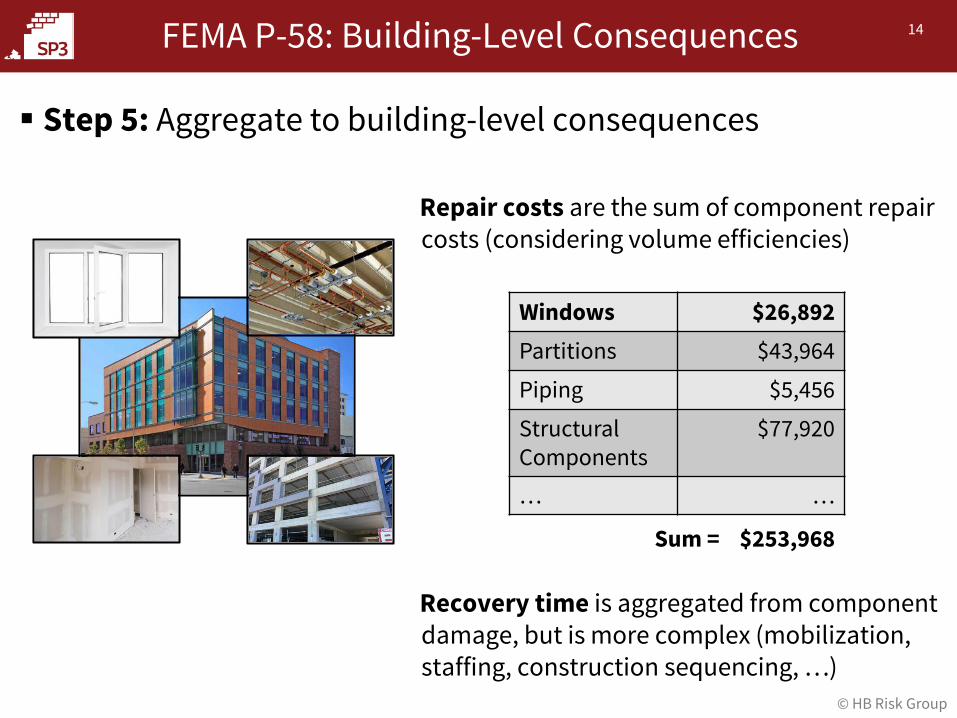
FEMA P-58: Building-Level Consequences
Repair costs are the sum of component repair costs (considering volume efficiencies)
Recovery time is aggregated from component damage, but is more complex (mobilization, staffing, construction sequencing, …)
Windows $26,892Partitions $43,964
Piping $5,456
Structural Components
$77,920
… …
Sum = $253,968
Step 5: Aggregate to building-level consequences
15
© HB Risk Group
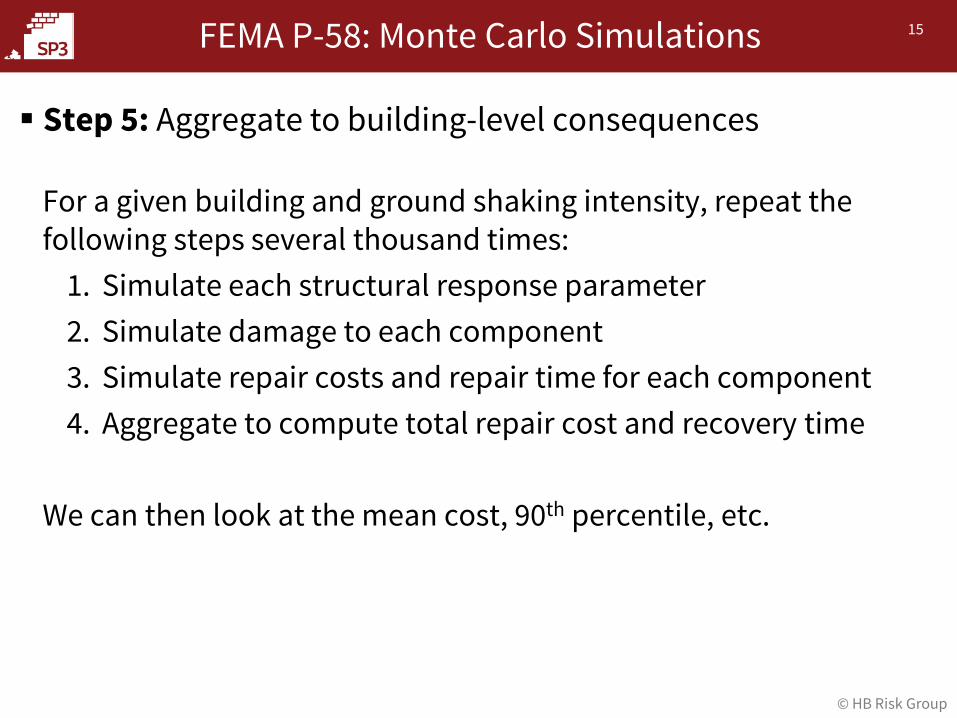
FEMA P-58: Monte Carlo Simulations
For a given building and ground shaking intensity, repeat the following steps several thousand times:
1. Simulate each structural response parameter2. Simulate damage to each component3. Simulate repair costs and repair time for each component4. Aggregate to compute total repair cost and recovery time
We can then look at the mean cost, 90th percentile, etc.
Step 5: Aggregate to building-level consequences
16
© HB Risk Group
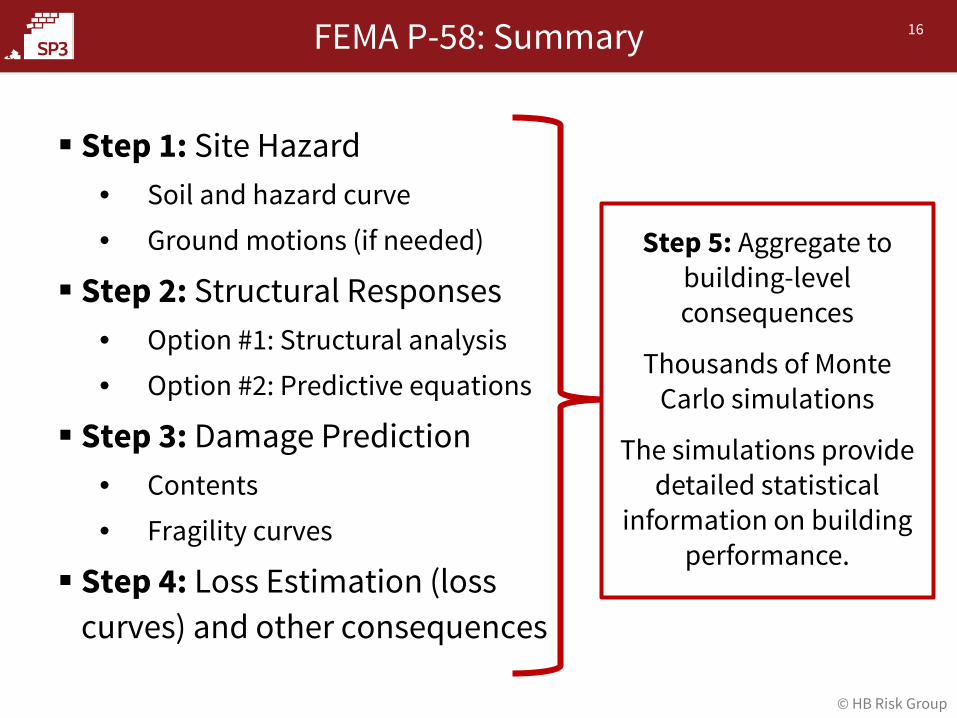
FEMA P-58: Summary
Step 1: Site Hazard• Soil and hazard curve• Ground motions (if needed)
Step 2: Structural Responses• Option #1: Structural analysis• Option #2: Predictive equations
Step 3: Damage Prediction• Contents • Fragility curves
Step 4: Loss Estimation (loss curves) and other consequences
Step 5: Aggregate to building-level consequences
Thousands of Monte Carlo simulations
The simulations provide detailed statistical
information on building performance.
17
© HB Risk Group
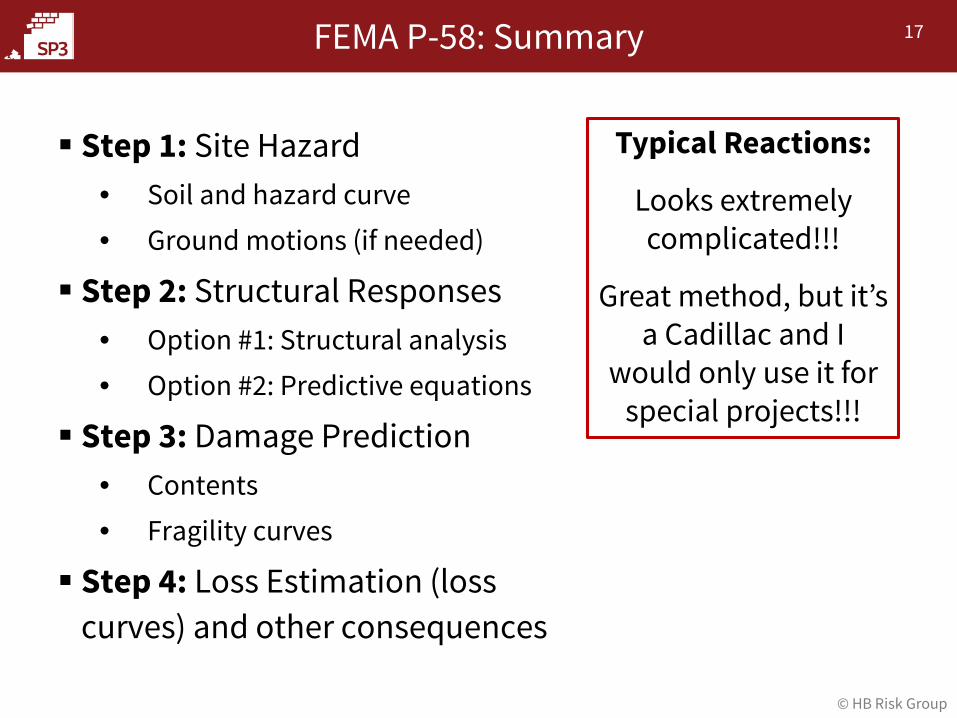
FEMA P-58: Summary
Step 1: Site Hazard• Soil and hazard curve• Ground motions (if needed)
Step 2: Structural Responses• Option #1: Structural analysis• Option #2: Predictive equations
Step 3: Damage Prediction• Contents • Fragility curves
Step 4: Loss Estimation (loss curves) and other consequences
Typical Reactions:
Looks extremely complicated!!!
Great method, but it’s a Cadillac and I
would only use it for special projects!!!

18
© HB Risk Group
The SP3 Software
A barrier to widespread FEMA P-58 adoption has been related to software and ease-of-use. FEMA P-58 is a great methodology but FEMA is expressly not in the
business of maintaining software. Software has been barrier to adoption. Need: To better enable use of FEMA P-58, a commercial-grade software is
needed. In 2014, Jack Baker and Curt Haselton decide to fill the software need by:
a) Creating user-friendly software to implement P-58. [released Dec. 2014] b) Maintaining software over time (fragilities, etc.). [e.g. expansions to
fragility library]c) Improving and extending the methodology in future (will take over reigns
when ATC done). [e.g. enhanced method for structure responses, etc.]
ATC Coordination: We have been in coordination with ATC/FEMA from the start (so all pulling in same direction).
19
© HB Risk Group
The SP3 Software
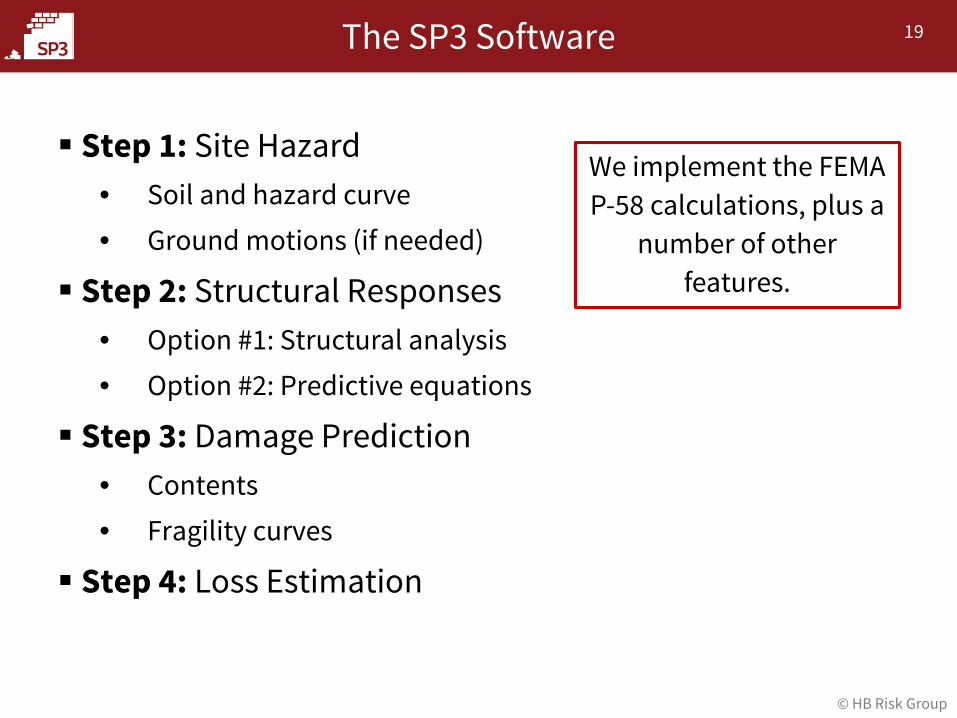
Step 1: Site Hazard• Soil and hazard curve• Ground motions (if needed)
Step 2: Structural Responses• Option #1: Structural analysis• Option #2: Predictive equations
Step 3: Damage Prediction• Contents • Fragility curves
Step 4: Loss Estimation
We implement the FEMA P-58 calculations, plus a
number of other features.

20
© HB Risk Group
The SP3 Software
Step 1: Site Hazard• Soil and hazard curve• Ground motions (if needed)
Step 2: Structural Responses• Option #1: Structural analysis• Option #2: Predictive equations
Step 3: Damage Prediction• Contents • Fragility curves
Step 4: Loss Estimation
USGS Soil and ground motion database
information embedded
Statistically calibrated structural response
methods are embedded
Building contents are auto-populated (using FEMA P-58 and enhanced options)
Structure: Cloud-based computational platform, flexible reporting options
Two-level structure: 1) Use initial pre-populated values2) Modify inputs and dig deeper
21
© HB Risk Group
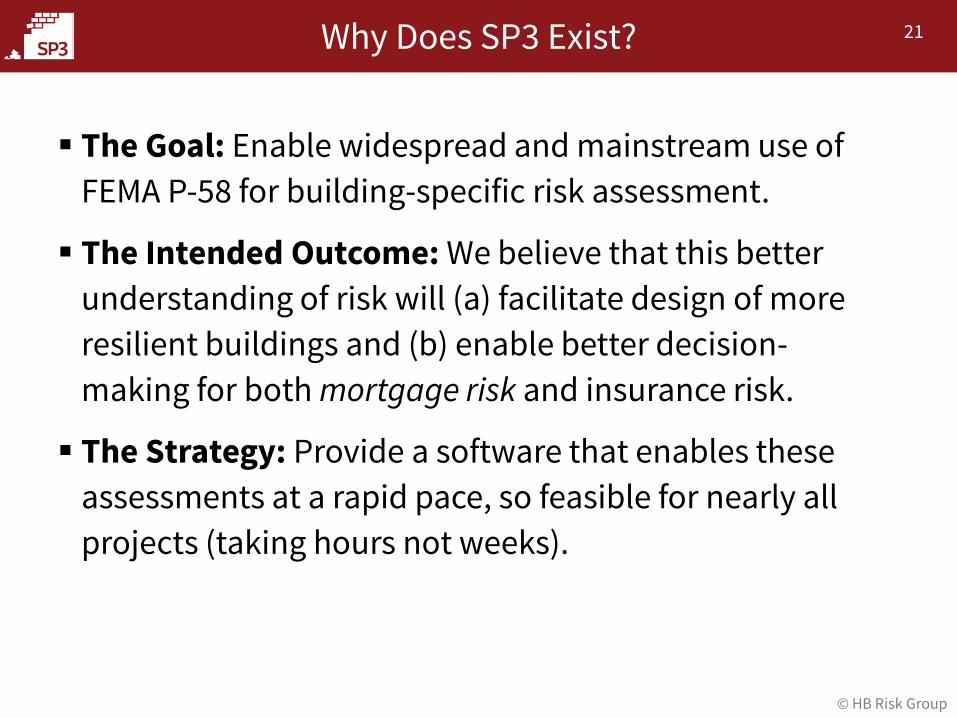
Why Does SP3 Exist?
The Goal: Enable widespread and mainstream use of FEMA P-58 for building-specific risk assessment.
The Intended Outcome: We believe that this better understanding of risk will (a) facilitate design of more resilient buildings and (b) enable better decision-making for both mortgage risk and insurance risk.
The Strategy: Provide a software that enables these assessments at a rapid pace, so feasible for nearly all projects (taking hours not weeks).
22
© HB Risk Group
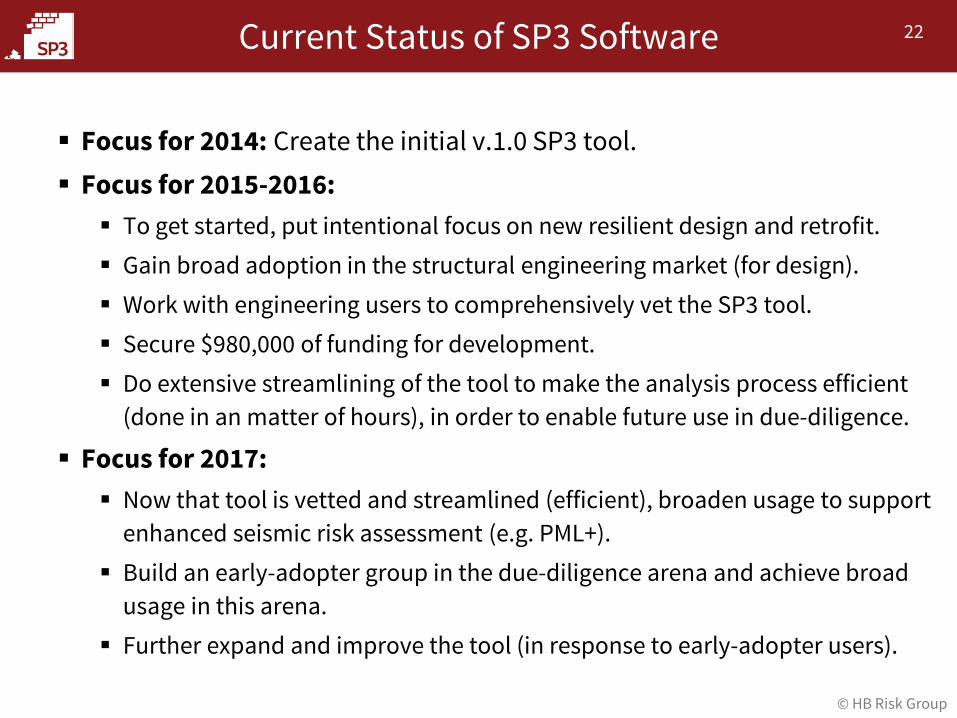
Current Status of SP3 Software
Focus for 2014: Create the initial v.1.0 SP3 tool. Focus for 2015-2016: To get started, put intentional focus on new resilient design and retrofit. Gain broad adoption in the structural engineering market (for design). Work with engineering users to comprehensively vet the SP3 tool. Secure $980,000 of funding for development. Do extensive streamlining of the tool to make the analysis process efficient
(done in an matter of hours), in order to enable future use in due-diligence.
Focus for 2017: Now that tool is vetted and streamlined (efficient), broaden usage to support
enhanced seismic risk assessment (e.g. PML+). Build an early-adopter group in the due-diligence arena and achieve broad
usage in this arena. Further expand and improve the tool (in response to early-adopter users).

23
© HB Risk Group
8%
70%
16%
0% 3% 3% 0% 0%0%
10%
20%
30%
40%
50%
60%
70%
80%
90%
100%
StructuralComponents
Partitions InteriorFinishes
Cladding Plumbing andHVAC
OtherComponents
Collapse Residual Drift
Loss Contributions by Component Type for a 50 Year Ground Motion
Output Examples: Repair Cost
8-story concrete frame in Los Angeles
Loss Ratio = 0.04
24
© HB Risk Group
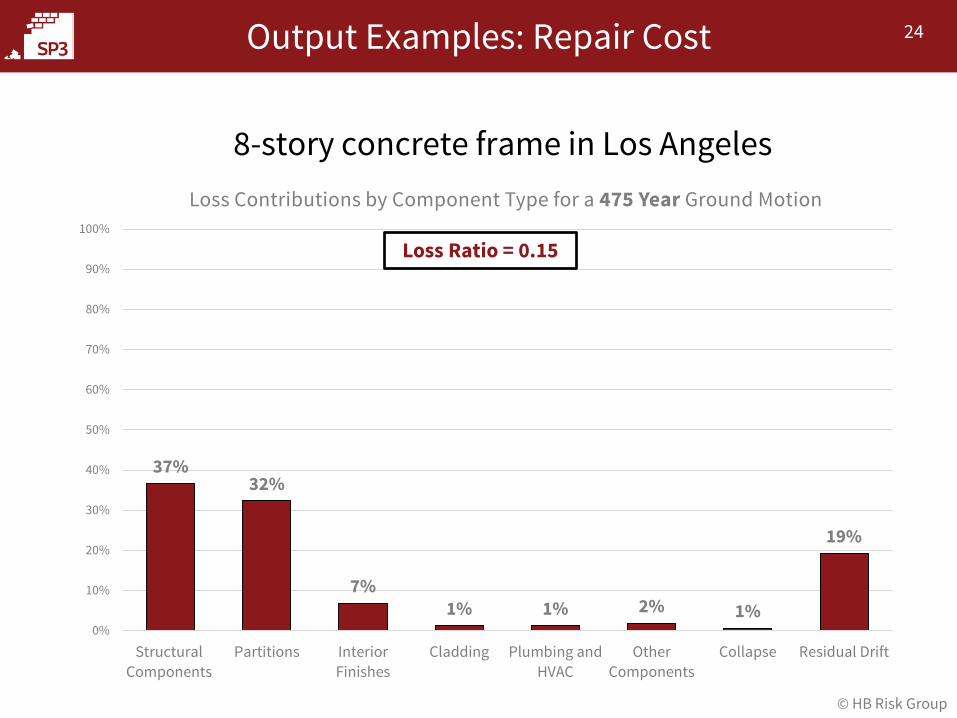
Output Examples: Repair Cost
8-story concrete frame in Los Angeles
37%32%
7%1% 1% 2% 1%
19%
0%
10%
20%
30%
40%
50%
60%
70%
80%
90%
100%
StructuralComponents
Partitions InteriorFinishes
Cladding Plumbing andHVAC
OtherComponents
Collapse Residual Drift
Loss Contributions by Component Type for a 475 Year Ground Motion
Loss Ratio = 0.15
25
© HB Risk Group
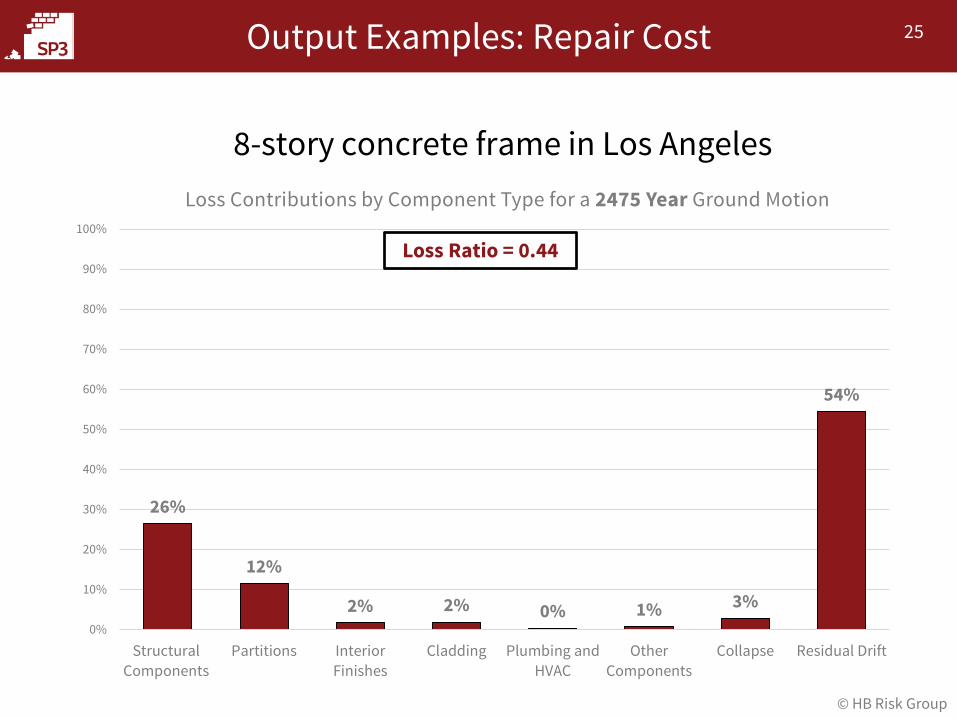
Output Examples: Repair Cost
8-story concrete frame in Los Angeles
26%
12%
2% 2% 0% 1% 3%
54%
0%
10%
20%
30%
40%
50%
60%
70%
80%
90%
100%
StructuralComponents
Partitions InteriorFinishes
Cladding Plumbing andHVAC
OtherComponents
Collapse Residual Drift
Loss Contributions by Component Type for a 2475 Year Ground Motion
Loss Ratio = 0.44
26
© HB Risk Group
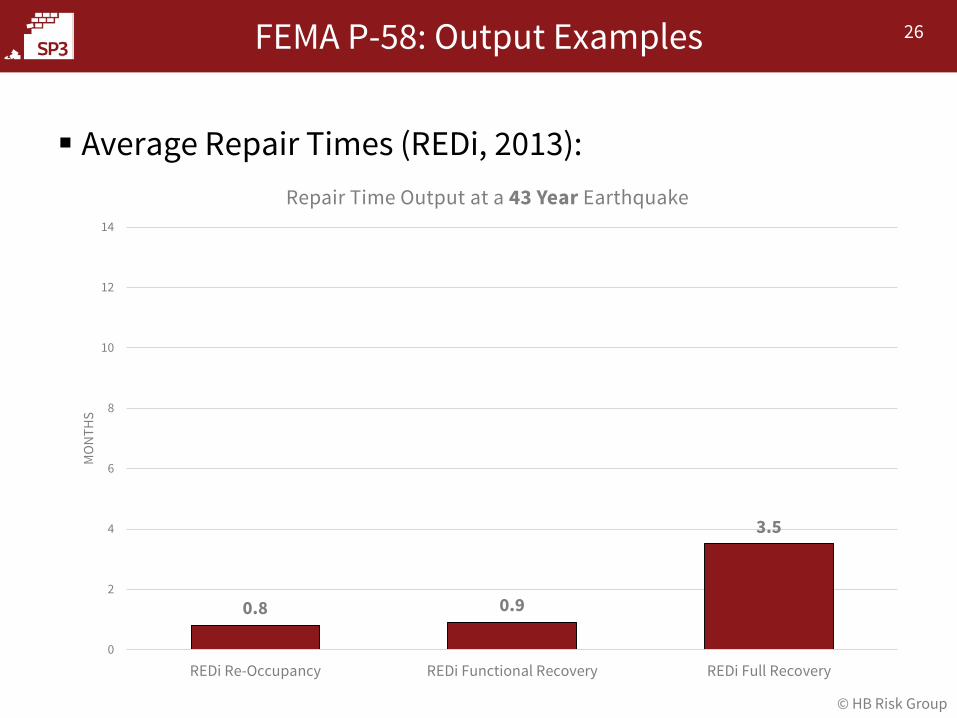
FEMA P-58: Output Examples
Average Repair Times (REDi, 2013):
0.8 0.9
3.5
0
2
4
6
8
10
12
14
REDi Re-Occupancy REDi Functional Recovery REDi Full Recovery
MO
NTH
S
Repair Time Output at a 43 Year Earthquake
27
© HB Risk Group
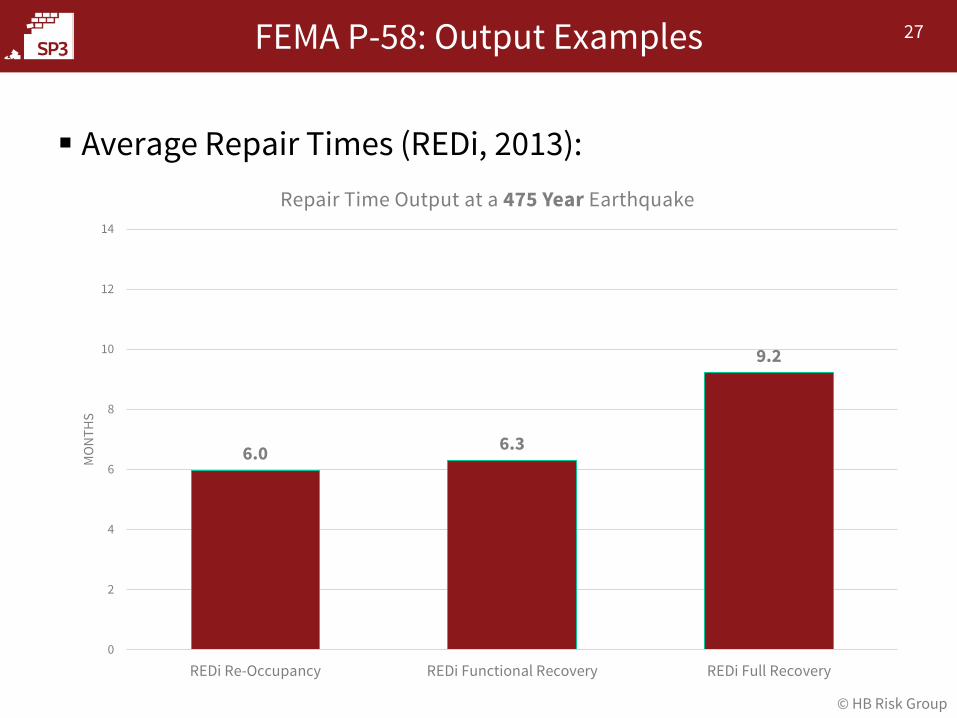
FEMA P-58: Output Examples
Average Repair Times (REDi, 2013):
6.0 6.3
9.2
0
2
4
6
8
10
12
14
REDi Re-Occupancy REDi Functional Recovery REDi Full Recovery
MO
NTH
S
Repair Time Output at a 475 Year Earthquake
28
© HB Risk Group
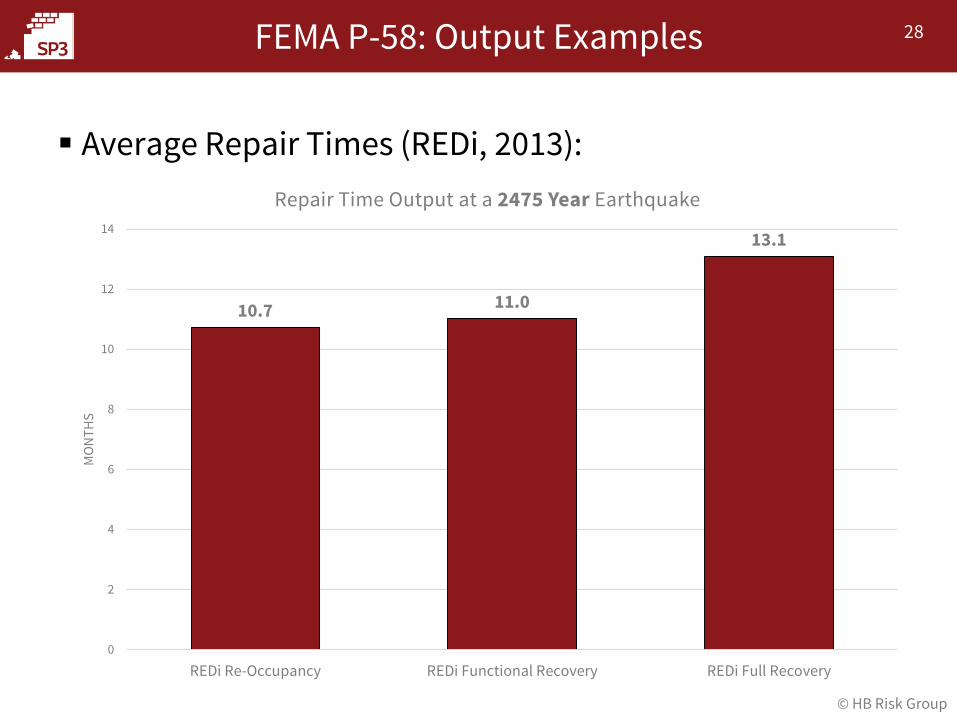
FEMA P-58: Output Examples
Average Repair Times (REDi, 2013):
10.7 11.0
13.1
0
2
4
6
8
10
12
14
REDi Re-Occupancy REDi Functional Recovery REDi Full Recovery
MO
NTH
S
Repair Time Output at a 2475 Year Earthquake
29
© HB Risk Group
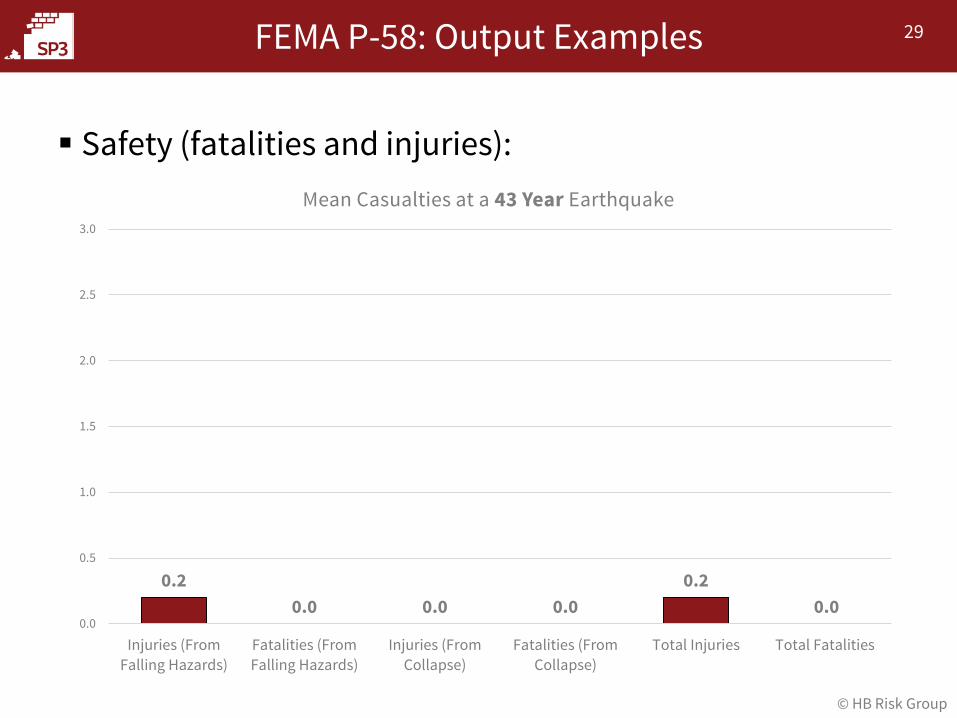
FEMA P-58: Output Examples
Safety (fatalities and injuries):
0.20.0 0.0 0.0
0.20.0
0.0
0.5
1.0
1.5
2.0
2.5
3.0
Injuries (FromFalling Hazards)
Fatalities (FromFalling Hazards)
Injuries (FromCollapse)
Fatalities (FromCollapse)
Total Injuries Total Fatalities
Mean Casualties at a 43 Year Earthquake
30
© HB Risk Group
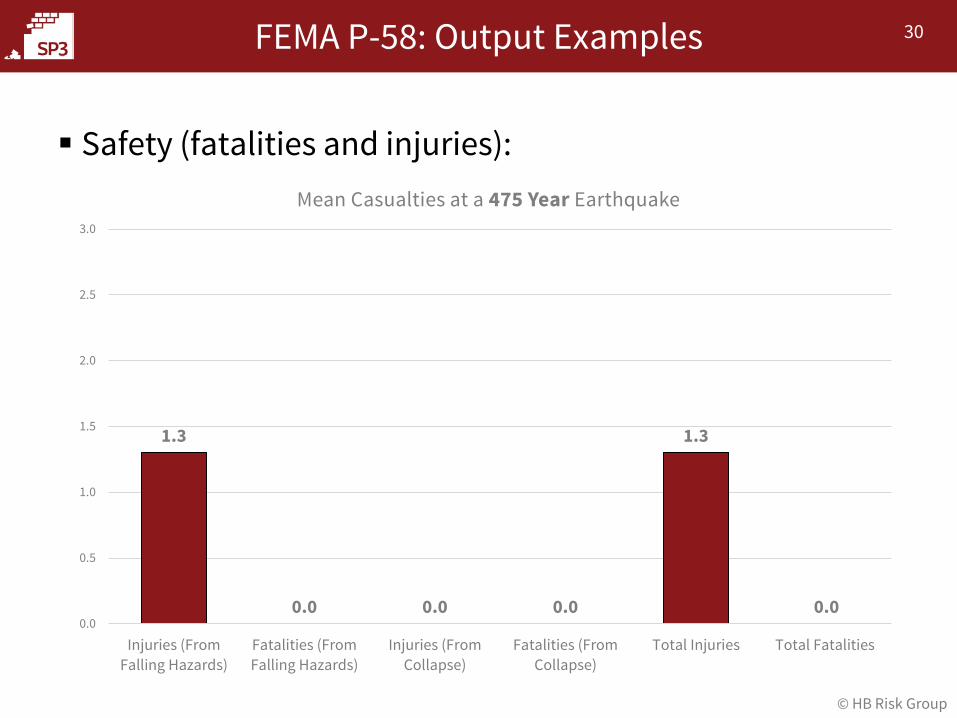
FEMA P-58: Output Examples
Safety (fatalities and injuries):
1.3
0.0 0.0 0.0
1.3
0.00.0
0.5
1.0
1.5
2.0
2.5
3.0
Injuries (FromFalling Hazards)
Fatalities (FromFalling Hazards)
Injuries (FromCollapse)
Fatalities (FromCollapse)
Total Injuries Total Fatalities
Mean Casualties at a 475 Year Earthquake

31
© HB Risk Group
FEMA P-58: Output Examples
Safety (fatalities and injuries):
2.5
0.00.1
0.8
2.6
0.8
0.0
0.5
1.0
1.5
2.0
2.5
3.0
Injuries (FromFalling Hazards)
Fatalities (FromFalling Hazards)
Injuries (FromCollapse)
Fatalities (FromCollapse)
Total Injuries Total Fatalities
Mean Casualties at a 2475 Year Earthquake

32
© HB Risk Group
FEMA P-58 provides a method that is:• Comprehensive and credible ($12M, 10 years, 100+ developers) • Transparent (open-source method for all to see)• Building-specific (not just for building class)• Standardized and repeatable (standard research-based databases
provide the foundation)
SP3 provides:• A software that makes FEMA P-58 feasible at the rapid pace of due-
diligence projects (hours, not days or weeks).• Easy access to the extensive FEMA P-58 building-specific risk information
accessible (SEL and SUL, but also detail on damaged components driving your losses, repair time estimates, etc.).
Why FEMA P-58 and SP3 for Due-Diligence?
33
© HB Risk Group
Currently in the PML market:• There are many methods one can use for due-diligence: ST-Risk, SeismicCat,
TZ, ATC-13, Hazus, etc.• These current methods are a mix of judgment, experience, and some data.• The risk assessment results (SEL and SUL) will depend heavily on the
method used. Some people equate this current situation to the consumer credit rating
arena. In the past, there were many “credit scores.” To have a consistent basis for lending decisions, the credit industry decided to choose one, and they chose the FICO score. The FEMA P-58 method is clearly superior to other available methods,
and it has now been streamlined in the SP3 software (now quick to use). Some are suggesting that the FEMA P-58 method become the “FICO
Score” for the due-diligence arena.
Why FEMA P-58 and SP3 for Due-Diligence?
34
© HB Risk Group
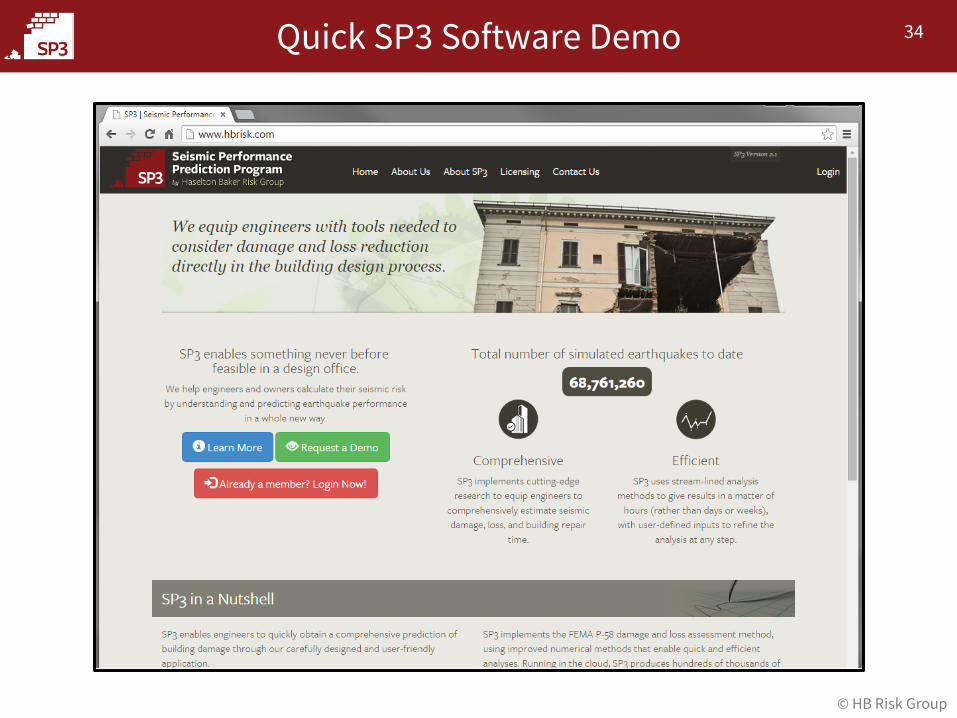
Quick SP3 Software Demo
35
© HB Risk Group
The FEMA P-58 method and SP3 software are complete and ready for use. FEMA P-58 method and SP3 are being used increasingly in our structural
engineering industry for:• PML and more advanced risk assessment• New resilient design• Retrofit projects
Summary and the Future
We are also continuing further SP3 development with $980k from National Science Foundation:
• Make the methods cover all structural systems and conditions (already covers nearly all of them). Currently implementing wood light-frame and creating the tilt-up method.
• Streamline the analysis methods to make the analysis quicker (e.g. no structural model needed for taller buildings, etc.).
36
© HB Risk Group
Questions and Discussion
Thank you for your time. Please let us know if you are interested in the due-diligence early-
adopter group that we will be starting this spring (with a soft start now). Our goal is to support adoption of advanced building-specific risk
assessment, and we welcome feedback and suggestions.
Time for questions and discussion!
Curt Haselton: [email protected], (530) 514-8980 Jack Baker: [email protected]
www.hbrisk.com