feeding and feed formulation strategies to reduce ... · pdf filetechnical reports:...
TRANSCRIPT

TECHNICAL REPORTS: INVESTIGATIONS 2009–2011
202
Feeding and Feed Formulation Strategies to Reduce Production Costs of
Tilapia Culture
Sustainable Feed Technology/Experiment/09SFT04NC
Remedios Bolivar
Central Luzon State University City of Muñoz, Philippines
Peter Ferket, Charles Stark and Russell Borski
North Carolina State University Raleigh, North Carolina, USA
ABSTRACT
Feed constitutes 60-80% of total production costs of tilapia (Oreochromis spp.). Reductions in quantity of feed used for fish growout and in the cost of formulated feeds are two approaches to containing feed costs. We evaluated combined feed reduction strategies, and less costly fishmeal-free and low crude protein diets as well as feed manufacturing options for improving production efficiency of Nile tilapia (O. niloticus). In a 120-day pond trial, fish subjected to a combined feed reduction strategy that incorporates a sequential series of a 60-day, 67% feeding rate with a 60-day 50% daily or 100% alternate day feeding rate had similar growth rates as fish fed daily at the 67% level throughout the trial. However, they exhibited lower survivorship, and hence the final extrapolated yield at harvest of animals on the combined feed reduction protocol was significantly lower. It appear sthat this protocol of incorporating a combination of feed reduction stategies is less effective than any of the strategies used alone, which were previously shown to reduce feed costs by as much as 56% in the growout of marketable tilapia. In a second pond trial we show that elimination of fishmeal from a standard 31% CP diet can produce a significant costs savings in feeds with no appreciable effect on growth performance and yield of tilapia raised in ponds. This confirms our earlier report whereby fishmeal-free diet provide an additional 8% cost savings in growout of tilapia over and above the > 50% savings seen with an alternate day feeding protocol. A reduction of dietary CP to 26%, so long as the amino acid composition remains similar to that of the higher 31% CP feed, can produce additional cost savings in feed of up to a 5.69% if fishmeal is included in the diet or up to 11.69% if fishmeal is not included in the lower protein diets. Hence, this work demonstrates that both elimination of fishmeal and reductions in the amount of crude protein or both significantly reduces the costs of feeds for growout of tilapia with little overall impact on growth parameters, survival or yield of fish. We also demonstrate that the production of a less costly pelleted fishmeal-free diet over an extruded form is further effective in reducing feed costs with negligible impact on performance. This was particularly true of the higher 31% CP diet. The ability to produce pelleted fishmeal-free aquafeeds that are of comparable performance as extruded feeds can not only promote an additional cost savings in feed of 3-7%, but would allow manufacturers who lack costly extruders to expand to production of aquafeeds. Collectively these series of studies and our previous work demonstrates that over and above any effects of reducing the amount of feed applied to the culture of tilapia, that up to 18% savings of feed costs can be achieved with fishmeal-free, lower crude protein and pelleted diets relative to the standard higher protein extruded feed containing 6% fishmeal.
INTRODUCTION
Feed is the most costly component of fish farming, accounting for as much as 80% of total production costs for small-scale, rural farmers in the Philippines that grow tilapia (ADB 2005; El-Sayed 2006). Approximately 35% of all feed manufactured or sold in the Philippines is for aquaculture, largely for

TECHNICAL REPORTS: INVESTIGATIONS 2009–2011
203
tilapia. Provided production efficiency is not significantly impaired, any reductions of feed costs per kg of fish marketed will increase income at several levels of Philippine society, including local suppliers of feedstuffs, feed manufacturers, allied industries, and especially tilapia farmers. Total feed costs for tilapia can be reduced through three approaches: 1) decrease in the amount of feed used for grow-out of marketable fish; 2) decrease feed formulation costs by reducing crude protein levels, amino acid supplementation and replacing expensive fish meal with lower cost protein sources; and 3) reduce feed manufacturing costs by pellet processing in place of the more expensive current practice of extrusion processing. The objectives of this investigation will address these three approaches to reducing feed costs for Filipino tilapia farmers. Our previous studies show that 1) delaying the onset of supplemental feeding to either 45-days or 75-days in fertilized ponds reduces the amount of feed consumed without any negative impact on the production of marketable tilapia, 2) feeding daily at 67% subsatiation produces growth rates identical to that of fish fed daily at full feeding levels and significantly improves production efficiency of tilapia growout, and 3) feeding daily at 50% satiation or on alternate days at the prescribed satiation level saved approximately half of feed cost without a significant reduction in growth, survival, or market yield of Nile tilapia in growout ponds (Brown et al. 2000, Bolivar et al. 2003, Bolivar et al. 2006; Bolivar et al., 2010). Nevertheless, fish were smaller on average at harvest with 50% daily satiation or alternate day satiation feeding relative to animals fed daily at the prescribed full level. Therefore, we tested a combined feeding strategy to evaluate whether a 67% subsatiation feeding combined with alternate day or 50% reduced feeding could reduce costs with no impact on growth or total biomass produced (see footnote at end of text). The formulation cost of commercial diets has risen sharply with about 40% of aquaculture feed costs attributable to fishmeal that constitutes as much as 20% of feed formulation. Much of the fishmeal used in the Philippines is imported and costs are expected to continue to rise as global supplies decline and demand increases. Unlike carnivorous species, tilapia are omnivorous fishes that do not require fish in their diet, and they are an ideal group of species to recycle food by-products into high quality food protein for humans (Brown 1983). Moreover, tilapia can digest a relatively high carbohydrate diet, and effectively utilize lower-cost feed ingredients readily available in the Philippines (e.g. rice bran, copra meal, and cassava) to completely replace or significantly reduce fishmeal use (Jackson et al. 1982; NRC 1993). Indeed, various animal and plant proteins have been shown to be either partially or completely replace fishmeal in tilapia diets (Lim and Webster 2006; El-Sayed 2006). For example, we reported tilapia fed diets with up to 33% sweet potato and lactic acid-stabilized poultry carcasses did not adversely affect tilapia growth performance or consumer panel sensory indices (Middleton et al. 2000). Additionally, our previous AquaFish CRSP research demonstrates that fishmeal can be replaced with poultry by-product meal, fermented poultry protein, or yeast extract protein without adversely affecting growth performance of tilapia fed pelleted feed (Ayoola 2010; Bolivar et al. 2010). Likewise, we have demonstrated that dietary replacement of a standard diet containing 6% fishmeal with porkmeal does not adversely effect growth of tilapia fed on alternative days in ponds, but produces a 8% cost savings in feeds (Borski et al. 2011). As observed with other monogastric omnivorous animal species, feeding lower protein diets supplemented with amino acids could significantly reduce excess nitrogen emission into pond water and increase profit margins by lowering feed costs for tilapia farmers (Ferket et al. 2003). These studies will evaluate the production performance feasibility of tilapia fed extruded high crude protein diets versus a lower crude protein diets supplemented with amino acids, and that contain either 0% or 6% fishmeal.
Most commercial aquaculture feed, including those for tilapia, is manufactured and fed as floating or slow-sinking extruded pellets because it is easier for fish farmers to detect over feeding and it has good water stability and durability. However, extrusion processing costs are higher than pellet processing. Likewise transport costs per ton are higher for extruded feeds because of their lower bulk density. Our previous work
TECHNICAL REPORTS: INVESTIGATIONS 2009–2011
204
at NCSU have shown that tank-reared tilapia are able to consume pellet-processed feed without adversely affecting growth performance efficiency (Ayoola 2010; Bolivar et al. 2010). The economic and production feasibility of feeding pellet processed feed must be confirmed with pond-reared tilapia in the Philippines. However, more research must be done to improve the water stability and durability of pelleted feed for pond systems. Pond-reared tilapia feed must have sufficiently high water stability that allows feed to be consumed by the fish and prevent nutrients from dispersing or leaching in the water, leading to poor feed conversion and performance (Leonard et al. 2002). Diet formulation, ingredient particle size, conditioning, die specs, and cooling are the major factors that influence pellet quality (Axe 2002). Proteinaceous and starch materials have the greatest influence on producing a water-stable feed, as well as the affecting the formula costs to meet nutrient specifications (Rokey and Huber 2005). However, most by-product protein meals commonly used in tilapia feed are heat-denatured proteins, which have reduced pellet-binding characteristics. In contrast, dietary inclusion of nutritive protein binders from yeast, animal, and plant sources or pelleting aids, could significantly enhance the durability of pelleted feed for tilapia. In the proposed investigation, we will evaluate the effect of dietary inclusion of various nutritive protein pellet binders and pelleting aids on the pellet durability and water stability of pelleted feed. This information will then be used to formulate and manufacture pelleted tilapia feed for pond culture systems and compare it to conventional extrusion-processed feed in terms of production efficiency and profitability.
OBJECTIVES
1. Evaluate effects of combined feed reduction strategies on the growout performance of Nile tilapia in fertilized earthen ponds.
2. Evaluate pond growout performance of Nile tilapia fed high and low crude protein diets with and without fishmeal.
3. Evaluate dietary inclusion of nutritive protein binders and pellet processing aids on pellet durability and water stability of tilapia feeds.
4. Compare the effect on tilapia feed manufactured by extrusion and pellet processing on pond grow-out performance of Nile tilapia.
MATERIALS AND METHODS
Study 1 - Evaluation of 67% subsatiation daily feeding combined with 100% alternate day or 50% daily
feeding versus continuous 67% daily feeding on growout of Nile tilapia in earthen ponds
Previous studies show that feeding at 67% of normal rates produces identical growth rates to animals fed at the typical 100% level, but at a signficant cost savings infeeds. This study evaluated if the 67% subsatiation feeding when combined with previous feed reduction strategies of alternate day feeding and 50% subsatiation might produce an additional cost savings with little impact on growth performance. This study evaluates three feeding treatments on the growth performance of Nile tilapia as follows: Treatment I – 67% daily feeding until harvest; Treatment II - 67% daily feeding for 60 days followed by 50% daily feeding until harvest; and Treatment III - 67% daily feeding for 60 days, followed by 100% alternate day feeding until harvest. Sex-reversed Nile tilapia (Orechromis niloticus) fingerlings (#20; 0.35- 0.37 g) were stocked at 4 fish m-2
in nine 500-m2 earthen ponds at the Freshwater Aquaculture Center (FAC), Central Luzon State University (CLSU), Science City of Muñoz, Nueva Ecija, Philippines with three replicates per group. The grow-out phase of this study were done in eight 500 m2 earthen ponds. Size 20 (weight range =) fingerlings of the GIFT strain were stocked in each pond. Fish were fed with pre-starter feeds containing 34% crude protein (CP) for the first month, starter feeds with 34% CP over the second month, and then grower feeds containing 31% CP until harvest. Treatment feed rations were adjusted based on the full
TECHNICAL REPORTS: INVESTIGATIONS 2009–2011
205
ration levels prescribed that ranged from 20% down to 2% average body weight over the course of the study. Feeding adjustment was done every two weeks when average body weights of fish were ascertained. The amount of feeds used per treatment was recorded daily. Fish sampling was done every two weeks by bulk weighing of 100 fish in each ponds. Individual weight and length of 100 fish were measured at the onset and termination of the study 120 days post stocking. Water temperature and dissolved oxygen were measured weekly at 0900 and 1300 hr using dissolved oxygen meter (YSI model 55). Hydrogen ion concentration (pH) and Secchi disc visibility depth (SDVD) reading was also measured weekly. Determinations of the other water quality parameters (total ammonia nitrogen and nitrite-nitrogen level) were measured using freshwater test kit (Lamotte Model AQ2). Ponds were fertilized with ammonium phosphate (16-20-0) and urea (46-0-0. ) at the rate of 28 kg N and 5.6 kg P ha-1 week-1, respectively to enhance the growth of natural foods in pond water. Weekly fertilization of the experimental ponds was adjusted based on SDVD. After 120 days of culture, stocks were harvested for bulk weight of all the stocks, survival rate, and the extrapolated gross fish yield (total weight of fish at harvest (kg) / area of the pond (m2)). Other variables, including total feed consumption, feed conversion ratio (FCR; feed consumed/body weight), specific growth rate (SGR; % daily body weight and length gain; [(ln Wf – ln Wi)/(Tf – Ti) X 100]) were calculated. Differences among means were statistically analyzed by analysis of variance (ANOVA) followed by Duncan’s Multiple Range Test (DMRT) (Duncan, 1955). Study 2 – Evaluation of pond growout performance of Nile tilapia fed high and low crude protein
diets with and without fishmeal.
This study was composed of 4 treatment groups: 1. Feeding of high CP (31%) extruded feed with 6% dietary inclusion of fishmeal – a standard diet used in
industry; 2. Feeding of low CP (26%) extruded feed with 6% dietary inclusion of fishmeal supplemented with amino
acids 3. Feeding of high CP (31%) extruded feed without (0%) dietary inclusion of fishmeal 4. Feeding of low CP (26%) extruded feed without (0%) dietary inclusion of fishmeal supplemented with
amino acids Diets were least-cost formulated to be similar to those from our previous work that demonstrated 31% CP fishmeal-free feed was as effective on the performance of tilapia in ponds as a standard diet containing 6% fishmeal (Borski et al. 2011)(Table 3). Diets were composed of locally available ingredients in the Philippines that included hydroyzed animal protein with fishmeal or porkmeal. Locally produced plant protein sources included copra cake, cassava, and rice bran. Soybean meal, upon which world protein market prices are based, was used as the basal plant protein source because of consistency of availability and nutritional quality. All grower diets were formulated to meet the nutrient requirement of tilapia (NRC 1993; Li et al. 2006) using least-cost linear programming. The low protein diets were supplemented with commercially available amino acids such that they have a similar amino acid profile as the high crude protein diet. Diets were formulated by Ms. Ning Pascaul of our industry cooperator, Santeh Feed Corporation (Tateh Aquafeeds, Santeh Feed Corp. Quezon City, Philippines).
Sex-reversed Nile tilapia fingerlings (#22, 0.162 g body weight) of GIFT strain were stocked at 4 fish m-2
in twelve 500 sq. m. earthen ponds at FAC-CLSU, Science City of Muñoz, Nueva Ecija, Philippines, with 3 replicate ponds per treatment group. Fish in all treatments were fed first with pre-starter feeds containing 36% crude protein for the first month and then with starter feeds containing 34% crude protein for the second month. Fish were subsequently fed grower treatment diets until harvest at 120 days poststocking. Fish were fed according to a standard schedule of 20% down to 2% body weight from the

TECHNICAL REPORTS: INVESTIGATIONS 2009–2011
206
beginning to the end of the pond study. Feeding adjustment was done every two weeks following subsampling for average body weight of stocks. Fish sampling was done every two weeks by getting the bulk weight of 50 fish samples. Individual weight and length of 100 fish was measured on the initial and final sampling. Water quality parameters were also measured as described above. Water temperature (oC), dissolved oxygen concentration (mg/l), hydrogen-ion concentration, total alkalinity (mg/l), total ammonia nitrogen (mg/l), carbon dioxide concentration (mg/l) and total phosphorus (mg/l) were monitored weekly. Total hardness (mg/l) was monitored monthly. Ponds were fertilized weekly with ammonium phosphate (16-20-0) and urea (46-0-0. ) at the rate of 28 kg N and 5.6 kg P ha-1 week-1, respectively to enhance the growth of natural foods in pond water and adjusted based on SDVD. Growth and production parameters were measured as described above. Differences among means were statistically analyzed by analysis of variance (ANOVA) followed by Duncan’s Multiple Range Test (DMRT) (Duncan 1955). Study 3 – Evaluate dietary inclusion of nutritive protein binders and pellet processing aids on pellet
durability and water stability of tilapia feeds.
The purpose of this study was to evaluate the efficacy of different types of pellet binder feed additives on the durability and water stability of pelleted tilapia feed. A 26% crude protein tilapia basal diet (containing ~34% corn, 25% soybean meal, 22% rice bran, 10% poultry by-product meal, 5% distillers dried grains with solubles, 0.5% poultry fat, and amino acids, vitamins and minerals making up the balance, Table 6) was ground through a #4 hammer mill screen to obtain a 400 micron geometrical mean particle size. Experiment 1
In experiment 1, the basal diet was split into 4 kg batches. Three commercial pellet binders and one “no binder” control were prepared in triplicate and arranged in three randomized blocks of consecutive processing runs through a small experimental pellet mill with 40 psi steam at ~80C with a 3.7 mm X 18 mm die). Feed additive pellet binders and inclusion levels tested were 0.2% urea-formaldehyde (UF), , 0.1% bone gelatin (G), and 2% wheat gluten (WG). The binders were added to 4 kg of the basal feed according to the manufacturer’s recommendations. The feed was pellet with a laboratory pellet mill. Feed was conditioned with 40 psi steam to 80oC and pelleted through a 3.7 mm x 18 mm ring die. Batches were run in immediate sequence with no change in steam or feeder screw rates. The results of this experiment were used to select the pellet binders in Experiment 2. Experiment 2
The basal tilapia grower formula and three different binders used in experiment 1 were also used here, with the addition of two combined treatments: 0.2% UF + 2% WG and 0.2% UF + 0.1% G. The combination of binders was based on the pellet quality results of Experiment 1. Diets were produced using a commercial-sized pellet mill equipped with a 4 mm X 45 mm die. The feed was conditioned for approximately 30 sec at each target temperature, using a 46 cm x 122 cm conditioner operating at 60 RPM. The pellet mill (Model PM1112-2, California Pellet Mill Co., Crawfordsville, IN) was equipped with a 4.4 mm x 35 mm ring die. Pellet Quality Analysis
Samples in Experiment 1 were tested for pellet compression strength, which was determined with a manually operated compression pellet tester (Amandas Kahl Nachf, 2057 Reinbek. Germany). The hardness of 15 pellets, randomly chosen from each treatment, was measured. Samples in Experiment 1 and 2 were tested for pellet quality with the following testing methods: 1) Pellet durability was determined by duplicate runs on the New Holmen Pellet Tester (NHPT, 68 mbar), whereby 100 g of
TECHNICAL REPORTS: INVESTIGATIONS 2009–2011
207
whole pellets were tumbled for 30- 90 seconds in a Holmen Pellet Tester, and percentage of remaining whole pellets calculated; 2) KSU pellet durability index (PDI) according to ASAE Method S269.7; 3) modified ASAE method that included the addition of three 19 mm hex-nuts (MPDI); and 4) water stability, which was determined with duplicate 50 g samples of pellets of each diet (PWS). Water stability samples were placed on a 3 mm diameter sieve and slowly immersed in deionized water at 24 ºC for 10 min; the sieve was removed from water, drained for 1 min, oven-dried at 105 ºC for 3 h, cooled in a desiccator, and reweighed. Water stability was calculated as the percentage difference in dry weight. Study 4: Compare the effect on tilapia feed manufactured by extrusion and pellet processing on
pond grow-out performance of Nile tilapia.
In this study we evaluated the effect of using a sinking pellet versus extruded feed on tilapia growout in ponds. Fish stocks were fed with the experimental feeds using a factorial arrangement of 2 manufactured feed forms, floating extruded versus slow sinking pelletd feed with high and low crude protein level. Binders used for the pelleted feed were those shown to maximize pellet durability and stability from Study 3 (0.2% urea-formaldehyde + 0.1% gelatin). All diets were formulated without fishmeal at either low or high crude protein levels similar to Study 2 using least-cost linear programming. Diets were formulated by Ms. Ning Pascaul of our industry cooperator, Santeh Feed Corporation (Tateh Aquafeeds, Santeh Feed Corp. Quezon City, Philippines). The following represent the four different fishmeal-free treatment diets used in the experiment: I) 31% CP floating extruded feed II) 31% CP slow-sinking pelleted feed + binders III) 26% CP floating extruded feed supplemented with amino acids IV) 26% CP slow-sinking pelleted feed supplemented amino acids + binders Sex-reversed fingerlings of size #22 (0.170 g/pc) were stocked in twelve 500 m2 earthen ponds at FAC-CLSU at 4 pcs m-2 with 3 replicates per treatment. Fish stocks in all treatments were fed first with fry mash (31% CP) for the first 30 days and starter feeds (30% CP) were given up to 75 days of culture period. Fish were subsequently fed the grower treatment diets aon alternate days for 60 days or until the end of the 135-day growout trial. Alternate day feeding was previously shown to reduce production costs of tilapia without significantly altering final yield as almost 50% less feed could be used to grow fish than that incorporating standard daily feeding practices (Bolivar et al. 2006). Moreover, our previous work showed that replacement of fishmeal with pork meal is as effective in producing tilapia under an alternate-day feed reduction strategy, as those diets containing standard levels of fishmeal (Borski et al. 2011). Feeding rates in the experiment started at 20% and was reduced to 2% based on average body weight of the stocks within the culture period. Fish sampling was done every two weeks by cast net to obtain average weight of fish stocks determined by bulk weighing 100 fish. Individual weight and length of 100 fish was measured on the initial stocking and final sampling. Water quality parameters were also measured as described above. Water temperature (oC), dissolved oxygen concentration (mg/l), hydrogen-ion concentration (pH), total alkalinity (mg/l), total ammonia nitrogen (mg/l), carbon dioxide concentration (mg/l) and total phosphorus (mg/l), and SDVD were monitored weekly at 0900 hour. Ponds were fertilized weekly with ammonium phosphate (16-20-0) and urea (46-0-0. ) at the rate of 28 kg N and 5.6 kg P ha-1 week-1, respectively to enhance the growth of natural foods in pond water and adjusted based on SDVD. Differences in growth performance, survival rate and feed consumption were statistically analyzed by ANOVA and the overall production costs were estimated to assess economic feasibility.

TECHNICAL REPORTS: INVESTIGATIONS 2009–2011
208
RESULTS AND DISCUSSION
Study 1 - Evaluation of 67% subsatiation daily feeding combined with 100% alternate day or 50%
daily feeding versus continuous 67% daily feeding on growout of Nile tilapia in earthen ponds1
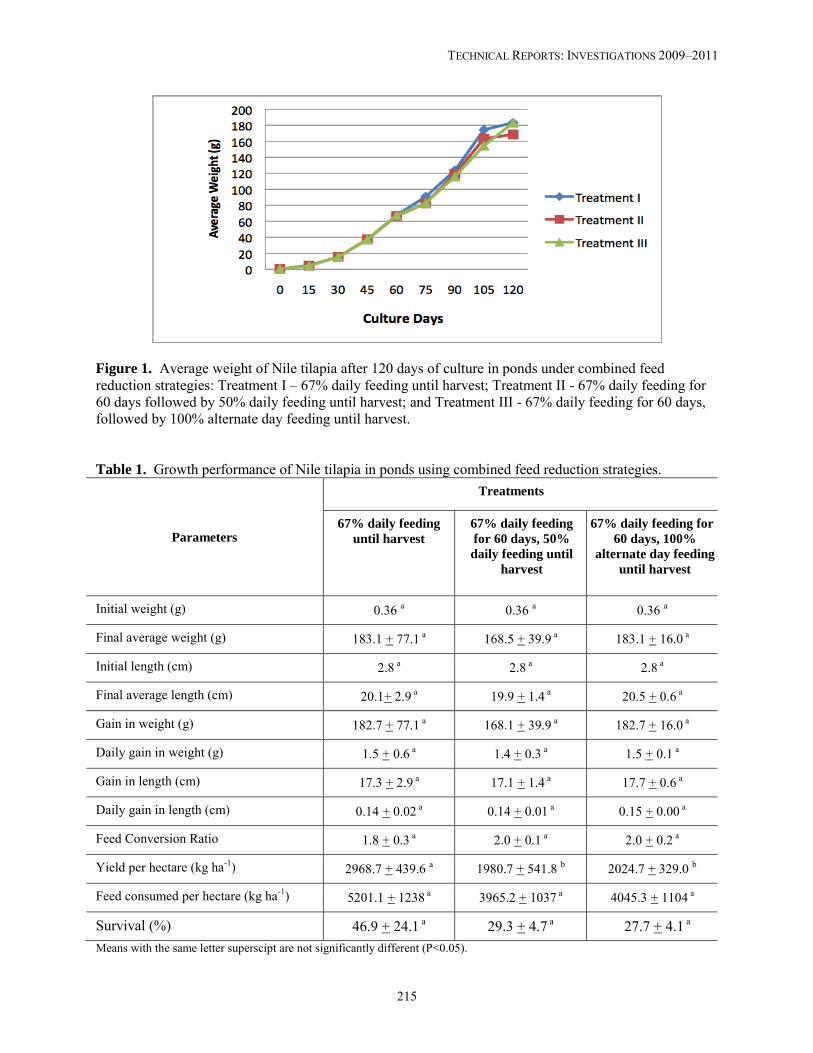
Figure 1 shows the average growth trend of stocks after 120 days of culture period in fertilized ponds. Average body weight of Nile tilapia on the 67%-50% or 67%-alternate day feeding did not differ significantly from animals fed at 67% subsation throughout the study. Table 1 summarizes the growth performance, survival, feed consumption and yield of Nile tilapia cultured in earthen ponds using combined feed reduction strategies. Feed consumption per hectare was highest in fish fed 67% level (5201.1 + 1238 kg/ha) compared with those animals fed at 67%-50% level (3965.2 + 1037 kg/ha) and 67%-alternate day protocol (4045.3 + 1104 kg/ha) Treatment III then Treatment II with a mean values of, 4,045.3 and 3,965.2 kgs hectare-1, respectively. Fish fed daily at the 67% level had an FCR of 1.8 which was lower than that seen with fish on the 67%-50% and 67%-alternate day feeding protocol that had an FCR of 2.0. Despite these trends, there were no significant difference in feed consumed or FCR among treatments. In terms of fish yield, the highest yield per hectare was observed in fish fed daily at 67% level, followed by those on the 67%-alternate day schedule, and then those on the 67%-50% protocol, with a mean values of 2,968.7, 2,024.7 and 1,980.7 kgs per hectare, respectively. Fish yield was signficantly higher in the 67% level group relative to other treatments (P < 0.05; Table 1). The highest survival of 46.9% was found for fish fed at the 67% level relative to the other groups whose mean survival ranged 27.7-29.3%. There was some variation in survivorship of replicate groups fed at the 67% level and hence no statistically signficant difference was observed between this and the other groups. It is likely that the higher yield of fish on the 67% daily feeding regimen s is due to the elevated survivorship of this group relative to the other treatments. Generally, the survival obtained after the experiment was low due to observed mortality during the third and fourth month of the study. Recorded high water temperatures during the afternoon could have caused stress which affected growth and survival even with replenishment of water. This may have been exaserbated in those groups where fish were fed daily at either the 50% level or on alternate days at full levels. Results on average minimum and maximum reading for water quality parameters during the 120-day culture period are summarized in Table 2. Generally, the dissolved oxygen readings during the morning ranged from 0.98 and 7.78 mg-L-1 for Treatment I, 1.20 and 3.89 mg-L-1 for Treatment II and 1.39 and 6.64 mg-L-1 for Treatment III. Afternoon dissolved oxygen readings for Treatments I, II and III were 3.64 and 12.87, 4.67 and 11.41 and 5.36 and 13.67 mg-L-1, respectively. Dissolved oxygen concentration measured during the study remained in the favorable range for tilapia (Boyd 1990). The results support the findings of Liti et al. (2002) that Nile tilapia can tolerate low DO levels. 1 The initial growout trial, e.g. Study 1, proposed for this investigation was initiated to assess the effect of high and lower dietary crude protein on growth performance of Nile tilapia in fertilized and nonfertilized ponds. Fry were sex reversed and fingerlings were stocked in ponds. However, due to production constraints, our industry cooperator (Santeh feed company of the Philippines) could not deliver the formulated feeds in adequate time to complete the study that was already in progress. Therefore, we improvised with the experiment already in progress by conducting Study 1 as outlined in this report., We evaluated the effects of a combined feed reduction on growout of tilapia using commercial feed in fertilized ponds. Also, our proposed second study (Study 2) essentially evaluates high and low dietary crude protein (with and without fishmeal) in fertilized ponds, hence it overlaps signficiantly with the original proposed Study 1, with exception that we did not test diets in unfertilized ponds. A majority of farmers fertilize there ponds so we have largely captured the objective of the original planned Study 1 through experiments outlined here with Study 2.

TECHNICAL REPORTS: INVESTIGATIONS 2009–2011
209
The average water temperature readings in the morning range between 28.43 and 31.97 oC, while afternoon water temperature ranged from 31.57 to 37.50 oC. Preferred water temperatures for tilapia growth are approximately 28.0-32.0 oC, but range varies depending on the tilapia species cultured. Tilapias reportedly tolerate temperatures up to 40 oC, but stress-induced disease and mortality are problematic when temperatures are around 37.0 or 38.0 oC (Teichert-Coddington et al. 1997). Fluctuation of the water temperature also affects growth due to the rise and fall of temperature, energy required for maintenance increases rapidly, thus decreasing the energy available for growth (Soderberg 1997). Average pH ranged between 6.93 and 8.37. Boyd (1998) reported that waters with a pH range of 6.5 – 9 are the most suitable for fish production. Readings for total ammonia nitrogen and nitrite levels during the experiment were in the desirable range for all the treatments. The European Inland Fisheries Advisory Commission (1993) reported that the toxic level of NH4 to fish is 2 mg/L. The average value of Secchi disc reading were 23.3 and 72.7, 22.3 and 78.3 and 24.3 and 57.7 cm for Treatments I, II and III, respectively. Water quality parameters showed no significant difference among treatments at 5% level of significance. In our previous work we found that 67% daily feeding, 50% daily feeding and alternate day feeding at 100% level when used alone are all effective in reducing feed and production costs with little impact on total yield (Brown et al. 2000, Bolivar et al. 2003, Bolivar et al. 2006; Bolivar et al. 2010). With the 67% daily feeding protocol animals grew to virtually identical sizes at harvest relative to the 100% daily feeding level, while the other feed reduction protocols elicited up to 50% cost savings, but final size at harvest was slightly less, albeit insignificant relative to animals on a typical feeding regimen. The results presented here shows that a combined feed reduction strategy that incorporates a sequential series of a 60-day, 67% feeding rate with a 60-day 50% daily or 100% alternate day feeding rate is less effective than 67% feeding rate used alone in the pond growout of tilapia. Despite similar growth rates the survivorship of fish, and hence final extrapolated yield was reduced when using combined feed reduction strategies. We similarly found that the delayed onset of feeding combined with alternate day and 67% feeding rates was also less effective than that of animals fed at the typical 100% daily feeding rate (Borski et al. 2010; Bolivar et al. 2010). Collectively these results suggest that combined feed reduction strategies, at least based on the experimental paradigm tested here and previously, are less effective than applying 67% satiation, 50% satiation or 100% alternate day feeding strategies alone.
Study 2 – Evaluation of pond growout performance of Nile tilapia fed high and low crude protein
diets with and without fishmeal.
The ingredients and proximate composition of the experimental diets are shown in Table 3. The 31% CP fishmeal and fishmeal free diets followed formulations from our previous work that showed the fishmeal free diets were 8% more cost effective than the standard diet containing fishmeal (Borski et al. 2011). Here we assess if reducing the crude protein levels of the diets might offer an additional cost benefit. Figure 2 shows the growth trend on average weight of Nile tilapia fed on four different diets after 120 days of culture period. The highest growth performance measured by final average weight of 287.722 g, final average length of 23.3 cm and specific growth rate of 6.227% were attained in tilapia fed 31% CP extruded feed without dietary inclusion of fishmeal (Table 4). The next best performance was seen in tilapia fed the 26% CP extruded feed without dietary inclusion of fishmeal where a final mean body weight, body length and specific growth rate was 269.226 g, 22.7 cm, and 6.169%, respectively. Fish fed the 31% CP extruded feed with fishmeal attained an average final body weight of 254.416 g, final length of 22.3 cm, and specific growth rate of 6.118%. Collectively, there were no significant differences in growth performance of fish fed the different diets (P > 0.05). Similarly there was no significant difference in extrapolated yield of fish at harvest or in overall feed conversion ratio among the groups, although fish on the 26% CP, fishmeal free diet had the lowest FCR of 2.8 and highest extrapolated yield per hectare at harvest (Table 4). Low survival was partly due to the

TECHNICAL REPORTS: INVESTIGATIONS 2009–2011
210
presence of predatory bird throughout the culture period. Additionally exposure to suboptimal, cooler temperature (22 C) along with extreme temperature shifts (22 - 28 C) during the culture period may have contributed to poorer survival (Figure 3). Other farmers in the region also exhibited generally low survival during the experimental period. Rakocy and McGinty (1989) indicated that the preferred temperature range for better tilapia growth and survival is 28-30 oC. Table 5 presents the minimum and maximum mean values of water quality parameters measured in each treatment over the course of the 120-day growth trial in ponds. Almost similar readings were observed for water quality parameters such as dissolved oxygen, water temperature, pH, alkalinity, total ammonia nitrogen, total phosphorus, CO2, total hardness and Secchi disc visibility. All water quality parameter readings during the experiment fall under the tolerable range for tilapia culture. In terms of cost and return analysis, all treatments had negative returns due to low number of stocks recovered during harvest (data not shown). Nevertheless, it is clear elimination of fishmeal and reducing the amount of crude protein in the diet provides a significant costs savings in feeds, which constitutes 60-70% of total production costs for growout of tilapia. The costs of feeds (43 PhP = $1) used in the experiments were as follows: PhP30.75 kg-1 for 31% CP with 6% fishmeal (treatment 1), PhP29.00 kg-1 for 26% CP + AA with fishmeal (treatment 2), PhP29.65 kg-1 for 31% CP with 0% fishmeal (treatment 3), and PhP27.20 kg-1 for 26% CP + AA with 0% fishmeal (treatment 4). With reference to the standard 31% CP with 6% fishmeal diet, the 26% CP with fishmeal diet costs 5.69%, the 31% CP with 0% fishmeal costs 3.58%, and the 26% CP with 0% fishmeal costs 11.54% less per kg than the standard diet. Collectively, the results suggest and confirms our earlier report (Borski et al. 2011) that elimination of fishmeal from a standard 31% CP diet can produce a significant costs savings in feeds with no appreciable effect on growth performance and yield of tilapia raised in ponds. Here, we show that reductions in the amount of dietary CP, so long as the amino acid composition remains similar, can produce additional cost savings in feed of up to a 5.69% if fishmeal is included in the diet or up to 11.69% if fishmeal is not included in the lower protein diets. Hence, this work demonstrates that both elimination of fishmeal and reductions in the amount of crude protein or both significantly reduces the costs of feeds for growout of tilapia with little overall impact on growth parameters, survival or yield of fish. Study 3 – Evaluation of dietary inclusion of nutritive protein binders and pellet processing aids on
pellet durability and water stability of tilapia feeds.
The majority of the tilapia feed sold to farmers is in the form of extruded pellets, which increases the cost of the feed. The development of a pellet that is manufactured with a ring die pellet mill would reduce the manufacturing cost of the diets sold to farmers. Also, the number of manufacturers of aquatic feeds could be expanded if semi-sinking pelleted fish feeds rather than extruded feeds could be used, since many feed mills that currently produce pelleted feeds for livestock do not have costly extruders. The objective of this experiment was to identify pellet binders that improve the stability of pellets fed in ponds as an alternative to extruded tilapia feed. Two experiments were conducted to determine if the inclusion of nutritive protein binders and pellet processing aids would increase the durability and water stability of tilapia feed. The average particle size of the basal diet (formulation in Table 6) was 291 and 281 microns in experiment 1 and 2, respectively. Based on traditional pellet durability tests The pellet quality results in both experiment indicated that that all pellets produced during the pelleting process were high quality (> 96% durability). The high quality pellets were primarily a result of the fine grinding of the basal diet, which increased the relative surface area contact between particles within the pellet. There was no difference in pellet durability index (PDI) between the control (no binder) diet and the diets containing the different binders (Table 7 and 8) based on traditional evaluation methods with the exception of the NHPT 90 sec test. Water stability testing was the primary method that produced significant differences between
TECHNICAL REPORTS: INVESTIGATIONS 2009–2011
211
the different pellet binders. The urea formaldehyde and wheat gluten treatments produced the best pellet water stability (PWS) results in Experiment 1. The urea-formaldehyde, gelatin, and wheat gluten increased (P <. 001) PWS by 37.3%, 5.7%, and 19.7%, respectively, over the no binder control (yielding 50.1% PWS). The pellets produced with urea-formaldehyde and wheat gluten had over 60% of the pellets intact at the end of the test. In experiment 2, the urea-formaldehyde, gluten, and urea-formaldehyde + gluten binders significantly increased (P < 0.05) PDI by 1.6%, 2.0%, and 2.2%, respectively, over the no binder control (91.5% NHPT PDI 90 sec test). The urea-formaldehyde, gluten and urea-formaldehyde + gluten binders increased (P < 0.001) PWS by 10%, 7%, and 15%, respectively over the no binder control and wheat gluten binder treatments (averaging 68% PWS). Although there was not statistical difference between the urea-formaldehyde as compared to the combination of 2% urea formaldehyde and 1% gelatin, the addition of the gelatin increased the water stability by 4.3%. In both studies, gelatin had a negative effect on pellet mill performance, causing the mill to choke a few times until the optimal feeder rate of the pellet mill was achieved. Based on these results, the combination of urea-formaldehyde and gelatin binders was included in commercial diets used in the pond research studies described below. Study 4: Compare the effect on tilapia feed manufactured by extrusion and pellet processing on
grow-out performance of Nile tilapia.
Our previous work (Borski et al. 2011) and results of Study 2 above, indicate fishmeal-free diets with 31% or 26% CP do not appreciably alter growth performance or yield of tilapia, but are more cost effective compared with standard diets containing fishmeal. Based on this information we compared extruded versus slow-sinking pelleted fishmeal-free diets that contain either 31% or 26% crude protein. Slow-sinking pelleted feeds contained 0.2% urea formaldehyde and 0.1% gelatin binder to improve pellet water stability (see Study 3 above). As with the other pond study described in Study 2 we worked with our industry cooperator, Santeh Feed Corporation (Philippines), to develop the diets (see Table 9). This insured that least cost forumulated diets would incorporate ingredients widely available in the Philippines, including rice bran, copra cake, cassava meal, local fish oils and coconut oil. Growth performance of Nile tilapia over the 135-day of culture period in earthen ponds is shown in Figure 4 and Table 10. Fish were provided the grower treatment diets during the last 60 days of growout. Figure 4 shows the growth pattern of the fish stocks prior to and during different dietary treatments. Fish fed the extruded 26% CP diet attained the highest final average body weight of 237.46 g, followed by those provided the pelleted 31% CP diet (227.95 g; P < 0.05). Both these groups had higher final average body weights and then those given the 31% extruded feed (180.67 g; P< 0.05). Fish fed the pelleted 26% CP diet had the the lowest final average body weight of 136.637 g that differed significantly from animals fed all other dietary treatments (P < 0.05). We found that these differences in growth began to diverge at day 45, which was prior to the onset applying the experimental diets at day 75. The difference in growth persisted until the end of the culture period. A similar pattern in overall daily weight gain and specific growth rate among the treatment groups was observed, although these difference were not statistically significant. There were no differences in FCR or feed efficiency among the treatment groups. Fish provided the 31% CP pelleted feed had the highest yield with 3,288.7 kg/ha. This was followed by animals fed 31% CP extruded diets (3,214 kg/ha), and those fed 26% CP extruded feed (3,026.7 kg/ha). Animals fed 26% CP pelleted feed had the lowest extrapolated yield of 2,650.7 kg/ha. Overall, there was no significiant differences in yield among the treatment groups. Likewise, the survival of fish ranged from 42-51%, with lowest survival in fish fed the extruded 26% CP diet. Again survival rates among the groups were not signficantly different.
TECHNICAL REPORTS: INVESTIGATIONS 2009–2011
212
Table 11 shows the average reading of the water quality parameters monitored in this study. All water quality parameters recorded were within the ideal ranges suitable for the culture of tilapia and did not show variances among treatments that could have affected the performance of the fish stock. The costs of fishmeal-free feeds (43 PhP = $1) used in the experiments were as follows: PhP30.20 kg-1 for extruded 31% CP diet (treatment I), PhP29.20 kg-1 for slow-sinking pelleted 31% CP (treatment II), PhP29.00 kg-1 for extruded 26% CP (treatment III), and PhP28.00 kg-1 for slow-sinking pelleted 26% CP feed (treatment IV). With reference to the standard extruded 31% CP diet, the 31% CP pelleted diet is 3.33%, the extruded 26% CP 4.00%, and the slow-sinking 26% CP diet is 6.67% less per kg. Collectively, these studies suggest that fishmeal-free extruded low CP and high CP diets produce similar performance with regard to growth, yield and survival of Nile tilapia, confirming results of Study 2. The use of high CP slow-sinking pelleted feed had the advantage over extruded feeds insofar as the cost of feed is 3.3% cheaper and performance is similar. It appears that sinking pelleted feeds at the lower crude protein level were somewhat less effective than the extruded feed, although no signficant loss of yield was observed with this feed compared with the others. Overall, it would appear that the use of sinking-pelleted feeds may have a cost effective advantage in tilapia production, particularly at the higher protein level. The results also suggest that manufacturers do not require costly extruders to produce effective tilapia aquafeeds.
CONCLUSION
It is estimated that 60-80% of total variable costs for growing tilapia is attributable to feeds. Through a series of studies we have established that feed costs can be reduced through modification of diet formulation and manufacturing with no significant impact on performance or yield of tilapia grown in ponds. The results suggest that elimination of fishmeal from a standard 31% CP diet can produce a significant costs savings in feeds with no appreciable effect on growth performance and yield of tilapia raised in ponds. This confirms our earlier report whereby fishmeal-free diet provide an additional 8% cost savings in growout of tilapia over and above the > 50% savings seen with an alternate day feeding protocol (Ayoola 2010; Borski et al. 2011). Additionally, we show that a reduction of dietary CP to 26%, so long as the amino acid composition remains similar to that of the higher 31% CP feed, can produce additional cost savings in feed of up to a 5.69% if fishmeal is included in the diet or up to 11.69% if fishmeal is not included in the lower protein diets. Hence, this work demonstrates that both elimination of fishmeal and reductions in the amount of crude protein or both significantly reduces the costs of feeds for growout of tilapia with little overall impact on growth parameters, survival or yield of fish. Toward development of a less costly slow-sinking pelleted versus extruded feed we evaluated dietary binders in tilapia diets. The combination of urea-formaldehyde and gelatin were the most effective binders that maximized water stability of pelleted tilapia feeds. pelleted fishmeal-free diet over an extruded form is further effective in reducing feed costs by 3-7% with negligible impact on performance. This was particularly true of the higher 31% CP diet. The ability to produce pelleted fishmeal-free aquafeeds that are of comparable performance as extruded feeds can not only promote an additional cost savings in feed, but would allow manufacturers who lack costly extruders, which include most livestock feed companies, to expand to production of aquafeeds. Training on feed reduction strategies, least cost feed formulations and feed manufacturing technologies was provided to tilapia farmers, feed companies, government officials and the academic community through a workshop held in Batangas, Philippines, a central region of tilapia production in the Philippines.

TECHNICAL REPORTS: INVESTIGATIONS 2009–2011
213
LITERATURE CITED
Asian Development Bank. 2005. An evaluation of small-scale freshwater rural aquaculture development for poverty reduction. 163 pp
Axe, D. 2002. Feed production and technology manual. IMC Feed Ingredients. Lake Forest, IL. Ayoola, A. 2010. Replacement of Fishmeal with Alternative Protein Source in Aquaculture Diets. M.S.
Thesis. North Carolina State University. 129 pp. Bolivar, R.B., Jimenez, E.B.J. and Brown, C.L. 2006. Alternate day feeding strategy for Nile tilapia grow
out in the Philippines: Marginal cost-revenue analysis. North American Journal of Aquaculture, 68: 192-197.
Bolivar, R.B., C.L. Brown and E.T. Jimenez. 2003. Feeding Strategies to Optimize Tilapia Production in Ponds. Book of Abstract. Aquaculture 2003. Louisville, Kentucky, USA. p. 26.
Bolivar R.B., Vera Cruz E.M, Jimenez E.B.T, Sayco RMV, Argueza R.L.B, Ferket P.R., Stark C.R., Malheiros R, Ayoola A.A., Johnstone W.M., Picha M.E., Holler B.L., Won E.T., and R.J. Borski. 2010. Feeding reduction strategies and alternative feeds to reduce production costs of tilapia culture. Technical Reports: Investigations 2007-2009, AquaFish Collaborative Research Support Program. Oregon State University. Vol 1. p 50-78. (309 pp)
Borski, R. J., Bolivar, R. B., Jimenez, E. B. T., Sayco, R. M. V. and Argueza, R. L. B. 2010. Growth Performance of Nile Tilapia (Oreochromis niloticus L.) in Ponds in the Philippines using Combined Feed Reduction Strategies. Aquaculture 2010 Book of Abstracts. San Diego California, USA.
Borski, R.J., Bolivar, R.B., Jimenez, E.B.T., Sayco, R.M.V., Arueza, R.L.B., Stark, C.R., and Ferket, P.R. 2011. Fishmeal-free diets improve the cost effectiveness of culturing Nile tilapia (Oreochromis
niloticus, L.) in ponds under an alternate day feeding strategy. p 95-101. In Liping L. and and Fitzsimmons K. (eds.). Proceedings of the Ninth International Symposium on Tilapia in Aquaculture. April 21-24. Shanghai, China. 407 p
Boyd, C. E. 1990. Water Quality in Ponds for Aquaculture. Alabama Agriculture Experiment Station, Auburn University, Alabama, USA.
Boyd, C. E. 1998. Water Quality for Pond Aquaculture. Research and development series No. 43. pp. 37. International Centre for aquaculture and aquatic Environments. Alabama Agricultural Experiment Station. Auburn University.
Brown, C.L., Bolivar, R.B., Jimenez, E. T., and Szyper, J.P. 2000. Timing of the onset of supplemental feeding of Nile tilapia (Oreochromis niloticus) in ponds. p. 237-240. In: Fitzsimmons, K. and Filho, J.C. (eds.). Tilapia Aquaculture in the 21st Century. Proceedings from the Fifth International Symposium on Tilapia Aquaculture. September 3-7. Rio de Janeiro, Brazil. 682 p.
Brown, E.E. 1983. World Fish Farming: Cultivation and Economics. 2nd edn. AVI Publishing, Westport, CT. 397 pp.
Duncan, D. B. 1955. Multiple ranges and multiple F-tests. Biometrics, 11: 1-42.
El-Sayed, A.F.M. 2006. Nutrition and Feeding. In: Tilapia Culture. CABI Publishing, Oxford, U.K. 277 pp.
European Inland Fisheries Advisory Commission. 1993. Water quality criteria for European fresh water fish. Report on Ammonia and Inland Fisheries. Water Res., 7: 1011.
Ferket, P.R., E. van Heugten, T. A. van Kempen, and R. Angel, 2003. Nutritional Strategies to Reduce Environmental Emissions from Non-Ruminants. J. An. Sci. 80(Electronic Supplement 2): 2289 http://www.asas.org/jas/symposia/esupp2/default.asp
Jackson, A.J., B.S. Caper, A.J. Matty. 1982. Evaluation of some plant proteins in complete diets for the tilapia Sarotherodon mossambicus. Aquaculture 27:97-109.
Leonard, G.O., S. Divakaran, A.G. Tacon. 2002. Methods for determining the physical stability of shrimp in water. Aquaculture Research, 33, pp 369-377.
TECHNICAL REPORTS: INVESTIGATIONS 2009–2011
214
Li, M.H., Lim, C.E., and Webster, C.D. 2006. Feed Formulation and Manufacture. In: Tilapia: Biology, culture and nutrition. C.E. Lim and C.D. Webster (Eds). The Haworth Press, Inc., New York. 517-559.
Lim, C.E. and Webster,C.D. 2006. Nutrient Requirement. In: Tilapia: Biology, culture and nutrition. C.E. Lim and C.D. Webster (Eds). The Haworth Press, Inc., New York. 469-501.
Middleton, T.F, P.R. Ferket, L.C. Boyd, H.V. Daniels, and M.L Gallagher. 2001. An evaluation of co-extruded poultry silage and culled jewel sweet potatoes as a feed ingredient for hybrid Tilapia (Oreochromis niloticus X O. mossambicus). Aquaculture 198:269-280.
Liti, D. M., Mac’Were, O. E. and Veverica, K. L. 2002. Growth performance and economic benefits of Oreochromis niloticus/Clarias gariepinus polyculture fed on three supplementary feeds in fertilized tropical ponds. In: K. McElwee, K. Lewis, M. Nidiffer, and P. Buitrago (eds.). Nineteenth Annual
Technical Report. Pond Dynamics/Aquaculture CRSP, Oregon State University, Corvallis, Oregon. pp. 11-16.
National Research Council. 1993. Nutrient Requirements of Fish. National Academic Press, Washington, DC.
Rokey, G. and G. Huber. 2005. Aquatic Feed: Extrusion processing for aquaculture feeds. Feed Technology V. E. Schofield, ed. American Feed Industry Assn. Arlington, VA. pp 292-293.
Soderberg, R. W. 1997. Factors affecting fish growth and production. p. 199-213. In: H. S. Egna and C. E. Boyd (eds.). Dynamics of Pond Aquaculture. CRC Press. New York, USA. 437 pp.
Teichert-Coddington, D. R., Popma, T. J. and Lovshin, L. L. 1997. Attributes of Tropical Pond-cultured Fish. p. 183-198. In: H. S. Egna and C. E. Boyd (eds.). Dynamics of Pond Aquaculture. CRC Press. New York, USA. 437 pp.
TECHNICAL REPORTS: INVESTIGATIONS 2009–2011
215
Figure 1. Average weight of Nile tilapia after 120 days of culture in ponds under combined feed reduction strategies: Treatment I – 67% daily feeding until harvest; Treatment II - 67% daily feeding for 60 days followed by 50% daily feeding until harvest; and Treatment III - 67% daily feeding for 60 days, followed by 100% alternate day feeding until harvest.
Table 1. Growth performance of Nile tilapia in ponds using combined feed reduction strategies.
Parameters
Treatments
67% daily feeding
until harvest
67% daily feeding
for 60 days, 50%
daily feeding until
harvest
67% daily feeding for
60 days, 100%
alternate day feeding
until harvest
Initial weight (g) 0.36 a 0.36 a 0.36 a
Final average weight (g) 183.1 + 77.1 a 168.5 + 39.9 a 183.1 + 16.0 a
Initial length (cm) 2.8 a 2.8 a 2.8 a
Final average length (cm) 20.1+ 2.9 a 19.9 + 1.4 a 20.5 + 0.6 a
Gain in weight (g) 182.7 + 77.1 a 168.1 + 39.9 a 182.7 + 16.0 a
Daily gain in weight (g) 1.5 + 0.6 a 1.4 + 0.3 a 1.5 + 0.1 a
Gain in length (cm) 17.3 + 2.9 a 17.1 + 1.4 a 17.7 + 0.6 a
Daily gain in length (cm) 0.14 + 0.02 a 0.14 + 0.01 a 0.15 + 0.00 a
Feed Conversion Ratio 1.8 + 0.3 a 2.0 + 0.1 a 2.0 + 0.2 a
Yield per hectare (kg ha-1) 2968.7 + 439.6 a 1980.7 + 541.8 b 2024.7 + 329.0 b
Feed consumed per hectare (kg ha-1) 5201.1 + 1238 a 3965.2 + 1037 a 4045.3 + 1104 a
Survival (%) 46.9 + 24.1 a 29.3 + 4.7 a 27.7 + 4.1 a Means with the same letter superscipt are not significantly different (P<0.05).

TECHNICAL REPORTS: INVESTIGATIONS 2009–2011
216
Table 2. Average minimum and maximum reading for water quality parameters in ponds of Nile tilapia grown out for 120 days under combined feed reduction strategies.
Parameters
67% daily feeding
until harvest
67% daily
feeding for 60
days, 50% daily
feeding until
harvest
67% daily feeding
for 60 days, 100%
alternate day
feeding until
harvest
Min Max Min Max Min Max
Dissolved Oxygen (9AM) (mg-L-1) 0.98 7.78 1.20 3.89 1.39 6.64
Dissolved Oxygen (3PM) (mg-L-1) 3.64 12.87 4.67 11.41 5.36 13.67
Water Temperature (9AM) (oC) 28.43 31.90 28.53 31.77 28.50 31.97
Water Temperature (3PM) (oC) 31.70 36.37 31.57 36.27 32.00 37.50
Hydrogen-Ion (pH) 7.07 8.37 6.97 8.20 6.93 8.27
Total Ammonia Nitrogen (mg L-1) 0.017 1.090 0.018 1.456 0.022 0.942
Nitrite-Nitrogen (mg L-1) 0.067 0.075 0.067 0.075 0.075 0.075
Secchi Disc Visibility (cm) 23.3 72.7 22.3 78.3 24.3 57.7

TECHNICAL REPORTS: INVESTIGATIONS 2009–2011
217
Table 3. Ingredients (inclusion rate in kg ton-1 of feed) and proximate composition of caloric balanced extruded grower test diets formulated with 31% crude protein (CP) or 26% CP supplemented with amino acids (AA) with 6% fishmeal and 0% fishmeal (fishmeal substituted with porkmeal).
RAW MATERIALS 31% CP with
6% fishmeal
26% CP + AA with
6% fishmeal
31% CP with
0% fishmeal
26% CP + AA with
0% fishmeal
Soybean Meal (HP) 45% 422.00 250.00 400.00 240.00 Corn Gluten 50.00 40.00 53.00 40.00 Hydrolyzed Animal Protein 30.00 30.00 30.00 30.00 Fishmeal Tuna 55% 60.00 60.00 0.00 0.00 Pork Meat Meal 55% 0.00 0.00 74.00 74.00 Copra Cake 73.00 111.20 76.00 135.00 Rice Bran 178.20 259.00 182.90 226.65 Cassava Meal 150.00 200.00 150.00 214.20 Fish Oil (Local) 5.50 5.00 5.00 5.00 Coconut Oil 5.00 15.00 5.00 10.00 Mono di-calcium phosphate 12.00 6.00 10.00 2.00 Salt 5.00 5.00 5.00 5.00 Mineral Premix 3.00 3.00 3.00 3.00 Vitamin Premix 6.30 5.80 6.10 5.80 L-Threonine 0.00 2.50 0.00 2.50 L-Lysine 0.00 6.00 0.00 5.25 DL-Methionine 0.00 1.50 0.00 1.60 TOTAL WEIGHT 1000.00 1000.00 1000.00 1000.00
DE Fish (kcal/kg) 2477.92 2455.75 2484.50 2443.86 Crude Protein (%) 30.99 25.71 31.07 25.66 Crude Fat (%) 6.21 6.87 6.23 6.67 Crude Fiber (%) 4.41 4.31 4.29 4.26 Starch (%) 17.36 22.33 17.40 22.57 Ash (%) 8.20 10.23 9.05 10.21 Ca (%) 0.96 0.94 0.91 0.92 Avail. Phosphorus (%) 0.67 0.64 0.66 0.64 Lysine (%) 1.51 1.50 1.50 1.49 Methionine (%) 0.54 0.54 0.50 0.53 Methionine+Cysteine (%) 0.97 0.87 0.96 0.89 Threonine (%) 1.06 1.05 1.07 1.07 Tryptophan (%) 0.33 0.25 0.42 0.34

TECHNICAL REPORTS: INVESTIGATIONS 2009–2011
218
Figure 2. Average weight of Nile tilapia grown in ponds and fed extruded grower test diets formulated with 31% crude protein (CP) or 26% CP supplemented with amino acids with 6% fishmeal and 0% fishmeal (fishmeal substituted with porkmeal). Fish were fed different diets during the last 60 days of the 120-day culture period in ponds. Treatment 1 – 31% CP with 6% fishmeal; Treatment 2 - 26% CP supplemented with amino acids with 6% fishmeal; Treatment 3 - 31% CP extruded feed with 0% fishmeal; Treatment 4 - 26% CP supplemented with amino acids with 0% fishmeal. All diets were extruded and least cost formulated.

TECHNICAL REPORTS: INVESTIGATIONS 2009–2011
219
Table 4. Summary on growth performance, survival and yield of Nile tilapia fed extruded grower test diets formulated with 31% crude protein (CP) or 26% CP supplemented with amino acids (AA) with 6% fishmeal and 0% fishmeal (fishmeal substituted with porkmeal). Fish were fed diets during the last 60 days of the 120-day culture period in earthen ponds.
PARAMETERS TREATMENTS
31% CP
with 6%
fishmeal
26% CP + AA
with 6%
fishmeal
31% CP
with 0%
fishmeal
26% CP + AA
with 0%
fishmeal
Initial Average weight (g) 0.162 + 0 0.162 + 0 0.162 + 0 0.162 + 0
Final Average Weight (g) 254.416 + 59.2 243.917 + 12 287.722 + 48.1 269.226 + 50.8
Initial Average Length (cm) 2.337 + 0 2.337 + 0 2.337 + 0 2.337 + 0
Final Average Length (cm) 22.3 + 1.3 22.1 + 0.2 23.3 + 1.2 22.7 + 1.1
Gain in Weight (g) 254.254 + 59.2 243.755 + 12 287.560 + 48.1 269.064 + 50.8
Daily Gain in Weight (g) 2.119 + 0.49 2.031 + 0.10 2.396 + 0.40 2.242 + 0.42
Specific Growth Rate (%) 6.118 + 0.19 6.097 + 0.04 6.227 + 0.15 6.169 + 0.16
Gain in Length (cm) 20.0 + 1.3 19.8 + 0.2 21.0 + 1.2 20.4 + 1.1
Daily Gain in Length (cm) 0.167 + 0.011 0.165 + 0.002 0.175 + 0.010 0.170 + 0.009
Feed Conversion Ratio 3.4 + 0.7 3.5 + 0.9 3.2 + 0.3 2.8 + 0.7
Feed Conversion Efficiency 30.5 + 6.7 30.3 + 9.1 31.0 + 2.5 37.0 + 9.1
Yield per Hectare (kgs/ha) 2036.0 + 501.8 1918.7 + 452.6 2183.3 + 242.7 2506.7 + 691.1
Feed consumed per Hectare (kgs/ha)
6651.5 + 624 6382.6 + 555 7017.0 + 210 6729.1 + 355
Survival (%) 20.3 + 6.6 20.6 + 5.0 19.1 + 2.3 23.3 + 5.9

TECHNICAL REPORTS: INVESTIGATIONS 2009–2011
220
Figure 3. Weekly pond temperatures of Nile tilapia fed extruded grower test diets formulated with 31% crude protein (CP) or 26% CP supplemented with amino acids with 6% fishmeal and 0% fishmeal (fishmeal substituted with porkmeal). Fish were fed different diets during the last 60 days of the 120-day culture period in ponds. Treatment 1 – 31% CP with 6% fishmeal; Treatment 2 - 26% CP supplemented with amino acids with 6% fishmeal; Treatment 3 - 31% CP extruded feed with 0% fishmeal; Treatment 4 - 26% CP supplemented with amino acids with 0% fishmeal.

TECHNICAL REPORTS: INVESTIGATIONS 2009–2011
221
Table 5. Minimum and maximum mean values of pond water quality parameters measured over a 120 day culture period in which fish were fed extruded grower test diets formulated with 31% crude protein (CP) or 26% CP supplemented with amino acids (AA) with 6% fishmeal and 0% fishmeal (fishmeal substituted with porkmeal). Fish were fed diets during the last 60 days of the 120-day culture period in earthen ponds.
PARAMETERS TREATMENTS
31% CP
with 6%
fishmeal
26% CP + AA
with 6%
fishmeal
31% CP
with 0%
fishmeal
26% CP + AA
with 0%
fishmeal
Dissolved Oxygen (mg- l-1) 1.98 – 6.10 2.09 – 6.25 2.03 – 6.39 2.98 – 6.36
Water Temperature (oC)
22.57 – 28.57 22.77 – 28.53 22.53 – 28.43 22.53 – 28.50
Hydrogen Ion Concentration (pH)
6.87 – 8.43 6.57 – 8.63 7.27 – 8.63 7.37 – 8.67
Alkalinity (mg- l-1) 172.67 – 251.00 169.33 – 248.33 190.67 – 284.00 171.00 – 243.00
Total Ammonia Nitrogen (mg- l-1) 0.045 – 0.827 0.031 – 0.817 0.047 – 0.876 0.045 – 0.846
Total Phosphorus (mg- l-1) 0.287 – 0.498 0.210 – 0.493 0.292 – 0.502 0.237 – 0.520
Carbon Dioxide Concentration (mg- l-1) 0.00 – 36.33 3.67 – 35.00 2.67 – 34.67 0.00 – 24.67
Total Hardness (mg- l-1) 122.67 – 146.67 126.67 – 142.00 141.33 – 171.33 113.33 – 132.00 Secchi Disc Visibility (cm) 24.33 – 43.00 21.00 – 33.67 16.67 – 32.00 15.33 – 45.33
Table 6. The composition of the basal tilapia grower diet used to assess inclusion of nutritive protein binders on pellet durability and water stability. CP, crude protein.
Ingredient % Calculated analysis
Corn 33.75 ME, kcal/kg 2650 Soybean meal (48 % CP) 25.00 Protein, % 25.50 Distillers Dried Grains w/ sol. 5.00 Ca, % 0.90 Rice bran 22.00 Available P, % 0.62 Poultry by-product meal, 65% CP 10.00 Total Lys, % 1.49 Poultry fat 0.50 Limestone 0.45 Dicalcium phosphate 1.55 L-Lysine 0.30 DL-Methionine 0.15 Salt 0.50 Vitamin premix 0.50 Choline chloride (60%) 0.10 Trace mineral premix 0.20

TECHNICAL REPORTS: INVESTIGATIONS 2009–2011
222
Table 7. Pellet quality and water stability of tilapia feed with the addition of pellet binder.
Binder
Treatment
NHPT
301
NHPT
602 PDI
2 adjPDI
3 PWS
4 PCS
5 MC
6
%
Control 96.4 93.1 97.8 84.5 50.1ab 10.5 12.7 Urea-formaldehyde (0.2%) 96.9 94.0 97.8 86.8 68.8d 10.5 12.7
Gelatin (0.1%) 96.5 93.1 97.3a 85.6 53.0ac 10.0 12.6
Wheat Gluten (2.0%) 96.9 93.8 98.0 87.3 60.0cd 10.2 12.8
Carob Bean 97.0 93.9 97.7 85.2 48.8a 10.2 13.4a
SEM 0.15 0.27 0.14 0.67 3.00 0.28 0.17 Source of Variation P-value 0.0588 0.0550 0.0468 0.0810 0.0004 0.7259 0.0423
Table 8. Pellet quality and water stability of tilapia feed with the addition of pellet binder.
Binder
Treatment
NHPT
301
NHPT
601
NHPT
901 PDI
2 MPDI
3 PWS
4 MC
6
%
Control 96.8 94.2 91.5a 97.5 91.1 68.2d 11.47 Wheat Gluten (WG – 2%) 96.9 94.3 91.8a 96.7 91.7 67.7d 11.36
Gelatin (G - 0.1%) 97.2 94.8 93.3b 97.7 91.9 72.8bc 11.53 Urea formaldehyde (UF – 0.2%)7 97.0 95.3 93.0ab 97.4 92.6 75.1ac 11.50
UF(0.2%) + G(0.1%) 97.2 95.5 93.5b 97.8 92.9 78.4a 11.53 UF(0.2%) + WG (2%) 96.8 95.0 92.7ab 97.6 92.1 69.1d 11.93 SEM 0.28 0.30 0.41 0.22 0.43 1.11 0.11 Source of variation P-value
0.9023 0.0806 0.0441 0.1495 0.1428 0.0005 0.0423
1New Holmen Pellet Tester at 68 mbar and 30, 60, or 90 seconds. 2Pellet durability index, ASAE S269.3 Cubes, Pellets and Crumbles - Definitions and Methods for Determining Density,
Durability, and Moisture Content. 3Modified pellet durability index ASAE S269.3 with the addition of three 19 mm hex nuts. 4Duplicate 50g samples of pellets from each treatment were place on a sieve with 3 mm diameter openings. The sample was
slowly immersed in deionized water (24oC) for 10 min. The sieve was removed from water and drained for 1 min, oven-dried at 105oC for 9 h, cooled in a desiccator, and reweighed. Pellet water stability (PWS) was calculated as the percentage difference in sample weight after re-weighing and expressed as % of dry matter.
5Pellet compression strength, which was determined with a manually operated compression pellet tester (Amandas Kahl Nachf, 2057 Reinbek. Germany).
6Moisture content, American Association of Cereal Chemists. 1995. AACC Method 44-15A: Moisture—Air-Oven Method. In Approved Methods of the American Association of Analytical Chemists. Vol. 2. AACC, St. Paul, MN.
7Not approved for aquaculture feeds in the United States.

TECHNICAL REPORTS: INVESTIGATIONS 2009–2011
223
Table 9. Ingredients (inclusion rate in kg ton-1 of feed) and proximate composition of caloric balanced floating extruded and slow-sinking pelleted grower test diets formulated with 31% crude protein (CP) or 26% CP supplemented with amino acids (AA). All diets contained 0% fishmeal (fishmeal substituted with porkmeal). Slow-sinking pelleted grower test diets contained 0.2% urea-formaldehyde + 0.1% gelatin to enhance pellet water stability and durability.
RAW MATERIALS Treatment I
31% CP floating
extruded feed
Treatment II
31% CP
slow-sinking
pelleted feed
Treatment III
26% CP
floating
extruded feed
Treatment IV
26% CP
slow-sinking
pelleted feed
Binder (%) Urea-Formaldehyde
0.00 2.00 0.00 2.00
Binder (%) Gelatin Based 0.00 1.00 0.00 1.00 Soybean Meal (HP) 45% 400.00 400.00 240.00 240.00 Corn Gluten 53.00 53.00 40.00 40.00 Hydrolized Animal Protein 30.00 30.00 30.00 30.00 Fishmeal Tuna 55% 0.00 0.00 0.00 0.00 Pork Meat Meal 55% 74.00 74.00 74.00 74.00 Copra Cake 76.00 76.00 135.00 135.00 Rice Bran 182.90 179.90 226.65 223.65 Cassava Meal 150.00 150.00 214.20 214.20 Fish Oil (Local) 5.00 5.00 5.00 5.00 Coconut Oil 5.00 5.00 0.00 0.00 Mono di-calcium phosphate 10.00 10.00 10.00 10.00 Limestone 0.00 0.00 2.00 2.00 Salt 5.00 5.00 5.00 5.00 Mineral Premix 3.00 3.00 3.00 3.00 Vitamin Premix 6.10 6.10 5.80 5.80 L-Threonine 0.00 0.00 2.50 2.50 L-Lysine 0.00 0.00 5.25 5.25 DL-Methionine 0.00 0.00 1.60 1.60 TOTAL WEIGHT 1000.00 1000.00 1000.00 1000.00
DE Fish (kcal/kg) 2,484.50 2,486.94 2,443.86 2,443.41 Crude Protein (%) 31.00 31.00 26.00 26.00 Crude Fat (%) 6.23 6.22 6.67 6.67 Crude Fiber (%) 4.29 4.25 4.26 4.24 Starch (%) 17.40 17.32 22.57 21.86 Ash (%) 9.05 8.91 10.21 9.32 Ca (%) 0.91 0.91 0.92 0.92 Avail. Phosphorus (%) 0.66 0.66 0.64 0.64 Lysine (%) 1.50 1.49 1.49 1.49 Methionine (%) 0.50 0.50 0.53 0.53 Methionine+Cysteine (%) 0.96 0.93 0.89 0.88 Threonine (%) 1.07 1.07 1.07 1.07 Tryptophan (%) 0.42 0.42 0.34 0.34

TECHNICAL REPORTS: INVESTIGATIONS 2009–2011
224
Figure 4. Average weight of Nile tilapia grown in ponds and fed floating extruded or slow-sinking pelleted, fishmeal-free grower test diets formulated with 31% crude protein (CP) or 26% CP supplemented with amino acids. Fish were fed different diets during the last 60 days of the 135-day culture period in ponds. Treatment 1 – 31% CP floating extruded feed; Treatment II - 31% CP slow-sinking pelleted feed; Treatment III - 26% CP floating extruded feed; Treatment IV - 26% CP slow-sinking pelleted feed. All diets were least cost formulated. Diets with 26% CP were supplemented with amino acids to provide similar amino acid profiles as the 31% CP diets. All slow-sinking pelleted diets contained 0.2% urea-formaldehyde and 0.1% gelatin to enhance pellet water stability.
Culture Period (days)

TECHNICAL REPORTS: INVESTIGATIONS 2009–2011
225
Table 10. Average weight of Nile tilapia grown in ponds and fed floating extruded or slow-sinking pelleted, fishmeal-free grower test diets formulated with 31% crude protein (CP) or 26% CP supplemented with amino acids. Fish were grown for 135 days and treatment diets were applied from day 75 until harvest. mean + SEM
PARAMETERS
Treatment I
31% CP
floating
extruded feed
Treatment II
31% CP
slow-sinking
pelleted feed
Treatment III
26% CP
floating
extruded feed
Treatment IV
26% CP
slow-sinking
pelleted feed
Initial Average Body Weight (g) 0.170 + 0.0 0.170 + 0.0 0.170 + 0.0 0.170 + 0.0
Final Average Body Weight (g) 180.667 + 3.01a 227.947 + 5.46b 237.457 + 7.87b 136.637 + 2.03c
Initial Average Total Length (cm) 2.288 + 0.0 2.288 + 0.0 2.288 + 0.0 2.288 + 0.0
Final Average Total Length (cm) 20.526 + 0.60a 21.110 + 0.15 a 21.033 + 0.21a 18.160 + 0.10 b
Daily Gain in Weight (g/day) 1.504 + 0.14 1.898 + 0.47 1.977 + 0.72 1.137 + 0.05
Daily gain in Total length (cm/day) 0.152 + 0.01 0.157 + 0.01 0.156 + 0.02 0.132 + 0.00
Specific Growth Rate (%) 5.800 + 0.08 5.948 + 0.21 5.932 + 0.29 5.573 + 0.04
Survival Rate (%) 48.4 + 2.20 44.7 + 11.6 42.1 + 11.6 50.6 + 3.9 Extrapolated Fish Yield per Hectare (kg/ha) 3214.0 + 194.0 3288.7 + 626.5 3026.7 + 147.3 2650.7 + 147.6
Extrapolated Feed Consumed per Hectare (kg/ha) 5986.6 + 238.5 6007.7 + 533.8 6062.1 + 633.2 5167.0 + 313.9
Feed Conversion Ratio 1.9 + 0.05 1.9 + 0.20 2.0 + 0.12 2.0 + 0.01
Feed Conversion Efficiency (%) 53.5 + 1.3 53.8 + 5.7 50.4 + 3.0 51.2 + 0.3

TECHNICAL REPORTS: INVESTIGATIONS 2009–2011
226
Table 11. Mean and range values for water quality parameters recorded weekly for Nile tilapia grown in ponds and fed floating extruded or slow-sinking pelleted, fishmeal-free grower test diets formulated with 31% crude protein (CP) or 26% CP supplemented with amino acids. Fish were grown for 135 days and treatment diets were applied from day 75 until harvest.
Parameters
Treatments
Treatment I
31% CP
floating
extruded feed
Treatment II
31% CP
slow-sinking
pelleted feed
Treatment III
26% CP
floating
extruded feed
Treatment IV
26% CP
slow-sinking
pelleted feed
DO (mg l-1) Mean 3.53 3.86 3.84 3.70 Min - Max 1.07-8.50 1.46-6.35 1.56-7.35 1.14-9.32
Temperature (oC) Mean 29.4 29.4 29.3 29.5 Min - Max 24.8-31.7 24.8-31.8 24.6-31.5 25.0-31.7
pH Mean 8.2 8.2 8.2 8.2 Min - Max 7.2-9.0 7.1-9.2 7.4-9.3 7.3-9.3
Total Alkalinity (mg l-1)
Mean 200.5 211.9 202.0 201.4 Min - Max 168.3-237.0 168.0-253.7 166.7-245.0 169.3-243.7
Total Ammonia Nitrogen (mg l-1)
Mean 0.090 0.094 0.084 0.083 Min - Max 0.007-0.199 0.018-0.238 0.012-0.237 0.009-0.174
Total Phosphorus (mg l-1)
Mean 0.323 0.394 0.347 0.378 Min - Max 0.120-0.685 0.173-0.675 0.142-0.628 0.200-0.677
Secchi Disc Visibility (cm)
Mean 25.9 24.5 26.2 24.2 Min - Max 16.7-76.7 18.0-63.3 17.3-73.3 19.3-73.3