february 18, 2009 an investigation into the recovery of...
TRANSCRIPT

T: 604.689.7902F: 604.689.7816TF: 1.800.667.0873
638 Millbank RoadVancouver, BC V5Z 4B7 CANADA
cumoco.com
February 18, 2009
An investigation into the recovery of Molybdenum, Copper and Silver from CuMO samples.SGS Canada Inc., Independent report

SGS Canada Inc. 50-655 West Kent Avenue North, Vancouver, BC, V6P 6T7 Tel: (604) 324-1166 Fax: (604) 324-1177 www.met.sgs.com www.ca.sgs.com
Member of the SGS Group (SGS SA)
An Investigation into
TTHHEE RREECCOOVVEERRYY OOFF MMOOLLYYBBDDEENNUUMM,, CCOOPPPPEERR AANNDD SSIILLVVEERR FFRROOMM CCUUMMOO SSAAMMPPLLEESS
prepared for
MMoossqquuiittoo CCoonnssoolliiddaatteedd GGoolldd MMiinneess LLttdd
Project 50004-001 February 18, 2009
NOTE: This report refers to the samples as received.
The practice of this Company in issuing reports of this nature is to require the recipient not to publish the report or any part thereof without the written consent of SGS Minerals Services.

Mosquito Consolidated Gold Mines – CUMO Project – CAVM-50004-001
SGS Minerals Services
1
Table of Contents
Page No.
Table of Contents 1
List of Figures 3
List of Tables 5
List of Tables 5
Executive Summary 6
Introduction 10
Testwork Summary 11
1 Sample Receipt and Preparation ......................................................................................11
1.1 Head Assay...............................................................................................................12
2 Grindability Testing .........................................................................................................13
2.1 SPI Testing ...............................................................................................................13
2.2 Bond Ball Mill Work Index Testing .........................................................................14
3 QEMSCAN Mineralogy ..................................................................................................15
3.1 Methodology ............................................................................................................15
3.2 Quality Control ........................................................................................................16
3.3 Bulk Modal Mineral Abundance ..............................................................................17
3.4 Copper Mineral Liberation......................................................................................22
3.5 Molybdenum Mineral Liberation .............................................................................24
4 Flotation Testing ..............................................................................................................26
4.1 Composite 1: Cu – Ag Zone Testing .......................................................................26
4.1.1 Rougher testing of composite 1 ........................................................................26
4.1.2 Cleaner Testing of Composite 1 .......................................................................28
4.1.3 Locked cycle testing of composite 1 ................................................................33
4.2 Composite 2: Cu – Mo Zone Testing .......................................................................34
4.2.1 Rougher testing of composite 2 ........................................................................34
4.2.2 Cleaner testing of composite 2 .........................................................................37
4.2.3 Locked cycle testing of composite 2 ................................................................40
4.3 Composite 3: Mo Zone Testing ................................................................................43
4.3.1 Rougher testing of composite 3 ........................................................................43
4.3.2 Cleaner testing of composite 3 .........................................................................45
4.3.3 Locked cycle testing of composite 3 ................................................................49
5 Environmental Testing.....................................................................................................50

Mosquito Consolidated Gold Mines – CUMO Project – CAVM-50004-001
SGS Minerals Services
2
6 Ancillary Testing .............................................................................................................51
6.1 Product Characterization ........................................................................................51
6.2 Tungsten Recovery ...................................................................................................52
7 Conclusions......................................................................................................................53
7.1 Samples ....................................................................................................................53
7.2 Cu – Ag Zone ore .....................................................................................................53
7.3 Cu – Mo Zone ore ....................................................................................................54
7.4 Mo Zone ore .............................................................................................................55
7.5 Environmental Testing .............................................................................................56
7.6 Ancillary Testing ......................................................................................................57
8 Recommendations............................................................................................................57
Appendices 59

Mosquito Consolidated Gold Mines – CUMO Project – CAVM-50004-001
SGS Minerals Services
3
List of Figures
Page No.
Figure 1: Ore Zones and Depth of Drill Hole ..........................................................................11
Figure 2: CUMO SAG Grindability vs. SGS Global Database ...............................................14
Figure 3: QEMSCAN vs. Chemical Assay Reconciliation .....................................................16
Figure 4: QEMSCAN vs. Chemical Cu Assay Reconciliation................................................17
Figure 5: Secondary Copper Content in CUMO, vs. SGS Global Cu ore Database ...............19
Figure 6: Pyrite Content in CUMO, vs. SGS Global Cu and Mo Ore Databases....................19
Figure 7: Clay Content in CUMO, vs. SGS Global Cu and Mo Ore Databases......................20
Figure 8: Mica Content in CUMO, vs. SGS Global Cu and Mo Ore Databases .....................21
Figure 9: Talc/Amphibole Content in CUMO, vs. SGS Global Cu and Mo Ore Databases ...22
Figure 10: Release Analysis of CUMO Chalcopyrite (black) vs. Global Cu database (red)...23
Figure 11: Image Grid describing CUMO Cu Liberation........................................................24
Figure 12: CUMO Molybdenite Release Analysis, vs. SGS Global Mo Ore Database ..........25
Figure 13: Image Grid describing Release Characteristics of CUMO Molybdenite: Mo
Composite (Composite 3) ........................................................................................................25
Figure 14: Rougher Kinetics of Composite 1 ..........................................................................27
Figure 15: Grade and recovery of Cu of Composite 1.............................................................28
Figure 16: Grade and Recovery of Mo and Ag of Composite 1..............................................28
Figure 17: Cleaner testing flow-sheet ......................................................................................29
Figure 18: Grade and cleaner recovery of Copper of composite 1 ..........................................30
Figure 19: Grade and cleaner recovery of Molybdenum of composite 1 ................................31
Figure 20: Grade and cleaner recovery of Silver of composite 1 ............................................32
Figure 21: Locked cycle test flow-sheet ..................................................................................33
Figure 22: The stability of the locked cycle test of composite 1 .............................................34
Figure 23: Flotation kinetics of composite 2 ...........................................................................35
Figure 24: Grade and rougher recovery of Cu of Composite 2 ...............................................36
Figure 25: Grade and rougher recovery of Mo and Ag of Composite 2..................................37
Figure 26: Grade and cleaner recovery of Copper of composite 2 ..........................................38
Figure 27: Grade and cleaner recovery of Molybdenum of composite 2 ................................40
Figure 28: Grade and cleaner recovery of Silver of composite 2 ............................................40
Figure 29: The stability of the locked cycle test of composite 2 .............................................42
Figure 30: Flotation kinetics of composite 3 ...........................................................................43
Figure 31: Grade and rougher recovery of Cu of composite 3 ................................................44
Figure 32: Grade and rougher recovery of Mo and Ag of composite 3...................................45
Figure 33: Concentrate grade vs recovery of Cu from composite 3 ........................................46

Mosquito Consolidated Gold Mines – CUMO Project – CAVM-50004-001
SGS Minerals Services
4
Figure 34: Concentrate grade vs recovery of Molybdenum from composite 3 ......................47
Figure 35: Concentrate grade vs recovery of Ag from composite 3........................................48
Figure 36: The stability of the locked cycle test of composite 3 .............................................50

Mosquito Consolidated Gold Mines – CUMO Project – CAVM-50004-001
SGS Minerals Services
5
List of Tables
Page No.
Table 1: Calculated Assays of the Composites........................................................................12
Table 2: Head Assays...............................................................................................................12
Table 3: SPI and Crusher Index Test Results ..........................................................................13
Table 4: Bond Ball Mill Work Index Results ..........................................................................15
Table 5: QEMSCAN-derived Modal Mineralogy ...................................................................17
Table 6: Cleaner testing parameters.........................................................................................29
Table 7: Metallurgical prediction for composite 1 ..................................................................33
Table 8: Cleaner testing parameters of composite 2................................................................38
Table 9: Metallurgical prediction for composite 2 ..................................................................41
Table 10: Composite 3 Cleaner Testing Parameters................................................................46
Table 11: Metallurgical Prediction for Composite 3 ...............................................................49
Table 12: ABA Test Results ....................................................................................................51
Table 13: Characterization assays of final concentrate and rougher tail .................................51
Table 14: WO3 response in a gravity circuit ............................................................................52

Mosquito Consolidated Gold Mines – CUMO Project – CAVM-50004-001
SGS Minerals Services
6
Executive Summary
This test program was performed on samples from the CUMO property in Idaho, USA. The
scoping program was intended to provide preliminary information on the behaviour of the ores in
terms of grindability and flotation separation.
Three composites representing three ore zones, Cu/Ag, Cu/Mo and Mo, were prepared from 115
core lengths received from three drill holes.
Cu/Ag ore:
The average head grade of the composite was 0.15% Cu and 0.017% Mo. The ore was amenable
to SAG grinding with an SPI of 84.5 minutes, and had a Bond Ball Mill Work Index of 15.8
kWh/tonne. The QEMSCAN analysis found fine-grained chalcopyrite to be the principal Cu
carrier. With little or no pyrite or talc, mineralogy predicted an easy separation process.
However, a cautionary note was issued due the significant presence of micaceous material, as
this will dilute concentrates without froth washing in the cleaners.
During rougher testing at a grind of K80 of 63 µm, 73% of the Cu, 86% of the Mo and 76% of the
Ag were recovered. Finer grind improved Cu metallurgy more than Mo or Ag. Reagents
appeared to be the only option to improve Mo and Ag.
During cleaner testing, under optimized conditions in 3 stages of open circuit cleaning, 64% of
the Cu was recovered to a grade of 15% Cu. The concentrate also carried 84% of Mo and 65%
of the Ag. The poor Cu recovery was likely due to low feed grade (and accordingly small
concentrate weights in the tests) and poor liberation. However, the upgrading ratios indicate that
a saleable grade of Cu concentrate can be made from this composite. To improve cleaner
metallurgy, the composite required a re-grind finer than K90 of 20 µm. A conventional reagent
suite was sufficient to processes the composite. The behaviour of tungsten was not assessed as it
could not be accurately measured due to its low assay. It was estimated that the composite
carried ~ 30 to 40 g/t of Tungsten and about 90% of it reported to the rougher tail.
The projected metallurgy of the locked cycle test consisting of three stages of cleaning, was a
recovery of 63% of the Cu to a grade of 13% Cu. The concentrate also carried 82% of the Mo

Mosquito Consolidated Gold Mines – CUMO Project – CAVM-50004-001
SGS Minerals Services
7
and 72% of the Ag. The circuit was stable and again the major loss occurred at the rougher
stage. Incomplete liberation at the primary grind stage was suspected to be the cause.
Cu/Mo ore:
The average head grade of this composite which constitutes a major part of the resource, was
0.13% Cu and 0.04% Mo. The ore was amenable to SAG grinding with a SPI index of 73
minutes, and had a Bond Ball Mill Work Index of 15.7 kWh/tonne. Again, QEMSCAN showed
fine-grained chalcopyrite to be the principal Cu carrier and fine grained molybdenum the
principal Mo carrier. Little or no pyrite or talc was found and mineralogy predicted an easy
separation process. However, a cautionary note was issued due to the presence of abundant
mica.
The rougher recovery of the Cu, Mo and Ag of this composite were independent of the grinds
tested (range of K80 of 61 to 106 µm). The rougher recovered 89% of the Cu, 93% of the Mo
and 75% of the Ag. A coarser grind produced better Cu rougher concentrate grade and recovery.
Mo and Ag did not follow suite.
During cleaner testing, under optimized conditions, 87% of Cu was recovered to a concentrate
grade of 17% Cu. The concentrate also carried 90% of Mo and 70% of the Ag. The incomplete
Cu recovery was likely due to low feed grade and poor liberation. The upgrading ratios assured
that saleable Cu and Mo concentrates can be made by added cleaning stages. For better cleaner
metallurgy, the composite required a re-grind finer than K96 of 20 µm. A generic reagent suite
was sufficient to processes the composite. The behaviour of Tungsten was not assessed as it
could not be accurately measured due to low availability. It was estimated that the composite
carried ~ 30 to 40 g/t of Tungsten and about 90% of it reported to the rougher tail.
The projected metallurgy of the locked cycle test consisting of three stages of cleaning, was a
collection of 88% of the Cu to a grade of 16% Cu. The concentrate also carried 94% of the Mo
and 80% of the Ag. The circuit was stable and again the major loss occurred at the rougher
stage. Incomplete liberation at the primary grind stage was suspected to be the cause.
Mo ore:

Mosquito Consolidated Gold Mines – CUMO Project – CAVM-50004-001
SGS Minerals Services
8
Primary Mo ores constitute much of the deposit. The average head grade of the composite was
0.035% Cu and 0.12% Mo. This composite was softer than the others, amenable to SAG
grinding with a SPI index of 70.8 minutes and had a Bond Ball Mill Work Index of 12.6
kWh/tonne. Fine-grained chalcopyrite was the principal Cu carrier and fine grained molybdenite
was that of Mo. Little or no pyrite or talc was found and mineralogy predicted an easy
separation process. However, significant mica was again in evidence.
The rougher recovery of the Cu, Mo and Ag of this composite were dependent of the grind and at
the finer grind of K80 of 62 µm, recovered 83% of the Cu, 96% of the Mo and 72% of the Ag.
During cleaner testing, under optimized conditions, 94% of the Mo was recovered to a grade of
24% Mo. The concentrate also carried 77% of Cu and 52% of the Ag. The poor Cu recovery
was likely due to low feed grade and poor liberation while the lower concentrate grades were due
to low feed grade, insufficient liberation and fewer cleaning stages. The upgrading ratios
indicate that Cu and Mo concentrates of saleable grades can be made by added cleaning stages.
The re-grind size required was finer than K96 of 20 µm. A conventional reagent suite and
flowsheet was sufficient to processes the composite. The behaviour of Tungsten as not assessed
as it could not be accurately measured at the levels present in the sample and using the analytical
methods applied. It was estimated that the composite carried ~ 50 to 80 g/t of Tungsten and
about 90% of it reported to the rougher tail.
The projected metallurgy of the locked cycle test consisting of three stages of cleaning, included
the recovery of 96% of the Mo to a grade of 22% Mo. The concentrate also carried 82% of the
Cu and 59% of the Ag. The circuit was stable and again the major loss occurred at the rougher.
The re-grind size was suspected to be the reason for low concentrate grade.
Environmental Testing:
Environmental data are included in this report.
Product Characterization:
The Ga of all final concentrates and the rougher tailings were less than 0.004 %, except the final
concentrate of the Mo zone which carried 0.005% Ga. The Os of all the final concentrates were
less than 0.03 g/t and Re were 0.9, 2.9 and 15 g/t respectively.

Mosquito Consolidated Gold Mines – CUMO Project – CAVM-50004-001
SGS Minerals Services
9
Tungsten Recovery:
In a gravity separation test, 26.3% of WO3 were recovered from flotation tailings to a grade of
4.6% WO3.
Recommendations:
The responses to flotation of the composites were similar and we recommend that a single
composite will be sufficient for future flowsheet development test work. Also, that test work
should be on 10 kg feed stages with more than 3 stages of cleaning. A variability test program to
study the mineralogy and the behaviour of Cu-Ag composite is also recommended.

Mosquito Consolidated Gold Mines – CUMO Project – CAVM-50004-001
SGS Minerals Services
10
Introduction
This report describes scoping level testwork completed for Mosquito Consolidated Gold Mines
Ltd. Idaho, USA. The testwork investigated the flotation options for the recovery of copper,
molybdenum and silver minerals from the CUMO property in Idaho. The scope of the program
involved sample preparation, grindability testing, mineralogical characterization via QEMSCAN
analysis, rougher kinetics testing, batch cleaner testing, locked cycle testing and environmental
testing on three samples from the property. The project also included an examination of the
concentrate for rare minerals and an evaluation of a gravity separation process for the recovery
of tungsten. All work referenced in this report was completed under the internal SGS project
number of 50004-001.
The primary goal of the testwork was to investigate the metallurgy of the ores and to perform
scoping level testwork. All test results and conditions are presented in the accompanying
Appendices. The results refer to samples as received. The testing program was completed over
the months of June 2008 to January 2009. Mr. Shaun Dykes of Mosquito Consolidated Gold
Mines, was regularly updated with new results as the testing progressed.
Sarath Ratnayake
Project Manager, Vancouver Metallurgy
Chris J. Martin, C.Eng
General Manager, Vancouver Metallurgy
Experimental in Vancouver work by: Wei Meng and Sarath Ratnayake
Report preparation by: Sarath Ratnayake

Mosquito Consolidated Gold Mines – CUMO Project – CAVM-50004-001
SGS Minerals Services
11
Testwork Summary
1 Sample Receipt and Preparation
A shipment of 115 core lengths from three drill holes sent by Mosquito Consolidated Gold, was
received at SGS Vancouver Metallurgy for the test work. They weighed a total of 746 kg and
arrived with instructions to make three composites representing the three distinct ore types.
The ore types were identified as Cu-Ag zone (Composite 1), Cu-Mo zone (Composite 2) and Mo
zone (Composite 3). The formation of the ore zones bears a linear relationship to the horizon
and confirmed the flexibility to mine and process the three zones separately. The formation is
presented in Figure 1.
Depth Vs. O re Zones
-1600
-1400
-1200
-1000
-800
-600
-400
-200
0
Dril l Hole - #
Dri
ll H
ole
Dep
th -
Ft
Gangue Cu/Ag Zone Cu/Mo Zone Mo Zone
Hole # 27 Hole # 28 Hole # 29
Figure 1: Ore Zones and Depth of Drill Hole
The zones of similar ore types were combined to make the three composites. A detailed
description of the samples indicating the drill hole number, core length, sample number and

Mosquito Consolidated Gold Mines – CUMO Project – CAVM-50004-001
SGS Minerals Services
12
weights are presented in the Appendix A. Table 1 shows the anticipated assays arrived after
calculating the weighted average of the composites.
Table 1: Calculated Assays of the Composites
Cu - % Mo - % Ag – g/t
Composite 1 0.17 0.0314 4.15
Composite 2 0.012 0.0674 2.82
Composite 3 0.03 0.1736 1.06
In preparation, the composites were crushed to 38 mm, homogenized and a 10 kg sample was
split out from each sample for SAG Power Index (SPI) test. Crushing was continued to 6 mm,
homogenized and approximately 40 kg was split out for the working composites and the
remainder stored. The selected sample was staged crushed down to minus 6 mesh and
homogenized before splitting out 10 kg for the Bond work index test work. The rest were
crushed to minus 10 mesh, homogenized and 2 kg charges for metallurgical test work were
prepared. The sample preparation flow-sheet is presented in the Appendix A.
1.1 Head Assay
The three composites were assayed for Cu, Mo, Fe and S in triplicate and the results are
presented below in Table 2.
Table 2: Head Assays
Sample Description Sample ID Cu - % Mo - % Fe - % S - %
Comp.1 – A 0.15 0.016 1.71 0.20
Comp.1 – B 0.16 0.018 1.46 0.21 Cu – Ag Zone
Comp.1- C 0.15 0.018 1.41 0.21
Average 0.15 0.017 1.53 0.21
Comp. 2 – A 0.12 0.04 1.18 0.22
Comp. 2 – B 0.13 0.04 1.10 0.21 Cu – Mo Zone
Comp. 2 – C 0.13 0.04 1.14 0.21
Average 0.13 0.04 1.14 0.21
Mo Zone Comp. 3 – A 0.039 0.12 0.89 0.15

Mosquito Consolidated Gold Mines – CUMO Project – CAVM-50004-001
SGS Minerals Services
13
Comp. 3 – B 0.036 0.12 0.88 0.14
Comp. 3 – C 0.029 0.11 0.90 0.14
Average 0.035 0.12 0.89 0.14
The chemical analyses of Cu were in fair agreement with those of the calculated Cu assays of the
composites. However, the chemical analyses of the Mo were markedly lower than the expected
Mo assays.
2 Grindability Testing
The grindability test work conducted on the CUMO composites include the SPI testing and the
Bond ball mill work indices.
2.1 SPI Testing
This test measured the SAG Power Index (SPI®), and Crusher Index. The SPI® is a measure of
the hardness of the ore from the perspective of semi-autogenous milling. The CEET Crusher
Index (CEET Ci) is used to predict the SAG feed size distribution of the ore, and is measured
during the SPI® feed preparation procedure. It required 10 kg of minus 50 mm material that was
prepared at the testing facility.
The results of the SPI and the Crusher index of each of the composites are shown below in Table
3.
Table 3: SPI and Crusher Index Test Results
SAG Power Index Crusher Index
Composite Description Minutes kWh/t
Composite 1; Cu – Ag Zone 84.5 11
Composite 2; Cu – Mo Zone 73.0 15
Composite 3: Mo Zone 70.8 16

Mosquito Consolidated Gold Mines – CUMO Project – CAVM-50004-001
SGS Minerals Services
14
In the global SPI database of five categories (very soft, soft, medium, hard and very hard), the
CUMO composites can be classified as “medium”. Elaborating further, Figure 2 shows the
positions of the CUMO SPI results in the global database. The composites 1, 2 and 3 were in the
59th
, 51st and 49
th percentiles respectively. The results of the Crusher Index showed a similar
relationship. Details of the SPI and Crusher Index tests can be found in Appendix B.
0
200
400
600
800
1000
1200
1400
1600
1800
10
30
50
70
90
11
0
13
0
15
0
17
0
19
0
21
0
23
0
25
0
27
0
>2
80
SPI - Minutes
Freq
uen
cy
0
10
20
30
40
50
60
70
80
90
1000 .0 5 0 .0 1 0 0 .0 1 5 0 .0 2 0 0 .0 2 5 0 .0
Cu
mu
lati
ve F
req
uen
cy (
%)
Database
Mosquito
Figure 2: CUMO SAG Grindability vs. SGS Global Database
2.2 Bond Ball Mill Work Index Testing
As part of the grindability test program, the Bond ball mill grindability test was performed
according the standard Bond procedure. It required 10 kg of minus 6-mesh material. The Bond
ball mill work index has been widely used for mill sizing, and is also utilized in computer
simulation, and variability testing.
The Bond ball mill work indices from the three tests, run with a closing screen size of 150
microns are displayed below in Table 4

Mosquito Consolidated Gold Mines – CUMO Project – CAVM-50004-001
SGS Minerals Services
15
Table 4: Bond Ball Mill Work Index Results
Bond Ball Mill Work Index
Composite Description Metric – kWh/tonne Imperial – kWh/ton
Composite 1; Cu – Ag Zone 15.8 14.3
Composite 2; Cu – Mo Zone 15.7 14.3
Composite 3; Mo Zone 12.6 11.4
The results indicated that composites 1 and 2 were medium-hard while the composite 3 was
softer than the others. Details of the Bond ball mill work index testing can be found in Appendix
B.
3 QEMSCAN Mineralogy
3.1 Methodology
A total of 8 polished sections were prepared for analysis by QEMSCAN. The analytical methods
used were Bulk Modal Analysis and Sparse Mineral Search:
Bulk Modal Analysis: This is a “line scan” analysis of the
polished section – where analyses are conducted every 2-6
microns (depending on the size fraction) along lines spaced
apart the same distance as the top-sized particles.
Sparse Mineral Search: This form of analysis uses the
rapid back scattered electron detection method to pre-select
candidate particles likely containing the target minerals,
then the high definition X-Ray detection methodology to
fully define the associated particle.
The operating statistics pertaining to the present analyses are shown in Table 5. A total of 552
thousand points were analysed by bulk modal analysis, while 3,174 copper and molybdenum-
x x x x x x x x x x x x x x x x x x x x x x x x x x x
x x x x x x x x x x x x x x x x x x x x x x x x x x x x x x x x x x x x x
x x x x x x x x x x x x x x x x x x x x x x x x xx x x x x x x x x x x x x x x x
x x x x x x x x x x x x x x x x x x x x x x x x x x x xx x x x x x x x x x x x x x x x
x x x x x x x x x x x x x x x x x x x x x x x x x x x x xx x x x x x x x x x x x x x x x
x x x x x x x x x x x x x x x x x x x x x x x x x x x x xx x x x x x x x x x x x x x x x
x x x x x x x x x x x x x x x x x x x x x x x x x x xx x x x x x x x x x x x x x x x
x x x x x x x x x x x x x x x x x x x x x x x x x xx x x x x x x x x x x x x x x x
x x x x x x x x x x x x x x x x x x x x x x x xx x x x x x x x x x x x x x x x
x x x x x x x x x x x x x x x x x x x x x xx x x x x x x x x x x x x x x x
x x x x x x x x x x x x x x x x x x x x x x xx x x x x x x x x x
x x x x x x x x x x x x x x x x x x xx x x x x x x x x
X-ray analysis
x BSE analysis

Mosquito Consolidated Gold Mines – CUMO Project – CAVM-50004-001
SGS Minerals Services
16
bearing particles were found and analysed in detail by QEMSCAN using the Sparse Mineral
Search routine on the three samples. A total of 12 polished sections were studied at a resolution
ranging from 2 to 4 microns.
3.2 Quality Control
The QEMSCAN operates by translating X-ray spectra into mineral identification using a
reference mineral library system – known as the Specimen Identification Protocol (SIP). While
basic SIPs are available within the SGS network for all ore types, they need to be tailored for
each ore, through a set-up methodology. The accuracy of this resulting SIP, together with the
statistical sufficiency of the data is tested by reconstituting the chemical analysis from the
mineralogy, and comparing with the assayed head. This is shown in Figure 3 below: A slope
close to 1 and a correlation R2 of in excess of 0.99 is good. Specifically, reconciliation of the
copper (always somewhat weaker with low grade samples) was excellent for all but four of the
size fractions analysed (Figure 4).
Assay Reconciliation
y = 0.9842x + 0.0946
R2 = 0.9961
0
10
20
30
40
50
0 10 20 30 40 50
QEMSCAN Assay (%)
Ch
em
ica
l A
ssay (
%)
Na
Mg
Al
Si
S
K
Ca
Ti
Fe
Cu
Mo
R2
Power (Mg)
Linear (R2)
Figure 3: QEMSCAN vs. Chemical Assay Reconciliation

Mosquito Consolidated Gold Mines – CUMO Project – CAVM-50004-001
SGS Minerals Services
17
0.00
0.05
0.10
0.15
0.20
0.25
0.30
0.00 0.05 0.10 0.15 0.20 0.25 0.30
QEMSCAN Cu assay, %
Chem
ical C
u a
ssay, %
Figure 4: QEMSCAN vs. Chemical Cu Assay Reconciliation
3.3 Bulk Modal Mineral Abundance
The QEMSCAN-derived host rock mineralogy is shown in Table 5.
Table 5: QEMSCAN-derived Modal Mineralogy
% Abundance Comp. 1 Comp. 2 Comp. 3
Chalcopyrite 0.5 0.4 0.1
Pyrite 0.3 0.1 0.1
Molybdenite 0.04 0.05 0.1
Other Sulphides 0.03 0.02 0.01
Quartz 37.4 36.1 41.3
K-Feldspar 35.5 39.3 34.6
Micas 20.2 18.4 19.4
Garnet 0.1 0.1 0.1
Amphiboles 0.4 0.4 0.9
Clays 1.9 1.9 1.0
Chlorites 2.0 1.3 0.7
Fe Oxides/Oxyhydroxides 0.3 0.1 0.2
Ti Oxides 0.3 0.2 0.2
Calcite 0.8 1.2 1.0
Apatite 0.2 0.1 0.1
Other 0.1 0.1 0.05

Mosquito Consolidated Gold Mines – CUMO Project – CAVM-50004-001
SGS Minerals Services
18
The following data analysis describes the CUMO data, and compares it with equivalent Modal
Analytical data form our master database of 35 disseminated copper ores and 10 primary Mo
ores. These ores range from large high-profile existing operations, mainly in Americas, such as
Las Pelambres, Andina, Collahuasi, Kemess and Robinson to developing projects such as
Pebble, Prosperity, Afton, La Arena, Mirador, Mount Hope and Storie. Respecting the need for
project confidentiality, individual projects are not cited, instead, the specific mineralogical
parameters pertaining to the CUMO data are rated against the overall dataset and probable
implications are described.
The CUMO ores are quartz-feldspar assemblages with a significant micaceous component. They
contain no measurable secondary copper mineralisation – essentially all the copper
mineralisation is in the form of chalcopyrite (Figure 5). Secondary copper mineralisation,
especially in conjunction with pyrite, normally requires high pH flotation. This is not the case
with CUMO, where a pH of 9-10 (within the optimal range for chalcopyrite flotation) is
recommended.
The pyrite content as shown in Figure 6, is also low when compared with our database of either
Mo ores or disseminated Cu ores. Pyrite can float freely into rougher and indeed in some cases
cleaner concentrates, and this needs to be controlled through a high pH environment. The lack of
pyrite again points to a mildly alkaline pH environment (pH 8-10) being optimal:

Mosquito Consolidated Gold Mines – CUMO Project – CAVM-50004-001
SGS Minerals Services
19
0.00
0.05
0.10
0.15
0.20
0.25
0.30
0.35
0.40
10 20 30 40 50 60 70 80 90
Percentile
Seco
nd
ary
co
pp
er
co
nte
nt,
%
Figure 5: Secondary Copper Content in CUMO, vs. SGS Global Cu ore
Database
0
2
4
6
8
10
12
14
16
10 20 30 40 50 60 70 80 90
Percentile
Pyri
te c
on
ten
t, %
0
2
4
6
8
10
12
14
10 20 30 40 50 60 70 80 90
Percentile
Py
rite
co
nte
nt,
%
(a) Cu ore Database (b) Mo ore Database
Figure 6: Pyrite Content in CUMO, vs. SGS Global Cu and Mo Ore
Databases

Mosquito Consolidated Gold Mines – CUMO Project – CAVM-50004-001
SGS Minerals Services
20
The Clay/kaolinite content is benchmarked in Figure 7. Certain clays act as ion exchange agents,
consuming reagents. They are often charged, causing them to repel each other, resisting
flocculation and coagulation, causing settling problems in return water systems and hence poor
water quality. Finally, those same surface charges can attract them to the anionic sulphide
surfaces, which can adversely affect sulphide flotation. High levels of clay, especially if seen in
conjunction with poor flotation performance, can lead to the need to speciate the clays using
XRD, so the water chemistry can be modified to handle them. This appears not to be necessary
in this case, with the CUMO ores being largely free from clays.
0
1
2
3
4
5
6
7
8
10 20 30 40 50 60 70 80 90
Percentile
Cla
ys c
on
ten
t, %
0.0
0.5
1.0
1.5
2.0
2.5
3.0
3.5
4.0
4.5
5.0
10 20 30 40 50 60 70 80 90
Percentile
Cla
y c
on
ten
t, %
(a) Cu ore Database (b) Mo ore Database
Figure 7: Clay Content in CUMO, vs. SGS Global Cu and Mo Ore Databases
The proportion of micas in the CUMO ore is benchmarked in Figure 8. Micaceous material does
not affect flotation chemistry as clays do, but they do have a tendency to be entrapped in
concentrates, and micaceous ores are accordingly quite difficult to clean. Froth washing is

Mosquito Consolidated Gold Mines – CUMO Project – CAVM-50004-001
SGS Minerals Services
21
needed to flush the micas out from the concentrate, so high levels of micas usually point to a
need to include column flotation, at least, as a final stage of cleaning. Alternatively, extra stages
of cleaning are recommended. The master composites contain a relatively (but not unusually)
high proportion of micaceous material. We would recommend the inclusion of column flotation
as a final stage of cleaning in this case.
0
5
10
15
20
25
10 20 30 40 50 60 70 80 90
Percentile
Mic
a c
on
ten
t, %
0
5
10
15
20
25
30
10 20 30 40 50 60 70 80 90
Percentile
Mic
a c
on
ten
t, %
(a) Cu ore Database (b) Mo ore Database
Figure 8: Mica Content in CUMO, vs. SGS Global Cu and Mo Ore
Databases
The talc/amphibole content in the CUMO composites is benchmarked against the databases in
Figure 9. There is relatively little talc/amphibole – high levels of, especially, talc usually lead to
the use of high-priced polymeric depressants in the cleaner circuit (and occasionally the
rougher). They will not be needed in this case.

Mosquito Consolidated Gold Mines – CUMO Project – CAVM-50004-001
SGS Minerals Services
22
0
2
4
6
8
10
12
14
10 20 30 40 50 60 70 80 90
Percentile
Talc
/am
ph
ibo
le c
on
ten
t, %
0
2
4
6
8
10
12
14
10 20 30 40 50 60 70 80 90
Percentile
Ta
lc/A
mp
hib
ole
co
nte
nt,
%
(a) Cu ore Database (b) Mo ore Database
Figure 9: Talc/Amphibole Content in CUMO, vs. SGS Global Cu and Mo
Ore Databases
3.4 Copper Mineral Liberation
The release analysis (% copper mineral liberation as a function of host particle size) is a useful
tool for defining the likely target range for the primary grind and the concentrate regrind to
achieve adequate selective mineral recovery. Further, the nature of the curve at the fine end
points either limits in concentrate grade or recovery.
The release analysis for CUMO chalcopyrite is shown against the database in Figure 10. CUMO
chalcopyrite is relatively fine-grained compared to our database of disseminated Cu ores.
Typically, most primary grind sizes K80’s are optimal at a size equivalent to 30-40% mineral
liberation. Using these criteria, an optimal primary grind of 50-60 microns is indicated.
However, given the relatively low per-tonne contained value of the material, a coarser grind may
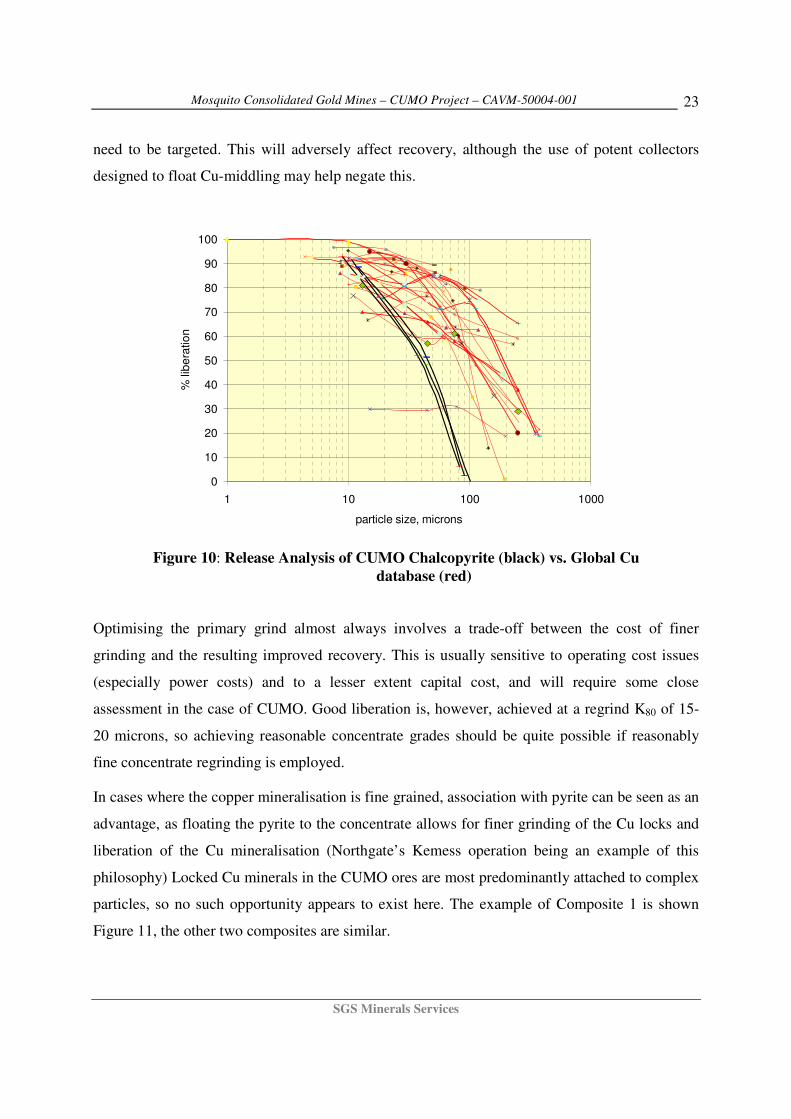
Mosquito Consolidated Gold Mines – CUMO Project – CAVM-50004-001
SGS Minerals Services
23
need to be targeted. This will adversely affect recovery, although the use of potent collectors
designed to float Cu-middling may help negate this.
0
10
20
30
40
50
60
70
80
90
100
1 10 100 1000
particle size, microns
% lib
era
tio
n
Figure 10: Release Analysis of CUMO Chalcopyrite (black) vs. Global Cu
database (red)
Optimising the primary grind almost always involves a trade-off between the cost of finer
grinding and the resulting improved recovery. This is usually sensitive to operating cost issues
(especially power costs) and to a lesser extent capital cost, and will require some close
assessment in the case of CUMO. Good liberation is, however, achieved at a regrind K80 of 15-
20 microns, so achieving reasonable concentrate grades should be quite possible if reasonably
fine concentrate regrinding is employed.
In cases where the copper mineralisation is fine grained, association with pyrite can be seen as an
advantage, as floating the pyrite to the concentrate allows for finer grinding of the Cu locks and
liberation of the Cu mineralisation (Northgate’s Kemess operation being an example of this
philosophy) Locked Cu minerals in the CUMO ores are most predominantly attached to complex
particles, so no such opportunity appears to exist here. The example of Composite 1 is shown
Figure 11, the other two composites are similar.

Mosquito Consolidated Gold Mines – CUMO Project – CAVM-50004-001
SGS Minerals Services
24
Figure 11: Image Grid describing CUMO Cu Liberation
Cu/Ag Composite (Composite 1)
3.5 Molybdenum Mineral Liberation
The release analysis for CUMO molybdenite is shown against the database in Figure 12. One of
the three datasets (Composite 1) for release analysis are poor, the result of inadequate statistics
from this very low grade Mo ore, however the other two tell a consistent story, one of relatively
fine-grained Mo which will be liberated at a grind of roughly K80 of roughly 70-80 microns.
CUMO molybdenite is slightly more coarsely disseminated than the chalcopyrite, so for the most
part, Mo metallurgy, at any given grind should be slightly better than Cu metallurgy.
Background
Chalcopyrite
Pyrite
Molybdenite
Other Sulphides
Quartz
Plagioclase
K-Feldspar
Micas
Garnet
Amphiboles
Clays
Chlorites
Fe Oxides/Oxyhydroxides
Ti Oxides
Calcite
Apatite
Other

Mosquito Consolidated Gold Mines – CUMO Project – CAVM-50004-001
SGS Minerals Services
25
0
10
20
30
40
50
60
70
80
90
100
1 10 100 1000
Particle size, microns
Mo
, %
lib
era
ted
Cumo comp 2
Cumo comp 3
Cumo comp 1
Figure 12: CUMO Molybdenite Release Analysis, vs. SGS Global Mo Ore
Database
Regrinding to a target size of 15-20 microns should release the Mo sufficiently to make
concentrate grades of 50% Mo. However, the propensity of the Mo to lock to harder silicates
(Figure 13) will increase the challenge associated with liberating the Mo without sliming it in the
process. Owing to the attrition nature of the grinding action, we suggest vertimills or
SMD/Isamills may not be a good application in this case.
Figure 13: Image Grid describing Release Characteristics of CUMO
Molybdenite: Mo Composite (Composite 3)

Mosquito Consolidated Gold Mines – CUMO Project – CAVM-50004-001
SGS Minerals Services
26
4 Flotation Testing
Flotation testing of the CUMO ore were conducted on three levels of investigations namely,
rougher, cleaner and locked cycle testing. All three composites were subjected to these tests
using common Cu and Mo reagents.
4.1 Composite 1: Cu – Ag Zone Testing
4.1.1 Rougher testing of composite 1
Two rougher kinetic flotation tests were conducted on the composite following the conditions
described below. The details of the tests are placed in the Appendix C.
• Grind: One sample of the composite was ground to a K80 of 62 micrometers while the
other to a K80 of 111 micrometers.
• Molybdenum activator/collectors: Fuel oil was tested as the Mo activator for this
composite and Aero 3302 was used as the Moly collector.
• Cu/Ag collectors: Aero 3418 A, a dithiophosphine was used as the Cu and Ag collector
in the Cu – Ag composite. This phosphine reagent is widely recognised as a strong and a
selective Cu, Pb and Ag collector in the industry.
The rougher kinetics of the Cu – Ag composite at two different mesh of grinds, are graphically
shown in Figures 14, 15 and 16. The results of the rougher testing proved the following.
• The rougher recovery of Cu, Mo and Ag at the finer grind (K80 of 63 µm) were 73%,
86% and 76% respectively (Figure 14) and were higher than at the coarser grind (K80 of
111 µm).
• For a resource with low head grades, the above recoveries are considered acceptable
averages by industry standards.
• The mass recovery of the finer grind was 7.6% and of the coarser grind was 5.5%.
• The finer grind benefited Cu more than Mo or Ag (Figure 14).

Mosquito Consolidated Gold Mines – CUMO Project – CAVM-50004-001
SGS Minerals Services
27
• The recovery of valuable minerals reached the recovery plateau in about eight minutes
(Figure 14). At this residence time, the recovery losses were a minimum (from the
maximum 15 minutes), with considerable benefits gained from the mass recovery.
Flotation Kinetics of Cu, Mo, Ag and Mass of Composite 1
0
10
20
30
40
50
60
70
80
90
100
0 2 4 6 8 10 12 14 16
Time - minutes
Reco
very
of
Cu
, M
o a
nd
Ag
-
%
0
2
4
6
8
10
12
14
16
Mass R
eco
very
- %
K80-63; Cu K80-63; Mo K80-63; Ag K80-111; Cu
K80-111; Mo K80-111; Ag K80-63; Mass K80-111; Mass
Figure 14: Rougher Kinetics of Composite 1
• The grade and recovery curves of Cu confirmed the benefits of the finer grind (Figure
15). In case of Mo and Ag, the benefits were marginal to mixed (Figure 16).
• Considering the price of 3418A, this phosphine Ag collector was not cost effective.
• The recovery of the Cu minerals can be improved by optimizing the mesh of grind and
the reagents. Reagents appeared to be the only option available to improve the Mo and
Ag mineral recoveries.

Mosquito Consolidated Gold Mines – CUMO Project – CAVM-50004-001
SGS Minerals Services
28
Grade and Recovery of Cu of Composite 1
0
1
2
3
4
5
6
7
40 45 50 55 60 65 70 75
Recovery of Cu - %
Gra
de o
f C
u -
%
K80-63 mic. K80-111 mic.
Figure 15: Grade and recovery of Cu of Composite 1
Grade and Recovery of Mo and Ag of Composite 1
0
2000
4000
6000
8000
10000
12000
40 50 60 70 80 90
Recovery of Mo and Ag - %
Gra
de o
f M
o -
g/t
0
20
40
60
80
100
120
140
160
180
Gra
de o
f A
g -
g/t
K80-63 mic; Mo K80-111 mic.Mo K80-63 mic.: Ag K80-111 mic;Ag
Figure 16: Grade and Recovery of Mo and Ag of Composite 1
4.1.2 Cleaner Testing of Composite 1
In this stage of testing the composite was floated at its best conditions determined during the
rougher tests. The rougher concentrate was re-ground and cleaned in three stages of open circuit

Mosquito Consolidated Gold Mines – CUMO Project – CAVM-50004-001
SGS Minerals Services
29
cleaning as shown in Figure 17. In cleaner testing, tungsten was added to the list of minerals to
be investigated.
Figure 17: Cleaner testing flow-sheet
The objectives of the cleaner tests were to optimise the reagents and re-grind times to produce
the best cleaner products and set up conditions to conduct locked cycle testing of the same
composite. Three cleaner flotation tests were conducted on the composite following the
conditions described by the test matrix in Table 6 below.
Table 6: Cleaner testing parameters of composite 1
PARAMETERS Test # 3 Test # 4 Test # 5
Primary grind - K80 , µm 63 54 54
Re-grind time – min 15 15 22
Diesel – g/t 25 25
Aero 3302 – g/t 31 26
F 1234 5
Aero 3477 – g/t 20
SIBX – g/t 36 36 37

Mosquito Consolidated Gold Mines – CUMO Project – CAVM-50004-001
SGS Minerals Services
30
The performance of the cleaning tests was evaluated through the flotation grade/recovery
relationships for copper, molybdenum and silver. These are presented in Figures 18, 19 and 20.
Grade and Cleaner Recovery of Copper of Composite 1
50.00
55.00
60.00
65.00
70.00
75.00
0.0 5.0 10.0 15.0 20.0 25.0
Grade of Copper - %
Reco
very
of
Co
pp
er
- %
Test 3 Test 4 Test 5
Figure 18: Grade and cleaner recovery of Copper of composite 1
The details of the cleaner tests were placed in the Appendix C. The following can be concluded:
• Test 4 produced the best metallurgy of Cu, Mo and Ag. Here, a concentrate assaying
15% Cu was made at a Cu recovery of 64%, while recovering 81% of the Mo for a grade
of 2% and 65% of the Ag for a grade of 462 g/t to the same concentrate.
• The graphs of all the elements in all tests remained almost parallel to each other during
the cleaning process, indicating either the lack of distinction or the ineffectiveness of
external stimuli (reagents, re-grind etc., etc.) towards the final outcome.
• The average upgrade ratio of Cu during cleaning in test 4, assured that a saleable grade
copper concentrate can be made with two additional stages of cleaning. The lower head
grade, low weight of the feed charge and the type of cleaning (lack of columns to address
mica), were some of the reasons why saleable grade of Cu was not made in these tests.

Mosquito Consolidated Gold Mines – CUMO Project – CAVM-50004-001
SGS Minerals Services
31
• The best rougher recovery achieved for Cu was 70% and this low recovery was likely due
to low feed grade and poor liberation. Rougher tail also carried the majority of Mo and
Ag losses.
Grade and Recovery of Moly of Composite 1
60.00
65.00
70.00
75.00
80.00
85.00
90.00
0 5000 10000 15000 20000 25000 30000 35000
Grade of Moly - g/t
Reco
very
of
Mo
ly -
%
Test 3 Test 4 Test 5
Figure 19: Grade and cleaner recovery of Molybdenum of composite 1

Mosquito Consolidated Gold Mines – CUMO Project – CAVM-50004-001
SGS Minerals Services
32
Grade and Recovery of Silver of Composite 1
40
45
50
55
60
65
70
75
0 100 200 300 400 500 600 700
Grade of Silver - g/t
Reco
very
of
Sil
ver
- %
Test 3 Test 4 Test 5
Figure 20: Grade and cleaner recovery of Silver of composite 1
• In general, the metallurgy (grade and recovery) of the rougher stage depended largely on
the primary grind. In these tests it proved that a grind of a K80 of 54 µm was more
beneficial for Cu and Mo than 64 µm.
• The finest regrind after 22 minutes (test # 5), was K90 of 20µm and yet the results were
not different from other tests concluding that either the regrind size should be much finer,
or that the regrind size is unimportant – however the mineralogy data point to the need
for a finer regrind. This needs more study.
• A generic reagent suite employing Sodium IsoButyl Xanthate and Cytec Aero 3302
collectors appeared to be sufficient to process this composite. The use of diesel to
activate Mo, and supplementary collector F1234 (thionocarbamate), did not appear to
help the general recoveries.
• The products carried so little W, they were below the analytical detection limit and hence
the grade and the behaviour of W, were not accurately assessed.
• However, it was estimated that the W of the feed of the composite to be between 30 g/t
and 40 g/t and about 90% of the W, reported to the rougher tail.

Mosquito Consolidated Gold Mines – CUMO Project – CAVM-50004-001
SGS Minerals Services
33
4.1.3 Locked cycle testing of composite 1
Extending the findings from the rougher and cleaner testing, one locked cycle test was conducted
on composite 1 and the flow-sheet is shown in Figure 21. The object of the test was to prove the
stability of a continuous process and confirm the economical metallurgy of the composite under
investigation.
Figure 21: Locked cycle test flow-sheet
The locked cycle test was conducted using the parameters determined during the cleaner testing.
The test details and the results of the locked cycle test were placed in Appendix C. The
metallurgical prediction arrived from the results of the locked cycle test is shown in Table 7.
Table 7: Metallurgical prediction for composite 1
Assay - %, g/t Distribution - %
Stream Wt - % Cu Mo Ag Cu Mo Ag
Final concentrate 0.78 13.03 1.9994 357.2 63.3 82.2 71.7
Cleaner/Scav. tail 7.00 0.08 0.0052 2.5 3.7 1.9 4.6
Rougher tail 92.00 0.06 0.0033 1.0 33.0 15.9 23.8
Calculated Head 99.78 0.16 0.0189 3.9 100.0 100.0 100.0

Mosquito Consolidated Gold Mines – CUMO Project – CAVM-50004-001
SGS Minerals Services
34
The metallurgy of W was not assessed due to their low availability in the products. The stability
of the process is depicted by Figure 22, below. The process tested resulted in a well balanced
and a stable circuit.
Circuit Stability
70.00
75.00
80.00
85.00
90.00
95.00
100.00
105.00
110.00
115.00
120.00
0 1 2 3 4 5 6 7
Cycles - Number
We
igh
t, M
eta
l U
nit
s -
%
Weight Cu Units Mo Units Ag Units W Units
Figure 22: The stability of the locked cycle test of composite 1
The major loss of recovery of Cu, Mo and Ag was to the rougher tail. While the rougher
recovery of Ag was better than in the rougher and cleaner tests, the Cu and Mo recoveries proved
to be similar to the rougher and cleaners tests. This lack of improvement was despite the finer
grind suggested by QEMSCAN studies and hence confirmed the need to further study the
mineralogy and its effect on metallurgy.
4.2 Composite 2: Cu – Mo Zone Testing
4.2.1 Rougher testing of composite 2
Two rougher kinetic flotation tests were conducted on the composite following the conditions
described below. Full details of the tests were placed in Appendix C.

Mosquito Consolidated Gold Mines – CUMO Project – CAVM-50004-001
SGS Minerals Services
35
• Grind: One sample of the composite was ground to a K80 of 61 micrometers while the
other to a K80 of 106 micrometers.
• Moly activator/collectors: Diesel oil was the Moly activator for this composite and Aero
3302 was the Moly collector.
• Cu/Ag collectors: Sodium IsoButyl Xanthate was used as the Cu and Ag collector in the
Cu – Mo composite.
The rougher kinetics test data on the Cu – Mo composite at two different mesh of grinds, are
graphically shown in Figures 23, 24 and 25. The results of the rougher testing proved the
following.
Flotation Kinetics of Cu, Mo, Ag and Mass of Composite 2
0
10
20
30
40
50
60
70
80
90
100
0 2 4 6 8 10 12
Flotation Time - minutes
Reco
very
of
Cu
, M
o a
nd
Ag
- %
0
1
2
3
4
5
6
7
8
9
10
Reco
very
of
Mass -
%
K80-106: Cu K80-106: Mo K80-106: Ag K80-61: Cu
K80-61: Mo K80-61: Ag K80-106: Mass K80-61: Mass
Figure 23: Flotation kinetics of composite 2
• The rougher recovery of Cu, Mo and Ag at the finer grind of K80 of 61 µm were 89%,
93% and 75% respectively while at the coarser grind K80 of 106 µm they were 90%, 92%

Mosquito Consolidated Gold Mines – CUMO Project – CAVM-50004-001
SGS Minerals Services
36
and 74% respectively, hardly any different from the finer grind. Recovery is not
dependent on the mesh of grind in this range i.e. K80 of 61 to 106 µm.
• For a composite with (calculated) head grades of 0.11% Cu, 417 g/t of Mo and 2.9 g/t of
Ag, the above recoveries would be considered above average by industry standards.
Grade and Recovery of Cu of Composite 2
0
1
2
3
4
5
6
7
8
74 76 78 80 82 84 86 88 90 92
Recovery of Cu - %
Gra
de o
f C
u -
%
K80-106 mic K80-61 mic
Figure 24: Grade and rougher recovery of Cu of Composite 2
• The flotation mass recovery following the finer grind was 6.1% and after the coarser
grind, 5.1%.
• The recovery of valuable minerals reached the recovery plateau in about seven minutes
(Figure 23).
• Figure 24 confirmed that the coarser grind provided better metallurgy for Cu than the
finer grind. In the future, even coarser grinds should be tested on this material type.
• Figure 25 proved that the Mo and Ag metallurgy was independent of primary grind over
the size ranges tested.

Mosquito Consolidated Gold Mines – CUMO Project – CAVM-50004-001
SGS Minerals Services
37
There may be significant project upside in the primary grind selection. The ore is moderately
hard so any attempt to further coarsen the grind should significantly enhance capital and
operating costs. This needs to be explored and an economic trade-off analysis conducted on
k80 grind sizes in the 100-200 micron range.
Grade and Recovery of Mo and Ag of Composite 2
0
5000
10000
15000
20000
25000
30000
50 60 70 80 90 100
Recovery of Mo and Ag - %
Gra
de
of
Mo
- g
/t
0
20
40
60
80
100
120
140
Gra
de
of
Ag
- g
/t
K80-106 mic; Mo K80-61 mic; Mo K80-106 mic; Ag K80-63 mic; Ag
Figure 25: Grade and rougher recovery of Mo and Ag of Composite 2
4.2.2 Cleaner testing of composite 2
In this stage of testing the composite was floated at its best conditions determined during the
rougher tests. The rougher concentrate was re-ground and cleaned in three stages of open circuit
cleaning as shown in Figure 17. During cleaner testing, “Moly oil” was used to activate Mo and
tungsten was added to the list of minerals to be investigated.
The objectives of the cleaner tests were to optimise the reagents and re-grind times to produce
the best cleaner products and set up conditions to conduct locked cycle testing of the composite.
Three cleaner flotation tests were conducted following the conditions described by the matrix in
Table 8.

Mosquito Consolidated Gold Mines – CUMO Project – CAVM-50004-001
SGS Minerals Services
38
The results of the cleaning tests were measured by their grade and recovery achievements of
copper, molybdenum and silver. These are presented in Figures 26, 27 and 28.
Table 8: Cleaner testing parameters of composite 2
PARAMETERS Test # 3 Test # 4 Test # 5
Primary grind - K80 , µm 63 63 63
Re-grind time – min 15 20 10
Moly Oil – g/t 31 25 32
Aero 3302 – g/t 36 36 41
SIBX – g/t 41 41 46
Grade and Cleaner Recovery of Copper of Composite 2
80.00
82.00
84.00
86.00
88.00
90.00
92.00
94.00
0.0 2.0 4.0 6.0 8.0 10.0 12.0 14.0 16.0 18.0 20.0
Grade of Cu - %
Re
co
ve
ry o
f C
u -
%
Test 3 Test 4 Test 5
Figure 26: Grade and cleaner recovery of Copper of composite 2

Mosquito Consolidated Gold Mines – CUMO Project – CAVM-50004-001
SGS Minerals Services
39
Note that in these tests, the weights of some of the products were insufficient to determine all the
elements completely. In such cases, values were assumed based on calculated head assays. The
details of the cleaner tests were placed in the Appendix C. The following were discovered.
• Test 5 produced the best metallurgy for Cu while tests #3 were best for Mo and Ag. As
in the case of composite 1, the behaviour of all elements of all tests except Mo in test # 5,
showed parallel paths, indicating either the lack of distinction or the ineffectiveness of
external stimuli (reagents, re-grind etc., etc.) towards the final outcome.
• In test 5, a concentrate assaying 17% grade Cu was made at a recovery of 87%, while
90% of the Mo was recovered to the concentrate, which assayed 5% Mo. Some 70% of
the Ag was also recovered to the concentrate, which assayed 365 g/t.
• The average upgrade ratio of Cu during cleaning in test 5, indicated that a saleable grade
copper concentrate can be made with two additional stages of cleaning. The lower head
grade, low weight of the feed charge and the type of cleaning (lack of columns to address
mica), were some of the reasons this was not demonstrated in these tests.
• No comment can be made on the ability to separate the Cu and Mo in the bulk Cu/Mo
concentrate from this sample, or whether Mo can be upgraded to a saleable concentrate
grade (50+% Mo)
Grade and Cleaner Recovery of Mo of Composite 2
90
91
92
93
94
95
96
0 10000 20000 30000 40000 50000 60000 70000
Grade of Mo - g/t
Re
co
ve
ry o
f M
o -
%
Test 3 Test 4 Test 5

Mosquito Consolidated Gold Mines – CUMO Project – CAVM-50004-001
SGS Minerals Services
40
Figure 27: Grade and cleaner recovery of Molybdenum of composite 2
• Test # 4 with the longest re-grind time produced a K96 of 20µm and yet it did not appear
to have been effective. As in composite 1, this concluded that the regrind should be finer
than K96 of 20 µm.
• A generic reagent suite appeared to be sufficient to process this composite.
Grade and Cleaner Recovery of Ag of Composite 2
68
70
72
74
76
78
80
82
84
0 50 100 150 200 250 300 350 400
Grade of Ag - g/t
Re
co
ve
ry o
f A
g -
%
Test 3 Test 4 Test 5
Figure 28: Grade and cleaner recovery of Silver of composite 2
• The products carried W grades below the detection limit for the analytical methodologies
employed in this study, hence the grade and the behaviour of W, were not accurately
assessed.
• The W of the feed of the composite was estimated to be between 50 g/t and 70 g/t and we
believe over 90% of the W, reported to the rougher tail. The rougher tail assayed at 70
g/t in test 3 and 50 g/t in each of tests 4 and 5.
4.2.3 Locked cycle testing of composite 2
Extending the findings from the rougher and cleaner testing, one locked cycle test was conducted
on Composite 2 and the flow-sheet is shown in Figure 21. The object of the test was to prove the

Mosquito Consolidated Gold Mines – CUMO Project – CAVM-50004-001
SGS Minerals Services
41
stability of a continuous process and confirm the metallurgy of the ore under investigation using
the as-developed procedure.
The locked cycle test was conducted using the parameters determined during the cleaner testing.
The test parameters and the results of the locked cycle test were placed in Appendix C. The
metallurgical prediction arrived from the results of the locked cycle test is shown in Table 9.
Table 9: Metallurgical prediction for composite 2
Assay - %, g/t Distribution - %
Stream Wt - % Cu Mo Ag Cu Mo Ag
Final concentrate 0.66 16.4 5.6567 324 88.6 93.7 80.0
Cleaner/Scav. tail 6.00 0.03 0.0058 1.20 1.2 0.9 2.7
Rougher tail 93.38 0.01 0.0023 0.50 10.2 5.4 17.3
Calculated Head 100.03 0.12 0.0401 0.27 100.0 100.0 100.0
The metallurgy of W was not assessed due to its low grade in the products. The stability of the
process is depicted by Figure 29, below. The process tested resulted in a well balanced and a
stable circuit.

Mosquito Consolidated Gold Mines – CUMO Project – CAVM-50004-001
SGS Minerals Services
42
Circuit Stability
70.00
75.00
80.00
85.00
90.00
95.00
100.00
105.00
110.00
115.00
120.00
0 1 2 3 4 5 6 7
Cycle - Number
We
igh
t, M
eta
l U
nit
s -
%
Weight Cu Units Mo Units Ag Units W Units
Figure 29: The stability of the locked cycle test of composite 2
Similar to Composite 1 and as expected, the major losses of Cu, Mo and Ag were to the rougher
tail. However, the Composite 2 rougher losses were lower than Composite 1, despite the lower
head assays, indicating that Composite 2 was an easier composite to process than Composite 1.
The final recoveries of Cu, Mo and Ag attained would be considered above industry average
considering the low head grades. The lower than saleable grade of the final concentrate, was a
product of the low grades and the small masses used in the test, and may not reflect any inability
of the material to yield saleable concentrate grades in reality.

Mosquito Consolidated Gold Mines – CUMO Project – CAVM-50004-001
SGS Minerals Services
43
4.3 Composite 3: Mo Zone Testing
4.3.1 Rougher testing of composite 3
Two rougher kinetic flotation tests were conducted on the composite following the conditions
described below. Full details of the tests were placed in Appendix C.
• Grind: One sample of the composite was ground to a K80 of 62 micrometers while the
other to a K80 of 115 micrometers.
• Moly activator/collectors: Moly Float® oil was the Moly activator for this composite
and Aero 3302 was the collector.
• Cu/Ag collectors: Sodium IsoButyl Xanthate was used as the Cu and Ag collector in this
composite.
The rougher kinetics of this Mo composite at two different mesh of grinds, are graphically shown
in Figures 30, 31 and 32. The results of the rougher testing proved the following.
Flotation Kinetics of Composite 3
0
10
20
30
40
50
60
70
80
90
100
0 2 4 6 8 10 12
Flotation Time - minutes
Reco
very
of
Cu
, M
o a
nd
Ag
- %
0
2
4
6
8
10
12
Reco
very
of
Mass -
%
K80-115; Cu K80-115; Mo K80-115; Ag K80-62; Cu
K80-62; Mo K80-62; Ag K80-115; Mass K80-62; Mass
Figure 30: Flotation kinetics of composite 3

Mosquito Consolidated Gold Mines – CUMO Project – CAVM-50004-001
SGS Minerals Services
44
• The rougher recovery of Cu, Mo and Ag at the finer grind of K80 of 62 µm were 83%,
97% and 72% respectively while at the coarser grind of K80 of 106 µm they were 77%,
94% and 64% respectively. The finer grind significantly favoured Cu and Ag, but not so
much Mo.
• For a composite with (calculated) head grades of 0.03% Cu, 1135 g/t of Mo and 1.1 g/t of
Ag, the above recoveries would be considered above average by the industry standards.
Grade and Recovery of Cu of Composite 3
0
0.2
0.4
0.6
0.8
1
1.2
1.4
1.6
1.8
60 65 70 75 80 85
Recovery of Cu - %
Gra
de o
f C
u -
%
K80-115 mic K80-62 mic
Figure 31: Grade and rougher recovery of Cu of composite 3
• The flotation mass recovery following the finer grind was 6.3% and following the coarser
grind, 5.4%.
• The recovery of valuable minerals reached the recovery plateau in just over six minutes
(Figure 30).
Mosquito Consolidated Gold Mines – CUMO Project – CAVM-50004-001
SGS Minerals Services
45
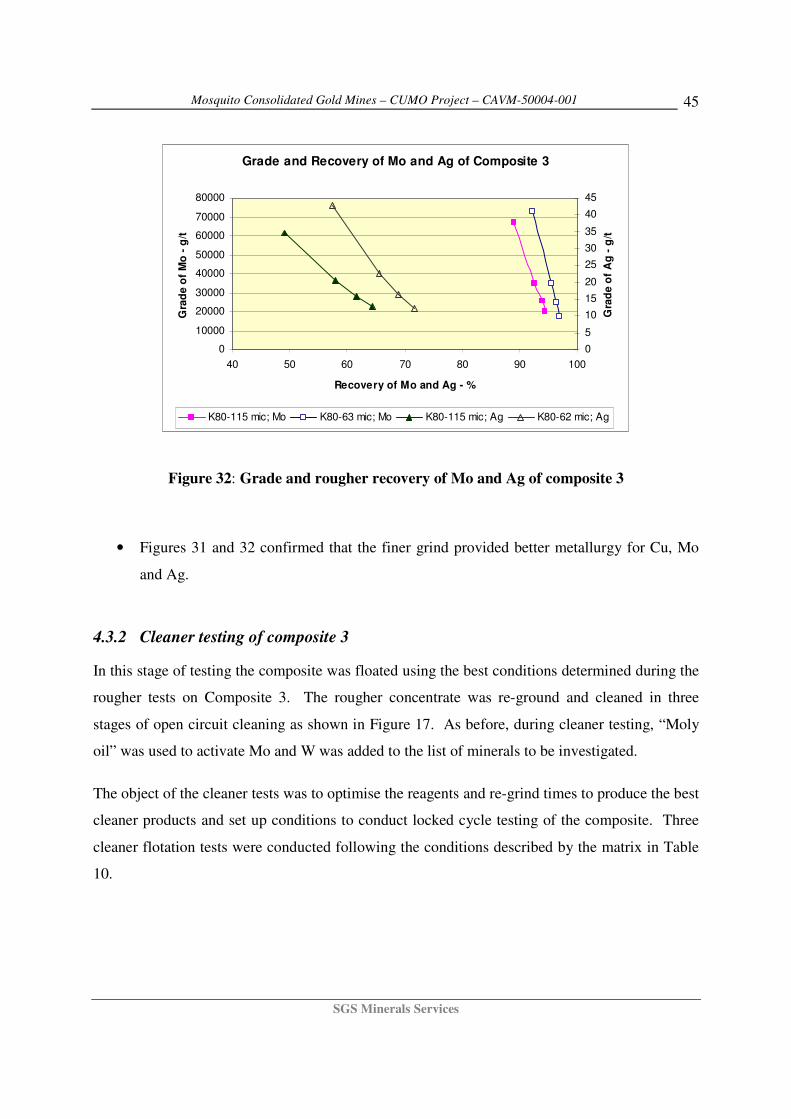
Grade and Recovery of Mo and Ag of Composite 3
0
10000
20000
30000
40000
50000
60000
70000
80000
40 50 60 70 80 90 100
Recovery of Mo and Ag - %
Gra
de o
f M
o -
g/t
0
5
10
15
20
25
30
35
40
45
Gra
de o
f A
g -
g/t
K80-115 mic; Mo K80-63 mic; Mo K80-115 mic; Ag K80-62 mic; Ag
Figure 32: Grade and rougher recovery of Mo and Ag of composite 3
• Figures 31 and 32 confirmed that the finer grind provided better metallurgy for Cu, Mo
and Ag.
4.3.2 Cleaner testing of composite 3
In this stage of testing the composite was floated using the best conditions determined during the
rougher tests on Composite 3. The rougher concentrate was re-ground and cleaned in three
stages of open circuit cleaning as shown in Figure 17. As before, during cleaner testing, “Moly
oil” was used to activate Mo and W was added to the list of minerals to be investigated.
The object of the cleaner tests was to optimise the reagents and re-grind times to produce the best
cleaner products and set up conditions to conduct locked cycle testing of the composite. Three
cleaner flotation tests were conducted following the conditions described by the matrix in Table
10.

Mosquito Consolidated Gold Mines – CUMO Project – CAVM-50004-001
SGS Minerals Services
46
Table 10: Composite 3 Cleaner Testing Parameters
PARAMETERS Test # 3 Test # 4 Test # 5
Primary grind - K80 , µm 63 63 63
Re-grind time - min 15 22 10
Moly Oil – g/t 25 38 38
Aero 3302 – g/t 34 36 36
SIBX – g/t 36 36 24
The results of the cleaning tests were measured by the copper, molybdenum and silver flotation
grade/recovery relationships. These are presented in Figures 33, 34 and 35.
Grade and Cleaner Recovery of Copper of Composite 3
76
77
78
79
80
81
82
83
84
85
86
0 1 2 3 4 5 6 7
Grade of Cu - %
Re
co
ve
ry o
f C
u -
%
Test 3 Test 4 Test 5
Figure 33: Concentrate grade vs. recovery of Cu from composite 3
Note that in these tests, the weights of some of the products were insufficient to determine all the
elements completely. In such cases, values were assumed based on fitting the calculated and
assayed head grades. The details of the cleaner tests were placed in the Appendix C. The
following were discovered.

Mosquito Consolidated Gold Mines – CUMO Project – CAVM-50004-001
SGS Minerals Services
47
Grade and Cleaner Recovery of Mo of Composite 3
93.5
94
94.5
95
95.5
96
96.5
97
97.5
0 50000 100000 150000 200000 250000 300000
Grade of Mo - g/t
Reco
very
of
Mo
- %
Test 3 Test 4 Test 5
Figure 34: Concentrate grade vs. recovery of Molybdenum from composite 3
• In this series, there was no difference in the Cu metallurgy between tests 3, 4 and 5
(Figure 33). The shortest regrind time yielded the poorest Mo grade/recovery
performance, showing that a finer grind is somewhat beneficial to grade/recovery
performance. In case of Mo and Ag, the differences between tests were marginal and
were within the limits of experimental error.
• Test # 3 with 15 minutes of regrinding produced a K88 of 20 µm and test # 4 yielded the
finest re-grind (K96 of 20 µm). These tests yielded similar Cu, Mo flotation response
• Ag flotation response was best in Test 5, though the significance of this result is
questionable given the low assays.
• In three stages of open circuit cleaning, 6% Cu were made at a recovery of 77%, while
collecting 94% of the Mo for a grade of 24% and 52% of the Ag for a grade of 156 g/t.
As shown at the rougher testing, for a resource with head grades of 0.03% Cu, 1135 g/t of
Mo and 1.1 g/t of Ag, the metallurgy produced here was considered acceptable by the
industry standards.

Mosquito Consolidated Gold Mines – CUMO Project – CAVM-50004-001
SGS Minerals Services
48
• The patterns of the grade/recovery curves of Cu and Mo assured that a saleable grade
concentrates can be made in four additional stages of cleaning. The lower head grade and
the low weight of the feed charge were some of the reasons this was not demonstrated in
these tests.
Grade and Cleaner Recovery of Ag of Composite 3
40
45
50
55
60
65
70
0 20 40 60 80 100 120 140 160 180
Grade of Ag - g/t
Reco
very
of
Ag
- %
Test 3 Test 4 Test 5
Figure 35: Concentrate grade vs. recovery of Ag from composite 3
• A generic reagent suite appeared to be sufficient to process this composite.
• The products carried so little W, they were below the detection level of the assaying
instruments and hence the grade and the behaviour of W, were not accurately assessed.
• The W of the feed of the composite was estimated to be between 50 g/t and 80 g/t and
over 90% of the W, reported to the rougher tail.

Mosquito Consolidated Gold Mines – CUMO Project – CAVM-50004-001
SGS Minerals Services
49
4.3.3 Locked cycle testing of composite 3
Extending the findings from the rougher and cleaner testing, one locked cycle test was conducted
on Composite 3 and the flow-sheet is shown in Figure 21. The object of the test was to prove the
stability of the flowsheet in closed circuit
The locked cycle test was conducted using the parameters determined during the cleaner testing.
The test parameters and the results of the locked cycle test were placed in Appendix C. The
metallurgical prediction arrived from the results of the locked cycle test is shown in Table 11.
Table 11: Metallurgical Prediction for Composite 3
Assay - %, g/t Distribution - %
Stream Wt - % Cu Mo Ag Cu Mo Ag
Final concentrate 0.49 5.59 21.63 122.1 81.8 96.2 59.3
Cleaner/Scav. tail 7.49 .01 0.007 0.57 2.6 0.5 4.5
Rougher tail 01.62 0.01 0.004 0.40 15.6 3.3 36.5
Calculated Head 99.59 0.03 0.11 1.01 100.0 100.0 100.0
As before the W grades were too low for reliable assaying. The stability of the process is
depicted by Figure 36, below. The process tested resulted in a well balanced and a stable circuit.

Mosquito Consolidated Gold Mines – CUMO Project – CAVM-50004-001
SGS Minerals Services
50
Circuit Stability
60.00
70.00
80.00
90.00
100.00
110.00
120.00
130.00
0 1 2 3 4 5 6 7
Cycles - Number
Weig
ht,
meta
l U
nit
s -
%
Weight % Cu Units Mo Units Ag Units W Units
Figure 36: The stability of the locked cycle test of composite 3
The major loss of recovery of Cu and Ag was to the rougher tail and were relatively high, owing
to the low head grades. Mo rougher performance was above average, a consequence of the high
head grade. Accounting for the low head grades, the final recoveries of Cu, Mo and Ag attained
would be considered above the industry average. The lower than saleable grade of the final
concentrate was expected given the limitations of the test size, but also proved the need for
additional stages of cleaning.
5 Environmental Testing
Acid Base Accounting tests were conducted on the rougher tailing of cycle E from each of the
locked cycle tests. The results are shown in Table 12 below. These data should be interpreted by
a qualified environmental consultant.

Mosquito Consolidated Gold Mines – CUMO Project – CAVM-50004-001
SGS Minerals Services
51
Table 12: ABA Test Results
Parameter Units VF1-LCT1-Ro Tail E VF2-LCT1-Ro Tail E VF3-LCT1-Ro Tail E
Paste pH units 8.48 8.42 8.68
Fizz Rate - Slight Slight Slight
Sample Weight g 2.00 2.00 2.00
HCl Added mL 20 20 20
HCl conc. Normality 0.10 0.10 0.10
NaOH Normality 0.10 0.10 0.10
NaOH to pH 8.3 mL 15.90 14.10 14.95
Final pH units 1.43 1.47 1.44
NP¹ t CaCO3/1000t 10.4 14.9 12.8
AP t CaCO3/1000t 0.3 0.3 0.3
Net NP t CaCO3/1000t 10.1 14.6 12.5
NP/AP ratio 33.3 47.7 41.0
Total S % 0.01 0.01 0.01
SO4 % <0.01 <0.01 <0.01
Sulphide % 0.01 0.01 0.01
Inorganic Carbon % 0.09 0.13 0.12
CO3 NP² t CaCO3/1000t 7.5 10.8 10.0
Classification based on ABA NP¹ PAN PAN PAN
¹ measured in ABA test.
² theoretical, based on CO3 content alone.
Green highlighting indicates Net NP values less than 20.
Orange highlighting indicates NP/AP ratios less than 3.
PAG - Potentially Acid Generating based on interpretation of ABA test data alone.
PAN - Potentially Acid Neutralizing based on interpretation of ABA test data alone.
Uncertain - acid generation potential is uncertain based on interpretation of test data alone.
6 Ancillary Testing
In this section additional testing of concentrates, tailings and new processes to recover trace
minerals were examined.
6.1 Product Characterization
The final concentrate from the locked cycle tests were analysed for Gallium, Osmium and
Rhenium while the rougher tail of the same test was analysed for Gallium only. The results are
tabulated and displayed in Table 13 below.
Table 13: Characterization assays of final concentrate and rougher tail
Assays

Mosquito Consolidated Gold Mines – CUMO Project – CAVM-50004-001
SGS Minerals Services
52
Sample Stream Ga - % Os – g/t Re – g/t
Concentrate < 0.004 < 0.03 0.9 Composite 1
Rougher tail < 0.004
Concentrate < 0.004 < 0.02 2.9 Composite 2
Rougher tail < 0.004
Concentrate 0.005 < 0.02 15.0 Composite 3
Rougher tail < 0.004
Re was the only metal present in quantities above the detection limit.
A subsequent analysis of rougher tail from composite 3 locked cycle test and the composite 3
for Ga using ICP MS, indicated 17 and 16 g/t Ga respectively.
6.2 Tungsten Recovery
Despite the inability to assess the metallurgy in the cleaning and locked cycle tests, a gravity
separation test was conducted on rougher tailing of the locked cycle test of composite 3. The test
consisted of feeding the rougher tailings to a Falcon concentrator whose concentrate was
upgraded on a Mozley table. Details of the tests are placed in Appendix D. The results are
tabulated in Table 14 below.
Table 14: WO3 response in a gravity circuit
WO3 - %
Stream Wt % Assay Distribution
Mozley Concentrate 0.04 4.61 26.34
Falcon Concentrate 2.85 0.093 40.55
Calculated Feed 100 0.003 100
The results indicated the amenability of a gravity circuit to recover WO3 from flotation tail.
However, in a real life production application the low grade of the feed stock is likely to render it
uneconomic because of the number of processing stages required to produce a saleable

Mosquito Consolidated Gold Mines – CUMO Project – CAVM-50004-001
SGS Minerals Services
53
concentrate. The difficulties in monitoring and controlling a process in a production situation
must also be considered.
7 Conclusions
7.1 Samples
• Composites 1, 2 and 3 assayed 0.15%, 0.13% and 0.035% Cu respectively. The
composites also assayed 0.017%, 0.04% and 0.12% Mo respectively.
7.2 Cu – Ag Zone ore
• The ore was medium-hard with SPI index of 84.5 minutes and Bond ball mill work index
of 15.8 kWh/tonne.
• Fine grained Chalcopyrite which requires a finer grind was the principal copper mineral
and fine grained Molybdenite was the molybdenum mineral.
• Very little pyrite and little or no interfering clay or talc minerals were found.
• The presence of micaceous material in an abundance that would require special cleaning
methods was confirmed.
• The best conditions for the rougher stage tested were a grind K80 of 63 µm, a pH of 8.5
maintained with 30 g /t of lime, 30 g /t of the Mo collector (Aero 3302), 25 g /t of Cu/Ag
collector (3418A) and 30g /t of frother (MIBC).
• The residence time required for an economical separation was 8 minutes and the mass
recovery over this time period was 5.2%.
• The best rougher conditions recovered 73% of the Cu, 86% of the Mo and 76% of the Ag
to the rougher concentrate.
• In 3 stages of open circuit cleaning the pH was kept at its natural level while during the
final stage when it was increased to 10.5 with 20 g/t of lime. A concentrate assaying 15%
Cu was made.
Mosquito Consolidated Gold Mines – CUMO Project – CAVM-50004-001
SGS Minerals Services
54
• To collect the Mo during cleaning, 20 g/t and 6 g/t of Aero 3302 was added to the
rougher and cleaners respectively. Further, 30 g/t and 6 g/t of SIBX were used as the Cu
collector during roughing and cleaning respectively.
• The regrind size should be at least as fine as K90 of 20 µm.
• The W grades of the product were below the detection levels of the instruments.
• In a 6 cycle locked cycle test, only 63% of the Cu was recovered to a grade of 13%. The
bulk concentrate also carried 82% of the Mo at 2% Mo and 72% of the Ag at a grade of
357 g/t.
• The most difficult metallurgy was exhibited by this composite.
7.3 Cu – Mo Zone ore
• The ore was medium hard with SPI index of 73 minutes and Bond ball mill work index of
15.7 kWh/tonne and however it was softer than Composite 1.
• Fine grained Chalcopyrite and Molybdenite were the principal copper and molybdenum
minerals.
• Very little pyrite and little or no interfering clay or talc minerals were found.
• The presence of micaceous material which requires special cleaning methods, was
confirmed.
• The rougher testing indicated the metal recoveries were independent of grind in the
ranges tested and hence the coarser grind (K80 of 106) was selected. Coarser grinds
should be tested in the future.
• The rougher conditions tested were a natural pH, 20 g/t of diesel to activate Mo, 20 g/t of
3302 to collect Mo, 25 g/t of SIBX to collect Cu and Ag and 27 g/t of X-133 as the
frother.
• The residence time required for an economical separation was 7 minutes and the mass
recovery over this time period was 5.1%.
• The best rougher conditions recovered 89% of the Cu, 92% of the Mo and 74% of the Ag
to the rougher concentrate.

Mosquito Consolidated Gold Mines – CUMO Project – CAVM-50004-001
SGS Minerals Services
55
• In 3 stages of open circuit cleaning, where the pH was kept at its natural level except
during the final stage when it was increased to 10.5 with 15 g/t of lime, a concentrate
with 18% Cu and 6.3% Mo was made.
• During cleaning, Mo was activated by 20 g/t and 11 g/t of Moly oil added to the rougher
and cleaners respectively. Further, 30 g/t and 6 g/t of 3302 was used as the Mo collector
and 40 g/t and 6 g/t of SIBX was used as the Cu collector during roughing and cleaning
respectively. The frother used was X-133 and 30 g/t and 12 g/t of frother was added to
rougher and cleaners respectively.
• The regrind size should be finer than K96 of 20 µm.
• The W grades of the product were below the detection levels of the instruments.
• In a 3 stage cleaning and 6 cycle locked cycle test, 89% of the Cu was recovered to a
grade of 16%. The bulk concentrate also carried 94% of the Mo at 6% Mo and 80% of
the Ag at a grade of 324 g/t.
• The metallurgy in general was simple, including a simple cleaning circuit with generic
flotation collectors and depressants (for a Mo separation).
• The results of the flotation test work conducted on this composite revealed no fatal
metallurgical flaws and so qualify moving to a pre-feasibility level of investigation.
7.4 Mo Zone ore
• The ore was medium hard with SPI index of 70.8 minutes and Bond ball mill work index
of 12.6 kWh/tonne and however it was softer than composite 1 or 2.
• Fine grained Chalcopyrite and Molybdenite were the principal copper and the
molybdenum minerals.
• Very little pyrite and little or no interfering clay or talc minerals were found.
• The presence of micaceous material which requires special cleaning methods, was
confirmed.

Mosquito Consolidated Gold Mines – CUMO Project – CAVM-50004-001
SGS Minerals Services
56
• The rougher conditions tested were a grind of K80 of 62µm, natural pH, 25.5 g/t of Moly
Oil to activate Mo, 30 g/t of 3302 to collect Mo, 25 g/t of SIBX to collect Cu and 30 g/t
of X-133 as the frother.
• The residence time required for an economical separation was 6 minutes and the mass
recovery over this time period was 6%.
• The best rougher conditions recovered 93% of the Mo and 83% of the Cu to the rougher
concentrate.
• In 3 stages of open circuit cleaning, where the pH was kept at its natural level except
during the final stage when it was increased to 10.5 with 20 g/t of lime, a concentrate
with 6% Cu and 24% Mo was made.
• During cleaning, Mo was activated by 20 g/t and 5 g/t of Moly oil added to the rougher
and cleaners respectively. Further, 28 g/t and 6 g/t of 3302 was used as the Mo collector
and 30 g/t and 6 g/t of SIBX was used as the Cu collector during roughing and cleaning
respectively. The frother used was X-133 and 30 g/t and 10 g/t of frother was added to
rougher and cleaners respectively.
• The regrind size should be finer than K96 of 20 µm.
• The W grades of the product were below the detection levels of the instruments.
• In a 3 stage cleaning and 6 cycle locked cycle test, 96% of the Mo was recovered to a
grade of 22%. The bulk concentrate also carried 82% of the Cu at 6% Cu and 59% of the
Ag at a grade of 122 g/t.
• The metallurgy in general was simple, can be treated by a simple cleaning circuit with
generic flotation collectors and depressants (for a Mo separation).
• The results of the flotation test work conducted on this composite also revealed no fatal
flaws and qualify moving to a pre-feasibility level of investigation.
7.5 Environmental Testing
• The flotation tailings tested were not acid generating

Mosquito Consolidated Gold Mines – CUMO Project – CAVM-50004-001
SGS Minerals Services
57
7.6 Ancillary Testing
• The Ga in the final concentrates of composites I and 2 were less than 0.004%, below the
detection level of the measuring instrument.
• The Ga of the final concentrate of composite 3 was 0.005%.
• The Ga of the rougher tailing of composites 1 and 2, was less than 0.004%, below the
detection level of the measuring instrument.
• The Ga in rougher tail of composite 3 was 17 g/t and that of feed of composite 3 was 16
g/t.
• The Os of the final concentrates of all composites were less than 0.003 g/t, below the
detection level of the measuring instrument.
• The Re of the final concentrates of composites 1, 2 and 3 were 0.9, 2.9 and 15.0 g/t
respectively.
8 Recommendations
The following are the recommendations.
• It is recommended that the next level of investigation should be of the pre-feasibility or
feasibility level conducted on single composite made using the mine plan.
• It is recommended that composite # 1 should be further studied under a variability test
program.
• It is recommended that the flow-sheet development test work must be carried using feed
charges over 10 kg.
• The cleaning circuits must be capable of rejecting mica. The use of columns and specific
(mineral rejecting) reagents are highly recommended.
• It is recommended that the number of cleaning stages must be increased to a number
sufficient to produce a saleable concentrate (to be assessed through 10-20kg bulk
flotation testing.

Mosquito Consolidated Gold Mines – CUMO Project – CAVM-50004-001
SGS Minerals Services
58
• It is recommended that the conclusions arrived with respect to residence time, mesh of
grind and the reagent suites be carried forward to the next stage of testing, although
economic upside may exist from employing a coarser grind in the case of the Cu/Mo ore.
• There was significant variability in the required primary grind from ore type to ore type,
and some variability in hardness. Given a mill circuit with constant installed power, this
would be reflected in throughput and/or primary grind variations – and given the different
primary grind needs, this would be reflected in varying metallurgical performance.
• Accordingly, this project should include, as part of any feasibility study, a structured
assessment of how the deposit will grind (in terms of throughput and grind size) and the
resulting metallurgical performance, spatially around the resource. This could well affect
mine planning and project economic analysis. Accordingly, some form of geometallurgy
programme is recommended so the resource model includes projected throughput and
recovery levels by mining block. This approach is becoming the norm in the evaluation
of large tonnage, low grade deposits worldwide.

Mosquito Consolidated Gold Mines – CUMO Project – CAVM-50004-001
SGS Minerals Services
59
Appendices

Mosquito Consolidated Gold Mines – CUMO Project - CAVM-50004-001 - 1 -
SGS Mineral Services
APPENDIX A
Sample Receipt and Preparation

Mosquito Consolidated Gold Mines - CUMO Project - CAVM-50004-001
Splitter
Splitter
Splitter
CUMO Sample Preparation flow-sheet per
composite
Sample
1.5" screen
10 kg for SPI test
Cone & Quartering
Riffle and Split
Store~ 40 kg – working
composite
Jaw crush to -6 mesh
Riffle and split
10 kg for Bond work index
tests
Roller crush to – 10 mesh
10 mesh screen
2 kg test charges
Jaw crush to 6 mm
SGS Vancouver Metallurgy
CONFIDENTIAL 1

Mosquito Consolidated Gold Mines - CUMO Project - CAVM-50004-001
Composite 1 - Cu-Ag Zone
Hole # From To New Sample # Weight (Kg) Information Mo-% Cu-% Ag-g/t
27 70 80 715371 5.9 0.008 0.71 2.3
27 80 90 715372 6.82 0.01234 0.06 6.2
27 90 100 715373 6.99 0.005 0.07 2.4
27 100 110 715374 7.91 0.0075 0.06 2.7
27 110 120 715375 7.57 0.006 0.05 1.6
27 120 130 715376 8.08 0.01868 0.07 1.8
27 130 140 715377 8.15 0.04954 0.11 3.4
27 140 150 715378 6.77 0.01718 0.09 5.4
27 150 160 715379 7.31 0.03019 0.15 3.7
27 160 170 715380 6.91 0.03703 0.12 3.2
27 170 180 715381 6.86 0.04187 0.09 1.8
27 180 190 715382 5.83 0.02352 0.12 2.6
27 190 200 715383 8.25 0.02185 0.14 3.8
29 210 220 4448 5.16 0.04702 0.14 3.66
29 220 230 4449 5.11 0.0824 0.26 6.25
29 230 240 4450 6.85 0.08207 0.3 6.5
29 240 250 4451 5.38 0.03787 0.2 4.77
29 250 260 4452 8.73 0.04537 0.23 4.43
29 260 270 4453 4.36 0.01151 0.12 2.49
29 270 280 4454 6.01 0.02202 0.16 3.61
29 280 290 4455 5.81 0.03278 0.15 3.45
29 290 300 4456 5.98 0.03178 0.19 4.89
29 300 310 4457 5.32 0.0352 0.23 6.04
29 310 320 4458 8.1 0.04504 0.22 5.89
29 320 330 4459 6.41 0.04053 0.23 12.05
wt. ave 0.0313611 0.166 4.152
Ar. Av. 0.03169 0.171 4.197
SGS Vancouver Metallurgy
CONFIDENTIAL 2

Mosquito Consolidated Gold Mines - CUMO Project - CAVM-50004-001
Composite 2 - Cu-Mo Zone
Hole # From To New Sample # Weight (Kg) Information Mo-% Cu-% Ag-g/t
27 420 430 715384 6.83 0.06105 0.16 3
27 430 440 715385 7.06 0.05421 0.1 2.5
27 440 450 715386 6.89 0.05505 0.13 2.4
27 450 460 715387 9.43 0.03069 0.13 2.7
27 460 470 715388 7.22 0.01768 0.11 2
27 470 480 715389 8.08 0.02956 0.08 1.9
27 480 490 715390 5.69 0.03186 0.14 2.9
27 490 500 715391 5.72 0.03169 0.09 1.7
27 500 510 715392 7.95 0.08001 0.1 2.2
27 510 520 715393 7.67 0.05538 0.11 2.1
27 520 530 715394 7.42 0.05705 0.1 1.9
27 530 540 715395 7.22 0.0347 0.07 2.1
28 450 460 4411 5.88 0.04737 0.09 2.61
28 460 470 4412 7.64 0.04437 0.08 1.84
28 470 480 4413 5.52 0.04204 0.09 2.75
28 480 490 4414 6.41 0.12694 0.13 3.73
28 490 500 4415 6.87 0.14996 0.14 3.83
28 500 510 4416 6.06 0.13311 0.16 4.09
28 510 520 4417 8.56 0.08057 0.07 1.76
28 520 530 4418 5.57 0.02677 0.06 1.62
28 530 540 4419 8.87 0.08874 0.08 1.7
28 540 550 4420 8.27 0.06122 0.1 2.17
28 550 560 4421 7.05 0.12377 0.14 3.1
28 560 570 4422 6.13 0.06172 0.17 4.28
28 570 580 4423 7.39 0.07923 0.15 4.5
28 580 590 4424 7.38 0.08274 0.12 2.47
28 590 600 4425 5.49 0.05955 0.15 2.82
28 600 610 4426 8.9 0.04320 0.11 2.88
28 610 620 4427 5.92 0.13395 0.17 3.5
28 620 630 4428 6.63 0.10025 0.14 2.97
29 500 510 4460 6.2 0.04621 0.1 2.21
29 510 520 4461 4.74 0.10792 0.13 3.01
29 520 530 4462 5.57 0.03386 0.09 1.9
29 530 540 4463 5.18 0.05154 0.06 1.42
29 540 550 4464 5.46 0.06506 0.1 2.05
29 550 560 4465 4.63 0.08757 0.12 2.77
29 560 570 4466 6.58 0.05288 0.09 1.77
29 570 580 4467 5.25 0.06406 0.05 0.93
29 580 590 4468 5.51 0.03953 0.1 2.38
29 590 602.5 4469 7.37 0.12144 0.07 2.41
29 602.5 613 4470 6.53 Hole 0.0809 0.66 15.3
wt. ave 0.0674103 0.122 2.817
Ar. Av. 0.06769 0.123 2.833
SGS Vancouver Metallurgy
CONFIDENTIAL 3

Mosquito Consolidated Gold Mines - CUMO Project - CAVM-50004-001
Composite 3 - Mo Zone
Hole # From ToOld sample #New Sample # Weight (Kg) Information Mo-% Cu-% Ag-g/t
27 1420 1430 715396 7.18 0.13578 0.05 1.18
27 1430 1440 715397 8.9 0.08974 0.04 1.82
27 1440 1450 715398 6.55 0.21683 0.03 1.88
27 1450 1460 715399 7 0.19934 0.03 1.31
27 1460 1470 715400 5.64 0.14946 0.03 0.67
27 1470 1480 4401 7.08 0.12594 0.04 1
27 1480 1490 4402 7.67 0.16064 0.02 0.73
27 1490 1500 4403 7.76 0.10442 0.03 0.69
27 1500 1510 4404 8.46 0.1111 0.02 0.97
27 1510 1520 4405 7.78 0.14312 0.02 0.32
27 1520 1530 4406 6.93 0.09942 0.02 0.44
27 1530 1540 4407 5.77 0.18433 0.02 0.57
27 1540 1550 4408 6.3 0.21435 0.02 5.61
27 1550 1560 4409 5.88 0.52545 0.03 0.92
27 1560 1570 4410 4.67 0.18015 0.04 0.99
28 1010 1020 4429 5.14 0.16247 0.02 0.38
28 1020 1030 4430 6.75 Hole 0.10743 0.02 0.44
28 1030 1040 4431 7.09 Hole 0.21352 0.01 0.49
28 1040 1050 4432 6.56 0.20851 0.02 0.48
28 1050 1060 4433 6.48 0.1603 0.03 0.97
28 1060 1070 4434 6.06 0.15063 0.03 0.55
28 1070 1080 4435 6.64 0.18516 0.03 0.57
28 1080 1090 4436 6.5 Hole 0.18516 0.03 0.67
28 1090 1100 4437 6.76 0.13161 0.02 0.59
28 1100 1110 4438 5.72 0.1126 0.03 0.45
28 1110 1120 4439 5.33 0.1166 0.02 0.49
28 1120 1130 4440 7.23 0.17181 0.04 0.74
28 1130 1140 4441 5.25 0.11543 0.03 0.47
28 1140 1150 4442 5.12 0.38032 0.01 0.58
28 1150 1160 4443 5.87 0.20518 0.01 2.64
28 1160 1170 4444 5.7 0.24688 0.01 0.48
28 1170 1180 4445 5.85 0.16848 0.02 0.37
28 1180 1190 4446 7.16 0.18516 0.02 0.37
28 1190 1200 4447 7.26 0.1518 0.01 0.2
29 1290 1300 4471 5.69 0.2352 0.09 2.77
29 1300 1310 4472 6.03 0.24188 0.07 1.88
29 1310 1320 4473 6.25 0.1498 0.03 0.84
29 1320 1330 4474 4.68 0.14496 0.04 2.17
29 1330 1340 4475 5.27 0.13111 0.07 1.59
29 1340 1350 4476 5.46 0.16514 0.04 1.14
29 1350 1360 4477 5.36 0.16314 0.04 1.02
29 1360 1370 4478 5.16 0.15096 0.06 1.94
29 1370 1380 4479 5.91 0.17181 0.06 1.31
29 1380 1390 4480 5.9 0.10876 0.06 1.32
29 1390 1400 4481 5.33 0.1885 0.06 1.46
29 1400 1410 4482 5.07 0.17515 0.03 1.13
29 1410 1420 4483 5.21 0.21685 0.03 0.75
29 1420 1430 4484 4.84 0.25856 0.03 0.71
29 1430 1440 4485 6.04 0.16147 0.08 1.71
wt. ave 0.1736113 0.033 1.063
304.2 Ar. Av. 0.17678 0.033 1.077
SGS Vancouver Metallurgy
CONFIDENTIAL 4
Mosquito Consolidated Gold Mines – CUMO Project - CAVM-50004-001 - 1 -
SGS Mineral Services
APPENDIX B
Grindability Test Data

SPI Tests Client:
Mod. Bond Tests Mine:
Std. Bond Tests
Crusher Tests Project No.:
Date:
3 SPI Tests Mod Bond Wi Std. Bond Wi
(Work Index) (Work Index)
at Pinion at Pinion
3 Crusher Tests
kWh/tonne kWh/tonne
1-2780 Cu-Mo Comp 1 10.9 84.5
1-2781 Cu-Mo Comp 2 14.5 73.0
1-2782 Cu-Mo Comp 3 16.5 70.8
Closing Screen of 0
microns GIVES
Closing Screen of 0
microns GIVESSGS Ref. No Sample ID SPI (minutes)
Ci (Crusher
Index)
April 30, 2008
Consolidated Gold Mines
Mosquito
50004-001
Consolidated Gold Mines SPI ProfileCompared to SPI Profiles of Operating Mines in the
SGS MinnovEX Database
0%
10%
20%
30%
40%
50%
60%
70%
80%
90%
100%
0 50 100 150 200 250 300 350 400
SAG Power Index
Cu
mu
lati
ve
%
Consolidated Gold Mines Plant A - AG (109) Plant B - SAG (1090)
Plant C - SAG (509) Plant D - SAG (81) Plant E - AG (190)
1

0
200
400
600
800
1000
1200
2.5 7.5 12.5 17.5 22.5 27.5 32.5 37.5 42.5 47.5 52.5 57.5 62.5 67.5 >70
Crusher Index -Metric
Fre
qu
en
cy
Database
Consolidated Gold Mines
2

SGS Minerals Services
Standard Bond Ball Mill Grindability Test
Project No.: 50004-001 Product: Minus 6 Mesh Date: ###########
Sample.: Comp1
Purpose: To determine the ball mill grindability of the sample in terms of a Bond
work index number.
Procedure: The equipment and procedure duplicate the Bond method for
determining ball mill work indices.
Test Conditions: Mesh of grind: 100 mesh
Test feed weight (700 mL): 1259.01 grams
Equivalent to : 1799 kg/m³ at Minus 6 mesh
Weight % of the undersize material in the ball mill feed: 12.5 %
Weight of undersize product for 250% circulating load: 360 grams
Results: Average for Last Three Stages = Circulation load
CALCULATION OF A BOND WORK INDEX
P1 = 100% passing size of the product 150 microns
Grp = Grams per revolution 1.47 grams
P80 = 80% passing size of product 113 microns
F80 = 80% passing size of the feed 2007 microns
BWI = 14.3 (imperial)
BWI = 15.8 (metric)
1.47g. 244%
BWI =44.5
P1 x xGrp0.23 0.82 10 10
P F{
{
Comp1-BWI-50004-001 Results
updated 2/23/2009 CONFIDENTIAL Page 1 of 3
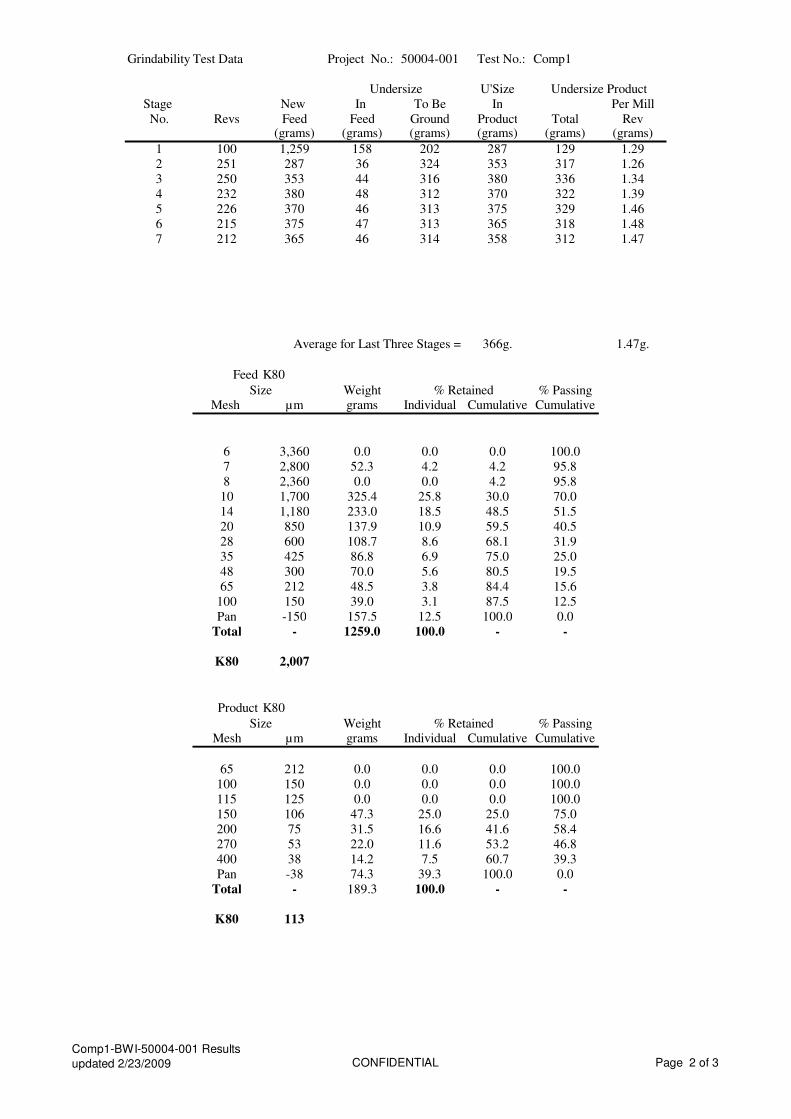
Grindability Test Data Project No.: 50004-001 Test No.: Comp1
Undersize U'Size Undersize Product
Stage New In To Be In Per Mill
No. Revs Feed Feed Ground Product Total Rev(grams) (grams) (grams) (grams) (grams) (grams)
1 100 1,259 158 202 287 129 1.29
2 251 287 36 324 353 317 1.26
3 250 353 44 316 380 336 1.34
4 232 380 48 312 370 322 1.39
5 226 370 46 313 375 329 1.46
6 215 375 47 313 365 318 1.48
7 212 365 46 314 358 312 1.47
Average for Last Three Stages = 366g. 1.47g.
Feed K80
Size Weight % Retained % PassingMesh µm grams Individual Cumulative Cumulative
6 3,360 0.0 0.0 0.0 100.0
7 2,800 52.3 4.2 4.2 95.8
8 2,360 0.0 0.0 4.2 95.8
10 1,700 325.4 25.8 30.0 70.0
14 1,180 233.0 18.5 48.5 51.5
20 850 137.9 10.9 59.5 40.5
28 600 108.7 8.6 68.1 31.9
35 425 86.8 6.9 75.0 25.0
48 300 70.0 5.6 80.5 19.5
65 212 48.5 3.8 84.4 15.6
100 150 39.0 3.1 87.5 12.5
Pan -150 157.5 12.5 100.0 0.0
Total - 1259.0 100.0 - -
K80 2,007
Product K80
Size Weight % Retained % PassingMesh µm grams Individual Cumulative Cumulative
65 212 0.0 0.0 0.0 100.0
100 150 0.0 0.0 0.0 100.0
115 125 0.0 0.0 0.0 100.0
150 106 47.3 25.0 25.0 75.0
200 75 31.5 16.6 41.6 58.4
270 53 22.0 11.6 53.2 46.8
400 38 14.2 7.5 60.7 39.3
Pan -38 74.3 39.3 100.0 0.0
Total - 189.3 100.0 - -
K80 113
Comp1-BWI-50004-001 Results
updated 2/23/2009 CONFIDENTIAL Page 2 of 3

Project No.: 50004-001 Test No.: Comp1
Particle Size Distribution
0
10
20
30
40
50
60
70
80
90
100
10 100 1,000 10,000
Screen Size (micrometers)
Cu
mu
lati
ve
% P
ass
ing
Feed
Product
Comp1-BWI-50004-001 Results
updated 2/23/2009 CONFIDENTIAL Page 3 of 3

SGS Minerals Services
Standard Bond Ball Mill Grindability Test
Project No.: 50004-001 Product: Minus 6 Mesh Date: ###########
Sample.: Comp2
Purpose: To determine the ball mill grindability of the sample in terms of a Bond
work index number.
Procedure: The equipment and procedure duplicate the Bond method for
determining ball mill work indices.
Test Conditions: Mesh of grind: 100 mesh
Test feed weight (700 mL): 1268.59 grams
Equivalent to : 1812 kg/m³ at Minus 6 mesh
Weight % of the undersize material in the ball mill feed: 11.5 %
Weight of undersize product for 250% circulating load: 362 grams
Results: Average for Last Three Stages = Circulation load
CALCULATION OF A BOND WORK INDEX
P1 = 100% passing size of the product 150 microns
Grp = Grams per revolution 1.45 grams
P80 = 80% passing size of product 113 microns
F80 = 80% passing size of the feed 2214 microns
BWI = 14.3 (imperial)
BWI = 15.7 (metric)
1.45g. 248%
BWI =44.5
P1 x xGrp0.23 0.82 10 10
P F{
{
Comp2-BWI-50004-001 Results
updated 2/23/2009 CONFIDENTIAL Page 1 of 3

Grindability Test Data Project No.: 50004-001 Test No.: Comp2
Undersize U'Size Undersize Product
Stage New In To Be In Per Mill
No. Revs Feed Feed Ground Product Total Rev(grams) (grams) (grams) (grams) (grams) (grams)
1 100 1,269 146 216 271 125 1.25
2 265 271 31 331 360 328 1.24
3 259 360 42 321 393 351 1.36
4 234 393 45 317 381 336 1.44
5 222 381 44 318 368 324 1.46
6 219 368 42 320 354 312 1.42
7 226 354 41 322 372 331 1.47
Average for Last Three Stages = 365g. 1.45g.
Feed K80
Size Weight % Retained % PassingMesh µm grams Individual Cumulative Cumulative
6 3,360 0.0 0.0 0.0 100.0
7 2,800 82.0 6.5 6.5 93.5
8 2,360 0.0 0.0 6.5 93.5
10 1,700 399.2 31.5 37.9 62.1
14 1,180 199.4 15.7 53.6 46.4
20 850 120.4 9.5 63.1 36.9
28 600 96.1 7.6 70.7 29.3
35 425 79.3 6.3 77.0 23.0
48 300 63.5 5.0 82.0 18.0
65 212 43.6 3.4 85.4 14.6
100 150 38.8 3.1 88.5 11.5
Pan -150 146.4 11.5 100.0 0.0
Total - 1268.6 100.0 - -
K80 2,214
Product K80
Size Weight % Retained % PassingMesh µm grams Individual Cumulative Cumulative
65 212 0.0 0.0 0.0 100.0
100 150 0.0 0.0 0.0 100.0
115 125 0.0 0.0 0.0 100.0
150 106 49.7 25.2 25.2 74.8
200 75 33.9 17.2 42.4 57.6
270 53 23.1 11.7 54.1 45.9
400 38 14.2 7.2 61.3 38.7
Pan -38 76.2 38.7 100.0 0.0
Total - 197.0 100.0 - -
K80 113
Comp2-BWI-50004-001 Results
updated 2/23/2009 CONFIDENTIAL Page 2 of 3

Project No.: 50004-001 Test No.: Comp2
Particle Size Distribution
0
10
20
30
40
50
60
70
80
90
100
10 100 1,000 10,000
Screen Size (micrometers)
Cu
mu
lati
ve
% P
ass
ing
Feed
Product
Comp2-BWI-50004-001 Results
updated 2/23/2009 CONFIDENTIAL Page 3 of 3

SGS Minerals Services
Standard Bond Ball Mill Grindability Test
Project No.: 50004-001 Product: Minus 6 Mesh Date: ###########
Sample.: Comp3
Purpose: To determine the ball mill grindability of the sample in terms of a Bond
work index number.
Procedure: The equipment and procedure duplicate the Bond method for
determining ball mill work indices.
Test Conditions: Mesh of grind: 100 mesh
Test feed weight (700 mL): 1276.6 grams
Equivalent to : 1824 kg/m³ at Minus 6 mesh
Weight % of the undersize material in the ball mill feed: 12.3 %
Weight of undersize product for 250% circulating load: 365 grams
Results: Average for Last Three Stages = Circulation load
CALCULATION OF A BOND WORK INDEX
P1 = 100% passing size of the product 150 microns
Grp = Grams per revolution 1.87 grams
P80 = 80% passing size of product 112 microns
F80 = 80% passing size of the feed 2255 microns
BWI = 11.4 (imperial)
BWI = 12.6 (metric)
1.87g. 251%
BWI =44.5
P1 x xGrp0.23 0.82 10 10
P F{
{
Comp3-BWI-50004-001 Results
updated 2/23/2009 CONFIDENTIAL Page 1 of 3

Grindability Test Data Project No.: 50004-001 Test No.: Comp3
Undersize U'Size Undersize Product
Stage New In To Be In Per Mill
No. Revs Feed Feed Ground Product Total Rev(grams) (grams) (grams) (grams) (grams) (grams)
1 100 1,277 157 208 293 136 1.36
2 241 293 36 329 390 354 1.47
3 215 390 48 317 403 355 1.65
4 191 403 50 315 386 336 1.76
5 180 386 47 317 366 318 1.77
6 181 366 45 320 369 324 1.79
7 178 369 45 319 374 329 1.85
8 173 374 46 319 369 323 1.87
9 171 369 45 319 368 323 1.89
10 169 368 45 319 365 319 1.89
11 169 365 45 320 357 312 1.85
Average for Last Three Stages = 363g. 1.87g.
Feed K80
Size Weight % Retained % PassingMesh µm grams Individual Cumulative Cumulative
6 3,360 0.0 0.0 0.0 100.0
7 2,800 93.1 7.3 7.3 92.7
8 2,360 0.0 0.0 7.3 92.7
10 1,700 410.3 32.1 39.4 60.6
14 1,180 197.0 15.4 54.9 45.1
20 850 114.3 8.9 63.8 36.2
28 600 88.3 6.9 70.7 29.3
35 425 70.5 5.5 76.3 23.7
48 300 52.8 4.1 80.4 19.6
65 212 48.0 3.8 84.1 15.9
100 150 45.3 3.6 87.7 12.3
Pan -150 157.1 12.3 100.0 0.0
Total - 1276.6 100.0 - -
K80 2,255
Product K80
Size Weight % Retained % PassingMesh µm grams Individual Cumulative Cumulative
65 212 0.0 0.0 0.0 100.0
100 150 0.0 0.0 0.0 100.0
115 125 0.0 0.0 0.0 100.0
150 106 48.3 24.8 24.8 75.2
200 75 36.5 18.7 43.5 56.5
270 53 25.4 13.0 56.5 43.5
400 38 16.2 8.3 64.8 35.2
Pan -38 68.7 35.2 100.0 0.0
Total - 194.9 100.0 - -
K80 112
Comp3-BWI-50004-001 Results
updated 2/23/2009 CONFIDENTIAL Page 2 of 3

Project No.: 50004-001 Test No.: Comp3
Particle Size Distribution
0
10
20
30
40
50
60
70
80
90
100
10 100 1,000 10,000
Screen Size (micrometers)
Cu
mu
lati
ve
% P
ass
ing
Feed
Product
Comp3-BWI-50004-001 Results
updated 2/23/2009 CONFIDENTIAL Page 3 of 3

Mosquito Consolidated Gold Mines – CUMO Project - CAVM-50004-001 - 1 -
SGS Mineral Services
APPENDIX C
Flotation Test Data

Mosquito Consolidated Gold Mines - CUMO Project - CAVM-50004-001
Test No.: VF1-1 Operator: Wei Date: 15-Apr-08
Purpose: Determine the flotation kinetics
Procedure: As outlined below.
Feed: 2 kg of minus 10 mesh of Composite # 1 (Cu - Ag Composite)
Grind: 49.1 minutes / 2 kg @ 65% solids in laboratory Ball Mill target K80 63
Regrind: Tested K80 62
Conditions:
Stage
F.O Lime 3302 3418 A MIBC Grind Cond. Froth
Grind 20 49.1 8.2
Condition 30 20 10 5 8.5
Rough. 1 25 2
Condition 5 1 8.7
Rough 2 5 3
Condition 5 1 8.7
Rough. 3 5
Condition 5 1 8.7
Rough. 4 5
Total 20 30 20 25 0 30 0
Stage 1st Cleaners 2nd Cleaners
Flotation Cell 500 -D12 250 -D12
Speed: rpm 1600 1100
Qualitative Observations:
Less bubble formed at the stage of Ro.1
Good froth at stages of Ro. 2, 3, and 4 -- yellow/sand color
Metallurgical Balance
Product Assays, g/t, % Distribution - %
g % Cu Mo Ag S Cu Mo Ag S
Ro. 1 Con 30.1 1.52 5.14 8764 147 8.98 54.90 70.56 53.03 55.95
Ro. 2 Con 41.6 2.10 0.84 1092 31.3 2.72 12.40 12.15 15.61 23.42
Ro. 3 Con 46.1 2.32 0.22 180 8.58 0.44 3.60 2.22 4.74 4.20
Ro. 4 Con 33.3 1.68 0.15 95 6.1 0.18 1.77 0.85 2.43 1.24
Ro. Tails 1834.3 92.39 0.042 29 1.1 0.04 27.34 14.23 24.18 15.19
Head (calc.) 1985.4 100.0 0.14 188 4.2 0.24 100 100 100 100
(direct)
Combined Products
Ro 1 con 30.1 1.52 5.14 8764 147 8.98 54.90 70.56 53.03 55.95
Ro 1 to 2 con 71.7 3.6 2.65 4313 80 5.3 67.29 82.71 68.64 79.37
Ro 1 to 3 con 117.8 5.9 1.70 2695 52 3.43 70.89 84.93 73.38 83.57
Ro 1 to 4 con 151.1 7.6 1.36 2122 42 2.71 72.66 85.77 75.82 84.81
Total Rec.
Time, minutes
Project No.: 50004-001
pH EhReagents added, grams per tonne
Rougher
1000-D12
1800
Weight
SGS Vancouver Metallurgy
CONFIDENTIAL 1

Mosquito Consolodated Gold Mines - CUMO Project - CAVM-50004-001
Test No.: VF1-2 Operator: Wei Date: 16-Apr-08
Purpose: Determine the flotation kinetics
Procedure: As outlined below.
Feed: 2 kg of minus 10 mesh of Composite # 1 (Cu - Ag Composite)
Grind: 32.9 minutes / 2 kg @ 65% solids in laboratory Ball Mill target K80 125
Regrind: teasted K80 111
Conditions:
Stage
F.O Lime 3302 3418 A MIBC Grind Cond. Froth
Grind 20 32.9 8.1
Condition 20 20 10 5 8.8
Rough. 1 25 2
Condition 5 1
Rough 2 3 8.8
Condition 5 1
Rough. 3 3 8.8
Condition 5 1
Rough. 4 3 8.8
Total 20 20 20 25 0 25 0
Stage 1st Cleaners 2nd Cleaners
Flotation Cell 500 -D12 250 -D12
Speed: rpm 1600 1100
Qualitative Observations:
Metallurgical Balance
Product Assays, g/t, % Distribution - %
g % Cu Mo Ag S Cu Mo Ag S
Ro. 1 Con 24.3 1.22 5.88 10451 167 10.7 44.85 71.22 49.35 53.78
Ro. 2 Con 34.5 1.74 0.86 781 34.1 2.56 9.31 7.56 14.31 18.27
Ro. 3 Con 27.5 1.38 0.33 227 12.1 0.54 2.85 1.75 4.05 3.07
Ro. 4 Con 22.8 1.15 0.24 161 9.36 0.33 1.72 1.03 2.60 1.56
Ro. Tails 1878.7 94.51 0.07 35 1.3 0.06 41.28 18.44 29.70 23.32
Head (calc.) 1987.8 100.0 0.16 179 4.1 0.24 100 100 100 100
(direct)
Combined Products
Ro 1 con 24.3 1.22 5.88 10451 167 10.70 44.85 71.22 49.35 53.78
Ro 1 to 2 con 58.8 3.0 2.93 4777 89 5.92 54.16 78.78 63.66 72.05
Ro 1 to 3 con 86.3 4.3 2.10 3327 65 4.21 57.01 80.53 67.70 75.13
Ro 1 to 4 con 109.1 5.5 1.71 2666 53 3.40 58.72 81.56 70.30 76.68
Total Rec.
Rougher
1000-D12
1800
Weight
Time, minutes
Project No.: 50004-001
pH EhReagents added, grams per tonne
SGS Vancouver Metallurgy
CONFIDENTIAL 2

Mosquito Consolidated Gold Mines - CUMO Project - CAVM-50004-001
Test No.: VF1-3 Operator: Wei Date: 1-May-08
Purpose: Determine the flotation character during cleaning
Procedure: As outlined below.
Feed: 2 kg of minus 10 mesh of Composite # 1 (Cu - Ag Composite)
Grind: 49.1 minutes / 2 kg @ 65% solids in laboratory Ball Mill target K80 63
Regrind: Tested K80
Conditions:
Stage
Diesel Oil Lime 3302 SIBX Pine Oil Grind Cond. Froth
Grind 20 49.1 8.3
Condition 25 30 5 8.6
Rougher 20 12 8.6
Regrind 5 15
Condition 5 5 3 8.5
Bulk Cleaner 1 7 6
Condition 1 1 1 8.5
Bulk Cleaner 2 2 2
Condition 10 10.2
Bulk Cleaner 3 0.5 1
Total 25 10 31 36 0 29.5 0
Stage 1st Cleaners 2nd Cleaners
Flotation Cell 500 -D12 250 -D12
Speed: rpm 1600 1100
Qualitative Observations:
Metallurgical Balance
Product Assays, g/t, % Distribution - %
g % Cu Mo Ag W Cu Mo Ag W
Cln 3 Conc. 7.4 0.38 19.8 33200 596 800 50.40 68.75 49.89 0.38
Cln 3 Tails 1.8 0.09 11.2 14020 105 800 6.93 7.06 2.14 0.09
Cln 2 Tails 3.8 0.19 1.94 1960 83.2 800 2.54 2.08 3.58 0.19
Cln 1 Tails 45.3 2.30 0.17 140 6.48 800 2.65 1.77 3.32 2.30
Ro. Tails 1911.5 97.04 0.057 38 1.9 800 37.48 20.33 41.08 97.04
Head (calc.) 1969.8 100.0 0.15 181 4.5 800 100 100 100 100
(direct)
Combined Products
Cln 3 Conc. 7.4 0.38 19.80 33200 596 800 50.40 68.75 49.89 0.38
Cln 2 Conc. 9.2 0.5 18.12 29447 500 800 57.34 75.81 52.02 0.47
Cln 1 Conc. 13.0 0.7 13.39 21413 378 800 59.87 77.90 55.60 0.66
Roug. Conc. 58.3 3.0 3.12 4883 89 800 62.52 79.67 58.92 2.96
Ag assay of Cln 3 tail was not assayed due to insufficient sample; An educated guess was placed.
W assays not entered as all assays reported as < 800 ppm
Rougher
1000-D12
1800
Weight
Time, minutes
Project No.: 50004-001
pH EhReagents added, grams per tonne
SGS Vancouver Metallurgy
CONFIDENTIAL 3

Mosquito Consolodated Gold Mines - CUMO Project - CAVM-50004-001
Test No.: VF1-4 Operator: Wei Date: 15-May-08
Purpose: Determine the flotation character during cleaning
Procedure: As outlined below.
Feed: 2 kg of minus 10 mesh of Composite # 1 (Cu - Ag Composite)
Grind: 56 minutes / 2 kg @ 65% solids in laboratory Ball Mill target K80
Regrind: Tested K80 54
Conditions:
Stage
Diesel Oil Lime 3302 SIBX F1234 X -133 Grind Cond. Froth
Grind 20 56 8.2
Condition 20 25 5 8.6
Rougher 1 20 5
Condition 5 1
Rougher 2 5 5
Condition 5 1
Rougher 3 5
Regrind 5 15
Condition 5 5 3
Bulk Cleaner 1 2 6
Condition 1
Bulk Cleaner 2 1 1 2
Condition 20 10.5
Bulk Cleaner 3 1
Total 25 20 26 36 5 27 0
Stage 1st Cleaners 2nd Cleaners
Flotation Cell 500 -D12 250 -D12
Speed: rpm 1600 1100
Qualitative Observations:
Metallurgical Balance
Product Assays, g/t, % Distribution - %
g % Cu Mo Ag W Cu Mo Ag W
Cln 3 Conc. 12.9 0.65 15.3 23000 462 20 64.03 81.35 64.88 0.43
Cln 3 Tails 5.8 0.29 0.97 900 48.9 20 1.83 1.43 3.09 0.19
Cln 2 Tails 11.7 0.59 0.26 200 12.4 30 0.99 0.64 1.58 0.59
Cln 1 Tails 70.9 3.59 0.12 60 3.78 40 2.76 1.17 2.92 4.74
Ro. Tails 1874.0 94.87 0.05 30 1.35 30 30.40 15.41 27.54 94.04
Head (calc.) 1975.3 100.0 0.16 185 4.7 30 100 100 100 100
(direct)
Combined Products
Cln 3 Conc. 12.9 0.65 15.30 23000 462 20 64.03 81.35 64.88 0.43
Cln 2 Conc. 18.7 0.9 10.86 16145 334 20 65.86 82.78 67.96 0.63
Cln 1 Conc. 30.4 1.5 6.78 10009 210 24 66.84 83.42 69.54 1.21
Roug. Conc. 101.3 5.1 2.12 3046 66 35 69.60 84.59 72.46 5.96
Notes: The assay of W of cleaner 3 conc and cleaner 3 tail were below the detection limits and hence the detection limits were assumed
Time, minutes
Project No.: 50004-001
pH EhReagents added, grams per tonne
Rougher
1000-D12
1800
Weight
SGS Vancouver Metallurgy
CONFIDENTIAL 4

Mosquito Consolidated Gold Mines - CUMO Project - CAVM-50004-001
Test No.: VF1-5 Operator: Wei Date: 26-May-08
Purpose: Determine the flotation character during cleaning
Procedure: As outlined below.
Feed: 2 kg of minus 10 mesh of Composite # 1 (Cu - Ag Composite)
Grind: 56 minutes / 2 kg @ 65% solids in laboratory Ball Mill target K80 54
Regrind: 22 minutes in a ceramic mill Tested K80
Conditions:
Stage
Lime 3477 SIBX X -133 Grind Cond. Froth
Grind 56
Condition 10 25 5 8.6
Rougher 1 20 5
Condition 5 5 1
Rougher 2 10 5
Condition 2 2 1
Rougher 3 5 5
Regrind 22
Condition 2 4 3
Bulk Cleaner 1 5
Condition 1
Bulk Cleaner 2 1 1 2
Condition 10.5
Bulk Cleaner 3 0.5
Total 0 0 20 37 0 35 0
Stage 1st Cleaners 2nd Cleaners
Flotation Cell 500 -D12 250 -D12
Speed: rpm 1600 1100
Qualitative Observations:
Metallurgical Balance
Product Assays, g/t, % Distribution - %
g % Cu Mo Ag W Cu Mo Ag W
Cln 3 Conc. 10.3 0.52 16.4 26819 539 20 55.68 79.06 41.24 0.26
Cln 3 Tails 10.2 0.51 0.8 1068 32.4 70 2.69 3.12 2.45 0.90
Cln 2 Tails 22.5 1.13 0.17 116 1.7 40 1.26 0.74 0.28 1.13
Cln 1 Tails 112.2 5.63 0.095 58 1.9 40 3.51 1.86 1.54 5.62
Ro. Tails 1837.4 92.21 0.061 29 4 40 36.87 15.22 54.49 92.10
Head (calc.) 1992.6 100.0 0.15 176 6.8 40 100 100 100 100
(direct)
Combined Products
Cln 3 Conc. 10.3 0.52 16.40 26819 539 20 55.68 79.06 41.24 0.26
Cln 2 Conc. 20.5 1.0 8.64 14006 287 45 58.37 82.18 43.69 1.16
Cln 1 Conc. 43.0 2.2 4.22 6753 138 42 59.62 82.92 43.98 2.28
Roug. Conc. 155.2 7.8 1.24 1913 40 41 63.13 84.78 45.51 7.90
Total Rec.
The W assay for cleaner 3 conc was reported as <.002 %
Rougher
1000-D12
1800
Weight
Time, minutes
Project No.: 50004-001
pH EhReagents added, grams per tonne
SGS Vancouver Metallurgy
CONFIDENTIAL 5

Mosquito Consolidated Gold Mines - CUMO Project - CAVM-50004-001
Test No.: VF1-LCT1 Operator: Wei / Bruce Date: 11-Jul-08
Purpose: Locked Cycle Test
Procedure: As outlined below.
Feed: 2 kg of minus 10 mesh of Composite # 1 (Cu - Ag Composite)
Grind: 49 minutes / 2 kg @ 65% solids in laboratory Ball Mill target K80 54
Regrind: As outlined below. Tested K80
Conditions:
Stage
Moly Oil Lime 3302 SIBX X -133 Grind Cond. Froth
Primary Grind 20 56
Condition 15 25 5
Rougher 1 30 5
Condition 5 5 1
Rougher 2 5 5
Condition 5 5 1
Rougher 3 2 5
Regrind 5 10
Condition 5 5 3 3
Cleaner 1 4
Cleaner Scav 1 1 1 1
Condition 1 1
Cleaner 2 3
Condition 20 1 1 9.5
Cleaner 3 1
Total 25 20 33 43 0 41 0
Stage 1st Cleaners 2nd Cleaners
Flotation Cell 500 -D12 250 -D12
Speed: rpm 1600 1100
Qualitative Observations:
Note; The W assay of the final concentrtate of all the cycles, were below the detection level of 0.002 % and hence they were assumed to be 0.002%
Metallurgical Balance The Ga assay of final conc and final tail were below the detecion level of 0.004%. The Re assay of the final concentrate was 0.9 g/t
Weight Assays - %, ppm Distribution - %
g. % Cu Mo Ag W Cu Mo Ag W
1 3rd
Cleaner conc A 14.20 0.12 14.2 2.17 445.0 0.002 10.63 13.65 13.34 0.06
2 3rd
Cleaner conc B 15.50 0.13 13.1 1.95 357.0 0.002 10.70 13.39 11.68 0.07
3 3rd
Cleaner conc C 15.30 0.13 13.4 2.05 362.0 0.002 10.81 13.89 11.69 0.06
4 3rd
Cleaner conc D 15.40 0.13 13.1 2.02 365.0 0.002 10.63 13.78 11.87 0.06
5 3rd
Cleaner conc E 15.10 0.13 13.4 2.06 376.0 0.002 10.67 13.78 11.99 0.06
6 3rd
Cleaner conc F 15.50 0.13 12.6 1.92 331.0 0.002 10.29 13.18 10.83 0.07
7 3rd
Cleaner tail F 11.49 0.10 0.58 0.0420 24.1 0.004 0.35 0.21 0.58 0.10
8 2nd
Cleaner tail F 26.39 0.22 0.17 0.0100 6.1 0.005 0.24 0.12 0.34 0.28
9 1st Clean/Scav conc F 5.68 0.05 0.28 0.0180 11.0 0.005 0.08 0.05 0.13 0.06
10 1st Clean/Scav tail A 130.52 1.10 0.088 0.0052 2.3 0.004 0.61 0.30 0.63 1.10
11 1st Clean/Scav tail B 122.34 1.03 0.075 0.0050 2.2 0.004 0.48 0.27 0.57 1.03
12 1st Clean/Scav tail C 147.15 1.24 0.077 0.0049 2.3 0.004 0.60 0.32 0.71 1.24
13 1st Clean/Scav tail D 131.77 1.11 0.088 0.0055 2.6 0.004 0.61 0.32 0.72 1.11
14 1st Clean/Scav tail E 136.71 1.15 0.085 0.0051 2.6 0.004 0.61 0.31 0.75 1.15
15 1st Clean/Scav tail F 146.41 1.24 0.079 0.0051 2.4 0.005 0.61 0.33 0.74 1.54
16 Rougher tail A 1807.76 15.26 0.064 0.0035 1.1 0.004 6.10 2.80 4.20 15.26
17 Rougher tail B 1834.51 15.48 0.050 0.0034 1.0 0.004 4.83 2.76 3.87 15.48
18 Rougher tail C 1807.21 15.25 0.049 0.0033 1.0 0.004 4.67 2.64 3.82 15.25
19 Rougher tail D 1830.72 15.45 0.064 0.0033 1.0 0.004 6.18 2.68 3.87 15.45
20 Rougher tail E 1815.89 15.32 0.052 0.0033 1.0 0.004 4.98 2.65 3.83 15.33
21 Rougher tail F 1804.40 15.23 0.056 0.0032 1.0 0.004 5.33 2.56 3.81 15.23
Head - (Calculated) 11850.0 100.00 0.160 0.0191 4.0 0.004 100.00 100.00 100.00 100.00
Head - (Direct) 12000 98.75 0.15 0.017
pH Eh
Rougher
1000-D12
Product
Project No.: 50004-001
Reagents added, grams per tonne Time, minutes
1800
SGS Vancouver Metallurgy
CONFIDENTIAL

Mosquito Consolidated Gold Mines - CUMO Project - CAVM-50004-001
Metallurgical Prediction (Using Cycles D,E,F)
Final Conc. 92 0.78 13.03 1.9994 357.2 0.002 63.31 82.16 71.65 0.39
Cleaner/Scav Tail 829.78 7.00 0.08 0.0052 2.5 0.004 3.67 1.94 4.58 7.62
Rougher Tail 10902.02 92.00 0.06 0.0033 1.0 0.004 33.02 15.91 23.77 91.99
Head - (Calculated) 11823.8 99.78 0.16 0.0189 3.9 0.004 100.00 100.00 100.00 100.00
Head - (Direct) 12000 98.53 0.15 0.017
Cleaner Circuit Mass Rec Upgrade Unit Recovery - %
Unit Performance 9.71 9.47 9.79 9.42 0.49 94.52 97.70 94.00 4.85
Overall Stability
Total Product Weight Units Out as a% of Units In/cycle
Out per cycle Cyc. # % Cu Mo Ag W
Cycle A 1 98.86 103.99 100.52 109.05 98.51
Cycle B 2 99.87 96.13 98.54 96.76 99.48
Cycle C 3 99.73 96.43 101.13 97.35 99.35
Cycle D 4 100.15 104.52 100.67 98.75 99.76
Cycle E 5 99.63 97.53 100.46 99.44 99.26
Cycle F 6 99.56 97.38 96.43 92.31 101.03
Average of E to F 99.60 97.45 98.44 95.88 100.14
Average of D to F 99.78 99.81 99.18 96.83 100.02
Average of C to F 99.77 98.96 99.67 96.96 99.85
Circuit Stability
70.00
75.00
80.00
85.00
90.00
95.00
100.00
105.00
110.00
115.00
120.00
0 1 2 3 4 5 6 7
Cycles - Number
Weig
ht,
Meta
l U
nit
s -
%
Weight Cu Units Mo Units Ag Units W Units
SGS Vancouver Metallurgy
CONFIDENTIAL

Mosquito Consolodated Gold Mines - CUMO Project - CAVM-50004-001
SGS Minerals Services Project No.
Size Distribution Analysis 50004-001
Sample: Comp 1 - Ro Tails Test No.: VF1-1
Size Weight % Retained % Passing
Mesh µm grams Individual Cumulative Cumulative
48 300 0.0 0.0 0.0 100.0
65 212 0.1 0.1 0.1 99.9
100 150 0.4 0.4 0.5 99.5
150 106 2.6 2.6 3.1 96.9
200 75 8.8 8.8 11.9 88.1
270 53 14.8 14.8 26.7 73.3
400 38 14.4 14.4 41.1 58.9
Pan -38 59.0 58.9 100.0 0.0
Total - 100.1 100.0 - -
K80 62
Particle Size Distribution
0
10
20
30
40
50
60
70
80
90
100
10 100 1,000
Screen Size (micrometers)
Cum
ula
tive %
Passin
g
K80 = 62 µm
SGS Vancouver Metallurgy
CONFIDENTIAL 1

Mosquito Consolidated Gold Mines - CUMO Project - CAVM-50004-001
SGS Minerals Services Project No.
Size Distribution Analysis 50004-001
Sample: Comp 1 - Ro Tails Test No.: VF1-2
Size Weight % Retained % Passing
Mesh µm grams Individual Cumulative Cumulative
48 300 0.1 0.1 0.1 99.9
65 212 1.6 1.6 1.7 98.3
100 150 7.1 7.1 8.8 91.2
150 106 12.6 12.6 21.4 78.6
200 75 15.0 15.0 36.4 63.6
270 53 13.0 13.0 49.4 50.6
400 38 8.7 8.7 58.2 41.8
Pan -38 41.8 41.8 100.0 0.0
Total - 99.9 100.0 - -
K80 111
Particle Size Distribution
0
10
20
30
40
50
60
70
80
90
100
10 100 1,000
Screen Size (micrometers)
Cum
ula
tive %
Passin
g
K80 = 111 µm
SGS Vancouver Metallurgy
CONFIDENTIAL 2

Mosquito Consolidated Gold Mines - CUMO Project - CAVM-50004-001
SGS Minerals Services Project No.
Size Distribution Analysis 50004-001
Sample: Comp 1 - Ro Tails Test No.: VF1-4
Size Weight % Retained % Passing
Mesh µm grams Individual Cumulative Cumulative
48 300 0.0 0.0 0.0 100.0
65 212 0.0 0.0 0.0 100.0
100 150 0.2 0.2 0.2 99.8
150 106 1.4 1.3 1.4 98.6
200 75 6.5 5.9 7.3 92.7
270 53 14.4 13.0 20.4 79.6
400 38 18.1 16.4 36.7 63.3
Pan -38 69.9 63.3 100.0 0.0
Total - 110.5 100.0 - -
K80 54
Particle Size Distribution
0
10
20
30
40
50
60
70
80
90
100
10 100 1,000
Screen Size (micrometers)
Cum
ula
tive %
Passin
g
K80 = 54 µm
SGS Vancouver Metallurgy
CONFIDENTIAL 3

Mosquito Consolidated Gold Mines - CUMO Project - CAVM-50004-001
SGS Minerals Services Project No.
Size Distribution Analysis 50004-001
Sample: Comp 1 Clen 1 Tail Test No.: VF1-5
Size Weight % Retained % Passing
Mesh µm grams Individual Cumulative Cumulative
65 212 0.0 0.0 0.0 100.0
100 150 0.0 0.0 0.0 100.0
150 106 0.0 0.0 0.0 100.0
200 75 0.0 0.0 0.0 100.0
270 53 0.0 0.0 0.0 100.0
400 38 2.5 5.5 5.5 94.5
635 20 2.0 4.4 9.9 90.1
-635 -20 41.8 90.1 100.0 0.0
Total - 46.4 100.0 - -
K80 #N/A
SGS Vancouver Metallurgy
CONFIDENTIAL 4
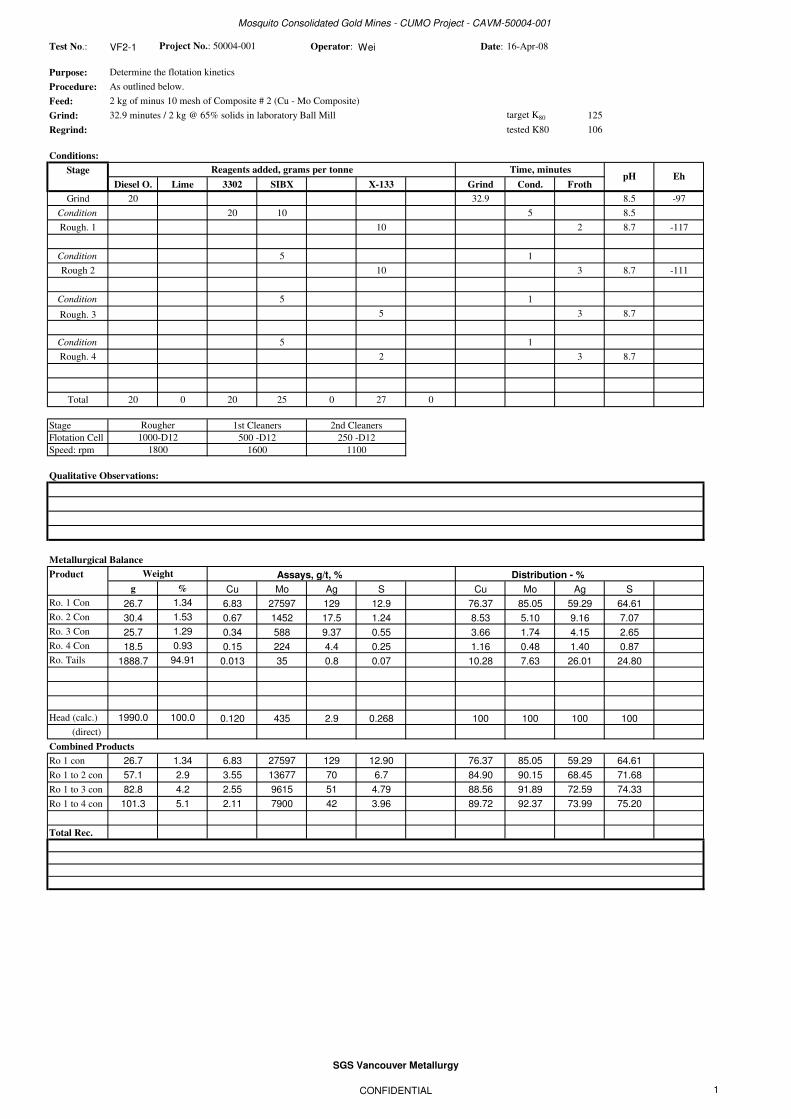
Mosquito Consolidated Gold Mines - CUMO Project - CAVM-50004-001
Test No.: VF2-1 Operator: Wei Date: 16-Apr-08
Purpose: Determine the flotation kinetics
Procedure: As outlined below.
Feed: 2 kg of minus 10 mesh of Composite # 2 (Cu - Mo Composite)
Grind: 32.9 minutes / 2 kg @ 65% solids in laboratory Ball Mill target K80 125
Regrind: tested K80 106
Conditions:
Stage
Diesel O. Lime 3302 SIBX X-133 Grind Cond. Froth
Grind 20 32.9 8.5 -97
Condition 20 10 5 8.5
Rough. 1 10 2 8.7 -117
Condition 5 1
Rough 2 10 3 8.7 -111
Condition 5 1
Rough. 3 5 3 8.7
Condition 5 1
Rough. 4 2 3 8.7
Total 20 0 20 25 0 27 0
Stage 1st Cleaners 2nd Cleaners
Flotation Cell 500 -D12 250 -D12
Speed: rpm 1600 1100
Qualitative Observations:
Metallurgical Balance
Product Assays, g/t, % Distribution - %
g % Cu Mo Ag S Cu Mo Ag S
Ro. 1 Con 26.7 1.34 6.83 27597 129 12.9 76.37 85.05 59.29 64.61
Ro. 2 Con 30.4 1.53 0.67 1452 17.5 1.24 8.53 5.10 9.16 7.07
Ro. 3 Con 25.7 1.29 0.34 588 9.37 0.55 3.66 1.74 4.15 2.65
Ro. 4 Con 18.5 0.93 0.15 224 4.4 0.25 1.16 0.48 1.40 0.87
Ro. Tails 1888.7 94.91 0.013 35 0.8 0.07 10.28 7.63 26.01 24.80
Head (calc.) 1990.0 100.0 0.120 435 2.9 0.268 100 100 100 100
(direct)
Combined Products
Ro 1 con 26.7 1.34 6.83 27597 129 12.90 76.37 85.05 59.29 64.61
Ro 1 to 2 con 57.1 2.9 3.55 13677 70 6.7 84.90 90.15 68.45 71.68
Ro 1 to 3 con 82.8 4.2 2.55 9615 51 4.79 88.56 91.89 72.59 74.33
Ro 1 to 4 con 101.3 5.1 2.11 7900 42 3.96 89.72 92.37 73.99 75.20
Total Rec.
Time, minutes
Project No.: 50004-001
pH EhReagents added, grams per tonne
Rougher
1000-D12
1800
Weight
SGS Vancouver Metallurgy
CONFIDENTIAL 1

Mosquito Consolidated Gold Mines - CUMO Project - CAVM-50004-001
Test No.: VF2-2 Operator: Wei Date: 16-Apr-08
Purpose: Determine the flotation kinetics
Procedure: As outlined below.
Feed: 2 kg of minus 10 mesh of Composite # 2 (Cu - Mo Composite)
Grind: 52.6 minutes / 2 kg @ 65% solids in laboratory Ball Mill target K80 63
Regrind: tested K80 61
Conditions:
Stage
Diesel O. Lime 3302 SIBX X-133 Grind Cond. Froth
Grind 20 52.6 8.5 -99
Condition 20 10 5 8.5
Rough. 1 10 2 8.7 -111
Condition 5 1
Rough 2 10 3 8.8 -112
Condition 5 1
Rough. 3 5 3 8.8
Condition 5 1
Rough. 4 5 3 8.8
Total 20 0 20 25 0 30 0
Stage 1st Cleaners 2nd Cleaners
Flotation Cell 500 -D12 250 -D12
Speed: rpm 1600 1100
Qualitative Observations:
Metallurgical Balance
Product Assays, g/t, % Distribution - %
g % Cu Mo Ag S Cu Mo Ag S
Ro. 1 Con 33.4 1.68 4.76 21000 108 10.3 75.66 88.46 61.41 65.80
Ro. 2 Con 33.0 1.66 0.64 760 14.7 1.48 10.05 3.16 8.26 9.34
Ro. 3 Con 25.6 1.28 0.18 230 5.26 0.39 2.19 0.74 2.29 1.91
Ro. 4 Con 29.5 1.48 0.1 150 5.07 0.26 1.40 0.56 2.55 1.47
Ro. Tails 1871.3 93.90 0.012 30 0.8 0.06 10.69 7.08 25.49 21.48
Head (calc.) 1992.8 100.0 0.11 398 2.9 0.262 100 100 100 100
(direct)
Combined Products
Ro 1 con 33.4 1.68 4.76 21000 108 10.30 75.66 88.46 61.41 65.80
Ro 1 to 2 con 66.4 3.3 2.71 10941 62 5.92 85.72 91.62 69.67 75.15
Ro 1 to 3 con 92.0 4.6 2.01 7961 46 4.38 87.91 92.36 71.97 77.06
Ro 1 to 4 con 121.5 6.1 1.54 6064 36 3.38 89.31 92.92 74.51 78.52
Total Rec.
Rougher
1000-D12
1800
Weight
Time, minutes
Project No.: 50004-001
pH EhReagents added, grams per tonne
SGS Vancouver Metallurgy
CONFIDENTIAL 2

Mosquito Consolidated Gold Mines - CUMO Project - CAVM-50004-001
Test No.: VF2-3 Operator: Wei Date: 9-May-08
Purpose: Determine the flotation character during cleaning
Procedure: As outlined below.
Feed: 2 kg of minus 10 mesh of Composite # 2 (Cu - Mo Composite)
Grind: 52.6 minutes / 2 kg @ 65% solids in laboratory Ball Mill target K80 63
Regrind: tested K80
Conditions:
Stage
Moly. Oil Lime 3302 SIBX X-133 Grind Cond. Froth
Grind 20 52.6 8.6
Condition 30 35 5 8.8
Rougher 30 10
Rougher-Conti. 5.5 5 2 1
Regrind 5.5 15
Condition 5 5 2 8.9
Cleaner 1 5 5
Condition 1 1 1 9.2
Cleaner 2 2 4
Condition 15 10.5
Cleaner 3 2
Total 31 15 36 41 0 42 0
Stage 1st Cleaners 2nd Cleaners
Flotation Cell 500 -D12 250 -D12
Speed: rpm 1600 1100
Qualitative Observations:
Metallurgical Balance
Product Assays, g/t, % Distribution - %
g % Cu Mo Ag W Cu Mo Ag W
Cln 3 Con 11.5 0.58 18 63060 344 20 85.50 93.67 76.83 0.17
Cln 3 Tails 2.1 0.11 1.35 2950 30.8 40 1.17 0.80 1.26 0.06
Cln 2 Tails 8.4 0.43 0.13 210 5.2 50 0.45 0.23 0.85 0.30
Cln 1 Tails 90.3 4.57 0.036 63 1.7 80 1.34 0.73 2.98 5.22
Ro. Tails 1862.2 94.31 0.015 19 0.5 70 11.54 4.57 18.08 94.25
Head (calc.) 1974.5 100.0 0.12 392 2.6 70 100 100 100 100
(direct)
Combined Products
Cln 3 Conc. 11.5 0.58 18.00 63060 344 20 85.50 93.67 76.83 0.17
Cln 2 Conc. 13.6 0.7 15.43 53778 296 23 86.67 94.47 78.09 0.23
Cln 1 Conc. 22.0 1.1 9.59 33325 185 33 87.12 94.70 78.94 0.53
Roug. Conc. 112.3 5.7 1.91 6579 38 71 88.46 95.43 81.92 5.75
Total Rec.
The Ag assays of the rougher tail was below the detection limits and was recorded as < 0.5 g/t
The W assays of the cleaner 3 conc was below the detection limits and was recorded as < 0.002 %
The W assays of the cleaner 3 and 2 tail were not completed due to insufficient sample and the values are educated guesses
Time, minutes
Project No.: 50004-001
pH EhReagents added, grams per tonne
Rougher
1000-D12
1800
Weight
SGS Vancouver Metallurgy
CONFIDENTIAL 3
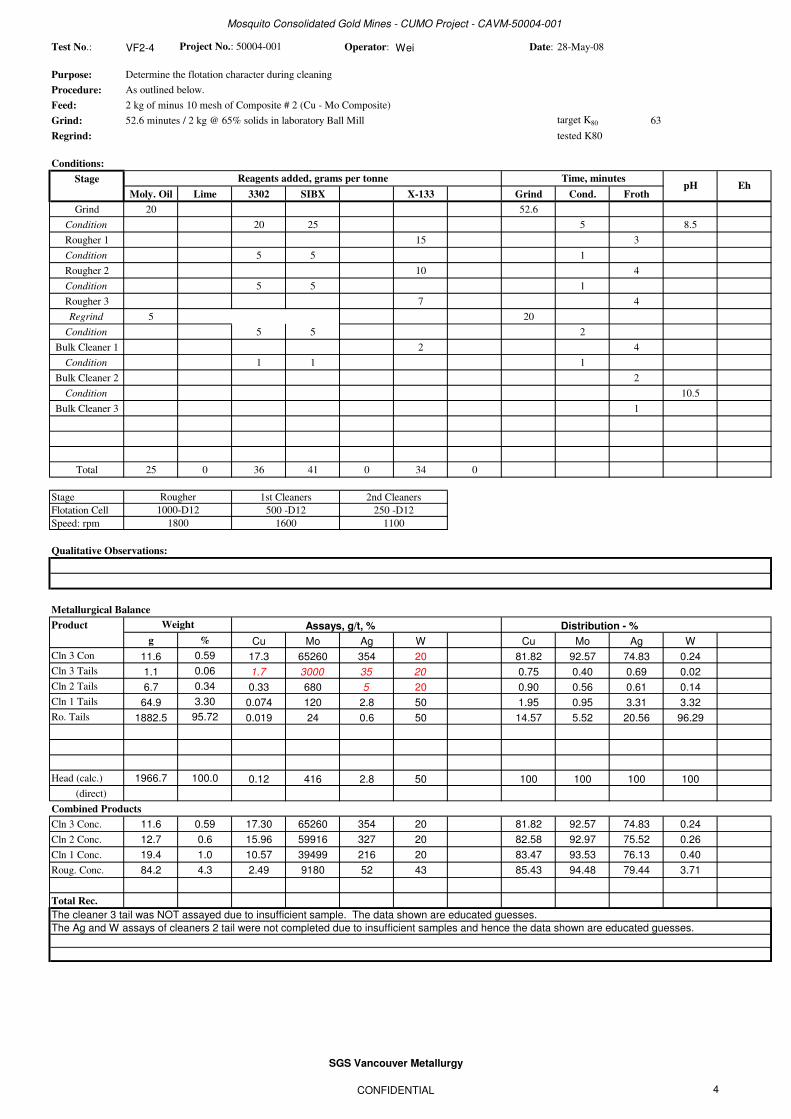
Mosquito Consolidated Gold Mines - CUMO Project - CAVM-50004-001
Test No.: VF2-4 Operator: Wei Date: 28-May-08
Purpose: Determine the flotation character during cleaning
Procedure: As outlined below.
Feed: 2 kg of minus 10 mesh of Composite # 2 (Cu - Mo Composite)
Grind: 52.6 minutes / 2 kg @ 65% solids in laboratory Ball Mill target K80 63
Regrind: tested K80
Conditions:
Stage
Moly. Oil Lime 3302 SIBX X-133 Grind Cond. Froth
Grind 20 52.6
Condition 20 25 5 8.5
Rougher 1 15 3
Condition 5 5 1
Rougher 2 10 4
Condition 5 5 1
Rougher 3 7 4
Regrind 5 20
Condition 5 5 2
Bulk Cleaner 1 2 4
Condition 1 1 1
Bulk Cleaner 2 2
Condition 10.5
Bulk Cleaner 3 1
Total 25 0 36 41 0 34 0
Stage 1st Cleaners 2nd Cleaners
Flotation Cell 500 -D12 250 -D12
Speed: rpm 1600 1100
Qualitative Observations:
Metallurgical Balance
Product Assays, g/t, % Distribution - %
g % Cu Mo Ag W Cu Mo Ag W
Cln 3 Con 11.6 0.59 17.3 65260 354 20 81.82 92.57 74.83 0.24
Cln 3 Tails 1.1 0.06 1.7 3000 35 20 0.75 0.40 0.69 0.02
Cln 2 Tails 6.7 0.34 0.33 680 5 20 0.90 0.56 0.61 0.14
Cln 1 Tails 64.9 3.30 0.074 120 2.8 50 1.95 0.95 3.31 3.32
Ro. Tails 1882.5 95.72 0.019 24 0.6 50 14.57 5.52 20.56 96.29
Head (calc.) 1966.7 100.0 0.12 416 2.8 50 100 100 100 100
(direct)
Combined Products
Cln 3 Conc. 11.6 0.59 17.30 65260 354 20 81.82 92.57 74.83 0.24
Cln 2 Conc. 12.7 0.6 15.96 59916 327 20 82.58 92.97 75.52 0.26
Cln 1 Conc. 19.4 1.0 10.57 39499 216 20 83.47 93.53 76.13 0.40
Roug. Conc. 84.2 4.3 2.49 9180 52 43 85.43 94.48 79.44 3.71
Total Rec.
The cleaner 3 tail was NOT assayed due to insufficient sample. The data shown are educated guesses.
The Ag and W assays of cleaners 2 tail were not completed due to insufficient samples and hence the data shown are educated guesses.
Rougher
1000-D12
1800
Weight
Time, minutes
Project No.: 50004-001
pH EhReagents added, grams per tonne
SGS Vancouver Metallurgy
CONFIDENTIAL 4

Mosquito Consolidated Gold Mines - CUMO Project - CAVM-50004-001
Test No.: VF2-5 Operator: Bruce Date: 26-Jun-08
Purpose: Determine the flotation character during cleaning
Procedure: As outlined below.
Feed: 2 kg of minus 10 mesh of Composite # 2 (Cu - Mo Composite)
Grind: 52.6 minutes / 2 kg @ 65% solids in laboratory Ball Mill target K80 63
Regrind: tested K80 64
Conditions:
Stage
Moly. Oil Lime 3302 SIBX Pine Oil Grind Cond. Froth
Grind 25 52.6
Condition 35 40 5 8.6
Rougher 40 12
Regrind 7 10
Condition 5 5 2
Cleaner 1 20 5
Condition 1 1 1
Cleaner 2 20 3
Condition 40 10
Cleaner 3 4 1
Total 32 40 41 46 0 84 0
Stage 1st Cleaners 2nd Cleaners
Flotation Cell 500 -D12 250 -D12
Speed: rpm 1600 1100
Qualitative Observations:
Metallurgical Balance
Product Assays, g/t, % Distribution - %
g % Cu Mo Ag W Cu Mo Ag W
Cln 3 Con 11.6 0.58 16.6 48750 365 20 86.66 90.35 70.26 0.23
Cln 3 Tails 2.2 0.11 1.7 3000 34.1 30 1.67 1.05 1.24 0.07
Cln 2 Tails 11.6 0.58 0.2 368 8.0 70 1.05 0.68 1.54 0.81
Cln 1 Tails 103.1 5.19 0.048 83 3.1 60 2.23 1.37 5.32 6.18
Ro. Tails 1856.0 93.53 0.01 22 0.7 50 8.38 6.55 21.64 92.72
Head (calc.) 1984.4 100.0 0.11 314 3.0 50 100 100 100 100
(direct)
Combined Products
Cln 3 Conc. 11.6 0.58 16.60 48750 365 20 86.66 90.35 70.26 0.23
Cln 2 Conc. 13.7 0.7 14.24 41491 312 22 88.34 91.40 71.50 0.30
Cln 1 Conc. 25.3 1.3 7.82 22684 173 44 89.38 92.08 73.04 1.11
Roug. Conc. 128.4 6.5 1.58 4540 37 57 91.62 93.45 78.36 7.28
Total Rec.
Notes: The Cu, Mo and W assay of cleaner 3 tail were not completed due to lack of sampless. The data shown are best guesses to fit the head assay
The W assay of cleaner 3 conc was below the detection limit and hence the detection limit was applied
Rougher
1000-D12
1800
Weight
Time, minutes
Project No.: 50004-001
pH EhReagents added, grams per tonne
SGS Vancouver Metallurgy
CONFIDENTIAL 5
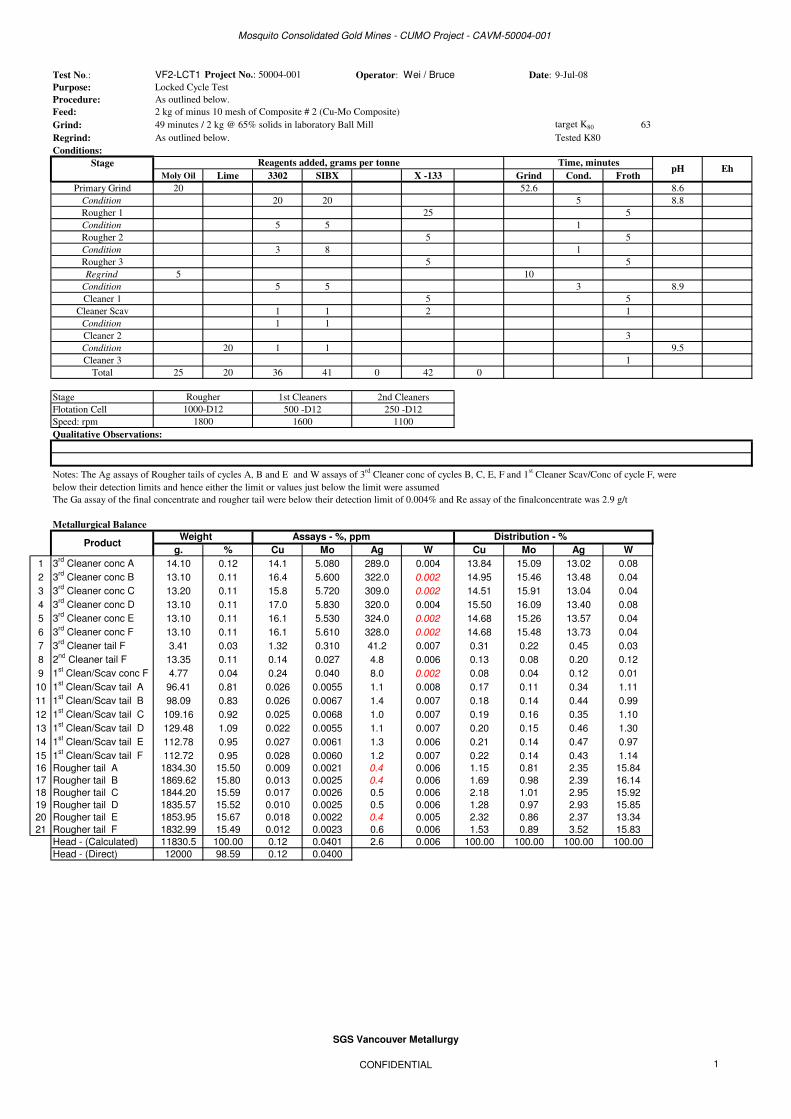
Mosquito Consolidated Gold Mines - CUMO Project - CAVM-50004-001
Test No.: VF2-LCT1 Operator: Wei / Bruce Date: 9-Jul-08
Purpose: Locked Cycle Test
Procedure: As outlined below.
Feed: 2 kg of minus 10 mesh of Composite # 2 (Cu-Mo Composite)
Grind: 49 minutes / 2 kg @ 65% solids in laboratory Ball Mill target K80 63
Regrind: As outlined below. Tested K80
Conditions:
Stage
Moly Oil Lime 3302 SIBX X -133 Grind Cond. Froth
Primary Grind 20 52.6 8.6
Condition 20 20 5 8.8
Rougher 1 25 5
Condition 5 5 1
Rougher 2 5 5
Condition 3 8 1
Rougher 3 5 5
Regrind 5 10
Condition 5 5 3 8.9
Cleaner 1 5 5
Cleaner Scav 1 1 2 1
Condition 1 1
Cleaner 2 3
Condition 20 1 1 9.5
Cleaner 3 1
Total 25 20 36 41 0 42 0
Stage 1st Cleaners 2nd Cleaners
Flotation Cell 500 -D12 250 -D12
Speed: rpm 1600 1100
Qualitative Observations:
Notes: The Ag assays of Rougher tails of cycles A, B and E and W assays of 3rd
Cleaner conc of cycles B, C, E, F and 1st Cleaner Scav/Conc of cycle F, were
below their detection limits and hence either the limit or values just below the limit were assumed
The Ga assay of the final concentrate and rougher tail were below their detection limit of 0.004% and Re assay of the finalconcentrate was 2.9 g/t
Metallurgical Balance
Weight Assays - %, ppm Distribution - %
g. % Cu Mo Ag W Cu Mo Ag W
1 3rd
Cleaner conc A 14.10 0.12 14.1 5.080 289.0 0.004 13.84 15.09 13.02 0.08
2 3rd
Cleaner conc B 13.10 0.11 16.4 5.600 322.0 0.002 14.95 15.46 13.48 0.04
3 3rd
Cleaner conc C 13.20 0.11 15.8 5.720 309.0 0.002 14.51 15.91 13.04 0.04
4 3rd
Cleaner conc D 13.10 0.11 17.0 5.830 320.0 0.004 15.50 16.09 13.40 0.08
5 3rd
Cleaner conc E 13.10 0.11 16.1 5.530 324.0 0.002 14.68 15.26 13.57 0.04
6 3rd
Cleaner conc F 13.10 0.11 16.1 5.610 328.0 0.002 14.68 15.48 13.73 0.04
7 3rd
Cleaner tail F 3.41 0.03 1.32 0.310 41.2 0.007 0.31 0.22 0.45 0.03
8 2nd
Cleaner tail F 13.35 0.11 0.14 0.027 4.8 0.006 0.13 0.08 0.20 0.12
9 1st Clean/Scav conc F 4.77 0.04 0.24 0.040 8.0 0.002 0.08 0.04 0.12 0.01
10 1st Clean/Scav tail A 96.41 0.81 0.026 0.0055 1.1 0.008 0.17 0.11 0.34 1.11
11 1st Clean/Scav tail B 98.09 0.83 0.026 0.0067 1.4 0.007 0.18 0.14 0.44 0.99
12 1st Clean/Scav tail C 109.16 0.92 0.025 0.0068 1.0 0.007 0.19 0.16 0.35 1.10
13 1st Clean/Scav tail D 129.48 1.09 0.022 0.0055 1.1 0.007 0.20 0.15 0.46 1.30
14 1st Clean/Scav tail E 112.78 0.95 0.027 0.0061 1.3 0.006 0.21 0.14 0.47 0.97
15 1st Clean/Scav tail F 112.72 0.95 0.028 0.0060 1.2 0.007 0.22 0.14 0.43 1.14
16 Rougher tail A 1834.30 15.50 0.009 0.0021 0.4 0.006 1.15 0.81 2.35 15.84
17 Rougher tail B 1869.62 15.80 0.013 0.0025 0.4 0.006 1.69 0.98 2.39 16.14
18 Rougher tail C 1844.20 15.59 0.017 0.0026 0.5 0.006 2.18 1.01 2.95 15.92
19 Rougher tail D 1835.57 15.52 0.010 0.0025 0.5 0.006 1.28 0.97 2.93 15.85
20 Rougher tail E 1853.95 15.67 0.018 0.0022 0.4 0.005 2.32 0.86 2.37 13.34
21 Rougher tail F 1832.99 15.49 0.012 0.0023 0.6 0.006 1.53 0.89 3.52 15.83
Head - (Calculated) 11830.5 100.00 0.12 0.0401 2.6 0.006 100.00 100.00 100.00 100.00
Head - (Direct) 12000 98.59 0.12 0.0400
Product
Project No.: 50004-001
Reagents added, grams per tonne Time, minutes
1800
pH Eh
Rougher
1000-D12
SGS Vancouver Metallurgy
CONFIDENTIAL 1

Mosquito Consolidated Gold Mines - CUMO Project - CAVM-50004-001
Metallurgical Prediction (Using Cycles D,E,F)
Final Conc. 78.6 0.66 16.40 5.6567 324.0 0.003 88.62 93.69 80.00 0.31
Cleaner/Scav Tail 710.0 6.00 0.03 0.0058 1.2 0.007 1.24 0.88 2.67 7.03
Rougher Tail 11045.0 93.36 0.01 0.0023 0.5 0.006 10.14 5.43 17.34 92.66
Head - (Calculated) 11833.58 100.03 0.12 0.0401 2.7 0.006 100.00 100.00 100.00 100.00
Head - (Direct) 12000 98.61 0.12 0.04
Upgrade Unit Recovery - %
Cleaner Circuit Mass Rec Cu Mo Ag W Cu Mo Ag W
Unit Performance 10.01 9.89 9.94 9.71 0.424 98.62 99.07 96.78 4.23
Overall Stability
Total Product Weight Units Out as a% of Units In/cycle
Out per cycle Cyc. # % Cu Mo Ag W
Cycle A 1 98.63 90.95 96.09 94.25 102.17
Cycle B 2 100.46 100.92 99.48 97.87 103.01
Cycle C 3 99.74 101.31 102.45 98.00 102.36
Cycle D 4 100.32 101.84 103.25 100.72 103.37
Cycle E 5 100.41 103.27 97.61 98.43 86.11
Cycle F 6 99.34 98.57 99.09 106.08 102.00
Average of E to F 99.88 100.92 98.35 102.26 94.05
Average of D to F 100.03 101.23 99.98 101.74 97.16
Average of C to F 99.95 101.25 100.60 100.81 98.46
Circuit Stability
70.00
75.00
80.00
85.00
90.00
95.00
100.00
105.00
110.00
115.00
120.00
0 1 2 3 4 5 6 7
Cycle - Number
We
igh
t, M
eta
l U
nit
s -
%
Weight Cu Units Mo Units Ag Units W Units
SGS Vancouver Metallurgy
CONFIDENTIAL 2

Mosquito Consolidated Gold Mines - CUMO Project - CAVM-50004-001
SGS Minerals Services Project No.
Size Distribution Analysis 50004-001
Sample: Comp 2 - Ro Tails Test No.: VF2-1
Size Weight % Retained % Passing
Mesh µm grams Individual Cumulative Cumulative
48 300 0.1 0.1 0.1 99.9
65 212 1.1 1.1 1.2 98.8
100 150 6.2 6.2 7.4 92.6
150 106 12.6 12.6 20.0 80.0
200 75 15.0 15.0 35.0 65.0
270 53 13.3 13.3 48.3 51.7
400 38 9.1 9.1 57.5 42.5
Pan -38 42.5 42.5 100.0 0.0
Total - 99.9 100.0 - -
K80 106
Particle Size Distribution
0
10
20
30
40
50
60
70
80
90
100
10 100 1,000
Screen Size (micrometers)
Cum
ula
tive %
Passin
g
K80 = 106 µm
SGS Vancouver Metallurgy
CONFIDENTIAL

Mosquito Consolidated Gold Mines - CUMO Project - CAVM-50004-001
SGS Minerals Services Project No.
Size Distribution Analysis 50004-001
Sample: Comp 2 - Ro Tails Test No.: VF2-2
Size Weight % Retained % Passing
Mesh µm grams Individual Cumulative Cumulative
48 300 0.0 0.0 0.0 100.0
65 212 0.0 0.0 0.0 100.0
100 150 0.3 0.3 0.3 99.7
150 106 2.3 2.3 2.6 97.4
200 75 8.5 8.5 11.1 88.9
270 53 14.6 14.6 25.7 74.3
400 38 13.8 13.8 39.5 60.5
Pan -38 60.5 60.5 100.0 0.0
Total - 100.0 100.0 - -
K80 61
Particle Size Distribution
0
10
20
30
40
50
60
70
80
90
100
10 100 1,000
Screen Size (micrometers)
Cum
ula
tive %
Passin
g
K80 = 61 µm
SGS Vancouver Metallurgy
CONFIDENTIAL

Mosquito Consolidated Gold Mines - CUMO Project - CAVM-50004-001
SGS Minerals Services Project No.
Size Distribution Analysis 50004-001
Sample: Comp 2 Clen 1 Tail Test No.: VF2-4
Size Weight % Retained % Passing
Mesh µm grams Individual Cumulative Cumulative
65 212 0.0 0.0 0.0 100.0
100 150 0.0 0.0 0.0 100.0
150 106 0.0 0.0 0.0 100.0
200 75 0.0 0.0 0.0 100.0
270 53 0.0 0.0 0.0 100.0
400 38 0.3 0.9 0.9 99.1
635 20 1.1 3.2 4.1 95.9
-635 -20 33.6 95.9 100.0 0.0
Total - 35.0 100.0 - -
K80 #N/A
SGS Vancouver Metallurgy
CONFIDENTIAL

Mosquito Consolidated Gold Mines - CUMO Project - CAVM-50004-001
SGS Minerals Services Project No.
Size Distribution Analysis 50004-001
Sample: Comp 2 - Ro Tail Test No.: VF2-5
Size Weight % Retained % Passing
Mesh µm grams Individual Cumulative Cumulative
48 300 0.0 0.0 0.0 100.0
65 212 0.1 0.1 0.1 99.9
100 150 0.3 0.4 0.4 99.6
150 106 2.7 3.0 3.4 96.6
200 75 8.4 9.2 12.6 87.4
270 53 14.2 15.5 28.2 71.8
400 38 11.3 12.4 40.6 59.4
Pan -38 54.1 59.4 100.0 0.0
Total - 91.1 100.0 - -
K80 64
Particle Size Distribution
0
10
20
30
40
50
60
70
80
90
100
10 100 1,000
Screen Size (micrometers)
Cu
mu
lative
% P
assin
g
K80 = 64 µm
SGS Vancouver Metallurgy
CONFIDENTIAL

Mosquito Consolidated Gold Mines - CUMO Project - CAVM-50004-001
Test No.: VF3-1 Operator: Wei Date: 25-Apr-08
Purpose: Determine the flotation kinetics
Procedure: As outlined below.
Feed: 2 kg of minus 10 mesh of Composite # 3 (Mo Composite)
Grind: 26.9 minutes / 2 kg @ 65% solids in laboratory Ball Mill target K80 125
Regrind: tested K80 115
Conditions:
Stage
Moly. Oil Lime 3302 SIBX X-133 Grind Cond. Froth
Grind 20 26.9 8.6
Condition 20 10 5 8.7
Rough. 1 15 2
Condition 5 5 1
Rough 2 5 3
Condition 5 1
Rough. 3 5 3
Condition 5.5 5 5 3
Rough. 4 5 3 8.8
Total 25.5 0 30 25 0 30 0
Stage 1st Cleaners 2nd Cleaners
Flotation Cell 500 -D12 250 -D12
Speed: rpm 1600 1100
Qualitative Observations:
Metallurgical Balance
Product Assays, g/t, % Distribution - %
g % Cu Mo Ag Cu Mo Ag
Ro. 1 Con 30.0 1.51 1.39 67050 34.6 63.75 88.97 49.11
Ro. 2 Con 29.8 1.50 0.18 2780 6.2 8.20 3.66 8.74
Ro. 3 Con 22.9 1.15 0.087 1200 3.5 3.05 1.22 3.79
Ro. 4 Con 24.8 1.25 0.052 520 2.3 1.97 0.57 2.70
Ro. Tails 1883.8 94.60 0.008 67 0.4 23.04 5.58 35.65
Head (calc.) 1991.3 100.0 0.033 1135 1.061 100 100 100
(direct)
Combined Products
Ro 1 con 30.0 1.51 1.39 67050 34.6 63.75 88.97 49.11
Ro 1 to 2 con 59.8 3.00 0.79 35022 20.4 71.95 92.63 57.86
Ro 1 to 3 con 82.7 4.15 0.59 25657 15.8 74.99 93.85 61.65
Ro 1 to 4 con 107.5 5.40 0.47 19858 12.7 76.96 94.42 64.35
Total Rec.
Ro tail Ag assay - Back calculated using the Head assay of 1.06 g/t and limited to a maximum of 0.5 g/t
Rougher
1000-D12
1800
Weight
Time, minutes
Project No.: 50004-001
pH EhReagents added, grams per tonne
SGS Vancouver Metallurgy
CONFIDENTIAL 1

Mosquito Consolidated Gold Mines - CUMO Project - CAVM-50004-001
Test No.: VF3-2 Operator: Wei Date: 25-Apr-08
Purpose: Determine the flotation kinetics
Procedure: As outlined below.
Feed: 2 kg of minus 10 mesh of Composite # 3 ( Mo Composite)
Grind: 49 minutes / 2 kg @ 65% solids in laboratory Ball Mill target K80 63
Regrind: tested K80 62
Conditions:
Stage
Moly. Oil Lime 3302 SIBX X-133 Grind Cond. Froth
Grind 20 49 8.6
Condition 20 10 5
Rough. 1 15 2 8.7
Condition 5 5 1
Rough 2 5 3 8.8
Condition 5 1
Rough. 3 5 3
Condition 5.5 5 5 3
Rough. 4 5 3
Total 25.5 0 30 25 0 30 0
Stage 1st Cleaners 2nd Cleaners
Flotation Cell 500 -D12 250 -D12
Speed: rpm 1600 1100
Qualitative Observations:
Metallurgical Balance
Product Assays, g/t, % Distribution - %
g % Cu Mo Ag Cu Mo Ag
Ro. 1 Con 28.6 1.44 1.66 73000 42.6 71.50 92.29 57.43
Ro. 2 Con 33.3 1.67 0.14 2300 5.2 7.02 3.39 8.16
Ro. 3 Con 27.6 1.38 0.07 600 2.6 2.78 0.73 3.38
Ro. 4 Con 35.5 1.78 0.03 340 1.7 1.82 0.53 2.84
Ro. Tails 1867.8 93.73 0.006 37 0.32 16.88 3.06 28.18
Head (calc.) 1992.8 100.0 0.03 1135 1.1 100 100 100
(direct)
Combined Products
Ro 1 con 28.6 1.44 1.66 73000 42.6 71.50 92.29 57.43
Ro 1 to 2 con 61.9 3.11 0.84 34966 22.5 78.52 95.68 65.60
Ro 1 to 3 con 89.5 4.49 0.60 24368 16.3 81.30 96.41 68.98
Ro 1 to 4 con 125.0 6.27 0.44 17544 12.2 83.12 96.94 71.82
Total Rec.
Ro tail Ag assay - Lower than detection limit; Reported as < 0.5 g/t: Back calculated using the Head assay of 1.06 g/t.
Time, minutes
Project No.: 50004-001
pH EhReagents added, grams per tonne
Rougher
1000-D12
1800
Weight
SGS VAncouver Metallurgy
CONFIDENTIAL 2

Mosquito Consolidated Gold Mines - CUMO Project - CAVM-50004-001
Test No.: VF3-3 Operator: Wei Date: 20-May-08
Purpose: Determine the flotation character during cleaning
Procedure: As outlined below.
Feed: 2 kg of minus 10 mesh of Composite # 3 (Mo Composite)
Grind: 49 minutes / 2 kg @ 65% solids in laboratory Ball Mill target K80 63
Regrind: Tested K80
Conditions:
Stage
Moly Oil Lime 3302 SIBX X -133 Grind Cond. Froth
Grind 20 49
Condition 20 20 5 8.6
Rougher 1 25 5 8.7
Condition 5 5 1
Rougher 2 5 5
Condition 3 5 1
Rougher 3 5 5 8.7
Regrind 5 15
Condition 5 5 3
Bulk Cleaner 1 5 6 8.7
Condition 1
Bulk Cleaner 2 1 1 3
Condition 20 10.5
Bulk Cleaner 3 2
Total 25 20 34 36 0 40 0
Stage 1st Cleaners 2nd Cleaners
Flotation Cell 500 -D12 250 -D12
Speed: rpm 1600 1100
Qualitative Observations:
Metallurgical Balance
Product Assays, g/t, % Distribution - %
g % Cu Mo Ag W Cu Mo Ag W
Cln 3 Conc. 8.2 0.41 5.94 244000 151 20 77.44 94.88 50.64 0.10
Cln 3 Tails 2.6 0.13 0.67 8900 30.6 60 2.78 1.10 3.26 0.10
Cln 2 Tails 10.3 0.52 0.12 1000 5.4 80 1.96 0.49 2.27 0.52
Cln 1 Tails 70.9 3.56 0.025 200 1.8 80 2.81 0.67 5.20 3.58
Ro. Tails 1898.1 95.37 0.005 32 0.5 80 15.02 2.87 38.63 95.70
Head (calc.) 1990.2 100.0 0.03 1065 1.2 80 100 100 100 100
(direct)
Combined Products
Cln 3 Conc. 8.2 0.41 5.94 244000 151 20 77.44 94.88 50.64 0.10
Cln 2 Conc. 10.9 0.55 4.67 187282 122 30 80.22 95.98 53.91 0.20
Cln 1 Conc. 21.2 1.06 2.45 96515 65 54 82.18 96.46 56.17 0.72
Roug. Conc. 92.1 4.63 0.58 22347 16 74 84.98 97.13 61.37 4.30
Total Rec.
The W assays of the cleaner 3 conc was below the detection limits and was recorded as < 0.002 %
The W assays of the cleaner 3 tail was not analyzed due to insufficient sample. An educated guess was entered.
Project No.: 50004-001
Reagents added, grams per tonne Time, minutespH Eh
Rougher
1000-D12
1800
Weight
SGS Vancouver Metallurgy
CONFIDENTIAL 3

Mosquito Consolidated Gold Mines - CUMO Project - CAVM-50004-001
Test No.: VF3-4 Operator: Wei Date: 28-May-08
Purpose: Determine the flotation character during cleaning
Procedure: As outlined below.
Feed: 2 kg of minus 10 mesh of Composite # 3 (Mo Composite)
Grind: 49 minutes / 2 kg @ 65% solids in laboratory Ball Mill target K80 63
Regrind: Tested K80
Conditions:
Stage
Moly Oil Lime 3302 SIBX X -133 Grind Cond. Froth
Grind 25 49
Condition 20 20 5 8.5
Rougher 1 20 5
Condition 5 5 5 1
Rougher 2 10 5
Condition 3 5 5 1
Rougher 3 5 5
Regrind 5 22
Condition 5 5 3
Bulk Cleaner 1 5
Condition 1
Bulk Cleaner 2 1 1 3
Condition 20 10.5
Bulk Cleaner 3 1
Total 38 20 36 36 0 35 0
Stage 1st Cleaners 2nd Cleaners
Flotation Cell 500 -D12 250 -D12
Speed: rpm 1600 1100
Qualitative Observations:
Metallurgical Balance
Product Assays, g/t, % Distribution - %
g % Cu Mo Ag W Cu Mo Ag W
Cln 3 Conc. 7.8 0.39 6.09 247740 150 20 76.90 93.91 48.62 0.16
Cln 3 Tails 3.0 0.15 0.72 12930 30 20 3.52 1.90 3.76 0.06
Cln 2 Tails 9.8 0.50 0.091 1180 5 70 1.45 0.56 2.04 0.69
Cln 1 Tails 77.4 3.93 0.023 160 2 60 2.90 0.61 6.48 4.69
Ro. Tails 1870.0 95.02 0.005 33 0.5 50 15.23 3.02 39.10 94.40
Head (calc.) 1968.0 100.0 0.03 1039 1.2 50 100 100 100 100
(direct)
Combined Products
Cln 3 Conc. 7.8 0.39 6.09 247740 150 20 76.90 93.91 48.62 0.16
Cln 2 Conc. 10.8 0.55 4.59 182212 117 20 80.42 95.81 52.38 0.22
Cln 1 Conc. 20.5 1.04 2.45 96065 63 44 81.86 96.38 54.42 0.91
Roug. Conc. 97.9 4.98 0.53 20244 15 57 84.77 96.98 60.90 5.60
Total Rec.
The W assay of Cleaner 3 conc. cleaner 3 tail and the Ag assay of rougher tail were below the detection level and hence the detection level was assumed.
The Ag assay of cleaner 3, 2 and 1 tails were not assyed due to insufficient sample. Educated guesses were placed.
Weight
Eh
Rougher
1000-D12
1800
Project No.: 50004-001
Reagents added, grams per tonne Time, minutespH
SGS Vancouver Metallurgy
CONFIDENTIAL 4

Mosquito Consolidated Gold Mines - CUMO Project - CAVM-500004-001
Test No.: VF3-5 Operator: Bruce.S Date: 27-Jun-08
Purpose: Determine the flotation character during cleaning
Procedure: As outlined below.
Feed: 2 kg of minus 10 mesh of Composite # 3 (Mo Composite)
Grind: 49 minutes / 2 kg @ 65% solids in laboratory Ball Mill target K80 63
Regrind: Tested K80 65
Conditions:
Stage
Moly Oil Lime 3302 SIBX Pine Oil Grind Cond. Froth
Grind 25 49
Condition 20 15 5 8.6
Rougher 1 20 5
Condition 5 5 3 1
Rougher 2 20 5
Condition 3 5 3 1
Rougher 3 20 5
Regrind 5 10
Condition 5 2 3
Bulk Cleaner 1 20 5
Condition 1 7.9
Bulk Cleaner 2 1 1 12 3
Condition 8.5
Bulk Cleaner 3 4 1
Total 38 0 36 24 0 96 0
Stage 1st Cleaners 2nd Cleaners
Flotation Cell 500 -D12 250 -D12
Speed: rpm 1600 1100
Qualitative Observations:
Metallurgical Balance
Product Assays, g/t, % Distribution - %
g % Cu Mo Ag W Cu Mo Ag W
Cln 3 Conc. 8.5 0.43 5.7 213310 168 20 77.85 93.90 55.24 0.17
Cln 3 Tails 2.2 0.11 0.71 12930 22.3 60 2.49 1.46 1.88 0.13
Cln 2 Tails 9.6 0.48 0.093 1070 4.4 80 1.42 0.53 1.62 0.76
Cln 1 Tails 98.3 4.95 0.021 166 1.4 60 3.30 0.84 5.30 5.88
Ro. Tails 1867.9 94.03 0.005 34 0.5 50 14.94 3.27 35.96 93.06
Head (calc.) 1986.5 100.0 0.03 977 1.3 51 100 100 100 100
(direct)
Combined Products
Cln 3 Conc. 8.5 0.43 5.70 213310 168 20 77.85 93.90 55.24 0.17
Cln 2 Conc. 10.7 0.54 4.68 172412 138 28 80.34 95.36 57.12 0.30
Cln 1 Conc. 20.3 1.02 2.52 91726 75 53 81.76 95.89 58.74 1.06
Roug. Conc. 118.6 5.97 0.45 15828 14 59 85.06 96.73 64.04 6.94
Total Rec.
The Cu, Mo and W assays of Cleaner 3 tail were not assayed due to insufficient sample. The Data presented are educated guesses to suit calculated heads.
The W assay of Cleaner 3 conc and Ag of rougher tail are below the detection level and therefre detection level is presented.
Project No.: 50004-001
Reagents added, grams per tonne Time, minutespH Eh
Rougher
1000-D12
1800
Weight
SGS Vancouver Metallurgy
CONFIDENTIAL 5

Mosquito Consolidated Gold Mines - CUMO Project - CAVM-50004-001
Test No.: VF3-LCT1 Operator: Wei / Bruce Date: July 04, 08
Purpose: Locked Cycle Test
Procedure: As outlined below.
Feed: 2 kg of minus 10 mesh of Composite # 3 (Mo Composite)
Grind: 49 minutes / 2 kg @ 65% solids in laboratory Ball Mill target K80 63
Regrind: As outlined below. Tested K80
Conditions:
Stage
Moly Oil Lime 3302 SIBX X -133 Grind Cond. Froth
Primary Grind 20 49
Condition 20 20 5 8.7
Rougher 1 25 5
Condition 5 5 1 8.7
Rougher 2 5 5
Condition 3 5 1
Rougher 3 5 5
Regrind 5 10
Condition 5 5 3
Cleaner 1 5 5 8.6
Cleaner Scav 1 1 2 1
Condition 1 1
Cleaner 2 3
Condition 1 1 9.5
Cleaner 3 1
Total 25 0 36 38 0 42 0
Stage 1st Cleaners 2nd Cleaners
Flotation Cell 500 -D12 250 -D12
Speed: rpm 1600 1100
Qualitative Observations:
Note: W assay of 3rd
Cleaner Tail of cycle F, was unavailable due to insufficient sample and hence it was assumed.
The Ag assay of all rougher tails and the W assay of the all the final concentrates were below the detection level of 0.5 g/t of Ag and 0.002 % W,
and hence 0.4 g/t Ag and 0.002 % W were assumed. The Ga assay of the final concentrate was 0.005% and that of the rougher tail was below the detection limit of 0.004%.
The Re assay of the final concentrate was 15 g/t.
Metallurgical Balance
Weight Assays - %, ppm Distribution - %
g. % Cu Mo Ag W Cu Mo Ag W
1 3rd
Cleaner conc A 8.7 0.07 5.6 22.6 114.0 0.002 12.00 15.23 8.01 0.03
2 3rd
Cleaner conc B 9.9 0.08 5.4 21.3 149.0 0.002 13.17 16.34 11.91 0.03
3 3rd
Cleaner conc C 9.9 0.08 5.46 21 140.0 0.002 13.31 16.11 11.19 0.03
4 3rd
Cleaner conc D 9.7 0.08 5.5 20.9 97.8 0.002 13.14 15.71 7.66 0.03
5 3rd
Cleaner conc E 9.5 0.08 5.53 21.7 95.6 0.002 12.94 15.97 7.33 0.03
6 3rd
Cleaner conc F 9.6 0.08 5.73 22.3 173.0 0.002 13.55 16.59 13.41 0.03
7 3rd
Cleaner tail F 4.6 0.04 0.3 0.35 12.9 0.003 0.34 0.12 0.48 0.02
8 2nd
Cleaner tail F 19.1 0.16 0.048 0.046 2.5 0.009 0.23 0.07 0.39 0.28
9 1st Clean/Scav conc F 6.0 0.05 0.084 0.072 3.6 0.004 0.12 0.03 0.17 0.04
10 1st Clean/Scav tail A 79.2 0.67 0.012 0.01 1.0 0.006 0.23 0.06 0.64 0.78
11 1st Clean/Scav tail B 95.9 0.81 0.015 0.011 0.8 0.005 0.35 0.08 0.62 0.79
12 1st Clean/Scav tail C 109.9 0.93 0.013 0.0082 0.8 0.005 0.35 0.07 0.71 0.90
13 1st Clean/Scav tail D 140.1 1.19 0.01 0.0067 0.6 0.005 0.35 0.07 0.68 1.15
14 1st Clean/Scav tail E 147.4 1.25 0.015 0.0068 0.6 0.006 0.54 0.08 0.71 1.45
15 1st Clean/Scav tail F 153.9 1.30 0.01 0.0062 0.5 0.005 0.38 0.07 0.62 1.26
16 Rougher tail A 1876.9 15.92 0.007 0.0041 0.4 0.005 3.24 0.60 6.06 15.42
17 Rougher tail B 1857.1 15.75 0.012 0.0038 0.4 0.005 5.49 0.55 6.00 15.26
18 Rougher tail C 1842.1 15.62 0.006 0.004 0.4 0.005 2.72 0.57 5.95 15.13
19 Rougher tail D 1792.9 15.21 0.006 0.0039 0.4 0.005 2.65 0.54 5.79 14.73
20 Rougher tail E 1815.3 15.40 0.006 0.0042 0.4 0.005 2.68 0.59 5.86 14.91
21 Rougher tail F 1792.9 15.21 0.005 0.0039 0.4 0.006 2.21 0.54 5.79 17.68
Head - (Calculated) 11790.4 100.00 0.034 0.1095 1.1 0.005 100.00 100.00 100.00 100.00
Head - (Direct) 12000 98.25 0.035 0.12
Product
Eh
Rougher
1000-D12
1800
Project No.: 50004-001
Reagents added, grams per tonne Time, minutespH
SGS Vancouver Metallurgy
CONFIDENTIAL 1

Mosquito Consolidated Gold Mines - CUMO Project - CAVM-50004-001
Metallurgical Prediction (Using Cycles D,E,F)
Final Conc. 57.6 0.49 5.59 21.631 122.1 0.002 81.81 96.22 59.34 0.18
Cleaner/Scav Tail 882.6 7.49 0.01 0.007 0.57 0.005 2.62 0.45 4.21 7.54
Rougher Tail 10802.1 91.62 0.01 0.004 0.40 0.005 15.57 3.34 36.45 92.27
Head - (Calculated) 11742.3 99.59 0.033 0.110 1.01 0.005 100.00 100.00 100.00 100.00
Head - (Direct) 12000 97.85 0.035 0.12
Upgrade Unit Recovery - %
Cleaner Circuit Mass Rec Cu Mo Ag W Cu Mo Ag W
Unit Performance 5.83 15.82 16.25 15.24 0.39 96.90 99.54 93.38 2.39
Overall Stability
Total Product Weight Units Out as a% of Units In/cycle
Out per cycle Cyc. # % Cu Mo Ag W
Cycle A 1 99.99 92.83 95.35 88.27 97.38
Cycle B 2 99.89 114.07 101.80 111.18 96.46
Cycle C 3 99.84 98.33 100.49 107.12 96.41
Cycle D 4 98.86 96.81 97.93 84.78 95.47
Cycle E 5 100.36 97.01 99.85 83.47 98.38
Cycle F 6 99.56 96.82 103.22 118.95 113.82
Average of E to F 99.96 96.91 101.53 101.21 106.10
Average of D to F 99.59 96.88 100.33 95.73 102.56
Average of C to F 99.65 97.24 100.37 98.58 101.02
Circuit Stability
60.00
70.00
80.00
90.00
100.00
110.00
120.00
130.00
0 1 2 3 4 5 6 7
Cycles - Number
Weig
ht,
meta
l U
nit
s -
%
Weight % Cu Units Mo Units Ag Units W Units
SGS Vancouver Metallurgy
CONFIDENTIAL 2

Mosquito Consolidated Gold Mines - CUMO Project - CAVM-50004-001
SGS Minerals Services Project No.
Size Distribution Analysis 50004-001
Sample: Comp 3 - Ro Tails Test No.: VF3-1
Size Weight % Retained % Passing
Mesh µm grams Individual Cumulative Cumulative
48 300 0.3 0.3 0.3 99.7
65 212 1.3 1.3 1.6 98.4
100 150 7.6 7.6 9.2 90.8
150 106 14.0 14.0 23.2 76.8
200 75 16.6 16.6 39.9 60.1
270 53 13.6 13.6 53.5 46.5
400 38 10.3 10.3 63.8 36.2
Pan -38 36.1 36.2 100.0 0.0
Total - 99.8 100.0 - -
K80 115
Particle Size Distribution
0
10
20
30
40
50
60
70
80
90
100
10 100 1,000
Screen Size (micrometers)
Cum
ula
tive %
Passin
g
K80 = 115 µm
SGS Vancouver Metallurgy
CONFIDENTIAL

Mosquito Consolidated Gold Mines - CUMO Project - CAVM-50004-001
SGS Minerals Services Project No.
Size Distribution Analysis 50004-001
Sample: Comp 3 - Ro Tails Test No.: VF3-2
Size Weight % Retained % Passing
Mesh µm grams Individual Cumulative Cumulative
48 300 0.2 0.2 0.2 99.8
65 212 0.1 0.1 0.3 99.7
100 150 0.2 0.2 0.5 99.5
150 106 2.0 2.0 2.5 97.5
200 75 8.4 8.4 10.9 89.1
270 53 16.3 16.3 27.2 72.8
400 38 17.3 17.3 44.5 55.5
Pan -38 55.4 55.5 100.0 0.0
Total - 99.9 100.0 - -
K80 62
Particle Size Distribution
0
10
20
30
40
50
60
70
80
90
100
10 100 1,000
Screen Size (micrometers)
Cum
ula
tive %
Passin
g
K80 = 62 µm
SGS Vancouver Metallurgy
CONFIDENTIAL

Mosquito Consolidated Gold Mines - CUMO Project - CAVM-50004-001
SGS Minerals Services Project No.
Size Distribution Analysis 50004-001
Sample: Comp 3 - Ro Tail Test No.: VF3-5
Size Weight % Retained % Passing
Mesh µm grams Individual Cumulative Cumulative
48 300 0.0 0.0 0.0 100.0
65 212 0.3 0.2 0.2 99.8
100 150 0.2 0.2 0.4 99.6
150 106 2.8 2.4 2.7 97.3
200 75 11.3 9.5 12.2 87.8
270 53 21.5 18.1 30.3 69.7
400 38 17.0 14.3 44.6 55.4
Pan -38 65.9 55.4 100.0 0.0
Total - 118.9 100.0 - -
K80 65
Particle Size Distribution
0
10
20
30
40
50
60
70
80
90
100
10 100 1,000
Screen Size (micrometers)
Cu
mu
lative
% P
assin
g
K80 = 65 µm
SGS VAncouver Metallurgy
CONFIDENTIAL

Mosquito Consolidated Gold Mines - CUMO Project - CAVM-50004-001
SGS Minerals Services Project No.
Size Distribution Analysis 50004-001
Sample: Comp 3 Cln 1 Tail Test No.: VF3-3
Size Weight % Retained % Passing
Mesh µm grams Individual Cumulative Cumulative
65 212 0.0 0.0 100.0
100 150 0.0 0.0 100.0
150 106 0.0 0.0 100.0
200 75 0.0 0.0 100.0
270 53 0.0 0.0 100.0
400 38 0.0 0.0 100.0
635 20 4.6 11.7 11.7 88.3
-635 -20 34.9 88.3 100.0 0.0
Total - 39.5 100.0 - -
K80 #N/A
SGS VAncouver Metallurgy
CONFIDENTIAL

Mosquito Consolidated Gold Mines - CUMO Project - CAVM-50004-001
SGS Minerals Services Project No.
Size Distribution Analysis 50004-001
Sample: Comp 3 Clen 1 Tail Test No.: VF3-4
Size Weight % Retained % Passing
Mesh µm grams Individual Cumulative Cumulative
65 212 0.0 0.0 0.0 100.0
100 150 0.0 0.0 0.0 100.0
150 106 0.0 0.0 0.0 100.0
200 75 0.0 0.0 0.0 100.0
270 53 0.0 0.0 0.0 100.0
400 38 0.3 0.9 0.9 99.1
635 20 1.4 3.5 4.4 95.6
-635 -20 37.9 95.6 100.0 0.0
Total - 39.6 100.0 - -
K80 #N/A
SGS Vancouver Metallurgy
CONFIDENTIAL

Mosquito Consolidated Gold Mines – CUMO Project - CAVM-50004-001 - 1 -
SGS Mineral Services
APPENDIX D
Ancillary Test Data

Mosquito Consolidated Gold Mines - CUMO Project - CAVM-50004-001
Head Assay of Composites
Sample Description Sample ID Cu - % Mo - g/t Fe - % S - %
Comp 1- A 0.15 0.016 1.71 0.20
Cu-Ag Zone Comp 1- B 0.16 0.018 1.46 0.21
Comp 1- C 0.15 0.018 1.41 0.21
Comp 2- A 0.12 0.04 1.18 0.22
Cu-Mo Zone Comp 2- B 0.13 0.04 1.10 0.21
Comp 2- C 0.13 0.041 1.14 0.21
Comp 3- A 0.039 0.12 0.89 0.15
Mo Zone Comp 3- B 0.036 0.12 0.88 0.14
Comp 3- C 0.029 0.11 0.90 0.14
ICP Analysis
Sample: Composite 3
LCT Rougher tail
Element Assay - g/t
Silver < 2
Aluminium 62000
Arsenic < 30
Barium 1000
Beryllium 1.4
Bismuth < 20
Calcium 8700
Cadmium < 2
Cobalt < 5
Chromium < 20
Copper 59
Iron 9500
Potassium 23000
Lithium < 5
Magnesium 2500
Manganese 210
Molybdenum 50
Sodium 13000
Nickel < 20
Phosphorus 270
Lead < 20
Antimony < 10
Selenium < 30
Tin < 20
Strontium 390
Titanium 1300
Thallium < 30
Uranium < 20
Vanadium 13
Yttrium 4.5
Zinc 20
SGS Vancouver Metallurgy
CONFIDENTIAL 1

Mosquito Consolidated Gold Mines - CUMO Project - CAVM-50004-001
Tungsten and Rare Element Assays of Locked Cycle Test Products
Sample ID W % Ga % Os g/t Re g/t
LCT1 Cln 3 Con A < 0.002 < 0.004 --- ---
LCT1 Cln 3 Con B < 0.002 --- < 0.03 ---
LCT1 Cln 3 Con C < 0.002 --- --- 0.9
LCT1 Ro Tail A 0.004 < 0.004
Tungsten and Rare Element Assays of Locked Cycle Test Products
Sample ID W % Ga % Os g/t Re g/t
VF2-LCT1-Cln 3 Con A 0.004 < 0.004 --- ---
VF2-LCT1-Cln 3 Con B < 0.002 --- <.02 ---
VF2-LCT1-Cln 3 Con C < 0.002 --- --- 2.9
VF2-LCT1-Ro Tail A 0.006 < 0.004 --- ---
Tungsten and Rare Element Assays of Locked Cycle Test Products
Sample ID W % Ga % Os g/t Re g/t
VF3-LCT1-Cln 3 Con A < 0.002 0.005 --- ---
VF3-LCT1-Cln 3 Con B < 0.002 --- < 0.02 ---
VF3-LCT1-Cln 3 Con C < 0.002 --- --- 15
VF3-LCT1-Ro Tail A 0.005 < 0.004 --- ---
ICP-MS - Gallium of Feed and Rougher Tail
Sample ID Ga - g/t
VF3-LCT1 Ro Tails 17
Feed Comp 3 16
SGS Vancouver Metallurgy
CONFIDENTIAL 2
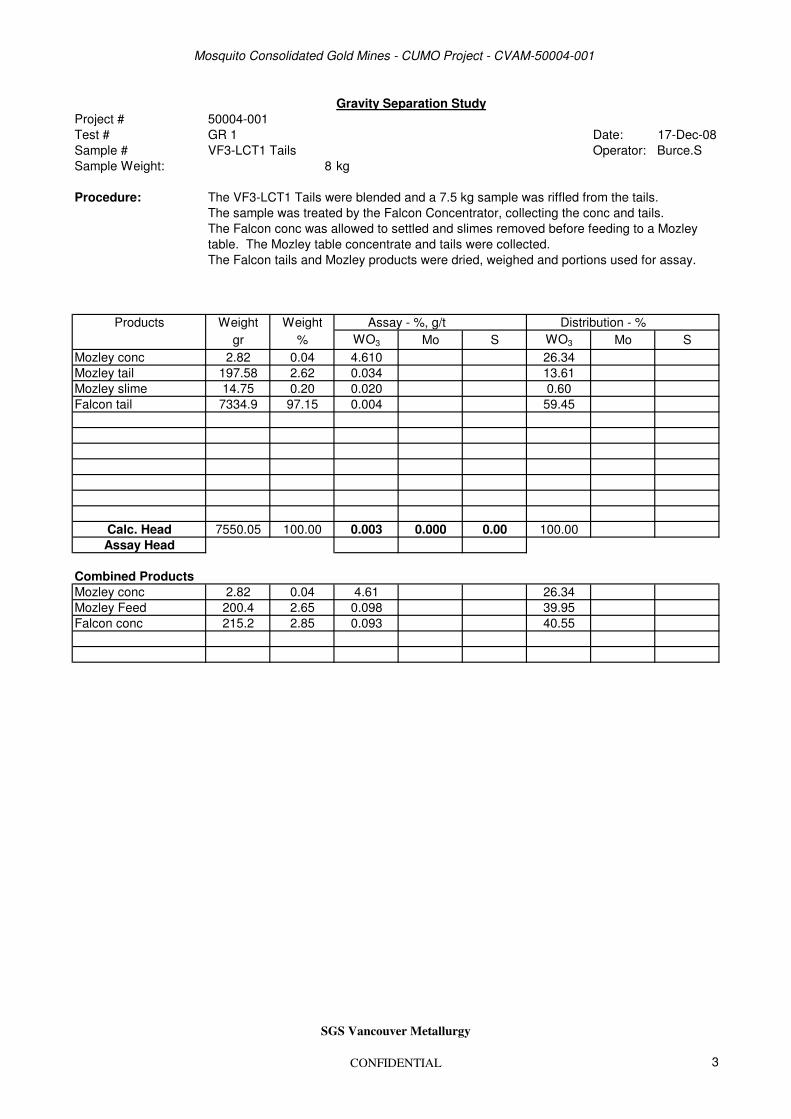
Mosquito Consolidated Gold Mines - CUMO Project - CVAM-50004-001
Gravity Separation Study
Project # 50004-001
Test # GR 1 Date: 17-Dec-08
Sample # VF3-LCT1 Tails Operator: Burce.S
Sample Weight: 8 kg
Procedure:
The sample was treated by the Falcon Concentrator, collecting the conc and tails.
The Falcon conc was allowed to settled and slimes removed before feeding to a Mozley
table. The Mozley table concentrate and tails were collected.
The Falcon tails and Mozley products were dried, weighed and portions used for assay.
Products Weight Weight Assay - %, g/t Distribution - %
gr % WO3 Mo S WO3 Mo S
Mozley conc 2.82 0.04 4.610 26.34
Mozley tail 197.58 2.62 0.034 13.61
Mozley slime 14.75 0.20 0.020 0.60
Falcon tail 7334.9 97.15 0.004 59.45
Calc. Head 7550.05 100.00 0.003 0.000 0.00 100.00
Assay Head
Combined Products
Mozley conc 2.82 0.04 4.61 26.34
Mozley Feed 200.4 2.65 0.098 39.95
Falcon conc 215.2 2.85 0.093 40.55
The VF3-LCT1 Tails were blended and a 7.5 kg sample was riffled from the tails.
SGS Vancouver Metallurgy
CONFIDENTIAL 3