f.e.a.r. returns - bicsi returns - 5 steps... · 40% in development/test vs. production ......
TRANSCRIPT

F.E.A.R. Returns:F.E.A.R. Returns:5 Steps Toward Data Center 5 Steps Toward Data Center
Efficiency TodayEfficiency Today

ObjectivesObjectivesObjectivesObjectives•• Benefits for ITS professionalsBenefits for ITS professionalsBenefits for ITS professionalsBenefits for ITS professionals
•• Brief review of the FEARBrief review of the FEAR data centerdata center
•• Define data center efficiencyDefine data center efficiency
•• Link efficiency to the FEAR data centerLink efficiency to the FEAR data center
•• Increase data center efficiencyIncrease data center efficiency

BenefitsBenefitsBenefitsBenefits•• Increase exposure to OwnersIncrease exposure to Ownerspp
–– ITS needs are addressed during budget developmentITS needs are addressed during budget development
–– Educated Owner makesEducated Owner makes valuevalue instead ofinstead of budgetbudget–– Educated Owner makes Educated Owner makes valuevalue instead of instead of budgetbudgetdecisionsdecisions
Increase input in the design processIncrease input in the design process•• Increase input in the design processIncrease input in the design process–– Develop peer relationships with traditional consultantsDevelop peer relationships with traditional consultants
–– Ensure standards and requirements are implementedEnsure standards and requirements are implemented
•• IncreaseIncrease revenuerevenue for the ITS professionalfor the ITS professional•• Increase Increase revenuerevenue for the ITS professionalfor the ITS professional

FEAR ModelFEAR Model -- ReviewReviewFEAR Model FEAR Model -- ReviewReview•• Footprint Footprint –– determine the rack size based determine the rack size based pp
on planned equipmenton planned equipment
•• EnergyEnergy evaluates the power allowanceevaluates the power allowance•• EnergyEnergy –– evaluates the power allowance evaluates the power allowance for process and support equipmentfor process and support equipment
•• ArrangementArrangement –– optimizes layout for space optimizes layout for space efficiencyefficiencyyy
•• RedundancyRedundancy –– considers space for support considers space for support equipment to meet requirementsequipment to meet requirementsequipment to meet requirementsequipment to meet requirements
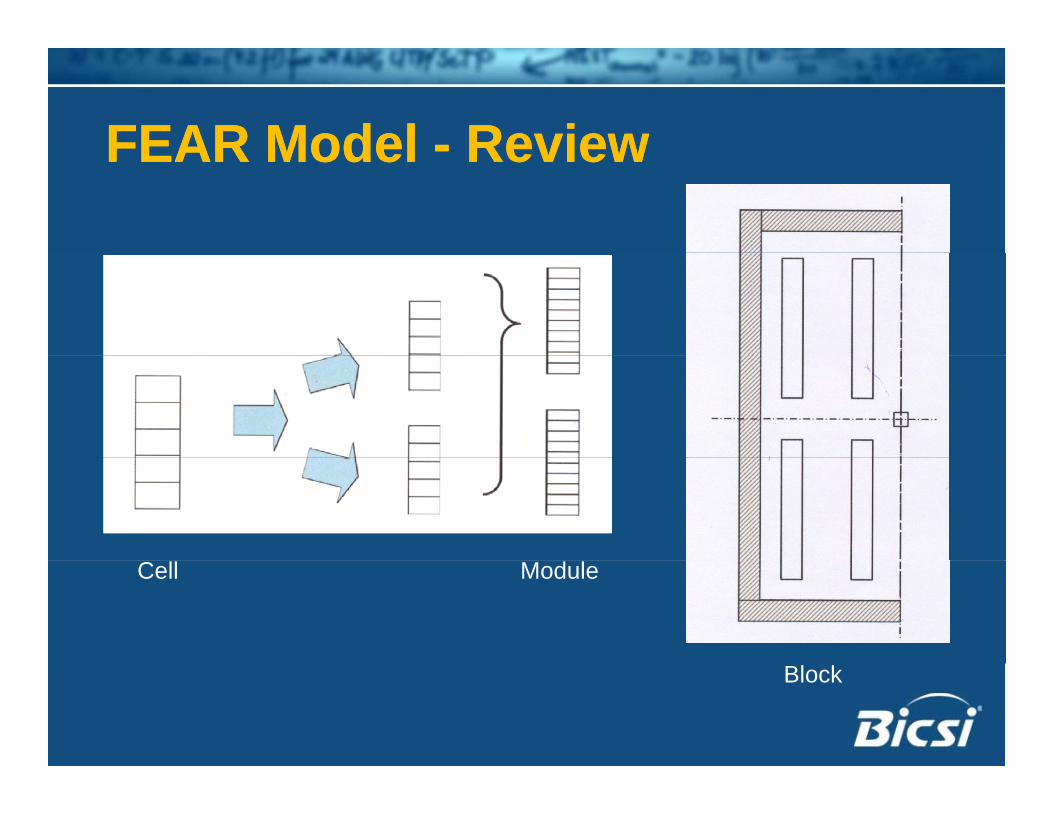
FEAR ModelFEAR Model -- ReviewReviewFEAR Model FEAR Model -- ReviewReview
Cell Module
Block

FEAR ModelFEAR Model -- ReviewReviewFEAR Model FEAR Model -- ReviewReview
Detailed Block Sample Data Center

FEAR ModelFEAR Model -- SummarySummaryFEAR Model FEAR Model -- SummarySummary
•• A simple process for concept planningA simple process for concept planningA simple process for concept planningA simple process for concept planning
•• Considers Footprint, Energy, Arrangement, Considers Footprint, Energy, Arrangement, p gy gp gy g
and Redundancyand Redundancy
•• Creates a modular plan that can be scaled Creates a modular plan that can be scaled
t j tt j tto a projectto a project

Efficiency - Background• What is today’s Data Center ?• What is today’s Data Center ?
Efficiency Background
StorageStorageCommsComms
yy
Storage Storage Area Area
NetworksNetworks(SAN)(SAN)
Comms Comms and and
Network Network EquipmentEquipment (SAN)(SAN)EquipmentEquipment
Enterprise Enterprise Process Process ServersServersServersServers

Efficiency - BackgroundEfficiency - Background•• What affects data center efficiency?What affects data center efficiency?yy
FacilitiesFacilities
PowerPower ManagementManagement CoolingCoolingPowerPower ManagementManagementInfrastructureInfrastructure
CoolingCooling
ComputeCompute StorageStorage NetworkNetworkComputeCompute StorageStorage NetworkNetwork
© 2009 The Green Grid

Efficiency - FactorsEfficiency - Factors•• Where is energy consumed?Where is energy consumed? CategoryCategory EnergyEnergygygy
–– IT equipment and processesIT equipment and processes
CategoryCategory EnergyEnergy
Processors 170 W
Pwr Supply Loss 158 W Processor duty cycleProcessor duty cycle
Application deployment densityApplication deployment density
Pwr Supply Loss 158 W
Storage 47 W
Networking 47 Wpp p y ypp p y y
Internal power utilizationInternal power utilizationPeripherals 88 W
Fans 78 W
PowerPower DrawDraw 588588 WW

Efficiency - FactorsEfficiency - Factors•• Where is energy consumed?Where is energy consumed? CategoryCategory EnergyEnergygygy
–– Facility equipmentFacility equipment
CategoryCategory EnergyEnergy
Chillers 300 W Electrical lossesElectrical losses
HVAC equipment effectivenessHVAC equipment effectiveness
Chillers 300 W
Fans 125 W
Elec Losses 101 Wq pq p
Redundancy considerationsRedundancy considerationsLights 13 W
Operations and controlsOperations and controlsPowerPower DrawDraw 539539 WW

Efficiency - FactorsEfficiency - Factors•• Where is energy consumed?Where is energy consumed?gygy
Pwr Supply Pwr Supply LossesLosses
14%14%14%14%
ProcessorsProcessors15%15%
CoolingCooling38%38%
PeripheralsPeripherals8%8%
FansFans7%7%
StorageStorageStorageStorage4%4%
NetworkingNetworking4%4%
Elec DistElec Dist9%9%
LightsLights1%1%
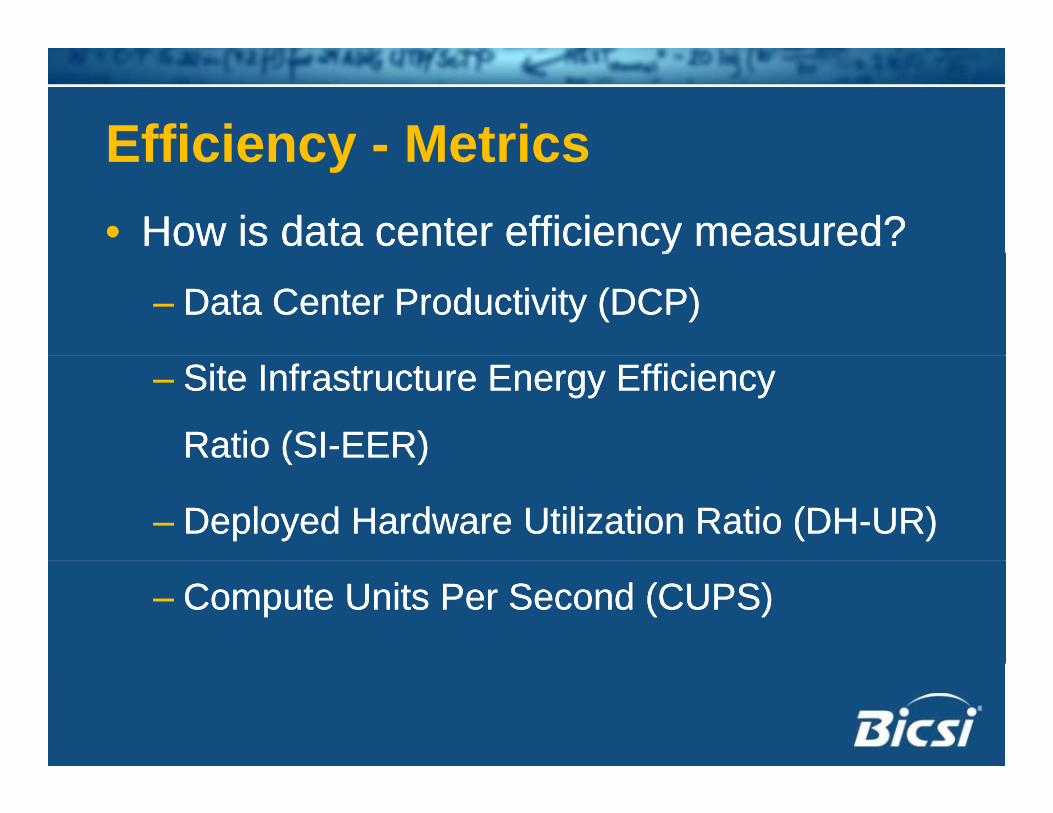
Efficiency - MetricsEfficiency - Metrics•• How is data center efficiency measured?How is data center efficiency measured?yy
–– Data Center Productivity (DCP)Data Center Productivity (DCP)
–– Site Infrastructure Energy Efficiency Site Infrastructure Energy Efficiency
Ratio (SIRatio (SI--EER)EER)(( ))
–– Deployed Hardware Utilization Ratio (DHDeployed Hardware Utilization Ratio (DH--UR)UR)
–– Compute Units Per Second (CUPS)Compute Units Per Second (CUPS)

Efficiency - MetricsEfficiency - Metrics• How is data center efficiency measured?y
– Power Utilization Effectiveness (PUE) [The Green Grid Consortium]
– Corporate Average Data Center Efficiency (CADE) [McKinsey Report]
– Data Center Performance Per Energy (DPPE)[Japan’s Green IT Promotion Council][Japan s Green IT Promotion Council]

Efficiency - MetricsEfficiency - Metrics•• How is data center efficiency measured?How is data center efficiency measured?yy
– Consensus opinions:
– Efficiency does not
capture full potential
– Economy measures
performance throughoutperformance throughout
operating range
© US EPA & US DoE

Efficiency - MetricsEfficiency - Metrics• How is data center efficiency measured?y
– For now – PUE is the standard
Total Data
PUECenter Power
IT Equipment Power

Efficiency - MetricsEfficiency - Metrics• How is data center efficiency measured?y
– For now – PUE is the standard
1 127 kW
1.92
1,127 kW
588 kW

Efficiency Meets FEAREfficiency Meets FEAREfficiency Meets FEAREfficiency Meets FEAR•• Model conceived to emphasize efficiencyModel conceived to emphasize efficiencyp yp y
–– Adapts to variable power densitiesAdapts to variable power densities
–– Applies to Raised Floor or Slab Applies to Raised Floor or Slab
Emphasizes Hot / Cold Aisle ConfigurationEmphasizes Hot / Cold Aisle Configuration–– Emphasizes Hot / Cold Aisle ConfigurationEmphasizes Hot / Cold Aisle Configuration
–– Flexible for Whole Room or InFlexible for Whole Room or In--Row SolutionsRow Solutions

Solution #1Solution #1 -- FootprintFootprintSolution #1 Solution #1 -- FootprintFootprint•• Manage IT UtilizationManage IT Utilizationgg
–– ConsolidateConsolidate
40% in Development/Test vs. Production
–– EliminateEliminateEliminateEliminate
30% of servers are "dead"
–– VirtualizeVirtualize
Average 10% processor utilizationAverage 10% processor utilization Average 10% processor utilizationAverage 10% processor utilization

Solution #1Solution #1 -- FootprintFootprintSolution #1 Solution #1 -- FootprintFootprint•• Manage IT UtilizationManage IT Utilizationgg
AdvantagesAdvantages DisadvantagesDisadvantages
•• Maximizes spaceMaximizes space
•• Eliminates low use lossesEliminates low use losses
•• Potential security / audit Potential security / audit issuesissues•• Eliminates low use lossesEliminates low use losses
•• Drives economical Drives economical operationsoperations
•• Virtualization can be Virtualization can be complex and expensivecomplex and expensiveoperationsoperations

Solution #2Solution #2 -- EnergyEnergySolution #2 Solution #2 -- EnergyEnergy•• Expand the EnvelopeExpand the Envelopep pp p
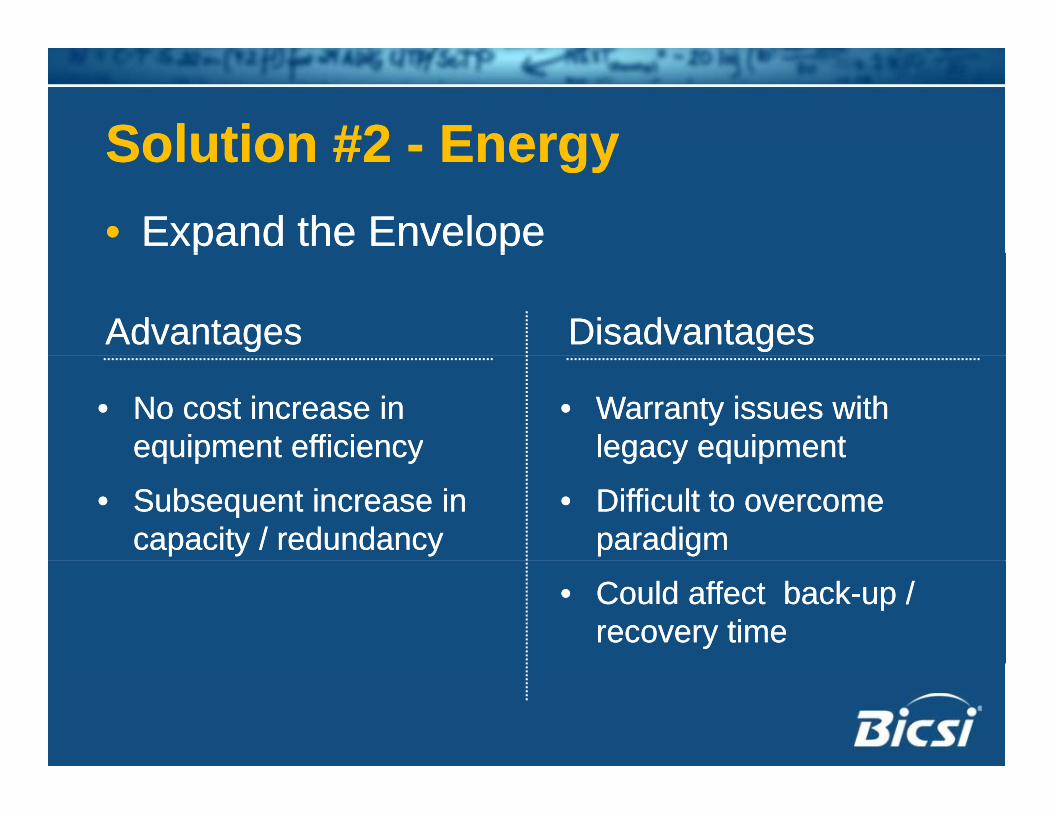
Solution #2Solution #2 -- EnergyEnergySolution #2 Solution #2 -- EnergyEnergy•• Expand the EnvelopeExpand the Envelopep pp p
AdvantagesAdvantages DisadvantagesDisadvantages
•• No cost increase in No cost increase in equipment efficiencyequipment efficiency
•• Warranty issues with Warranty issues with legacy equipmentlegacy equipmentq p yq p y
•• Subsequent increase in Subsequent increase in capacity / redundancycapacity / redundancy
g y q pg y q p
•• Difficult to overcome Difficult to overcome paradigmparadigm
•• Could affect backCould affect back--up / up / recovery timerecovery time

Solution #3Solution #3 -- ArrangementArrangementSolution #3 Solution #3 -- ArrangementArrangement•• Plan and manage room loadPlan and manage room loadgg
–– Option A Option A -- Spread the loadSpread the load
Design room based on average densityDesign room based on average density
Allocate functions to manage average densityAllocate functions to manage average densityg g yg g y
–– Option B Option B -- Create density zonesCreate density zones
Designate specific rows for high / med / low Designate specific rows for high / med / low
densitydensity

Solution #3Solution #3 -- ArrangementArrangementSolution #3 Solution #3 -- ArrangementArrangement•• Plan and Manage Room LoadPlan and Manage Room Loadgg
AdvantagesAdvantages DisadvantagesDisadvantages
•• Easy to planEasy to plan
•• Enables right sizing ofEnables right sizing of
•• Difficult to implement in Difficult to implement in existing roomexisting room•• Enables right sizing of Enables right sizing of
support equipmentsupport equipment
gg
•• Can create sprawl, Can create sprawl, countering efficiency countering efficiency effortsefforts

Solution #4Solution #4 -- RedundancyRedundancySolution #4 Solution #4 -- RedundancyRedundancy•• Leverage site conditionsLeverage site conditionsgg
–– Free coolingFree cooling
Water side economizerWater side economizer
Air side EconomizerAir side Economizer
–– Other renewable solutionsOther renewable solutions
Evaporative coolingEvaporative cooling
GeothermalGeothermalGeot e aGeot e a

Solution #4Solution #4 -- RedundancyRedundancySolution #4 Solution #4 -- RedundancyRedundancy•• Leverage site conditionsLeverage site conditionsgg

Solution #4Solution #4 -- RedundancyRedundancySolution #4 Solution #4 -- RedundancyRedundancy•• Leverage site conditionsLeverage site conditionsgg
AdvantagesAdvantages DisadvantagesDisadvantages
•• Increase redundancy with Increase redundancy with reduced energyreduced energy
•• Trends toward limited Trends toward limited geographygeography
•• Enables right sizing of support Enables right sizing of support equipmentequipment
Major step toward sustainableMajor step toward sustainable
•• Potential air quality issuesPotential air quality issues
•• Major step toward sustainable Major step toward sustainable operationsoperations

Solution #5Solution #5 -- FEARFEARSolution #5 Solution #5 -- FEARFEAR•• Measure & ControlMeasure & Control
–– You can’t improve what you can’t measure…You can’t improve what you can’t measure…
FacilitiesFacilities
PowerPower ManagementManagementI f t tI f t t
CoolingCoolingInfrastructureInfrastructure
ComputeCompute StorageStorage NetworkNetwork

Solution #5Solution #5 -- FEARFEARSolution #5 Solution #5 -- FEARFEAR•• Measure & ControlMeasure & Control
AdvantagesAdvantages DisadvantagesDisadvantages
•• Automation enhances response Automation enhances response to efficiency measuresto efficiency measures
•• Can be expensive and Can be expensive and complicated to implementcomplicated to implement
•• Enables direct feedback for Enables direct feedback for efficiency metricsefficiency metrics
Provides predictive data forProvides predictive data for•• Provides predictive data for Provides predictive data for growth managementgrowth management
•• Multiple levels availableMultiple levels available
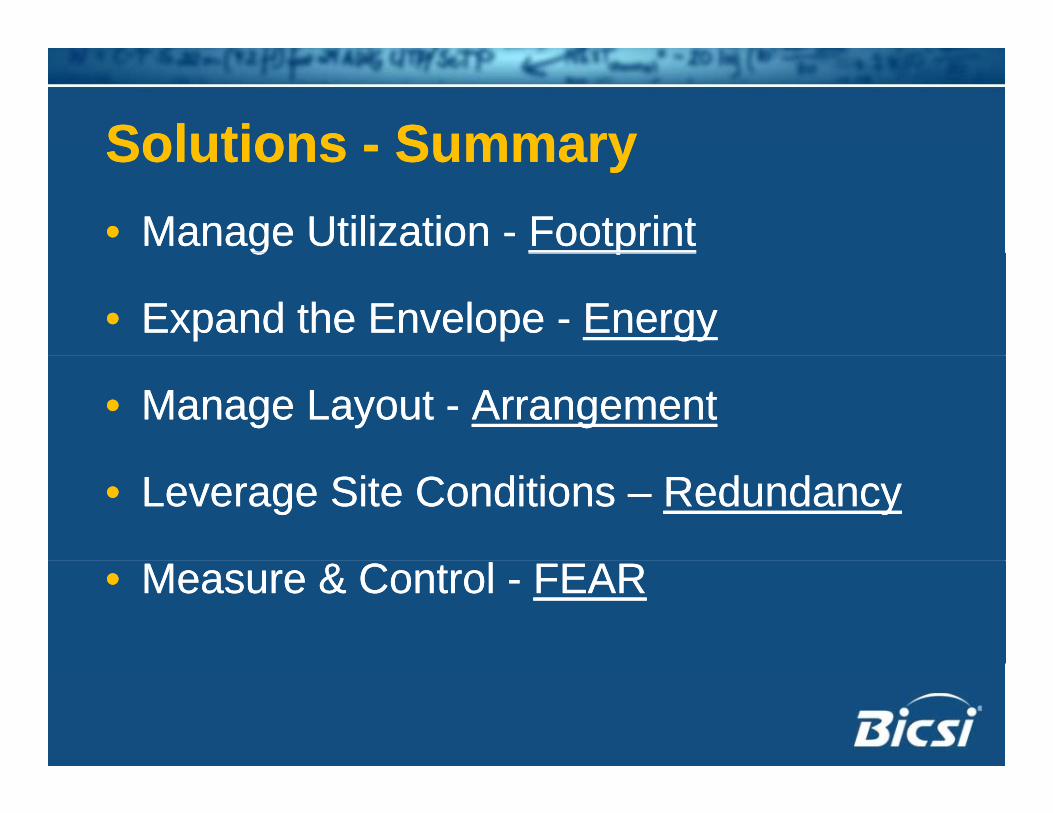
SolutionsSolutions -- SummarySummarySolutions Solutions -- SummarySummary•• Manage Utilization Manage Utilization -- FootprintFootprintgg pp
•• Expand the Envelope Expand the Envelope -- EnergyEnergy
•• Manage Layout Manage Layout -- ArrangementArrangement
•• Leverage Site Conditions Leverage Site Conditions –– RedundancyRedundancy
•• Measure & Control Measure & Control -- FEARFEAR

Tools & ResourcesTools & ResourcesTools & ResourcesTools & Resources•• Resource OrganizationsResource Organizationsgg
–– BICSIBICSI
Data Center Design ManualData Center Design Manual
–– The Green GridThe Green GridThe Green GridThe Green Grid
www.thegreengrid.comwww.thegreengrid.com library and toolslibrary and tools
–– ASHRAEASHRAE
TC 9 9 DataCom SeriesTC 9 9 DataCom Series TC 9.9 DataCom SeriesTC 9.9 DataCom Series

Tools & ResourcesTools & ResourcesTools & ResourcesTools & Resources•• Useful ToolsUseful Tools
–– DoE EERE ITPDoE EERE ITP
DC Pro DC Pro –– profiling and system assessment toolsprofiling and system assessment tools
–– The Green GridThe Green GridThe Green GridThe Green Grid
Performance calculators and estimatorsPerformance calculators and estimators
Application white papersApplication white papers

F.E.A.R. Returns:F.E.A.R. Returns:5 Steps Toward Data Center 5 Steps Toward Data Center
Efficiency TodayEfficiency Today
Thank You!Thank You!