ezh2-gata6 axis in pancreatic ductal adenocarcinoma
TRANSCRIPT
EZH2-GATA6 axis in
Pancreatic ductal adenocarcinoma
DISSERTATION
for the award of the degree
“Doctor of Philosophy (Ph.D)”
Division of Mathematics and Natural Sciences
of the Georg-August-Universität Göttingen
within the doctoral program “Molecular Medicine”
of the Georg-August University School of Science (GAUSS)
Submitted by
Shilpa Patil
Born in
Manipal, India
Göttingen, May 2020

Members of the thesis committee:
PD. Dr. med. Elisabeth Hessmann (Thesis supervisor & 1st Reviewer)
Department of Gastroenterlogy and Gastrointestinal Oncology
University Medical Center, Göttingen
Prof. Dr. Frauke Alves (2nd Reviewer)
Translational Molecular Imaging Group
Max Planck Institute of Experimental Medicine, Göttingen
Prof. Dr. rer. nat. Dieter Kube
Department of Hematology and Oncology
University Medical Center, Göttingen
Extended examination Board Members:
Prof. Dr. med. Matthias Dobbelstein
Institute of Molecular Oncology
University Medical Center, Göttingen
Prof. Dr. med. Heidi Hahn
Institute of Human Genetics
University Medical Center, Göttingen
PD. Dr. rer. nat. Laura Zelarayan-Behrend
Institute of Pharmacology & Toxicology
University Medical Center, Göttingen
Date of submission of thesis: 07.05.2020
Date of the oral examination: 22.06.2020


DEDICATION
To my parents
for giving me the space to
dream and fly.
I owe them everything I achieve in my life.

TABLE OF CONTENTS
ACKNOWLEDGMENTS ............................................................................................... i
LIST OF FIGURES ...................................................................................................... v
ABSTRACT ............................................................................................................... vii
1 INTRODUCTION .................................................................................................. 1
Pancreatic cancer ......................................................................................... 1
Pancreatic cancer statistics .................................................................... 1
Pancreatic carcinogenesis ...................................................................... 2
PDAC heterogeneity ..................................................................................... 3
Molecular heterogeneity of PDAC ........................................................... 3
Molecular PDAC subtypes ...................................................................... 4
Epigenetics ................................................................................................... 7
Nucleosome remodeling ......................................................................... 8
Histone modifications .............................................................................. 9
PRC2 complex ........................................................................................... 11
Regulation of EZH2 expression in cancer ............................................. 13
Context-dependent roles of EZH2 ......................................................... 14
EZH2 in PDAC ...................................................................................... 16
EZH2 inhibitors ..................................................................................... 16
Aims of the study ........................................................................................ 20
2 MATERIALS ...................................................................................................... 21
Equipments: ............................................................................................... 21
Consumable materials ................................................................................ 23
Chemicals................................................................................................... 24
Kits, reagents and inhibitors ....................................................................... 25
Nucleic acids .............................................................................................. 26
gRNA sequences and validation primers for CRISPR/Cas9-mediated EZH2 knockout................................................................................................... 26
siRNA/shRNA oligonucleotides ............................................................. 27
qPCR primers ....................................................................................... 27
ChIP Primers ........................................................................................ 29
Buffers ........................................................................................................ 30
ChIP Buffers ......................................................................................... 30
Western Buffers .................................................................................... 31
Antibodies, Enzymes and standards ........................................................... 34
Antibodies ............................................................................................. 34
Enzymes ............................................................................................... 35
Standards ............................................................................................. 35
Cell culture reagents, growth media and antibiotics .................................... 35
Softwares ................................................................................................... 36
3 METHODS ......................................................................................................... 37
In vivo experiments ..................................................................................... 37
Mouse strains ....................................................................................... 37
Metastatic incidence in transgenic mice ................................................ 38
Cell culture: ................................................................................................ 38
Cells, culture conditions and Tazemetostat (EPZ6438) treatment ......... 38
Generation of EZH2 shRNA and CRISPR/Cas9 clones and transient transfection ........................................................................................................ 39
Functional in vitro assays ........................................................................... 40
Cell counting assay ............................................................................... 40
BrdU (Bromodeoxyuridine) assay ......................................................... 40
Boyden chamber assay ........................................................................ 41
Colony formation assay ........................................................................ 41
Sphere formation assay ........................................................................ 41
Molecular biology ........................................................................................ 42
RNA isolation ........................................................................................ 42
cDNA synthesis .................................................................................... 42
Quantitative polymerase chain reaction (qPCR) .................................... 42
Chromatin Immunoprecipitation (ChIP) ................................................. 43
Protein biochemistry ................................................................................... 45
Sample preparation and Bradford Assay ............................................... 45
SDS PAGE and Western blot analysis .................................................. 45
Next generation sequencing: ...................................................................... 46
ChIP seq library preparation and analysis ............................................. 46
RNA seq library preparation and analysis ............................................. 47
H&E staining and immunohistochemistry .................................................... 48
Tissue Microarray Analysis (TMA) in human PDAC samples ...................... 49
Statistical analysis ...................................................................................... 49
4 RESULTS .......................................................................................................... 51
EZH2 in tumor progression ......................................................................... 51
EZH2 is overexpressed in dedifferentiated human PDAC ..................... 51
EZH2 drives PDAC progression in transgenic mice .............................. 52
EZH2 drives liver metastasis in transgenic mice ................................... 57
Functional implications of EZH2 in PDAC cells ........................................... 58
EZH2 depletion reduces proliferation in NKC cells ................................ 60
EZH2 depletion reduces stemness properties in NKC cells ................... 61
EZH2 depletion reduces the invasive potential of NKC cells ................. 62
Mechanistic role of EZH2 in PDAC ............................................................. 63
EZH2 regulates genes mediating differentiation and tumor progression in PDAC 64
EZH2 depletion leads to enrichment of favorable prognosis and differentiation gene sets ..................................................................................... 65
Classical subtype PDAC genes are positively enriched upon EZH2 depletion ............................................................................................................ 67
EZH2 binds largely on TSS/promoter sites of its target genes .............. 69
EZH2-deficiency fosters a shift in histone modifications at EZH2 target genes 71
EZH2 targets differentiation-associated genes ...................................... 73
EZH2 target gene expression validation ............................................... 75
EZH2-GATA6 axis in PDAC ....................................................................... 78
EZH2 targets epithelial transcription factor Gata6 ................................. 78
EZH2 depletion significantly increases Gata6 expression in murine PDAC cells ......................................................................................................... 80
EZH2 represses GATA6 expression in human PDAC ........................... 82
The EZH2-GATA6 axis exists in human PDAC specimens ................... 84
GATA6 targets are enriched upon EZH2 depletion ............................... 85
Gata6 knockdown can rescue the effects of EZH2 depletion on invasion86
5 DISCUSSION ..................................................................................................... 89
Polycomb group proteins in the regulation of differentiation processes ....... 89
EZH2 in pancreas development and cancer progression ............................ 89
Role of epigenetic modulations in mediating cancer cell plasticity .............. 92
EZH2 in PDAC subtype identity .................................................................. 94
GATA6 as a marker of the classical PDAC subtype .................................... 96
PDAC subtype switching ............................................................................ 97
Strategies to induce GATA6 expression for subtype switching .............. 98
Pharmacological inhibition of EZH2 in PDAC ............................................ 100
Conclusion................................................................................................ 102
6 BIBLIOGRAPHY .............................................................................................. 103
ABBREVIATIONS ...................................................................................................... ix
APPENDIX ................................................................................................................ xv
CURRICULUM VITAE ............................................................................................. xvii


ACKNOWLEDGMENTS
i
ACKNOWLEDGMENTS
“No one can whistle a symphony. It takes an orchestra to play it” – H.E.Luccock
Ph.D. is like topography – There are summits of happiness and success, flat stretches
of boring routine, valleys of frustration and failures. Now when I look back, it feels
completely worth experiencing the walk. The last four years have been amazing years
of immense learning and personal growth. Though I stand alone on the cover of this
thesis, the credit goes to many people for helping me persevere and complete my
degree with satisfaction. I would like to acknowledge all the people who have been a
major part of my journey.
I have been amazingly fortunate to have PD. Dr. med. Elisabeth Hessmann (Lissy) as
my supervisor, who has continuously provided me with valuable guidance,
encouragement and support throughout these years. She has given me the freedom to
pursue my research while also silently ensuring that I stay on track. Apart from
science, I have always tried to imbibe from her values on patience, productivity, hard
work, balancing life, being humble and extremely grounded. She will always be
someone that I would look up to in my life for her exceptional scientific knowledge as
well as extraordinary human qualities.
On a special note, I would like to thank Prof. Dr. med. Volker Ellenrieder for giving me
the opportunity to work in this young, collaborative and enthusiastic department that he
has built and supported for years. I acknowledge the financial support for my research
study by Deutsche Krebshilfe and Wilhelm Sander Stiftung funding sources.
I express my deep and sincere gratitude to Prof. Steven Johnsen (Steve) for showing
genuine interest in my project, constantly providing credible ideas and being very
approachable. I thank Prof. Frauke Alves for all the valuable insights on my project
throughout these four years. She never missed to ask me about my problems and
wellbeing in Germany especially in my initial days and I greatly appreciate her
concern. I also thank Prof. Dieter Kube for joining as my TAC member in between my
Ph.D. journey and providing helpful suggestions on my project.
My sincere gratitude goes to Prof. Matthias Dobbelstein for giving me the opportunity
to collaborate in his project and for being an extremely inspiring person. I thank him as
well as Prof. Heidi Hahn and PD. Dr. rer. nat. Laura Zelarayan for agreeing to be my
external examination board members.
I appreciate the support received from our collaborators- Prof. Philipp Ströbel and Dr.
Stefan Kueffer from the Institute of Pathology. I thank Dr. Vijayalakshmi Kari, Dr.

ACKNOWLEDGMENTS
Zeynab Najafova and specially Xin Wang who was always available to help and teach
me bioinformatic analysis as well as for being a very good friend.
I am deeply grateful to Dr. Shiv K. Singh for being immensely helpful at all times and
for all the refreshing conversations I have had with him during these four years. I
sincerely thank PD. Dr. Dr. med. Albrecht Neesse for introducing me to the ultrasound
techniques and giving me an opportunity to be a part of his projects. My special thanks
to Dr. med. Robert Goetze (Robby) for patiently making me better at my ultrasound
technical skills and for being a very caring, generous and super-friendly person.
I am indebted to Christin Kellner, Jessica Spitalieri and Kristina Reutlinger for the
excellent technical support, and Sercan Mercan and Tobias Kaiser for their generous
help with the mice. I am thankful to Ulrike Wegner for always being pleasant and Jutta
Blumberg for all her warm hugs which were my instant stress-burster. My very special
gratitude goes to Waltraut Kopp for always going an extra mile to help me with mouse
studies, experiments and for being extremely kind, affectionate and caring.
I literally have the ‘best’ Ph.D. mates – Zhe Zhang and Lennart Versemann. I thank
them for helping me around in lab, listening to all my experiments-not-working issues,
proofreading my thesis, giving constructive feedback and giving me the privilege of
friendship to be myself. I thank all my current/former fellow colleagues – Mengyu,
Umair, Lucas, Geske, Fredi, Nina, Marie, Melanie, Iswarya and all others who have in
their own ways assisted me on this path and have ensured that good times kept
flowing. I thank Jan Arne and Joshua Blume for giving me an opportunity to develop
my teaching skills.
Cheers to the best friends I made in this lab – Alice, Mengyu and Cezerela. I genuinely
value them for their amazing company, never-ending conversations, crazy movie
nights, stupid advice, loads of laughter and all the special ‘little moments’ which will
remain the best part of my lab memories.
My days in Goettingen would not have been the same without the company of a few
people: I am extremely grateful to Iswarya (Ishu) whom I completely relied on when I
initially came to Germany. I thank her for all those times she cooked for me and took
care of my health. My heartfelt gratitude goes to Anusha and Sandeep, who are my
family away from home. I thank them for always counting me in their life, making me
feel a little less homesick and for all the advice they have given me. I thank my buddy,
Uday, whom I can always count on and fight with. My special gratitude goes to Maithily
(Maithy). I was very fortunate to have met her when we both newly arrived in Germany
and we have figured out everything together since then. Our every weekend travels,

ACKNOWLEDGMENTS
iii
Europe-trips, dance practices and laughing at our own jokes have kept me sane in
Goettingen. I am very grateful for her continuous moral and emotional support and
hope this to continue in the future.
Back home, I extend my gratitude to my amazing bunch of school friends who have
been there in all aspects of my ups and downs for the last 18 years. I treasure the
lovely friendships I have made along the way - Sunaina, Stephanie, Sidharth, Sunita,
Revathi and my forever enthusiastic friend Sushma. I am deeply thankful to these
people for making my bad times bearable and good times even better. I would like to
specially thank Shikha who has always given me the extra push I needed and has so
far proofread all my thesis, applications, emails, CV and so on since my masters. I can
blindly count on her to continue being my support system in the future.
I am extremely grateful to my Master thesis supervisor Dr. Sweta Srivastava - a strong
reason for me to step deeper into science and research. She has truly been one of my
‘woman of impact’ and I thank her for the space and liberty she has given me to
approach her anytime for any kind of advice.
I whole-heartedly thank my best friend, Himanshu, for his every day phone calls, an
overwhelming amount of laughter, honest opinion on all my complaints, extraordinary
moral support and for his unique way of putting me back on track. All the
conversations that I have had with him has been a constant reminder for me to watch
my thoughts which has helped me develop a broader perspective in life.
My biggest source of strength and the strongest backing that I could ever wish for is
my family. My heartfelt gratitude to my grandmother (doddamma) for her unwavering
love and blessings. I am immensely grateful to my parents for their unconditional love,
unfiltered trust, endless support, quite patience and silent prayers. My deeply
treasured gratitude goes to my most favorite person, my human diary and literally my
second mother - my amazing sister, Kripa - whose footsteps I have copied throughout
my childhood. I specially thank my brother-in-law, Shravan, for teaching me to give
myself the space to figure out what I wanted. He was just a phone call away to help
me handle my silly computer-related issues to life- and career-related confusions. I
thank them both for taking all my tantrums, handling my stubbornness and for being
my eternal cheerleaders. I am blessed to have my family that has never let me feel
short of love and care.
Lastly, I want to express my deepest gratitude to my life mentor Dr. A.P.J. Abdul
Kalam. Some people leave a huge impact on our life without ever meeting in-person.
With his books and speeches, I never felt short of inspiration and motivation.

LIST OF FIGURES
v
LIST OF FIGURES
Figure 1: Schematic depicting heterogeneity in pancreatic cancer. ................... 4
Figure 2: Schematics depicting the chromatin regulators. ................................. 9
Figure 3: Schematic illustrating the function mediated by the PRC2 complex . 12
Figure 4: EZH2 SET-domain inhibitors and their mechanism of action. ........... 18
Figure 5: EZH2 expression correlates with high grade PDAC. ........................ 52
Figure 6: Complete loss of EZH2 hampers pancreatic development in mice. .. 53
Figure 7: EZH2 drives PDAC development and dedifferentiation. ................... 55
Figure 8: EZH2 correlates with increased PDAC incidence in transgenic mice 56
Figure 9: EZH2 deficiency reduces metastatic incidence................................. 57
Figure 10: Generation of shRNA-mediated stable knockdown of EZH2 in NKC
cells.................................................................................................................. 59
Figure 11: EZH2 depletion reduces cell proliferation in NKC cells. .................. 60
Figure 12: EZH2 deficiency reduces anchorage independent growth and
stemness in NKC cells ..................................................................................... 61
Figure 13: EZH2 knockdown reduces invasive capacity of NKC cells. ............ 62
Figure 14: Schematic of the sequencing analysis. ........................................... 63
Figure 15: EZH2 deficiency leads to enrichment of pathways related to PDAC
progression. ..................................................................................................... 65
Figure 16: EZH2 depletion mediates better prognosis and cell differentiation
programs. ......................................................................................................... 66
Figure 17: EZH2 knockdown leads to positive enrichment of classical PDAC-
and negative enrichment of basal-like PDAC subtype gene signatures. ......... 68
Figure 18: EZH2 knockdown leads to enrichment of lipogenic subtype gene
signatures. ....................................................................................................... 69
Figure 19: EZH2 largely occupies the promoter region of its target genes. ..... 71
Figure 20: PCA plots of histone marks from ChIP sequencing analysis .......... 72
Figure 21: Loss of EZH2 binding leads to decrease in H3K27me3 and increase
in H3K4me3 enrichment. ................................................................................. 73
Figure 22: Direct target genes of EZH2 mediate developmental and cell
differentiation related programs. ...................................................................... 74
Figure 23: IGV profile of selected 11 EZH2 direct target genes. ...................... 75
LIST OF FIGURES
vi
Figure 24: Expression of direct EZH2 target genes increases upon EZH2
depletion. .......................................................................................................... 76
Figure 25: EZH2 binds to TSS of its target genes and mediated promoter
specific histone modifications. .......................................................................... 78
Figure 26: EZH2 binds to TSS of Gata6 and mediates TSS specific histone
modifications. ................................................................................................... 79
Figure 27: EZH2 deficiency leads to increased GATA6 expression in murine
PDAC cells ....................................................................................................... 81
Figure 28: EZH2 regulates GATA6 expression in human PDAC cell line PANC-
1. ...................................................................................................................... 82
Figure 29: EZH2 regulates GAT6A expression in cells derived from PDX
models. ............................................................................................................. 83
Figure 30: EZH2 dependent GATA6 regulation is evident in the subpopulation
of PDAC patients. ............................................................................................. 84
Figure 31: Direct downstream targets of GATA6 are enriched upon EZH2
depletion. .......................................................................................................... 85
Figure 32: GATA6 knockdown partially rescues the invasion effects mediated
by EZH2 deficiency. ......................................................................................... 87
Figure 33: Schematic depicting two main PDAC subtypes and its features. .... 94
Figure 34: Proposed model depicting subtype switching in PDAC mediated by
inhibiting EZH2. .............................................................................................. 101
Figure 35: Generation of CRISPR/Cas9 mediated stable knockout of EZH2 in
NKC cells. ....................................................................................................... xvi
ABSTRACT
vii
ABSTRACT
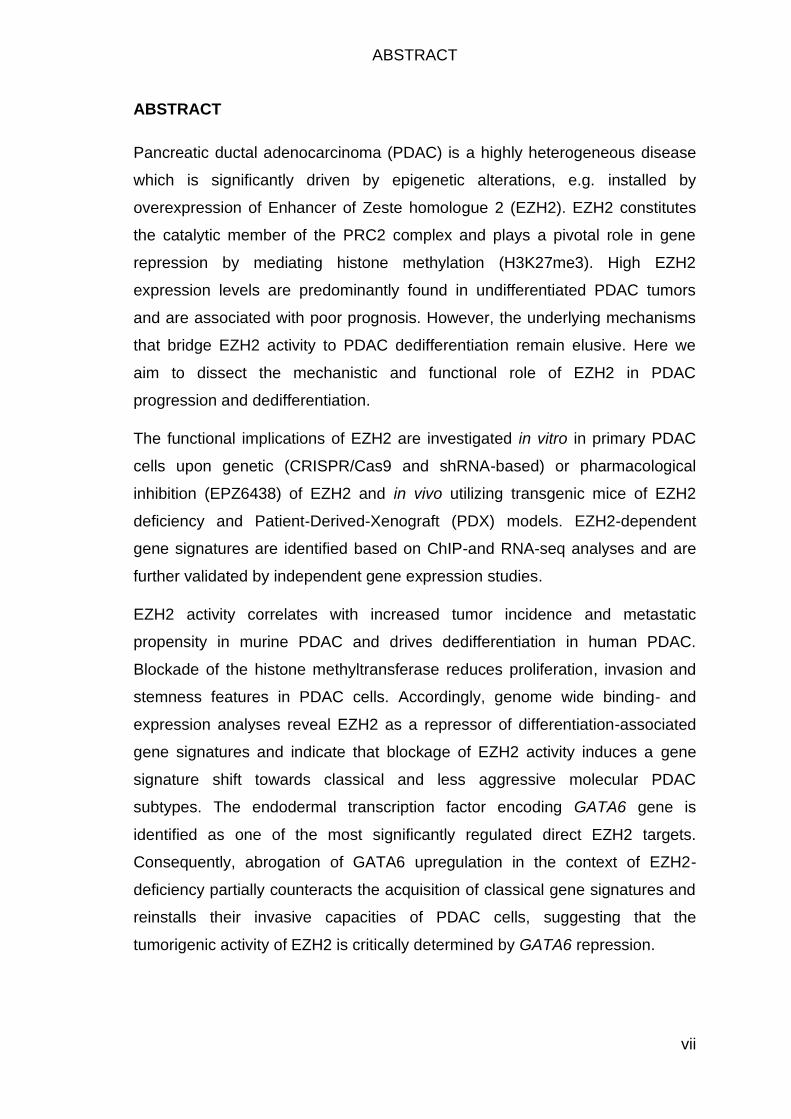
Pancreatic ductal adenocarcinoma (PDAC) is a highly heterogeneous disease
which is significantly driven by epigenetic alterations, e.g. installed by
overexpression of Enhancer of Zeste homologue 2 (EZH2). EZH2 constitutes
the catalytic member of the PRC2 complex and plays a pivotal role in gene
repression by mediating histone methylation (H3K27me3). High EZH2
expression levels are predominantly found in undifferentiated PDAC tumors
and are associated with poor prognosis. However, the underlying mechanisms
that bridge EZH2 activity to PDAC dedifferentiation remain elusive. Here we
aim to dissect the mechanistic and functional role of EZH2 in PDAC
progression and dedifferentiation.
The functional implications of EZH2 are investigated in vitro in primary PDAC
cells upon genetic (CRISPR/Cas9 and shRNA-based) or pharmacological
inhibition (EPZ6438) of EZH2 and in vivo utilizing transgenic mice of EZH2
deficiency and Patient-Derived-Xenograft (PDX) models. EZH2-dependent
gene signatures are identified based on ChIP-and RNA-seq analyses and are
further validated by independent gene expression studies.
EZH2 activity correlates with increased tumor incidence and metastatic
propensity in murine PDAC and drives dedifferentiation in human PDAC.
Blockade of the histone methyltransferase reduces proliferation, invasion and
stemness features in PDAC cells. Accordingly, genome wide binding- and
expression analyses reveal EZH2 as a repressor of differentiation-associated
gene signatures and indicate that blockage of EZH2 activity induces a gene
signature shift towards classical and less aggressive molecular PDAC
subtypes. The endodermal transcription factor encoding GATA6 gene is
identified as one of the most significantly regulated direct EZH2 targets.
Consequently, abrogation of GATA6 upregulation in the context of EZH2-
deficiency partially counteracts the acquisition of classical gene signatures and
reinstalls their invasive capacities of PDAC cells, suggesting that the
tumorigenic activity of EZH2 is critically determined by GATA6 repression.

ABSTRACT
viii
Together, our findings link the EZH2-GATA6 axis to PDAC subtype identity and
suggest EZH2 inhibition as a promising therapeutic strategy to induce subtype-
switching in favor of a less aggressive PDAC phenotype.
INTRODUCTION
1
1 INTRODUCTION
Pancreatic cancer
The pancreas is a glandular organ that lies behind the lower part of the
stomach in the abdomen. It mainly consists of two functional units - endocrine
and exocrine. The endocrine cells help regulate the blood glucose levels, and
the exocrine unit, which is made of acinar and ductal cells, produces and
releases digestive enzymes (Zhou and Melton 2018). The tumor can form in
cells from any of these compartments but 90 % of the pancreatic cancers are
pancreatic ductal adenocarcinoma (PDAC), which arise from the acinar cells of
the pancreas (Iguchi et al. 2016).
Pancreatic cancer statistics
Pancreatic cancer is currently the third leading cause of cancer-related deaths
in the United States (Tavakkoli et al. 2020) and fourth in Europe (Ferlay et al.
2018). With the records of increasing incidence, consistently low survival rates
and no significant improvements in mortality trends, it is projected to be the
second leading cause of cancer-related deaths by 2030 (Tavakkoli et al. 2020).
According to GLOBOCAN 2018 estimates, pancreatic cancer is the 11th most
common cancer in the world and was reported to cause 432,242 deaths (4.5 %
of all deaths caused by cancer) in 2018 (Bray et al. 2018). With the highest
mortality rate of 91 %, to date, it remains one of the deadliest gastrointestinal
malignancies worldwide. Even though the overall incidence of pancreatic
cancer is relatively less, the incidence almost equals the mortality rate (Gordon-
Dseagu et al. 2018; Rahib et al. 2014). Despite all the scientific efforts in the
last few decades, the five-year survival rate of PDAC remains at 9 %, which is
the lowest of all cancer entities (Rawla, Sunkara, and Gaduputi 2019). These
alarming statistics are reasoned by late diagnosis due to lack of specific early
detection methods and no predictive symptoms or nonspecific symptoms.
Furthermore, tumors are unresectable when detected at an advanced stage.
PDAC displays a high recurrence rate after surgery and an intrinsic resistance
against diverse therapeutic regimens, mainly because of untailored therapeutic
strategies, extensive tumor heterogeneity and dynamic cellular plasticity (Orth
et al. 2019). Approximately 70 % of the patients do not respond to therapies
INTRODUCTION
2
and additionally upon failure of chemotherapy, they develop accelerated tumor
growth, resistance and metastasis (Juiz, Iovanna, and Dusetti 2019).
Consequently, advanced research is urgently needed for the better
understanding of disease etiology and the development of novel therapeutic
strategies.
Pancreatic carcinogenesis
The origin of PDAC was deciphered in the 21st century with the development of
genetically engineered mouse models (GEMMs) of PDAC. For a long time,
PDAC was thought to originate from the ductal cells of the pancreas (J. M.
Bailey, DelGiorno, and Crawford 2014; Busnardo et al. 1983). Later, it was
experimentally confirmed that PDAC originates from the acinar cells, which are
known to possess a high degree of cellular plasticity (J. M. Bailey et al. 2015;
Kopp et al. 2012; Ray et al. 2011). In 1988, Smit et al. set a link between a
mutation in codon 12 in KRAS and PDAC (Smit et al. 1988). Subsequently,
many GEMMs verified the association and confirmed that point mutations in the
KRAS gene is the earliest event for the onset of PDAC (Hingorani et al. 2003;
Olive and Tuveson 2006). The KRAS gene codes for the KRAS protein, a
Guanosine triphisphatase (GTPase), which acts as a switch to regulate the
RAS/MAPK signaling pathway. The mutation results in a constitutively active
KRAS protein that continuously drives proliferation independent of external
stimuli (Ellis and Clark 2000). The KRAS oncogene is found to be mutated in
90 % of PDACs (Hansel, Kern, and Hruban 2003; Hruban et al. 1993), and this
gatekeeper KRAS mutation is vital for the initiation of PDAC (Kandha et al.
2012). Studies in mouse models show that upon acinar damage, mutant KRAS
blocks acinar regeneration, thus resulting in progression of Acinar-to-ductal
metaplasia (ADM) to Pancreatic Intraepithelial Neoplasia (PanIN) formation
(Morris et al. 2010). PanINs represent PDAC precursor lesions, which progress
through three well-defined stages (PanIN1A/1B, PanIN2, PanIN3) and have the
potential to cause PDAC. These lesions differ in their level of cytological
abnormalities (Guerra et al. 2007) and are associated with specific step-wise
genetic changes. Oncogenic KRAS is present in 90 % of PanIN1A/1B,
CDKN2A is found to be inactivated in 90 % of PanIN2 (Caldas et al. 1994;
Russo et al. 1998), inactivation of TP53 is found in 50-70 % (Barton et al. 1991;
INTRODUCTION
3
Berrozpe et al. 1994; Rozenblum et al. 1997; Solcia, Bonato, and Ranzani
1994) and loss of SMAD4 is seen in 55 % (Hahn et al. 1996) of PanIN3 (Guerra
et al. 2007; Iacobuzio-Donahue 2012; Thilo Welsch, Jorg Kleeff, and Helmut
Friess 2007).
Although oncogenic activation of KRAS is a very early initiating event for PDAC
origin, certain environmental stimuli like stress or acinar cell injury accelerate
PDAC initiation and further progression (Dumartin et al. 2017). Accordingly,
chronic pancreatitis displays a crucial risk factor for PDAC development (Yadav
and Lowenfels 2013). These events ultimately enhance the secretion of
inflammatory factors which in combination with mutant KRAS boost progression
of PDAC (Baer et al. 2014; Ye et al. 2019; Young et al. 2019).
PDAC heterogeneity
Molecular heterogeneity of PDAC
One of the major reasons for the aggressive tumor biology and the therapeutic
resistance of PDAC is its high molecular heterogeneity. Next-generation
sequencing approaches conducted in the last few years have significantly
extended our understanding of the molecular complexity of PDAC. The first
whole-exome sequencing experiment in pancreatic cancer specimens
conducted in 2008 identified alterations in a number of oncogenes and tumor
suppressor genes (Jones et al. 2008). Further, numerous follow-up studies
have revealed huge amount of information regarding the wide spectrum of
mutational and copy number variations in PDAC (Adamo et al. 2017; P. Bailey
et al. 2016). These reports have not only reaffirmed signature mutations in
KRAS, CDKN2A, SMAD4 and TP53 genes but revealed additional genetic
alterations that occur throughout the process of tumor progression, although at
lower prevalence (P. Bailey et al. 2016; Biankin et al. 2012; Du et al. 2017).
However, recent work indicates that phenotypic features of PDAC are not only
driven by genetic alterations but are significantly determined by epigenetic
changes (G. Lomberk et al. 2018; Nicolle et al. 2017). Hence, epigenetic
dysregulation critically contributes to the molecular diversity of PDAC.
INTRODUCTION
4
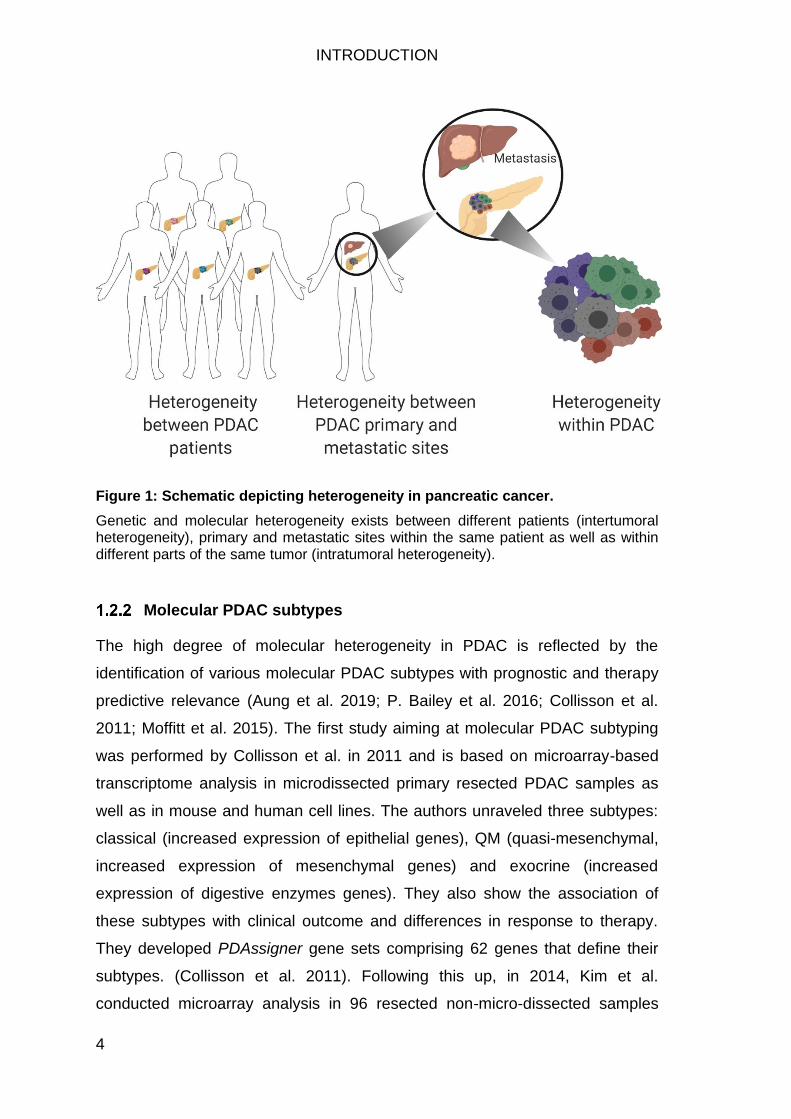
Figure 1: Schematic depicting heterogeneity in pancreatic cancer.
Genetic and molecular heterogeneity exists between different patients (intertumoral heterogeneity), primary and metastatic sites within the same patient as well as within different parts of the same tumor (intratumoral heterogeneity).
Molecular PDAC subtypes
The high degree of molecular heterogeneity in PDAC is reflected by the
identification of various molecular PDAC subtypes with prognostic and therapy
predictive relevance (Aung et al. 2019; P. Bailey et al. 2016; Collisson et al.
2011; Moffitt et al. 2015). The first study aiming at molecular PDAC subtyping
was performed by Collisson et al. in 2011 and is based on microarray-based
transcriptome analysis in microdissected primary resected PDAC samples as
well as in mouse and human cell lines. The authors unraveled three subtypes:
classical (increased expression of epithelial genes), QM (quasi-mesenchymal,
increased expression of mesenchymal genes) and exocrine (increased
expression of digestive enzymes genes). They also show the association of
these subtypes with clinical outcome and differences in response to therapy.
They developed PDAssigner gene sets comprising 62 genes that define their
subtypes. (Collisson et al. 2011). Following this up, in 2014, Kim et al.
conducted microarray analysis in 96 resected non-micro-dissected samples
INTRODUCTION
5
and shared similar findings. They found three molecular subtypes: subtype1
(similar to classical subtype with enriched immune pathways), subtype2
(resembles QM PDA) and subtype3 (similar to exocrine-like) which had a
significant correlation with tumor size, metastasis and survival (S. Kim et al.
2014).
In 2015, Moffit et al. performed virtual microdissection to separate stroma from
epithelial tumors and looked for gene expression in both tumoral and stromal
compartment. They conducted microarray analysis in both primary and
metastatic samples and further validated their results by RNA-sequencing
(RNA-seq), which is a more sensitive method and can capture a broader range
(Rodríguez-García, Sola-Landa, and Barreiro 2017). They presented two
subtypes for the tumor compartment: classical and basal-like which overlapped
with the Collisson classical and QM subtypes, respectively. The authors also
distinguished two stromal subtypes: Normal and activated stroma which
independently serve as prognostic markers (Moffitt et al. 2015). Soon after this,
in 2016, Janky et al. published their microarray data in resected samples,
where they found three clusters largely reflecting the findings from Collisson et
al (Janky et al. 2016). In 2016, Bailey et al. in collaboration with International
Cancer Genome Consortium (ICGC), performed integrated genomic analysis
and gene expression analysis using deep-exome sequencing and RNA-seq
approaches. They explored 32 significantly mutated genes that aggregated into
10 molecular pathways. Clustering from the gene expression analysis revealed
four clinically relevant subtypes: Progenitor, Aberrantly differentiated endocrine
exocrine (ADEX), Squamous and Immunogenic. The progenitor and squamous
subtypes shared common features with Collisson’s classical and QM subtypes,
respectively (P. Bailey et al. 2016). However, work from The Cancer Genome
Atlas (TCGA) categorized ADEX and Immunogenic subtypes as less pure.
Using the transcriptomic data from Bailey et al., Müller classified five different
clusters: cluster1 overlapped with squamous subtype, cluster2 had more
epithelial cell signatures, cluster3 had signatures related to EMT and MAPK
pathways which are characteristics of undifferentiated tumors, cluster4 was
similar to the immunogenic subtype and cluster5 resembled ADEX subtype
gene signatures (Mueller et al. 2018).
INTRODUCTION
6
More recently, Puleo et al. conducted a large investigation of the transcriptional
landscape by performing microarray analysis in 309 paraffin-embedded
samples. The study integrates data from epithelial and stromal compartments.
The unsupervised classification of the whole tumor entity revealed five
subtypes: Pure classical, immune classical, desmoplastic, stroma activated and
pure-basal-like. The high tumor cellularity classification revealed two well-
defined subtypes: classical and basal-like. This study captured the molecular
diversification of PDAC compartments and validated the existence of classical
and basal subtypes as described in all previous PDAC stratification studies
(Puleo et al. 2018). In the follow-up study, Maurer et al. (2019) carried out RNA-
sequencing in 60 resected samples and revealed two epithelial (classical and
basal-like) and two stromal (ECM rich and immune rich) subtypes (Maurer et al.
2019).
In summary, two subtypes exist in the epithelial PDAC compartment, which
have been univocally identified by all transcription-based subtyping studies
conducted in PDAC so far: classical and basal-like. The classical molecular
PDAC subtype is characterized by the expression of epithelial differentiation-
related gene signatures, is less aggressive and displays a relatively good
prognosis. In contrast, basal-like PDAC is highly aggressive and is associated
with chemoresistance and low survival (P. Bailey et al. 2016; Collisson et al.
2011; G. Lomberk et al. 2018; Moffitt et al. 2015; Puleo et al. 2018). Hence, the
aforementioned subtyping studies have not only allowed for a better
understanding of the remarkable molecular heterogeneity of PDAC, but have
revealed molecular explanations for the poor efficacy of “one-size-fits-all”
therapeutic approaches in PDAC treatment. Moreover, these studies clearly
emphasize the necessity of considering the diverse molecular PDAC
characteristics for pursuing tailored therapeutic strategies to combat pancreatic
cancer. Finally, the aforementioned studies indicate that molecular PDAC
subtypes are primarily defined at the level of gene transcription. Hence, a
thorough understanding of the mechanistic regulation of PDAC subtypes
requires the exploration of epigenetic alterations underlying the classification of
PDAC tumors.
INTRODUCTION
7
Epigenetics
Epigenetics literally translates to ‘outside genetics’. The term epigenetics is
used to describe the heritable changes in gene expression and phenotype
without any alterations in the DNA sequence itself (Holliday 1994).
Epigenomics means the genome-wide analysis of the epigenetic process
(Ideraabdullah and Zeisel 2018). Epigenetics can be broadly classified into
three principle mechanisms (Bishop and Ferguson 2015; Virani et al. 2012):
1. Chromatin regulatory processes
2. DNA Methylation
3. Non-coding RNA
In each eukaryotic cell, the DNA strand is around 2 meters in length. To fit itself
into a small nucleus of some 6 µm diameter, the DNA coils around nuclear
proteins called histones and forms a compact structure called chromatin (Hauer
and Gasser 2017). In this process, the DNA becomes inaccessible for DNA
binding factors and hence does not get transcribed. This state of chromatin
which displays a high degree of compaction is defined as heterochromatin. For
gene transcription, the chromatin structure needs to shift from a condensed to a
transcriptionally accessible relaxed state. This relaxed chromatin state which
enables active transcription is termed as euchromatin (Corradini et al. 2007;
Fedorova and Zink 2008). The dynamic reorganization of the chromatin
architecture and hence the regulation of gene transcription are controlled by
two major processes: Chromatin remodeling and histone modification.
Given the critical involvement of chromatin regulatory processes in controlling
gene transcription, alterations of chromatin-associated processes contribute to
several pathophysiological conditions, including cancer (Bauer and Martin
2017; Morgan and Shilatifard 2015). For example, mutation of chromatin
regulatory proteins or their altered activity have a severe impact on cellular
functions that support the development and progression of cancer (Jian Chen
et al. 2016). Accordingly, in PDAC approximately 38 % of specimens carry
mutational events in chromatin regulatory proteins (P. Bailey et al. 2016), which
can have prognostic implications (Grassi et al. 2018). Moreover, several
genetic alterations in PDAC and subsequent dysregulation in signaling
pathways influence on the expression, recruitment and activity of chromatin
INTRODUCTION
8
regulatory proteins with potential impact on the chromatin landscape (Liu et al.
2016).
The following paragraphs summarize the major physiological mechanisms
controlling chromatin remodeling and histone modifications and provide
examples, how alterations of chromatin regulatory protein functions can
contribute to PDAC development and progression.
Nucleosome remodeling
The nucleosome is the fundamental unit of chromatin. Each nucleosome is a
DNA-protein complex, which comprises 146 bp of DNA wrapped around a
histone octamer (2 sets of histone H2A, H2B, H3, and H4) (Van Holde et al.
1980). Nucleosome remodeling is mediated by large multiprotein complexes
that contain several subunits, including the Adenosine triphosphatase (ATPase)
catalytic subunit. The energy released by the hydrolysis of ATP is utilized to
slide nucleosome along the DNA, thereby exposing the DNA to transcription
factors (Tyagi et al. 2016). Currently, four families of remodeling complexes are
known: SWI/SNF, ISWI, CHD and INO80, (Musladin et al. 2014) each with
distinct biological functions. All complexes have a conserved ATPase subunit
and other members are responsible for the complexes’ recruitment to DNA or
regulate the ATPase activity (Mani et al. 2017).
The subunits of the complexes are known to be inactivated in many human
cancers and are hence referred to as tumor suppressors. Importantly,
according to investigations by Bailey et al., mutations in components of the
SWI/SNF complex were detected in 14 % of PDAC samples (P. Bailey et al.
2016). Importantly, inactivation of selective SWI/SNF complex members has
been associated with poor survival in PDAC patients (Yoon et al. 2019) and
impact on the senstitivity towards platinum-based therapy regimens (Hasan and
Ahuja 2019), hence emphasizing the prognostic and predictive relevance of
these alterations.
INTRODUCTION
9
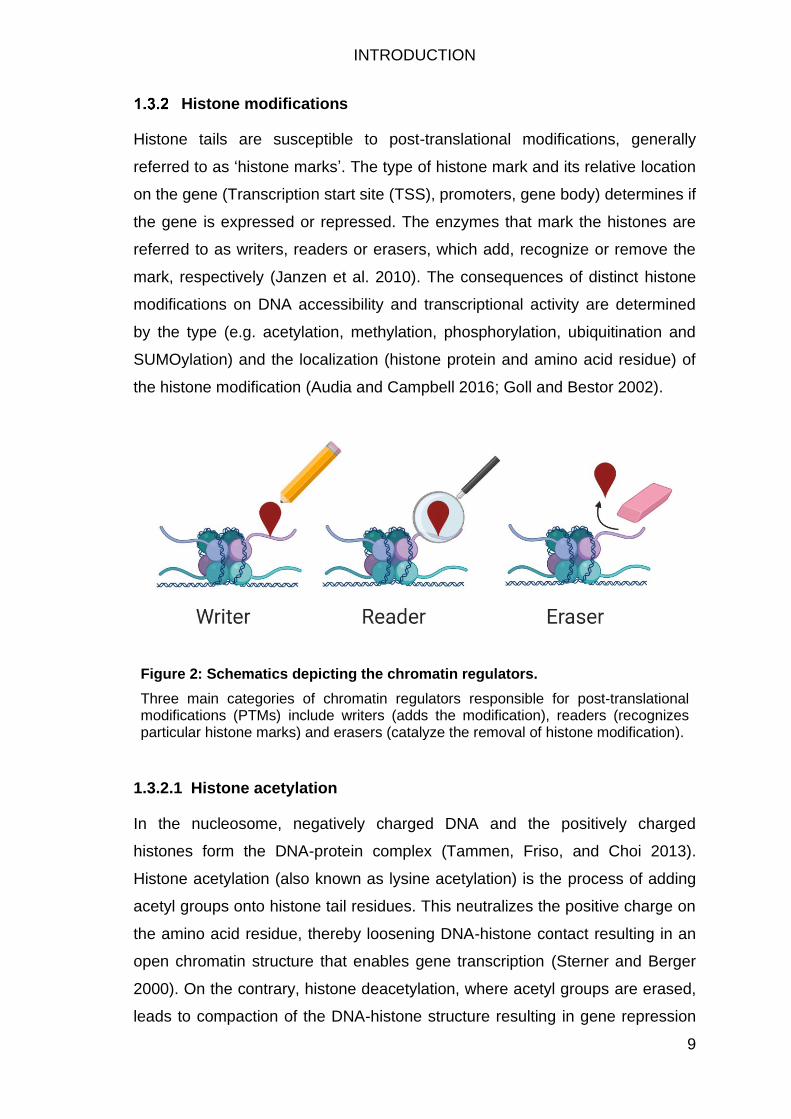
Histone modifications
Histone tails are susceptible to post-translational modifications, generally
referred to as ‘histone marks’. The type of histone mark and its relative location
on the gene (Transcription start site (TSS), promoters, gene body) determines if
the gene is expressed or repressed. The enzymes that mark the histones are
referred to as writers, readers or erasers, which add, recognize or remove the
mark, respectively (Janzen et al. 2010). The consequences of distinct histone
modifications on DNA accessibility and transcriptional activity are determined
by the type (e.g. acetylation, methylation, phosphorylation, ubiquitination and
SUMOylation) and the localization (histone protein and amino acid residue) of
the histone modification (Audia and Campbell 2016; Goll and Bestor 2002).
Figure 2: Schematics depicting the chromatin regulators.
Three main categories of chromatin regulators responsible for post-translational modifications (PTMs) include writers (adds the modification), readers (recognizes particular histone marks) and erasers (catalyze the removal of histone modification).
1.3.2.1 Histone acetylation
In the nucleosome, negatively charged DNA and the positively charged
histones form the DNA-protein complex (Tammen, Friso, and Choi 2013).
Histone acetylation (also known as lysine acetylation) is the process of adding
acetyl groups onto histone tail residues. This neutralizes the positive charge on
the amino acid residue, thereby loosening DNA-histone contact resulting in an
open chromatin structure that enables gene transcription (Sterner and Berger
2000). On the contrary, histone deacetylation, where acetyl groups are erased,
leads to compaction of the DNA-histone structure resulting in gene repression
INTRODUCTION
10
(De Ruijter et al. 2003). The addition and removal of acetyl groups on lysine
residues are mediated by histone acetyltransferases (HATs) and Histone
deacetylases (HDACs), respectively (Singh, Reindl, and Jansen 2019). Further,
acetylated marks serve as docking sites where chromatin reader proteins bind
(Yun et al. 2011).
Aberrant activity of HATs, HDACs and acetylation readers are correlated with
PDAC development and progression (Glozak and Seto 2007; Köenig et al.
2010; Ouaïssi et al. 2014; Stenzinger et al. 2013). Considering the implications
of aberrant acetylation in cancer, several inhibitors are being developed against
histone lysine writers (Kunnumakkara et al. 2007; Sahu, Batra, and Srivastava
2009), readers (Pérez-Salvia and Esteller 2017; Y. Xu and Vakoc 2017) and
erasers (Marmorstein and Zhou 2014; Mottamal et al. 2015).
1.3.2.2 Histone methylation
Histone methylation is the process where methyl groups are added to
lysine/arginine residues of histones (Hyun et al. 2017). Unlike acetylation which
is always associated with gene activation, methylation can be correlated to
either gene expression or repression depending on which lysine/arginine
residue is methylated and how many methyl groups are added (mono-, di- or
trimethylation) (Dambacher, Hahn, and Schotta 2010). For instance,
trimethylation of lysine 4 on histone H3 (H3K4me3) by the trithorax complex
induces gene expression whereas H3K27me3 installed by members of the
Polycomb repressor complex 2 (PRC2) induces gene repression
(Schuettengruber et al. 2007). Histone methyltransferases (HMTs) which
methylate lysine and arginine residues on histones are referred to as lysine
methyltransferases (KMTs) and protein arginine methyltransferases (PRMTs),
respectively. (Lorenzo and Bedford 2011; Upadhyay and Cheng 2011). Around
50 KMTs are known so far, where all of them (except Dot1) have a conserved
Su(var)3-9,EZH2 and Trithorax (SET) domain, which is responsible for the
methyltransferase activity (G. A. Lomberk, Iovanna, and Urrutia 2016). Lysine
demethylases (KDMs) counteracts KMT activity by mediating the removal of
methyl marks (Thinnes et al. 2014).
Many histone- methylases and demethylases are known to be mutated,
dysregulated, overexpressed, or downregulated in various cancers (Singh,
INTRODUCTION
11
Reindl, and Jansen 2019). For instance, studies showed that mutations in
MLL1, MLL3 and MLL4 and reduced expression of MLL3 and MLL4 had a
better prognosis and outcome in PDAC (Dawkins et al. 2016). In contrast, high
levels of KDM1A in PDAC is associated with poor survival. Also, several other
KDMs (KDM2A, KDM3A, KDM5B) are highly expressed in various cancers
(McGrath and Trojer 2015). Histone methyltransferases represent another class
of attractive druggable targets for PDAC intervention. BRD-4770, a molecular
inhibitor of G9a was found to decrease methylation levels, induce cell cycle
arrest and mediate cell senescence (Artal-Martinez de Narvajas et al. 2013;
Yuan et al. 2012). Another G9a inhibitor, BIX-01294, also showed similar
results in vitro in pancreatic cancer (Cui et al. 2015). One of the early
nonselective KDM1 inhibitors, tranylcypromine, is approved by the FDA for
neural disorders (Thinnes et al. 2014). Several compounds are being tested for
the development of selective KDM inhibitors (G. A. Lomberk, Iovanna, and
Urrutia 2016).
PRC2 complex
The protein complex families - trithorax group (trxG) genes and polycomb group
(PcG) genes were initially discovered in Drosophila Melanogaster, where they
regulate the expression of homeotic genes (Hox genes) during the formation of
body plan (Deschamps et al. 1999). They work antagonistically with trxG
maintaining and PcG silencing transcription processes, respectively (Kennison
1995; Schuettengruber et al. 2007). PcG assembles into two types of
multiprotein complexes- Polycomb Repressive Complex 1 (PRC1) and
Polycomb Repressive Complex 2 (PRC2) (Sauvageau and Sauvageau 2010).
The PRC2 complex mediates H3K27me3 which is then recognized by
members of the PRC1 complex, which further mediates H2AK119Ub1. This
causes the chromatin to condense, thereby leading to transcriptional silencing.
INTRODUCTION
12
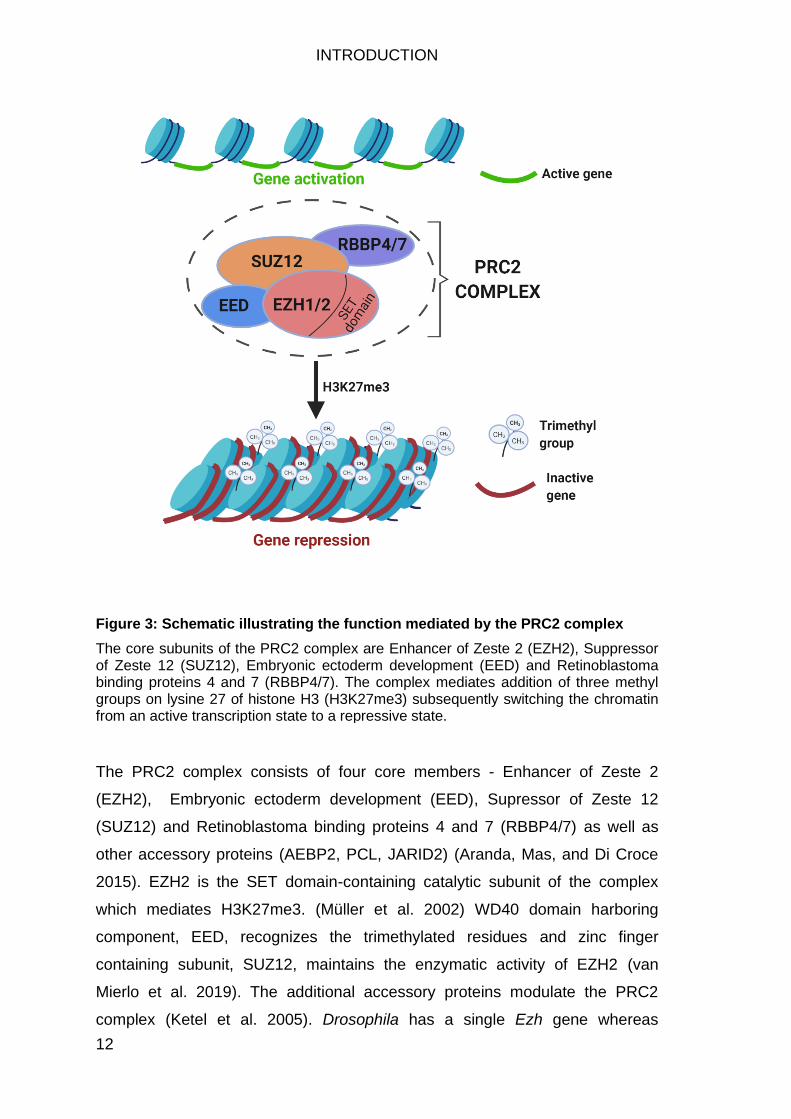
Figure 3: Schematic illustrating the function mediated by the PRC2 complex
The core subunits of the PRC2 complex are Enhancer of Zeste 2 (EZH2), Suppressor of Zeste 12 (SUZ12), Embryonic ectoderm development (EED) and Retinoblastoma binding proteins 4 and 7 (RBBP4/7). The complex mediates addition of three methyl groups on lysine 27 of histone H3 (H3K27me3) subsequently switching the chromatin from an active transcription state to a repressive state.
The PRC2 complex consists of four core members - Enhancer of Zeste 2
(EZH2), Embryonic ectoderm development (EED), Supressor of Zeste 12
(SUZ12) and Retinoblastoma binding proteins 4 and 7 (RBBP4/7) as well as
other accessory proteins (AEBP2, PCL, JARID2) (Aranda, Mas, and Di Croce
2015). EZH2 is the SET domain-containing catalytic subunit of the complex
which mediates H3K27me3. (Müller et al. 2002) WD40 domain harboring
component, EED, recognizes the trimethylated residues and zinc finger
containing subunit, SUZ12, maintains the enzymatic activity of EZH2 (van
Mierlo et al. 2019). The additional accessory proteins modulate the PRC2
complex (Ketel et al. 2005). Drosophila has a single Ezh gene whereas
INTRODUCTION
13
mammals have two - EZH1 and EZH2 which are paralogs. Even though both
EZH1 and EZH2 harbor H3K27me3 activity, PRC2-EZH1 shows relatively lower
methyltransferase activity than PRC2-EZH2. Also, EZH2 is mostly present in
proliferating cells whereas EZH1 is found in dividing cells (Margueron et al.
2008). Genome-wide studies in human embryonic fibroblast cells show that
PRC2 and H3K27 methylation mark co-occupy on several differentiation-
associated genes (Bracken et al. 2006).
Regulation of EZH2 expression in cancer
EZH2 is an extensively studied SET domain-containing histone
methyltransferase, which silences gene expression by catalyzing trimethylation
of H3K27 (Chou et al. 2015). EZH2 dysregulation is frequently seen in a wide
variety of cancers. Altered EZH2 expression and activity can be caused by
activating/inactivating mutations of EZH2 which are primarily found in
hematological malignancies (Jankowska et al. 2011; Morin et al. 2010) or by
missense mutation (K27M) in H3.3 which is found in pediatric gliomas (Khuong-
Quang et al. 2012). Besides these genetic events targeting EZH2, in solid
tumors the histone methyltransferase is mostly overexpressed. Overexpression
of EZH2 can also be caused by various transcriptional pathways. For example,
the Mitogen-activated protein kinase kinase (MEK) – extracellular signal-
regulated kinase (ERK) – ETS Like-1 (ELK1) pathway has been shown to be
responsible for increased EZH2 expression in ERBB2 overexpressing and
triple-negative breast cancers. Phosphorylated ELK1 binds to its binding motif
on the EZH2 promoter thereby activating EZH2 transcription (Fujii et al. 2011).
Another pathway involved in EZH2 regulation is Retiniblastoma protein (pRb) -
E2F signaling. Upon phosphorylation of pRb, E2F dissociates from the pRb-
E2F complex, binds to its binding site on the EZH2 promoter thereby promoting
EZH2 transcription (Margueron et al. 2008). Abberation of the pRb-E2F
pathway or E2F overexpression is associated with EZH2 overactivation in
breast and bladder tumors (Feber et al. 2004; Margueron et al. 2008). Cancer-
related transcription factors bind on the EZH2 promoter and activate its mRNA
expression. In breast cancer, hypoxia inducible factor 1a (HIF1a) induced by
the hypoxic environment binds to its consensus sequence on EZH2 and
activates its expression thereby aggravating breast cancer (Mahara et al.
INTRODUCTION
14
2016). Besides, miRNAs downregulate EZH2 levels by post-translational
modifications. Many different miRNA s like miR-25, -98, -124, -138, -214
interact with specific sequences in the EZH2 3’ untranslated region (3’ UTR)
(Völkel et al. 2015). Together, aberrant EZH2 expression in cancer can be
caused by various mechanisms which occur at different regulatory levels.
Context-dependent roles of EZH2
EZH2 overexpression was initially detected in breast and prostate cancer
through microarray analysis where it was strongly correlated with poor
prognosis and associated with high-grade metastatic stages (Bachmann et al.
2006; Varambally et al. 2002). High levels of EZH2 are reported in a wide
variety of other cancers like melanoma (Fan et al. 2012; Zingg et al. 2015), lung
(Hussain et al. 2009), hepatocellular (Sudo et al. 2005), bladder (Raman et al.
2005), ovarian (Moses and Jia 2013; Rao et al. 2010), brain (Bracken et al.
2003) and pancreatic cancer (Han et al. 2016; Ougolkov, Bilim, and Billadeau
2008; Toll et al. 2010). In these solid tumor entities EZH2 mainly serves as an
oncogenic factor by silencing tumor suppressor genes via H3K27me3-mediated
transcriptional repression. However, apart from its PRC2-dependent activity,
EZH2 exhibits various other modes of action depending on the cellular context.
For instance, EZH2 mediates posttranslational methylation of many non-histone
proteins like GATA4 (He et al. 2012), RORα (Lee et al. 2012) and TALIN
(Gunawan et al. 2015). In addition to mediating gene repression, EZH2 also
functions in a PRC2 independent manner to mediate transcriptional activation.
In the estrogen receptor-positive luminal-like breast cancer cell line MCF7 for
example, EZH2 mediates CYCLIND1 and MYC transcription independent of its
methyltransferase activity (Shi et al. 2007). Another instance where EZH2
functions as an activator is in castration-resistant prostate cancer. EZH2 acts
via its methyltransferase activity but without relying on other PRC2 complex
members. In this case, EZH2 gets phosphorylated posttranslationally at serine
21, and then biochemically interacts with the androgen receptor to work as a
transcriptional coactivator activating downstream target genes (K. Xu et al.
2012).
While the aforementioned examples highlight the oncogenic activity of EZH2,
there is also evidence for tumor suppressive functions of the histone
INTRODUCTION
15
methyltransferase. For instance, Ntziachristos et al. found that loss-of-function
EZH2 mutations promote tumor progression in T-cell acute lymphoblastic
leukemia (T-ALL) (Ntziachristos et al. 2012). In another study, Bremer et al.
demonstrated that high EZH2 expression significantly correlated with favorable
prognosis in colorectal cancer (CRC) patients (Bremer et al. 2019). Another
example is in renal cell carcinoma where loss of EZH2 mediates HIF-
dependent CXCR4 activation consequently promoting cancer metastasis
(Vanharanta et al. 2013).
Context-dependent EZH2 activities have also been described in the pancreas
where EZH2 is critically involved in the regulation of cellular plasticity.
Accordingly, EZH2 has been described as a critical regulator of acinar cell
regeneration following injury. Mallen-St. Clair et al. showed that EZH2
represses CDKN2A (encoding for the negative cell cycle regulator p16), thus
allowing the proliferation of ADM which is a prerequisite for acinar
redifferentiation (Mallen-St. Clair et al. 2012). Further mechanistic analyses
suggest that EZH2-driven pancreatic regeneration critically involves
transcriptional repression of the NFATc1 gene (N. M. Chen et al. 2017). The
inflammatory transcription factor Nuclear factor of activated T cells (NFATc1) is
activated upon acinar cell injury and blocks pancreatic regeneration. In KRAS
wildtype cells, EZH2 counteracts NFATc1 activity by binding to the TSS of the
NFATc1 gene and transcriptionally repressing its expression, which then allows
the redifferentiation of acinar cells in later stages of pancreatic recovery.
However, the EZH2-NFATc1 axis does not operate in the same way in the
context of PDAC. In the presence of oncogenic KRAS, EZH2 transcriptionally
activates NFATc1 expression, which further leads to ADM formation and
progression into PDAC. Hence, KRAS acts as a switch that regulates opposing
roles of EZH2 in acinar cell regeneration vs. transformation (N. M. Chen et al.
2017).
Overall, EZH2 activity are highly context dependent. While EZH2 is crucial
during development and regeneration of the organ, it shifts its role in cancer. It
functions via various modes of action, promotes either oncogenic or tumor-
suppressive implications and is regulated at different levels by several
mechanisms.
INTRODUCTION
16
EZH2 in PDAC
EZH2 was identified as an oncogenic driver in PDAC by Ougolvou and
colleagues, where they found nuclear overexpression of the histone
methyltransferase in 68 % of PDAC patients. They elegantly provide functional
insights into the role of EZH2 in mediating cell proliferation and
chemoresistance. Their study also reported that EZH2 silencing induced
apoptosis and increased the sensitivity towards gemcitabine and doxorubicin
(Ougolkov, Bilim, and Billadeau 2008). Another report in 2012 by Toll et al.
supported this study and reported that EZH2 depletion sensitizes pancreatic
cancer cells to gemcitabine and subsequently induces apoptosis. They
evaluated EZH2 levels in PDAC samples from patients treated with
gemcitabine. Patients with low EZH2 levels survived for a significantly longer
time compared to the ones with high EZH2 levels. This validates the correlation
between high EZH2 levels and low gemcitabine response. Furthermore, their
study was the first to show that high EZH2 levels are associated with reduced
E-cadherin levels in PDAC (Toll et al. 2010). The EZH2-E-cadherin axis was
further validated by Han et al., where they additionally showed that EZH2
mediates cell invasion and migration by transcriptionally repressing CDH-1. In
their study, patients harboring an abundance of EZH2 and low E-cadherin
displayed lower survival (Han et al. 2016). Altogether, EZH2 is highly
expressed and harbors oncogenic activity in pancreatic cancer.
EZH2 inhibitors
Considering that H3K27me3 is one of the frequently dysregulated histone
modifications in a lot of cancers including PDAC, and EZH2 is the mediator for
depositing this mark, it has been a major target for the development of
inhibitors. One of the first inhibitors developed for EZH2 inhibition was 3-
deazaneplanocin (DNZep), an S-adenosyl-L-homocysteine (SAH) hydrolase
inhibitor, which increases SAH levels, thereby leading to inactivation of several
methyltransferases including EZH2. It showed promising activity in breast
cancer and prostate cancer diminishing EZH2 and H3K27me3 levels and
restoring downstream target genes of PRC2 (Tan et al. 2007). This small
molecule inhibitor also reduced the self renewal capacity of prostate, ovarian
and glioblastoma stem cells (Völkel et al. 2015). One of the studies reported
INTRODUCTION
17
that DNZnep boosted the antiproliferative effect of gemcitabine in PDAC cell
lines and primary cultures derived from PDAC tumors. Despite this, the use of
this drug has been terminated due to its high toxicity levels (Gaudichon et al.
2014).
Following this up, S-adenosyl-L-methionine (SAM) competitive EZH2 inhibitors
like EPZ005687, GSK2816126, CPI-1205, UNC1999 and EPZ6438
(tazemetostat) were discovered through high throughput screening approaches.
They display 1000 times more selectivity for EZH2 over other
methyltransferases and can effectively antagonize EZH2 activity in the
nanomolar range (McGrath and Trojer 2015). GSK126 was effective in
monolayers in gastric cancer and lung adenocarcinoma cell lines as well as in
xenografts models of lymphoma, where it displayed a decrease in cell
proliferation, angiogenesis, and a significant increase in apoptosis (Y. T. Chen
et al. 2016; McCabe et al. 2012). The compound CPI-1205 exhibited a
decrease in EZH2 and H3K27me3 levels. Additionally, it displayed
antiproliferative effects and led to increased apoptosis in vitro in
medulloblastoma. It is relatively well tolerated and currently in clinical trials for
medulloblastoma and B cell lymphoma (Miele et al. 2017; Vaswani et al. 2016).
UNC1999, an orally bioavailable EZH2 inhibitor induced durable tumor
response successfully in monolayers, spheroid cultures and pdx mouse models
of PDAC (Huang et al. 2015b). Tazematostat (EPZ6438) is a first in class,
highly selective, orally administered EZH2 inhibitor that has been tested in a
phase-I study. It exhibited beneficial results with a favorable safety profile and
anti-tumor activity in patients with B cell non-Hodgkin lymphoma and
SMARCA4-negative or INI1 negative advanced solid tumors (Italiano et al.
2018; Richart and Margueron 2020). Moreover, a disease control rate of 55 %
was observed in solid tumors with this epidrug. Currently, Tazematostat is in
phase-II clinical trials (NCT01897571) (Hessmann et al. 2017). To date, three
EZH2 inhibitors, CPI-1205, GSK2816126 and tazematostat (EPZ 6438) have
shown considerable tolerance and efficiency in hematological malignancies and
solid cancers.
INTRODUCTION
18
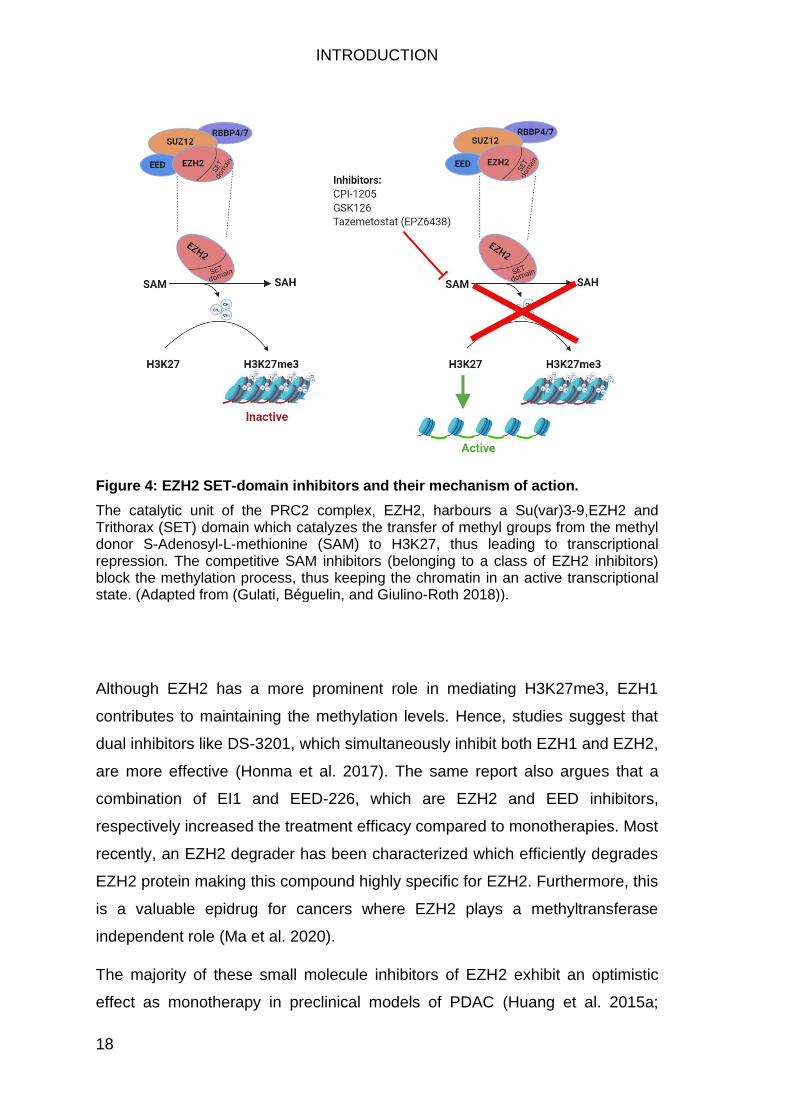
Figure 4: EZH2 SET-domain inhibitors and their mechanism of action.
The catalytic unit of the PRC2 complex, EZH2, harbours a Su(var)3-9,EZH2 and Trithorax (SET) domain which catalyzes the transfer of methyl groups from the methyl donor S-Adenosyl-L-methionine (SAM) to H3K27, thus leading to transcriptional repression. The competitive SAM inhibitors (belonging to a class of EZH2 inhibitors) block the methylation process, thus keeping the chromatin in an active transcriptional state. (Adapted from (Gulati, Béguelin, and Giulino-Roth 2018)).
Although EZH2 has a more prominent role in mediating H3K27me3, EZH1
contributes to maintaining the methylation levels. Hence, studies suggest that
dual inhibitors like DS-3201, which simultaneously inhibit both EZH1 and EZH2,
are more effective (Honma et al. 2017). The same report also argues that a
combination of EI1 and EED-226, which are EZH2 and EED inhibitors,
respectively increased the treatment efficacy compared to monotherapies. Most
recently, an EZH2 degrader has been characterized which efficiently degrades
EZH2 protein making this compound highly specific for EZH2. Furthermore, this
is a valuable epidrug for cancers where EZH2 plays a methyltransferase
independent role (Ma et al. 2020).
The majority of these small molecule inhibitors of EZH2 exhibit an optimistic
effect as monotherapy in preclinical models of PDAC (Huang et al. 2015a;
INTRODUCTION
19
Paradise, Barham, and Fernandez-Zapico 2018). But the combination of these
inhibitors with a chemotherapeutic agent or another epidrug seems to work
better in PDAC than a monotherapy (Honma et al. 2017; Ougolkov, Bilim, and
Billadeau 2008). Further exploration of these inhibitors in larger clinical trials as
targeted therapy is necessary for maximizing its benefits for translational utility.
Furthermore, given that EZH2 exhibits a highly context-dependent expression
and function, inhibiting EZH2 might not be benefical in all situations or might
even foster cancer progression. Indeed, some studies demonstrate that EZH2
inhibitors were only effective in subgroups of cancer patients. For instance,
Puppe et al. showed in 2009 that EZH2 inhibition by DZNep was selectively
beneficial in BRCA-1 deficient or mutated breast cancer cells as these cells
promoted tumor progression in an EZH2 dependent manner whereas BRCA-1
proficient cells were not affected by EZH2 inhibition (Puppe et al. 2009). In
certain subsets of breast cancer (Shi et al. 2007), EZH2 mediates tumor
progression in a methyltransferase independent manner and in such cases
inhibitors blocking the SET domain of EZH2 would not be efficacious while
inhibitors that degrade EZH2 protein would potentially be more effective (Ma et
al. 2020). Besides, another study suggests that while inhibiting EZH2 in
cancers harboring EZH2 Gain-of-function (GOF) mutations like in follicular
lymphomas (FL) and Diffuse large B cell lymphomas (DLBCL) is very effective,
the inhibitors were not useful in cells harboring EZH2 Loss-of-function (LOF)
mutations like in certain cases of Myeloproliferative neoplasms (MPN) and T-
cell acute lymphoblastic leukemia (T-ALL) (Honma et al. 2017). Further several
lines of evidence demonstrate that blocking EZH2 is specifically impactful in
cancer cells harboring mutation or loss of SWI/SNF subunits – in lung cancer
cells (K. H. Kim et al. 2015), small cell carcinoma of ovary (Chan-Penebre et al.
2017) and other rhaboid tumors (Knutson et al. 2013; Wilson et al. 2010).
These studies argue that it is necessary to understand the molecular conditions
underlying EZH2 mediated tumor progression in cancer before designing
strategies to inhibit it.
INTRODUCTION
20
Aims of the study
EZH2 consitutes a widely studied epigenetic factor in development as well as
in cancer. Its implications in various cancer types including PDAC characterize
the histone methyltransferase as a promising therapeutic target in PDAC.
However, recent findings also suggest that the activity, target gene selection
and regulation of chromatin regulatory proteins like EZH2 occur in a highly
context-dependent manner. Hence, the successful application of EZH2
inhibition in PDAC treatment requires an in-depth understanding of how the
histone methyltransferase promotes PDAC progression and depends on the
elucidation of the molecular dependencies determining the efficacy of EZH2
inhibition in PDAC.
In this study, we aim at investigating the role of EZH2 in pancreatic cancer
progression and plasticity and aim at gaining mechanistic insights into EZH2-
dependent gene regulation in PDAC. Our specific aims are:
1) To dissect the functional implications of EZH2 in PDAC development and
progression.
2) To identify EZH2-dependent gene signatures in PDAC progression.
3) To elucidate the molecular prerequisites determining the efficacy of EZH2
targeting in PDAC.
MATERIALS
21
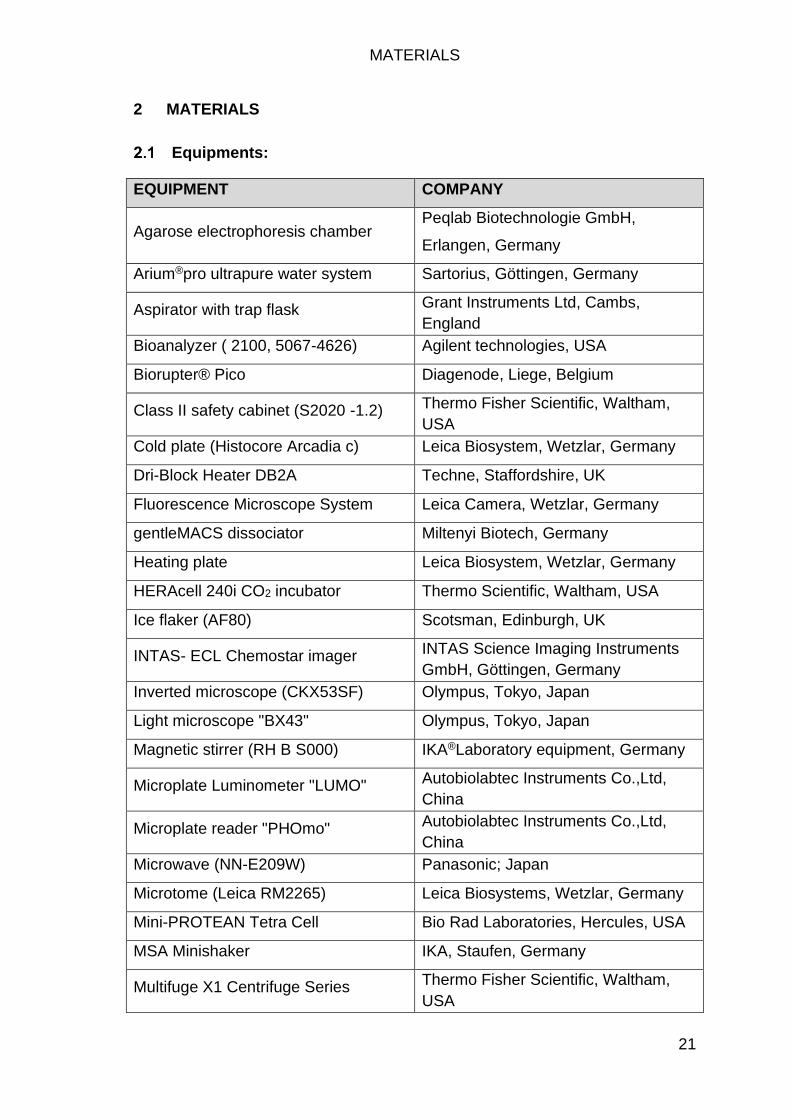
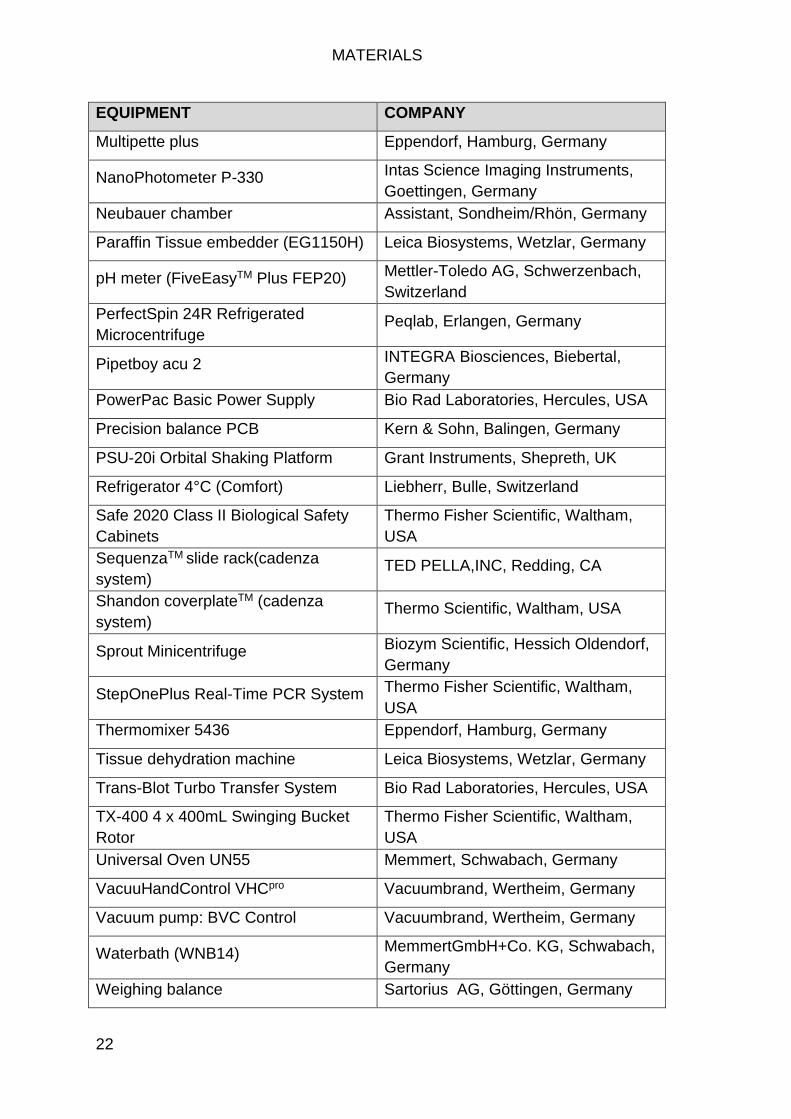
2 MATERIALS
Equipments:
EQUIPMENT COMPANY
Agarose electrophoresis chamber Peqlab Biotechnologie GmbH,
Erlangen, Germany
Arium®pro ultrapure water system Sartorius, Göttingen, Germany
Aspirator with trap flask Grant Instruments Ltd, Cambs,
England
Bioanalyzer ( 2100, 5067-4626) Agilent technologies, USA
Biorupter® Pico Diagenode, Liege, Belgium
Class II safety cabinet (S2020 -1.2) Thermo Fisher Scientific, Waltham,
USA
Cold plate (Histocore Arcadia c) Leica Biosystem, Wetzlar, Germany
Dri-Block Heater DB2A Techne, Staffordshire, UK
Fluorescence Microscope System Leica Camera, Wetzlar, Germany
gentleMACS dissociator Miltenyi Biotech, Germany
Heating plate Leica Biosystem, Wetzlar, Germany
HERAcell 240i CO2 incubator Thermo Scientific, Waltham, USA
Ice flaker (AF80) Scotsman, Edinburgh, UK
INTAS- ECL Chemostar imager INTAS Science Imaging Instruments
GmbH, Göttingen, Germany
Inverted microscope (CKX53SF) Olympus, Tokyo, Japan
Light microscope "BX43" Olympus, Tokyo, Japan
Magnetic stirrer (RH B S000) IKA®Laboratory equipment, Germany
Microplate Luminometer "LUMO" Autobiolabtec Instruments Co.,Ltd,
China
Microplate reader "PHOmo" Autobiolabtec Instruments Co.,Ltd,
China
Microwave (NN-E209W) Panasonic; Japan
Microtome (Leica RM2265) Leica Biosystems, Wetzlar, Germany
Mini-PROTEAN Tetra Cell Bio Rad Laboratories, Hercules, USA
MSA Minishaker IKA, Staufen, Germany
Multifuge X1 Centrifuge Series Thermo Fisher Scientific, Waltham,
USA
MATERIALS
22
EQUIPMENT COMPANY
Multipette plus Eppendorf, Hamburg, Germany
NanoPhotometer P-330 Intas Science Imaging Instruments,
Goettingen, Germany
Neubauer chamber Assistant, Sondheim/Rhön, Germany
Paraffin Tissue embedder (EG1150H) Leica Biosystems, Wetzlar, Germany
pH meter (FiveEasyTM Plus FEP20) Mettler-Toledo AG, Schwerzenbach,
Switzerland
PerfectSpin 24R Refrigerated
Microcentrifuge Peqlab, Erlangen, Germany
Pipetboy acu 2 INTEGRA Biosciences, Biebertal,
Germany
PowerPac Basic Power Supply Bio Rad Laboratories, Hercules, USA
Precision balance PCB Kern & Sohn, Balingen, Germany
PSU-20i Orbital Shaking Platform Grant Instruments, Shepreth, UK
Refrigerator 4°C (Comfort) Liebherr, Bulle, Switzerland
Safe 2020 Class II Biological Safety
Cabinets
Thermo Fisher Scientific, Waltham,
USA
SequenzaTM slide rack(cadenza
system) TED PELLA,INC, Redding, CA
Shandon coverplateTM (cadenza
system) Thermo Scientific, Waltham, USA
Sprout Minicentrifuge Biozym Scientific, Hessich Oldendorf,
Germany
StepOnePlus Real-Time PCR System Thermo Fisher Scientific, Waltham,
USA
Thermomixer 5436 Eppendorf, Hamburg, Germany
Tissue dehydration machine Leica Biosystems, Wetzlar, Germany
Trans-Blot Turbo Transfer System Bio Rad Laboratories, Hercules, USA
TX-400 4 x 400mL Swinging Bucket
Rotor
Thermo Fisher Scientific, Waltham,
USA
Universal Oven UN55 Memmert, Schwabach, Germany
VacuuHandControl VHCpro Vacuumbrand, Wertheim, Germany
Vacuum pump: BVC Control Vacuumbrand, Wertheim, Germany
Waterbath (WNB14) MemmertGmbH+Co. KG, Schwabach,
Germany
Weighing balance Sartorius AG, Göttingen, Germany
MATERIALS
23
EQUIPMENT COMPANY
Qubit (Q32854) Fluorometer Invitrogen GmbH, Karlsruhe
-20°C freezer Liebherr, Bulle, Switzerland
-80°C Ultra low temperature freezer
(MDF-U54V) Sanyo electric Co.,Ltd Japan
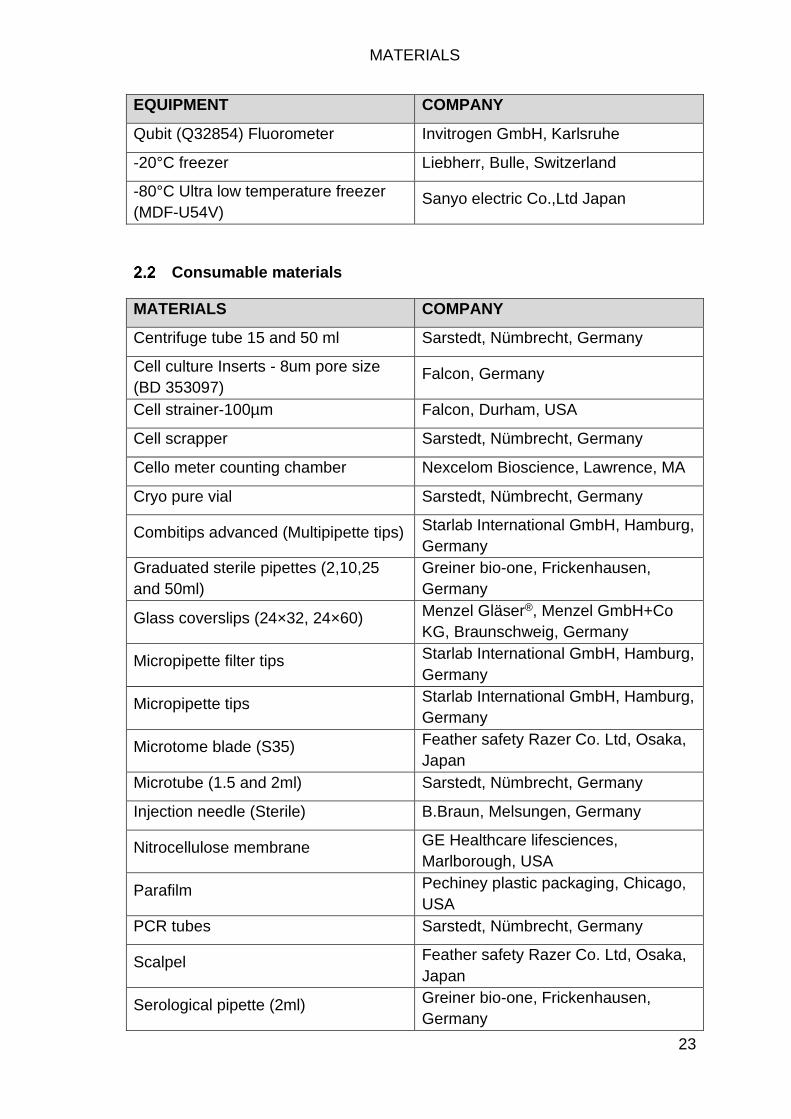
Consumable materials
MATERIALS COMPANY
Centrifuge tube 15 and 50 ml Sarstedt, Nümbrecht, Germany
Cell culture Inserts - 8um pore size
(BD 353097) Falcon, Germany
Cell strainer-100µm Falcon, Durham, USA
Cell scrapper Sarstedt, Nümbrecht, Germany
Cello meter counting chamber Nexcelom Bioscience, Lawrence, MA
Cryo pure vial Sarstedt, Nümbrecht, Germany
Combitips advanced (Multipipette tips) Starlab International GmbH, Hamburg,
Germany
Graduated sterile pipettes (2,10,25
and 50ml)
Greiner bio-one, Frickenhausen,
Germany
Glass coverslips (24×32, 24×60) Menzel Gläser®, Menzel GmbH+Co
KG, Braunschweig, Germany
Micropipette filter tips Starlab International GmbH, Hamburg,
Germany
Micropipette tips Starlab International GmbH, Hamburg,
Germany
Microtome blade (S35) Feather safety Razer Co. Ltd, Osaka,
Japan
Microtube (1.5 and 2ml) Sarstedt, Nümbrecht, Germany
Injection needle (Sterile) B.Braun, Melsungen, Germany
Nitrocellulose membrane GE Healthcare lifesciences,
Marlborough, USA
Parafilm Pechiney plastic packaging, Chicago,
USA
PCR tubes Sarstedt, Nümbrecht, Germany
Scalpel Feather safety Razer Co. Ltd, Osaka,
Japan
Serological pipette (2ml) Greiner bio-one, Frickenhausen,
Germany
MATERIALS
24
MATERIALS COMPANY
Sponge Pad For XCell IITM Blotting Novex by Life technologies, Carlsbad,
CA
Superfrost glass slides (Histology) Thermo Scientific, Waltham, USA
Syringe (1ml) BD Plastic, Madrid, Spain
Syringe (5,10,20ml) B.Braun, Melsungen, Germany
Sterile syringe Filter (0.2µm) Labsolute, Th.Geyer ingredients
GmbH & Co.KG, Höxter, Germany
Tissue culture multiwell plates Greiner bio-one, Frickenhausen,
Germany
Tissue culture flasks Greiner bio-one, Frickenhausen,
Germany
Tissue culture dishes (2cm, 10cm) Sarstedt, Nümbrecht, Germany
Tissue cassette Sanowa, Leimen, Germany
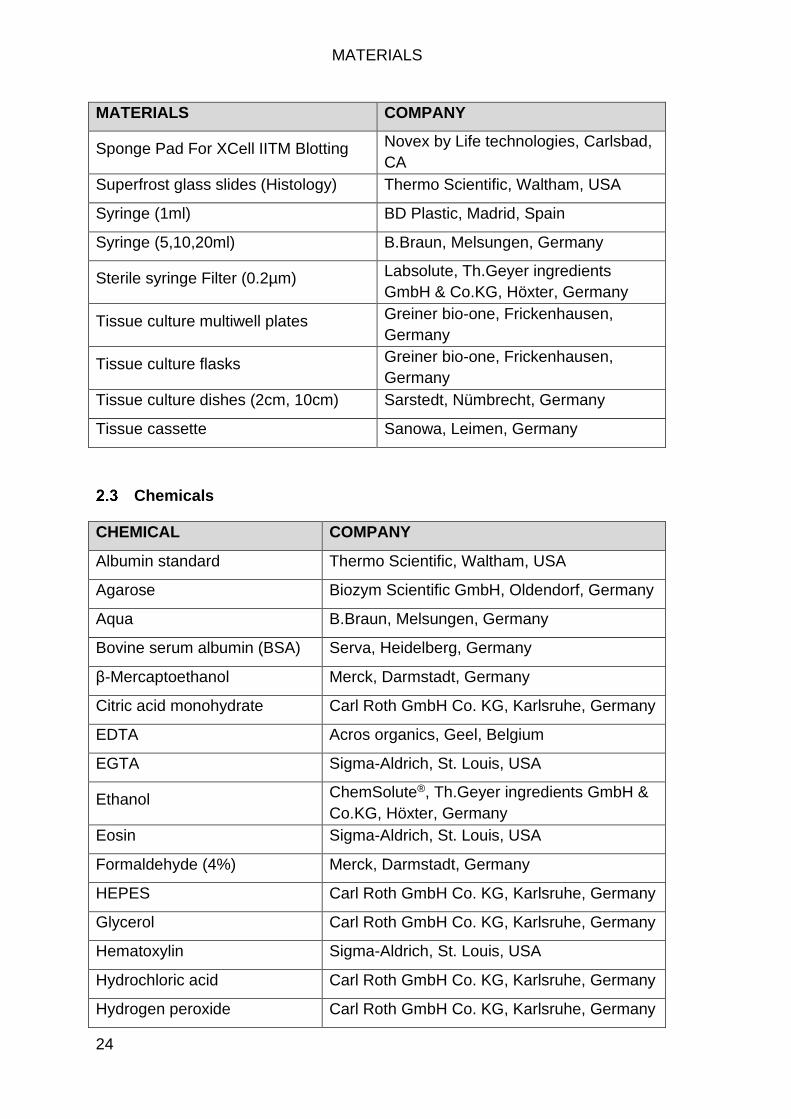
Chemicals
CHEMICAL COMPANY
Albumin standard Thermo Scientific, Waltham, USA
Agarose Biozym Scientific GmbH, Oldendorf, Germany
Aqua B.Braun, Melsungen, Germany
Bovine serum albumin (BSA) Serva, Heidelberg, Germany
β-Mercaptoethanol Merck, Darmstadt, Germany
Citric acid monohydrate Carl Roth GmbH Co. KG, Karlsruhe, Germany
EDTA Acros organics, Geel, Belgium
EGTA Sigma-Aldrich, St. Louis, USA
Ethanol ChemSolute®, Th.Geyer ingredients GmbH &
Co.KG, Höxter, Germany
Eosin Sigma-Aldrich, St. Louis, USA
Formaldehyde (4%) Merck, Darmstadt, Germany
HEPES Carl Roth GmbH Co. KG, Karlsruhe, Germany
Glycerol Carl Roth GmbH Co. KG, Karlsruhe, Germany
Hematoxylin Sigma-Aldrich, St. Louis, USA
Hydrochloric acid Carl Roth GmbH Co. KG, Karlsruhe, Germany
Hydrogen peroxide Carl Roth GmbH Co. KG, Karlsruhe, Germany
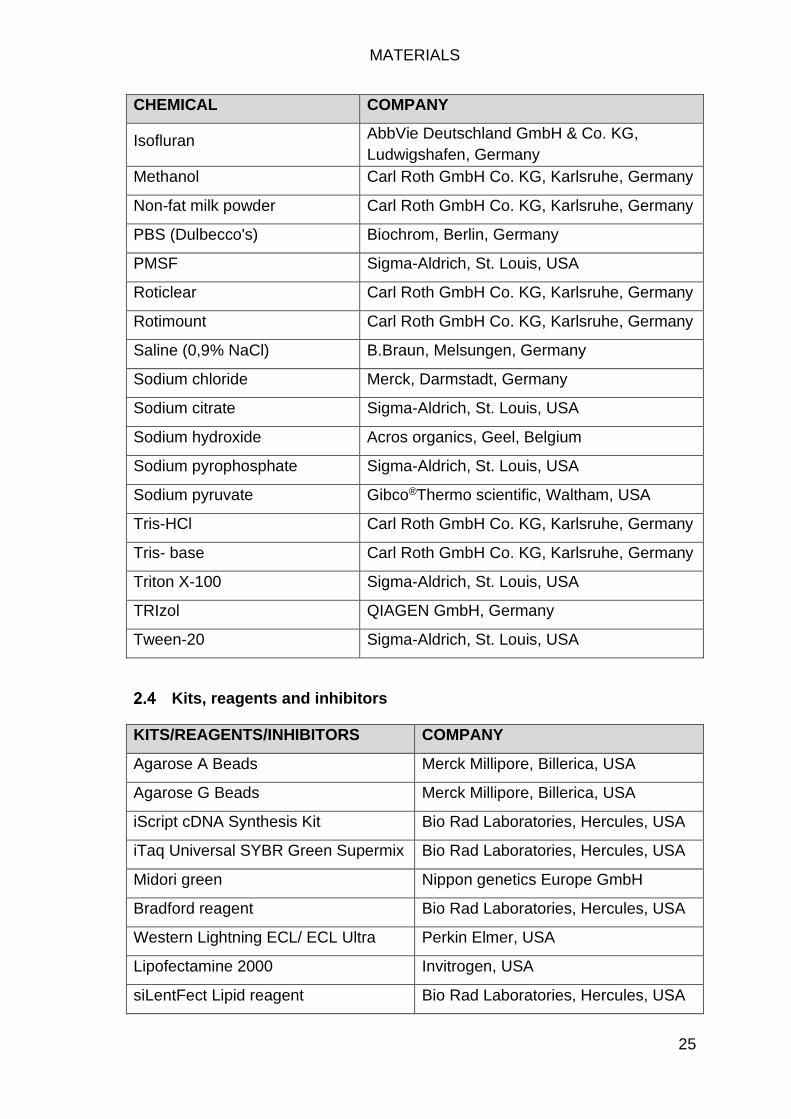
MATERIALS
25
CHEMICAL COMPANY
Isofluran AbbVie Deutschland GmbH & Co. KG,
Ludwigshafen, Germany
Methanol Carl Roth GmbH Co. KG, Karlsruhe, Germany
Non-fat milk powder Carl Roth GmbH Co. KG, Karlsruhe, Germany
PBS (Dulbecco's) Biochrom, Berlin, Germany
PMSF Sigma-Aldrich, St. Louis, USA
Roticlear Carl Roth GmbH Co. KG, Karlsruhe, Germany
Rotimount Carl Roth GmbH Co. KG, Karlsruhe, Germany
Saline (0,9% NaCl) B.Braun, Melsungen, Germany
Sodium chloride Merck, Darmstadt, Germany
Sodium citrate Sigma-Aldrich, St. Louis, USA
Sodium hydroxide Acros organics, Geel, Belgium
Sodium pyrophosphate Sigma-Aldrich, St. Louis, USA
Sodium pyruvate Gibco®Thermo scientific, Waltham, USA
Tris-HCl Carl Roth GmbH Co. KG, Karlsruhe, Germany
Tris- base Carl Roth GmbH Co. KG, Karlsruhe, Germany
Triton X-100 Sigma-Aldrich, St. Louis, USA
TRIzol QIAGEN GmbH, Germany
Tween-20 Sigma-Aldrich, St. Louis, USA
Kits, reagents and inhibitors
KITS/REAGENTS/INHIBITORS COMPANY
Agarose A Beads Merck Millipore, Billerica, USA
Agarose G Beads Merck Millipore, Billerica, USA
iScript cDNA Synthesis Kit Bio Rad Laboratories, Hercules, USA
iTaq Universal SYBR Green Supermix Bio Rad Laboratories, Hercules, USA
Midori green Nippon genetics Europe GmbH
Bradford reagent Bio Rad Laboratories, Hercules, USA
Western Lightning ECL/ ECL Ultra Perkin Elmer, USA
Lipofectamine 2000 Invitrogen, USA
siLentFect Lipid reagent Bio Rad Laboratories, Hercules, USA
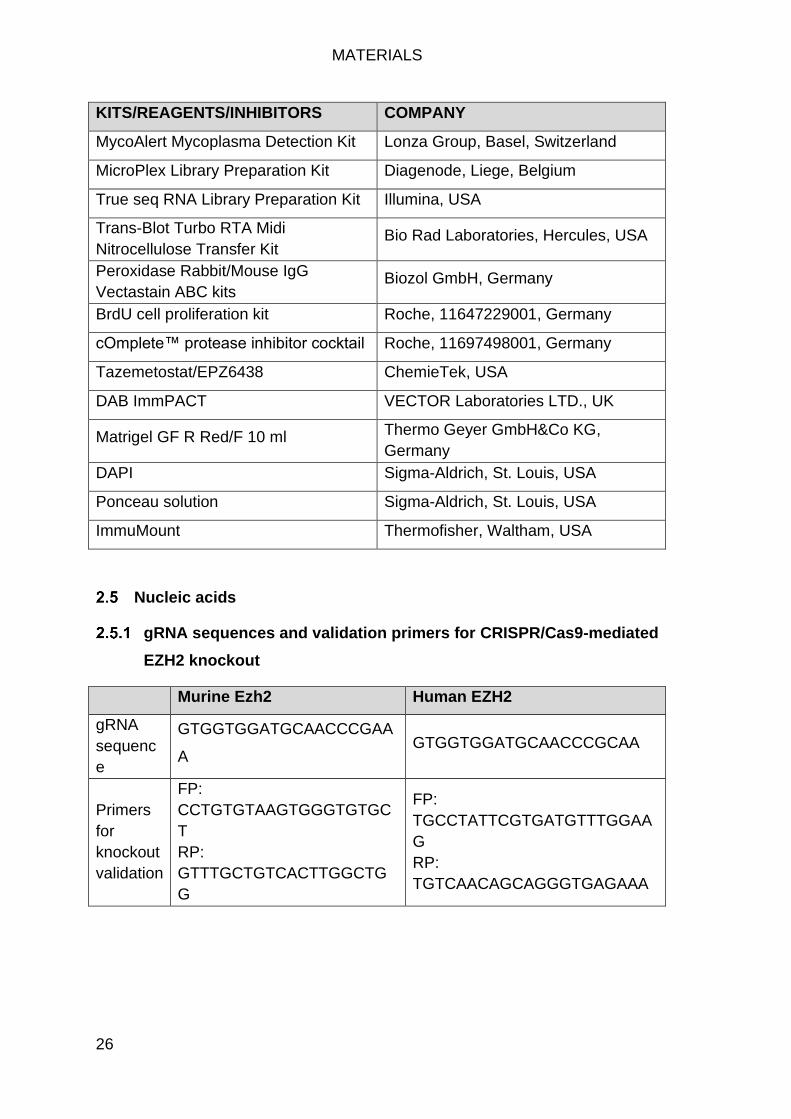
MATERIALS
26
KITS/REAGENTS/INHIBITORS COMPANY
MycoAlert Mycoplasma Detection Kit Lonza Group, Basel, Switzerland
MicroPlex Library Preparation Kit Diagenode, Liege, Belgium
True seq RNA Library Preparation Kit Illumina, USA
Trans-Blot Turbo RTA Midi
Nitrocellulose Transfer Kit Bio Rad Laboratories, Hercules, USA
Peroxidase Rabbit/Mouse IgG
Vectastain ABC kits Biozol GmbH, Germany
BrdU cell proliferation kit Roche, 11647229001, Germany
cOmplete™ protease inhibitor cocktail Roche, 11697498001, Germany
Tazemetostat/EPZ6438 ChemieTek, USA
DAB ImmPACT VECTOR Laboratories LTD., UK
Matrigel GF R Red/F 10 ml Thermo Geyer GmbH&Co KG,
Germany
DAPI Sigma-Aldrich, St. Louis, USA
Ponceau solution Sigma-Aldrich, St. Louis, USA
ImmuMount Thermofisher, Waltham, USA
Nucleic acids
gRNA sequences and validation primers for CRISPR/Cas9-mediated
EZH2 knockout
Murine Ezh2 Human EZH2
gRNA
sequenc
e
GTGGTGGATGCAACCCGAA
A GTGGTGGATGCAACCCGCAA
Primers
for
knockout
validation
FP:
CCTGTGTAAGTGGGTGTGC
T
RP:
GTTTGCTGTCACTTGGCTG
G
FP:
TGCCTATTCGTGATGTTTGGAA
G
RP:
TGTCAACAGCAGGGTGAGAAA
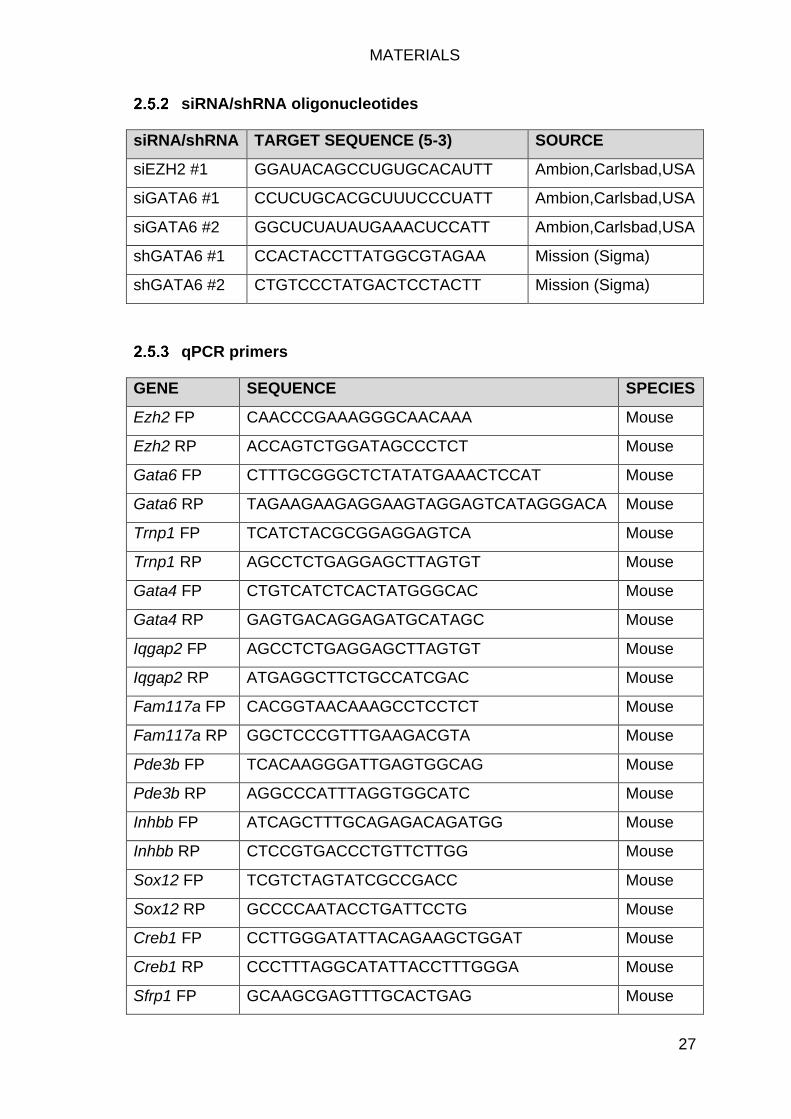
MATERIALS
27
siRNA/shRNA oligonucleotides
siRNA/shRNA TARGET SEQUENCE (5-3) SOURCE
siEZH2 #1 GGAUACAGCCUGUGCACAUTT Ambion,Carlsbad,USA
siGATA6 #1 CCUCUGCACGCUUUCCCUATT Ambion,Carlsbad,USA
siGATA6 #2 GGCUCUAUAUGAAACUCCATT Ambion,Carlsbad,USA
shGATA6 #1 CCACTACCTTATGGCGTAGAA Mission (Sigma)
shGATA6 #2 CTGTCCCTATGACTCCTACTT Mission (Sigma)
qPCR primers
GENE SEQUENCE SPECIES
Ezh2 FP CAACCCGAAAGGGCAACAAA Mouse
Ezh2 RP ACCAGTCTGGATAGCCCTCT Mouse
Gata6 FP CTTTGCGGGCTCTATATGAAACTCCAT Mouse
Gata6 RP TAGAAGAAGAGGAAGTAGGAGTCATAGGGACA Mouse
Trnp1 FP TCATCTACGCGGAGGAGTCA Mouse
Trnp1 RP AGCCTCTGAGGAGCTTAGTGT Mouse
Gata4 FP CTGTCATCTCACTATGGGCAC Mouse
Gata4 RP GAGTGACAGGAGATGCATAGC Mouse
Iqgap2 FP AGCCTCTGAGGAGCTTAGTGT Mouse
Iqgap2 RP ATGAGGCTTCTGCCATCGAC Mouse
Fam117a FP CACGGTAACAAAGCCTCCTCT Mouse
Fam117a RP GGCTCCCGTTTGAAGACGTA Mouse
Pde3b FP TCACAAGGGATTGAGTGGCAG Mouse
Pde3b RP AGGCCCATTTAGGTGGCATC Mouse
Inhbb FP ATCAGCTTTGCAGAGACAGATGG Mouse
Inhbb RP CTCCGTGACCCTGTTCTTGG Mouse
Sox12 FP TCGTCTAGTATCGCCGACC Mouse
Sox12 RP GCCCCAATACCTGATTCCTG Mouse
Creb1 FP CCTTGGGATATTACAGAAGCTGGAT Mouse
Creb1 RP CCCTTTAGGCATATTACCTTTGGGA Mouse
Sfrp1 FP GCAAGCGAGTTTGCACTGAG Mouse
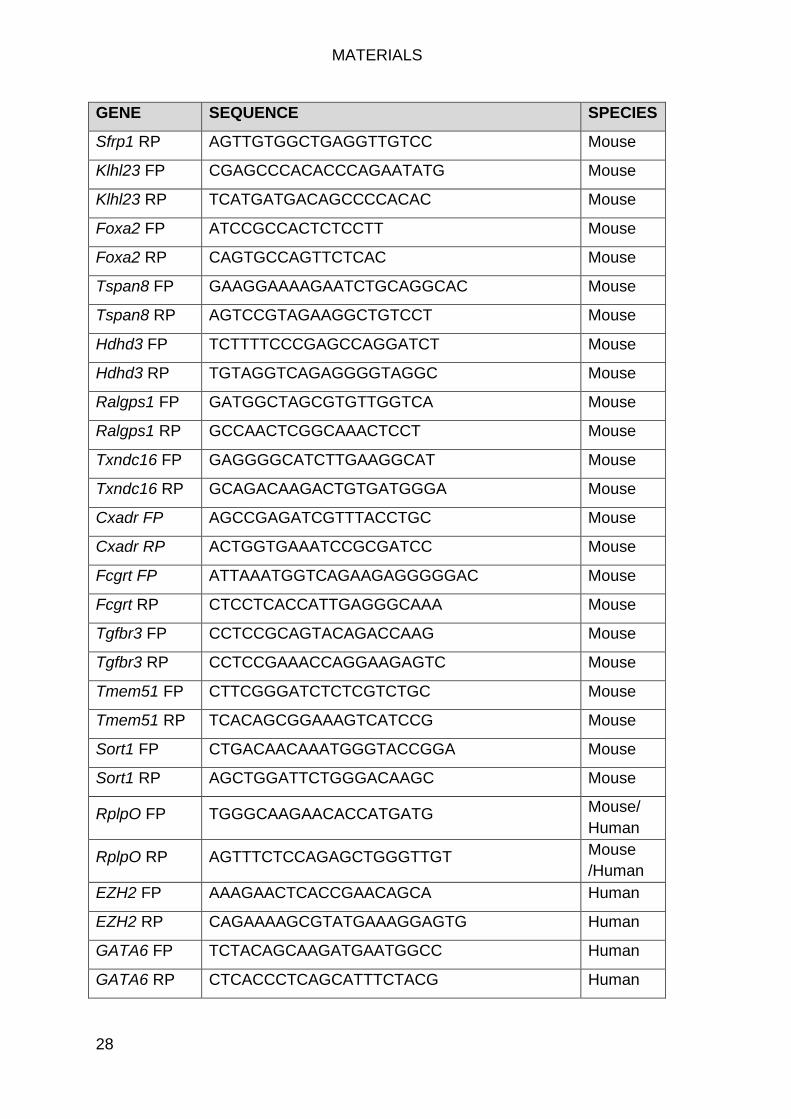
MATERIALS
28
GENE SEQUENCE SPECIES
Sfrp1 RP AGTTGTGGCTGAGGTTGTCC Mouse
Klhl23 FP CGAGCCCACACCCAGAATATG Mouse
Klhl23 RP TCATGATGACAGCCCCACAC Mouse
Foxa2 FP ATCCGCCACTCTCCTT Mouse
Foxa2 RP CAGTGCCAGTTCTCAC Mouse
Tspan8 FP GAAGGAAAAGAATCTGCAGGCAC Mouse
Tspan8 RP AGTCCGTAGAAGGCTGTCCT Mouse
Hdhd3 FP TCTTTTCCCGAGCCAGGATCT Mouse
Hdhd3 RP TGTAGGTCAGAGGGGTAGGC Mouse
Ralgps1 FP GATGGCTAGCGTGTTGGTCA Mouse
Ralgps1 RP GCCAACTCGGCAAACTCCT Mouse
Txndc16 FP GAGGGGCATCTTGAAGGCAT Mouse
Txndc16 RP GCAGACAAGACTGTGATGGGA Mouse
Cxadr FP AGCCGAGATCGTTTACCTGC Mouse
Cxadr RP ACTGGTGAAATCCGCGATCC Mouse
Fcgrt FP ATTAAATGGTCAGAAGAGGGGGAC Mouse
Fcgrt RP CTCCTCACCATTGAGGGCAAA Mouse
Tgfbr3 FP CCTCCGCAGTACAGACCAAG Mouse
Tgfbr3 RP CCTCCGAAACCAGGAAGAGTC Mouse
Tmem51 FP CTTCGGGATCTCTCGTCTGC Mouse
Tmem51 RP TCACAGCGGAAAGTCATCCG Mouse
Sort1 FP CTGACAACAAATGGGTACCGGA Mouse
Sort1 RP AGCTGGATTCTGGGACAAGC Mouse
RplpO FP TGGGCAAGAACACCATGATG Mouse/
Human
RplpO RP AGTTTCTCCAGAGCTGGGTTGT Mouse
/Human
EZH2 FP AAAGAACTCACCGAACAGCA Human
EZH2 RP CAGAAAAGCGTATGAAAGGAGTG Human
GATA6 FP TCTACAGCAAGATGAATGGCC Human
GATA6 RP CTCACCCTCAGCATTTCTACG Human
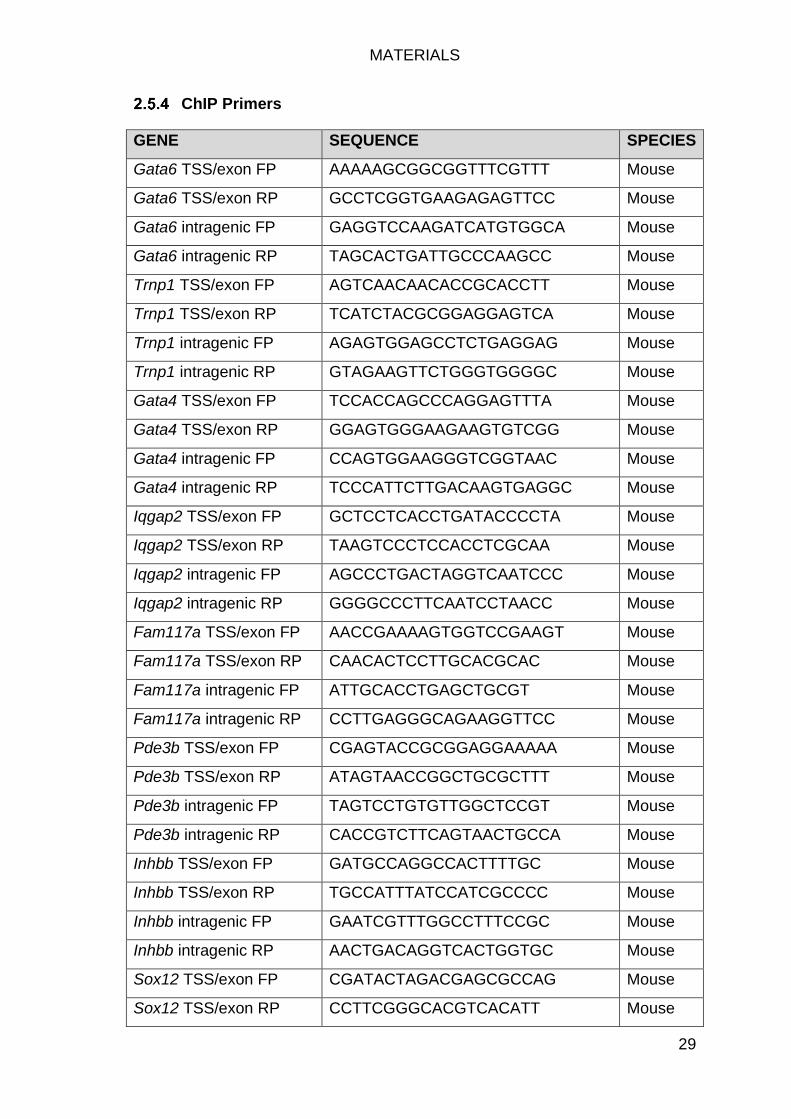
MATERIALS
29
ChIP Primers
GENE SEQUENCE SPECIES
Gata6 TSS/exon FP AAAAAGCGGCGGTTTCGTTT Mouse
Gata6 TSS/exon RP GCCTCGGTGAAGAGAGTTCC Mouse
Gata6 intragenic FP GAGGTCCAAGATCATGTGGCA Mouse
Gata6 intragenic RP TAGCACTGATTGCCCAAGCC Mouse
Trnp1 TSS/exon FP AGTCAACAACACCGCACCTT Mouse
Trnp1 TSS/exon RP TCATCTACGCGGAGGAGTCA Mouse
Trnp1 intragenic FP AGAGTGGAGCCTCTGAGGAG Mouse
Trnp1 intragenic RP GTAGAAGTTCTGGGTGGGGC Mouse
Gata4 TSS/exon FP TCCACCAGCCCAGGAGTTTA Mouse
Gata4 TSS/exon RP GGAGTGGGAAGAAGTGTCGG Mouse
Gata4 intragenic FP CCAGTGGAAGGGTCGGTAAC Mouse
Gata4 intragenic RP TCCCATTCTTGACAAGTGAGGC Mouse
Iqgap2 TSS/exon FP GCTCCTCACCTGATACCCCTA Mouse
Iqgap2 TSS/exon RP TAAGTCCCTCCACCTCGCAA Mouse
Iqgap2 intragenic FP AGCCCTGACTAGGTCAATCCC Mouse
Iqgap2 intragenic RP GGGGCCCTTCAATCCTAACC Mouse
Fam117a TSS/exon FP AACCGAAAAGTGGTCCGAAGT Mouse
Fam117a TSS/exon RP CAACACTCCTTGCACGCAC Mouse
Fam117a intragenic FP ATTGCACCTGAGCTGCGT Mouse
Fam117a intragenic RP CCTTGAGGGCAGAAGGTTCC Mouse
Pde3b TSS/exon FP CGAGTACCGCGGAGGAAAAA Mouse
Pde3b TSS/exon RP ATAGTAACCGGCTGCGCTTT Mouse
Pde3b intragenic FP TAGTCCTGTGTTGGCTCCGT Mouse
Pde3b intragenic RP CACCGTCTTCAGTAACTGCCA Mouse
Inhbb TSS/exon FP GATGCCAGGCCACTTTTGC Mouse
Inhbb TSS/exon RP TGCCATTTATCCATCGCCCC Mouse
Inhbb intragenic FP GAATCGTTTGGCCTTTCCGC Mouse
Inhbb intragenic RP AACTGACAGGTCACTGGTGC Mouse
Sox12 TSS/exon FP CGATACTAGACGAGCGCCAG Mouse
Sox12 TSS/exon RP CCTTCGGGCACGTCACATT Mouse
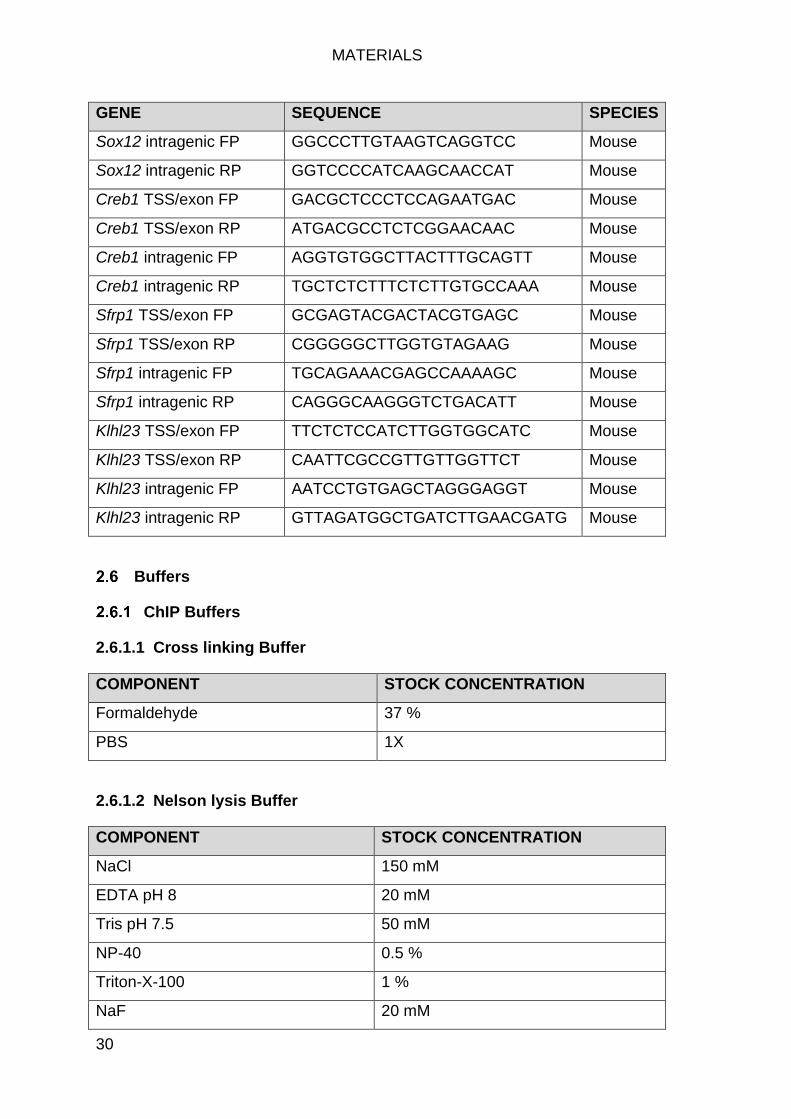
MATERIALS
30
GENE SEQUENCE SPECIES
Sox12 intragenic FP GGCCCTTGTAAGTCAGGTCC Mouse
Sox12 intragenic RP GGTCCCCATCAAGCAACCAT Mouse
Creb1 TSS/exon FP GACGCTCCCTCCAGAATGAC Mouse
Creb1 TSS/exon RP ATGACGCCTCTCGGAACAAC Mouse
Creb1 intragenic FP AGGTGTGGCTTACTTTGCAGTT Mouse
Creb1 intragenic RP TGCTCTCTTTCTCTTGTGCCAAA Mouse
Sfrp1 TSS/exon FP GCGAGTACGACTACGTGAGC Mouse
Sfrp1 TSS/exon RP CGGGGGCTTGGTGTAGAAG Mouse
Sfrp1 intragenic FP TGCAGAAACGAGCCAAAAGC Mouse
Sfrp1 intragenic RP CAGGGCAAGGGTCTGACATT Mouse
Klhl23 TSS/exon FP TTCTCTCCATCTTGGTGGCATC Mouse
Klhl23 TSS/exon RP CAATTCGCCGTTGTTGGTTCT Mouse
Klhl23 intragenic FP AATCCTGTGAGCTAGGGAGGT Mouse
Klhl23 intragenic RP GTTAGATGGCTGATCTTGAACGATG Mouse
Buffers
ChIP Buffers
2.6.1.1 Cross linking Buffer
COMPONENT STOCK CONCENTRATION
Formaldehyde 37 %
PBS 1X
2.6.1.2 Nelson lysis Buffer
COMPONENT STOCK CONCENTRATION
NaCl 150 mM
EDTA pH 8 20 mM
Tris pH 7.5 50 mM
NP-40 0.5 %
Triton-X-100 1 %
NaF 20 mM
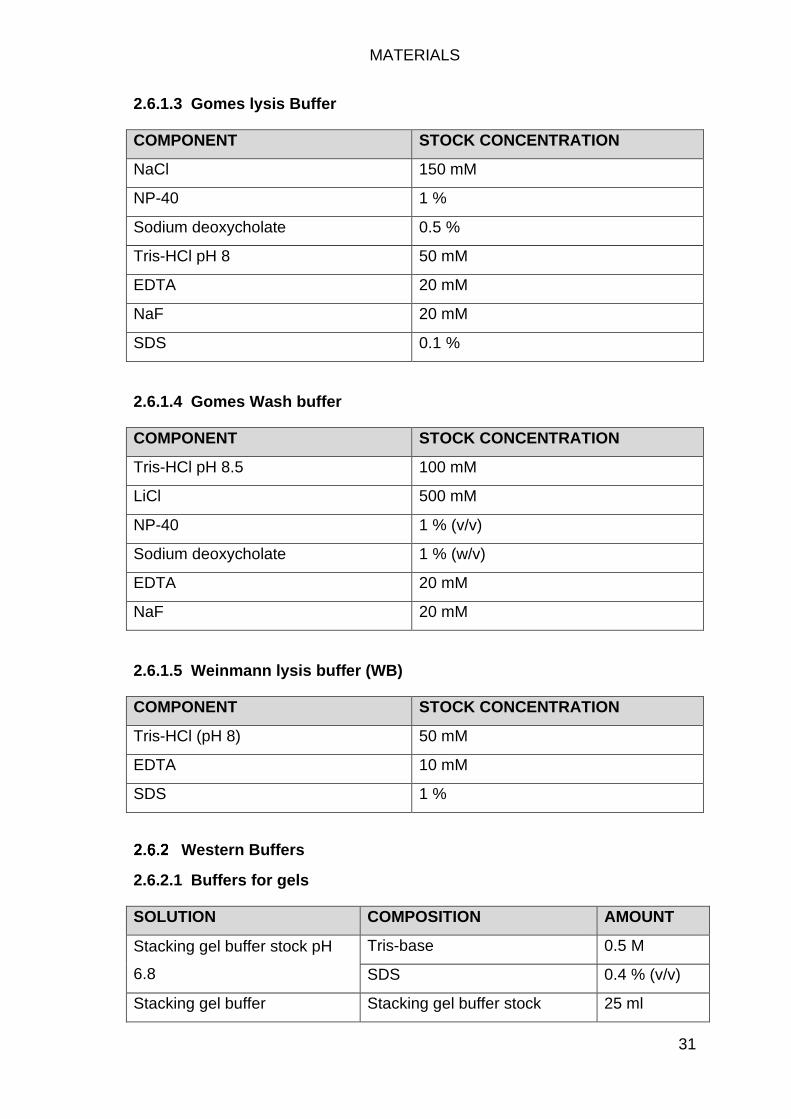
MATERIALS
31
2.6.1.3 Gomes lysis Buffer
COMPONENT STOCK CONCENTRATION
NaCl 150 mM
NP-40 1 %
Sodium deoxycholate 0.5 %
Tris-HCl pH 8 50 mM
EDTA 20 mM
NaF 20 mM
SDS 0.1 %
2.6.1.4 Gomes Wash buffer
COMPONENT STOCK CONCENTRATION
Tris-HCl pH 8.5 100 mM
LiCl 500 mM
NP-40 1 % (v/v)
Sodium deoxycholate 1 % (w/v)
EDTA 20 mM
NaF 20 mM
2.6.1.5 Weinmann lysis buffer (WB)
COMPONENT STOCK CONCENTRATION
Tris-HCl (pH 8) 50 mM
EDTA 10 mM
SDS 1 %
Western Buffers
2.6.2.1 Buffers for gels
SOLUTION COMPOSITION AMOUNT
Stacking gel buffer stock pH
6.8
Tris-base 0.5 M
SDS 0.4 % (v/v)
Stacking gel buffer Stacking gel buffer stock 25 ml
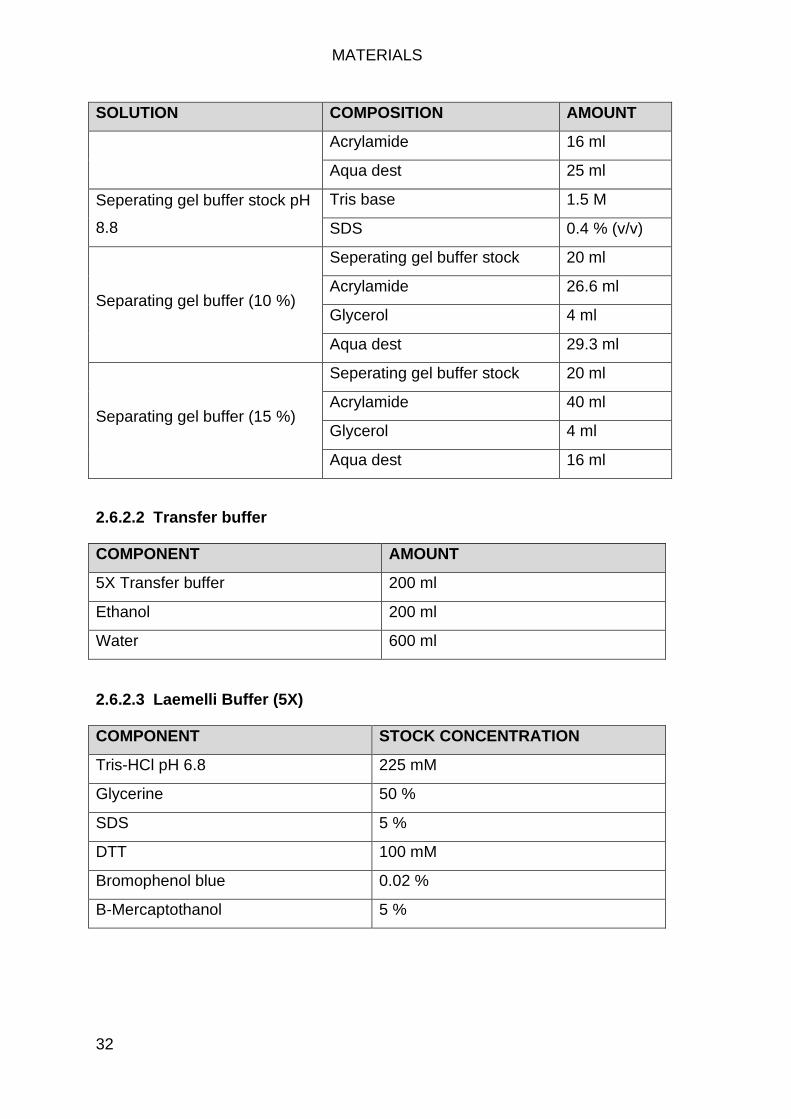
MATERIALS
32
SOLUTION COMPOSITION AMOUNT
Acrylamide 16 ml
Aqua dest 25 ml
Seperating gel buffer stock pH
8.8
Tris base 1.5 M
SDS 0.4 % (v/v)
Separating gel buffer (10 %)
Seperating gel buffer stock 20 ml
Acrylamide 26.6 ml
Glycerol 4 ml
Aqua dest 29.3 ml
Separating gel buffer (15 %)
Seperating gel buffer stock 20 ml
Acrylamide 40 ml
Glycerol 4 ml
Aqua dest 16 ml
2.6.2.2 Transfer buffer
COMPONENT AMOUNT
5X Transfer buffer 200 ml
Ethanol 200 ml
Water 600 ml
2.6.2.3 Laemelli Buffer (5X)
COMPONENT STOCK CONCENTRATION
Tris-HCl pH 6.8 225 mM
Glycerine 50 %
SDS 5 %
DTT 100 mM
Bromophenol blue 0.02 %
B-Mercaptothanol 5 %
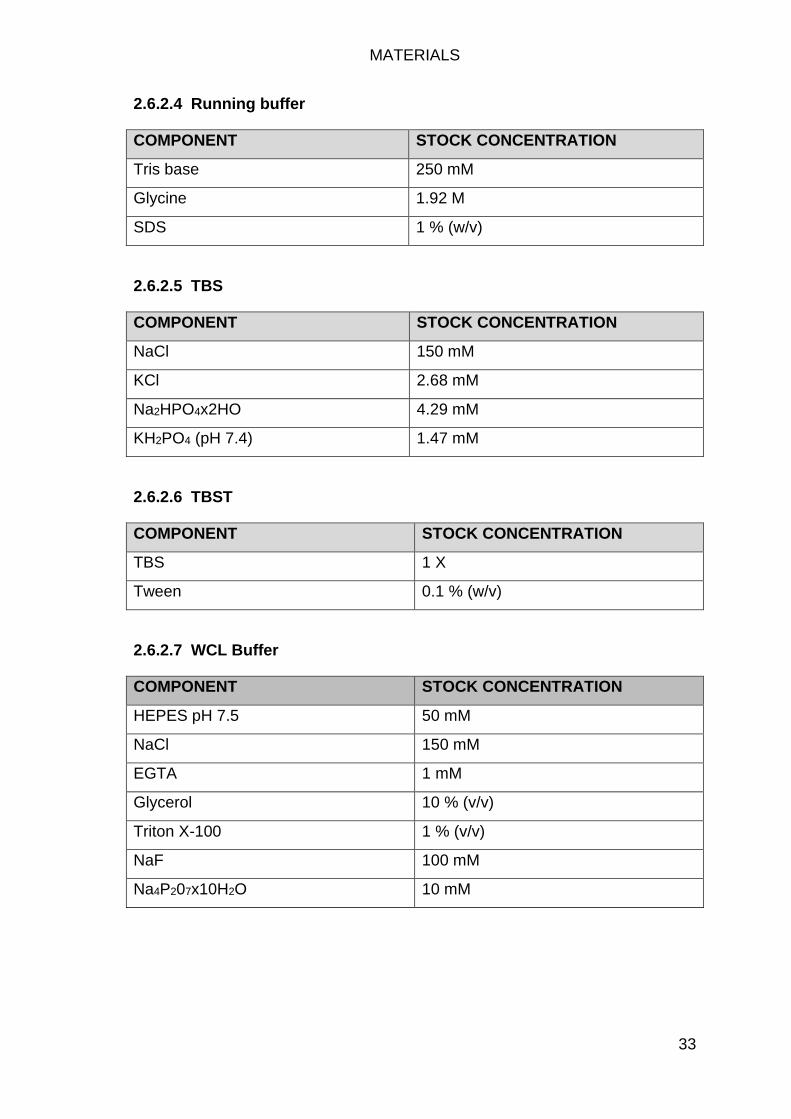
MATERIALS
33
2.6.2.4 Running buffer
COMPONENT STOCK CONCENTRATION
Tris base 250 mM
Glycine 1.92 M
SDS 1 % (w/v)
2.6.2.5 TBS
COMPONENT STOCK CONCENTRATION
NaCl 150 mM
KCl 2.68 mM
Na2HPO4x2HO 4.29 mM
KH2PO4 (pH 7.4) 1.47 mM
2.6.2.6 TBST
COMPONENT STOCK CONCENTRATION
TBS 1 X
Tween 0.1 % (w/v)
2.6.2.7 WCL Buffer
COMPONENT STOCK CONCENTRATION
HEPES pH 7.5 50 mM
NaCl 150 mM
EGTA 1 mM
Glycerol 10 % (v/v)
Triton X-100 1 % (v/v)
NaF 100 mM
Na4P207x10H2O 10 mM
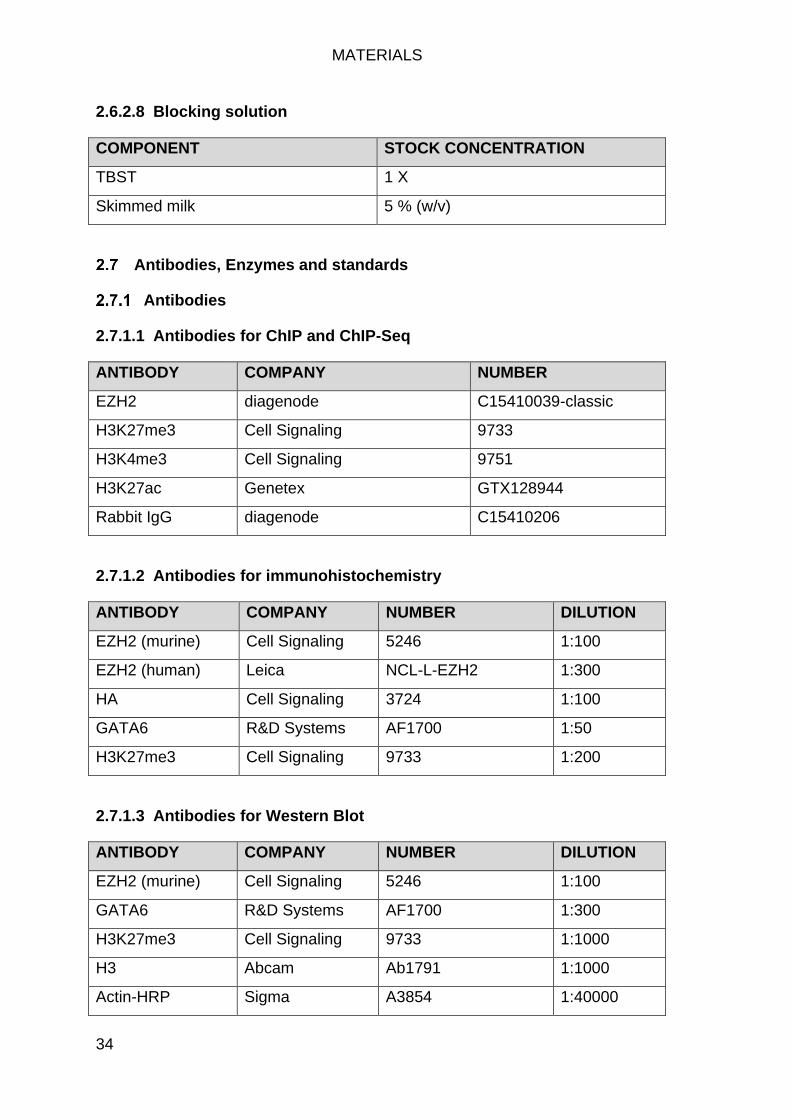
MATERIALS
34
2.6.2.8 Blocking solution
COMPONENT STOCK CONCENTRATION
TBST 1 X
Skimmed milk 5 % (w/v)
Antibodies, Enzymes and standards
Antibodies
2.7.1.1 Antibodies for ChIP and ChIP-Seq
ANTIBODY COMPANY NUMBER
EZH2 diagenode C15410039-classic
H3K27me3 Cell Signaling 9733
H3K4me3 Cell Signaling 9751
H3K27ac Genetex GTX128944
Rabbit IgG diagenode C15410206
2.7.1.2 Antibodies for immunohistochemistry
ANTIBODY COMPANY NUMBER DILUTION
EZH2 (murine) Cell Signaling 5246 1:100
EZH2 (human) Leica NCL-L-EZH2 1:300
HA Cell Signaling 3724 1:100
GATA6 R&D Systems AF1700 1:50
H3K27me3 Cell Signaling 9733 1:200
2.7.1.3 Antibodies for Western Blot
ANTIBODY COMPANY NUMBER DILUTION
EZH2 (murine) Cell Signaling 5246 1:100
GATA6 R&D Systems AF1700 1:300
H3K27me3 Cell Signaling 9733 1:1000
H3 Abcam Ab1791 1:1000
Actin-HRP Sigma A3854 1:40000
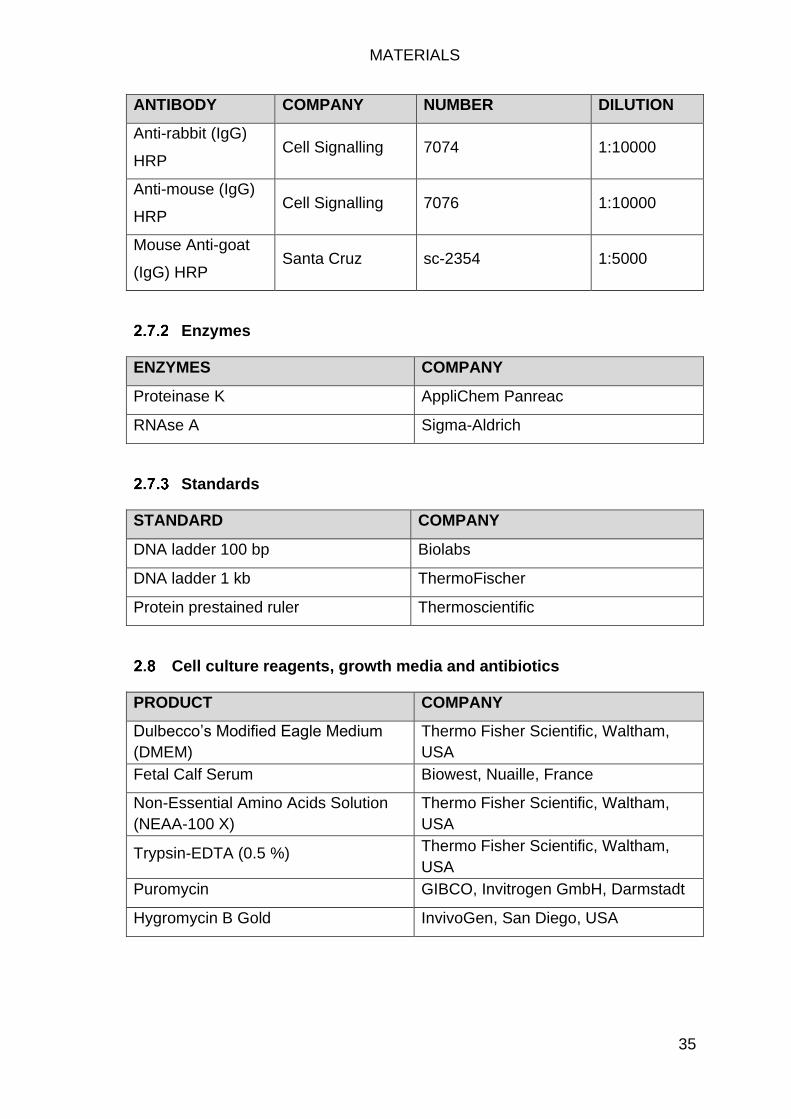
MATERIALS
35
ANTIBODY COMPANY NUMBER DILUTION
Anti-rabbit (IgG)
HRP Cell Signalling 7074 1:10000
Anti-mouse (IgG)
HRP Cell Signalling 7076 1:10000
Mouse Anti-goat
(IgG) HRP Santa Cruz sc-2354 1:5000
Enzymes
ENZYMES COMPANY
Proteinase K AppliChem Panreac
RNAse A Sigma-Aldrich
Standards
STANDARD COMPANY
DNA ladder 100 bp Biolabs
DNA ladder 1 kb ThermoFischer
Protein prestained ruler Thermoscientific
Cell culture reagents, growth media and antibiotics
PRODUCT COMPANY
Dulbecco’s Modified Eagle Medium
(DMEM)
Thermo Fisher Scientific, Waltham,
USA
Fetal Calf Serum Biowest, Nuaille, France
Non-Essential Amino Acids Solution
(NEAA-100 X)
Thermo Fisher Scientific, Waltham,
USA
Trypsin-EDTA (0.5 %) Thermo Fisher Scientific, Waltham,
USA
Puromycin GIBCO, Invitrogen GmbH, Darmstadt
Hygromycin B Gold InvivoGen, San Diego, USA
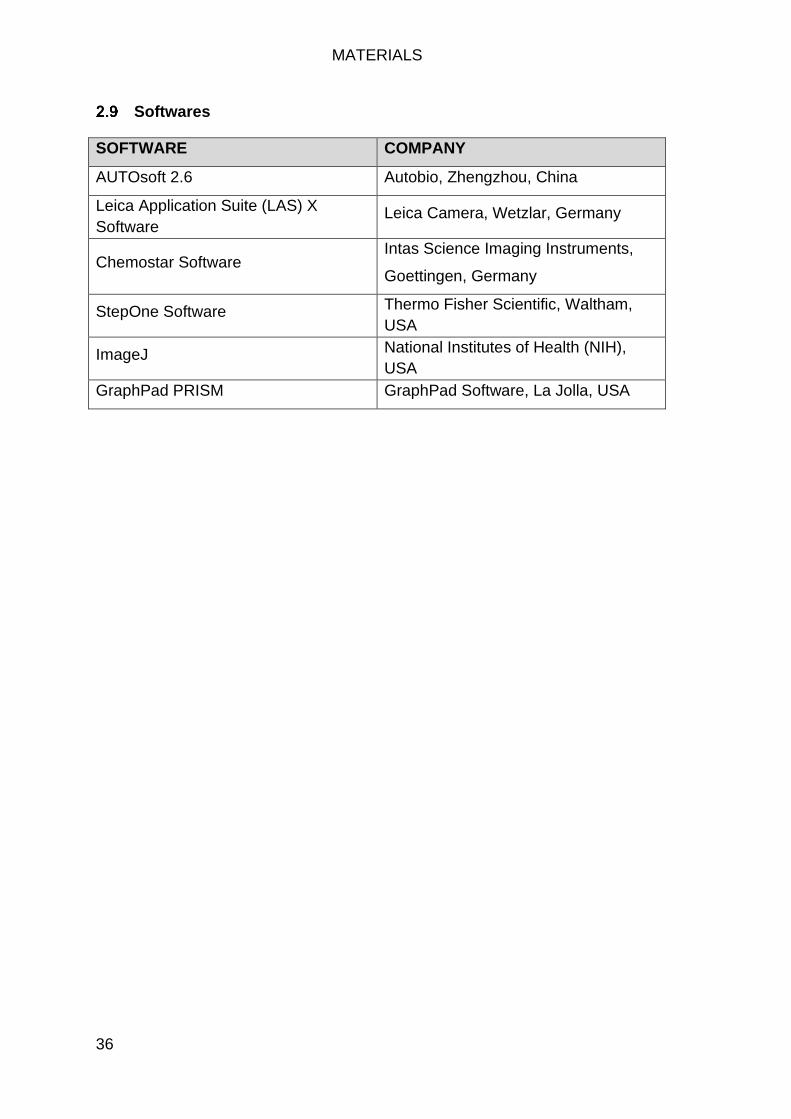
MATERIALS
36
Softwares
SOFTWARE COMPANY
AUTOsoft 2.6 Autobio, Zhengzhou, China
Leica Application Suite (LAS) X
Software Leica Camera, Wetzlar, Germany
Chemostar Software Intas Science Imaging Instruments,
Goettingen, Germany
StepOne Software Thermo Fisher Scientific, Waltham,
USA
ImageJ National Institutes of Health (NIH),
USA
GraphPad PRISM GraphPad Software, La Jolla, USA
METHODS
37
3 METHODS
This chapter describes the various methods followed towards performing the
experiments and analyses of the acquired data. Studies were conducted with
the assistance from and cooperation with different collaborators departments:
Tumor grading was performed by Prof. Dr. med Philipp Ströbel, Institute of
Pathology, University Medical Center, Goettingen. EZH2 and GATA6 Stainings
in Tissue microarray (TMA) samples were provided by Dr. Stefan Kueffer
(Institute of Pathology, University Medical Center, Goettingen). The generation
of PDAC-PDX models was performed in close collaboration with Prof. Dr. med.
Jochen Gaedcke (Department of General-, Visceral- and Pediatric surgery,
University Medical Center, Goettingen) and Prof. Dr. med Phillip Ströbel
(Institute of Pathology, University Medical Center, Goettingen). The
caNFATc1;KrasG12D (NKC) and EZH2fl/+;caNFATc1;KrasG12D (ENKC) mouse
models have been generated with support from Benjamin Steuber, Waltraut
Kopp and Sercan Mercan. The shRNA EZH2 NKC cells were obtained from
Jinsan Zhang (Gene Regulatory Mechanisms and Molecular Epigenetics Lab,
Division of Gastroenterology and Hepatology, Mayo Clinic, Rochester, USA).
In vivo experiments
Mouse strains
caNfatc1;KrasG12D (NKC) mice have been previously described (Baumgart et al.
2014). Briefly, this model harbors the oncogenic KrasG12D mutation and
pdx/p48 Cre-mediated expression of HA-tagged NFATc1 constitutively under
the control of Rosa26 promoter. Ezh2fl/fl mice were purchased from Charles
River and were interbred with caNfatc1;KrasG12D littermates to generate
Ezh2fl/+;caNfatc1;KrasG12D (ENKC) mice. For survival studies,
Ezh2fl/+;caNfatc1;KrasG12D (ENKC) mice were followed up until they reached
end point criteria and then sacrificed. The pancreas, liver and spleen were
collected in 4 % formaldehyde for histological analysis and a part of pancreatic
tissue was frozen in -80 °C. The tissues collected and stored overnight in 4 %
formaldehyde were subjected to dehydration in increasing concentrations of
ethanol and further embedded in paraffin for long time storage. The tissues in
METHODS
38
paraffin blocks were sectioned with a thickness of 4 µm using microtome and
fixed on glass slides which were then used for various histological stainings.
All animal procedures were conducted in accordance with the protocols
approved by the Institutional Animal Care and Use Committee (33.9-42502-04-
14/1633; -17/2497 and -19/3085).
Metastatic incidence in transgenic mice
For evaluation of micrometastases, three liver sections, each section separated
by 20 µm, from each tumor-bearing caNfatc1;KrasG12D- and
Ezh2fl/+;caNfatc1;KrasG12D mouse were stained for HA-NFATc1 for better
visualization of tumor cells in the liver and were subsequently evaluated for
metastasis. Mice that carried at least one HA-positive lesion which was
surrounded by healthy liver tissue were considered as positive for metastasis.
Cell culture:
Cells, culture conditions and Tazemetostat (EPZ6438) treatment
Primary PDAC cells derived from caNfatc1;KrasG12D (NKC) and
KrasG12D;TP53R172H/+ (KPC) mice have been described previously (Baumgart et
al. 2014; Hingorani et al. 2005). The isolation of pancreatic tumor and further
generation of ENKC cell lines from tumor bearing Ezh2fl/+;caNFATc1;KrasG12D
mice was performed by Waltraut Kopp. Primary murine PDAC cells were
cultured using Dulbecco’s Modifies Eagle’s Medium (DMEM) containing 4.5 g/L
D- Glucose, L-Glutamine supplemented with 10 % Fetal calf serum (FCS) and
1 % Non-essential amino acids (NEAA). PANC-1 cells have been previously
described (N. M. Chen et al. 2017) and were cultivated using DMEM containing
4.5 g/L D-Glucose, L-Glutamine supplemented with 10 % FCS. PDX lines
derived from the subcutaneous tumors of PDX mice were cultured in
Keratinocyte-SFM (KSF):Roswell Park Memorial Institute (RPMI) (in 3:1 ratio)
media supplemented with 2 % FCS, 1 % PenStrep, bovine pituitary extract and
epidermal growth factor. Cells were grown in a sterile incubator with 5 % CO2
humidity and at 37 °C. The mycoplasma status of the cells was verified after
METHODS
39
reviving the cells for the experiments using the MycoAlert Mycoplasma
Detection Kit from Lonza Group following the instructions mentioned in the kit.
The cells grown up to 80 % confluency were utilized to make cell stocks for
long term storage. Cells were trypsinized and centrifuged (1200 rpm for 3
minutes) to pellet down the cells. The supernatant was discarded. Desired
amount of cryoprotectant medium (90 % FCS + 10 % DMSO) was added onto
the cells to attain a concentration of 2*106 cells/ml. Further 1 ml cell suspension
was aliquoted into each cryovial and the cryovials were quickly transferred into
frosty box (container containing isopropanol). The frosty box was left at -80 °C
overnight and later transferred into liquid nitrogen for long term storage. While
reviving the cells, cryovials were removed from the liquid nitrogen, quickly
thawed in a waterbath (37 °C) and resuspended in a falcon containing 10 ml
medium. The cell suspension was centrifuged and the supernatant containing
freezing medium was discarded. Cells were resuspended in fresh medium and
transferred into a cell culture flask. When passaging the cells, cells were briefly
washed with PBS to remove the serum. Further, the cells were incubated with
trypsin for 3-5 minutes and the reaction was neutralized by adding media on the
cells. The content was collected in a falcon, centrifuged (1200 rpm for 3
minutes) and the supernatant was discarded. The cells were then resuspended
in fresh medium and split at the required density into a new cell culture flask.
EZH2 methyltransferase inhibition was performed by treatment of indicated
concentrations of Tazemetostat (EPZ6438) for 72 hours diluted in dimethyl
sulfoxide (DMSO). Control cells were treated with equal amounts of DMSO.
Generation of EZH2 shRNA and CRISPR/Cas9 clones and transient
transfection
CRISPR/Cas9 based genome editing was utilized to generate EZH2 knockout
PDAC cells. The PDAC cells were seeded into a 10 cm dish and once they
attained 60 % confluency, they were transfected with pSpCas9(BB)-2A-Puro
PX459 vectors containing single guide RNA (sgRNA) against murine or human
EZH2, respectively, with the help of lipofectamine 2000. The following day, cells
were split at different dilutions to allow the growth of single colonies and were
treated with Puromycin (2 µg/ml) to select for transfected cells. Cells were
allowed to grow until they formed visible single colonies on the culture dish.
METHODS
40
Further, the single clones were picked by trypsinizing with small volume of
trypsin, taking care not to disturb the neighbouring colonies. The cells were
then transferred into 24-well plate and further expanded in culture. Some of
these cells were used to harvest for lysate and tested on western blot for
knockdown. Further, genomic DNA was isolated from those clones that showed
EZH2 knockdown in western blot and a PCR was performed using the
genotyping primers. The PCR products were then sequenced by Microsynth
Seqlab GmbH to confirm the knockout. RNA and whole cell lysate (WCL) were
also extracted to confirm the knockout at RNA and protein level. After
confirmation of successful EZH2 knockout, cells were used for further
experiments.
For siRNA or shRNA based knockdowns, siLentFect or Lipofectamine 2000
was used respectively. In short, the designated volume of siRNA and
transfection reagent was added to OptiMEM and incubated for 20 minutes and
subsequently added on the cells. Media was changed approximately 10 hours
post transfection and cells were harvested for experiments after 48-72 hours.
For EZH2 re-expression, HA-tagged EZH2 expression plasmid was transfected
into NKC cells using lipofectamine 2000 and the transfected cells were selected
using the antibiotic Hygromycin (300 µg/ml). The selected cells harboring
transient re-expression of wildtype EZH2 were used for experiments.
Functional in vitro assays
Cell counting assay
Cell counting assays were performed to determine the trend in cell growth.
Experiments were conducted in triplicates. 2,500 cells were seeded in each
well of a 6-well plate (Day 0). On day 3, cells were trypsinized and quantified
before replating in a fresh 10 cm dish. Finally, on day 6, the cells were
trypsinized and counted again.
BrdU (Bromodeoxyuridine) assay
BrdU assays were performed to analyze the proliferation capacity of the cells
by determining the intensity of absorbance of cellular BrdU incorporation. 2,500
METHODS
41
cells were seeded into each well of a 96-well plate in five replicates per
condition. After 72 hours, BrdU labelling reagent was added on the cells and
incubated for 4 hours. Further steps were performed according to
manufacturer’s instructions (BrdU cell proliferation kit, Roche, 11647229001).
The absorbance was measured at 405 nm and the OD values were plotted as
BrdU incorporation.
Boyden chamber assay
Invasion capacities of PDAC cells were determined utilizing Boyden chamber
assay. 50,000 cells were counted and seeded in 50 % matrigel into the
collagen coated inserts. The inserts were placed into a 24-well plate. Complete
media was added in the lower chamber and serum free media was added into
the inserts. After 48 hours, the non-invaded cells and the matrigel were scraped
off. The invaded cells were fixed with 4 % paraformaldehyde (PFA) for 20
minutes, washed twice with 1X PBS, stained with DAPI (1:2000) and mounted
on a glass slide. The DAPI positive nuclei were counted under fluorescence
microscope.
When evaluating the invasion potential of GATA6 knockdown cells, the cells
transfected with siRNA against GATA6 were trypsinized 24 hours post
transfection and seeded for Boyden chamber assay.
Colony formation assay
Soft agar assays were performed to evaluate the ability of the cells for
anchorage independent growth. The 6-well plates were coated with 1:1 mix of
nobel agar (1 %) and culture medium. Further, 13,000 cells in medium were
mixed with 1% nobel agar in the ratio 1:3 and seeded on these coated wells.
After ensuring proper solidification of agar (approximately 30 minutes), cell
culture medium was added on the top and 7 days later the colonies (cluster of
cells visible under microscope) were counted under the microscope.
Sphere formation assay
Sphere formation assays were conducted to analyze the stemness behavior of
the cells. 30,000 cells were seeded into each well of a 6-well low attachment
plate and were supplemented with sphere medium (DMEM/F-12 supplemented
METHODS
42
with 1X insulin, 0.4 % BSA, 20 ng/µl EGF, 10 ng/µl FGF, 2 % B27 supplement
and N2 supplement). 0.02 ng/µl fibroblast growth factor (FGF) was added into
each well every fourth day. After 11 days, pictures of the spheres from all the
wells were taken using phase contrast microscopy. Total number of spheres in
each well were counted, and the size of spheres were measured using ImageJ.
The average value from three wells were used for plotting the graph.
Molecular biology
RNA isolation
The media of cells was aspirated, and the cells were washed twice with 1X
PBS. Further, cells were scraped in TRIzol and collected in a 1.5 ml eppendorf
tube. 200 µl chloroform was added on the samples, vortexed and centrifuged at
13500 rpm for 15 minutes at 4 °C. The aqueous phase was collected in a
separate tube and RNA was precipitated by adding 500 µl isopropanol, allowing
it to stand at room temperature (RT) for 15 minutes and centrifuging it at 13500
rpm for 30 minutes at 4 °C. The RNA, which was pelleted down was then
washed twice with 75 % ethanol, dried and resuspended in 30-40 µl aqua-dest
water. RNA was stored at -80 °C. The concentration was measured
photometrically using NanoPhotometer P-330 prior to cDNA synthesis or RNA
sequencing.
cDNA synthesis
1 µg of RNA was reverse transcribed into cDNA using iscript cDNA synthesis
kit. cDNA synthesis was performed at 42 °C for 20 minutes and the enzyme
was inactivated by heating the samples at 95 °C for 1 minute. The sample was
further diluted in aqua dest water to 10 ng/µl.
Quantitative polymerase chain reaction (qPCR)
qPCR was performed to quantify the gene expression. qPCR was performed in
triplicates in a reaction volume of 10 µl. For each reaction, 1 µl of cDNA or DNA
from ChIP was mixed with 3.9 µl H2O, 5 µl of SYBR green mix and 0.05 µl of
each forward and reverse primers, and added into each well of a MicroAmp

METHODS
43
Fast Optical 96-well reaction plate. The plate was sealed with an adhesive film
and was briefly vortexed before placing it into StepOnePlus Real-Time PCR
System. The PCR reaction was as follows:
95 °C 10 minutes
95 °C 15 second 40 cycles
60 °C 1 minute
The CT values obtained were used to calculate the expression. The expression
was normalized to the housekeeping gene Rplp0 and further normalized to
control using the ΔΔCT method. For ChIP, qPCR samples were normalized
corresponding to their ChIP input samples.
Chromatin Immunoprecipitation (ChIP)
3.4.4.1 Cross linking and sonication
Cells were grown in a 15 cm dish and were used for ChIP once they attained
80 % confluency. Cells were fixed with 1 % formaldehyde in PBS for 20
minutes and the reaction was quenched by adding 1.25 M glycine for 5
minutes. Further, cells were washed twice with ice-cold PBS before adding 1 ml
Nelson buffer containing protease inhibitors on the cells. The cells were
scraped, collected in a 1.5 ml eppendorf tube and centrifuged at 11000 rpm, 4
°C for 5 minutes. The nuclei which had formed a pellet were washed once more
with 1 ml Nelson buffer. The final pellet was resuspended in 200 µl Gomes lysis
buffer containing protease inhibitors and SDS, and then incubated on a rotating
wheel at 4 °C for 15 minutes. The samples were sonicated using Biorupter with
30 seconds ON/OFF pulse for 25 cycles. The sonicated samples were then
centrifuged at 13000 rpm for 10 minutes at 4 °C and the supernatant was used
to proceed with pre-clearing.
3.4.4.2 Shearing check
Shearing check was performed to confirm that the sonication has sheared the
chromatin efficiently before proceeding with pre-clearing step. 10 µl of
sonicated samples was incubated overnight on a shaker (65 °C, 800 rpm) in
100 µl Weinmann lysis buffer supplemented with 30 µg proteinase K. On the
METHODS
44
following day, 100 µl water, 10 µl LiCl (8 M) and 2 µl glycogen was added into
the sample and DNA was isolated by adding phenol/chloroform/isoaymyl
alcohol (200 µl) and centrifuging at full speed for 2 minutes. The aqueous
phase was collected and the phenolic phase underwent back extraction with
200 µl Tris (pH 8) 10 mM + 0.4 M LiCl followed by 2 minutes full speed
centrifugation. The aqueous phase was added into the first tube and the DNA
was precipitated using 100 % ethanol. The DNA pellet was washed once with
70 % ethanol then finally resuspended in aqua-dest water with RNAse A (100
µg/ml). Further, the DNA was mixed with loading dye and run on a 1.5 %
agarose gel. The gel was observed under the gel documentation system and
the shearing was considered efficient if most of the fragments were in the range
200-500 bp.
3.4.4.3 Pre-clearing and Immunoprecipitation
Required volume of Agarose A beads was washed twice with Gomes lysis
buffer. The ChIP samples were brought up to 500 µl in Gomes lysis buffer and
were incubated with 100 µl Agarose A beads 50 % slurry for 1 hour at 4 °C.
Afterwards, the sample were centrifuged and the supernatant was aliquoted for
IP and one tube (2 % of the total sample) was saved as input.
The chromatin aliquots were incubated with desired antibodies mix (1-2 µg/ IP)
at 4 °C overnight on a cogwheel. On the following day, the blocked beads
(Agarose A beads were blocked in Gomes lysis buffer with 1 mg/ml BSA
overnight) were added and incubated for an hour. Further, the ChIP immune
complex were washed once with Gomes lysis buffer, twice with Gomes wash
buffer, twice with Gomes lysis buffer and finally with 1X TE buffer.
3.4.4.4 DNA isolation
The ChIP samples as well as input samples were diluted with 10 mM Tris (pH
8) containing 10 µg RNAse A and incubated for 30 minutes at 37 °C. Further,
50 µl Weinmann lysis buffer with an additional 30 µg proteinase K were added
and incubated at 65 °C overnight. The samples were centrifuged and the
supernatant was collected in a separate tube. The DNA on the beads was
eluted by resuspending with 100 µl Tris (pH 8), incubating for 10 minutes at 65
°C, 800 rpm followed by centrifuging and collecting the supernatant into the first
METHODS
45
tube. The DNA was further extracted using the phenol/chloroform/isoaymyl
alcohol extraction method (same as mentioned in shearing check). Finally, the
DNA was resuspended in 40 µl aqua-dest water. qPCR was performed with the
input and ChIP samples and further the expression was normalized to
expression in input samples.
Protein biochemistry
Sample preparation and Bradford Assay
For protein analyses, cells were harvested in whole cell lysis buffer
supplemented with 1X cOmplete™ protease inhibitor cocktail and additional
protease inhibitors- PMSF, NaF and NaO. Cells were scraped, collected in an
eppendorf tube, incubated for 30 minutes on ice and centrifuged at 13000 rpm
for 30 minutes at 4 °C. The supernatant was collected in a fresh eppendorf
tube which was stored at -20 °C for short time period and at -80 °C for long-
term storage. Protein concentration was measured using Bradford reagent
following standard protocol. Different dilutions of Bovine serum albumin (BSA)
was used as the standard. The absorbance of the standards and samples were
measured at 595 nm. The absorbance value of the standards were plotted and
the coefficent was derived which was used to calculate the concentration of the
sample.
SDS PAGE and Western blot analysis
Sodium dodecyl sulfate polyacrylamide gel electrophoresis (SDS-PAGE) was
performed to separate the proteins based on their molecular weight. We used a
10 % gel to detect proteins of size larger than 30 kDa and a 15 % gel to
visualize proteins smaller than 30 kDa. To generate the polyacrylamide gels,
the plates were assembled together in the cassette. Approximately 4.5 ml
resolving gel solution was poured in the spacer within two plates and was
overlayed with stacking gel solution. 10 well comb was placed and the gel was
allowed to solidify for 30-45 minutes. Further the comb was carefully removed,
gel was placed in the electrophoresis tank and the tank was filled with running
buffer. Equal amount of proteins were incubated with SDS and heated up at 95
METHODS
46
°C for 5 minutes. These samples were loaded into the wells of the gel and the
electrophoresis was performed at 120 volts for approximately 1 hour. Once the
proteins were separated by polyacrylamide gel electrophoresis (PAGE), the
proteins on the gel were transferred onto a nitrocellulose membrane using a
TurboBlot system (fixed: 25 V and 1.0 A, time: 22 minutes for 10 % gels and 10
minutes for 15 % gels). Further, the membrane was briefly stained with
Ponceau S solution to visualize the proteins bands thereby to confirm the
blotting. The membrane was blocked using 5 % milk in TBST and incubated
with primary antibodies overnight at 4 °C. Membranes were then incubated with
respective secondary antibodies for 1 hour at room temperature. Bands were
visualized in Intas ECL Chemocam Imager using chemiluminescence.
Next generation sequencing:
ChIP seq library preparation and analysis
For ChIP-seq, ChIP was performed as described above and with antibodies
against EZH2, H3K27me3 and H3K4me3. IgG was used as a control.
Subsequently, DNA samples were sonicated in a Biorupter® Pico to obtain
approximately 300 bp fragments which were used for library preparation with
the MicroPlex Library Preparation Kit as per manufacturer’s protocol.
Sequencing was performed using the HiSeq 2000 Illumina platform of the NIG.
Subsequently, the ChIP-seq files were analyzed in the public server
(usegalaxy.org). The quality of the raw files were assessed by running FASTQ
quality check (FASTQC). After ensuring the quality of the raw data, the
sequence reads were aligned to the mouse reference genome (mm9) using
Bowtie2 (version 0.4) with default parameters (Langmead and Salzberg 2012)
and the aligned reads were saved as a BAM file. This file was used for peak
calling utilizing the Model based Analysis of ChIP-seq (MACS2 version
2.1.0.20151222) tool (Zhang et al. 2008) on UseGalaxy (usegalaxy.org) server.
The cut off value for peak detection was set to 0.05. BigWig files were
generated using BamCoverage (version 2.2.3) from deeptools (Ramírez et al.
2016) and were visualized using integrative genomics viewer (IGV version
2.5.3) (Robinson et al. 2011). Further, BigWig and bed files were used to
generate aggregate profiles and distribution of ChIP regions on chromosome
METHODS
47
using CEAS tool (Shin et al. 2009) on Galaxy cistrome. Differential binding
analysis was performed to identify differentially occupied regions in shRNA
EZH2- compared to shRNA control NKC cells using the Bioconductor R
package Diffbind (Ross-Innes et al. 2012) run on R version 3.6.1 according to
the instruction manual. Furthermore, Genomic Regions Enrichment of
Annotations Tool (GREAT) analysis (Mclean et al. 2010) was used to identify
associated genes with regions identified by Diffbind analysis. The default
association rule, basal plus extension (5 kb upstream, 1kb downstream plus
distal 1Mb), was set for GREAT analysis. Further, principle component analysis
(PCA) for the H3K27me3 and H3K4me3 profiles was plotted in R. Heatmaps
and average profiles for occupancy were generated using the computeMatrix
and plotHeatmap tools on the UseGalaxy server and peak center was set as
the reference point mode.
For analyses in PANC-1 cells, input and EZH2 ChIP-seq sequence reads were
aligned against the human reference genome (hg38) and BigWig files were
generated as described above. The input peaks were subtracted from the
EZH2 binding peaks and visualized in IGV.
RNA seq library preparation and analysis
ShRNA control and shRNA EZH2 NKC cells were cultured in triplicates and
later harvested in TRIzol. RNA was isolated by phenol-chloroform method
followed by confirming the purity and integrity on 1 % agarose gel. 500 ng of
total RNA was used to prepare libraries using True seq RNA library preparation
kit as per the manufacturer’s instructions. cDNA library concentrations and
fragment sizes were controlled by Qubit and bioanalyzer respectively prior to
sequencing in the NGS Integrative Genomics Core Unit (NIG) of the UMG. The
FastQ files from the RNA sequencing were analyzed in the public server
usegalaxy.org. The reads were aligned to the murine transcriptome mm9 using
TopHat2 (version 2.1.0) (D. Kim et al. 2013). Further, differential gene
regulation and Fragment Per Kilobase Million (FPKM) values were obtained by
Cuffdiff (version 2.2.1) and Cuffnorm (version 2.2.1.1) respectively (Trapnell et
al. 2013). The read counts obtained by HTSeq (version 0.9.1) (Anders, Pyl, and
Huber 2015) were used to plot Principal Component Analysis (PCA) in R.
Genes with FPKM of < 0.2 were excluded from the analysis to reduce
METHODS
48
background signals. Gene ontology was performed using PANTHER GO
Ontology database (Binomial test with Bonferroni correction) and pathways with
FDR < 0.05 were considered as significant pathways. GSEA was performed
using standard parameters (Signal2Noise metric for gene ranking).
H&E staining and immunohistochemistry
Upon sacrificing the mice, pancreas and liver tissue were collected in
parafolmaldehyde, dehydrated in increasing concentrations of ethanol and
further embedded in paraffin to make tissue blocks. Paraffin blocks were
sectioned into 4 µm sections and fixed on glass slides. Hematoxylin & Eosin
(H&E) stainings were performed to visualize the tissue morphology. To this end
the slides were placed in roticlear to remove the paraffin (de-waxing). Further,
the tissue sections were hydrated by placing the slides in decreasing
concentrations of ethanol (99 %, 96 %, 80 %, 70 %, 50 %). The slides were
placed in hematoxylin solution, which stains the nuclei blue, for approximately 5
minutes and then rinsed with tap water for 7 minutes. Further, the slides were
transferred to the eosin in 0.2 % acetic acid solution, which consists of a dye
that stains the cytoplasm, for approximately 10 seconds. The sections were
further dehydrated by placing in increasing concentrations of ethanol (70 %, 80
%, 96 %, 99 %) and finally in roticlear. The slides were mounted using a cover
slip and with a mounting solution and further viewed under the microscope.
For immunohistochemistry (IHC), the sections were de-waxed by placing the
slides in roticlear and further hydrated by placing in decreasing concentrations
of ethanol. Then, the slides were covered with TE/citrate buffer and boiled for 5-
10 minutes in the microwave to expose the antigens and then cooled down by
placing it on the ice. Further the sections were incubated in 3 % hydrogen
peroxide solution for 10 minutes to block the endogenous peroxidase activity.
The slides were placed in the cadenxa slide holding system and then blocked
with 10 % BSA solution prepares in PBST (containing 1 % Tween or 1 %
TritonX). The slides were then incubated overnight with the primary antibody.
The following day, slides were washed twice with PBST and incubated with the
secondary antibody for 1 hour, followed by incubating with AB complex for
another hour (performed utilizing the Peroxidase Rabbit/Mouse IgG Vectastain
METHODS
49
ABC kits). The slides were then washed with PBST and stained with DAB
solution. The reaction was stopped by placing the slides in water and further
the slides were counterstained in hematoxylin for 5 minutes. Slides were placed
under tap water for 7 minutes for the nuclei stain to develop into blue colour.
Finally, sections were dehydrated and mounted as explained for H&E stainings.
The slides were viewed under the microscope.
Tissue Microarray Analysis (TMA) in human PDAC samples
EZH2 and GATA6 stainings in TMA were provided by the Institute of Pathology,
UMG, Göttingen. TMAs were prepared from 54 resected PDAC patients with
three to four cores per patient. TMAs were evaluated for nuclear EZH2 and
GATA6 expression and were scored in accordance to the Immune Reactive
Sore (IRS). Each tissue was given a score for the percentage of positively
stained cells (A) and intensity of staining (B). Multiplying the scores of two
variables (A*B) gave a IRS ranging from 0 to 12. Tissues with IRS ≤ 3 were
considered as tissues with null or mild staining and the tissues with IRS > 3
were considered as moderate or strongly stained.
Statistical analysis
Statistical analysis was performed by Graphpad Prism (version 6.0). Data are
represented as mean ± standard deviation (SD). Fisher's exact test was used
to analyze the significance of in vivo data. Log-Rank test was used for the
survival analysis. Two-tailed unpaired student’s t-test, one-way and two-way
ANOVA were used calculate the statistical significance of in vitro data
(described in each figure legend). p value of < 0.05 was considered as
statistically significant. p- values < 0.05, < 0.01 and < 0.001 are depicted as *,
** and ***, respectively.

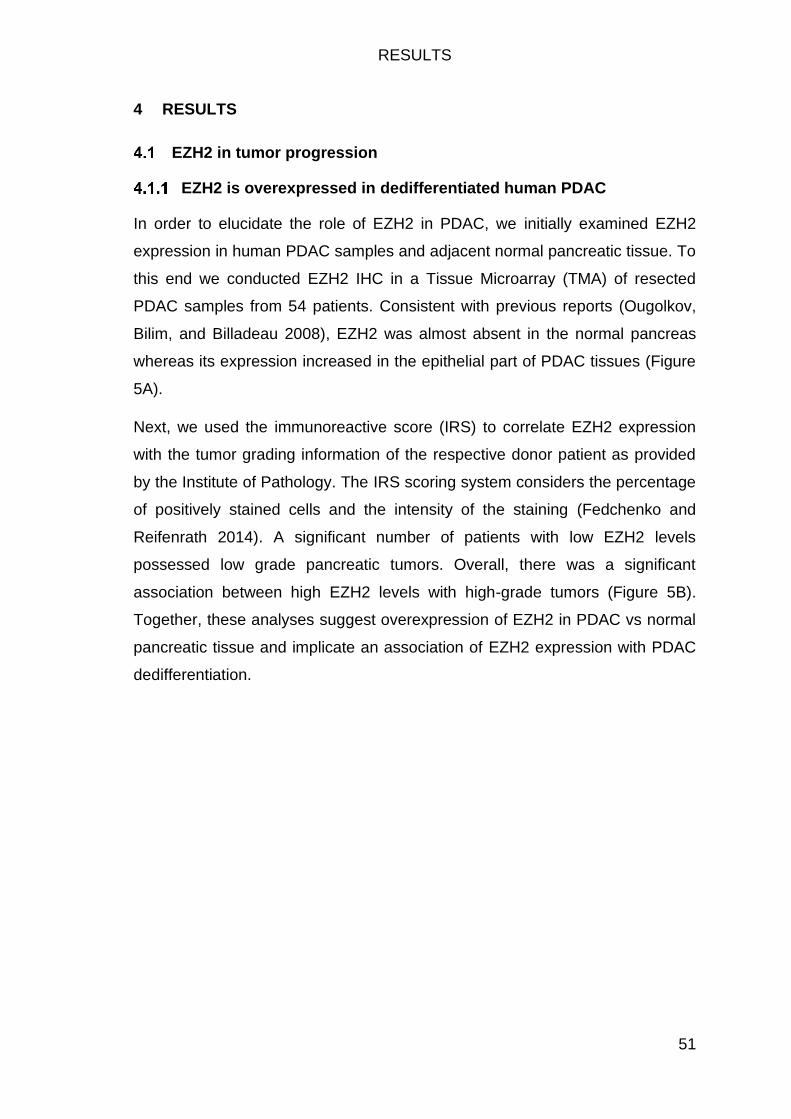
RESULTS
51
4 RESULTS
EZH2 in tumor progression
EZH2 is overexpressed in dedifferentiated human PDAC
In order to elucidate the role of EZH2 in PDAC, we initially examined EZH2
expression in human PDAC samples and adjacent normal pancreatic tissue. To
this end we conducted EZH2 IHC in a Tissue Microarray (TMA) of resected
PDAC samples from 54 patients. Consistent with previous reports (Ougolkov,
Bilim, and Billadeau 2008), EZH2 was almost absent in the normal pancreas
whereas its expression increased in the epithelial part of PDAC tissues (Figure
5A).
Next, we used the immunoreactive score (IRS) to correlate EZH2 expression
with the tumor grading information of the respective donor patient as provided
by the Institute of Pathology. The IRS scoring system considers the percentage
of positively stained cells and the intensity of the staining (Fedchenko and
Reifenrath 2014). A significant number of patients with low EZH2 levels
possessed low grade pancreatic tumors. Overall, there was a significant
association between high EZH2 levels with high-grade tumors (Figure 5B).
Together, these analyses suggest overexpression of EZH2 in PDAC vs normal
pancreatic tissue and implicate an association of EZH2 expression with PDAC
dedifferentiation.
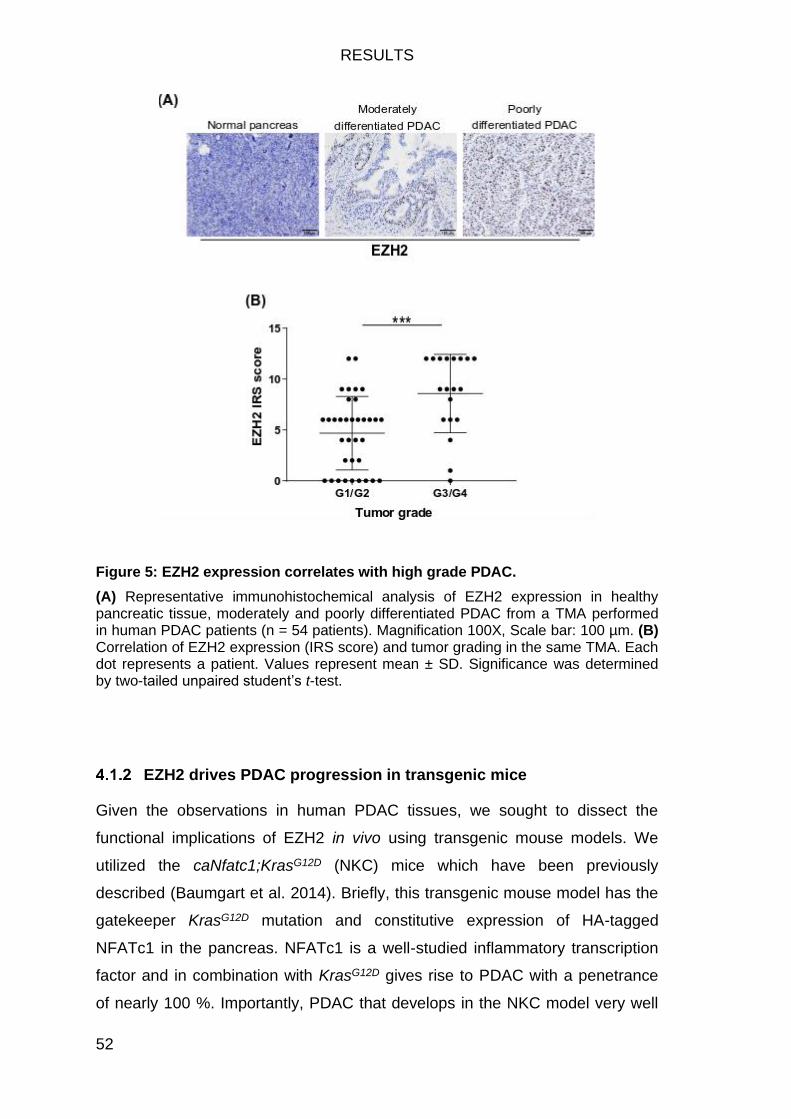
RESULTS
52
Figure 5: EZH2 expression correlates with high grade PDAC.
(A) Representative immunohistochemical analysis of EZH2 expression in healthy pancreatic tissue, moderately and poorly differentiated PDAC from a TMA performed in human PDAC patients (n = 54 patients). Magnification 100X, Scale bar: 100 µm. (B) Correlation of EZH2 expression (IRS score) and tumor grading in the same TMA. Each dot represents a patient. Values represent mean ± SD. Significance was determined by two-tailed unpaired student’s t-test.
EZH2 drives PDAC progression in transgenic mice
Given the observations in human PDAC tissues, we sought to dissect the
functional implications of EZH2 in vivo using transgenic mouse models. We
utilized the caNfatc1;KrasG12D (NKC) mice which have been previously
described (Baumgart et al. 2014). Briefly, this transgenic mouse model has the
gatekeeper KrasG12D mutation and constitutive expression of HA-tagged
NFATc1 in the pancreas. NFATc1 is a well-studied inflammatory transcription
factor and in combination with KrasG12D gives rise to PDAC with a penetrance
of nearly 100 %. Importantly, PDAC that develops in the NKC model very well
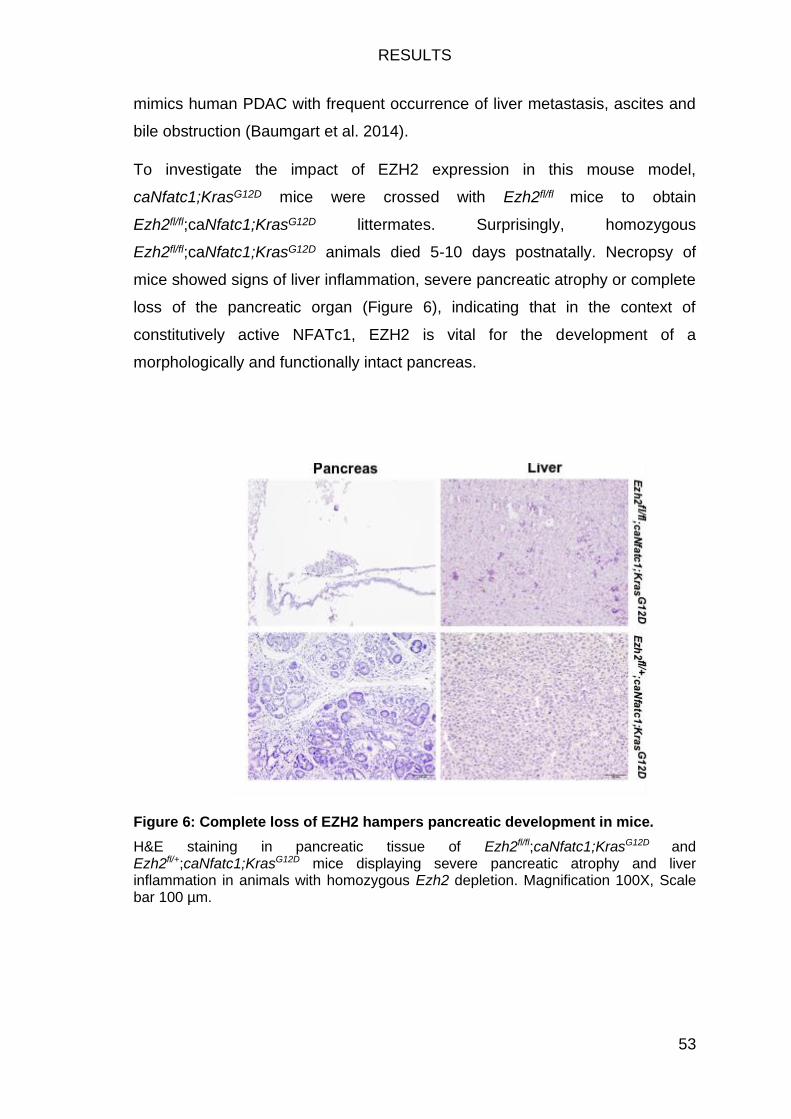
RESULTS
53
mimics human PDAC with frequent occurrence of liver metastasis, ascites and
bile obstruction (Baumgart et al. 2014).
To investigate the impact of EZH2 expression in this mouse model,
caNfatc1;KrasG12D mice were crossed with Ezh2fl/fl mice to obtain
Ezh2fl/fl;caNfatc1;KrasG12D littermates. Surprisingly, homozygous
Ezh2fl/fl;caNfatc1;KrasG12D animals died 5-10 days postnatally. Necropsy of
mice showed signs of liver inflammation, severe pancreatic atrophy or complete
loss of the pancreatic organ (Figure 6), indicating that in the context of
constitutively active NFATc1, EZH2 is vital for the development of a
morphologically and functionally intact pancreas.
Figure 6: Complete loss of EZH2 hampers pancreatic development in mice.
H&E staining in pancreatic tissue of Ezh2fl/fl;caNfatc1;KrasG12D and Ezh2fl/+;caNfatc1;KrasG12D mice displaying severe pancreatic atrophy and liver inflammation in animals with homozygous Ezh2 depletion. Magnification 100X, Scale bar 100 µm.
RESULTS
54
As the homozygous Ezh2 knockout mice could not be used for the study, we
interbred Ezh2fl/fl;caNfatc1;KrasG12D mice with Ezh2+l+ (wildtype) animals to
obtain Ezh2fl/+;caNfatc1;KrasG12D mice with heterozygous EZH2 expression.
Both caNfatc1;KrasG12D and Ezh2fl/+;caNfatc1;KrasG12D (ENKC) mice gave rise
to all steps of pancreatic carcinogenesis. ADM and PanIN lesions were
observed in caNfatc1;KrasG12D mice as soon as 2 weeks after birth. While most
of the 8 week old mice displayed the full PanIN PDAC precursor lesions, nearly
all 7 month old animals suffered from PDAC. The pancreas of 8 week old
Ezh2fl/+;caNfatc1;KrasG12D animals displayed ADMs and PanIN precursor
lesions and few of these mice developed PDAC.
The ADM, PanIN lesions and PDAC of caNfatc1;KrasG12D and
Ezh2fl/+;caNfatc1;KrasG12D mice were subjected to various
immunohistochemical analyses. As this mouse model has overexpression of
HA-tagged NFATc1, tissues were stained for HA-tag thereby validating the
expression of NFATc1 and to distinguish epithelial- from non-epithelial tissue
parts. Consistent with the observations in human pancreatic cancer tissues,
EZH2 was nearly absent in acinar cells but showed increased expression and
activity (as illustrated by H3K27me3 staining) in PDAC precursor lesions and
established tumors. Interestingly, PDAC developing in
Ezh2fl/+;caNfatc1;KrasG12D mice were overall more differentiated than the
tumors in caNfatc1;KrasG12D mice (Figure 7), suggesting that EZH2 promotes
dedifferentiation in these mice.
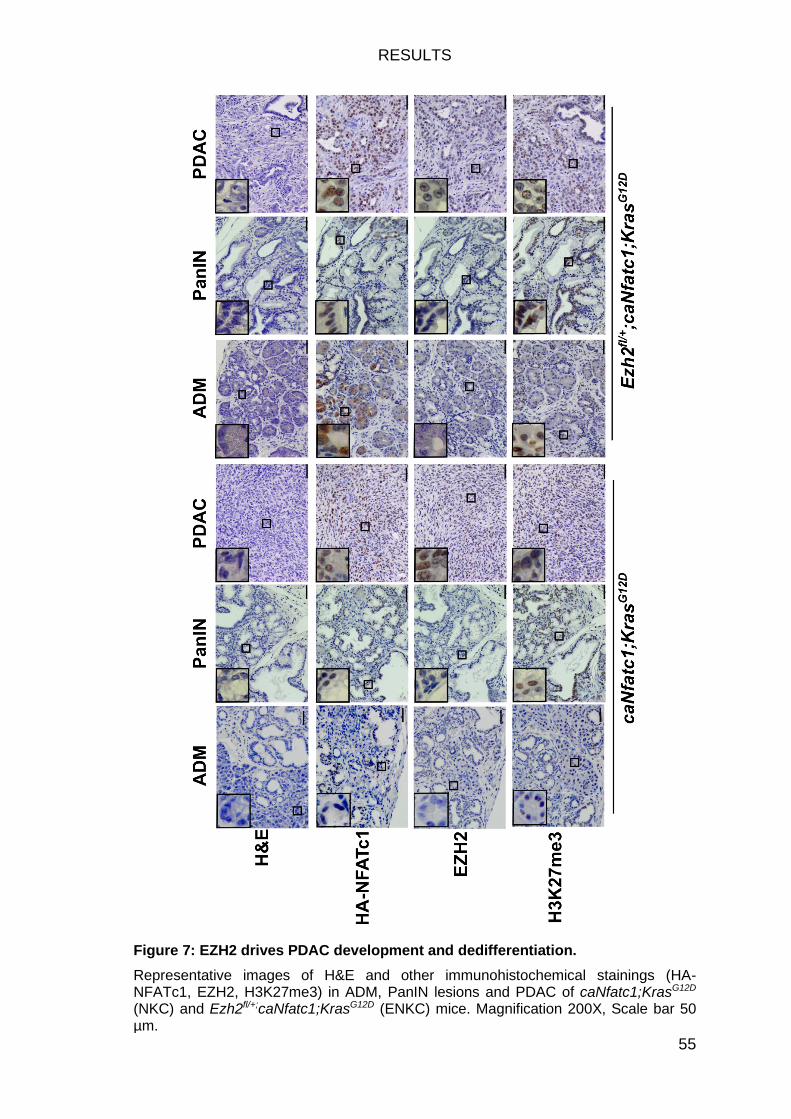
RESULTS
55
Figure 7: EZH2 drives PDAC development and dedifferentiation.
Representative images of H&E and other immunohistochemical stainings (HA-NFATc1, EZH2, H3K27me3) in ADM, PanIN lesions and PDAC of caNfatc1;KrasG12D (NKC) and Ezh2fl/+;caNfatc1;KrasG12D (ENKC) mice. Magnification 200X, Scale bar 50 µm.
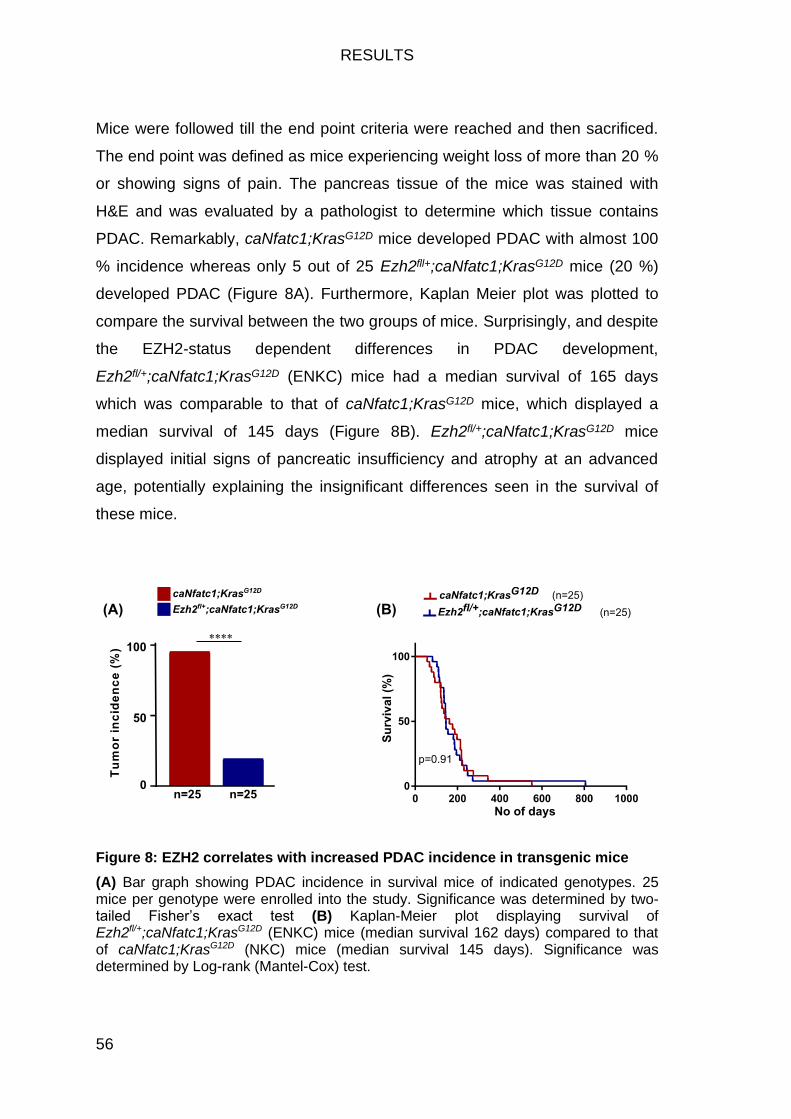
RESULTS
56
Mice were followed till the end point criteria were reached and then sacrificed.
The end point was defined as mice experiencing weight loss of more than 20 %
or showing signs of pain. The pancreas tissue of the mice was stained with
H&E and was evaluated by a pathologist to determine which tissue contains
PDAC. Remarkably, caNfatc1;KrasG12D mice developed PDAC with almost 100
% incidence whereas only 5 out of 25 Ezh2fll+;caNfatc1;KrasG12D mice (20 %)
developed PDAC (Figure 8A). Furthermore, Kaplan Meier plot was plotted to
compare the survival between the two groups of mice. Surprisingly, and despite
the EZH2-status dependent differences in PDAC development,
Ezh2fl/+;caNfatc1;KrasG12D (ENKC) mice had a median survival of 165 days
which was comparable to that of caNfatc1;KrasG12D mice, which displayed a
median survival of 145 days (Figure 8B). Ezh2fl/+;caNfatc1;KrasG12D mice
displayed initial signs of pancreatic insufficiency and atrophy at an advanced
age, potentially explaining the insignificant differences seen in the survival of
these mice.
Figure 8: EZH2 correlates with increased PDAC incidence in transgenic mice
(A) Bar graph showing PDAC incidence in survival mice of indicated genotypes. 25 mice per genotype were enrolled into the study. Significance was determined by two-tailed Fisher’s exact test (B) Kaplan-Meier plot displaying survival of Ezh2fl/+;caNfatc1;KrasG12D (ENKC) mice (median survival 162 days) compared to that of caNfatc1;KrasG12D (NKC) mice (median survival 145 days). Significance was determined by Log-rank (Mantel-Cox) test.
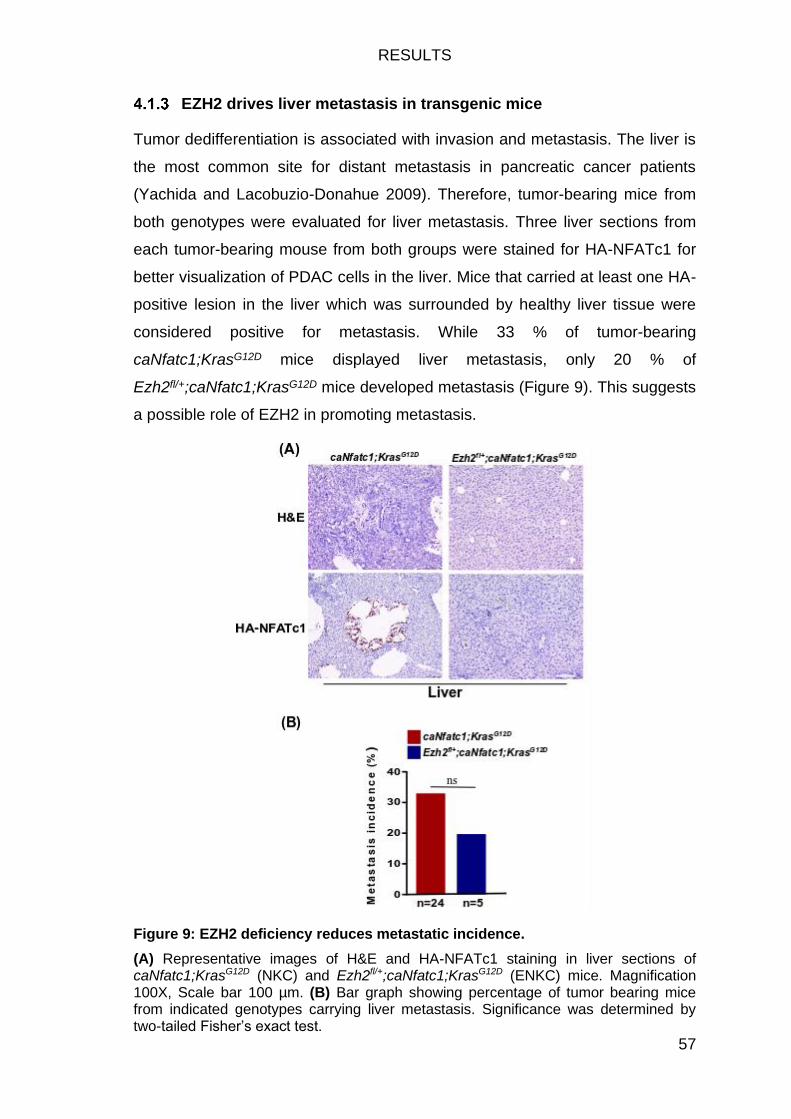
RESULTS
57
EZH2 drives liver metastasis in transgenic mice
Tumor dedifferentiation is associated with invasion and metastasis. The liver is
the most common site for distant metastasis in pancreatic cancer patients
(Yachida and Lacobuzio-Donahue 2009). Therefore, tumor-bearing mice from
both genotypes were evaluated for liver metastasis. Three liver sections from
each tumor-bearing mouse from both groups were stained for HA-NFATc1 for
better visualization of PDAC cells in the liver. Mice that carried at least one HA-
positive lesion in the liver which was surrounded by healthy liver tissue were
considered positive for metastasis. While 33 % of tumor-bearing
caNfatc1;KrasG12D mice displayed liver metastasis, only 20 % of
Ezh2fl/+;caNfatc1;KrasG12D mice developed metastasis (Figure 9). This suggests
a possible role of EZH2 in promoting metastasis.
Figure 9: EZH2 deficiency reduces metastatic incidence.
(A) Representative images of H&E and HA-NFATc1 staining in liver sections of caNfatc1;KrasG12D (NKC) and Ezh2fl/+;caNfatc1;KrasG12D (ENKC) mice. Magnification 100X, Scale bar 100 µm. (B) Bar graph showing percentage of tumor bearing mice from indicated genotypes carrying liver metastasis. Significance was determined by two-tailed Fisher’s exact test.
RESULTS
58
Together, these results in human PDAC samples and transgenic mouse
models suggest a critical involvement of EZH2 in driving tumor progression and
dedifferentiation towards a highly aggressive PDAC phenotype.
Functional implications of EZH2 in PDAC cells
To delineate the functional implications of EZH2 in PDAC maintenance, we
isolated pancreatic tumors from the EZH2-expressing caNfatc1;KrasG12D mice
and further harvested primary PDAC cells (NKC cells) from the tumor
(Baumgart et al. 2014). NKC cells were subjected to shRNA mediated
knockdown of EZH2 to generate stable EZH2 knockdown NKC cells (Figure
10A). The western blot confirms the reduction in EZH2 expression and
subsequent decrease in H3K27me3 levels upon EZH2 knockdown (Figure
10B). The shRNA control and shRNA EZH2 NKC cells were utilized to perform
various functional assays.
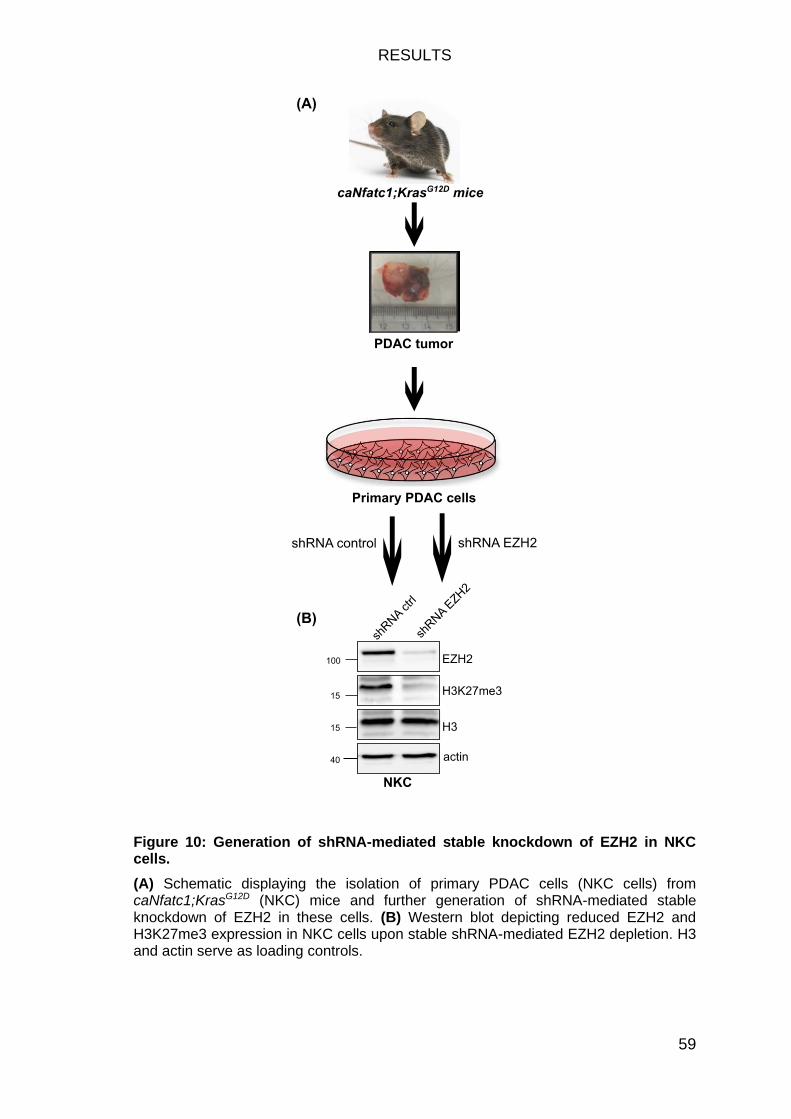
RESULTS
59
Figure 10: Generation of shRNA-mediated stable knockdown of EZH2 in NKC cells.
(A) Schematic displaying the isolation of primary PDAC cells (NKC cells) from caNfatc1;KrasG12D (NKC) mice and further generation of shRNA-mediated stable knockdown of EZH2 in these cells. (B) Western blot depicting reduced EZH2 and H3K27me3 expression in NKC cells upon stable shRNA-mediated EZH2 depletion. H3 and actin serve as loading controls.
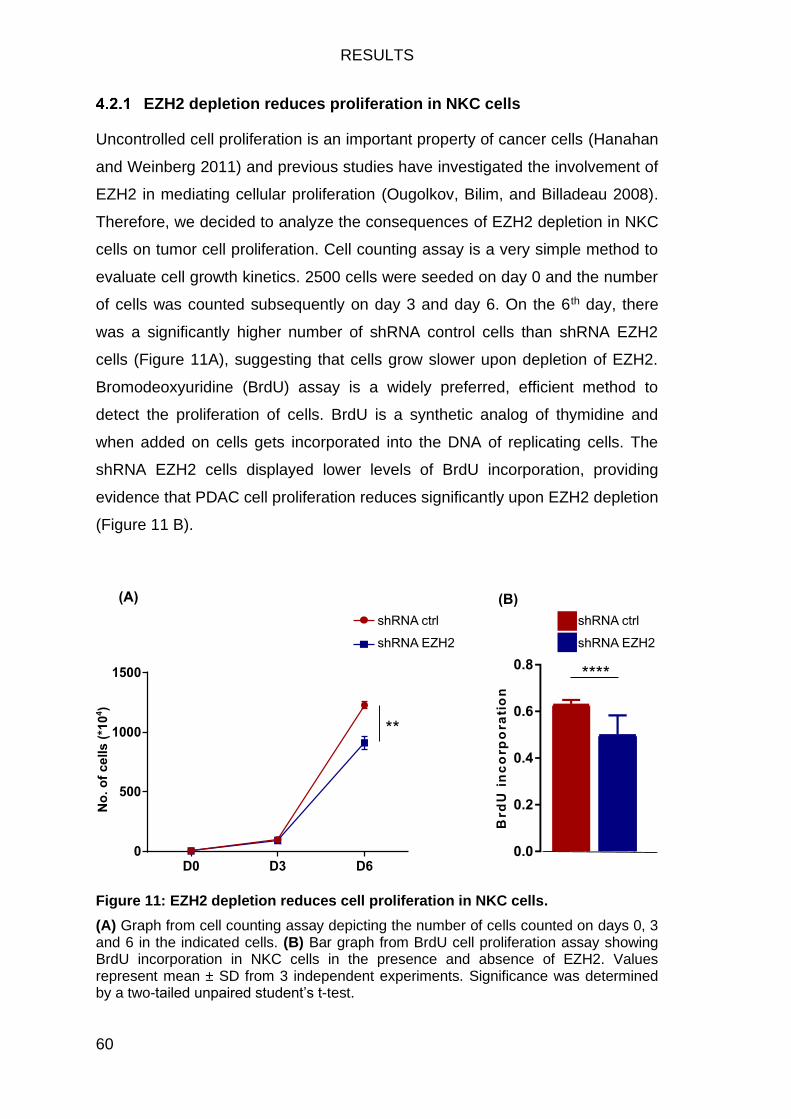
RESULTS
60
EZH2 depletion reduces proliferation in NKC cells
Uncontrolled cell proliferation is an important property of cancer cells (Hanahan
and Weinberg 2011) and previous studies have investigated the involvement of
EZH2 in mediating cellular proliferation (Ougolkov, Bilim, and Billadeau 2008).
Therefore, we decided to analyze the consequences of EZH2 depletion in NKC
cells on tumor cell proliferation. Cell counting assay is a very simple method to
evaluate cell growth kinetics. 2500 cells were seeded on day 0 and the number
of cells was counted subsequently on day 3 and day 6. On the 6th day, there
was a significantly higher number of shRNA control cells than shRNA EZH2
cells (Figure 11A), suggesting that cells grow slower upon depletion of EZH2.
Bromodeoxyuridine (BrdU) assay is a widely preferred, efficient method to
detect the proliferation of cells. BrdU is a synthetic analog of thymidine and
when added on cells gets incorporated into the DNA of replicating cells. The
shRNA EZH2 cells displayed lower levels of BrdU incorporation, providing
evidence that PDAC cell proliferation reduces significantly upon EZH2 depletion
(Figure 11 B).
Figure 11: EZH2 depletion reduces cell proliferation in NKC cells.
(A) Graph from cell counting assay depicting the number of cells counted on days 0, 3 and 6 in the indicated cells. (B) Bar graph from BrdU cell proliferation assay showing BrdU incorporation in NKC cells in the presence and absence of EZH2. Values represent mean ± SD from 3 independent experiments. Significance was determined by a two-tailed unpaired student’s t-test.
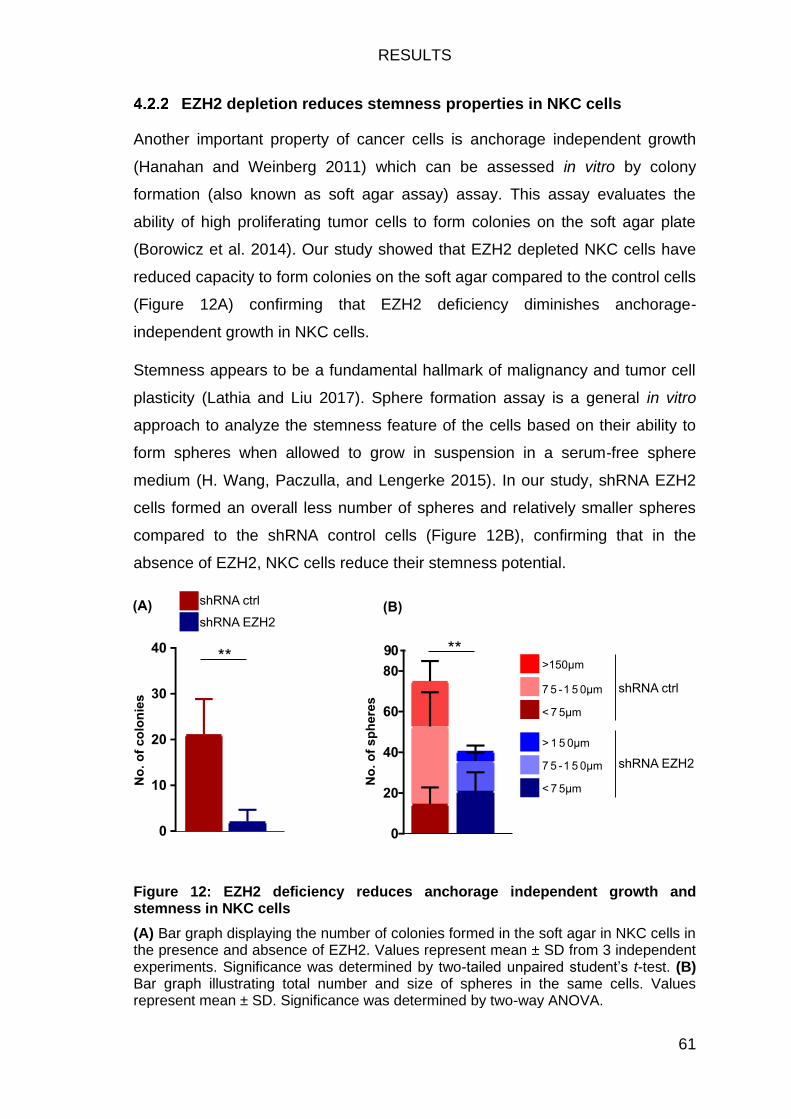
RESULTS
61
EZH2 depletion reduces stemness properties in NKC cells
Another important property of cancer cells is anchorage independent growth
(Hanahan and Weinberg 2011) which can be assessed in vitro by colony
formation (also known as soft agar assay) assay. This assay evaluates the
ability of high proliferating tumor cells to form colonies on the soft agar plate
(Borowicz et al. 2014). Our study showed that EZH2 depleted NKC cells have
reduced capacity to form colonies on the soft agar compared to the control cells
(Figure 12A) confirming that EZH2 deficiency diminishes anchorage-
independent growth in NKC cells.
Stemness appears to be a fundamental hallmark of malignancy and tumor cell
plasticity (Lathia and Liu 2017). Sphere formation assay is a general in vitro
approach to analyze the stemness feature of the cells based on their ability to
form spheres when allowed to grow in suspension in a serum-free sphere
medium (H. Wang, Paczulla, and Lengerke 2015). In our study, shRNA EZH2
cells formed an overall less number of spheres and relatively smaller spheres
compared to the shRNA control cells (Figure 12B), confirming that in the
absence of EZH2, NKC cells reduce their stemness potential.
Figure 12: EZH2 deficiency reduces anchorage independent growth and stemness in NKC cells
(A) Bar graph displaying the number of colonies formed in the soft agar in NKC cells in the presence and absence of EZH2. Values represent mean ± SD from 3 independent experiments. Significance was determined by two-tailed unpaired student’s t-test. (B) Bar graph illustrating total number and size of spheres in the same cells. Values represent mean ± SD. Significance was determined by two-way ANOVA.
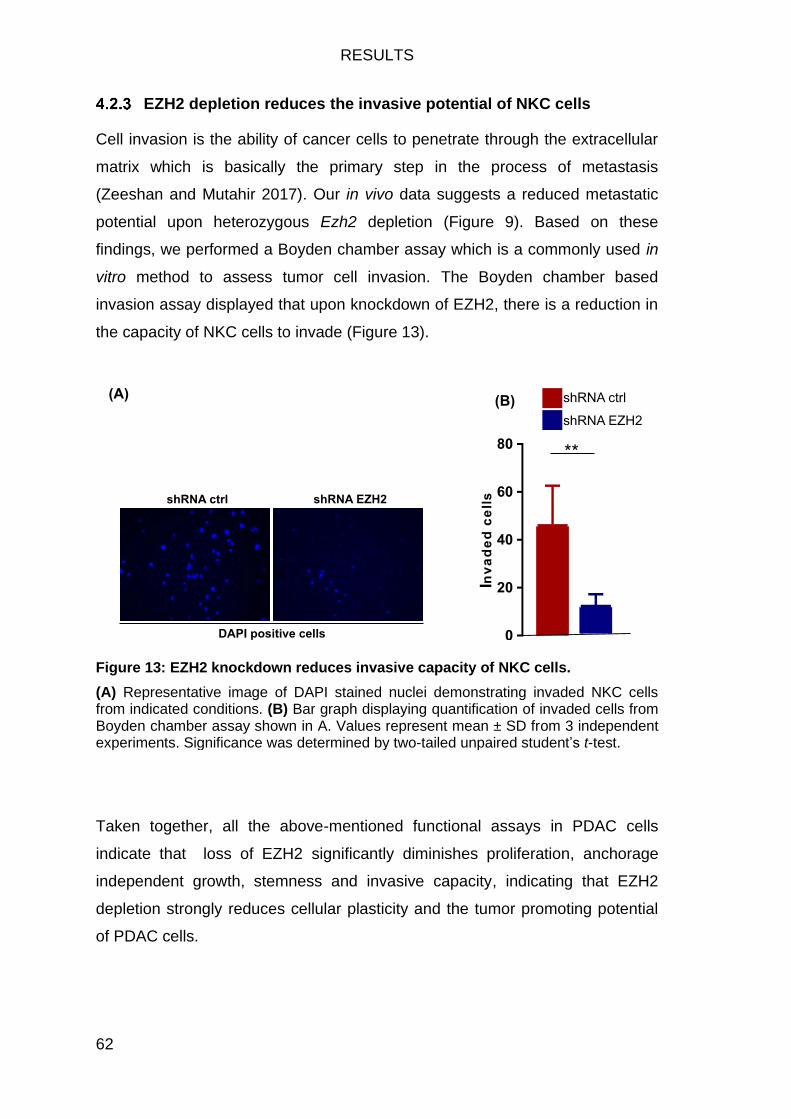
RESULTS
62
EZH2 depletion reduces the invasive potential of NKC cells
Cell invasion is the ability of cancer cells to penetrate through the extracellular
matrix which is basically the primary step in the process of metastasis
(Zeeshan and Mutahir 2017). Our in vivo data suggests a reduced metastatic
potential upon heterozygous Ezh2 depletion (Figure 9). Based on these
findings, we performed a Boyden chamber assay which is a commonly used in
vitro method to assess tumor cell invasion. The Boyden chamber based
invasion assay displayed that upon knockdown of EZH2, there is a reduction in
the capacity of NKC cells to invade (Figure 13).
Figure 13: EZH2 knockdown reduces invasive capacity of NKC cells.
(A) Representative image of DAPI stained nuclei demonstrating invaded NKC cells from indicated conditions. (B) Bar graph displaying quantification of invaded cells from Boyden chamber assay shown in A. Values represent mean ± SD from 3 independent experiments. Significance was determined by two-tailed unpaired student’s t-test.
Taken together, all the above-mentioned functional assays in PDAC cells
indicate that loss of EZH2 significantly diminishes proliferation, anchorage
independent growth, stemness and invasive capacity, indicating that EZH2
depletion strongly reduces cellular plasticity and the tumor promoting potential
of PDAC cells.
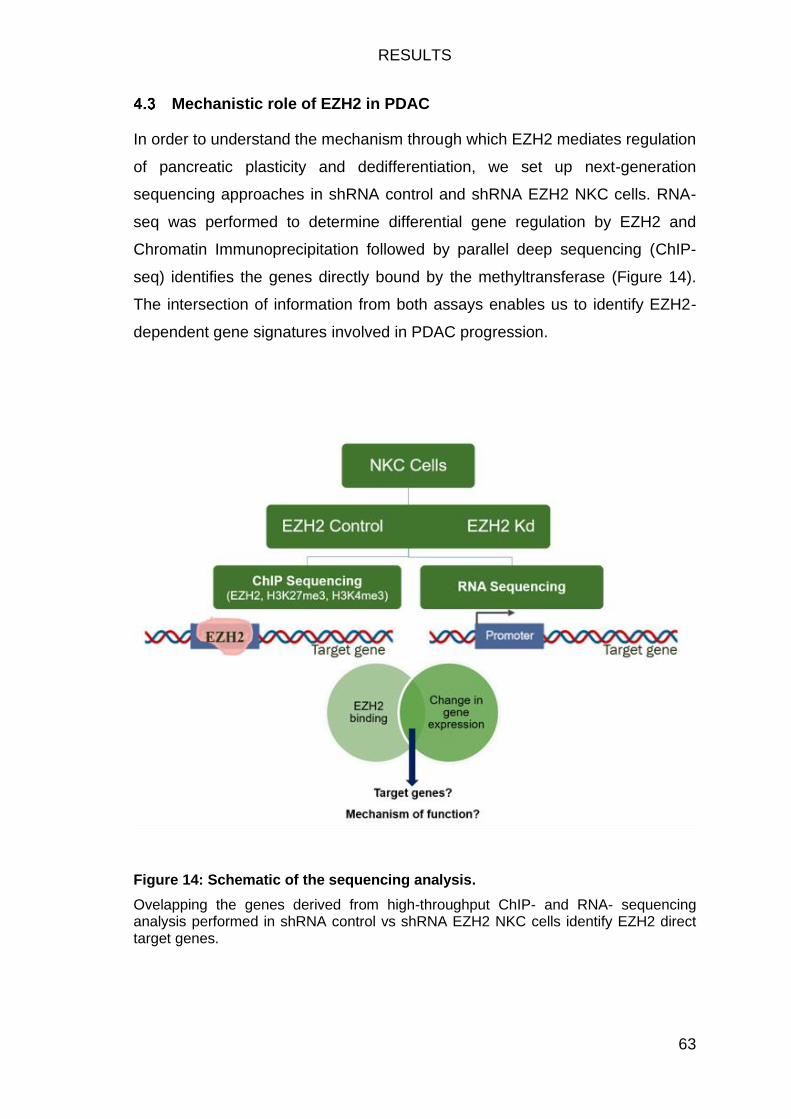
RESULTS
63
Mechanistic role of EZH2 in PDAC
In order to understand the mechanism through which EZH2 mediates regulation
of pancreatic plasticity and dedifferentiation, we set up next-generation
sequencing approaches in shRNA control and shRNA EZH2 NKC cells. RNA-
seq was performed to determine differential gene regulation by EZH2 and
Chromatin Immunoprecipitation followed by parallel deep sequencing (ChIP-
seq) identifies the genes directly bound by the methyltransferase (Figure 14).
The intersection of information from both assays enables us to identify EZH2-
dependent gene signatures involved in PDAC progression.
Figure 14: Schematic of the sequencing analysis.
Ovelapping the genes derived from high-throughput ChIP- and RNA- sequencing analysis performed in shRNA control vs shRNA EZH2 NKC cells identify EZH2 direct target genes.
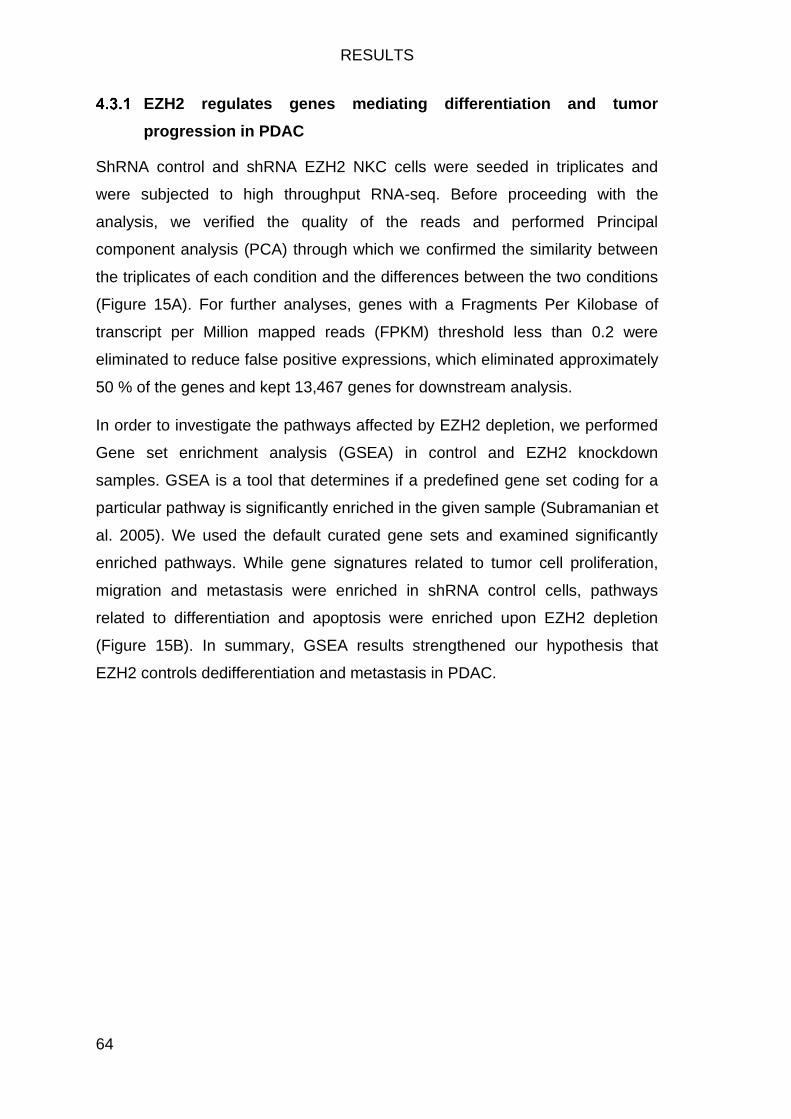
RESULTS
64
EZH2 regulates genes mediating differentiation and tumor
progression in PDAC
ShRNA control and shRNA EZH2 NKC cells were seeded in triplicates and
were subjected to high throughput RNA-seq. Before proceeding with the
analysis, we verified the quality of the reads and performed Principal
component analysis (PCA) through which we confirmed the similarity between
the triplicates of each condition and the differences between the two conditions
(Figure 15A). For further analyses, genes with a Fragments Per Kilobase of
transcript per Million mapped reads (FPKM) threshold less than 0.2 were
eliminated to reduce false positive expressions, which eliminated approximately
50 % of the genes and kept 13,467 genes for downstream analysis.
In order to investigate the pathways affected by EZH2 depletion, we performed
Gene set enrichment analysis (GSEA) in control and EZH2 knockdown
samples. GSEA is a tool that determines if a predefined gene set coding for a
particular pathway is significantly enriched in the given sample (Subramanian et
al. 2005). We used the default curated gene sets and examined significantly
enriched pathways. While gene signatures related to tumor cell proliferation,
migration and metastasis were enriched in shRNA control cells, pathways
related to differentiation and apoptosis were enriched upon EZH2 depletion
(Figure 15B). In summary, GSEA results strengthened our hypothesis that
EZH2 controls dedifferentiation and metastasis in PDAC.
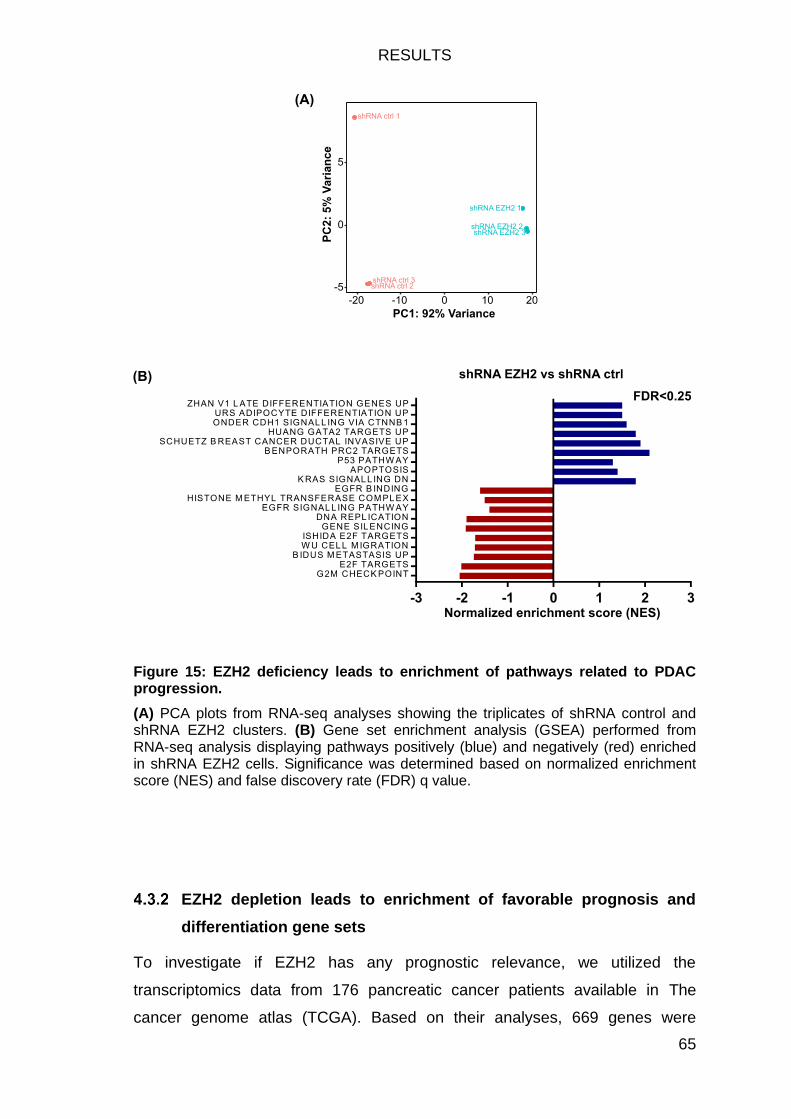
RESULTS
65
Figure 15: EZH2 deficiency leads to enrichment of pathways related to PDAC progression.
(A) PCA plots from RNA-seq analyses showing the triplicates of shRNA control and shRNA EZH2 clusters. (B) Gene set enrichment analysis (GSEA) performed from RNA-seq analysis displaying pathways positively (blue) and negatively (red) enriched in shRNA EZH2 cells. Significance was determined based on normalized enrichment score (NES) and false discovery rate (FDR) q value.
EZH2 depletion leads to enrichment of favorable prognosis and
differentiation gene sets
To investigate if EZH2 has any prognostic relevance, we utilized the
transcriptomics data from 176 pancreatic cancer patients available in The
cancer genome atlas (TCGA). Based on their analyses, 669 genes were
RESULTS
66
classified as unfavorable prognosis genes and 857 genes were identified as
favorable prognosis genes in PDAC (Cancer Genome Atlas Research Network
et al. 2013). High expression of favorable genes at diagnosis indicated better
overall survival whereas increased expression of unfavorable genes indicated
lower survival of PDAC patients. We performed GSEA on our genome-wide
expression data using these prognostic gene sets. There was a positive
enrichment of genes associated with favorable prognosis in the context of
EZH2 deficiency, supporting that depleting EZH2 enables a better prognosis
(Figure 16A).
Figure 16: EZH2 depletion mediates better prognosis and cell differentiation programs.
GSEA performed from RNA-seq analysis illustrating enrichment of (A) PDAC favorable prognosis gene set (B) cell differentiation gene set and (C) stem cell differentiation gene set upon EZH2 depletion. Significance was determined based on NES and FDR q value.
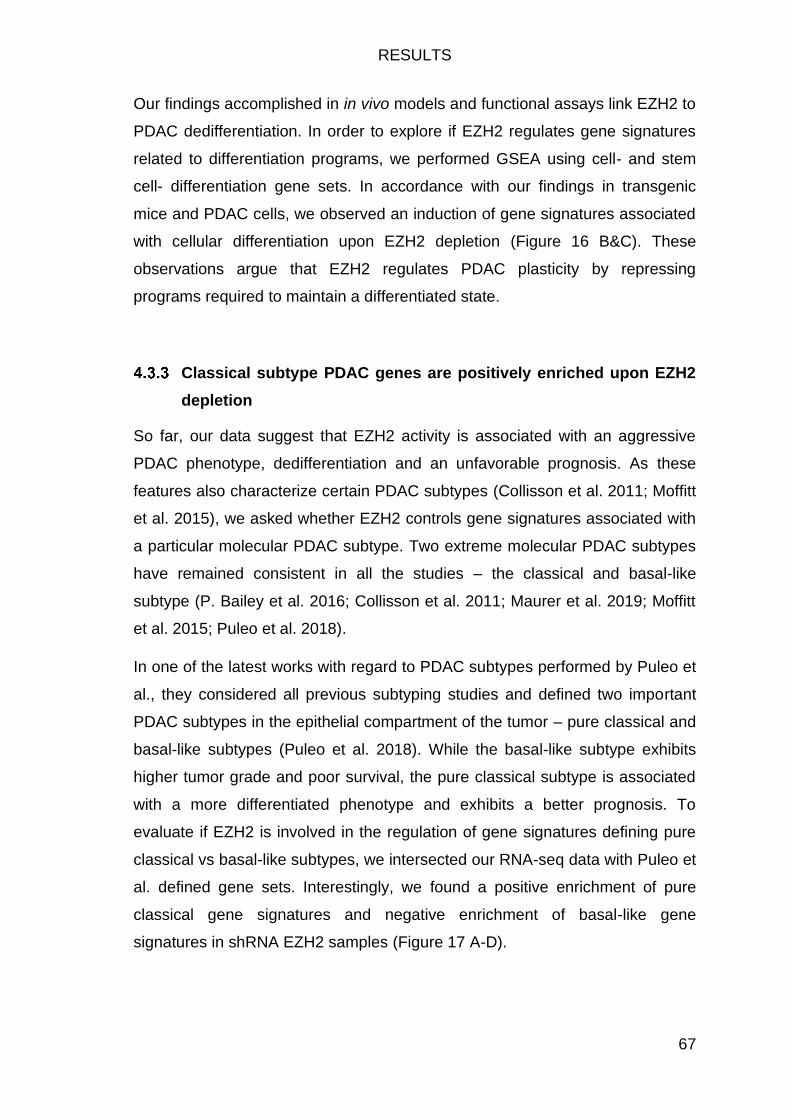
RESULTS
67
Our findings accomplished in in vivo models and functional assays link EZH2 to
PDAC dedifferentiation. In order to explore if EZH2 regulates gene signatures
related to differentiation programs, we performed GSEA using cell- and stem
cell- differentiation gene sets. In accordance with our findings in transgenic
mice and PDAC cells, we observed an induction of gene signatures associated
with cellular differentiation upon EZH2 depletion (Figure 16 B&C). These
observations argue that EZH2 regulates PDAC plasticity by repressing
programs required to maintain a differentiated state.
Classical subtype PDAC genes are positively enriched upon EZH2
depletion
So far, our data suggest that EZH2 activity is associated with an aggressive
PDAC phenotype, dedifferentiation and an unfavorable prognosis. As these
features also characterize certain PDAC subtypes (Collisson et al. 2011; Moffitt
et al. 2015), we asked whether EZH2 controls gene signatures associated with
a particular molecular PDAC subtype. Two extreme molecular PDAC subtypes
have remained consistent in all the studies – the classical and basal-like
subtype (P. Bailey et al. 2016; Collisson et al. 2011; Maurer et al. 2019; Moffitt
et al. 2015; Puleo et al. 2018).
In one of the latest works with regard to PDAC subtypes performed by Puleo et
al., they considered all previous subtyping studies and defined two important
PDAC subtypes in the epithelial compartment of the tumor – pure classical and
basal-like subtypes (Puleo et al. 2018). While the basal-like subtype exhibits
higher tumor grade and poor survival, the pure classical subtype is associated
with a more differentiated phenotype and exhibits a better prognosis. To
evaluate if EZH2 is involved in the regulation of gene signatures defining pure
classical vs basal-like subtypes, we intersected our RNA-seq data with Puleo et
al. defined gene sets. Interestingly, we found a positive enrichment of pure
classical gene signatures and negative enrichment of basal-like gene
signatures in shRNA EZH2 samples (Figure 17 A-D).
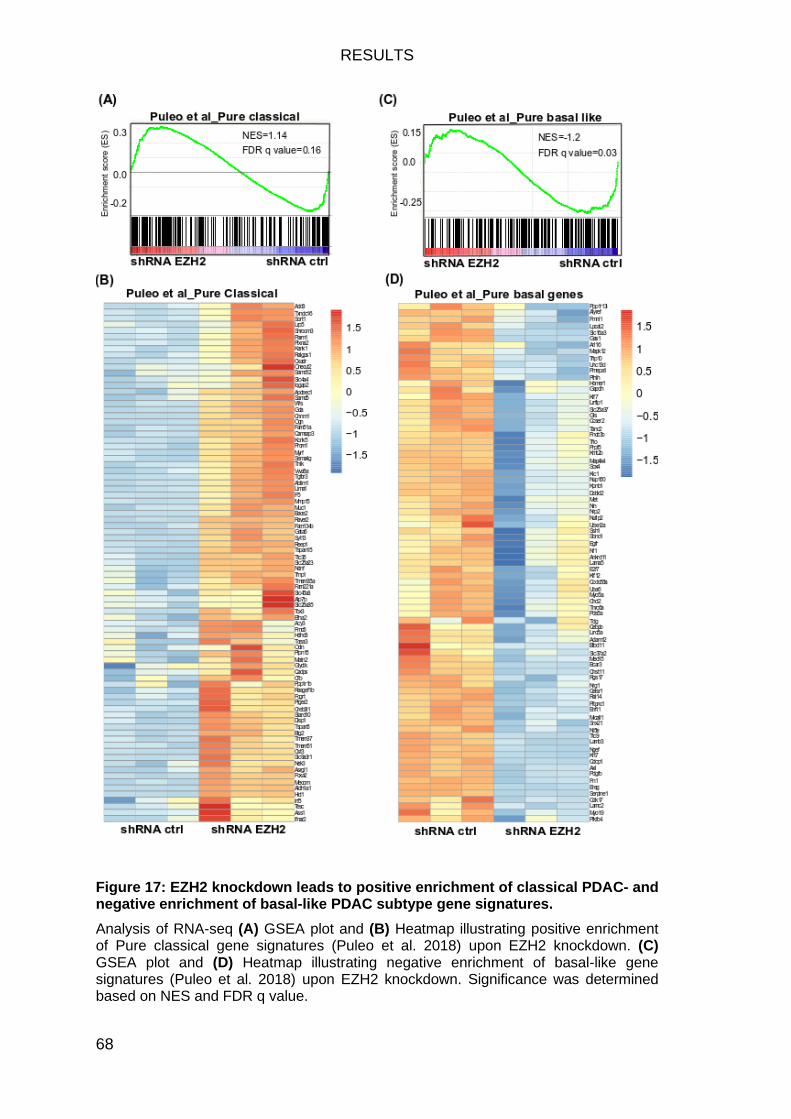
RESULTS
68
Figure 17: EZH2 knockdown leads to positive enrichment of classical PDAC- and negative enrichment of basal-like PDAC subtype gene signatures.
Analysis of RNA-seq (A) GSEA plot and (B) Heatmap illustrating positive enrichment of Pure classical gene signatures (Puleo et al. 2018) upon EZH2 knockdown. (C) GSEA plot and (D) Heatmap illustrating negative enrichment of basal-like gene signatures (Puleo et al. 2018) upon EZH2 knockdown. Significance was determined based on NES and FDR q value.
RESULTS
69
Importantly, molecular PDAC subtypes not only display distinct histological
features and prognostic implications, they also exhibit diverse metabolic
profiles. Indeed, Daemen et al. have identified two extreme metabolic profiles
which strongly associate with the classical and basal-like subtypes (Daemen et
al. 2015). While the lipogenic subtype that consists of genes associated with
lipogenesis is strongly associated with classical PDAC, the glycolytic subtype
which comprises genes involved in glycolysis correlates with basal PDAC gene
signatures (Daemen et al. 2015). In line with the aforementioned enrichment of
classical gene signatures in shEZH2 cells, GSEA using these metabolic gene
sets revealed that lipogenic gene signatures are enriched in the context of
EZH2 deficiency (Figure 18). This data further strengthens the observation that
EZH2 depletion is associated with a less aggressive classical PDAC subtype.
Figure 18: EZH2 knockdown leads to enrichment of lipogenic subtype gene signatures.
Analysis of RNA-seq: GSEA plot depicting enrichment of lipogenic gene signatures in shRNA EZH2 condition. Significance was determined based on NES and FDR q value.
EZH2 binds largely on TSS/promoter sites of its target genes
The transcriptomics data supported the hypothesis that EZH2 regulates
differentiation-associated gene signatures and pathways. To further elucidate
the mechanistic background of oncogenic EZH2 activity in PDAC and to identify
target genes directly bound by EZH2, we performed genome-wide binding
analysis by ChIP-seq. To this end, shRNA control and shRNA EZH2 NKC cells
RESULTS
70
were seeded in triplicates and subjected to ChIP-seq. ChIP-seq with an
antibody recognizing EZH2 was performed in shRNA control cells to identify the
genes occupied by EZH2. Firstly, we analyzed the location on the genome
where EZH2 majorly binds. We assessed the enrichment of EZH2 binding at
different genomic regions like promoter, introns, exon etc. using Cis-regulatory
Element Annotation System (CEAS). CEAS is a tool that enables the
visualization of relative ChIP enrichment at important genomic locations
compared to the whole genome (Shin et al. 2009). The CEAS analysis of EZH2
ChIP-seq revealed that most of the EZH2 binding regions were confined to the
TSS/Promoter of the genes (17.1 %) compared to whole-genome (1.1 %)
(Figure 19A). Additionally, GREAT analysis also validated the genome-wide
EZH2 occupancy predominantly near the TSS of target genes (Figure 19B).
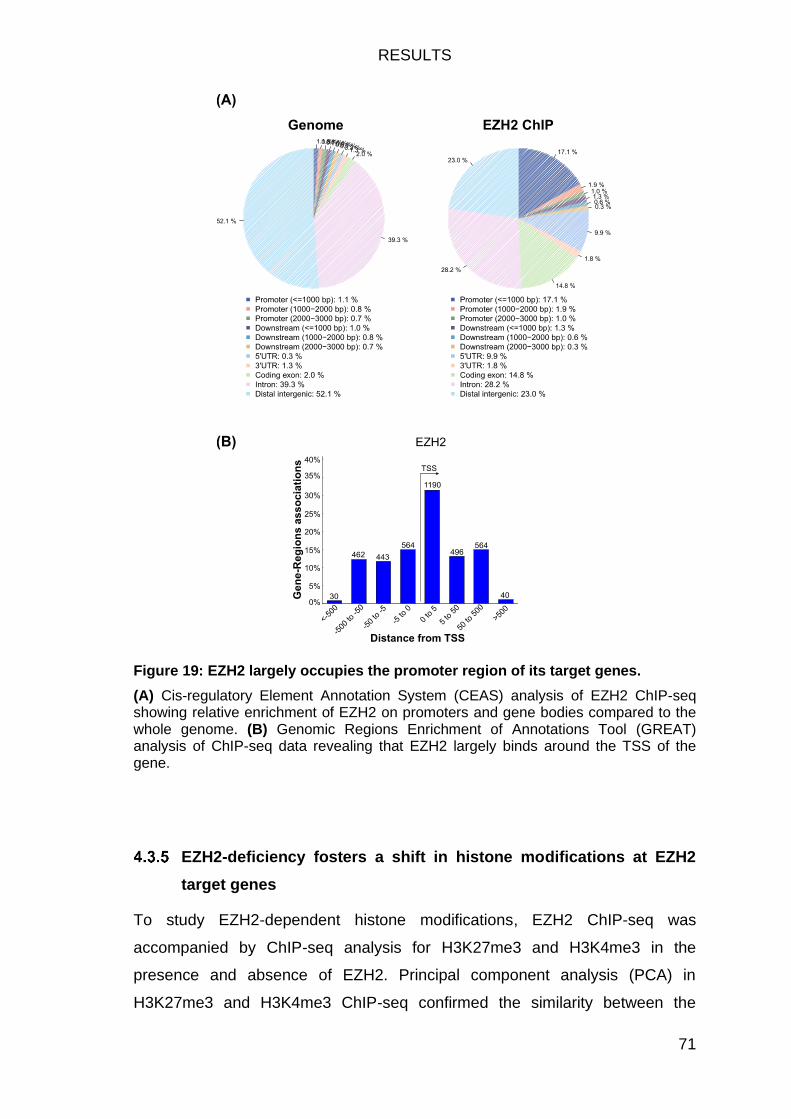
RESULTS
71
Figure 19: EZH2 largely occupies the promoter region of its target genes.
(A) Cis-regulatory Element Annotation System (CEAS) analysis of EZH2 ChIP-seq showing relative enrichment of EZH2 on promoters and gene bodies compared to the whole genome. (B) Genomic Regions Enrichment of Annotations Tool (GREAT) analysis of ChIP-seq data revealing that EZH2 largely binds around the TSS of the gene.
EZH2-deficiency fosters a shift in histone modifications at EZH2
target genes
To study EZH2-dependent histone modifications, EZH2 ChIP-seq was
accompanied by ChIP-seq analysis for H3K27me3 and H3K4me3 in the
presence and absence of EZH2. Principal component analysis (PCA) in
H3K27me3 and H3K4me3 ChIP-seq confirmed the similarity between the
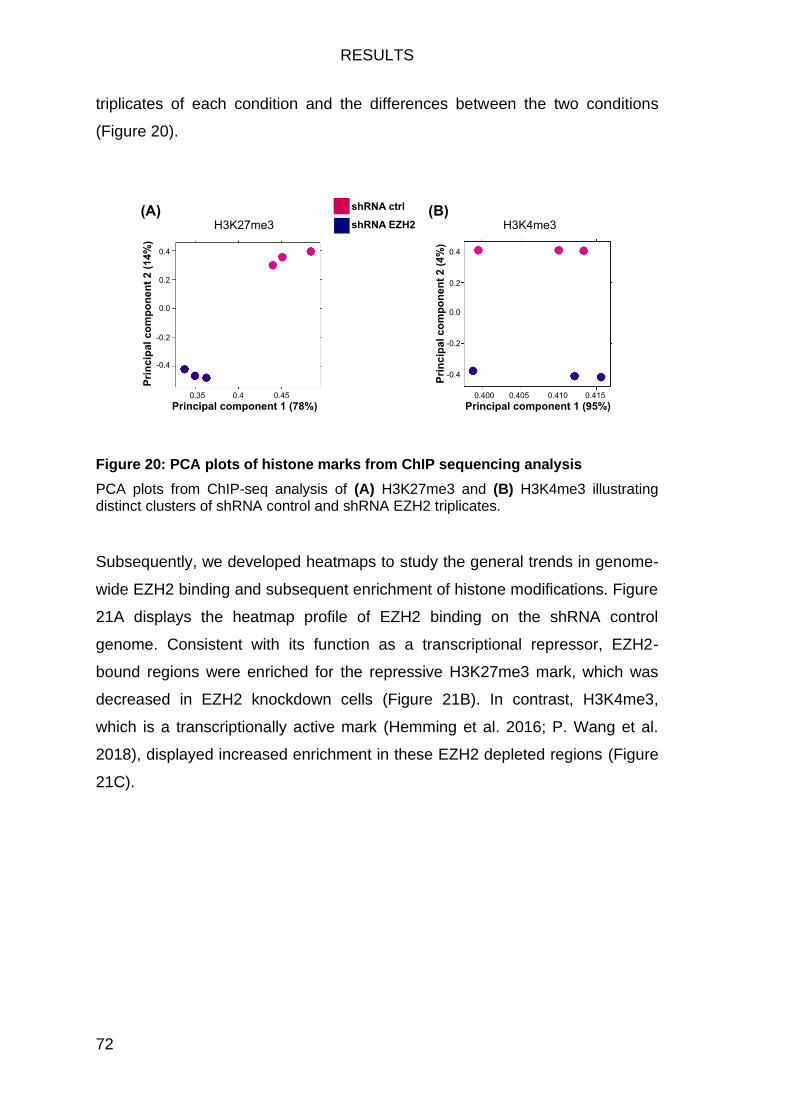
RESULTS
72
triplicates of each condition and the differences between the two conditions
(Figure 20).
Figure 20: PCA plots of histone marks from ChIP sequencing analysis
PCA plots from ChIP-seq analysis of (A) H3K27me3 and (B) H3K4me3 illustrating distinct clusters of shRNA control and shRNA EZH2 triplicates.
Subsequently, we developed heatmaps to study the general trends in genome-
wide EZH2 binding and subsequent enrichment of histone modifications. Figure
21A displays the heatmap profile of EZH2 binding on the shRNA control
genome. Consistent with its function as a transcriptional repressor, EZH2-
bound regions were enriched for the repressive H3K27me3 mark, which was
decreased in EZH2 knockdown cells (Figure 21B). In contrast, H3K4me3,
which is a transcriptionally active mark (Hemming et al. 2016; P. Wang et al.
2018), displayed increased enrichment in these EZH2 depleted regions (Figure
21C).
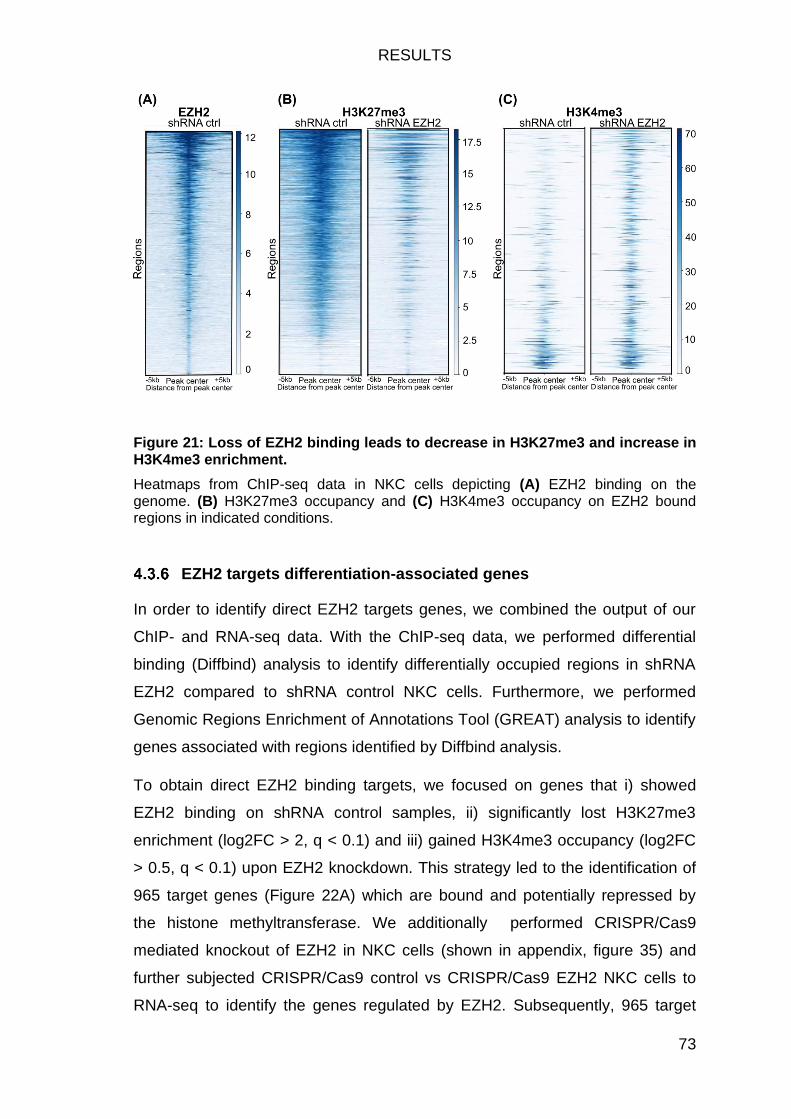
RESULTS
73
Figure 21: Loss of EZH2 binding leads to decrease in H3K27me3 and increase in H3K4me3 enrichment.
Heatmaps from ChIP-seq data in NKC cells depicting (A) EZH2 binding on the genome. (B) H3K27me3 occupancy and (C) H3K4me3 occupancy on EZH2 bound regions in indicated conditions.
EZH2 targets differentiation-associated genes
In order to identify direct EZH2 targets genes, we combined the output of our
ChIP- and RNA-seq data. With the ChIP-seq data, we performed differential
binding (Diffbind) analysis to identify differentially occupied regions in shRNA
EZH2 compared to shRNA control NKC cells. Furthermore, we performed
Genomic Regions Enrichment of Annotations Tool (GREAT) analysis to identify
genes associated with regions identified by Diffbind analysis.
To obtain direct EZH2 binding targets, we focused on genes that i) showed
EZH2 binding on shRNA control samples, ii) significantly lost H3K27me3
enrichment (log2FC > 2, q < 0.1) and iii) gained H3K4me3 occupancy (log2FC
> 0.5, q < 0.1) upon EZH2 knockdown. This strategy led to the identification of
965 target genes (Figure 22A) which are bound and potentially repressed by
the histone methyltransferase. We additionally performed CRISPR/Cas9
mediated knockout of EZH2 in NKC cells (shown in appendix, figure 35) and
further subjected CRISPR/Cas9 control vs CRISPR/Cas9 EZH2 NKC cells to
RNA-seq to identify the genes regulated by EZH2. Subsequently, 965 target
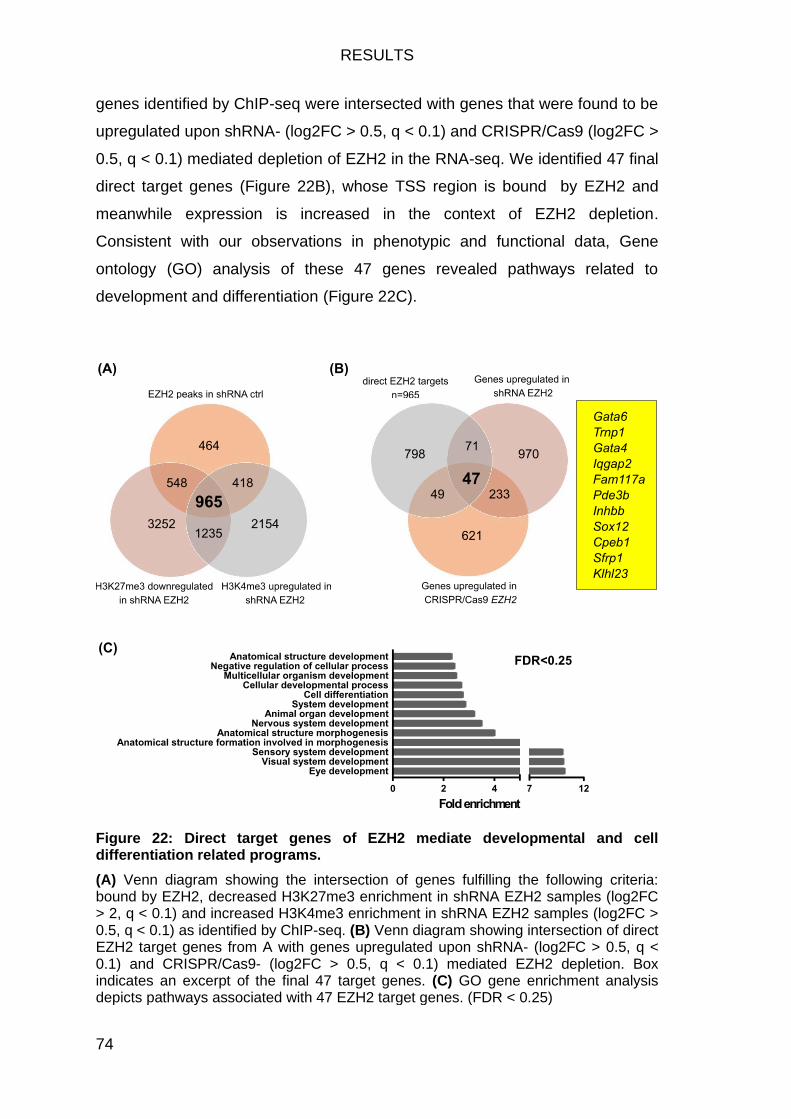
RESULTS
74
genes identified by ChIP-seq were intersected with genes that were found to be
upregulated upon shRNA- (log2FC > 0.5, q < 0.1) and CRISPR/Cas9 (log2FC >
0.5, q < 0.1) mediated depletion of EZH2 in the RNA-seq. We identified 47 final
direct target genes (Figure 22B), whose TSS region is bound by EZH2 and
meanwhile expression is increased in the context of EZH2 depletion.
Consistent with our observations in phenotypic and functional data, Gene
ontology (GO) analysis of these 47 genes revealed pathways related to
development and differentiation (Figure 22C).
Figure 22: Direct target genes of EZH2 mediate developmental and cell differentiation related programs.
(A) Venn diagram showing the intersection of genes fulfilling the following criteria: bound by EZH2, decreased H3K27me3 enrichment in shRNA EZH2 samples (log2FC > 2, q < 0.1) and increased H3K4me3 enrichment in shRNA EZH2 samples (log2FC > 0.5, q < 0.1) as identified by ChIP-seq. (B) Venn diagram showing intersection of direct EZH2 target genes from A with genes upregulated upon shRNA- (log2FC > 0.5, q < 0.1) and CRISPR/Cas9- (log2FC > 0.5, q < 0.1) mediated EZH2 depletion. Box indicates an excerpt of the final 47 target genes. (C) GO gene enrichment analysis depicts pathways associated with 47 EZH2 target genes. (FDR < 0.25)
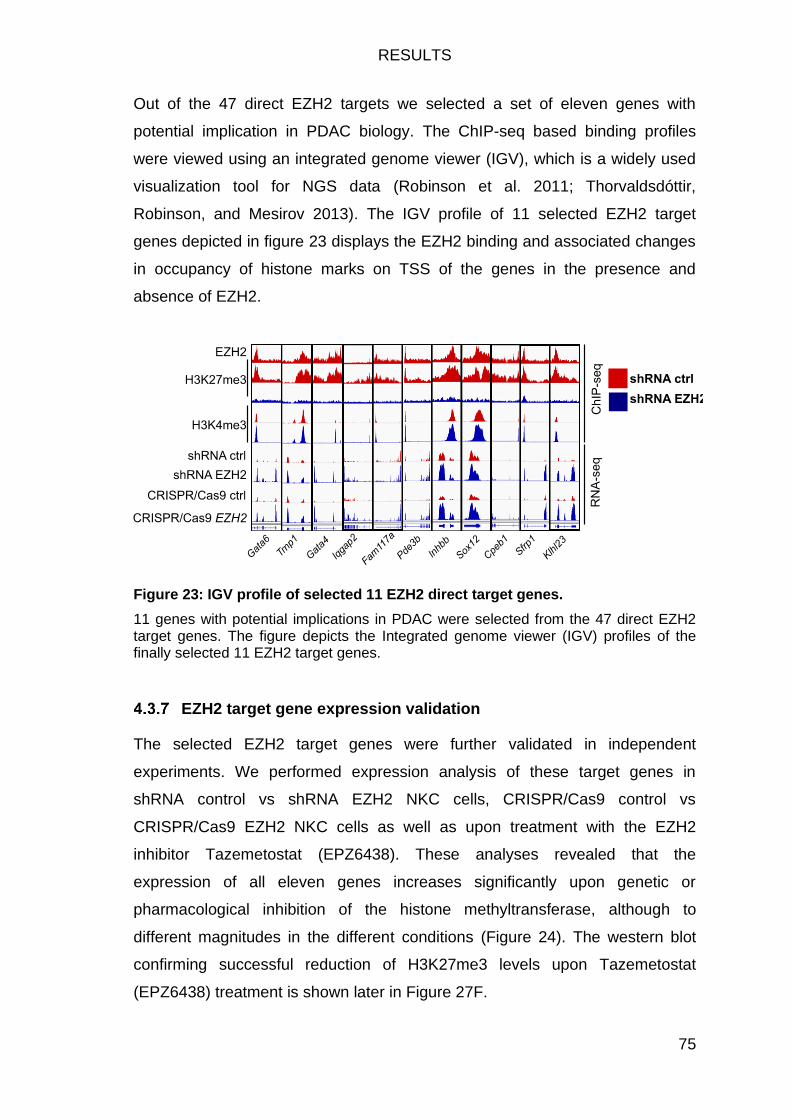
RESULTS
75
Out of the 47 direct EZH2 targets we selected a set of eleven genes with
potential implication in PDAC biology. The ChIP-seq based binding profiles
were viewed using an integrated genome viewer (IGV), which is a widely used
visualization tool for NGS data (Robinson et al. 2011; Thorvaldsdóttir,
Robinson, and Mesirov 2013). The IGV profile of 11 selected EZH2 target
genes depicted in figure 23 displays the EZH2 binding and associated changes
in occupancy of histone marks on TSS of the genes in the presence and
absence of EZH2.
Figure 23: IGV profile of selected 11 EZH2 direct target genes.
11 genes with potential implications in PDAC were selected from the 47 direct EZH2 target genes. The figure depicts the Integrated genome viewer (IGV) profiles of the finally selected 11 EZH2 target genes.
EZH2 target gene expression validation
The selected EZH2 target genes were further validated in independent
experiments. We performed expression analysis of these target genes in
shRNA control vs shRNA EZH2 NKC cells, CRISPR/Cas9 control vs
CRISPR/Cas9 EZH2 NKC cells as well as upon treatment with the EZH2
inhibitor Tazemetostat (EPZ6438). These analyses revealed that the
expression of all eleven genes increases significantly upon genetic or
pharmacological inhibition of the histone methyltransferase, although to
different magnitudes in the different conditions (Figure 24). The western blot
confirming successful reduction of H3K27me3 levels upon Tazemetostat
(EPZ6438) treatment is shown later in Figure 27F.
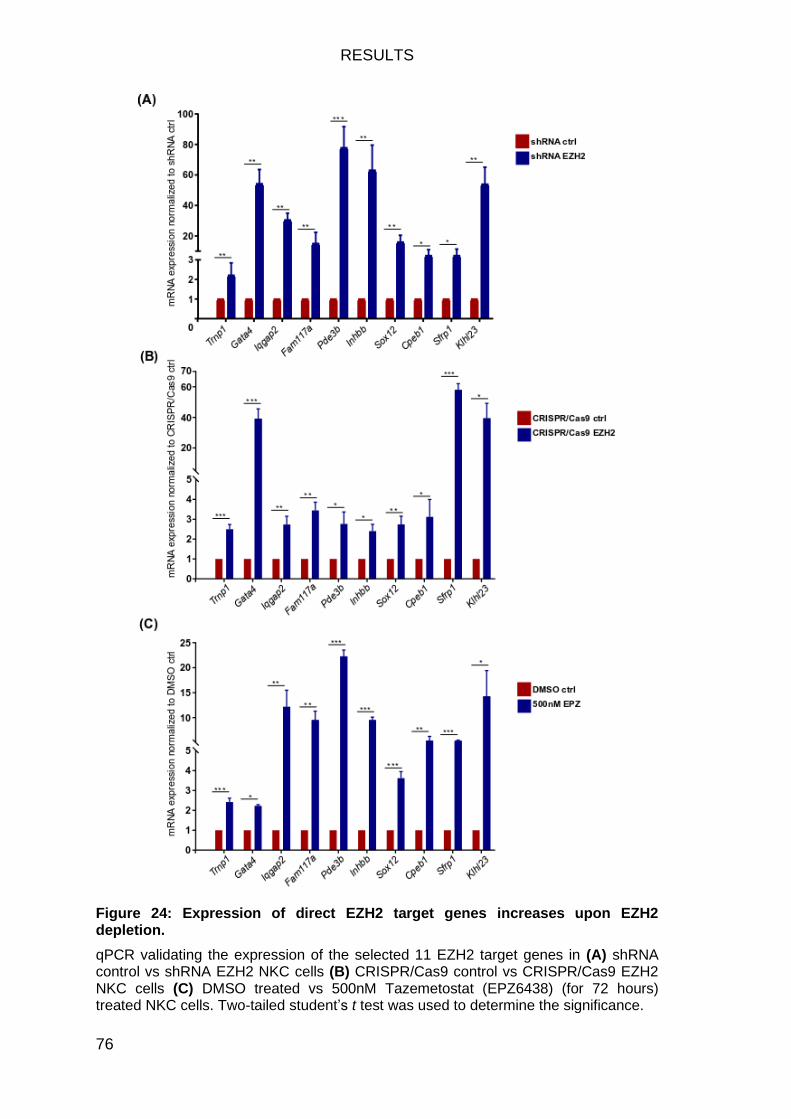
RESULTS
76
Figure 24: Expression of direct EZH2 target genes increases upon EZH2 depletion.
qPCR validating the expression of the selected 11 EZH2 target genes in (A) shRNA control vs shRNA EZH2 NKC cells (B) CRISPR/Cas9 control vs CRISPR/Cas9 EZH2 NKC cells (C) DMSO treated vs 500nM Tazemetostat (EPZ6438) (for 72 hours) treated NKC cells. Two-tailed student’s t test was used to determine the significance.
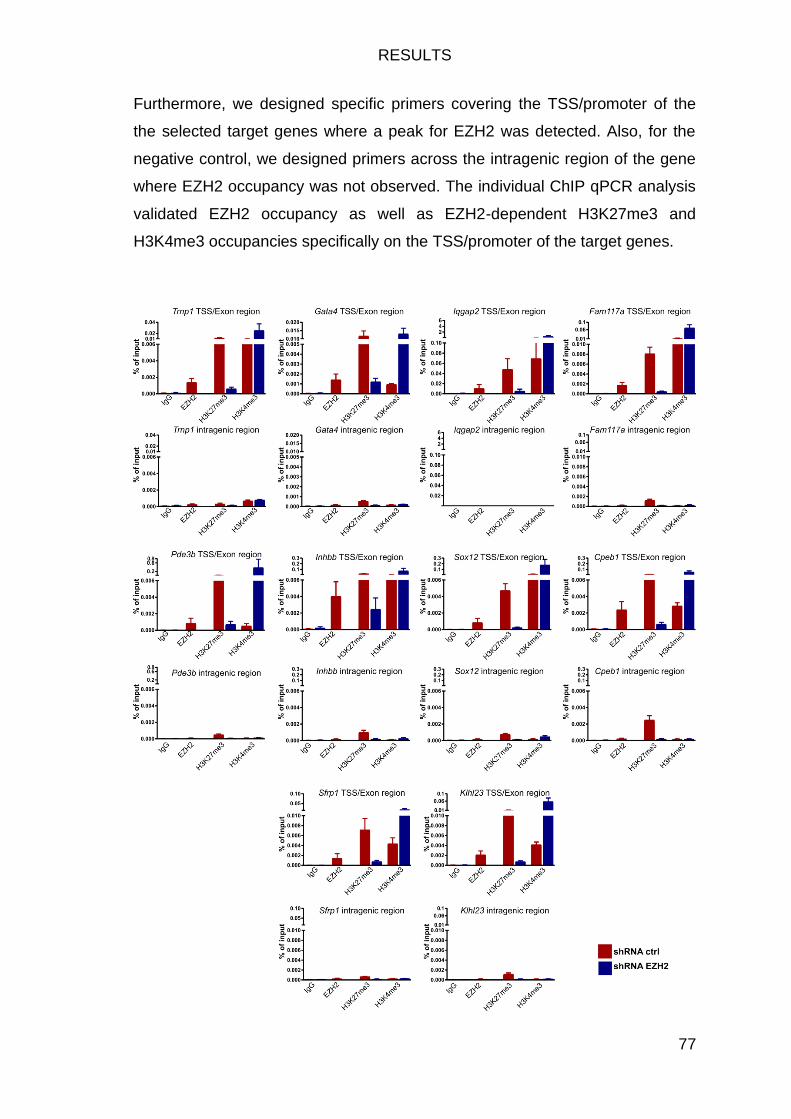
RESULTS
77
Furthermore, we designed specific primers covering the TSS/promoter of the
the selected target genes where a peak for EZH2 was detected. Also, for the
negative control, we designed primers across the intragenic region of the gene
where EZH2 occupancy was not observed. The individual ChIP qPCR analysis
validated EZH2 occupancy as well as EZH2-dependent H3K27me3 and
H3K4me3 occupancies specifically on the TSS/promoter of the target genes.
RESULTS
78
Figure 25: EZH2 binds to TSS of its target genes and mediates promoter specific histone modifications.
qRT-PCR following EZH2- and histone modification ChIP analysis utilizing primers embracing the TSS/promoter region and intragenic region (negative control) of selected genes for validation as a direct EZH2 target gene.
EZH2-GATA6 axis in PDAC
EZH2 targets epithelial transcription factor Gata6
One of the well-regulated and interesting EZH2 target genes was the
transcription factor GATA6. GATA6 represents a critical regulator of pancreatic
development and endodermal lineage differentiation (C. Y. Chia et al. 2019;
Lorberbaum and Sussel 2017; Tiyaboonchai et al. 2017). Its expression in
various cancers including pancreatic cancer is linked to blocking pancreatic
carcinogenesis and PDAC progression. GATA6 loss is associated with reduced
differentiation and increased metastasis in PDAC (Martinelli et al. 2017).
Further evidence states that GATA6 activates transcriptional programs related
to epithelial differentiation (Hermann et al. 2014; Martinelli et al. 2016).
Moreover, all the PDAC subtype studies from this decade portray GATA6 as
the central regulator of molecular subtype identity. GATA6 proves to be a
surrogate marker with high and low GATA6 expression implying classical and
basal-like PDAC subtypes, respectively (Aung et al. 2019; P. Bailey et al. 2016;
Collisson et al. 2011; O’Kane et al. 2020).
Interestingly, in our ChIP-seq we detected a prominent EZH2 peak around the
TSS/promoter of the Gata6 gene. Additionally, we observed a decrease in
H3K27me3 enrichment and increase in H3K4me3 occupancy in this region
upon the depletion of EZH2. This was in line with our observations in RNA-seq
data, where we detected a significantly enhanced upregulation of Gata6
expression upon EZH2 knockdown (Figure 26A). To further validate that EZH2
indeed binds specifically to the promoter of Gata6, we performed individual
ChIP experiments. Consistent with our observations in IGV from ChIP-seq,
qRT-PCR performed in ChIP samples revealed a significant enrichment of
EZH2 binding and its activity (H3K27me3) around the promoter of Gata6. In the
context of EZH2 deficiency, binding of EZH2 and H3K27me3 reduced while
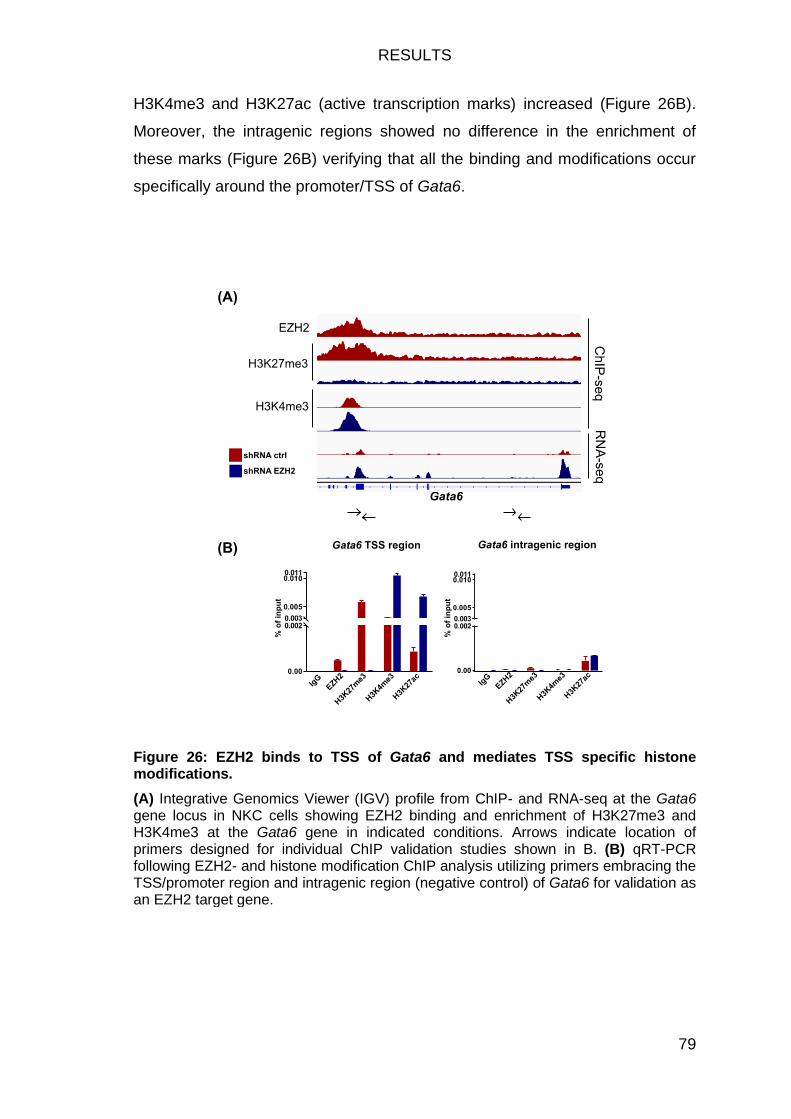
RESULTS
79
H3K4me3 and H3K27ac (active transcription marks) increased (Figure 26B).
Moreover, the intragenic regions showed no difference in the enrichment of
these marks (Figure 26B) verifying that all the binding and modifications occur
specifically around the promoter/TSS of Gata6.
Figure 26: EZH2 binds to TSS of Gata6 and mediates TSS specific histone modifications.
(A) Integrative Genomics Viewer (IGV) profile from ChIP- and RNA-seq at the Gata6 gene locus in NKC cells showing EZH2 binding and enrichment of H3K27me3 and H3K4me3 at the Gata6 gene in indicated conditions. Arrows indicate location of primers designed for individual ChIP validation studies shown in B. (B) qRT-PCR following EZH2- and histone modification ChIP analysis utilizing primers embracing the TSS/promoter region and intragenic region (negative control) of Gata6 for validation as an EZH2 target gene.
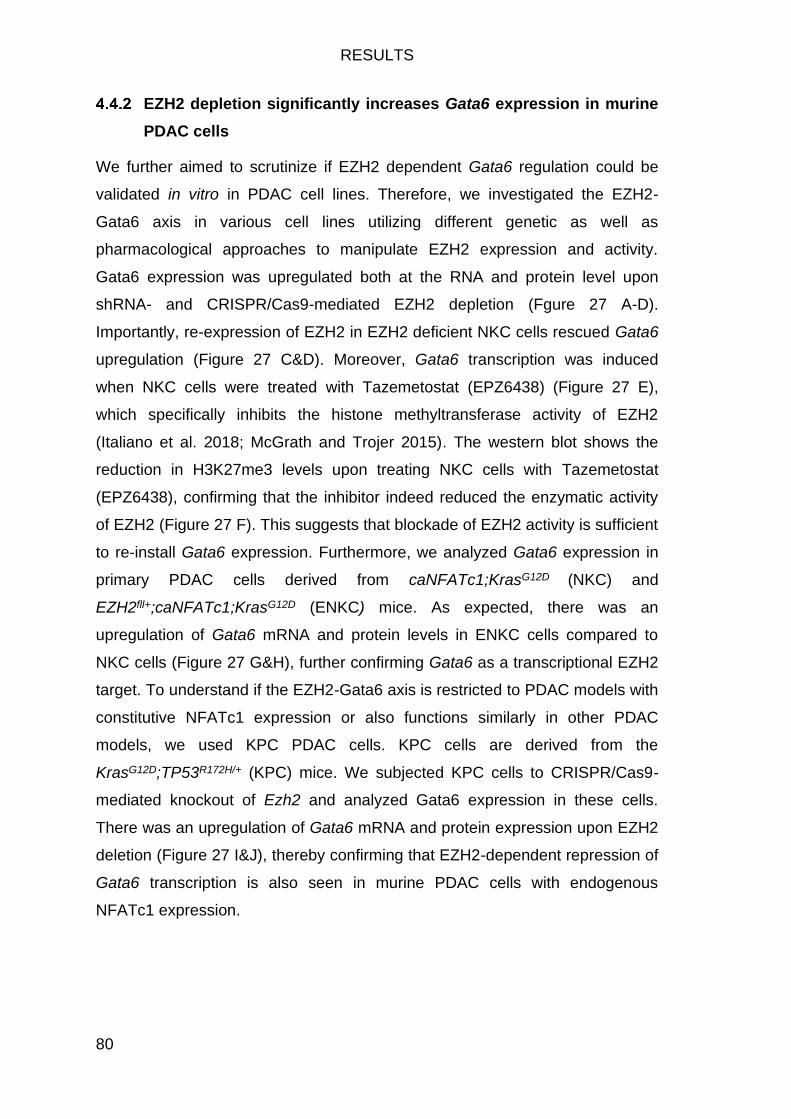
RESULTS
80
EZH2 depletion significantly increases Gata6 expression in murine
PDAC cells
We further aimed to scrutinize if EZH2 dependent Gata6 regulation could be
validated in vitro in PDAC cell lines. Therefore, we investigated the EZH2-
Gata6 axis in various cell lines utilizing different genetic as well as
pharmacological approaches to manipulate EZH2 expression and activity.
Gata6 expression was upregulated both at the RNA and protein level upon
shRNA- and CRISPR/Cas9-mediated EZH2 depletion (Fgure 27 A-D).
Importantly, re-expression of EZH2 in EZH2 deficient NKC cells rescued Gata6
upregulation (Figure 27 C&D). Moreover, Gata6 transcription was induced
when NKC cells were treated with Tazemetostat (EPZ6438) (Figure 27 E),
which specifically inhibits the histone methyltransferase activity of EZH2
(Italiano et al. 2018; McGrath and Trojer 2015). The western blot shows the
reduction in H3K27me3 levels upon treating NKC cells with Tazemetostat
(EPZ6438), confirming that the inhibitor indeed reduced the enzymatic activity
of EZH2 (Figure 27 F). This suggests that blockade of EZH2 activity is sufficient
to re-install Gata6 expression. Furthermore, we analyzed Gata6 expression in
primary PDAC cells derived from caNFATc1;KrasG12D (NKC) and
EZH2fll+;caNFATc1;KrasG12D (ENKC) mice. As expected, there was an
upregulation of Gata6 mRNA and protein levels in ENKC cells compared to
NKC cells (Figure 27 G&H), further confirming Gata6 as a transcriptional EZH2
target. To understand if the EZH2-Gata6 axis is restricted to PDAC models with
constitutive NFATc1 expression or also functions similarly in other PDAC
models, we used KPC PDAC cells. KPC cells are derived from the
KrasG12D;TP53R172H/+ (KPC) mice. We subjected KPC cells to CRISPR/Cas9-
mediated knockout of Ezh2 and analyzed Gata6 expression in these cells.
There was an upregulation of Gata6 mRNA and protein expression upon EZH2
deletion (Figure 27 I&J), thereby confirming that EZH2-dependent repression of
Gata6 transcription is also seen in murine PDAC cells with endogenous
NFATc1 expression.
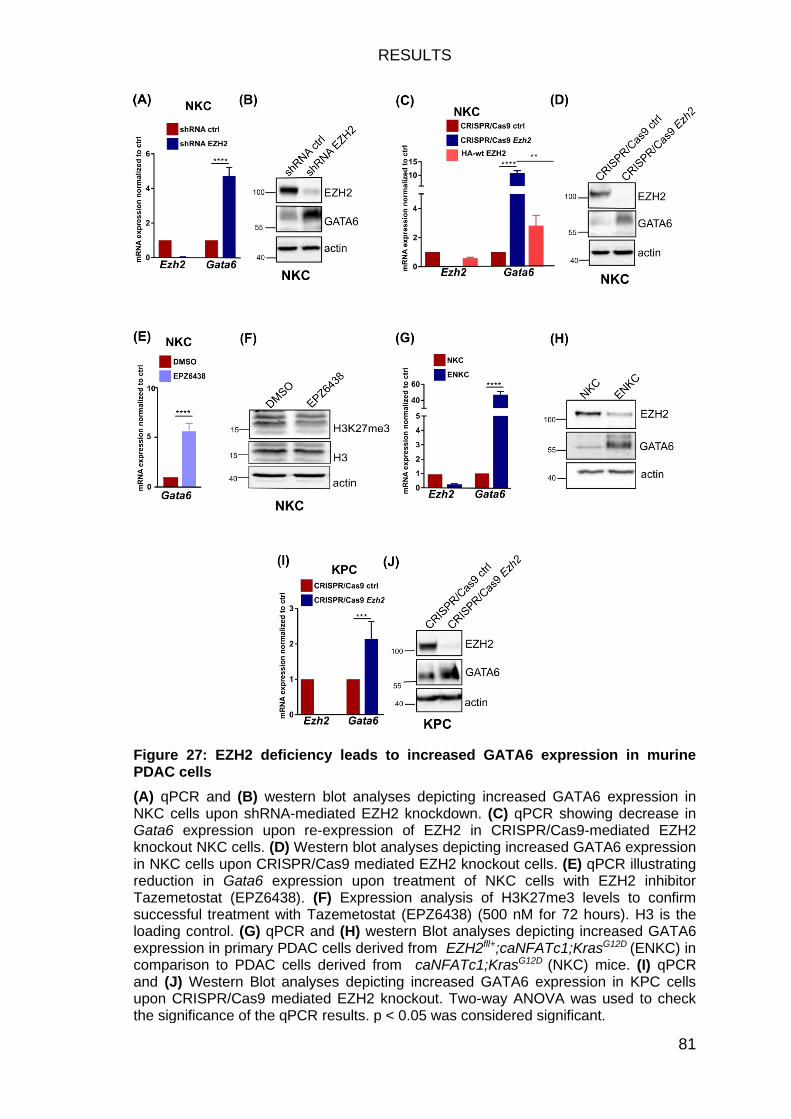
RESULTS
81
Figure 27: EZH2 deficiency leads to increased GATA6 expression in murine PDAC cells
(A) qPCR and (B) western blot analyses depicting increased GATA6 expression in NKC cells upon shRNA-mediated EZH2 knockdown. (C) qPCR showing decrease in Gata6 expression upon re-expression of EZH2 in CRISPR/Cas9-mediated EZH2 knockout NKC cells. (D) Western blot analyses depicting increased GATA6 expression in NKC cells upon CRISPR/Cas9 mediated EZH2 knockout cells. (E) qPCR illustrating reduction in Gata6 expression upon treatment of NKC cells with EZH2 inhibitor Tazemetostat (EPZ6438). (F) Expression analysis of H3K27me3 levels to confirm successful treatment with Tazemetostat (EPZ6438) (500 nM for 72 hours). H3 is the loading control. (G) qPCR and (H) western Blot analyses depicting increased GATA6 expression in primary PDAC cells derived from EZH2fll+;caNFATc1;KrasG12D (ENKC) in comparison to PDAC cells derived from caNFATc1;KrasG12D (NKC) mice. (I) qPCR and (J) Western Blot analyses depicting increased GATA6 expression in KPC cells upon CRISPR/Cas9 mediated EZH2 knockout. Two-way ANOVA was used to check the significance of the qPCR results. p < 0.05 was considered significant.
RESULTS
82
EZH2 represses GATA6 expression in human PDAC
Our next question was to understand whether EZH2-dependent GATA6
repression also occurs in human PDAC. First, we took advantage of publicly
available EZH2 ChIP-seq data accomplished in PANC-1 (Tzatsos et al. 2013).
PANC-1 is a human pancreatic cancer epithelial cell line which is categorized
as a basal-like subtype PDAC cell line (Diaferia et al. 2016). The ChIP-seq raw
data was retrieved and analyzed in usegalaxy server using the default
parameters. The EZH2 enrichment profile was visualized on IGV which
revealed a significant enrichment of EZH2 on the GATA6 TSS/promoter (Figure
28A), confirming that EZH2 binds on the GATA6 gene in human PDAC as well.
To validate whether EZH2 also blocks GATA6 transcription, we subjected
PANC-1 cells to CRISPR/Cas9 mediated EZH2 deletion and tested for GATA6
expression in CRISPR/Cas9 control vs CRISPR/Cas9 EZH2 KO PANC-1 cells.
As predicted, EZH2 deletion significantly increased GATA6 mRNA and protein
expression (Figure 28B&C), yet again supporting that the EZH2-GATA6 axis
also persists in human PDAC.
Figure 28: EZH2 regulates GATA6 expression in human PDAC cell line PANC-1.
(A) IGV profile demonstrating EZH2 occupancy on the GATA6 TSS in PANC1 cells as defined by ChIP-seq analysis (Tzatsos et al. 2013). (B) qPCR and (C) western blot analyses depicting increased GATA6 expression in PANC-1 cells upon CRISPR/Cas9-mediated EZH2 knockout. Two-way ANOVA was used to check the significance of the qPCR results.
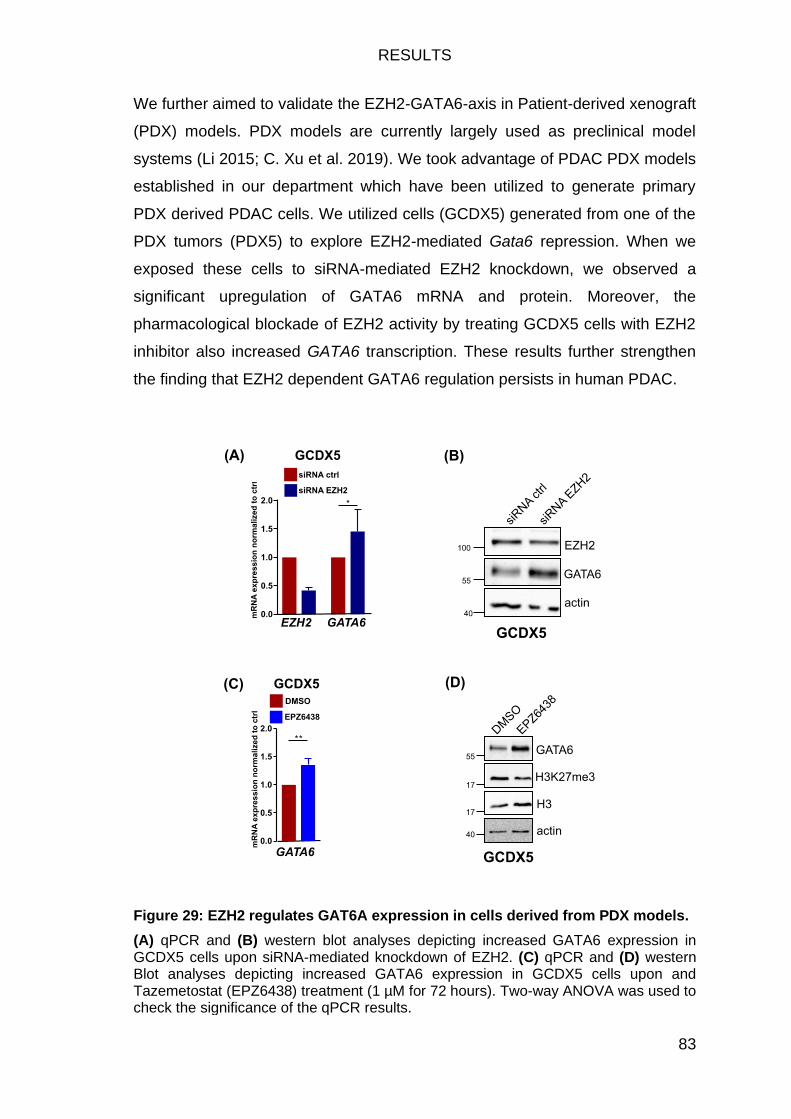
RESULTS
83
We further aimed to validate the EZH2-GATA6-axis in Patient-derived xenograft
(PDX) models. PDX models are currently largely used as preclinical model
systems (Li 2015; C. Xu et al. 2019). We took advantage of PDAC PDX models
established in our department which have been utilized to generate primary
PDX derived PDAC cells. We utilized cells (GCDX5) generated from one of the
PDX tumors (PDX5) to explore EZH2-mediated Gata6 repression. When we
exposed these cells to siRNA-mediated EZH2 knockdown, we observed a
significant upregulation of GATA6 mRNA and protein. Moreover, the
pharmacological blockade of EZH2 activity by treating GCDX5 cells with EZH2
inhibitor also increased GATA6 transcription. These results further strengthen
the finding that EZH2 dependent GATA6 regulation persists in human PDAC.
Figure 29: EZH2 regulates GAT6A expression in cells derived from PDX models.
(A) qPCR and (B) western blot analyses depicting increased GATA6 expression in GCDX5 cells upon siRNA-mediated knockdown of EZH2. (C) qPCR and (D) western Blot analyses depicting increased GATA6 expression in GCDX5 cells upon and Tazemetostat (EPZ6438) treatment (1 µM for 72 hours). Two-way ANOVA was used to check the significance of the qPCR results.
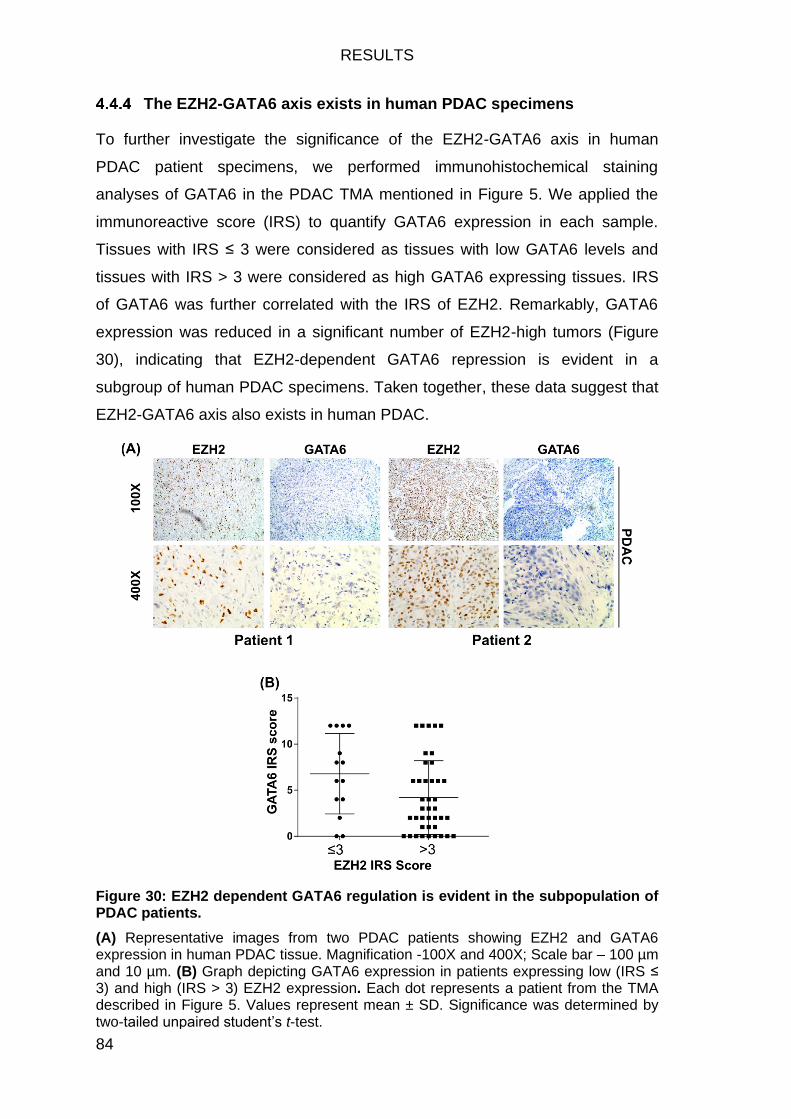
RESULTS
84
The EZH2-GATA6 axis exists in human PDAC specimens
To further investigate the significance of the EZH2-GATA6 axis in human
PDAC patient specimens, we performed immunohistochemical staining
analyses of GATA6 in the PDAC TMA mentioned in Figure 5. We applied the
immunoreactive score (IRS) to quantify GATA6 expression in each sample.
Tissues with IRS ≤ 3 were considered as tissues with low GATA6 levels and
tissues with IRS > 3 were considered as high GATA6 expressing tissues. IRS
of GATA6 was further correlated with the IRS of EZH2. Remarkably, GATA6
expression was reduced in a significant number of EZH2-high tumors (Figure
30), indicating that EZH2-dependent GATA6 repression is evident in a
subgroup of human PDAC specimens. Taken together, these data suggest that
EZH2-GATA6 axis also exists in human PDAC.
Figure 30: EZH2 dependent GATA6 regulation is evident in the subpopulation of PDAC patients.
(A) Representative images from two PDAC patients showing EZH2 and GATA6 expression in human PDAC tissue. Magnification -100X and 400X; Scale bar – 100 µm and 10 µm. (B) Graph depicting GATA6 expression in patients expressing low (IRS ≤ 3) and high (IRS > 3) EZH2 expression. Each dot represents a patient from the TMA described in Figure 5. Values represent mean ± SD. Significance was determined by two-tailed unpaired student’s t-test.
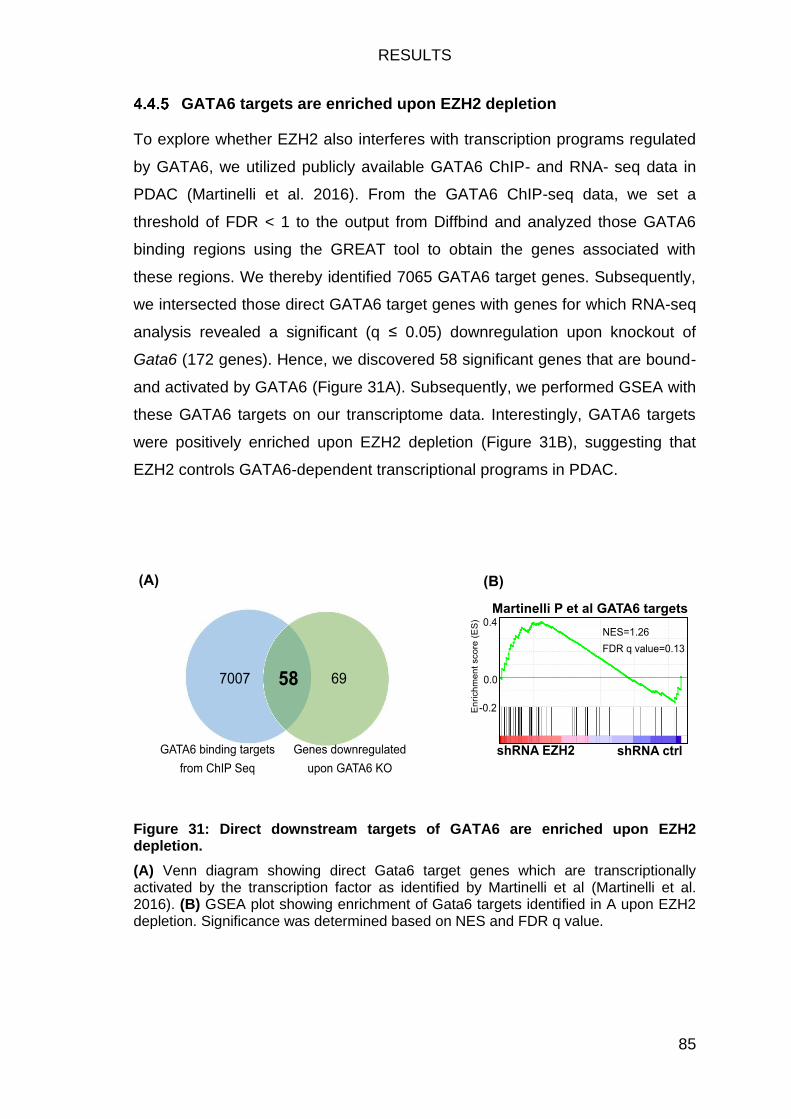
RESULTS
85
GATA6 targets are enriched upon EZH2 depletion
To explore whether EZH2 also interferes with transcription programs regulated
by GATA6, we utilized publicly available GATA6 ChIP- and RNA- seq data in
PDAC (Martinelli et al. 2016). From the GATA6 ChIP-seq data, we set a
threshold of FDR < 1 to the output from Diffbind and analyzed those GATA6
binding regions using the GREAT tool to obtain the genes associated with
these regions. We thereby identified 7065 GATA6 target genes. Subsequently,
we intersected those direct GATA6 target genes with genes for which RNA-seq
analysis revealed a significant (q ≤ 0.05) downregulation upon knockout of
Gata6 (172 genes). Hence, we discovered 58 significant genes that are bound-
and activated by GATA6 (Figure 31A). Subsequently, we performed GSEA with
these GATA6 targets on our transcriptome data. Interestingly, GATA6 targets
were positively enriched upon EZH2 depletion (Figure 31B), suggesting that
EZH2 controls GATA6-dependent transcriptional programs in PDAC.
Figure 31: Direct downstream targets of GATA6 are enriched upon EZH2 depletion.
(A) Venn diagram showing direct Gata6 target genes which are transcriptionally activated by the transcription factor as identified by Martinelli et al (Martinelli et al. 2016). (B) GSEA plot showing enrichment of Gata6 targets identified in A upon EZH2 depletion. Significance was determined based on NES and FDR q value.
RESULTS
86
Gata6 knockdown can rescue the effects of EZH2 depletion on
invasion
In order to explore the functional significance of GATA6 in curbing EZH2
mediated PDAC progression, we depleted Gata6 in shRNA EZH2 NKC cells
using siRNA strategies. Figure 32A depicts the confirmation of knockdown of
Gata6. Subsequently, we performed an invasion assay to investigate whether
Gata6 knockdown can rescue the invasive capacity of EZH2-deficient PDAC
cells. The number of invading cells increased significantly upon Gata6
knockdown in EZH2-depleted cells (Figure 32B), arguing that Gata6 depletion
partially restores the invasive potential of shRNA EZH2 NKC cells. These
results suggest that Gata6 repression is essential for EZH2-driven PDAC cells
invasion.
To further understand the role of GATA6 in impeding the EZH2-dependent
repression of gene signatures associated with the classical PDAC subtype, we
examined the expression of few classical genes in the presence and absence
of EZH2 and upon GATA6 depletion. The classical genes were selected from
the previously described Pure-classical gene set defined by Puleo and
colleagues (Puleo et al. 2018). Consistent with the observed enrichment of pure
classical and basal-like gene signatures in shRNA EZH2 and shRNA control
NKC cells, respectively, pure classical genes were upregulated upon sole
EZH2 depletion. However, GATA6 depletion partially rescued increased
classical target gene expression observed upon EZH2 deficiency (Figure 32C)
suggesting that GATA6 is required for EZH2 mediated abrogation of classical
gene expression signatures.
Taken together, these data demonstrate that GATA6 expression is essential for
the abrogation of invasive potential of features of PDAC and acquisition of a
classical subtype state upon EZH2 depletion.
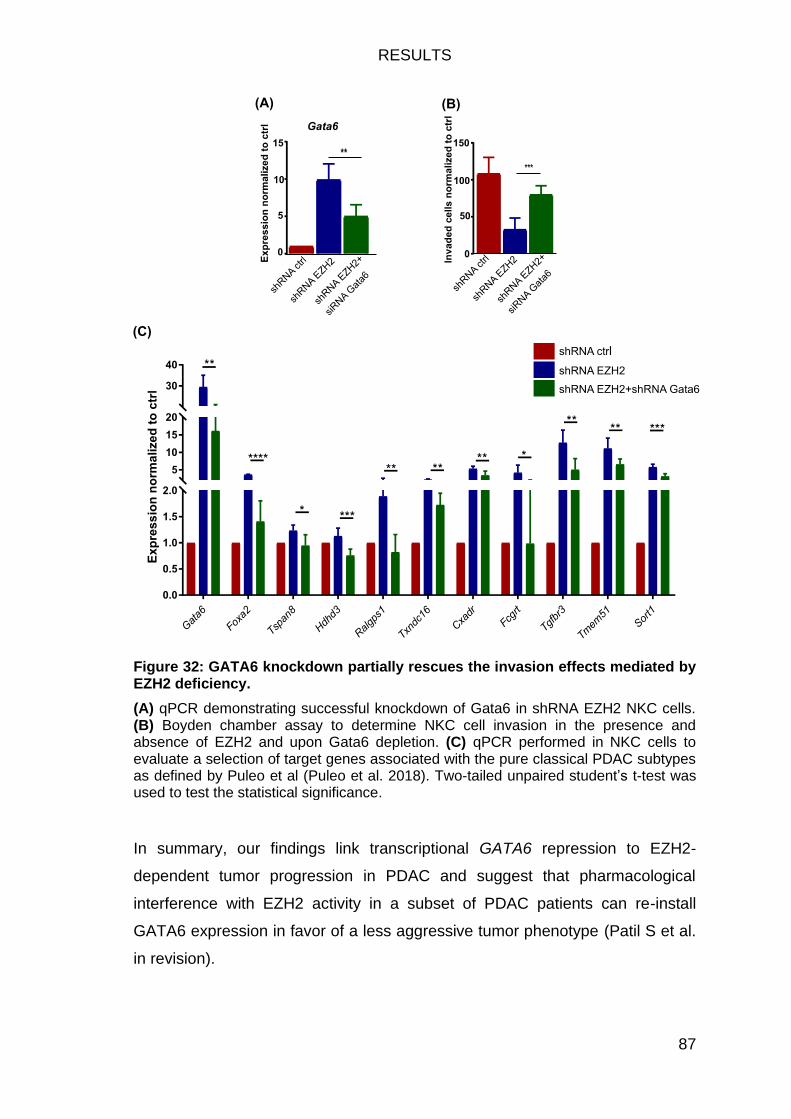
RESULTS
87
Figure 32: GATA6 knockdown partially rescues the invasion effects mediated by EZH2 deficiency.
(A) qPCR demonstrating successful knockdown of Gata6 in shRNA EZH2 NKC cells. (B) Boyden chamber assay to determine NKC cell invasion in the presence and absence of EZH2 and upon Gata6 depletion. (C) qPCR performed in NKC cells to evaluate a selection of target genes associated with the pure classical PDAC subtypes as defined by Puleo et al (Puleo et al. 2018). Two-tailed unpaired student’s t-test was used to test the statistical significance.
In summary, our findings link transcriptional GATA6 repression to EZH2-
dependent tumor progression in PDAC and suggest that pharmacological
interference with EZH2 activity in a subset of PDAC patients can re-install
GATA6 expression in favor of a less aggressive tumor phenotype (Patil S et al.
in revision).

DISCUSSION
89
5 DISCUSSION
Polycomb group proteins in the regulation of differentiation
processes
Polycomb group (PcG) proteins regulate several processes during development
including cell fate determination, lineage specification, stem cell regulation and
maintaining homeostasis (Bracken et al. 2006; Ringrose and Paro 2004;
Schuettengruber and Cavalli 2009; Surface, Thornton, and Boyer 2010). In the
course of embryonic development, they control transcriptional programs by
restricting the expression of specific genes. They particularly repress genes
linked to differentiation and maintain the repressed state of the genes in an
adult differentiated cell (Sparmann and Van Lohuizen 2006). Along with their
critical role in development and differentiation, several studies show a
significant connection between polycomb proteins and cancer (Hormaeche and
Licht 2007; Richly, Aloia, and Di Croce 2011; Sauvageau and Sauvageau
2010; Valk-Lingbeek, Bruggeman, and Van Lohuizen 2004). PcG proteins carry
out their functions by forming multiprotein complexes like PRC1 and PRC2.
EZH2 is one of the most important members of the PRC2 complex and is found
to be vital in ensuring proper development of various organs including the
pancreas (Chou et al. 2015; San et al. 2016). This is very well reflected in our
study where we see that pancreas specific homozygous EZH2 knockout mice
are lethal and show various developmental abnormalities of the pancreas.
EZH2 in pancreas development and cancer progression
Since the past few years, EZH2 has gained a lot of attention regarding its
deregulation in various cancer entities. For instance, EZH2 overexpression is
seen in breast and prostate cancer, linking its abundant expression to poor
prognosis and advanced tumor stages (Bachmann et al. 2006; Kleer et al.
2003). Similarly, in pancreatic cancer, consistent with previous studies (N. M.
Chen et al. 2017; Ougolkov, Bilim, and Billadeau 2008), our findings also show
increased EZH2 levels in dedifferentiated high-grade human PDAC.
EZH2 overexpression in cancer has been associated with increased
proliferation (Ougolkov, Bilim, and Billadeau 2008), stemness (Y. H. Chen,
Hung, and Li 2012), migration (Smits et al. 2010), invasion (Han et al. 2016)
DISCUSSION
90
and metastasis (Rao et al. 2010; Richter et al. 2009). In line with these reports,
we made similar observations upon performing functional assays in NKC PDAC
cells in vitro. Upon EZH2 depletion, cells exhibited reduced proliferation,
anchorage-independent growth and invasive capabilities confirming that EZH2-
deficient cells reduce their tumor-promoting activities. One of the reasons for
the failure to sufficiently eradicate cancer cells has been credited to the
stemness property of cancer cells which lead to therapy resistance and tumor
relapse (Nangia-Makker, Hogan, and Raz 2018; Shlush et al. 2017). Our
sphere-formation assay in NKC PDAC cells depicts that upon loss of EZH2,
NKC cells lose their stemness property. Accordingly, the RNA-seq analysis
suggests that EZH2 regulates transcriptional programs that mediate stemness
in PDAC cells. These findings argue that EZH2 depletion can create a shift
towards reduced stemness features which might reduce the likelihood of PDAC
relapses.
We utilized the caNfatc1;KrasG12D transgenic mouse models with wildtype Ezh2
expression or upon heterozygous Ezh2 expression to investigate the
implications of EZH2 depletion in PDAC in vivo. Although homozygous mice
would aid better in characterizing the role of EZH2, the heterozygous mice
already displayed differences regarding changes in cellular differentiation status
and metastasis. Despite the EZH2-status dependent differences in tumor
biology in these models, we did not observe significant differences between the
survival of caNfatc1;KrasG12D and EZH2fl/+;caNfatc1;KrasG12D mice. Given that
EZH2 is critical for proper development of the pancreas and based on our
observation that EZH2 heterozygous mice of advanced age displayed initial
signs of pancreatic insufficiency and atrophy, the comparable median survival
between the groups can be best explained by developmental issues. We
speculate that the utilization of an inducible mouse model (Guerra and Barbacid
2013; Martinelli et al. 2016) which facilitates EZH2 depletion after the
completion of pancreatic development would favor a better judgment on the
impact of EZH2 activity on tumor progression and mice survival. However, our
GEMM harboring EZH2 heterozygous deficiency already displays reduced
tumor incidence and metastasis. Hence, despite the limitations of our PDAC
model, it reflects the human situation to a significant extent.
DISCUSSION
91
caNfatc1;KrasG12D mouse model harbor the oncogenic KrasG12D mutation and
constitutive expression of the inflammatory transcription factor NFATc1.
Considering the implication of inflammation in boosting PDAC development
(Baer et al. 2014; Yadav and Lowenfels 2013; Ye et al. 2019; Young et al.
2019), this well-characterized transgenic mouse serves as a good model
system to study PDAC carcinogenesis. Additionally, these mice undergo all
steps of pancreatic carcinogenesis, thus highly mimicking human PDAC
development (Baumgart et al. 2014). Besides, Cre-mediated expression of HA-
tagged NFATc1 in this model occurs constitutively under the control of the
Rosa26 promoter, thus prohibiting the previously described alterations (N. M.
Chen et al. 2017) of NFATc1 expression upon interference with EZH2 activity.
Furthermore, EZH2 has been identified as a transcriptional NFATc1 target gene
(Baumgart et al. 2014) which means NKC mouse model expresses high levels
of EZH2, thus characterizing this model as a practicable tool to study the tumor
biological consequences and the mechanistic basis of EZH2 overexpression in
PDAC. However, in the context of constitutive NFATc1 activation, homozygous
Ezh2 depleted mice are lethal which hinders us from examining homozygous
EZH2 loss in these mice. Interestingly, in another GEMM which is also based
on KrasG12D but shows endogenous NFATc1 expression (EZH2fl/fl;KrasG12D
(KEC)), this was not to be observed and the mice were viable even upon
homozygous Ezh2 depletion (N. M. Chen et al. 2017; Mallen-St. Clair et al.
2012). Hence, constitutive NFATc1 activation seems to potentiate the functional
implications of Ezh2 deficiency in PDAC development. However, the EZH2-
GATA6 axis was also confirmed in systems with endogenous NFATc1
expression and in the context of additional genetic drivers of PDAC (e.g. gain of
function mutations of TP53).
Although the functional implications of EZH2 in cancer are published in various
reports (Y. H. Chen, Hung, and Li 2012; Han et al. 2016; Ougolkov, Bilim, and
Billadeau 2008; Rao et al. 2010; Richter et al. 2009; Smits et al. 2010), very few
studies exist that decode the specific function of this histone methyltransferase
in PDAC. Consistently, very little is known about the mechanistic functions and
direct targets of EZH2, especially in pancreatic cancer. Our study describes
ChIP- and RNA-seq analysis which provides insights into the mechanistic
background of EZH2-dependent gene regulation in PDAC and links EZH2
DISCUSSION
92
activity to suppression of transcriptional programs fostering differentiation and a
better outcome of PDAC patients.
Role of epigenetic modulations in mediating cancer cell plasticity
Cancer cells have a high level of cellular and molecular plasticity which is
predominantly regulated at the level of gene transcription (Flavahan, Gaskell,
and Bernstein 2017). Their ability to interconvert between different states allows
them to grow and spread across different sites (Roe et al. 2017). EMT and
stemness represent crucial factors for cancer cell plasticity which have a major
impact on metastasis and therapeutic resistance, respectively (Polyak and
Weinberg 2009). Many epigenetic modulators regulate transcription programs
that drive this transition. For instance, epigenetic alterations initiated by
transcription factors like SNAI and ZEB1 modulate the chromatin, consequently
controlling the transcription of genes involved in EMT (Nieto et al. 2016). In a
study in small cell lung cancer (SCLC), amplification of the transcription factor
NFIB offered genome-wide chromatin accessibility subsequently promoting
gene expression controlling metastasis programs (Denny et al. 2016). Recent
evidence suggests that reprogramming of the enhancer landscape mediates
metastatic potential in pancreatic cancer cells (Roe et al. 2017). Few studies
indicate the role of EZH2 in interacting with EMT associated factors. For
instance, EZH2 promotes Snail-mediated recruitment of RING1A/B to the
CDH1 promoter (encoding for E-Cadherin) to repress its expression, thereby
promoting cell migration in PANC-1 cells (Chen et al. 2014). Furthermore, few
studies also suggest that EZH2 binds directly to the CDH1 promoter to repress
its expression, thus promoting cell migration and invasion (Han et al. 2016;
Qazi et al. 2012). However, in our study, we do not observe any major
differences in the expression of EMT-related gene signatures upon loss of
EZH2. Interestingly we still discovered a potential link between EZH2
expression and metastasis in vivo. However, there are a few reports suggesting
EMT-independent mechanisms driving PDAC metastasis in GEMMs. For
instance, Zheng et al demonstrate that loss of Twist1 and Snai1 does not
influence metastases frequency (Zheng et al. 2015) and further fluorescence-
based lineage tracing experiments confirmed non-EMT associated metastasis
in mouse models of PDAC (Y. Chen et al. 2018). Considering these studies
DISCUSSION
93
arguing that the EMT process is dispensable for metastasis in PDAC, we
contemplate a possibility that metastasis could have been influenced by
processes other than EMT in our mouse models. It is also possible that the
implication of EZH2 on EMT was prominent in mice but not as well captured in
our in vitro systems. To better understand the implication of EZH2 on EMT in
vivo, the tumors from the wildtype and EZH2 depleted mice could be stained
with antibodies recognizing EMT markers.
There are few studies in breast cancer investigating the differences in
epigenomic patterns between primary and metastatic sites. Priedigkeit and
colleagues showed in their study that 20 % of patients with ERBB2-HER2
negative tumors at the primary tumor site showed ERBB2/HER2 positive brain
metastasis (Priedigkeit et al. 2017). In a recent report by Cai et al., they studied
the transcriptional differences between cells from tumors in primary and
metastasized sites (brain and lung) of breast cancer utilizing high throughput
sequencing approaches (ChIP-seq, RNA-seq, ATAC-seq, and HiChIP). They
claim that very few of those differences are driven by genetic mutations, while
the majority of these are promoted by epigenetic alterations indicating the
relevance of epigenomic reprogramming in fostering cellular plasticity of cancer
(Cai et al. 2020). Similarly, pancreatic cancer, which is a highly heterogeneous
tumor, also displays a high degree of cellular plasticity which is largely
mediated by differences in epigenetic landscapes. Lomberk et al. performed a
comprehensive analysis of epigenomic landscapes underlying PDAC subtypes
in patient-derived tumor xenografts (PDTXs) combining ChIP-seq for various
histone marks, RNA-seq and DNA methylation approaches where they
associate the epigenomic pattern with PDAC heterogeneity. Moreover, they
identify MET as a crucial transcription factor expressed in basal-like PDAC
subtypes and also show that siRNA mediated depletion of MET in PDTX-
derived cell lines mediates a shift from basal to classical PDAC subtype,
highlighting the influence of epigenetics in PDAC plasticity (G. Lomberk et al.
2018). Considering the implications of EZH2 in promoting metastasis and
stemness in our studies, manipulating EZH2 expression to tackle PDAC
plasticity could be considered as a therapeutic strategy.
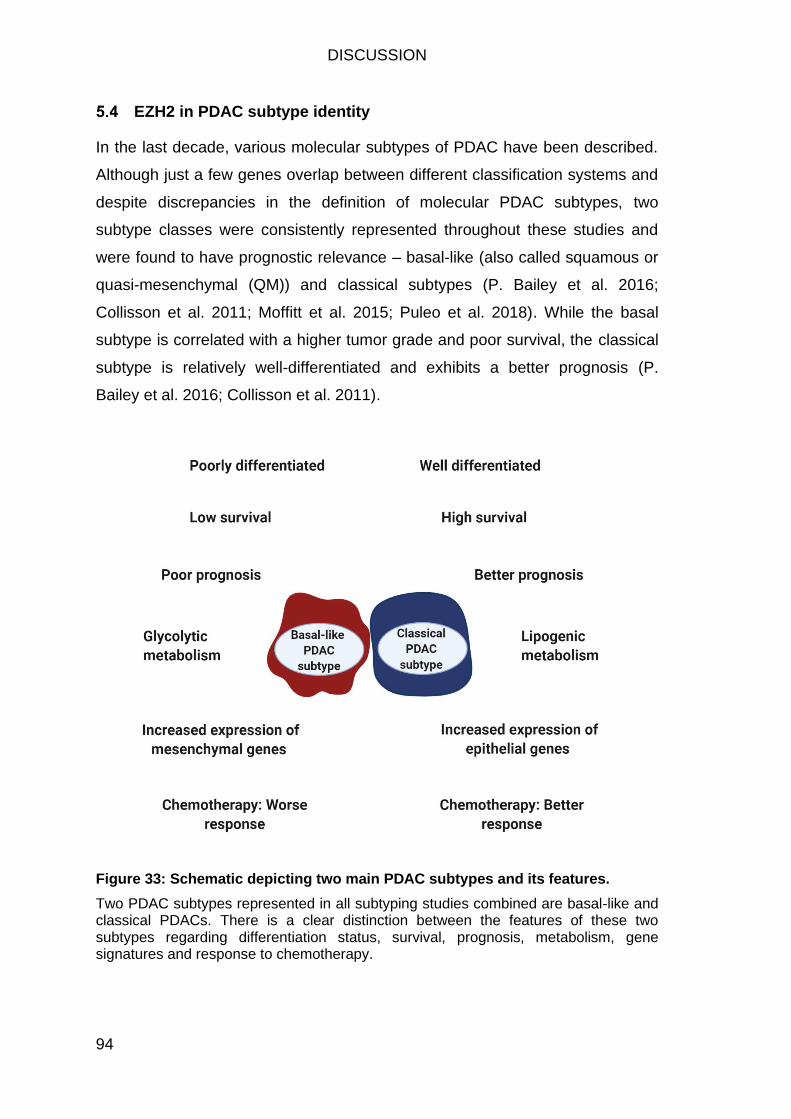
DISCUSSION
94
EZH2 in PDAC subtype identity
In the last decade, various molecular subtypes of PDAC have been described.
Although just a few genes overlap between different classification systems and
despite discrepancies in the definition of molecular PDAC subtypes, two
subtype classes were consistently represented throughout these studies and
were found to have prognostic relevance – basal-like (also called squamous or
quasi-mesenchymal (QM)) and classical subtypes (P. Bailey et al. 2016;
Collisson et al. 2011; Moffitt et al. 2015; Puleo et al. 2018). While the basal
subtype is correlated with a higher tumor grade and poor survival, the classical
subtype is relatively well-differentiated and exhibits a better prognosis (P.
Bailey et al. 2016; Collisson et al. 2011).
Figure 33: Schematic depicting two main PDAC subtypes and its features.
Two PDAC subtypes represented in all subtyping studies combined are basal-like and classical PDACs. There is a clear distinction between the features of these two subtypes regarding differentiation status, survival, prognosis, metabolism, gene signatures and response to chemotherapy.
DISCUSSION
95
Molecularly, basal tumors show increased TP63 expression (Mueller et al.
2018) and express genes related to EMT (Martens et al. 2019; Nicolle et al.
2017). In contrast, classical tumors are characterized by expression of
pancreatic developmental transcription factors and epithelial genes (P. Bailey et
al. 2016). Dissimilar with classical subtypes, basal subtypes lose expression of
master endodermal transcription factors that are required to maintain
endodermal differentiation (Adamo et al. 2017). Additionally, basal subtypes
regularly carry mutations in genes encoding chromatin regulatory proteins like
KDM6A (Andricovich et al. 2018). Reports also suggest a correlation of PDAC
subtypes with metabolism. While basal tumors are enriched for genes
regulating glycolytic pathways, classical tumors show enrichment for lipogenic
pathways (Daemen et al. 2015; Martens et al. 2019; Nicolle et al. 2017).
Evidence also suggests that these subtypes differ in their responses to
chemotherapy where basal tumors show an overall worse chemotherapeutic
response compared to classical tumors (Aung et al. 2019; P. Bailey et al. 2016;
Collisson et al. 2011; O’Kane et al. 2020). Together, there exists evidence for a
classical/basal-like subtype system in PDAC which embodies prognostic and
predictive relevance. Hence, molecular-subtype-driven stratification in PDAC
treatment might represent a promising strategy to tackle PDAC.
Differential gene expression analysis performed in our study revealed that
EZH2 loss led to the enrichment of transcriptional programs fostering a
favorable prognosis and promoting differentiation as well as a classical PDAC
subtype state. Additionally, basal-like gene signatures were negatively enriched
upon EZH2 depletion. These observations point out to a possibility of the
existence of the EZH2-high subgroup in the basal-like PDAC subtype.
However, we did not observe differences in EZH2 expression per se between
classical and basal-like PDAC subtype states in the published datasets (P.
Bailey et al. 2016; Diaferia et al. 2016; Puleo et al. 2018). This confirms that the
expression of EZH2 alone cannot be used as a predictive marker to determine
the subtype. To understand if manipulating EZH2 truly converts PDAC tumors
from basal to classical PDA tumors, EZH2 could be depleted in basal tumors
and further the EZH2 proficient and deficient basal tumors can be analyzed for
classical/basal PDAC features by staining for classical markers (E-Cadherin,
GATA6, HNF1A) and basal markers (KRT5, KRT14, TP63). However, we
DISCUSSION
96
speculate that EZH2 functions by repressing the classical genes rather than
modulating the basal genes.
GATA6 as a marker of the classical PDAC subtype
The transcription factor that was consistently mentioned in all PDAC molecular
subtyping studies was GATA6. The classical PDAC subtype defined by both
Moffit and Collison expressed elevated levels of GATA6 (Collisson et al. 2011;
Moffitt et al. 2015). Furthermore, Bailey et al. reported that GATA6 was
epigenetically repressed in the squamous subtype (P. Bailey et al. 2016). The
aforementioned subtyping studies and various other reports (G. Lomberk et al.
2018; Puleo et al. 2018; Seino et al. 2018; The Cancer Genome Atlas
Research Network and Raphael 2017) characterize the expression and activity
of GATA6 as the crucial driver of PDAC subtype identity.
GATA6 belongs to the family of GATA transcription factors that contains two
highly conserved zinc-finger DNA-binding domains that recognize an
(A/T)GATA(A/G) consensus nucleotide sequence. There are six GATA
members: while GATA 1-3 are predominantly expressed in the hematopoietic
lineage, GATA 4-6 are mainly present in the endodermal lineage (Rodríguez-
García, Sola-Landa, and Barreiro 2017; Tiyaboonchai et al. 2017). GATA6
drives endodermal lineage differentiation by transcriptionally activating lineage
defining transcription factors (Fisher et al. 2017). Consistently, Gata6 maintains
epithelial differentiation and suppresses mutant Kras-driven tumorigenesis in
the mouse pancreas by activating differentiation-related transcription programs
(Martinelli et al. 2016).
In pancreatic cancer models, GATA6 blocks dedifferentiation and abrogates
EMT programs. Moreover, dedifferentiated basal-like PDAC tumors with low
GATA6 expression associate with poor prognosis and low response to 5-
fluorouracil (5-FU) based adjuvant therapy (Martinelli et al. 2017). In addition to
these studies, results from the COMPASS trial identified GATA6 expression as
a robust surrogate biomarker for differentiating classical and basal PDAC
subtypes utilizing RNA sequencing and RNA in situ hybridization (ISH)
techniques (Aung et al. 2019). Besides, in the same COMPASS trial samples,
Kane et al. validated GATA6 as the prime classifier of the classical PDAC
DISCUSSION
97
subtype, while its expression is low or almost absent in basal-like tumors
(O’Kane et al. 2020).
Utilizing high throughput sequencing approaches, our findings identified Gata6
as a key target of EZH2-dependent transcriptional repression in PDAC.
Notably, GATA6 depletion in EZH2 deficient cells re-installed the invasive
potential of PDAC cells and also decreased the expression of classical PDAC
subtype genes, implying that EZH2-mediated GATA6 repression is crucial for
the tumor-promoting activities of the histone methyltransferase. However, to
what extend GATA6 expression impacts on EZH2-driven PDAC biology
remains to be elucidated, for instance by utilizing in vivo models with and
without Gata6 expression in the absence of EZH2.
PDAC subtype switching
PDAC subtypes are controlled at the level of transcription (P. Bailey et al. 2016;
Collisson et al. 2011; Moffitt et al. 2015; Puleo et al. 2018). Considering that
PDAC exhibits a high degree of plasticity and given that epigenetic alterations
are reversible, PDAC subtypes are potentially interconvertible. Importantly,
classical PDAC tumors exhibit a better prognosis and higher chemotherapeutic
susceptibility, thus underinning that subtype switching towards the classical
PDAC subtype constitutes an attractive strategy in PDAC treatment. Subtype
switching has for instance been reported for basal-like PDAC subtypes
harboring mutations in the histone demethylase encoding gene KDM6A. Loss
of KDM6A fosters aberrant rewiring of super-enhancers regulating oncogenes
such as ΔNp63, RUNX, and MYC, thereby promoting dedifferentiation to the
squamous-like subtype and metastatic PDAC. Furthermore, the study confirms
in vivo that KDM6A-deficient PDAC is more susceptible to BET inhibitors which
reverse basal differentiation and restrain PDAC growth. Overall, this study
reveals reprogramming of super-enhancers as a crucial mechanism for subtype
switching in pancreatic cancer (Andricovich et al. 2018). Besides the chromatin
regulatory proteins that control subtype-defining transcription programs,
subtype switching is also controlled by pioneer transcription factors. For
instance, Adams and colleagues provide detailed evidence stating Glioma-
associated oncogene homology 2 (GLI2) transcription factor as the critical
regulator of PDAC subtype switching. GLI2 mediates hedgehog signaling and
DISCUSSION
98
was found to be highly expressed in basal-like pancreatic cancer cell lines and
patient tissues. GLI2 activation could sufficiently switch PDAC cells from
classical to basal-like subtype harboring enhanced EMT potential. Additionally,
depletion of this transcription factor could suppress basal transcription
programs, suggesting interfering with GLI2 activity might provide a promising
strategy to push PDAC cells towards a less aggressive, classical subtype
(Adams et al. 2019). These studies emphasize the significant degree of
plasticity modulated by the chromatin factors and transcription factors in PDAC
subtypes.
Strategies to induce GATA6 expression for subtype switching
Switching from one subtype to another involves transcriptional reprogramming
of endodermal developmental and differentiation programs. Considering the
involvement of GATA6 in PDAC development, progression and differentiation
(Hermann et al. 2014; Martinelli et al. 2016, 2017) and its implications in the
classical PDAC subtype (Adams et al. 2019; Aung et al. 2019; P. Bailey et al.
2016; Collisson et al. 2011; Moffitt et al. 2015; O’Kane et al. 2020; Puleo et al.
2018), upregulation of GATA6 expression is an attractive strategy to promote
and maintain classical subtype identity. Consistently, the induction of GATA6
was observed in tumors upon switching from basal to classical subtypes in lung
and skin cancers (Biehs et al. 2018). Furthermore, the downregulation of
GATA6 mediated commitment to squamous subtype in lung cancer models
(Cheung et al. 2013). Consistently, similar observations are made in PDAC
subtype inter-conversion. For instance, while GATA6 expression declined in
GLI2-induced basal PDAC cells, loss of GLI2 resulted in increased GATA6
expression and acquisition of classical gene signatures (Adams et al. 2019).
Similarly, genetic depletion of the hepatocyte growth factor receptor MET in
basal PDAC subtypes resulted in a shift towards the classical phenotype which
involved upregulation of GATA6-dependent transcription programs (G. Lomberk
et al. 2018). These studies emphasize the role of the transcriptional regulator
GATA6 in subtype switching in pancreatic cancer. However, the strategies to
re-induce GATA6 expression are not well understood.
First insights on the dynamic regulation of GATA6 expression came from
reports focusing on developmental processes. These studies suggest that the
DISCUSSION
99
regulation of GATA6 expression occurs at the chromatin level (Fisher et al.
2017; Smith, Singh, and Dalton 2010; Suzuki et al. 2015), for instance by
transcriptional repression by PcG proteins. Gata6 expression is found to be
tightly regulated by polycomb proteins during cardiac development (Kang et al.
2010). Furthermore, genome-wide shRNA screening in embryonic stem cells
identified BCOR, an associated member of the PRC1 complex member
RING1B as an essential repressor of the GATA6 gene (Cooper and Brockdorff
2013). Further emphasizing the impact of the PcG family of chromatin
regulatory proteins in GATA6 regulation, the PRC2 core member EED
maintains neural stem cell differentiation by repressing GATA6 transcription
(Sun et al. 2018). Finally, loss of the histone methyltransferase EZH2 in mouse
embryos resulted in the differentiation of germ layers due to the de-repression
of Hoxb1, Hand1, and Gata6 (Huang et al, 2014).
However, the mechanisms controlling the expression of GATA6 in cancer
remain mainly elusive. Our study explored EZH2 dependent Gata6 regulation in
vitro in different PDAC murine (NKC, KPC) and human (PANC-1) cell lines
upon transient knockdown and stable knockout of EZH2 as well as upon
pharmacological EZH2 inhibition. Additionally, EZH2-dependent GATA6
regulation was recognized in PDX specimens at both mRNA and protein levels.
Our analysis in human samples also revealed a subgroup of PDAC patients
with EZH2 high/GATA6 low tumors, and these patients might be potentially
exhibiting EZH2 dependent GATA6 regulation. Combining all the data, our
findings identify a novel mechanism of GATA6 regulation in PDAC. EZH2
regulates Gata6 at the transcriptional level by binding on the TSS/promoter of
the Gata6 gene and depositing the H3K27me3 repressive mark. Upon loss of
EZH2, there is a reversal of this regulation which leads to increased Gata6
transcription and enrichment of GATA6 downstream targets. However, the
mechanism behind the recruitment of EZH2 to the Gata6 locus is yet to be
discovered. We have observed before that NFATc1 regulates EZH2 expression
in PDAC (Baumgart et al. 2014) and biochemically interacts with the
methyltransferase (unpublished data of the Hessmann group). Hence, NFATc1
might recruit EZH2 to the Gata6 promoter. Furthermore, one of the previous
report suggest KDM2B-mediated EZH2 recruitment to the Gata6 locus (Tzatsos
et al. 2013). Although the exact mechanism targeting EZH2 to the GATA6 gene
DISCUSSION
100
remains to be elucidated, our data suggest EZH2 inhibition as a promising
strategy to re-install GATA6 expression in a subgroup of PDAC.
Pharmacological inhibition of EZH2 in PDAC
EZH2 is a very attractive target in cancer therapy due to its oncogenic potential
in various cancer types (Raman et al. 2005; Rao et al. 2010; Völkel et al. 2015;
Zingg et al. 2015). Consequently, EZH2 inhibition was evaluated as a
therapeutic strategy in many cancer entities (Huang et al. 2015a; McCabe et al.
2012; Miele et al. 2017; Tan et al. 2007). Besides, the data on the safety and
efficacy of EZH2 inhibitors is already available from clinical trials in
hematological malignancies and selected solid tumors (e.g. NCT04179864,
NCT03010982). Consequently, pharmacological interference with EZH2 activity
represents a therapeutic option with strong translational potential in PDAC.
However, as described before in chapter 1.4.2, epigenetic mechanisms in
general, and EZH2 activity in particular, underlay a strong context-dependency.
Consequently, we proposed that the efficacy of EZH2 inhibition as a therapeutic
strategy in PDAC might be restricted to a subgroup of PDAC which
encompasses those molecular prerequisites required for beneficial EZH2
inhibition.
Given that our data suggest transcriptional repression of GATA6 as an
essential mechanism underlying oncogenic EZH2 activity, we propose that the
therapeutic efficacy of EZH2 inhibition is restricted to a subgroup of PDAC
patients characterized by high EZH2 activity and low GATA6 expression. In this
particular context, the EZH2 blockade might sufficiently re-install GATA6
expression with a subsequent shift towards gene signatures essential for
maintaining classical subtype identity. Based on our analysis in human PDAC
tissue the subgroup of EZH2high/GATA6low PDAC subtypes represents
approximately 40 % of PDAC patients. While pharmacological interference with
the EZH2-GATA6 axis might be beneficial in this subset of PDAC, EZH2
inhibition might eventually prove less efficient in tumors which are either
characterized by low EZH2 expression and activity and/or already express high
levels of GATA6. Indeed, EZH2-independent mechanisms controlling GATA6
expression have been reported previously. For instance, some cancer entities
including PDAC can be characterized by amplification of the GATA6 gene (N.
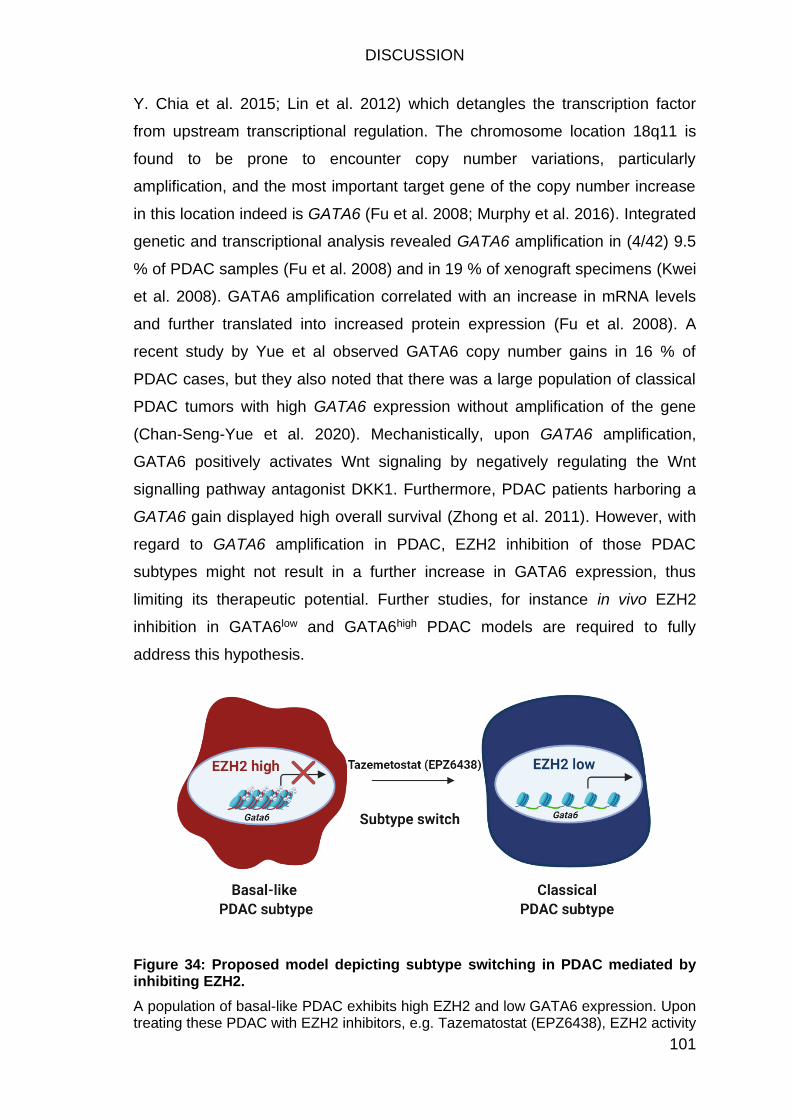
DISCUSSION
101
Y. Chia et al. 2015; Lin et al. 2012) which detangles the transcription factor
from upstream transcriptional regulation. The chromosome location 18q11 is
found to be prone to encounter copy number variations, particularly
amplification, and the most important target gene of the copy number increase
in this location indeed is GATA6 (Fu et al. 2008; Murphy et al. 2016). Integrated
genetic and transcriptional analysis revealed GATA6 amplification in (4/42) 9.5
% of PDAC samples (Fu et al. 2008) and in 19 % of xenograft specimens (Kwei
et al. 2008). GATA6 amplification correlated with an increase in mRNA levels
and further translated into increased protein expression (Fu et al. 2008). A
recent study by Yue et al observed GATA6 copy number gains in 16 % of
PDAC cases, but they also noted that there was a large population of classical
PDAC tumors with high GATA6 expression without amplification of the gene
(Chan-Seng-Yue et al. 2020). Mechanistically, upon GATA6 amplification,
GATA6 positively activates Wnt signaling by negatively regulating the Wnt
signalling pathway antagonist DKK1. Furthermore, PDAC patients harboring a
GATA6 gain displayed high overall survival (Zhong et al. 2011). However, with
regard to GATA6 amplification in PDAC, EZH2 inhibition of those PDAC
subtypes might not result in a further increase in GATA6 expression, thus
limiting its therapeutic potential. Further studies, for instance in vivo EZH2
inhibition in GATA6low and GATA6high PDAC models are required to fully
address this hypothesis.
Figure 34: Proposed model depicting subtype switching in PDAC mediated by inhibiting EZH2.
A population of basal-like PDAC exhibits high EZH2 and low GATA6 expression. Upon treating these PDAC with EZH2 inhibitors, e.g. Tazematostat (EPZ6438), EZH2 activity
DISCUSSION
102
is abolished which in turn de-represses GATA6 transcription and mediates switching to a less aggressive classical PDAC subtype (Adapted and modified from Adams et al. 2019).
Taken together, EZH2 inhibition might prove as an advantage in the treatment
of a subset of basal-like PDAC subtype patients exhibiting high EZH2 and low
GATA6 expression. Therefore, it is important to apply molecular stratification
approaches before advising EZH2 inhibition in PDAC therapy.
Conclusion
The key findings of this study are:
1. EZH2 has oncogenic potential in PDAC and mediates tumor
progression, dedifferentiation, metastasis and PDAC plasticity.
2. Loss of EZH2 results in the enrichment of gene signatures favoring
better prognosis, differentiation and a classical PDAC subtype state.
3. EZH2 transcriptionally represses GATA6, which is a crucial epithelial
transcription factor.
4. Genetic or pharmacological inhibition of EZH2 can re-install GATA6 in
PDAC cells, which further abrogates tumor-promoting functions of EZH2.
In summary, our findings link transcriptional GATA6 repression to EZH2-
dependent tumor progression in PDAC and suggest that pharmacological
interference with EZH2 activity specifically in a defined subset of PDAC patients
can re-install GATA6 expression in favor of a less aggressive and better
therapy-responsive tumor phenotype.

BIBLIOGRAPHY
103
6 BIBLIOGRAPHY
Adamo, Patricia et al. 2017. “Profiling Tumour Heterogeneity through Circulating Tumour DNA in Patients with Pancreatic Cancer.” Oncotarget 8(50): 87221–33.
Adams, Christina R. et al. 2019. “Transcriptional Control of Subtype Switching Ensures Adaptation and Growth of Pancreatic Cancer.” eLife 8: 1–25.
Anders, Simon, Paul Theodor Pyl, and Wolfgang Huber. 2015. “HTSeq-A Python Framework to Work with High-Throughput Sequencing Data.” Bioinformatics 31(2): 166–69.
Andricovich, Jaclyn et al. 2018. “Loss of KDM6A Activates Super-Enhancers to Induce Gender-Specific Squamous-like Pancreatic Cancer and Confers Sensitivity to BET Inhibitors.” Cancer Cell 33(3): 512-526.
Aranda, Sergi, Gloria Mas, and Luciano Di Croce. 2015. “Regulation of Gene Transcription by Polycomb Proteins.” Science Advances 1(11): 1–16.
Artal-Martinez de Narvajas, A. et al. 2013. “Epigenetic Regulation of Autophagy by the Methyltransferase G9a.” Molecular and Cellular Biology 33(20): 3983–93.
Audia, James E., and Robert M. Campbell. 2016. “Histone Modifications and Cancer.” Cold Spring Harbor Perspectives in Biology 8(4): 1–31.
Aung, Kyaw L et al. 2019. “HHS Public Access Cancer : Early Results from the COMPASS Trial.” 24(6): 1344–54.
Bachmann, Ingeborg M. et al. 2006. “EZH2 Expression Is Associated with High Proliferation Rate and Aggressive Tumor Subgroups in Cutaneous Melanoma and Cancers of the Endometrium, Prostate, and Breast.” Journal of Clinical Oncology 24(2): 268–73.
Baer, Romain et al. 2014. “Pancreatic Cell Plasticity and Cancer Initiation Induced by Oncogenic Kras Is Completely Dependent on Wild-Type PI 3-Kinase P110α.” Genes and Development 28(23): 2621–35.
Bailey, Jennifer M. et al. 2015. “DCLK1 Marks a Morphologically Distinct Subpopulation of Cells with Stem Cell Properties in Pre-Invasive Pancreatic Cancer.” 146(1): 245–56.
Bailey, Jennifer M., Kathleen E. DelGiorno, and Howard C. Crawford. 2014. “The Secret Origins and Surprising Fates of Pancreas Tumors.” Carcinogenesis 35(7): 1436–40.
Bailey, Peter et al. 2016. “Genomic Analyses Identify Molecular Subtypes of Pancreatic Cancer.” Nature 531(7592): 47–52.
Barton, C. M. et al. 1991. “Abnormalities of the P53 Tumour Suppressor Gene in Human Pancreatic Cancer.” British Journal of Cancer 64(6): 1076–81.
Bauer, Ashley J., and Kathleen A. Martin. 2017. “Coordinating Regulation of Gene Expression in Cardiovascular Disease: Interactions between Chromatin Modifiers and Transcription Factors.” Frontiers in Cardiovascular Medicine 4:1-19.
BIBLIOGRAPHY
104
Baumgart, Sandra et al. 2014. “Inflammation-Induced NFATc1-STAT3 Transcription Complex Promotes Pancreatic Cancer Initiation by KrasG12D.” Cancer Discovery 4(6): 688–701.
Berrozpe, Georgina et al. 1994. “Comparative Analysis of Mutations in the P53 and K‐ras Genes in Pancreatic Cancer.” International Journal of Cancer 58(2): 185–91.
Biankin, Andrew V et al. 2012. “Pancreatic cancer genomes reveal aberrations in axon guidance pathway genes.” Nature (7424): 399–405.
Biehs, Brian et al. 2018. “A Cell Identity Switch Allows Residual BCC to Survive Hedgehog Pathway Inhibition.” Nature 562(7727): 429–33.
Bishop, Karen S., and Lynnette R. Ferguson. 2015. “The Interaction between Epigenetics, Nutrition and the Development of Cancer.” Nutrients 7(2): 922–47.
Borowicz, Stanley et al. 2014. “The Soft Agar Colony Formation Assay.” Journal of Visualized Experiments (92): 1–6.
Bracken, Adrian P. et al. 2003. “EZH2 Is Downstream of the PRB-E2F Pathway, Essential for Proliferation and Amplified in Cancer.” EMBO Journal 22(20): 5323–35.
Bracken, Adrian P. et al. 2006. “Genome-Wide Mapping of Polycomb Target Genes Unravels Their Roles in Cell Fate Transitions.” Genes and Development 20(9): 1123–36.
Bray, Freddie et al. 2018. “Global Cancer Statistics 2018: GLOBOCAN Estimates of Incidence and Mortality Worldwide for 36 Cancers in 185 Countries.” CA: A Cancer Journal for Clinicians 68(6): 394–424.
Bremer, Sebastian C.B. et al. 2019. “Enhancer of Zeste Homolog 2 in Colorectal Cancer Development and Progression.” Digestion.
Busnardo, A. C., L. J.A. Didio, R. T. Tidrick, and N. R. Thomford. 1983. “History of the Pancreas.” American Journal of Surgery 146(5): 539–50.
Cai, Wesley L. et al. 2020. “Specific Chromatin Landscapes and Transcription Factors Couple Breast Cancer Subtype with Metastatic Relapse to Lung or Brain.” BMC Medical Genomics 13(1): 1–18.
Caldas, C et al. 1994. “Frequent Somatic Mutations and Homozygous Deletions of the P16 (MTS1) Gene in Pancreatic Adenocarcinoma.” Nature genetics 8(1): 27–32.
Cancer Genome Atlas Research Network et al. 2013. “The Cancer Genome Atlas Pan-Cancer Analysis Project.” Nature genetics 45(10): 1113–20.
Chan-Penebre, Elayne et al. 2017. “Selective Killing of SMARCA2- and SMARCA4-Deficient Small Cell Carcinoma of the Ovary, Hypercalcemic Type Cells by Inhibition of EZH2: In Vitro and in Vivo Preclinical Models.” Molecular Cancer Therapeutics 16(5): 850–60.
Chan-Seng-Yue, Michelle et al. 2020. "Transcription Phenotypes of Pancreatic Cancer Are Driven by Genomic Events during Tumor Evolution." Nature Genetics 52(2): 231-240.
BIBLIOGRAPHY
105
Chen, Jian, Franklin H. Herlong, John R. Stroehlein, and Lopa Mishra. 2016. “Mutations of Chromatin Structure Regulating Genes in Human Malignancies.” Current Protein & Peptide Science 17(5): 411–37.
Chen, Jiangzhi et al. 2014. “Snail Recruits Ring1B to Mediate Transcriptional Repression and Cell Migration in Pancreatic Cancer Cells.” Cancer Research 74(16): 4353–63.
Chen, Nai Ming et al. 2017. “Context-Dependent Epigenetic Regulation of Nuclear Factor of Activated T Cells 1 in Pancreatic Plasticity.” Gastroenterology 152(6): 1507-1520.
Chen, Ya Huey, Mien Chie Hung, and Long Yuan Li. 2012. “EZH2: A Pivotal Regulator in Controlling Cell Differentiation.” American Journal of Translational Research 4(4): 364–75.
Chen, Ya Tian et al. 2016. “The Novel EZH2 Inhibitor, GSK126, Suppresses Cell Migration and Angiogenesis via down-Regulating VEGF-A.” Cancer Chemotherapy and Pharmacology 77(4): 757–65.
Chen, Yang et al. 2018. “Dual Reporter Genetic Mouse Models of Pancreatic Cancer Identify an Epithelial‐to‐mesenchymal Transition‐independent Metastasis Program.” EMBO Molecular Medicine 10(10): 1–13.
Cheung, William K C et al. 2013. “Control of Alveolar Differentiation by the Lineage Transcription Factors GATA6 and HOPX Inhibits Lung Adenocarcinoma Metastasis.” Cancer cell 23(6): 725–38.
Chia, Crystal Y. et al. 2019. “GATA6 Cooperates with EOMES/SMAD2/3 to Deploy the Gene Regulatory Network Governing Human Definitive Endoderm and Pancreas Formation.” Stem Cell Reports 12(1): 57–70.
Chia, Na Yu et al. 2015. “Regulatory Crosstalk between Lineage-Survival Oncogenes KLF5, GATA4 and GATA6 Cooperatively Promotes Gastric Cancer Development.” Gut 64(5): 707–19.
Chou, Ruey Hwang, Lian Chiu, Yung Luen Yu, and Woei Cherng Shyu. 2015. “The Potential Roles of EZH2 in Regenerative Medicine.” Cell Transplantation 24(3): 313–17.
Collisson, Eric A et al. 2011. “Differing Responses to Therapy.” Nat med 17(4): 500–503.
Cooper, Sarah, and Neil Brockdorff. 2013. “Genome-Wide ShRNA Screening to Identify Factors Mediating Gata6 Repression in Mouse Embryonic Stem Cells.” Development (Cambridge) 140(19): 4110–15.
Corradini, N. et al. 2007. “Drosophila Melanogaster as a Model for Studying Protein-Encoding Genes That Are Resident in Constitutive Heterochromatin.” Heredity 98(1): 3–12.
Cui, Jing et al. 2015. “EHMT2 Inhibitor BIX-01294 Induces Apoptosis through PMAIP1-USP9X-MCL1 Axis in Human Bladder Cancer Cells.” Cancer Cell International 15(1): 1–9.
BIBLIOGRAPHY
106
Daemen, Anneleen et al. 2015. “Metabolite Profiling Stratifies Pancreatic Ductal Adenocarcinomas into Subtypes with Distinct Sensitivities to Metabolic Inhibitors.” Proceedings of the National Academy of Sciences of the United States of America 112(32): E4410–17.
Dambacher, S., M. Hahn, and G. Schotta. 2010. “Epigenetic Regulation of Development by Histone Lysine Methylation.” Heredity 105(1): 24–37.
Dawkins, Joshua B.N. et al. 2016. “Reduced Expression of Histone Methyltransferases KMT2C and KMT2D Correlates with Improved Outcome in Pancreatic Ductal Adenocarcinoma.” Cancer Research 76(16): 4861–71.
Denny, Sarah K. et al. 2016. “Nfib Promotes Metastasis through a Widespread Increase in Chromatin Accessibility.” Cell 166(2): 328–42.
Deschamps, Jacqueline et al. 1999. “Initiation, Establishment and Maintenance of Hox Gene Expression Patterns in the Mouse.” International Journal of Developmental Biology 43(7): 635–50.
Diaferia, Giuseppe R et al. 2016. “ Dissection of Transcriptional and Cis ‐regulatory Control of Differentiation in Human Pancreatic Cancer .” The EMBO Journal 35(6): 595–617.
Du, Yongxing et al. 2017. “Molecular Subtyping of Pancreatic Cancer: Translating Genomics and Transcriptomics into the Clinic.” Journal of Cancer 8(4): 513–22.
Dumartin, L. et al. 2017. “ER Stress Protein AGR2 Precedes and Is Involved in the Regulation of Pancreatic Cancer Initiation.” Oncogene 36(22): 3094–3103.
Ellis, Chad A., and Geoff Clark. 2000. “The Importance of Being K-Ras.” Cellular Signalling 12(7): 425–34.
Fan, Tao et al. 2012. “EZH2-Dependent Suppression of a Cellular Senescence Phenotype in Melanoma Cells by Inhibition of P21/CDKN1A Expression.” Molecular cancer research 9(4): 418–29.
Feber, Andrew et al. 2004. “Amplification and Overexpression of E2F3 in Human Bladder Cancer.” Oncogene 23(8): 1627–30.
Fedchenko, Nickolay, and Janin Reifenrath. 2014. “Different Approaches for Interpretation and Reporting of Immunohistochemistry Analysis Results in the Bone Tissue - a Review.” Diagnostic pathology 9: 221.
Fedorova, Elena, and Daniele Zink. 2008. “Nuclear Architecture and Gene Regulation.” Biochimica et Biophysica Acta - Molecular Cell Research 1783(11): 2174–84.
Ferlay, J. et al. 2018. “Cancer Incidence and Mortality Patterns in Europe: Estimates for 40 Countries and 25 Major Cancers in 2018.” European Journal of Cancer 103: 356–87.
Fisher, J. B., K. Pulakanti, S. Rao, and S. A. Duncan. 2017. “GATA6 Is Essential for Endoderm Formation from Human Pluripotent Stem Cells.” Biology Open 6(7): 1084–95.
BIBLIOGRAPHY
107
Flavahan, William A., Elizabeth Gaskell, and Bradley E. Bernstein. 2017. “Epigenetic Plasticity and the Hallmarks of Cancer.” Science 357(6348).
Fu, Baojin et al. 2008. “Frequent Genomic Copy Number Gain and Overexpression of GATA-6 in Pancreatic Carcinoma.” Cancer Biology and Therapy 7(10): 1593–1601.
Fujii, S. et al. 2011. “MEK-ERK Pathway Regulates EZH2 Overexpression in Association with Aggressive Breast Cancer Subtypes.” Oncogene 30(39): 4118–28.
Gaudichon, Jérémie et al. 2014. “Deazaneplanocin a Is a Promising Drug to Kill Multiple Myeloma Cells in Their Niche.” PLoS ONE 9(9): 1–12.
Glozak, M. A., and E. Seto. 2007. “Histone Deacetylases and Cancer.” Oncogene 26(37): 5420–32.
Goll, Mary Grace, and Timothy H. Bestor. 2002. “Histone Modification and Replacement in Chromatin Activation.” Genes and Development 16(14): 1739–42.
Gordon-Dseagu, Vanessa L., Susan S. Devesa, Michael Goggins, and Rachael Stolzenberg-Solomon. 2018. “Pancreatic Cancer Incidence Trends: Evidence from the Surveillance, Epidemiology and End Results (SEER) Population-Based Data.” International Journal of Epidemiology 47(2): 427–39.
Grassi, Elisa et al. 2018. “Mutational Burden of Resectable Pancreatic Cancer, as Determined by Whole Transcriptome and Whole Exome Sequencing, Predicts a Poor Prognosis.” International Journal of Oncology 52(6): 1972–80.
Guerra, Carmen et al. 2007. “Chronic Pancreatitis Is Essential for Induction of Pancreatic Ductal Adenocarcinoma by K-Ras Oncogenes in Adult Mice.” Cancer Cell 11(3): 291–302.
Guerra, Carmen, and Mariano Barbacid. 2013. “Genetically Engineered Mouse Models of Pancreatic Adenocarcinoma.” Molecular Oncology 7(2): 232–47.
Gulati, Nitya, Wendy Béguelin, and Lisa Giulino-Roth. 2018. “Enhancer of Zeste Homolog 2 (EZH2) Inhibitors.” Leukemia & Lymphoma 59(7): 1574–85.
Gunawan, Merry et al. 2015. “The Methyltransferase Ezh2 Controls Cell Adhesion and Migration through Direct Methylation of the Extranuclear Regulatory Protein Talin.” Nature Immunology 16(5): 505–16.
Hahn, Stephan A. et al. 1996. “DPC4, a Candidate Tumor Suppressor Gene at Human Chromosome 18q21.1.” Science 271(5247): 350–53.
Han, Ting et al. 2016. “EZH2 Promotes Cell Migration and Invasion but Not Alters Cell Proliferation by Suppressing E-Cadherin, Partly through Association with MALAT-1 in Pancreatic Cancer.” Oncotarget 7(10): 11194–207.
Hanahan, Douglas, and Robert A. Weinberg. 2011. “Hallmarks of Cancer: The next Generation.” Cell 144(5): 646–74.
Hansel, Donna E., Scott E. Kern, and Ralph H. Hruban. 2003. “ M Olecular P Athogenesis of P Ancreatic C Ancer .” Annual Review of Genomics and Human Genetics 4(1): 237–56.
BIBLIOGRAPHY
108
Hasan, Nesrin, and Nita Ahuja. 2019. 11 Cancers The Emerging Roles of ATP-Dependent Chromatin Remodeling Complexes in Pancreatic Cancer.
Hauer, Michael H., and Susan M. Gasser. 2017. “Chromatin and Nucleosome Dynamics in DNA Damage and Repair.” Genes and Development 31(22): 2204–21.
He, Aibin et al. 2012. “PRC2 Directly Methylates GATA4 and Represses Its Transcriptional Activity.” Genes & development 26(1): 37–42.
Hemming, Sarah et al. 2016. “Identification of Novel EZH2 Targets Regulating Osteogenic Differentiation in Mesenchymal Stem Cells.” Stem Cells and Development 25(12): 909–21.
Hermann, Patrick C. et al. 2014. “Nicotine Promotes Initiation and Progression of KRAS-Induced Pancreatic Cancer via Gata6-Dependent Dedifferentiation of Acinar Cells in Mice.” Gastroenterology 147(5): 1119-1133.e4.
Hessmann, Elisabeth, Steven A. Johnsen, Jens T. Siveke, and Volker Ellenrieder. 2017. “Epigenetic Treatment of Pancreatic Cancer: Is There a Therapeutic Perspective on the Horizon?” Gut 66(1): 168–79.
Hingorani, Sunil R. et al. 2003. “Preinvasive and Invasive Ductal Pancreatic Cancer and Its Early Detection in the Mouse.” Cancer Cell 4(6): 437–50.
Hingorani, Sunil R et al. 2005. “Trp53R172H and KrasG12D Cooperate to Promote Chromosomal Instability and Widely Metastatic Pancreatic Ductal Adenocarcinoma in Mice.” Cancer Cell 7(5): 469–83.
Van Holde, K. E. et al. 1980. “DNA-Histone Interactions in Nucleosomes.” Biophysical Journal 32(1): 271–82.
Holliday, Robin. 1994. “Epigenetics : An Overview.” Developmental Genetics 453457.
Honma, Daisuke et al. 2017. “Novel Orally Bioavailable EZH1/2 Dual Inhibitors with Greater Antitumor Efficacy than an EZH2 Selective Inhibitor.” Cancer Science 108(10): 2069–78.
Hormaeche, Itsaso, and Jonathan D. Licht. 2007. “Chromatin Modulation by Oncogenic Transcription Factors: New Complexity, New Therapeutic Targets.” Cancer Cell 11(6): 475–78.
Hruban, R. H. et al. 1993. “K-Ras Oncogene Activation in Adenocarcinoma of the Human Pancreas: A Study of 82 Carcinomas Using a Combination of Mutant-Enriched Polymerase Chain Reaction Analysis and Allele-Specific Oligonucleotide Hybridization.” American Journal of Pathology 143(2): 545–54.
Huang, Ling et al. 2015. “Ductal Pancreatic Cancer Modeling and Drug Screening Using Human Pluripotent Stem Cell- and Patient-Derived Tumor Organoids.” Nature medicine 21(11): 1364–71.
Hussain, Mustafa et al. 2009. “Tobacco Smoke Induces Polyeomb-Mediated Repression of Dickkopf-1 in Lung Cancer Cells.” Cancer Research 69(8): 3570–78.
Hyun, Kwangbeom, Jongcheol Jeon, Kihyun Park, and Jaehoon Kim. 2017. “Writing, Erasing and Reading Histone Lysine Methylations.” Experimental and Molecular Medicine 49(4): 324-22.
BIBLIOGRAPHY
109
Iacobuzio-Donahue, Christine A. 2012. “Genetic Evolution of Pancreatic Cancer: Lessons Learnt from the Pancreatic Cancer Genome Sequencing Project.” Gut 61(7): 1085–94.
Ideraabdullah, Folami Y., and Steven H. Zeisel. 2018. “Dietary Modulation of the Epigenome.” Physiological Reviews 98(2): 667–95.
Iguchi, Eriko et al. 2016. “Pancreatic Cancer, a Mis-Interpreter of the Epigenetic Language.” Yale Journal of Biology and Medicine 89(4): 575–90.
Italiano, Antoine et al. 2018. “Tazemetostat, an EZH2 Inhibitor, in Relapsed or Refractory B-Cell Non-Hodgkin Lymphoma and Advanced Solid Tumours: A First-in-Human, Open-Label, Phase 1 Study.” The Lancet Oncology 19(5): 649–59.
Jankowska, Anna M et al. 2011. “Mutational Spectrum Analysis of Chronic Myelomonocytic Leukemia Includes Genes Associated with Epigenetic Regulation: UTX, EZH2 & DNMT3A.” Blood 118(14): 3932 – 3941.
Janky, Rekin’s et al. 2016. “Prognostic Relevance of Molecular Subtypes and Master Regulators in Pancreatic Ductal Adenocarcinoma.” BMC Cancer 16(1): 1–15.
Janzen, William P., Tim J. Wigle, Jian Jin, and Stephen V. Frye. 2010. “Epigenetics: Tools and Technologies.” Drug Discovery Today: Technologies 7(1): 59–65.
Jones, Siân et al. 2008. “Core Signaling Pathways in Human Pancreatic Cancer Revealed.” Science 321(5897): 1801–6.
Juiz, Natalia Anahi, Juan Iovanna, and Nelson Dusetti. 2019. “Pancreatic Cancer Heterogeneity Can Be Explained beyond the Genome.” Frontiers in Oncology 9(4): 1–8.
Kang, Xunlei et al. 2010. “SUMO-Specific Protease 2 Is Essential for Suppression of Polycomb Group Protein-Mediated Gene Silencing during Embryonic Development.” Molecular cell 38(2): 191–201.
Kennison, James A. 1995. “THE POL YCOMB AND PROTEINS OF DROSOPHILA : Trans-Regulators of Homeotic Gene Function.” Annual Review of Genetics: 289–303.
Ketel, C. S. et al. 2005. “Subunit Contributions to Histone Methyltransferase Activities of Fly and Worm Polycomb Group Complexes.” Molecular and Cellular Biology 25(16): 6857–68.
Khuong-Quang, Dong Anh et al. 2012. “K27M Mutation in Histone H3.3 Defines Clinically and Biologically Distinct Subgroups of Pediatric Diffuse Intrinsic Pontine Gliomas.” Acta Neuropathologica 124(3): 439–47.
Kim, Daehwan et al. 2013. “TopHat2: Accurate Alignment of Transcriptomes in the Presence of Insertions, Deletions and Gene Fusions.” Genome Biology 14(4): R36.
Kim, Kimberly H et al. 2015. “SWI/SNF-Mutant Cancers Depend on Catalytic and Non-Catalytic Activity of EZH2.” Nature medicine 21(12): 1491–96.
Kim, Shinuk et al. 2014. “Identifying Molecular Subtypes Related to Clinicopathologic Factors in Pancreatic Cancer.” BioMedical Engineering Online 13(Suppl 2): S5.
BIBLIOGRAPHY
110
Kleer, Celina G. et al. 2003. “EZH2 Is a Marker of Aggressive Breast Cancer and Promotes Neoplastic Transformation of Breast Epithelial Cells.” Proceedings of the National Academy of Sciences of the United States of America 100(20): 11606–11.
Knutson, Sarah K. et al. 2013. “Durable Tumor Regression in Genetically Altered Malignant Rhabdoid Tumors by Inhibition of Methyltransferase EZH2.” Proceedings of the National Academy of Sciences of the United States of America 110(19): 7922–27.
Köenig, Alexander et al. 2010. “NFAT-Induced Histone Acetylation Relay Switch Promotes c-Myc-Dependent Growth in Pancreatic Cancer Cells.” Gastroenterology 138(3): 1–18.
Kopp, Janel L et al. 2012. “Identification of Sox9-Dependent Acinar-to-Ductal Reprogramming as the Principal Mechanism for Initiation of Pancreatic Ductal Adenocarcinoma.” Cancer cell 22(6): 737–50.
Kunnumakkara, Ajaikumar B. et al. 2007. “Curcumin Potentiates Antitumor Activity of Gemcitabine in an Orthotopic Model of Pancreatic Cancer through Suppression of Proliferation, Angiogenesis, and Inhibition of Nuclear Factor-ΚB-Regulated Gene Products.” Cancer Research 67(8): 3853–61.
Kwei, Kevin A. et al. 2008. “Genomic Profiling Identifies GATA6 as a Candidate Oncogene Amplified in Pancreatobiliary Cancer.” PLoS Genetics 4(5) 13-20.
Langmead, Ben, and Steven L Salzberg. 2012. “Fast Gapped-Read Alignment with Bowtie 2.” Nature Methods 9(4): 357–59.
Lathia, Justin D., and Huiping Liu. 2017. “Overview of Cancer Stem Cells and Stemness for Community Oncologists.” Targeted Oncology 12(4): 387–99.
Lee, Ji Min et al. 2012. “EZH2 Generates a Methyl Degron That Is Recognized by the DCAF1/DDB1/CUL4 E3 Ubiquitin Ligase Complex.” Molecular Cell 48(4): 572–86.
Li, Gang. 2015. “Patient-Derived Xenograft Models for Oncology Drug Discovery.” Journal of Cancer Metastasis and Treatment 5(2): 10-30.
Lin et al. 2012. “Activation of GATA Binding Protein 6 (GATA6) Sustains Oncogenic Lineage-Survival in Esophageal Adenocarcinoma.” Proceedings of the National Academy of Sciences of the United States of America 109(11): 4251–56.
Liu, Fan, Lan Wang, Fabiana Perna, and Stephen D. Nimer. 2016. “Beyond Transcription Factors: How Oncogenic Signalling Reshapes the Epigenetic Landscape.” Nature Reviews Cancer 16(6): 359–72.
Lomberk, Gwen et al. 2018. “Distinct Epigenetic Landscapes Underlie the Pathobiology of Pancreatic Cancer Subtypes.” Nature Communications 9(1): 1–10.
Lomberk, Gwen A., Juan Iovanna, and Raul Urrutia. 2016. “The Promise of Epigenomic Therapeutics in Pancreatic Cancer.” Epigenomics 8(6): 831–42.
Lorberbaum, David S., and Lori Sussel. 2017. “Gotta Have GATA for Human Pancreas Development.” Cell Stem Cell 20(5): 577–79.
Lorenzo, Alessandra Di, and Mark T Bedford. 2011. “Histone Arginine Methylation.” FEBS lett 7(1): 66.
BIBLIOGRAPHY
111
Ma, Anqi et al. 2020. “Discovery of a First-in-Class EZH2 Selective Degrader.” Nature chemical biology 16(2): 214–22.
Mahara, Sylvia et al. 2016. “HIFI-α Activation Underlies a Functional Switch in the Paradoxical Role of Ezh2/PRC2 in Breast Cancer.” Proceedings of the National Academy of Sciences of the United States of America 113(26): 3735–44.
Mallen-St. Clair, Jon et al. 2012. “EZH2 Couples Pancreatic Regeneration to Neoplastic Progression.” Genes and Development 26(5): 439–44.
Mani, Udayakumar, Alagu Sankareswaran S, Arun Goutham R N, and Suma Mohan S. 2017. “SWI/SNF Infobase - An Exclusive Information Portal for SWI/SNF Remodeling Complex Subunits.” PLoS ONE 12(9): 1–11.
Margueron, Raphael et al. 2008. “Ezh1 and Ezh2 Maintain Repressive Chromatin through Different Mechanisms.” Molecular Cell 32(4): 503–18.
Marmorstein, Ronen, and Ming Ming Zhou. 2014. “Writers and Readers of Histone Acetylation: Structure, Mechanism, and Inhibition.” Cold Spring Harbor Perspectives in Biology 6(7): 1–25.
Martens, S. et al. 2019. “Different Shades of Pancreatic Ductal Adenocarcinoma, Different Paths towards Precision Therapeutic Applications.” Annals of Oncology 30(9): 1428–36.
Martinelli, Paola et al. 2016. “The Acinar Regulator Gata6 Suppresses KRasG12V-Driven Pancreatic Tumorigenesis in Mice.” Gut 65(3): 476–86.
Martinelli, Paola et al. 2017. “GATA6 Regulates EMT and Tumour Dissemination, and Is a Marker of Response to Adjuvant Chemotherapy in Pancreatic Cancer.” Gut 66(9): 1665–76.
Maurer, Carlo et al. 2019. “Experimental Microdissection Enables Functional Harmonisation of Pancreatic Cancer Subtypes.” Gut 68(6): 1034–43.
McCabe, Michael T. et al. 2012. “EZH2 Inhibition as a Therapeutic Strategy for Lymphoma with EZH2-Activating Mutations.” Nature 492(7427): 108–12.
McGrath, John, and Patrick Trojer. 2015. “Targeting Histone Lysine Methylation in Cancer.” Pharmacology and Therapeutics 150: 1–22.
Mclean, Cory Y et al. 2010. “GREAT Improves Functional Interpretation of Cis-Regulatory Regions HHS Public Access Author Manuscript.” Nat Biotechnol 28(5): 495–501.
Miele, Evelina et al. 2017. “The Histone Methyltransferase EZH2 as a Druggable Target in SHH Medulloblastoma Cancer Stem Cells.” Oncotarget 8(40): 68557–70.
van Mierlo, G., Gert Jan C. Veenstra, Michiel Vermeulen, and Hendrik Marks. 2019. “The Complexity of PRC2 Subcomplexes.” Trends in Cell Biology 29(8): 660–71.
Moffitt, Richard A. et al. 2015. “Virtual Microdissection Identifies Distinct Tumor- and Stroma-Specific Subtypes of Pancreatic Ductal Adenocarcinoma.” Nature Genetics 47(10): 1168–78.
BIBLIOGRAPHY
112
Morgan, Marc A., and Ali Shilatifard. 2015. “Chromatin Signatures of Cancer.” Genes and Development 29(3): 238–49.
Morin, Ryan D et al. 2010. “Somatic Mutations Altering EZH2 (Tyr641) in Follicular and Diffuse Large B-Cell Lymphomas of Germinal-Center Origin.” Nature Genetics 42(2): 181–85.
Morris, John et al. 2010. “β-Catenin Blocks Kras-Dependent Reprogramming of Acini into Pancreatic Cancer Precursor Lesions in Mice.” Journal of Clinical Investigation 120(2): 508–20.
Moses, Marsha A., and Di Jia. 2013. “Regulation of Tumor Angiogenesis.” Encyclopedia of Systems Biology 18(2): 1834–37.
Mottamal, Madhusoodanan, Shilong Zheng, Tien L. Huang, and Guangdi Wang. 2015. “Histone Deacetylase Inhibitors in Clinical Studies as Templates for New Anticancer Agents.” Molecules 20(3): 3898–3941.
Mueller, Sebastian et al. 2018. “Evolutionary Routes and KRAS Dosage Define Pancreatic Cancer Phenotypes.” Nature 554(7690): 62–68.
Müller, Jürg et al. 2002. “Histone Methyltransferase Activity of a Drosophila Polycomb Group Repressor Complex.” Cell 111(2): 197–208.
Murphy, Stephen J et al. 2016. “Integrated Genomic Analysis of Pancreatic Ductal Adenocarcinomas Reveals Genomic Rearrangement Events as Significant Drivers of Disease.” Cancer research 76(3): 749–61.
Musladin, Sanja, Nils Krietenstein, Philipp Korber, and Slobodan Barbaric. 2014. “The RSC Chromatin Remodeling Complex Has a Crucial Role in the Complete Remodeler Set for Yeast PHO5 Promoter Opening.” Nucleic Acids Research 42(7): 4270–82.
Nangia-Makker, Pratima, Victor Hogan, and Avraham Raz. 2018. “Galectin-3 and Cancer Stemness.” Glycobiology 28(4): 172–81.
Nicolle, Rémy et al. 2017. “Pancreatic Adenocarcinoma Therapeutic Targets Revealed by Tumor-Stroma Cross-Talk Analyses in Patient-Derived Xenografts.” Cell reports 21(9): 2458–70.
Nieto, M. Angela, Ruby Yun Y.J. Huang, Rebecca A A. Jackson, and Jean Paul P. Thiery. 2016. “Emt: 2016.” Cell 166(1): 21–45.
Ntziachristos, Panagiotis et al. 2012. “Genetic Inactivation of the PRC2 Complex in T-Cell Acute Lymphoblastic Leukemia.” Nature medicine 18(2): 298–301.
O’Kane, Grainne M et al. 2020. “GATA6 Expression Distinguishes Classical and Basal-like Subtypes in Advanced Pancreatic Cancer.” Clinical Cancer Research 5(2) :3724.2019.
Olive, Kenneth P., and David A. Tuveson. 2006. “The Use of Targeted Mouse Models for Preclinical Testing of Novel Cancer Therapeutics.” Clinical Cancer Research 12(18): 5277–87.
Orth, Michael et al. 2019. “Pancreatic Ductal Adenocarcinoma: Biological Hallmarks, Current Status, and Future Perspectives of Combined Modality Treatment Approaches.” Radiation Oncology 14(1): 1–20.
BIBLIOGRAPHY
113
Ouaïssi, Mehdi et al. 2014. “Further Characterization of HDAC and SIRT Gene Expression Patterns in Pancreatic Cancer and Their Relation to Disease Outcome.” PLoS ONE 9(10): 1–14.
Ougolkov, Andrei V, Vladimir N Bilim, and Daniel D Billadeau. 2008. “Regulation of Pancreatic Tumor Proliferation and Chemoresistance by the Histone Methyltransferase EZH2.” Clinical Cancer Research 14(21): 6790–96.
Paradise, Brooke D., Whitney Barham, and Martín E. Fernandez-Zapico. 2018. “Targeting Epigenetic Aberrations in Pancreatic Cancer, a New Path to Improve Patient Outcomes?” Cancers 10(5): 1–16.
Pérez-Salvia, Montserrat, and Manel Esteller. 2017. “Bromodomain Inhibitors and Cancer Therapy: From Structures to Applications.” Epigenetics 12(5): 323–39.
Polyak, Kornelia, and Robert A. Weinberg. 2009. “Transitions between Epithelial and Mesenchymal States: Acquisition of Malignant and Stem Cell Traits.” Nature Reviews Cancer 9(4): 265–73.
Priedigkeit, Nolan et al. 2017. “Intrinsic Subtype Switching and Acquired ERBB2 / HER2 Amplifications and Mutations in Breast Cancer Brain Metastases.” JAMA Oncology 3(5): 666-677.
Puleo, Francesco et al. 2018. “Stratification of Pancreatic Ductal Adenocarcinomas Based on Tumor and Microenvironment Features.” Gastroenterology 155(6): 1999-2013.
Puppe, Julian et al. 2009. “BRCA1-Deficient Mammary Tumor Cells Are Dependent on EZH2 Expression and Sensitive to Polycomb Repressive Complex 2-Inhibitor 3-Deazaneplanocin A.” Breast Cancer Research 11(4): 1–12.
Qazi, Aamer M et al. 2012. “Restoration of E-Cadherin Expression in Pancreatic Ductal Adenocarcinoma Treated with MicroRNA-101.” Surgery 152(4): 704–11.
Rahib, Lola et al. 2014. “Projecting Cancer Incidence and Deaths to 2030: The Unexpected Burden of Thyroid, Liver, and Pancreas Cancers in the United States.” Cancer Research 74(11): 2913–21.
Raman, Jay D. et al. 2005. “Increased Expression of the Polycomb Group Gene, EZH2, in Transitional Cell Carcinoma of the Bladder.” Clinical Cancer Research 11(24): 8570–76.
Ramírez, Fidel et al. 2016. “DeepTools2: A next Generation Web Server for Deep-Sequencing Data Analysis.” Nucleic acids research 44(1): 160–65.
Rao, Zhi Yue et al. 2010. “EZH2 Supports Ovarian Carcinoma Cell Invasion and/or Metastasis via Regulation of TGF-β 1 and Is a Predictor of Outcome in Ovarian Carcinoma Patients.” Carcinogenesis 31(9): 1576–83.
Rawla, Prashanth, Tagore Sunkara, and Vinaya Gaduputi. 2019. “Epidemiology of Pancreatic Cancer: Global Trends, Etiology and Risk Factors.” World Journal of Oncology 10(1): 10–27.
Ray, Kevin C. et al. 2011. “Epithelial Tissues Have Varying Degrees of Susceptibility to KrasG12D-Initiated Tumorigenesis in a Mouse Model.” PLoS ONE 6(2).
BIBLIOGRAPHY
114
Richart, Laia, and Raphaël Margueron. 2020. “Drugging Histone Methyltransferases in Cancer.” Current Opinion in Chemical Biology 56: 51–62.
Richly, H., L. Aloia, and L. Di Croce. 2011. “Roles of the Polycomb Group Proteins in Stem Cells and Cancer.” Cell Death and Disease 2(9): 204-7.
Richter, Günther H.S. et al. 2009. “EZH2 Is a Mediator of EWS/FLI1 Driven Tumor Growth and Metastasis Blocking Endothelial and Neuro-Ectodermal Differentiation.” Proceedings of the National Academy of Sciences of the United States of America 106(13): 5324–29.
Ringrose, Leonie, and Renato Paro. 2004. “Epigenetic Regulation of Cellular Memory by the Polycomb and Trithorax Group Proteins.” Annual Review of Genetics 38(1): 413–43.
Robinson, James T et al. 2011. “Integrative Genome Viewer.” Nature Biotechnology 29(1): 24–26.
Rodríguez-García, Antonio, Alberto Sola-Landa, and Carlos Barreiro. 2017. “RNA-Seq-Based Comparative Transcriptomics: RNA Preparation and Bioinformatics.” Methods in molecular biology (Clifton, N.J.) 1645(4): 59–72.
Roe, Jae-seok et al. 2017. “Enhancer Reprogramming Promotes Pancreatic Cancer Metastasis.” Cell 170(5): 875-888.
Ross-Innes, Caryn S. et al. 2012. “Differential Oestrogen Receptor Binding Is Associated with Clinical Outcome in Breast Cancer.” Nature 481(7381): 389–93.
Rozenblum, Ester et al. 1997. “Tumor-Suppressive Pathways in Pancreatic Carcinoma.” Cancer Research 57(9): 1731–34.
De Ruijter, Annemieke J.M. et al. 2003. “Histone Deacetylases (HDACs): Characterization of the Classical HDAC Family.” Biochemical Journal 370(3): 737–49.
Russo, Alicia A. et al. 1998. “Structural Basis for Inhibition of the Cyclin-Dependent Kinase Cdk6 by the Tumour Suppressor P16(INK4a).” Nature 395(6699): 237–43.
Sahu, R. P., S. Batra, and S. K. Srivastava. 2009. “Activation of ATM/Chk1 by Curcumin Causes Cell Cycle Arrest and Apoptosis in Human Pancreatic Cancer Cells.” British Journal of Cancer 100(9): 1425–33.
San, Bilge et al. 2016. “Normal Formation of a Vertebrate Body Plan and Loss of Tissue Maintenance in the Absence of Ezh2.” Scientific Reports 6: 1–16.
Sauvageau, Martin, and Guy Sauvageau. 2010. “Polycomb Group Proteins: Multi-Faceted Regulators of Somatic Stem Cells and Cancer.” Cell Stem Cell 7(3): 299–313.
Schuettengruber, Bernd et al. 2007. “Genome Regulation by Polycomb and Trithorax Proteins.” Cell 128(4): 735–45.
Schuettengruber, Bernd, and Giacomo Cavalli. 2009. “Recruitment of Polycomb Group Complexes and Their Role in the Dynamic Regulation of Cell Fate Choice.” Development 136(21): 3531–42.
BIBLIOGRAPHY
115
Seino, Takashi et al. 2018. “Human Pancreatic Tumor Organoids Reveal Loss of Stem Cell Niche Factor Dependence during Disease Progression.” Cell Stem Cell 22(3): 454-467.
Shi, B. et al. 2007. “Integration of Estrogen and Wnt Signaling Circuits by the Polycomb Group Protein EZH2 in Breast Cancer Cells.” Molecular and Cellular Biology 27(14): 5105–19.
Shin, Hyunjin, Tao Liu, Arjun K. Manrai, and Shirley X. Liu. 2009. “CEAS: Cis-Regulatory Element Annotation System.” Bioinformatics 25(19): 2605–6.
Shlush, Liran I. et al. 2017. “Tracing the Origins of Relapse in Acute Myeloid Leukaemia to Stem Cells.” Nature 547(7661): 104–8.
Singh, Rahul, Katie Reindl, and Rick Jansen. 2019. “Epigenomics of Pancreatic Cancer: A Critical Role for Epigenome-Wide Studies.” Epigenomes 3(1): 5.
Smit, V. T.H.B.M. et al. 1988. “KRAS Codon 12 Mutations Occur Very Frequently in Pancreatic Adenocarcinomas.” Nucleic Acids Research 16(22): 10952.
Smith, Keriayn N, Amar M Singh, and Stephen Dalton. 2010. “Myc Represses Primitive Endoderm Differentiation in Pluripotent Stem Cells.” Cell stem cell 7(3): 343–54.
Smits, Michiel et al. 2010. “MiR-101 Is down-Regulated in Glioblastoma Resulting in EZH2- Induced Proliferation , Migration , and Angiogenesis AbstrAct : Background : Glioblastoma ( GBM ) Is a Malignant Brain Tumor with Dismal.” Oncotarget 1(8): 710–20.
Solcia, E., M. Bonato, and G. N. Ranzani. 1994. “K-Ras and P53 Gene Mutations in Pancreatic Cancer: Ductal and Nonductal Tumors Progress through Different Genetic Lesions.” Cancer Research 54(6): 1556–60.
Sparmann, Anke, and Maarten Van Lohuizen. 2006. “Polycomb Silencers Control Cell Fate, Development and Cancer.” Nature Reviews Cancer 6(11): 846–56.
Stenzinger, Albrecht et al. 2013. “High SIRT1 Expression Is a Negative Prognosticator in Pancreatic Ductal Adenocarcinoma.” BMC Cancer 13(1): 1-10.
Sterner, D. E., and S. L. Berger. 2000. “Acetylation of Histones and Transcription-Related Factors.” Microbiology and Molecular Biology Reviews 64(2): 435–59.
Subramanian, Aravind et al. 2005. “Gene Set Enrichment Analysis: A Knowledge-Based Approach for Interpreting Genome-Wide Expression Profiles.” Proceedings of the National Academy of Sciences of the United States of America 102(43): 15545–50.
Sudo, T. et al. 2005. “Clinicopathological Significance of EZH2 MRNA Expression in Patients with Hepatocellular Carcinoma.” British Journal of Cancer 92(9): 1754–58.
Sun, Bin, Eunhyuk Chang, Anna Gerhartl, and Francis G. Szele. 2018. “Polycomb Protein Eed Is Required for Neurogenesis and Cortical Injury Activation in the Subventricular Zone.” Cerebral Cortex 28(4): 1369–82.
Surface, Lauren E., Seraphim R. Thornton, and Laurie A. Boyer. 2010. “Polycomb Group Proteins Set the Stage for Early Lineage Commitment.” Cell Stem Cell 7(3): 288–98.
BIBLIOGRAPHY
116
Suzuki, Shinnosuke et al. 2015. “Histone Methyltransferase Smyd3 Regulates Early Embryonic Lineage Commitment in Mice.” Reproduction 150(1): 21–30.
Tammen, Stephanie A., Simonetta Friso, and Sang Woon Choi. 2013. “Epigenetics: The Link between Nature and Nurture.” Molecular Aspects of Medicine 34(4): 753–64.
Tan, Jing et al. 2007. “Pharmacologic Disruption of Polycomb-Repressive Complex 2-Mediated Gene Repression Selectively Induces Apoptosis in Cancer Cells.” Genes and Development 21(9): 1050–63.
Tavakkoli, Anna et al. 2020. “Racial Disparities and Trends in Pancreatic Cancer Incidence and Mortality in the United States.” Clinical Gastroenterology and Hepatology 18(1): 171-178.
The Cancer Genome Atlas Research Network, and Benjamin J Raphael. 2017. “Integrated Genomic Characterization of Pancreatic Ductal Adenocarcinoma The Cancer Genome Atlas Research Network *.” Cancer Cell 32(2)(2): 185–203.
Thilo Welsch, Jorg Kleeff, and Helmut Friess. 2007. “Molecular Pathogenesis of Pancreatic Cancer: Advances and Challenges.” Current Molecular Medicine 7(5): 504–21.
Thinnes, Cyrille C. et al. 2014. “Targeting Histone Lysine Demethylases - Progress, Challenges, and the Future.” Biochimica et Biophysica Acta - Gene Regulatory Mechanisms 1839(12): 1416–32.
Thorvaldsdóttir, Helga, James T. Robinson, and Jill P. Mesirov. 2013. “Integrative Genomics Viewer (IGV): High-Performance Genomics Data Visualization and Exploration.” Briefings in Bioinformatics 14(2): 178–92.
Tiyaboonchai, Amita et al. 2017. “GATA6 Plays an Important Role in the Induction of Human Definitive Endoderm, Development of the Pancreas, and Functionality of Pancreatic β Cells.” Stem Cell Reports 8(3): 589–604.
Toll, Adam D. et al. 2010. “Implications of Enhancer of Zeste Homologue 2 Expression in Pancreatic Ductal Adenocarcinoma.” Human Pathology 41(9): 1205–9.
Trapnell, Cole et al. 2013. “Differential Analysis of Gene Regulation at Transcript Resolution with RNA-Seq.” Nature Biotechnology 31(1): 46–53.
Tyagi, Monica, Nasir Imam, Kirtika Verma, and Ashok K. Patel. 2016. “Chromatin Remodelers: We Are the Drivers!!” Nucleus 7(4): 388–404.
Tzatsos, Alexandros et al. 2013. “KDM2B Promotes Pancreatic Cancer via Polycomb-Dependent and -Independent Transcriptional Programs.” Journal of Clinical Investigation 123(2): 727–39.
Upadhyay, Anup K., and Xiaodong Cheng. 2011. “Dynamics of Histone Lysine Methylation: Structures of Methyl Writers and Erasers.” Progress in Drug Research 67: 107–24.
Valk-Lingbeek, Merel E., Sophia W.M. Bruggeman, and Maarten Van Lohuizen. 2004. “Stem Cells and Cancer: The Polycomb Connection.” Cell 118(4): 409–18.
Vanharanta, Sakari et al. 2013. “Epigenetic Expansion of VHL-HIF Signal Output Drives Multiorgan Metastasis in Renal Cancer.” Nature medicine 19(1): 50–56.
BIBLIOGRAPHY
117
Varambally, Sooryanarayana et al. 2002. “The Polycomb Group Protein EZH2 Is Involved in Progression of Prostate Cancer.” Nature 419(6907): 624–29.
Vaswani, Rishi G. et al. 2016. “Identification of (R)-N-((4-Methoxy-6-Methyl-2-Oxo-1,2-Dihydropyridin-3-Yl)Methyl)-2-Methyl-1-(1-(1-(2,2,2-Trifluoroethyl)Piperidin-4-Yl)Ethyl)-1H-Indole-3-Carboxamide (CPI-1205), a Potent and Selective Inhibitor of Histone Methyltransferase EZH2, Suitabl.” Journal of Medicinal Chemistry 59(21): 9928–41.
Virani, Shama et al. 2012. “Cancer Epigenetics: A Brief Review.” ILAR journal / National Research Council, Institute of Laboratory Animal Resources 53(3–4): 359–69.
Völkel, Pamela, Barbara Dupret, Xuefen Le Bourhis, and Pierre Olivier Angrand. 2015. “Diverse Involvement of EZH2 in Cancer Epigenetics.” American Journal of Translational Research 7(2): 175–93.
Wang, Hui, Anna Paczulla, and Claudia Lengerke. 2015. “Evaluation of Stem Cell Properties in Human Ovarian Carcinoma Cells Using Multi and Single Cell-Based Spheres Assays.” Journal of Visualized Experiments (95): 1–11.
Wang, Pingting et al. 2018. “KDM6A Promotes Chondrogenic Differentiation of Periodontal Ligament Stem Cells by Demethylation of SOX9.” Cell Proliferation 51(3): 1–13.
Wilson, Boris G et al. 2010. “Epigenetic Antagonism between Polycomb and SWI/SNF Complexes during Oncogenic Transformation.” Cancer Cell 18(4): 316–28.
Xu, Cong et al. 2019. “Patient-Derived Xenograft Mouse Models: A High Fidelity Tool for Individualized Medicine (Review).” Oncology Letters 17(1): 3–10.
Xu, K. et al. 2012. “EZH2 Oncogenic Activity in Castration-Resistant Prostate Cancer Cells Is Polycomb-Independent.” Science 338(6113): 1465–69.
Xu, Yali, and Christopher R Vakoc. 2017. “Targeting Cancer Cells with BET Bromodomain Inhibitors.” Cold Spring Harbor Perspectives in Biology: 1–17.
Yachida, Shinichi, and Christine A. Lacobuzio-Donahue. 2009. “The Pathology and Genetics of Metastatic Pancreatic Cancer.” Archives of Pathology and Laboratory Medicine 133(3): 413–22.
Yadav, Dhiraj, and Albert B Lowenfels. 2013. “The Epidemiology of Pancreatitis and Pancreatic Cancer.” Gastroenterology 144(6): 1252–61.
Ye, Jie et al. 2019. “PRDM3 Attenuates Pancreatitis and Pancreatic Tumorigenesis by Regulating Inflammatory Response.” Cell Death Dis 11(3): 187.
Yoon, Kyong Ah et al. 2019. “Comprehensive Cancer Panel Sequencing Defines Genetic Diversity and Changes in the Mutational Characteristics of Pancreatic Cancer Patients Receiving Neoadjuvant Treatment.” Gut and Liver 13(6): 683–89.
Young, Claire C. et al. 2019. “The Loss of ATRX Increases Susceptibility to Pancreatic Injury and Oncogenic KRAS in Female But Not Male Mice.” Cmgh 7(1): 93–113.
Yuan, Yuan et al. 2012. “A Small-Molecule Probe of the Histone Methyltransferase G9a Induces Cellular Senescence in Pancreatic Adenocarcinoma.” ACS Chemical Biology 7(7): 1152–57.
BIBLIOGRAPHY
118
Yun, Miyong, Jun Wu, Jerry L. Workman, and Bing Li. 2011. “Readers of Histone Modifications.” Cell Research 21(4): 564–78.
Zeeshan, Rabia, and Zeeshan Mutahir. 2017. “Cancer Metastasis - Tricks of the Trade.” Bosnian Journal of Basic Medical Sciences 17(3): 172–82.
Zhang, Yong et al. 2008. “Model-Based Analysis of ChIP-Seq (MACS).” Genome Biology 9(9): 137.
Zheng, Xiaofeng et al. 2015. “EMT Program Is Dispensable for Metastasis but Induces Chemoresistance in Pancreatic Cancer.” Nature 527(7579): 525–30.
Zhong, Yi et al. 2011. “GATA6 Activates Wnt Signaling in Pancreatic Cancer by Negatively Regulating the Wnt Antagonist Dickkopf-1.” PLoS ONE 6(7): 22129.
Zhou, Qiao, and Douglas A Melton. 2018. “Pancreas Regeneration.” Nature 557(7705): 351–58.
Zingg, Daniel et al. 2015. “The Epigenetic Modifier EZH2 Controls Melanoma Growth and Metastasis through Silencing of Distinct Tumour Suppressors.” Nature Communications 6(5): 6061.
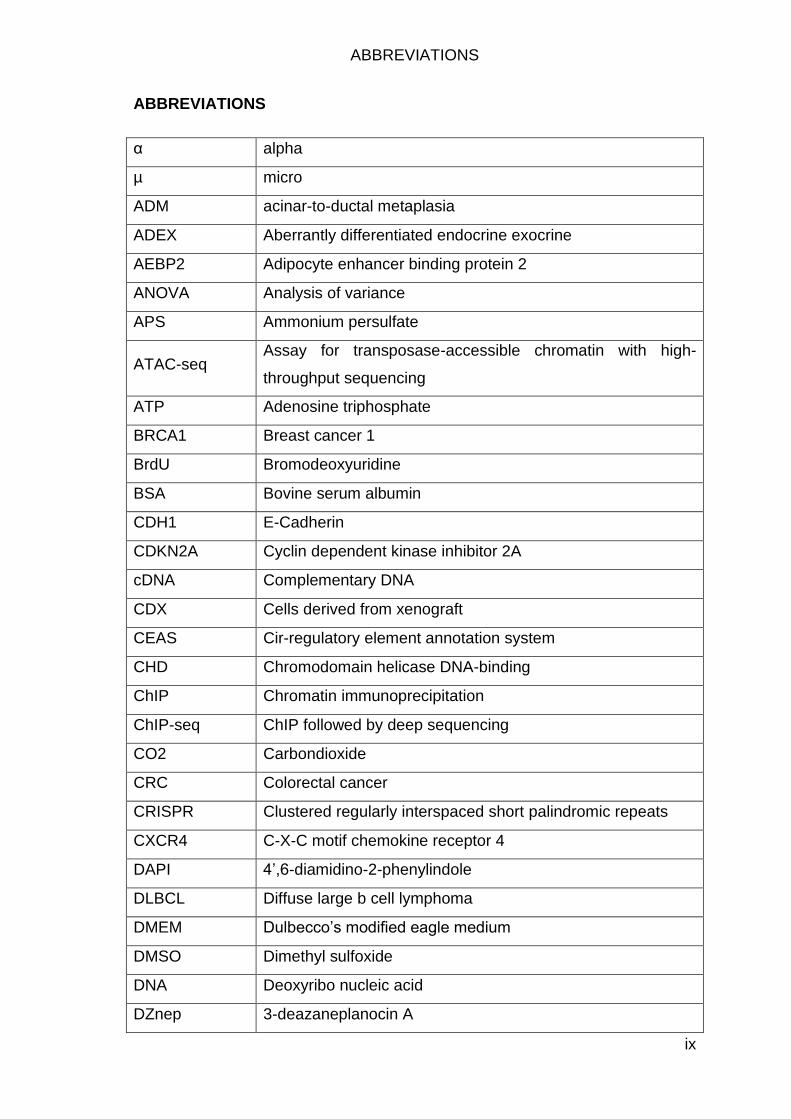
ABBREVIATIONS
ix
ABBREVIATIONS
α alpha
µ micro
ADM acinar-to-ductal metaplasia
ADEX Aberrantly differentiated endocrine exocrine
AEBP2 Adipocyte enhancer binding protein 2
ANOVA Analysis of variance
APS Ammonium persulfate
ATAC-seq Assay for transposase-accessible chromatin with high-
throughput sequencing
ATP Adenosine triphosphate
BRCA1 Breast cancer 1
BrdU Bromodeoxyuridine
BSA Bovine serum albumin
CDH1 E-Cadherin
CDKN2A Cyclin dependent kinase inhibitor 2A
cDNA Complementary DNA
CDX Cells derived from xenograft
CEAS Cir-regulatory element annotation system
CHD Chromodomain helicase DNA-binding
ChIP Chromatin immunoprecipitation
ChIP-seq ChIP followed by deep sequencing
CO2 Carbondioxide
CRC Colorectal cancer
CRISPR Clustered regularly interspaced short palindromic repeats
CXCR4 C-X-C motif chemokine receptor 4
DAPI 4’,6-diamidino-2-phenylindole
DLBCL Diffuse large b cell lymphoma
DMEM Dulbecco’s modified eagle medium
DMSO Dimethyl sulfoxide
DNA Deoxyribo nucleic acid
DZnep 3-deazaneplanocin A
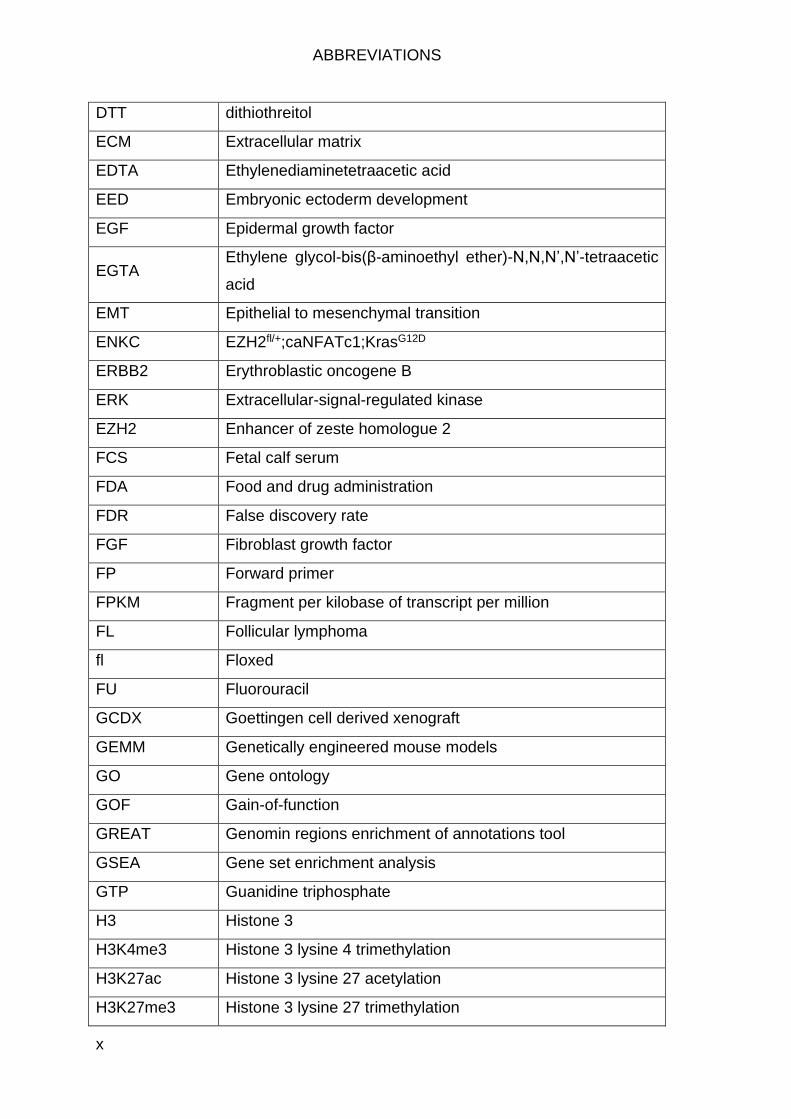
ABBREVIATIONS
x
DTT dithiothreitol
ECM Extracellular matrix
EDTA Ethylenediaminetetraacetic acid
EED Embryonic ectoderm development
EGF Epidermal growth factor
EGTA Ethylene glycol-bis(β-aminoethyl ether)-N,N,N’,N’-tetraacetic
acid
EMT Epithelial to mesenchymal transition
ENKC EZH2fl/+;caNFATc1;KrasG12D
ERBB2 Erythroblastic oncogene B
ERK Extracellular-signal-regulated kinase
EZH2 Enhancer of zeste homologue 2
FCS Fetal calf serum
FDA Food and drug administration
FDR False discovery rate
FGF Fibroblast growth factor
FP Forward primer
FPKM Fragment per kilobase of transcript per million
FL Follicular lymphoma
fl Floxed
FU Fluorouracil
GCDX Goettingen cell derived xenograft
GEMM Genetically engineered mouse models
GO Gene ontology
GOF Gain-of-function
GREAT Genomin regions enrichment of annotations tool
GSEA Gene set enrichment analysis
GTP Guanidine triphosphate
H3 Histone 3
H3K4me3 Histone 3 lysine 4 trimethylation
H3K27ac Histone 3 lysine 27 acetylation
H3K27me3 Histone 3 lysine 27 trimethylation
ABBREVIATIONS
xi
HA Hemagglutinin
HAT Histone acetyl transferase
HDAC Histone deacetylase
HE Hematoxylin & eosin
HER2 Human epidermal growth factor receptor 2
HNF Hepatocyte nuclear factor
HOX Homeobox
HRP Horse raddish peroxidase
IgG Immunoglobulin G
IGV Integrative genome viewer
IHC Immunohistochemistry
INI Integrase interactor 1
IP Immunoprecipitation
IRS Immune reactive score
ISWI Imitation SWI
JARID Jumonji and AT rich interaction domain 2
KAT Lysine acetyl transferase
Kb Kilobase
KCl Potassium chloride
KDa Kilo Dalton
KH2PO4 Potassium dihydrogen phosphate
KMT Lysine methyltransferase
KPC KrasG12D;TP53R172H/+
KRAS Kirsten rat sarcoma
KSF Keratinocyte serum-free
LiCl Lithium chloride
LOF Loss-of-function
log2FC Log2 fold change
MACS Model-based analysis of ChIP-seq
MAPK Mitogen-activated protein kinase
MEK MAPK kinase
miRNA Micro RNA
ABBREVIATIONS
xii
MLL Mixed lineage leukemia
MPN Myeloproliferative neoplasms
mRNA Messenger RNA
N2 Nitrogen supplement
Na2HPO4 Disodium hydrogen phosphate
NaCl Sodium chloride
NaF Sodium fluride
NaO Sodium oxide
NEAA Non essential amino acids
NES Normalized enrichment score
NFAT Nuclear factor of activated T cells
NGS Next generation sequencing
NIG NGS integrative genomics
NKC caNFATc1;KrasG12D
NP40 Nonidet P-40
OD Optical density
PAGE Polyacrylamide gel electrophoresis
PanIN Pancreatic intraepithelial neoplasia
PANTHER Protein analysis through evolutionary relationships
PBS Phosphate-buffered saline
PBST PBS with tween20 or triton-X
PCA Principal component analysis
PcG Polycomb group
PCR Polymerase chain reaction
PDAC Pancreatic ductal adenocarcinoma
PDTX Patient derived tumor xenograft
PDX Patient derive xenograft
PFA Paraformaldehyde
PMSF Phenylmethylsulfonyl fluoride
PRC Polycomb repressive complex
PRMT Arginine methyltransferase
QM Quasi-mesenchymal
ABBREVIATIONS
xiii
qPCR Quantitative PCR
Rb Retinoblastoma
RBBP4/7 Retinoblastoma binding protein 4/7
RNA Ribonucleic acid
RNA ISH RNA in situ hybridization
RNA-seq RNA sequencing
RORα RAR-relate orphan receptor
RP Reverse primer
RPM Rotations per minute
RT Room temperature
SAH S-adenosyl homocysteine
SD Standard deviation
SDS Sodium dodecyl sulfate
SET Su(var)3-9,EZH2 and Trithorax
sgRNA Single guide RNA
siRNA Small interfering RNA
shRNA Small hair pin RNA
SMARCA SWI/SNF-related matrix-associated actin-dependent
regulator of chromatin subfamily A
SUZ12 Suppressor of zeste 12
SWI/SNF Switch/sucrose non-fermentable
T-ALL T-cell acute lymphoblastic leukemia
TBS Tris-buffered saline
TBST TBS with tween20 or triton-X
TCGA The cancer genome atlas
TE Tris EDTA
TEMED tetramethylethylenediamine
TMA Tissue microarray
TP53 Tumor protein 53
trxG Trithorax group
TSS Transcription start site
UTR Untraslated region

ABBREVIATIONS
xiv
WB Weinmann buffer
wt Wild type
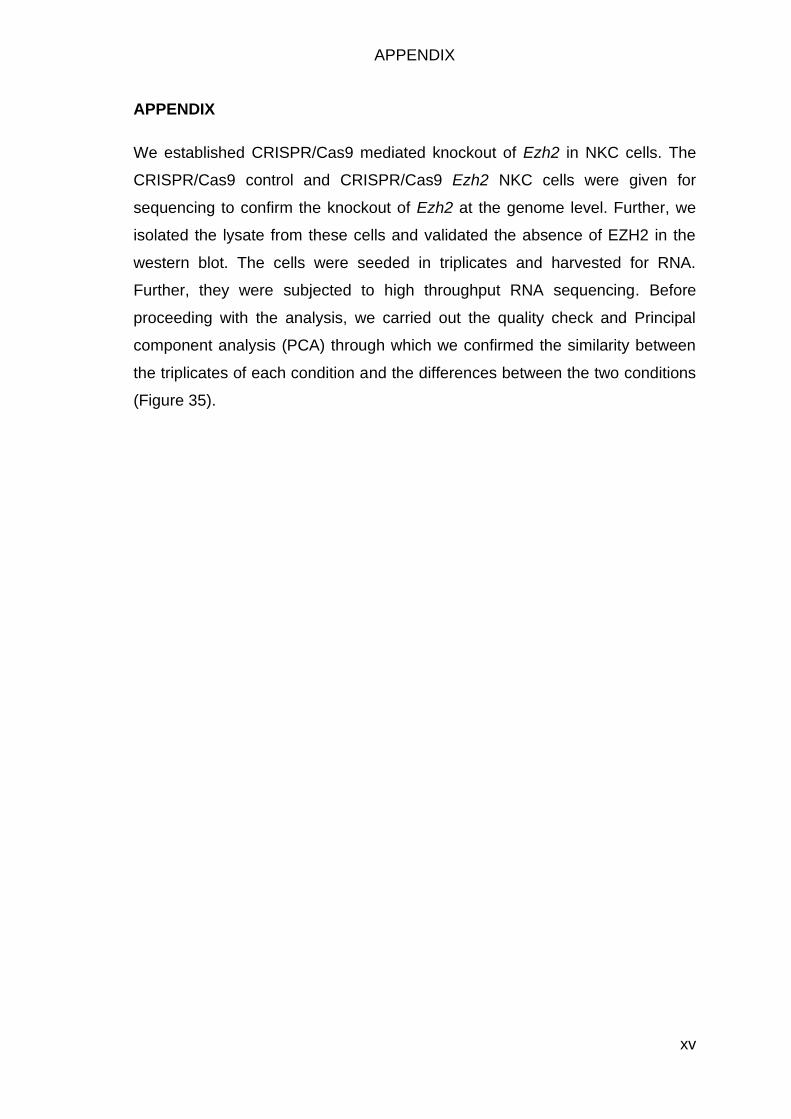
APPENDIX
xv
APPENDIX
We established CRISPR/Cas9 mediated knockout of Ezh2 in NKC cells. The
CRISPR/Cas9 control and CRISPR/Cas9 Ezh2 NKC cells were given for
sequencing to confirm the knockout of Ezh2 at the genome level. Further, we
isolated the lysate from these cells and validated the absence of EZH2 in the
western blot. The cells were seeded in triplicates and harvested for RNA.
Further, they were subjected to high throughput RNA sequencing. Before
proceeding with the analysis, we carried out the quality check and Principal
component analysis (PCA) through which we confirmed the similarity between
the triplicates of each condition and the differences between the two conditions
(Figure 35).
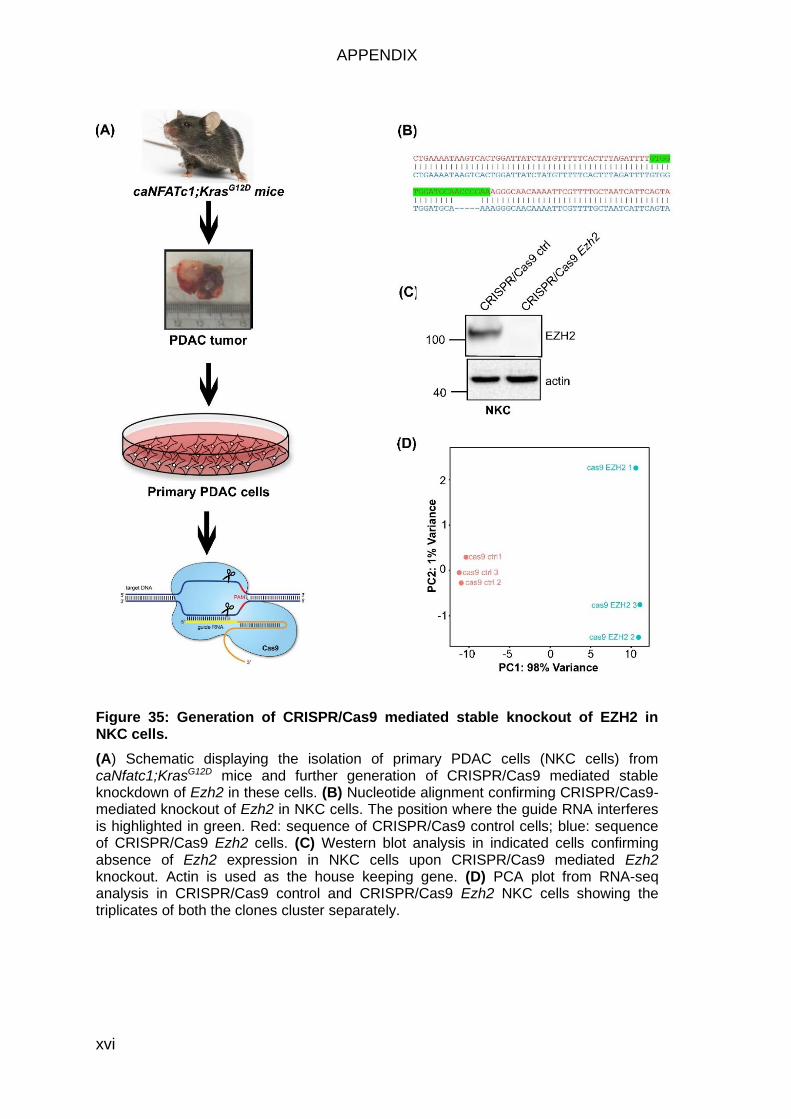
APPENDIX
xvi
Figure 35: Generation of CRISPR/Cas9 mediated stable knockout of EZH2 in NKC cells.
(A) Schematic displaying the isolation of primary PDAC cells (NKC cells) from caNfatc1;KrasG12D mice and further generation of CRISPR/Cas9 mediated stable knockdown of Ezh2 in these cells. (B) Nucleotide alignment confirming CRISPR/Cas9-mediated knockout of Ezh2 in NKC cells. The position where the guide RNA interferes is highlighted in green. Red: sequence of CRISPR/Cas9 control cells; blue: sequence of CRISPR/Cas9 Ezh2 cells. (C) Western blot analysis in indicated cells confirming absence of Ezh2 expression in NKC cells upon CRISPR/Cas9 mediated Ezh2 knockout. Actin is used as the house keeping gene. (D) PCA plot from RNA-seq analysis in CRISPR/Cas9 control and CRISPR/Cas9 Ezh2 NKC cells showing the triplicates of both the clones cluster separately.

CURRICULUM VITAE
xvii
CURRICULUM VITAE
SHILPA PATIL
PERSONAL DETAILS: Address: Goettingen, Lower Saxony, Germany 37075 Date of birth: 28.05.1991 Place of birth: Manipal, India E-mail address: [email protected] Contact number: +49 17657979548 EDUCATIONAL QUALIFICATIONS: Doctor of Philosophy (Ph.D.) University Medical Center, Goettingen, Germany Pancreatic Cancer May 2016- July 2020 (expected)
Thesis Title: EZH2-GATA6 axis in Pancreatic ductal adenocarcinoma.
I am studying the mechanistic and functional role of EZH2 (Enhancer of Zeste
Homologue 2) in tumor progression, plasticity and molecular subtype identity of
pancreatic cancer. My work suggests GATA6 as the crucial target of EZH2 and
elaborate on the EZH2-GATA6 axis in regulating classical PDAC subtype.
Master of Science (Research) (M.Sc.) Manipal University, Bangalore, India Regenerative Medicine (72% ) 2012-2014
Thesis Title: Analysis of copy number variation in chronic myeloid leukemia (CML).
(In National center Biological Sciences (NCBS) and St John’s Medical college,
Bangalore, India)
In this study, we discovered a novel strategy to predict if the CML patients are
responders or nonresponders to the imatinib therapy, based on copy number variation
of a few vital genes in their bone marrow samples.
Bachelor of Science (B.Sc.) Manipal University, Manipal, India Biotechnology (80%) 2009-2012
Thesis Title: Alterations in the extracellular matrix (ECM) proteins under hypoxic
conditions in HepG2 cells.
In this project, we studied the differences in the expression pattern of ECM proteins in
normoxic and hypoxic conditions in HepG2 cells using Mass Spectrometry based
proteomics tool. We identified novel proteins differentially expressed upon hypoxia.
CURRICULUM VITAE
xviii
WORK EXPERIENCE: Research Assistant JNCASR, India
Sept 2014 – Feb 2016
I worked on a project aimed at investigating the factors mediating p300
autoacetylation. The main idea was to understand the effect of wildtype and various
mutants of p53 to mediate p300 autoacetylation. I was also involved in a project in
elucidating the mechanisms behind NPM1 mediating p300 autoacetylation.
MENTORSHIP SKILLS:
• Guided two Medical students on lab rotations, one month each with basic lab techniques
• Conducted a method course on ‘Mouse models of pancreatic cancer - Tumor
screening by ultrasound’ (Part of method courses offered by Molecular medicine
program) at UMG, Goettingen in 2017.
• Mentored a one-day workshop on ‘Orthotopic transplantation of pancreatic tumor
cells into pancreas of mice’ (Workshop offered as a part of Deutsche Pancreas
Club (DPC) conference hosted in Goettingen in 2019).
• Provided regular teaching/guidance on orthotopic transplantation and ultrasound-
based tumor screening techniques in mice.
PUBLICATIONS:
EZH2 regulates pancreatic cancer subtype identity and tumor progression by transcriptional repression of GATA6 Patil S et al… Hessmann E. (manuscript in revision)
Preclinical Evaluation of 1,2-Diamino-4,5-Dibromobenzene in Genetically
Engineered Mouse Models of Pancreatic Cancer. Goetze, Robert G., Buchholz, S.
M., Ou, N., Zhang, Q., Patil, S., Schirmer, M., … Neesse, A. (2019). Cells, 8(6), 563.
Cytosolic 5′-nucleotidase 1A is overexpressed in pancreatic cancer and mediates
gemcitabine resistance by reducing intracellular gemcitabine metabolites. Patzak, M.
S., Kari, V., Patil, S., Hamdan, F. H., Goetze, R. G., Brunner, M., … Neesse, A.
(2019). EBioMedicine, 40, 394–405.
Mutant and Wild-Type Tumor Suppressor p53 Induces p300 Autoacetylation.
Kaypee, S., Sahadevan, S. A., Patil, S., Ghosh, P., Roy, N. S., Roy, S., & Kundu, T.
K. (2018). IScience, 4, 260–272.
Oligomers of human histone chaperone NPM1 alter p300/KAT3B folding to induce
autoacetylation. Kaypee, S., Sahadevan, S. A., Sudarshan, D., Halder Sinha, S.,
Patil, S., Senapati, P., … Kundu, T. K. (2018). Biochimica et Biophysica Acta.
General Subjects, 1862(8), 1729–1741.

CURRICULUM VITAE
xix
Utilizing high resolution ultrasound to monitor tumor onset and growth in genetically
engineered pancreatic cancer models. Goetze, Robert Guenther, Buchholz, S. M.,
Patil, S., Petzold, G., Ellenrieder, V., Hessmann, E., & Neesse, A. (2018). Journal of
Visualized Experiments, 2018(134).
CONFERENCES:
• Participated and presented poster in the European Pancreas Club (EPC) conferences in 2019 (held at Bergen, Norway) & 2017 (held at Budapest, Hungary).
• Participated and presented poster in the Deutsche Pancreas Club (DPC)
conferences in 2019 (Goettingen, Germany), 2018 (held at Ulm, Germany) & 2017
(Greifswald, Germany). Also volunteered in organizing the DPC held in 2019 at
Goettingen, Germany.
• Participated, presented poster and volunteered in organizing the Pancreas spring
meeting held in Goettingen, Germany in 2017.
• Participated, presented poster and volunteered in organizing the EKFS cancer
symposium held in Goettingen, Germany in 2017.
• Participated and volunteered in organizing the international conference ‘Gene
networks in chromatin/chromosome function, 5th meeting of the Asian forum of
chromosome and chromatin biology’ held at JNCASR, Bangalore in 2015.
ACADEMIC MERITS:
• Awarded the Best Abstract Prize for the poster titled ‘Characterization of EZH2 in PDAC plasticity’ at Deutsche Pancreas Club (DPC) conference held at Ulm, Germany in Jan 2018.
• Awarded the travel award for the poster titled ‘Role of EZH2 in PDAC’ at European
Pancreas Club (EPC) conference held at Budapest, Hungary in June 2017.
• Awarded Dr. TMA Pai Gold Medal for the best outgoing graduate student of Manipal
Life Sciences Centre, Manipal University in 2012.
• Awarded the Certificate of Merit for Outstanding Academic Performance and for
being among the top 0.1% of successful candidates of All India Secondary
Examinations in English Language and literature in 2007.
TEST SCORES:
• Obtained IELTS overall score 7.5 (2019).