australian ductal pc beams
DESCRIPTION
DUCTAL PC BEAMS AUSRALIANTRANSCRIPT

Pub
licat
ion
Cov
er e
dite
d in
200
6 by
Dr
Mar
k R
eben
tros
t
WORLD WIDE WEB
www.VSL-intl.comwww.Ductal.com
AUSTRALIAN OFFICES
Head OfficeSydney
Phone: +61 2 94 84 59 44Fax: +61 2 98 75 38 94
Southern RegionMelbourne
Phone: +61 3 97 95 03 66Fax: +61 3 97 95 05 47
Other OfficesBrisbane, Adelaide, Hobart
HEADQUARTERS
VSL International AGSwitzerland
Phone: +41 32 613 30 30Fax: +41 32 613 30 35
REGIONAL OFFICES
Asia & PacificVSL-Intrafor Asia,
Hong Kong Phone: +852 2590 22 88
Fax: +852 2590 02 90
Central East Europe, Middle East,French speaking Africa Phone: +41 32 613 30 30
Fax: +41 32 613 30 35
Iberian Peninsula, South Africaand Latin America
CTT StrongholdSpain
Phone: +34 93 289 23 30Fax: +34 93 289 23 31
REFERENCE ARTICLE:
Design Guidelines for Ductal Prestressed Concrete Beams
Prof. Gowripalan N
Prof. Ian R GilbertProfessor of Civil Engineering
School of Civil and Environmental Engineering, The University of NSWMay 2000: pp 53.
AUSTRALIAAUSTRALIA
Dr Mark RebentrostMark joined VSL in 2004 after working for a major engineering consultant as a bridge designer. He has a PhD in non-linear structural engineering methods. His area of expertise at VSL includes the engineering of cost-effective and innovative Ductal [email protected]
Brian Cavill FIEAust CPEngBrian has been with VSL for more than 30 years, with responsibility for the manage-ment of their design activities and for the development of new technologies. He is a main driving force behind VSL’s innovative concrete products, including [email protected]
For comments please write to: [email protected]
Alternatively please contact one of our Ductal experts for further information:
PREFACE:This document was prepared for and on behalf of VSL (Aust) Pty Ltd. Its aim is to provide guidelines for the design of prestressed concrete beams using the Reactive Powder Concrete known as DUCTAL. Where possible, the design guidelines are consistent with the limit states design philosophy of AS3600-1994.
The authors have attempted to follow a first principles approach, based on well established principles of structural mechanics and the material properties and behaviour reported in the literature. In doing so, the authors have relied heavily on the results of research published overseas.

Design Guidelines for Ductal Prestressed Concrete Beams
N Gowripalan and R I Gilbert School of Civil and Environmental Engineering
The University of New South Wales
May 2000
®

1
PREFACE
This document was prepared for and on behalf of VSL (Aust) Pty Ltd. Its aim is to provide
guidelines for the design of prestressed concrete beams using the Reactive Powder Concrete
known as DUCTAL. Where possible, the design guidelines are consistent with the limit
states design philosophy of AS3600-1994. The authors have attempted to follow a first
principles approach, based on well established principles of structural mechanics and the
material properties and behaviour reported in the literature. In doing so, the authors have
relied heavily on the results of research published overseas.
DISCLAIMER
While every effort has been made and all reasonable care taken to ensure the accuracy and
applicability of the material contained herein, the authors of this document shall not be held
liable or responsible in any way whatsoever for any loss or damage, cost or expense incurred
as a result of the use of or reliance on any material or advice contained in this document.
Copyright © 2000 by VSL (Aust) Pty Ltd

2
TABLE OF CONTENTS NOTATION 4 1. INTRODUCTION 5 2. SCOPE AND APPLICATION 5 3. DESIGN REQUIREMENTS AND PROCEDURES 7 3.1 Requirements 7
3.2 Design for Strength 7 3.3 Design for Serviceability 7 3.4 Design for Durability 8
4. DESIGN PROPERTIES OF DUCTAL 9
4.1 Behaviour in Compression 9 4.2 Characteristic Compressive Strength 9 4.3 Idealised Stress-strain Relationship in Compression 10 4.4 Behaviour in Tension 10 4.5 Idealised Stress-strain Relationship in tension 12 4.6 Modulus of Elasticity 12 4.7 Density 12 4.8 Poisson’s Ratio 13 4.9 Creep 13 4.10 Shrinkage 14
5. STRENGTH IN FLEXURE 15
5.1 Theoretical Moment Capacity 15 5.2 Minimum Strength and Other Requirements 16 5.3 Ductility Requirements 17
6 STRENGTH IN SHEAR 18
6.1 Discussion 18 6.2 Design Shear Strength 18 6.3 Critical Section for Shear in Beams 19 6.4 Strength of Slabs in Shear 20
7 STRENGTH IN TORSION
7.1 Design Torsional Strength 21 7.2 Strength in combined Shear and Torsion 21
8 FLEXURAL CRACK CONTROL AT SERVICE LOADS 22
8.1 Non-Prestressed Elements 22 8.2 Prestressed Elements 22
9 DEFLECTION AT SERVICE LOADS 23
9.1 Short-term deflection 23 9.2 Long-term deflection 23
10 RESISTANCE TO FIRE 25

3
11 FATIGUE 25 12 LOSSES OF PRESTRESS 26
12.1 Instantaneous losses 26 12.2 Time-dependent losses 26 13 ANCHORAGE ZONES 27 14 REFERENCES 28 APPENDIX A - TECHNICAL CHARACTERISTICS OF DUCTAL 30 APPENDIX B - FLEXURAL BEHAVIOUR 31 Example B.1 32 Example B.2 35 Example B.3 39 APPENDIX C - DESIGN CALCULATIONS Example C.1 41
4
NOTATION
a a dimension of critical shear perimeter; A area of cross-section; Am area enclosed by median lines of the walls
of a hollow section; Ap area of prestressing steel; b width of section; bw width of web;
minimum wall thickness of a hollow section;
c cover; C compressive force; C1, C2 compressive force components in
concrete; d effective depth from the extreme
compressive fibre to the resultant tensile force in the tensile zone at the ultimate limit state;
dn depth to the neutral axis on the cracked section;
dp depth to the prestressing steel; D overall depth of the cross-section; Ec elastic modulus of concrete at 28 days; Ecp elastic modulus of concrete at transfer; Ep elastic modulus of prestressing steel; fcu maximum compressive stress in concrete; f'c characteristic compressive strength at 28
days; f'ct characteristic flexural tensile stress at first
cracking; f'cp characteristic compressive strength at
transfer; fm mean compressive strength fpu ultimate tensile strength of prestressing
steel; HLP heavy load platform; I second moment of area about centroidal
axis; Ig second moment of area of gross section; Jt torsional constant; ku ratio of neutral axis depth to effective
depth at the ultimate moment (=dn / d); Lef effective span; Lf length of fibre; M moment; Mi initial moment; Mmax maximum moment; Mu ultimate moment; M* design moment for the ultimate limit state; Mv
* moment transferred to a support; P prestressing force; Pe effective prestressing force after all losses; Pi prestressing force immediately after
transfer; Pv vertical component of prestress; Q first moment of area; RPC reactive powder concrete; Ru ultimate strength; sd standard deviation; SLS serviceability limit state;
S* factored design action T tensile force or torsion; Tc tensile force in concrete; Tp tensile force in prestressing steel; Tu ultimate torsional strength; Tuc torsional strength of concrete section; T* the design torsion (ULS) T1, T2, T3 tensile force components in concrete; u perimeter length of critical section for punching shear; ULS ultimate limit state; Vt design shear force at the critical section; Vu ultimate shear strength; Vuo ultimate shear strength under a
concentrated load; Vuc shear strength contributed by concrete; Vus shear strength contributed by stirrups; V* the design shear force (ULS); w design crack width; x shorter dimension of rectangular section; X1, X2, X3 distances; y distance from centroidal axis; longer dimension of rectangular section; Z section modulus; Zb, Zt section moduli with respect to bottom
and top fibres, respectively; χ aging coefficient; ε strain; εb strain in extreme tensile fibre; εb,u strain in bottom fibre at the ultimate limit
state; εce concrete strain at steel level due to
prestress; εcp strain in the concrete at the tendon level; εpt strain component in prestressing steel; εo top fibre strain; εo,u top fibre strain at ultimate limit state; εt,p limiting tensile strain in concrete (Fig 5); εt,u limiting tensile strain in concrete (Fig 5); εsh* final shrinkage strain; φ strength (or capacity) reduction factor; φ* final creep coefficient; κ curvature; κi instantaneous curvature; κm curvature at midspan; κs curvature at support; σ stress; σcp average prestress after all losses, Pe/A; σo top fibre concrete stress after cracking; σbot stress in concrete in bottom fibre; σtop stress in concrete in top fibre; σ1 principal tensile stress; τ shear stress; ∆ deflection; ∆σp loss of prestress;
5
1. INTRODUCTION
This document provides guidelines for the design of prestressed concrete beams
manufactured using the Reactive Powder Concrete (RPC) known as Ductal. Where possible, a
limit states approach consistent with the design requirements of the Australian Standard for
Concrete Structures AS3600 – 1994 has been adopted.
Reactive Powder Concrete is a relatively new material and research into the properties and
behaviour of RPC is still in its infancy. Most existing literature on RPC, and it structural
applications, is written in French and efforts have been made to study these documents, together
with the relevant French design codes and specifications. Currently available literature indicates
that RPC can readily be used in a wide variety of structural applications, including bridges,
highway structures, pipes, culverts and precast members. For prestressed concrete applications,
RPC appears to be an ideal construction material.
The design guidelines presented here are based on a study of the existing literature,
research undertaken at UNSW and elsewhere and information gained from the performance of
existing RPC structures constructed overseas. The guidelines are necessarily based on the current
state of knowledge and, where possible, a first principles approach has been adopted. The design
procedures have been developed based on the principles of structural mechanics and the material
properties and behaviour reported in the literature. Research is continuing in many areas and, as
more information becomes available, sections of the document will be improved and re-calibrated
and, no doubt, the document will be expanded. However, in order to facilitate design of
prestressed girders manufactured from Ductal, detailed design rules and recommendations have
been made. In some areas, design guidance is provided, but it is based on the authors’ experience
rather than on well-documented and independently verified research. Numerical examples
illustrating the behaviour of pretensioned concrete beams and unreinforced elements are included
in the Appendices, together with detailed design calculations for pretensioned bridge girders.
2. SCOPE AND APPLICATION
This document sets out guidelines for the design of prestressed concrete beams
manufactured from the Reactive Powder Concrete (RPC) known as Ductal. The beams are
prestressed longitudinally with steel tendons. The guidelines include the design of the non-
prestressed elements of the beam transverse to the direction of the prestress (including
overhanging flanges and transverse ribs, if any).
Ductal is a material developed by Bouygues, S.A., Paris and made from particles smaller
than 800µm (hence the name powder concrete). By replacing coarse aggregate with fine sand,

6
the size of the microfissures linked to intrusions in traditional concrete is greatly reduced. Ductal
contains large quantities of a particular steel fibre. The presence of the steel fibres is essential to
enhance the post-cracking tensile strength and to improve the ductility of the material. A typical
mix for Ductal resulting in a mean cylinder compressive strength of 228 MPa and a characteristic
compressive strength of 197 MPa is given in Table 1. Additional information on Ductal is
provided in Appendix A.
Table 1 Typical composition of Ductal (Dallaire et al., 1998).
Component Material Quantity (kg/m3)
Cement 705
Silica fume 230
Crushed quartz 210
Sand 1010
Superplasticizer 17
Steel fibres 190
Water 195
The guidelines are intended to apply to prestressed structural members made of DUCTAL
with
(a) a characteristic compressive strength at 28 days, cf ′ , in the range 150 to 220 MPa;
(b) a minimum fibre content of 2.0% by volume (the fibre length is 13mm and diameter is
0.2mm) with a minimum fibre tensile strength of 1800 MPa;
(c) a saturated, surface-dry density in the range 2400 kg/m3 to 2650 kg/m3; and
(d) sufficient curing to develop a minimum characteristic strength at transfer of 100 MPa and
a minimum elastic modulus at transfer of 40000 MPa.
An initial heat treatment, consisting of curing in hot water or steam at a temperature of
90°C for a period not less than 48 hours, substantially reduces the creep of Ductal and causes
almost all the shrinkage to occur during the period of heat treatment.
It is intended that these design guidelines are to be used by a competent, experienced and
suitably qualified engineer (a person qualified for Corporate Membership of the Institution of
Engineers, Australia, or with equivalent qualifications, and competent to practise in the design
and construction of concrete structures).

7
3. DESIGN REQUIREMENTS AND PROCEDURES
3.1 Requirements:
In the design of a prestressed concrete beam, the aim is to provide an element that is durable,
serviceable and has adequate strength to fulfil its intended function. It must also be robust, have
adequate fatigue resistance and satisfy other relevant requirements, such as ease of construction
and economy.
A beam is durable if it withstands expected wear and deterioration throughout its intended
life without the need for undue maintenance. It is serviceable and has adequate strength if the
probability of loss of serviceability and the probability of collapse are both acceptably low
throughout its intended life.
These guidelines, as far as possible, provide design requirements that are consistent with
those in AS3600 – 1994.
3.2 Design for Strength:
Beams should be designed for strength as follows:
(a) The loads, other actions and the ‘design load for strength’ are determined in accordance
with Section 3 of AS3600.
(b) The design action effect, S*, due to the design load for strength is determined by an
appropriate analysis.
(c) The design strength, ,uRφ is determined as outlined in Section 5.1 of this document,
where φ is a strength reduction factor and uR is the ultimate strength. For elements
where flexural strength is provided by bonded reinforcement or tendons, and the ductility
requirements of Section 5.3 are satisfied, φ should not exceed 0.8 for bending and 0.7 for
shear and torsion. For elements where flexural strength is not provided by bonded
reinforcement or tendons, φ should not exceed 0.7.
(d) The beam is proportioned so that its design strength is greater than or equal to the design
action effect, ie. *SRu ≥φ .
3.3 Design for Serviceability:
Beams should be designed for serviceability by controlling or limiting deflection, cracking and
vibration, as appropriate, in accordance with the requirements of Section 2.4 in AS3600.
The deflection of a beam under service conditions should be controlled as follows:
8
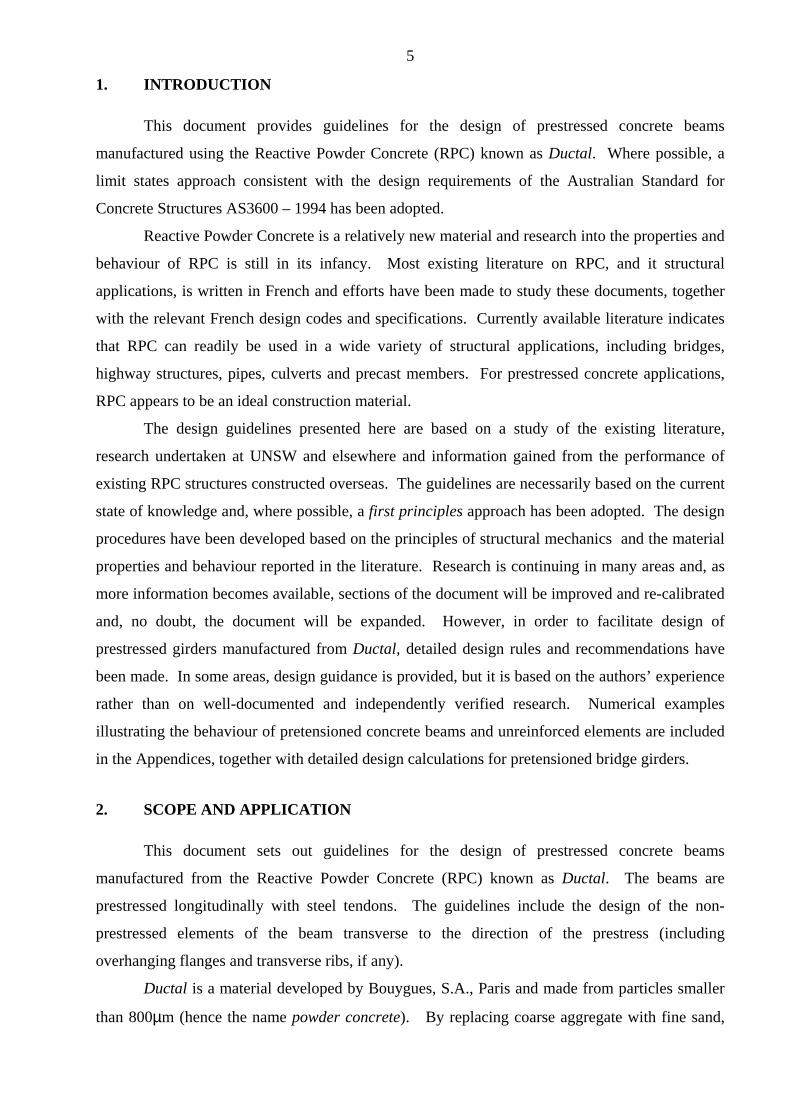
(a) a limit for the calculated deflection is chosen appropriate to the support conditions
and the intended use. AS3600 provides the following deflection limits.
Type of member Deflection to be considered
Deflection limitation )( efL∆ for spans
Deflection limitation )( efL∆ for
cantilevers All members The total deflection 1/250 1/125
Members supporting masonry partitions or other brittle finishes
The deflection which occurs after the addition or attachment of the partitions or finishes
1/500 where provision is made to minimize the effect of movement, otherwise 1/1000
1/250 where provision is made to minimize the effect of movement, otherwise 1/500
Bridge members The live load (and impact) deflection
1/800 1/400
(b) the member should be designed so that, under the ‘design load for serviceability’
(determined in accordance with Section 3 of AS3600), the calculated deflection
does not exceed the limit selected in (a) above.
The cracking of a beam under service conditions should be controlled, with limits on crack
width being selected to ensure acceptable appearance and durability.
The vibration of a beam under service conditions should be such that it does not adversely
affect the serviceability of the structure. Vibrations due to machinery, or vehicular or pedestrian
traffic, should be considered where applicable. To minimise vibration of beams, the additional
deflection due to live loads alone may be limited to Span/800.
3.4 Design for Durability:
Beams should be designed for durability in accordance with the general requirements of
Section 4 of AS3600. However, the durability of Ductal is superior to high performance
(conventional) concrete. The porosity of Ductal is about 5% and, hence, its permeability is very
low. Steel fibre reinforced concrete with a dense cementitious matrix has outperformed other
types of concrete, even in a marine environment.
For exposure classifications A1, A2, B1, B2 and C, the minimum required cover of well
compacted Ductal to the tendons is 20 mm and the minimum clear spacing between adjacent
tendons is 1.5 times the tendon diameter or 20 mm, whichever is the larger.
9
4. DESIGN PROPERTIES OF DUCTAL
4.1 Behaviour in Compression
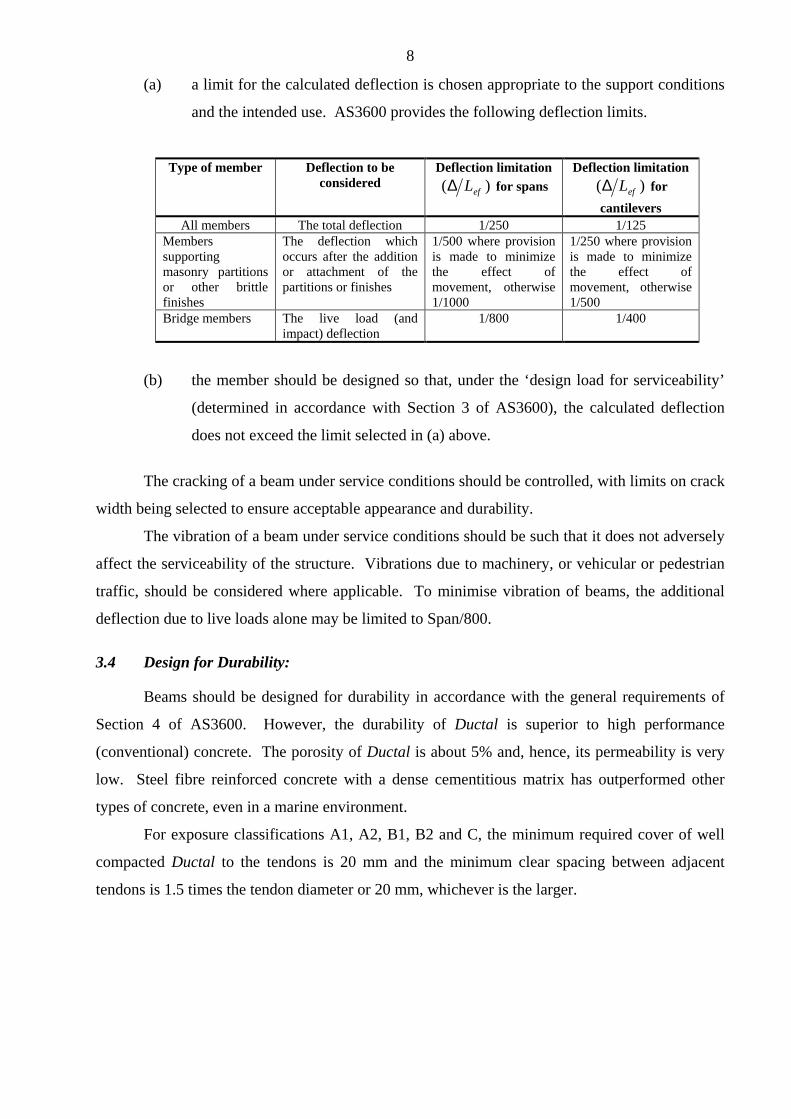
A typical stress-strain curve for Ductal is shown in Figure 1. The curve was obtained from
measurements taken in a standard compression test on a 70 mm diameter cylinder (Behloul,
1999). The ascending part of the stress-strain curve OA is essentially linear up to the peak stress,
fcu. On reaching the peak stress, the steel fibres provide considerable ductility, as is evidenced by
the plateau AB in Figure 1. The extent of the plateau depends on the type and quantity of steel
fibres. The shape of the post-peak, descending part of the stress-strain curve also depends on the
type and quantity of steel fibres.
200 A B
Stress (MPa)
160
120
80
40
O
0
0 .002 .004 .006 .008 .010 .012 .014 .016 .018 .02
Strain
Figure 1 Typical stress-strain relationship in compression (Behloul, 1999).
4.2 Characteristic Compressive Strength
The characteristic compressive strength of RPC, ,cf ′ should be determined statistically
from compressive strength tests in accordance with AS1012.9.
In order to obtain the specified characteristic strength cf ′ , the following equation can be
used:
sdff mc 33.2−=′ (4.1)
where mf is the mean compressive strength and sd is the standard deviation.
10
The characteristic compressive strength, ,cf ′ is obtained from standard 28 day
compressive tests on carefully prepared cylinders with the ends cut or ground square. The
diameter of the cylinders may vary between 70 and 100 mm and the length of the cylinders is
twice the diameter.
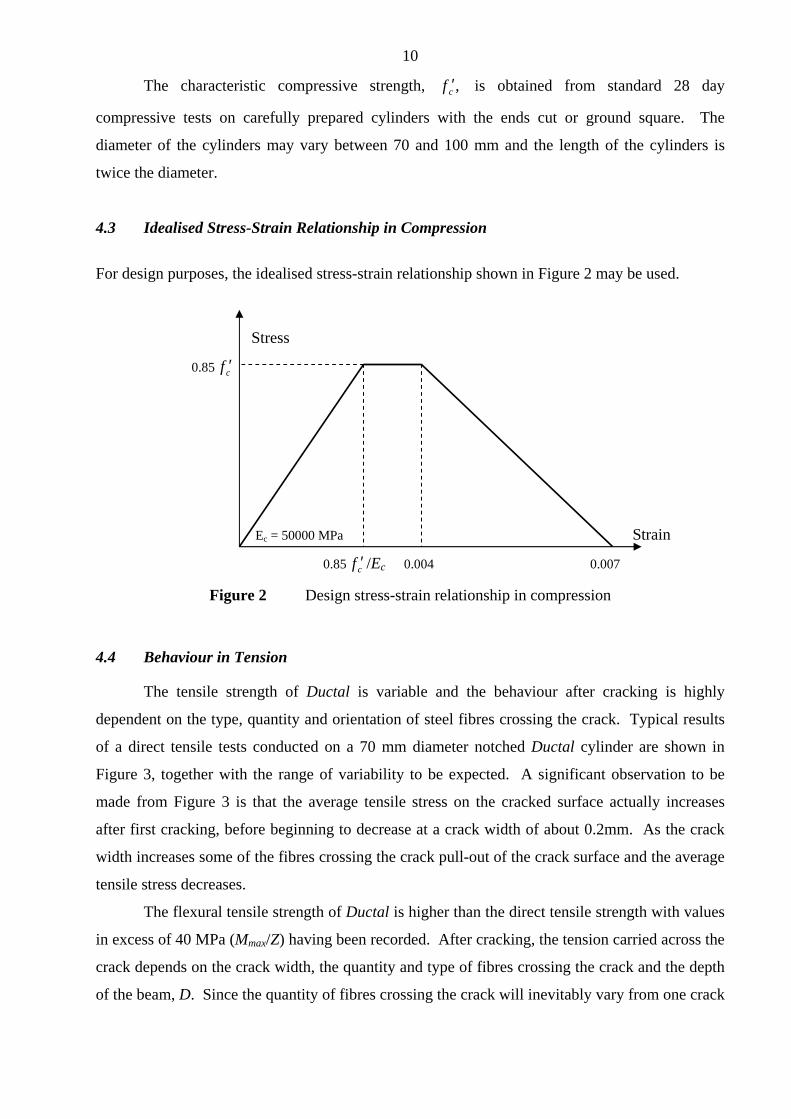
4.3 Idealised Stress-Strain Relationship in Compression
For design purposes, the idealised stress-strain relationship shown in Figure 2 may be used.
Stress
0.85 cf ′
Ec = 50000 MPa Strain
0.85 cf ′ /Ec 0.004 0.007
Figure 2 Design stress-strain relationship in compression
4.4 Behaviour in Tension
The tensile strength of Ductal is variable and the behaviour after cracking is highly
dependent on the type, quantity and orientation of steel fibres crossing the crack. Typical results
of a direct tensile tests conducted on a 70 mm diameter notched Ductal cylinder are shown in
Figure 3, together with the range of variability to be expected. A significant observation to be
made from Figure 3 is that the average tensile stress on the cracked surface actually increases
after first cracking, before beginning to decrease at a crack width of about 0.2mm. As the crack
width increases some of the fibres crossing the crack pull-out of the crack surface and the average
tensile stress decreases.
The flexural tensile strength of Ductal is higher than the direct tensile strength with values
in excess of 40 MPa (Mmax/Z) having been recorded. After cracking, the tension carried across the
crack depends on the crack width, the quantity and type of fibres crossing the crack and the depth
of the beam, D. Since the quantity of fibres crossing the crack will inevitably vary from one crack

11
to another, a high factor of safety is recommended in design when estimating the tension carried
across a crack.
Stress
(MPa) 16
upper limit
12
8
lower limit
4
0
0 0.5 1.0 1.5 2.0 2.5 3.0
Crack opening (mm)
Figure 3 Behaviour in direct tension (Behloul,1999)
The characteristic flexural tensile strength, ,fcf ′ may be determined statistically from
standard three point or four point modulus of rupture tests on prisms of square section using a
formula similar to Eqn 4.1. Unlike conventional concretes, the maximum moment (Mu) carried by
a prism of Ductal in a standard modulus of rupture test is considerably higher than the moment
required to cause first cracking (Mcr). The flexural tensile strength (fcf = Mu/Z) is therefore higher
than the tensile stress at the onset of cracking (fct = Mcr/Z). Since Mu is generally greater than
1.2Mcr for an unreinforced Ductal flexural member, the minimum flexural reinforcement
requirements for conventional concrete flexural members are not required for Ductal elements.
Overseas practice (Behloul, 1999) is to reduce the measured modulus of rupture by a
factor of safety of about 4 when determining the design tensile stress at which cracking first
occurs. For the range of Ductal strengths considered in this document (150 ≤ cf ′ ≤ 220 MPa), the
characteristic flexural tensile stress at which cracking is initiated may be taken as
ctf ′ = 8.0 MPa (4.2)
After cracking, the stress-strain curve for concrete in tension depends on the fibre length,
Lf, the fibre content and the depth of the beam, D. For a fibre length of Lf = 13 mm and a fibre
content of 2% by volume, the stress-strain curves for concrete in tension for various beam depths
are shown in Figure 4 (Behloul, 1999). The ascending part of these curves is linear with a slope
corresponding to an elastic modulus of 50 GPa. The descending curve may be approximated by a
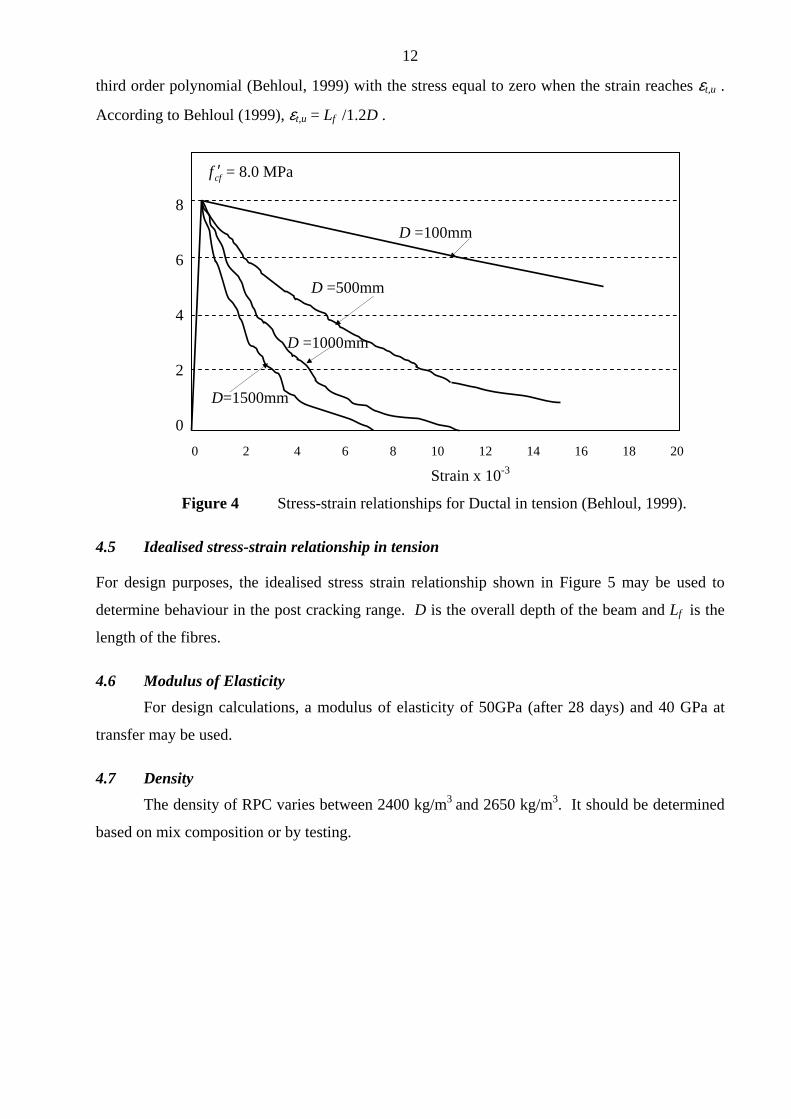
12
third order polynomial (Behloul, 1999) with the stress equal to zero when the strain reaches εt,u .
According to Behloul (1999), εt,u = Lf /1.2D .
cff ′ = 8.0 MPa
8
D =100mm
6
D =500mm
4
D =1000mm
2
D=1500mm
0
0 2 4 6 8 10 12 14 16 18 20
Strain x 10-3
Figure 4 Stress-strain relationships for Ductal in tension (Behloul, 1999).
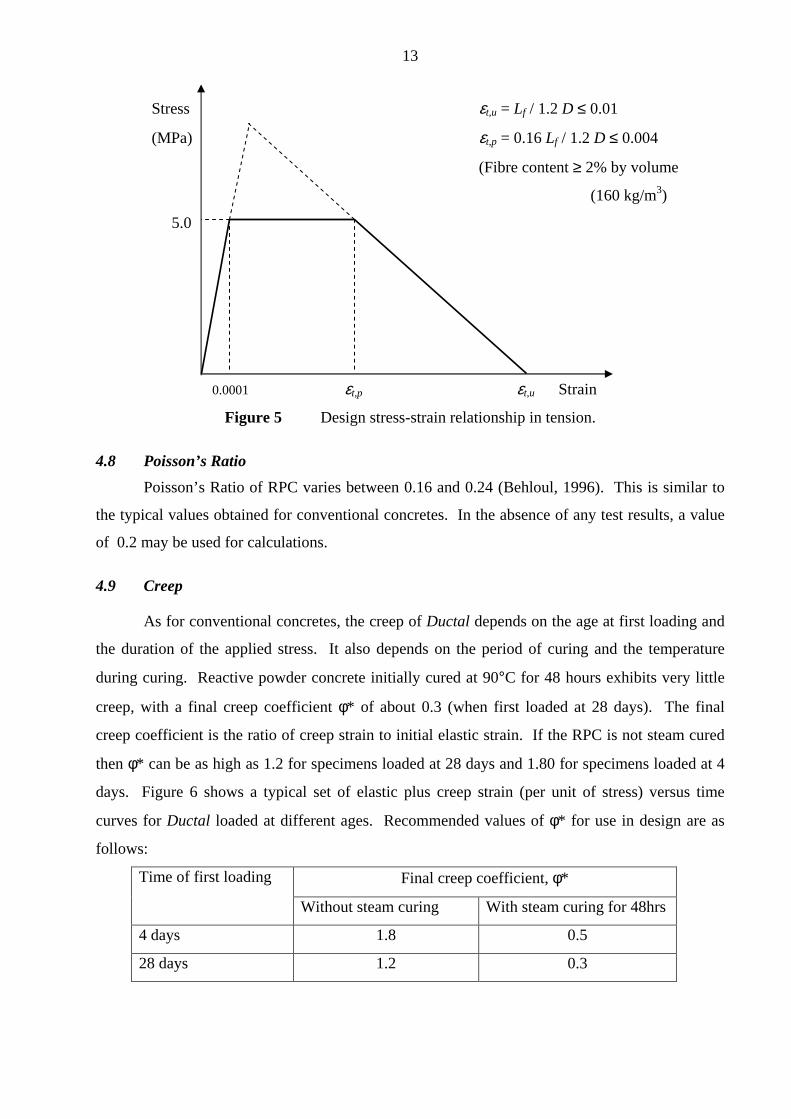
4.5 Idealised stress-strain relationship in tension
For design purposes, the idealised stress strain relationship shown in Figure 5 may be used to
determine behaviour in the post cracking range. D is the overall depth of the beam and Lf is the
length of the fibres.
4.6 Modulus of Elasticity
For design calculations, a modulus of elasticity of 50GPa (after 28 days) and 40 GPa at
transfer may be used.
4.7 Density
The density of RPC varies between 2400 kg/m3 and 2650 kg/m3. It should be determined
based on mix composition or by testing.
13
Stress εt,u = Lf / 1.2 D ≤ 0.01
(MPa) εt,p = 0.16 Lf / 1.2 D ≤ 0.004
(Fibre content ≥ 2% by volume
(160 kg/m3)
5.0
0.0001 εt,p εt,u Strain
Figure 5 Design stress-strain relationship in tension.
4.8 Poisson’s Ratio
Poisson’s Ratio of RPC varies between 0.16 and 0.24 (Behloul, 1996). This is similar to
the typical values obtained for conventional concretes. In the absence of any test results, a value
of 0.2 may be used for calculations.
4.9 Creep
As for conventional concretes, the creep of Ductal depends on the age at first loading and
the duration of the applied stress. It also depends on the period of curing and the temperature
during curing. Reactive powder concrete initially cured at 90°C for 48 hours exhibits very little
creep, with a final creep coefficient φ* of about 0.3 (when first loaded at 28 days). The final
creep coefficient is the ratio of creep strain to initial elastic strain. If the RPC is not steam cured
then φ* can be as high as 1.2 for specimens loaded at 28 days and 1.80 for specimens loaded at 4
days. Figure 6 shows a typical set of elastic plus creep strain (per unit of stress) versus time
curves for Ductal loaded at different ages. Recommended values of φ* for use in design are as
follows:
Final creep coefficient, φ* Time of first loading
Without steam curing With steam curing for 48hrs
4 days 1.8 0.5
28 days 1.2 0.3

14
4.10 Shrinkage
Reactive powder concrete suffers an endogenous shrinkage strain of about 500 x 10-6. If
initially subjected to steam curing at 90°C for at least 48 hours, almost all the shrinkage occurs
during the period of steam curing, with no shrinkage taking place subsequently. If cured at room
temperatures, the shrinkage takes place over a considerably longer period increasing at a
decreasing rate, as shown in Figure 7. The shrinkage is essentially the result of chemical
reactions within the RPC and is not the same as drying shrinkage in conventional concretes. As a
result, even for RPC cured at room temperatures, the great majority of shrinkage occurs in the
first 28 days after casting.
50 Loading Age
4 days
40 7 days
14 days
30 28 days
Creep After curing at 90°C for 48 hrs
20
10 Elastic
0
0 50 100 Age (Days) 150
Figure 6 Creep plus elastic strain versus time (Behloul, 1999)
0.0005
Shrinkage
Strain
with initial heat treatment
without initial heat treatment
0 2 Age (days) 28
Figure 7 Shrinkage versus time for specimens with and without initial heat treatment.
15
5. STRENGTH IN FLEXURE
5.1 Theoretical Moment Capacity
Calculations for strength of a section in bending should incorporate equilibrium and strain
compatibility considerations and be consistent with the following assumptions:
(a) plane sections normal to the beam axis remain plane after bending; and
(b) the distribution of concrete compressive and tensile stresses are as outlined in
Figures 2 and 5, respectively.
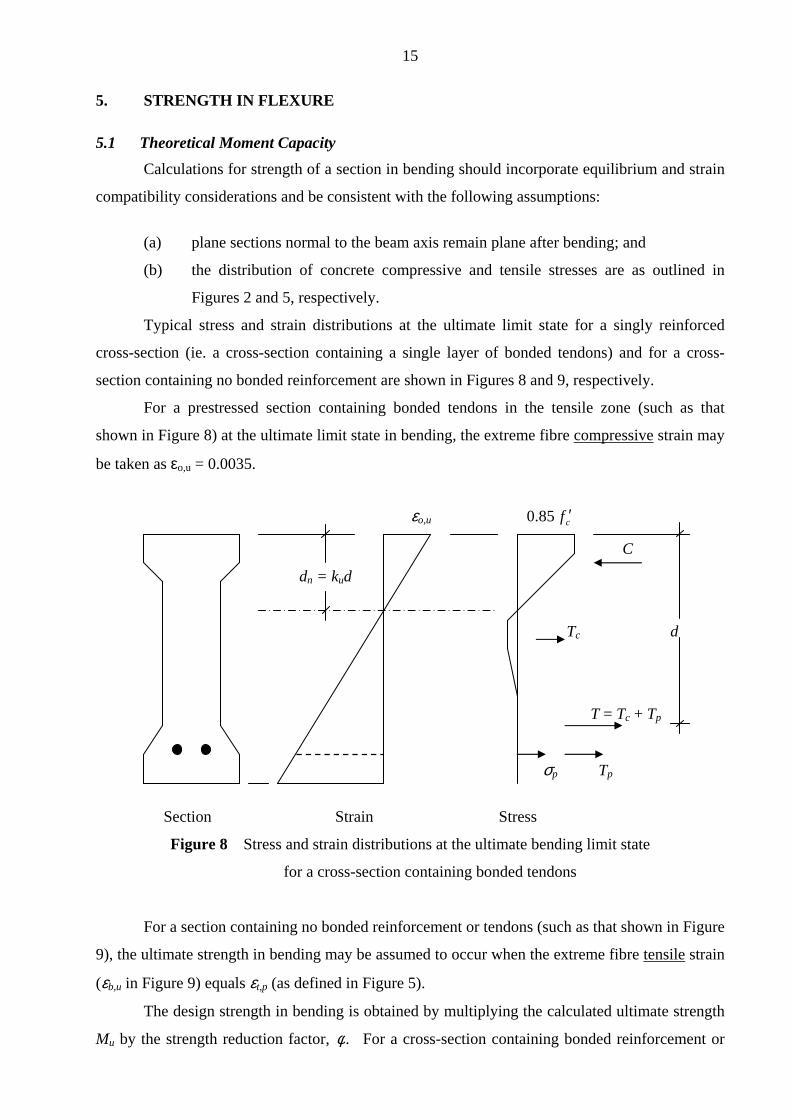
Typical stress and strain distributions at the ultimate limit state for a singly reinforced
cross-section (ie. a cross-section containing a single layer of bonded tendons) and for a cross-
section containing no bonded reinforcement are shown in Figures 8 and 9, respectively.
For a prestressed section containing bonded tendons in the tensile zone (such as that
shown in Figure 8) at the ultimate limit state in bending, the extreme fibre compressive strain may
be taken as εo,u = 0.0035.
εo,u 0.85 cf ′
C
dn = kud
Tc d
T = Tc + Tp
σp Tp
Section Strain Stress
Figure 8 Stress and strain distributions at the ultimate bending limit state
for a cross-section containing bonded tendons
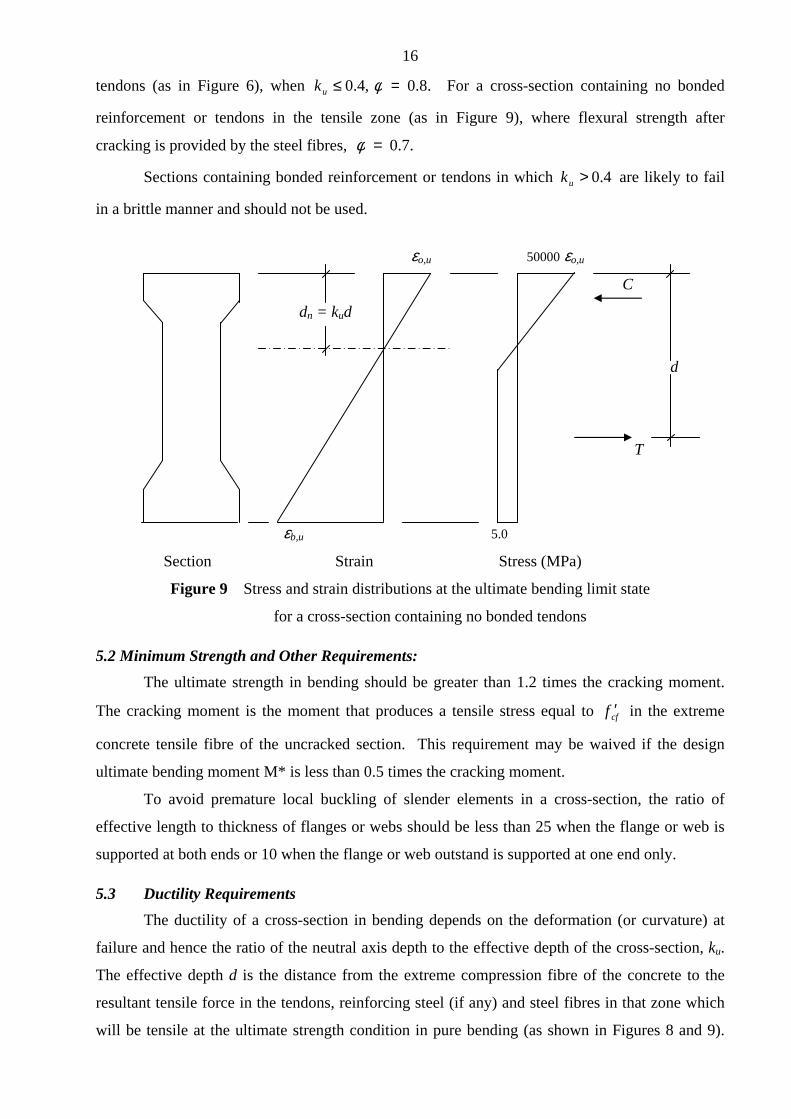
For a section containing no bonded reinforcement or tendons (such as that shown in Figure
9), the ultimate strength in bending may be assumed to occur when the extreme fibre tensile strain
(εb,u in Figure 9) equals εt,p (as defined in Figure 5).
The design strength in bending is obtained by multiplying the calculated ultimate strength
Mu by the strength reduction factor, .φ For a cross-section containing bonded reinforcement or
16
tendons (as in Figure 6), when .8.0,4.0 =≤ φuk For a cross-section containing no bonded
reinforcement or tendons in the tensile zone (as in Figure 9), where flexural strength after
cracking is provided by the steel fibres, .7.0=φ
Sections containing bonded reinforcement or tendons in which 4.0>uk are likely to fail
in a brittle manner and should not be used.
εo,u 50000 εo,u
C
dn = kud
d
T
εb,u 5.0
Section Strain Stress (MPa)
Figure 9 Stress and strain distributions at the ultimate bending limit state
for a cross-section containing no bonded tendons
5.2 Minimum Strength and Other Requirements:
The ultimate strength in bending should be greater than 1.2 times the cracking moment.
The cracking moment is the moment that produces a tensile stress equal to cff ′ in the extreme
concrete tensile fibre of the uncracked section. This requirement may be waived if the design
ultimate bending moment M* is less than 0.5 times the cracking moment.
To avoid premature local buckling of slender elements in a cross-section, the ratio of
effective length to thickness of flanges or webs should be less than 25 when the flange or web is
supported at both ends or 10 when the flange or web outstand is supported at one end only.
5.3 Ductility Requirements
The ductility of a cross-section in bending depends on the deformation (or curvature) at
failure and hence the ratio of the neutral axis depth to the effective depth of the cross-section, ku.
The effective depth d is the distance from the extreme compression fibre of the concrete to the
resultant tensile force in the tendons, reinforcing steel (if any) and steel fibres in that zone which
will be tensile at the ultimate strength condition in pure bending (as shown in Figures 8 and 9).

17
Hence, ku is affected by the quantity of reinforcement in the tensile zone (which includes tendons,
conventional reinforcement and fibres).
To ensure adequate ductility, ku should not exceed 0.4.
18
6. STRENGTH IN SHEAR
6.1 Discussion
The existing French literature suggests that the design for shear requires checks at both the
serviceability and ultimate limit states. For serviceability, shear can only be a problem if it causes
cracks under service loads with widths exceeding acceptable crack limits. The approach taken
here when checking the shear strength of sections not containing transverse shear reinforcement
will ensure that shear cracking under service conditions does not occur. Hence, the design for
shear need only consider the strength limit states.
6.2 Design Shear Strength
The design shear force V* (caused by the factored design loads for the strength limit
states) should not exceed the design strength, uVφ (where 7.0=φ in accordance with AS3600 –
1994).
The shear strength of a prestressed concrete section, Vu, is given by
vusucu PVVV ++= (6.1)
where Vuc is the contribution of the concrete to the shear strength, Vus is the contribution of the
transverse shear reinforcement (if any) and Pv is the transverse component of the prestressing
force which will exist if the prestressing tendon is inclined at an angle to the member axis.
In the absence of shear reinforcement and inclined tendons, for pretensioned beams, the
shear strength becomes
ucu VV = (6.2)
Much more research is required to calibrate the post-cracking contribution of RPC to the
shear strength of beams. At present, it is suggested that, for a cross-section that is uncracked in
flexure, the shear strength Vuc is limited to the shear force Vt required to produce a principal
tensile stress of (5.0 + 0.13 cf ′ ) (in MPa) at either the centroidal axis or at the junction of the
web and the flange of the cross-section, whichever is the smaller.

19
The stresses at a point in the web of a cross-section are shown in Figure 10.
τ
Figure 10 τ
σ σ
τ
τ
The principal tensile stress 1σ is given by
22
1 22τσσσ +
+= (≤ (5.0 + 0.13 cf ′ ) MPa) (6.3)
where I
My
I
yPe
A
P +−−=σ and Ib
QVt=τ (6.4)
P is the effective prestress after all losses; e is the eccentricity of the prestressing tendon; y
is the distance from the centroidal axis to the point under consideration; A and I are respectively
the area of the cross-section and the second moment of area of the cross-section about the
centroidal axis; Q is the first moment of area about the centroidal axis of that part of the cross-
section between the level under consideration and the extreme fibre; b is the width of the web at
the point under consideration; and M is the moment at the section when the shear force is Vt.
With Vt calculated from Eqn 6.3, the shear strength of a section not containing stirrups may be
taken as
vtuc PVV += (6.5)
6.3 Critical Section for Shear in Beams
When a beam is supported on its soffit and diagonal cracking cannot take place at the
support or extend into the support, the critical section for shear is at a distance equal to d from the
face of the support. Where diagonal cracking can take place at the support or extend into the
support, the critical section is at the face of the support. The maximum transverse shear to be
considered in design is the factored design ultimate shear force at the critical section.

20
6.4 Strength of Slabs in Shear
The strength of a slab in shear shall be determined in accordance with the following:
(a) Where shear failure can occur across the width of the slab, the design shear strength
of the slab shall be calculated in accordance with Section 6.2.
(b) Where shear failure can occur locally around a support or concentrated load, the
design shear strength of the slab shall be taken as uVφ , where uV is calculated from
]8
1[*
*
adV
uM
VV
v
uou
+= (6.6)
where
)3.05( cpuo udV σ+= (6.7)
and u is the effective length of the critical shear perimeter; *vM is the bending
moment transferred from the slab to the support in the direction being considered;
d is the effective depth of the slab averaged around the critical shear perimeter; a is
the dimension of the critical shear perimeter measured parallel to the direction of
the span producing *vM ; and cpσ is the average effective prestress around the
critical shear perimeter (+ve if compressive and -ve if tensile).
The critical shear perimeter, mentioned in (b) above, is defined by a line geometrically
similar to the boundary of the effective area of a support or concentrated load and located at a
distance of d/2 therefrom.
In the case of a concentrated wheel load acting on a slab, *vM is zero and Eqns 6.6 and 6.7
reduce to
)3.05( cpuou udVV σ+== (6.8)
21
7. STRENGTH IN TORSION
7.1 Design Torsional Strength
For a member or element subjected to pure torsion, the design torsion T* (caused by the
factored design loads for the strength limit states) should not exceed the design strength, uTφ ,
where 7.0=φ in accordance with AS3600 – 1994.
For a member not containing torsional reinforcement (in the form of closed ties and
longitudinal reinforcement), the torsional strength uT may be taken as the torsional strength of the
concrete section, ucT , which is conventionally taken as the pure torsion required to cause first
cracking and may be estimated from Eqn 7.1.
ccpctuc ffJT ′+′+= /101)13.00.5( σ (7.1)
where tJ is the torsional constant for the cross-section given by
yxJt24.0= for solid sections
yx24.0 Σ= for solid flanged sections
wmbA2= for thin-walled hollow sections
x and y are the shorter and longer overall dimensions of the rectangular part(s) of the solid section,
respectively; Am is the area enclosed by the median lines of the walls of a hollow section; bw is
the minimum thickness of the walls of the hollow section; the term (5.0 + 0.13 cf ′ ) represents
the tensile strength of the concrete in MPa; the term ccp f ′+ /101 σ is the beneficial effect of the
prestress; and cpσ is the average effective prestress, Pe/A.
7.2 Strength in combined Shear and Torsion
For a cross-section subjected to combined shear and torsion and not containing shear or
torsional reinforcement, the requirements for adequate strength are satisfied if the following
inequality is satisfied:
75.0** ≤+ucuc V
V
T
T
φφ (7.2)
where T* and V* are the factored design torsion and shear, respectively; Tuc is determined from
Eqn 7.1; and Vuc is obtained from Eqn 6.5. Much more research is required to calibrate the
strength of RPC beams in combined shear and torsion. The procedure adopted here is consistent
with the procedure taken in AS3600 and is considered to be adequate.

22
8. CRACK CONTROL IN FLEXURE AT SERVICE LOADS
8.1 Non-Prestressed Elements
Flexural cracking may be deemed to be controlled, if under the short-term service loads
the resulting maximum tensile stress in Ductal does not exceed 6.0 MPa.
If flexural cracking does occur under short-term service loads, the cracks may be deemed
to be controlled if the design crack width at the extreme tensile fibre is less than 0.3mm. In the
case of a cross-section not containing any bonded tendons in the tensile zone, the design crack
width, w, at the extreme tensile fibre of the section may be taken as
)00016.0(5.1 −= bDw ε (8.1)
where bε is the concrete strain at the extreme tensile fibre calculated from a cracked section
analysis.
8.2 Prestressed Elements
For sections containing bonded tendons in the tensile zone, flexural cracking may be
deemed to be controlled if, under short-term service loads, the resulting maximum tensile stress in
the concrete does not exceed 8.0 MPa, or if this stress is exceeded, by
(a) providing bonded reinforcement or tendons near the tensile face; and
(b) the increment in steel stress near the tension face is less than 200 MPa, as the load
is increased from its value when the extreme concrete tensile fibre is at zero stress
to the short-term service load value.
23
9. DEFLECTION AT SERVICE LOADS
9.1 Short-term deflection
Most RPC prestressed beams will be uncracked under service loads. The short-term
deflection of uncracked beams may be calculated assuming an elastic modulus of 50000 MPa and
the second moment of area of the gross section about the centroidal axis.
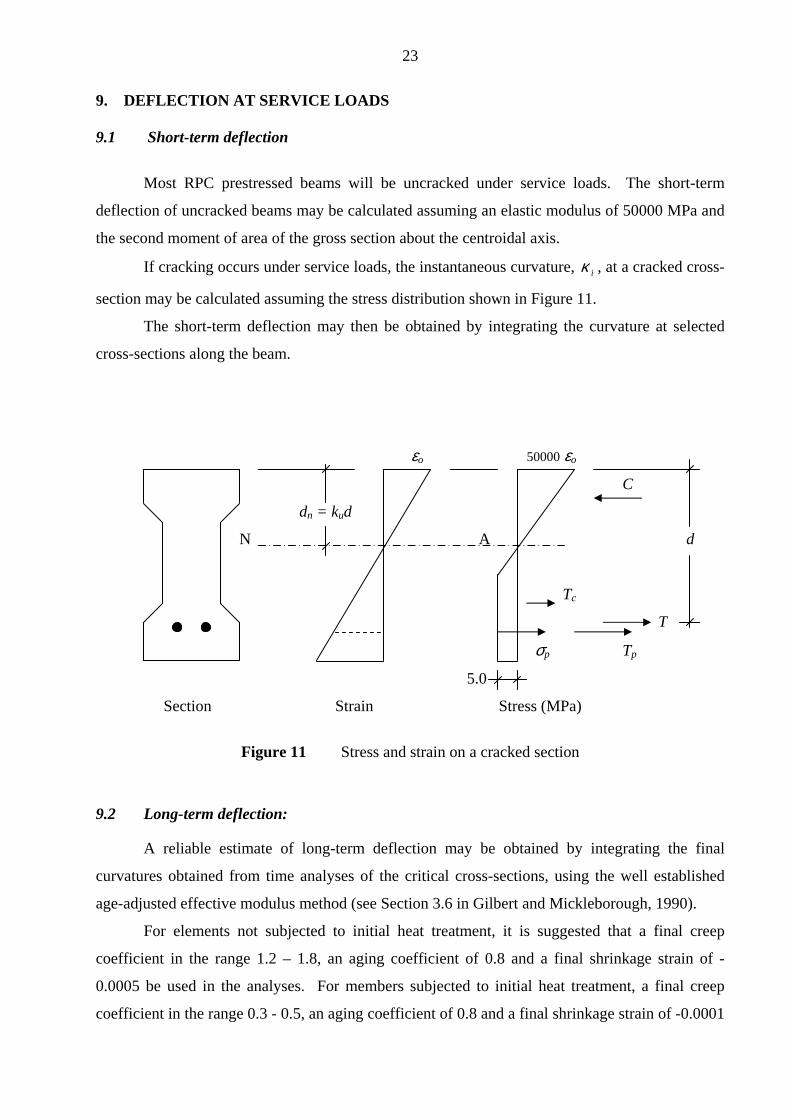
If cracking occurs under service loads, the instantaneous curvature, iκ , at a cracked cross-
section may be calculated assuming the stress distribution shown in Figure 11.
The short-term deflection may then be obtained by integrating the curvature at selected
cross-sections along the beam.
εo 50000 εo
C
dn = kud
N A d
Tc
T
σp Tp
5.0
Section Strain Stress (MPa)
Figure 11 Stress and strain on a cracked section
9.2 Long-term deflection:
A reliable estimate of long-term deflection may be obtained by integrating the final
curvatures obtained from time analyses of the critical cross-sections, using the well established
age-adjusted effective modulus method (see Section 3.6 in Gilbert and Mickleborough, 1990).
For elements not subjected to initial heat treatment, it is suggested that a final creep
coefficient in the range 1.2 – 1.8, an aging coefficient of 0.8 and a final shrinkage strain of -
0.0005 be used in the analyses. For members subjected to initial heat treatment, a final creep
coefficient in the range 0.3 - 0.5, an aging coefficient of 0.8 and a final shrinkage strain of -0.0001

24
should be used in the analyses. It should be remembered that an endogenous shrinkage strain of
about -0.0005 occurs during the heat treatment process (in the first 48 hours).

25
10. RESISTANCE TO FIRE
The fire resistance of Ductal is currently the subject of research and no conclusive
recommendations can be made. Some RPC mixes with 200MPa compressive strength, showed
spalling at 500°C. Mix design is critical in achieving enhanced performance under fire
conditions. A mix of steel and synthetic fibres has been shown to alleviate some of the problems
by providing voids in the RPC which reduce the build up of internal pressure during exposure to
fire.
However, in applications such as bridge beams and sound barriers this is not considered to
be a problem. For building structures, the resistance to fire is more important and consideration
should be given to the inclusion of synthetic fibres in the mix.
11. FATIGUE
Fatigue tests carried out on DUCTAL specimens indicate that RPC has a superior fatigue
performance than normal strength concrete, high performance concrete and conventional
reinforced concrete, as shown in Figure 12.
1.1
RPC
Rate of Loading
0.9
CRC
NSC
0.7
HPC
0.5
1E00 1E01 1E02 1E03 1E04 1E05 1E06 1E07
Number of cycles
Figure 12 S-N curves (Behloul, 1999).
26
12. LOSSES OF PRESTRESS
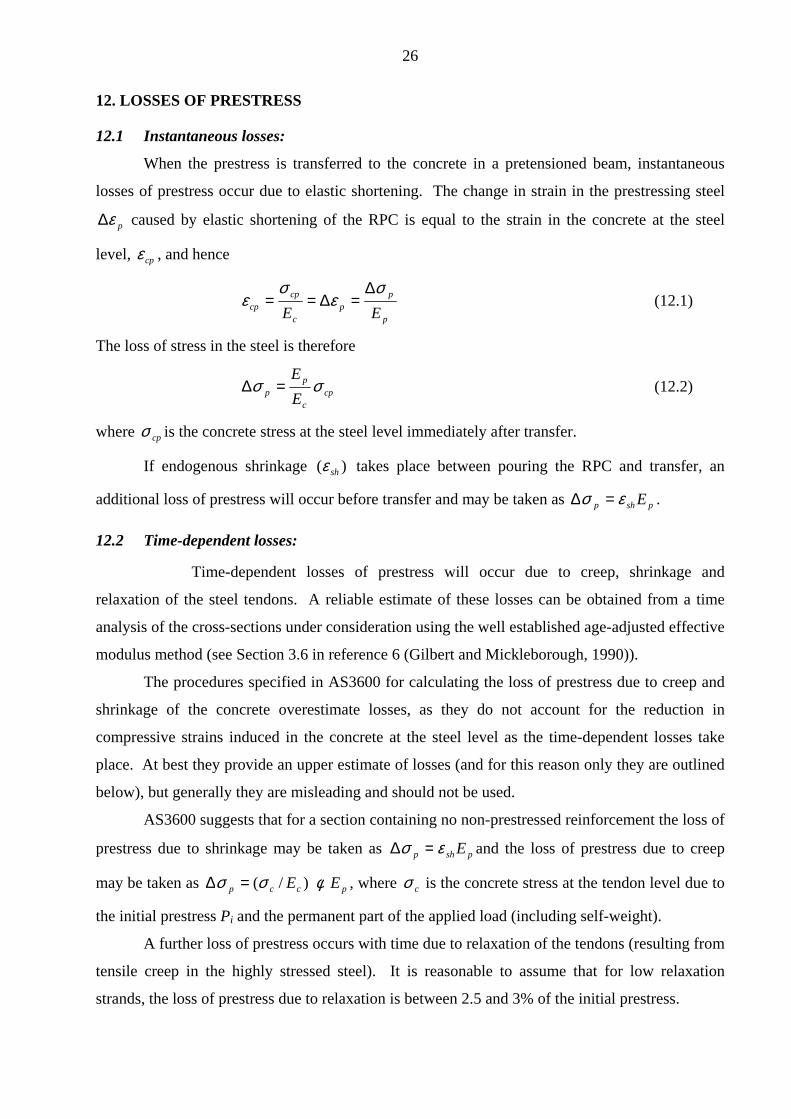
12.1 Instantaneous losses:
When the prestress is transferred to the concrete in a pretensioned beam, instantaneous
losses of prestress occur due to elastic shortening. The change in strain in the prestressing steel
pε∆ caused by elastic shortening of the RPC is equal to the strain in the concrete at the steel
level, cpε , and hence
p
pp
c
cpcp EE
σε
σε
∆=∆== (12.1)
The loss of stress in the steel is therefore
cpc
pp E
Eσσ =∆ (12.2)
where cpσ is the concrete stress at the steel level immediately after transfer.
If endogenous shrinkage )( shε takes place between pouring the RPC and transfer, an
additional loss of prestress will occur before transfer and may be taken as pshp Eεσ =∆ .
12.2 Time-dependent losses:
Time-dependent losses of prestress will occur due to creep, shrinkage and
relaxation of the steel tendons. A reliable estimate of these losses can be obtained from a time
analysis of the cross-sections under consideration using the well established age-adjusted effective
modulus method (see Section 3.6 in reference 6 (Gilbert and Mickleborough, 1990)).
The procedures specified in AS3600 for calculating the loss of prestress due to creep and
shrinkage of the concrete overestimate losses, as they do not account for the reduction in
compressive strains induced in the concrete at the steel level as the time-dependent losses take
place. At best they provide an upper estimate of losses (and for this reason only they are outlined
below), but generally they are misleading and should not be used.
AS3600 suggests that for a section containing no non-prestressed reinforcement the loss of
prestress due to shrinkage may be taken as pshp Eεσ =∆ and the loss of prestress due to creep
may be taken as pccp EE φσσ )/(=∆ , where cσ is the concrete stress at the tendon level due to
the initial prestress Pi and the permanent part of the applied load (including self-weight).
A further loss of prestress occurs with time due to relaxation of the tendons (resulting from
tensile creep in the highly stressed steel). It is reasonable to assume that for low relaxation
strands, the loss of prestress due to relaxation is between 2.5 and 3% of the initial prestress.

27
13. ANCHORAGE ZONES
The anchorage zone is the zone between the loaded face of the beam and the cross-section
at which a linear distribution of stress due to prestress is achieved. For post-tensioned members,
the prestress is applied through anchorage or bearing plates at the loaded face. In the case of
pretensioned members, the prestress is applied more gradually due to bond between the tendon
and the concrete over a distance along the pretensioned tendon known as the transmission length,
.tl
The transmission length is considerably shorter in RPC beams than in conventional
concrete beams because the bond conditions between the tendons and the RPC containing steel
fibres are more favourable. For Ductal beams, the transmission length of strand is in the range
20db to 40db, where db is the diameter of the pretensioned strand. When designing the anchorage
zone, it is recommended that the lower end of this range be selected as the length over which the
concentrated prestressing force is transferred to the concrete. This is conservative and will result
in the largest transverse tension within the anchorage zone. However, when checking the stresses
on a cross-section near to the end of a beam or when checking the shear strength of such a section,
it is conservative to adopt a transmission length closer to the upper end of the range.
For the analysis and design of the anchorage zone, it is sufficient to adopt a strut and tie
model which appropriately identifies the primary flow of forces in the anchorage zone (Marti and
Rogowski, 1991). If primary tension tie forces are to be resisted by the Ductal without the
assistance of transverse reinforcement, it is recommended that the dimensions of the section be
selected such that the average tensile stress in the RPC tie should not exceed 5.0 MPa and the
maximum tensile stress in the RPC should not exceed 8.0 MPa.
Some typical strut and tie models that may be used in anchorage zone design are shown in
Figure 13. The internal forces are obtained readily using the principles of statics.
In the case of the concentrically placed tendons of Figure 13a, the average tensile stress in
concrete resisting the tension force Ts may be taken as )/( TSwsav bT l=σ , where wb is the width of
the tie, and may be taken as the effective width of the concrete web at the level of the tendon, and
TSl is the tie dimension in the direction of the tendon and may be taken as 30db or 0.3D,
whichever is the greater. For the case of the eccentric tendon in Figure 13b, the tension tie force
Ts is resisted by a triangular distribution of transverse tensile stresses, with the maximum
transverse tensile stress occurring at the end face of the beam and given by )5.0/(max TSws bT l=σ .

28
0.5D - 0.6D
P/5
P/5
Pretensioned tendon Ts
P P/5
P/5
P/5
(a) tl
0.5D - 0.6D
Ts
Pretensioned tendon
(b) tl
Figure 13 Typical strut and tie models for the anchorage zone
29
14. REFERENCES
1. AS3600 – 1994, Australian Standard for “Concrete Structures”.
2. AS3600 Supp 1 – 1994, Concrete Structures – Commentary.
3. Behloul Mouloud (1996), Analyse et Modelisation du Comportement d’un Matrice
Cimentaire Fibree a Ultra Hautes Performances (Betons de Poudres Reactives), France,
180 pp.
4. Behloul, M (1999), Design Rules for DUCTAL Prestressed Beams, 19pp.
5. Chauvel, Adeline, Jacquemmoz and Birelli, First design rules for RPC beams.
6. Dallaire, E., Aitcin, P.C. and Lachemi, M. (1998), High Performance Powder, Civil
Engineering Journal, ASCE, pp 48-51.
7. Gilbert and Mickleborough (1990), Design of Prestressed Concrete, Unwin Hyman
(London), 504 pp.
8. Gowripalan, Dumitru, Smorchevsky, Marks and B’De Souza (1999), Modified reactive
powder concrete for prestressed concrete applications, Conc. Ins. Australia Biennial
Conference, Sydney.
9. Hassan W (1999), Optimisation of RPC mixes, undergraduate thesis, UNSW.
10. Kahlil, G (1998), Mechanical properties of RPC using readily available materials in
Australia, undergraduate thesis, UNSW.
11. Marti P and Rogowski D (1991), Detailing for Post-tensioning, VSL International.
12. Nguyen VQ (1998), RPC subjected to high temperature, undergraduate thesis, UNSW.
13. Parduli F (1999), High temperature effects on RPC, undergraduate thesis, UNSW.
14. Richard and Cheyrezy (1994?), Ductile ultra high strength concrete (200 – 800 MPa)
15. Te Strake, M. (1997), Feasibility of manufacturing reactive powder concrete in Australia,
undergraduate thesis, UNSW.
30
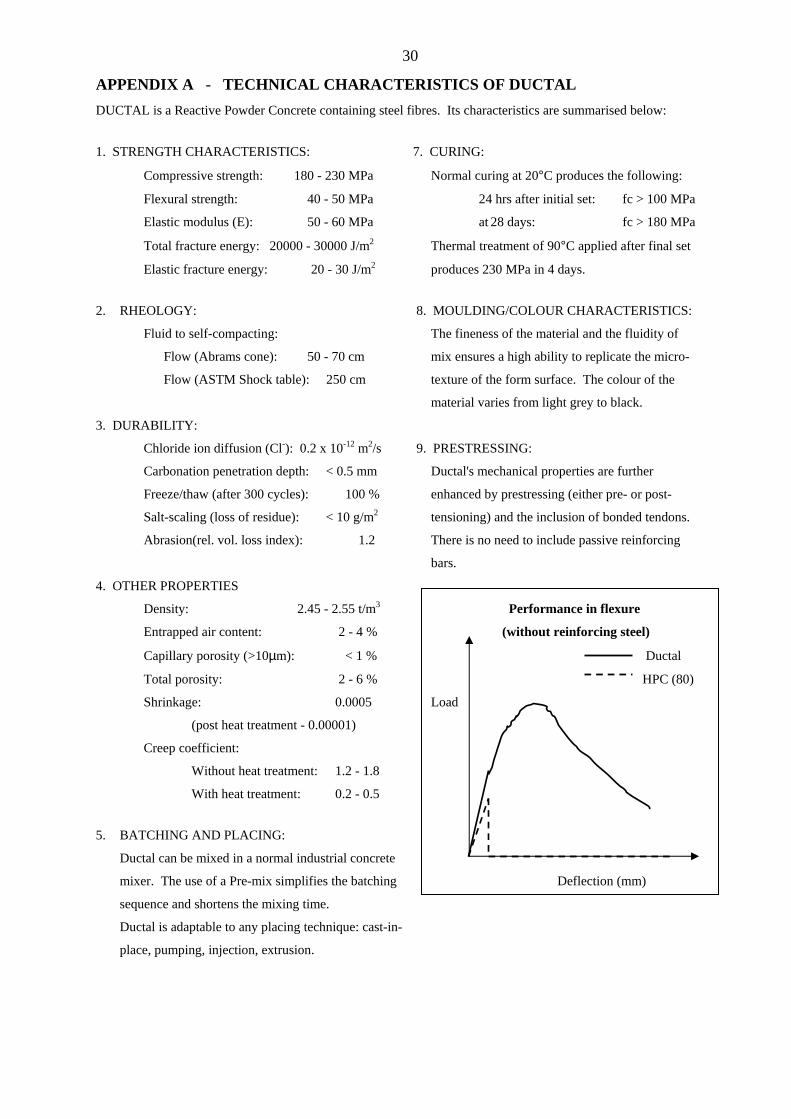
APPENDIX A - TECHNICAL CHARACTERISTICS OF DUCTAL
DUCTAL is a Reactive Powder Concrete containing steel fibres. Its characteristics are summarised below:
1. STRENGTH CHARACTERISTICS: 7. CURING:
Compressive strength: 180 - 230 MPa Normal curing at 20°C produces the following:
Flexural strength: 40 - 50 MPa 24 hrs after initial set: fc > 100 MPa
Elastic modulus (E): 50 - 60 MPa at 28 days: fc > 180 MPa
Total fracture energy: 20000 - 30000 J/m2 Thermal treatment of 90°C applied after final set
Elastic fracture energy: 20 - 30 J/m2 produces 230 MPa in 4 days.
2. RHEOLOGY: 8. MOULDING/COLOUR CHARACTERISTICS:
Fluid to self-compacting: The fineness of the material and the fluidity of
Flow (Abrams cone): 50 - 70 cm mix ensures a high ability to replicate the micro-
Flow (ASTM Shock table): 250 cm texture of the form surface. The colour of the
material varies from light grey to black.
3. DURABILITY:
Chloride ion diffusion (Cl-): 0.2 x 10⁻¹² m2/s 9. PRESTRESSING:
Carbonation penetration depth: < 0.5 mm Ductal's mechanical properties are further
Freeze/thaw (after 300 cycles): 100 % enhanced by prestressing (either pre- or post-
Salt-scaling (loss of residue): < 10 g/m2 tensioning) and the inclusion of bonded tendons.
Abrasion(rel. vol. loss index): 1.2 There is no need to include passive reinforcing
bars.
4. OTHER PROPERTIES
Density: 2.45 - 2.55 t/m3 Performance in flexure
Entrapped air content: 2 - 4 % (without reinforcing steel)
Capillary porosity (>10µm): < 1 % Ductal
Total porosity: 2 - 6 % HPC (80)
Shrinkage: 0.0005 Load
(post heat treatment - 0.00001)
Creep coefficient:
Without heat treatment: 1.2 - 1.8
With heat treatment: 0.2 - 0.5
5. BATCHING AND PLACING:
Ductal can be mixed in a normal industrial concrete
mixer. The use of a Pre-mix simplifies the batching Deflection (mm)
sequence and shortens the mixing time.
Ductal is adaptable to any placing technique: cast-in-
place, pumping, injection, extrusion.

31
APPENDIX B - FLEXURAL BEHAVIOUR
The moment-curvature relationship for a cross-section may be determined from first
principles by enforcing the requirements of strain compatibility, equilibrium and the stress-strain
relationships for the materials. The stress-strain relationships adopted here are as follows:
(i) for RPC in compression - Figure 2;
(ii) for RPC in tension - Figure 5; and
(iii) for prestressing steel in tension - an elastic-plastic relationship with an
initial elastic modulus of 200000 MPa and a yield stress of 1800 MPa.
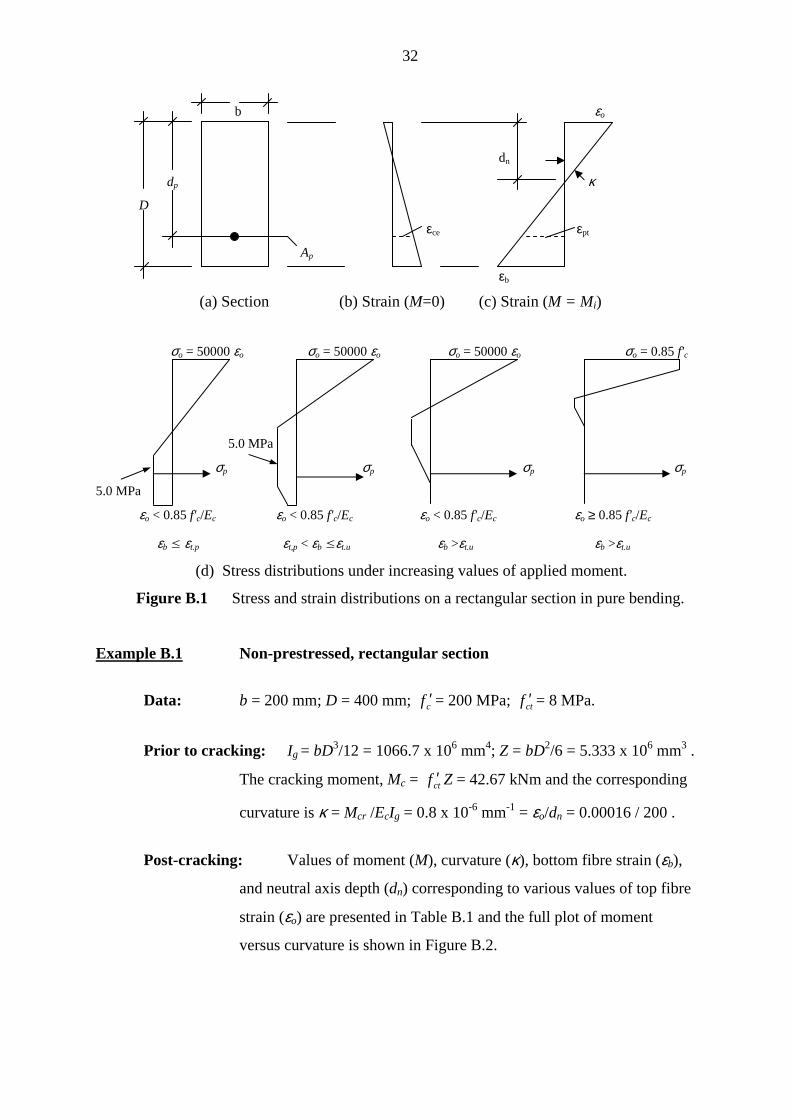
Consider the singly-reinforced rectangular cross-section shown in Figure B.1a. The strain
distribution when the applied moment is zero is shown in Figure B.1b. When a moment Mi is
applied to the cross-section, the strain distribution changes from that in Figure B.1b to that in
Figure B.1c. The top fibre strain εo and the depth to the neutral axis dn depend on the magnitude
of M.
The stress distribution in the RPC depends on εo and dn, with typical distributions shown
in Figure B.1d. The strain in the prestressing steel when M = 0 is εpe = Pe/ApEp , where Pe is the
effective prestress, Ap is the area of the prestressing steel and Ep is its elastic modulus. The
change in strain in the prestressing steel as the moment Mi is applied is equal to the change in
strain at the level of the bonded tendon, ie. |εce| + εpt (where εce and εpt are defined in Figures B.1b
and c, respectively.
To obtain a point on the moment-curvature curve for the cross-section, an appropriate
value of εo is first selected. A search is then undertaken to determine the value of dn which
satisfies horizontal equilibrium. That is, the sum of the compressive forces on the cross-section
(the volume of the compressive stress block) equals the sum of the tensile forces on the cross-
section (the volume of the tensile stress block on the RPC plus the tensile force in the prestressing
steel, if any). When the correct value of dn is determined, the moment M corresponding to the
current value of εo is obtained by taking moments of the compressive and tensile forces on the
cross-section about any convenient point. The corresponding curvature is the slope of the strain
diagram, κ = εo/dn. By incrementing the value of εo and repeating the above procedure, the
moment-curvature relationship can be readily generated.
32
b εo
dn
dp κ
D
εce εpt
Ap
εb
(a) Section (b) Strain (M=0) (c) Strain (M = Mi)
σo = 50000 εo σo = 50000 εo σo = 50000 εo σo = 0.85 f'c
5.0 MPa
σp σp σp σp
5.0 MPa
εo < 0.85 f'c/Ec εo < 0.85 f'c/Ec εo < 0.85 f'c/Ec εo ≥ 0.85 f'c/Ec
εb ≤ εt.p εt,p < εb ≤εt.u εb >εt.u εb >εt.u
(d) Stress distributions under increasing values of applied moment.
Figure B.1 Stress and strain distributions on a rectangular section in pure bending.
Example B.1 Non-prestressed, rectangular section
Data: b = 200 mm; D = 400 mm; cf ′ = 200 MPa; ctf ′ = 8 MPa.
Prior to cracking: Ig = bD3/12 = 1066.7 x 106 mm4; Z = bD2/6 = 5.333 x 106 mm3 .
The cracking moment, Mc = ctf ′ Z = 42.67 kNm and the corresponding
curvature is κ = Mcr /EcIg = 0.8 x 10⁻⁶ mm-1 = εo/dn = 0.00016 / 200 .
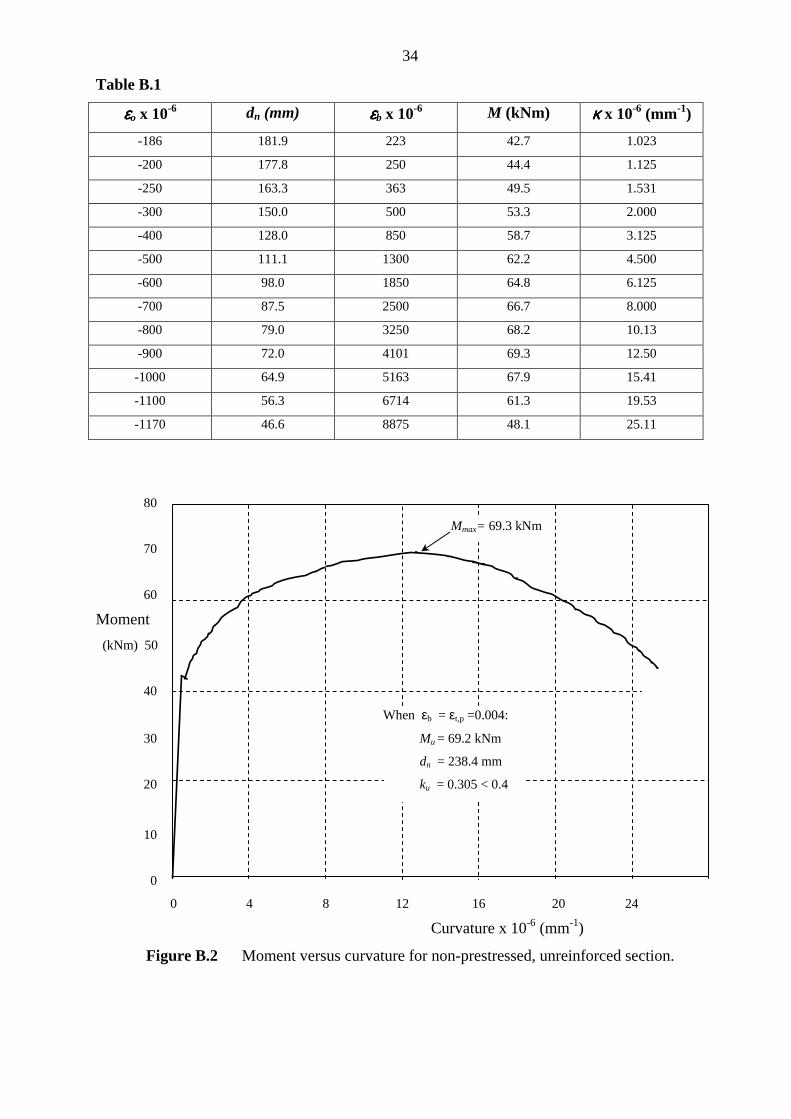
Post-cracking: Values of moment (M), curvature (κ), bottom fibre strain (εb),
and neutral axis depth (dn) corresponding to various values of top fibre
strain (εo) are presented in Table B.1 and the full plot of moment
versus curvature is shown in Figure B.2.
33
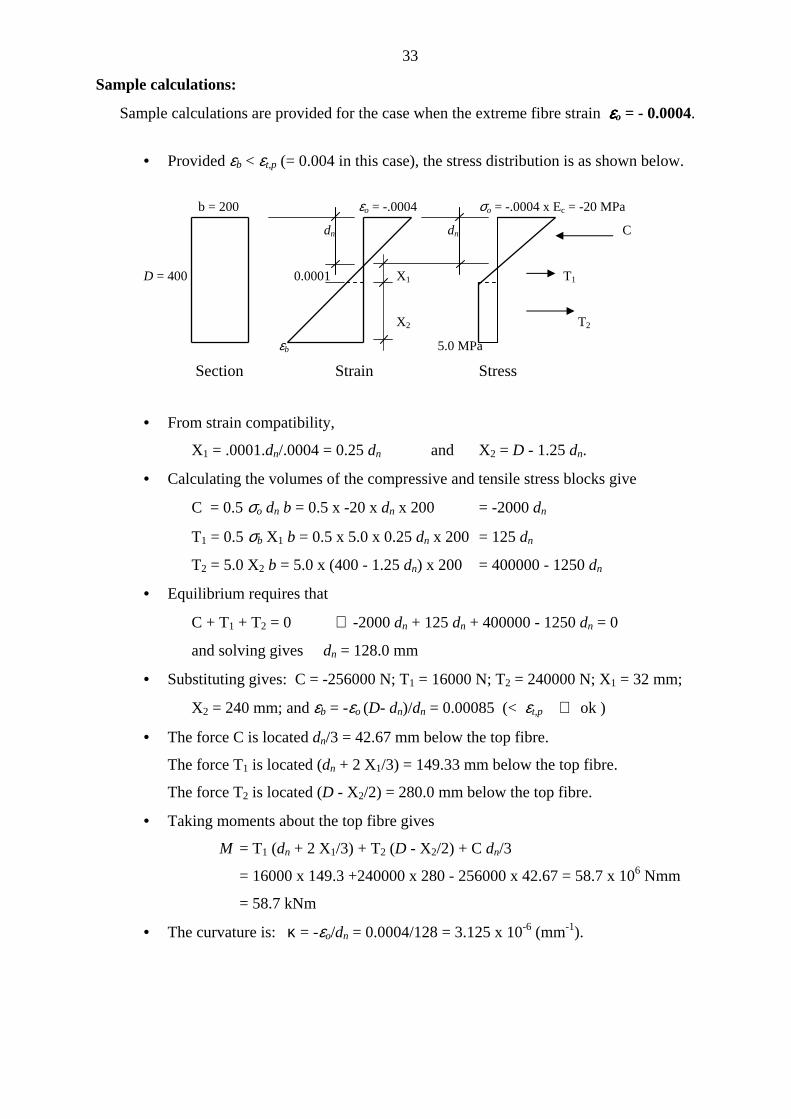
Sample calculations:
Sample calculations are provided for the case when the extreme fibre strain εεεεo = - 0.0004.
• Provided εb < εt,p (= 0.004 in this case), the stress distribution is as shown below.
b = 200 εo = -.0004 σo = -.0004 x Ec = -20 MPa
dn dn C
D = 400 0.0001 X1 T1
X2 T2
εb 5.0 MPa
Section Strain Stress
• From strain compatibility,
X1 = .0001.dn/.0004 = 0.25 dn and X2 = D - 1.25 dn.
• Calculating the volumes of the compressive and tensile stress blocks give
C = 0.5 σo dn b = 0.5 x -20 x dn x 200 = -2000 dn
T1 = 0.5 σb X1 b = 0.5 x 5.0 x 0.25 dn x 200 = 125 dn
T2 = 5.0 X2 b = 5.0 x (400 - 1.25 dn) x 200 = 400000 - 1250 dn
• Equilibrium requires that
C + T1 + T2 = 0 ∴ -2000 dn + 125 dn + 400000 - 1250 dn = 0
and solving gives dn = 128.0 mm
• Substituting gives: C = -256000 N; T1 = 16000 N; T2 = 240000 N; X1 = 32 mm;
X2 = 240 mm; and εb = -εo (D- dn)/dn = 0.00085 (< εt,p ∴ ok )
• The force C is located dn/3 = 42.67 mm below the top fibre.
The force T1 is located (dn + 2 X1/3) = 149.33 mm below the top fibre.
The force T2 is located (D - X2/2) = 280.0 mm below the top fibre.
• Taking moments about the top fibre gives
M = T1 (dn + 2 X1/3) + T2 (D - X2/2) + C dn/3
= 16000 x 149.3 +240000 x 280 - 256000 x 42.67 = 58.7 x 10⁶ Nmm
= 58.7 kNm
• The curvature is: κ = -εo/dn = 0.0004/128 = 3.125 x 10⁻⁶ (mm-1).
34
Table B.1
εεεεo x 10-6 dn (mm) εεεεb x 10-6 M (kNm) κκκκ x 10-6 (mm-1)
-186 181.9 223 42.7 1.023
-200 177.8 250 44.4 1.125
-250 163.3 363 49.5 1.531
-300 150.0 500 53.3 2.000
-400 128.0 850 58.7 3.125
-500 111.1 1300 62.2 4.500
-600 98.0 1850 64.8 6.125
-700 87.5 2500 66.7 8.000
-800 79.0 3250 68.2 10.13
-900 72.0 4101 69.3 12.50
-1000 64.9 5163 67.9 15.41
-1100 56.3 6714 61.3 19.53
-1170 46.6 8875 48.1 25.11
80
Mmax= 69.3 kNm
70
60
Moment
(kNm) 50
40
When εb = εt,p =0.004:
30 Mu = 69.2 kNm
dn = 238.4 mm
20 ku = 0.305 < 0.4
10
0
0 4 8 12 16 20 24
Curvature x 10-6 (mm-1)
Figure B.2 Moment versus curvature for non-prestressed, unreinforced section.

35
Example B.2 Prestressed, rectangular sections (effect of varying Ap)
Data: b = 200 mm; D = 400 mm; dp = 300 mm; cf ′ = 200 MPa; ctf ′ = 8 MPa.
Variables: Four cross-sections to be considered:
(i) Ap = 250 mm2 and Pe = 315 kN (Pe/Ap = 1260 MPa = 0.7 fpu);
(ii) Ap = 500 mm2 and Pe = 630 kN (Pe/Ap = 1260 MPa = 0.7 fpu);
(iii) Ap = 750 mm2 and Pe = 945 kN (Pe/Ap = 1260 MPa = 0.7 fpu); and
(iv) Ap = 1000 mm2 and Pe = 1260 kN (Pe/Ap = 1260 MPa = 0.7 fpu).
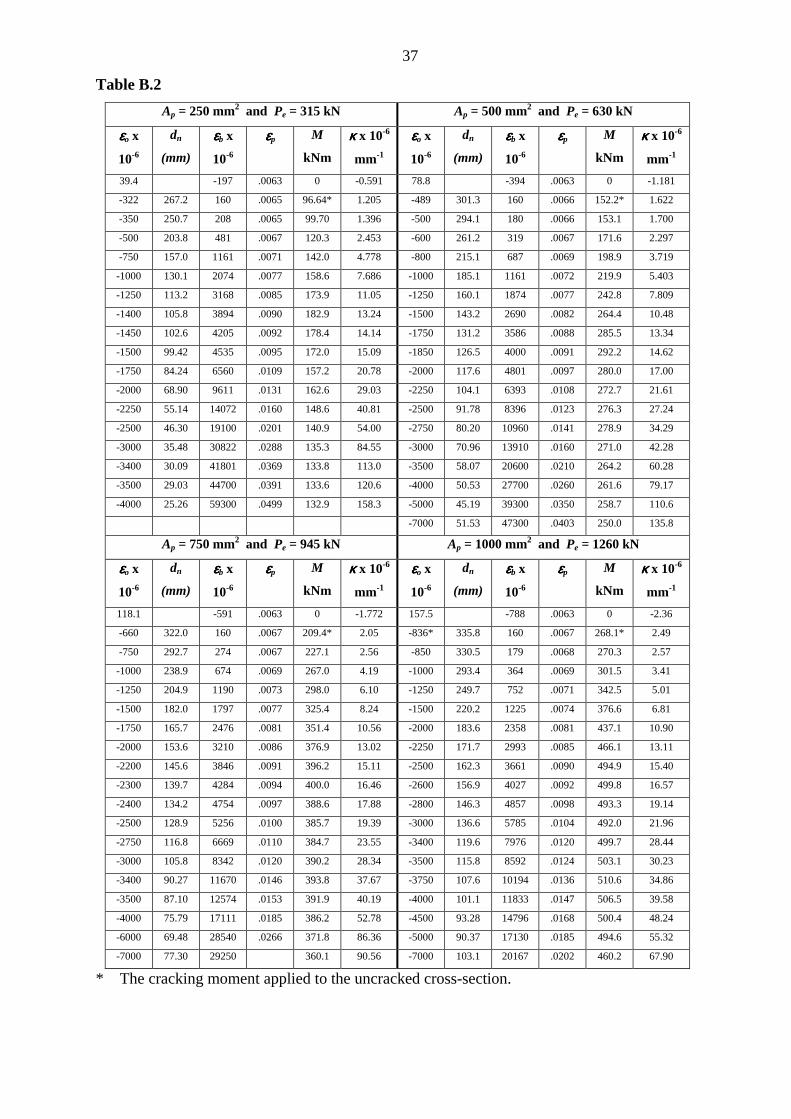
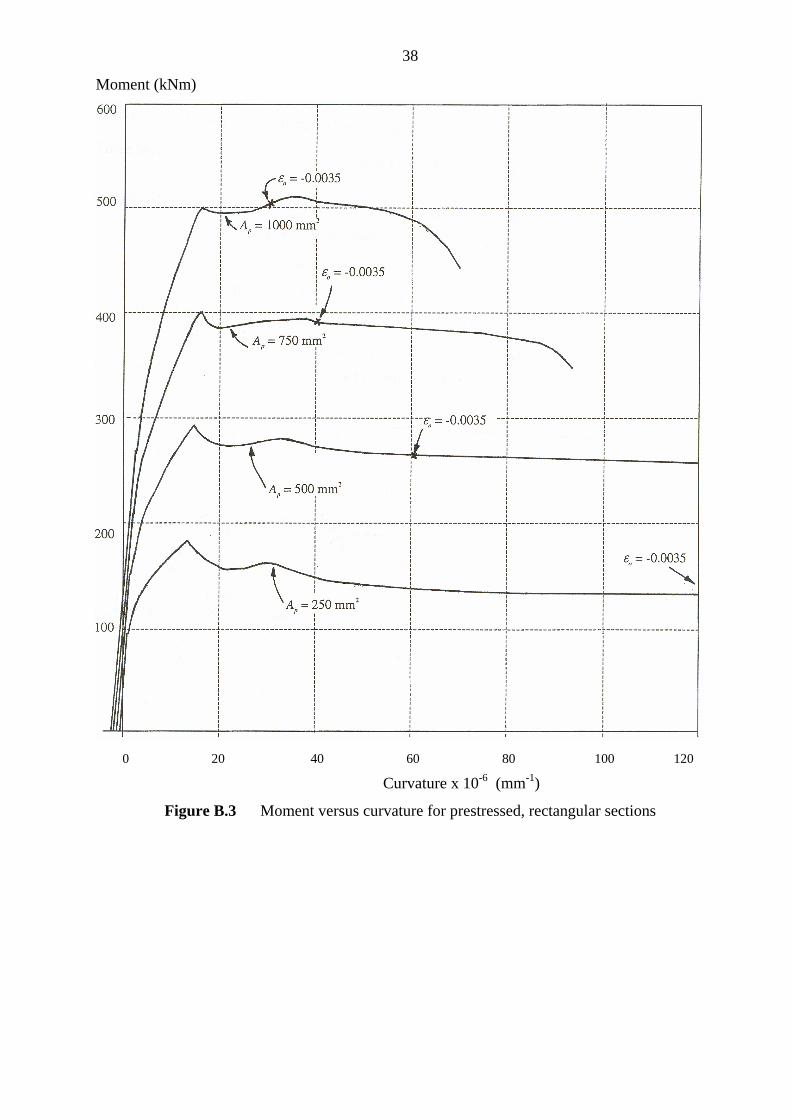
Comments: These four sections range from heavily prestressed (Section iv) to lightly
prestressed (Section i). The moment and curvature corresponding to various values of top fibre
strain are presented in Table B.2 and the moment curvature plots are shown in Figure B.3. Note
the decrease in ductility with increasing Ap . Also note that a reasonable estimate of Mu is
obtained by taking εo = -0.0035.
Sample Calculations:
Sample calculations are provided for the section where Ap = 500 mm2 and Pe = 630 kN (Section
ii) and when the extreme fibre compressive strain is εεεεo = -0.0035. (This is the top fibre strain
assumed at the ultimate limit state).
• Provided εb > εt,u (= 0.01 in this case), the stress distribution is as shown below. It is
assumed initially (and subsequently checked) that the prestressing steel is at yield (ie.
εp > 0.009). Note that 0.85cf ′ /Ec = 0.0034
b = 200mm εo = -.0035 0.85 f'c = 170 MPa
dn X1 dn C2 C1
X1 34X1 T1
300 0.004 X2 T2
400 X3 T3
0.01
σpu Tp
Ap εpt
Section Strain Stress
• From strain compatibility,
X1 = dn/35; X2 = 39 dn/35; and X3 = 60 dn/35.

36
• Calculating the volumes of the compressive and tensile stress blocks give
C1 = 0.85 cf ′ (dn/35) b = 170 x (dn/35) x 200 = -971.4 dn
C2 = 0.5 x 0.85 cf ′ (34dn/35) b = 0.5 x 170 x (34dn/35) x 200 = -16514.3 dn
T1 = 0.5 x 5.0 X1 b = 0.5 x 5.0 x (dn/35) x 200 = 14.3 dn
T2 = 5.0 X2 b = 5.0 x (39dn/35) x 200 = 1114.3 dn
T3 = 0.5 x 5.0 X3 b = 0.5 x 5.0 x (60dn/35) x 200 = 857.1 dn
Tp = Ap fpu = 500 x 1800 = 900 000 N
• Equilibrium requires that
C1 + C2 + T1 + T2 + T3 + Tp = 0
∴ (-971.4 -16514.3 + 14.3 + 1114.3 +857.1) dn + 900000 = 0
and solving gives dn = 58.07 mm
• Substituting gives: C1 = -56406 N; C2 = -958894; T1 = 830 N; T2 = 64701 N; T3 =
49769; Tp = 900000 N; X1 = 1.659 mm; X2 =64.70 mm; and X3 =99.539 mm.
Also εpt = .0035(300-58.07)/58.07 = 0.0146 and so εp >> εp = 0.009.
In addition, εb = .0035 (D- dn)/dn = 0.0206 >> 0.01
∴ The initial assumption are satisfied.
• Taking moments about the top fibre gives
M = T1 (dn + 2 X1/3) + T2 (dn + X1 + X2/2) + T3 (dn + X1 + X2 + X3/3)
Tp dp + C1 X1/2 + C2 (X1 + 34X1/3)
= 264.2 kNm
• The curvature is: κ = -εo/dn = 0.0035/58.07 = 60.28 x 10⁻⁶ (mm-1).
37
Table B.2
Ap = 250 mm2 and Pe = 315 kN Ap = 500 mm2 and Pe = 630 kN
εεεεo x
10-6
dn
(mm)
εεεεb x
10-6
εεεεp M
kNm
κκκκ x 10-6
mm-1
εεεεo x
10-6
dn
(mm)
εεεεb x
10-6
εεεεp M
kNm
κκκκ x 10-6
mm-1
39.4 -197 .0063 0 -0.591 78.8 -394 .0063 0 -1.181
-322 267.2 160 .0065 96.64* 1.205 -489 301.3 160 .0066 152.2* 1.622
-350 250.7 208 .0065 99.70 1.396 -500 294.1 180 .0066 153.1 1.700
-500 203.8 481 .0067 120.3 2.453 -600 261.2 319 .0067 171.6 2.297
-750 157.0 1161 .0071 142.0 4.778 -800 215.1 687 .0069 198.9 3.719
-1000 130.1 2074 .0077 158.6 7.686 -1000 185.1 1161 .0072 219.9 5.403
-1250 113.2 3168 .0085 173.9 11.05 -1250 160.1 1874 .0077 242.8 7.809
-1400 105.8 3894 .0090 182.9 13.24 -1500 143.2 2690 .0082 264.4 10.48
-1450 102.6 4205 .0092 178.4 14.14 -1750 131.2 3586 .0088 285.5 13.34
-1500 99.42 4535 .0095 172.0 15.09 -1850 126.5 4000 .0091 292.2 14.62
-1750 84.24 6560 .0109 157.2 20.78 -2000 117.6 4801 .0097 280.0 17.00
-2000 68.90 9611 .0131 162.6 29.03 -2250 104.1 6393 .0108 272.7 21.61
-2250 55.14 14072 .0160 148.6 40.81 -2500 91.78 8396 .0123 276.3 27.24
-2500 46.30 19100 .0201 140.9 54.00 -2750 80.20 10960 .0141 278.9 34.29
-3000 35.48 30822 .0288 135.3 84.55 -3000 70.96 13910 .0160 271.0 42.28
-3400 30.09 41801 .0369 133.8 113.0 -3500 58.07 20600 .0210 264.2 60.28
-3500 29.03 44700 .0391 133.6 120.6 -4000 50.53 27700 .0260 261.6 79.17
-4000 25.26 59300 .0499 132.9 158.3 -5000 45.19 39300 .0350 258.7 110.6
-7000 51.53 47300 .0403 250.0 135.8
Ap = 750 mm2 and Pe = 945 kN Ap = 1000 mm2 and Pe = 1260 kN
εεεεo x
10-6
dn
(mm)
εεεεb x
10-6
εεεεp M
kNm
κκκκ x 10-6
mm-1
εεεεo x
10-6
dn
(mm)
εεεεb x
10-6
εεεεp M
kNm
κκκκ x 10-6
mm-1
118.1 -591 .0063 0 -1.772 157.5 -788 .0063 0 -2.36
-660 322.0 160 .0067 209.4* 2.05 -836* 335.8 160 .0067 268.1* 2.49
-750 292.7 274 .0067 227.1 2.56 -850 330.5 179 .0068 270.3 2.57
-1000 238.9 674 .0069 267.0 4.19 -1000 293.4 364 .0069 301.5 3.41
-1250 204.9 1190 .0073 298.0 6.10 -1250 249.7 752 .0071 342.5 5.01
-1500 182.0 1797 .0077 325.4 8.24 -1500 220.2 1225 .0074 376.6 6.81
-1750 165.7 2476 .0081 351.4 10.56 -2000 183.6 2358 .0081 437.1 10.90
-2000 153.6 3210 .0086 376.9 13.02 -2250 171.7 2993 .0085 466.1 13.11
-2200 145.6 3846 .0091 396.2 15.11 -2500 162.3 3661 .0090 494.9 15.40
-2300 139.7 4284 .0094 400.0 16.46 -2600 156.9 4027 .0092 499.8 16.57
-2400 134.2 4754 .0097 388.6 17.88 -2800 146.3 4857 .0098 493.3 19.14
-2500 128.9 5256 .0100 385.7 19.39 -3000 136.6 5785 .0104 492.0 21.96
-2750 116.8 6669 .0110 384.7 23.55 -3400 119.6 7976 .0120 499.7 28.44
-3000 105.8 8342 .0120 390.2 28.34 -3500 115.8 8592 .0124 503.1 30.23
-3400 90.27 11670 .0146 393.8 37.67 -3750 107.6 10194 .0136 510.6 34.86
-3500 87.10 12574 .0153 391.9 40.19 -4000 101.1 11833 .0147 506.5 39.58
-4000 75.79 17111 .0185 386.2 52.78 -4500 93.28 14796 .0168 500.4 48.24
-6000 69.48 28540 .0266 371.8 86.36 -5000 90.37 17130 .0185 494.6 55.32
-7000 77.30 29250 360.1 90.56 -7000 103.1 20167 .0202 460.2 67.90
* The cracking moment applied to the uncracked cross-section.
38
Moment (kNm)
600
εo = -0.0035
500
Ap = 1000 mm2
εo = -0.0035
400
Ap = 750 mm2
300 εo = -0.0035
Ap = 500 mm2
200
εo = -0.0035
Ap = 250 mm2
100
0 20 40 60 80 100 120
Curvature x 10-6 (mm-1)
Figure B.3 Moment versus curvature for prestressed, rectangular sections
39
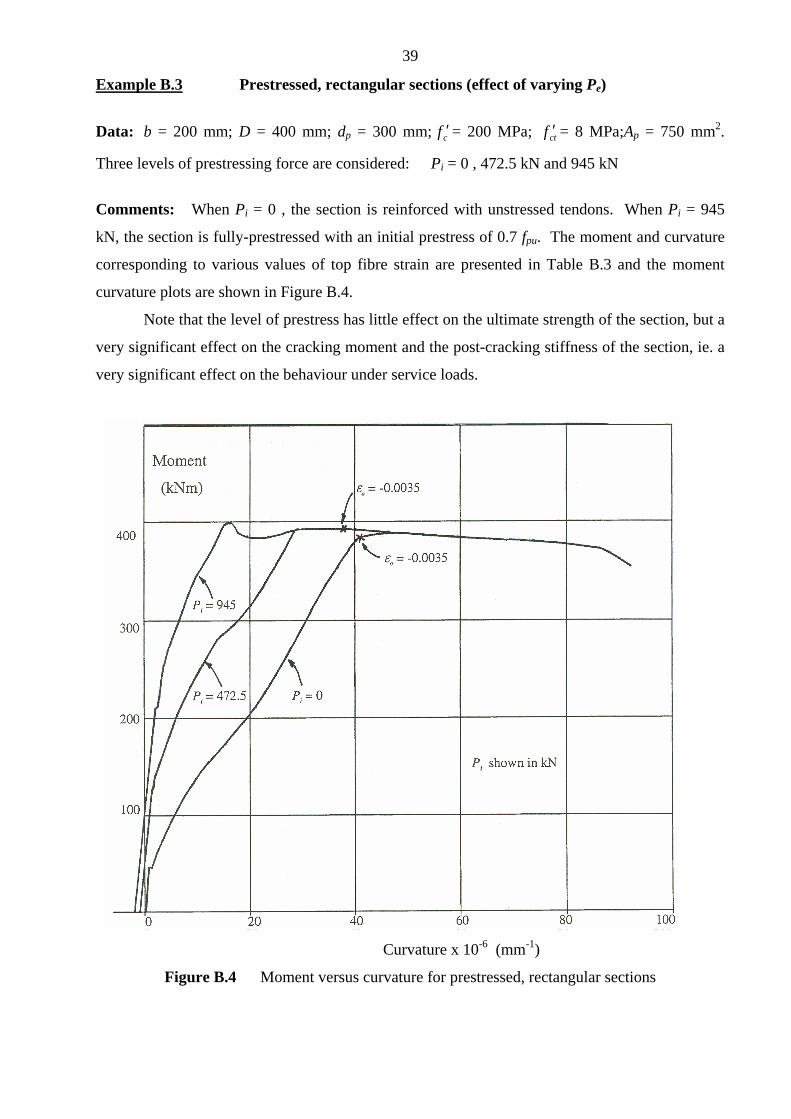
Example B.3 Prestressed, rectangular sections (effect of varying Pe)
Data: b = 200 mm; D = 400 mm; dp = 300 mm; cf ′ = 200 MPa; ctf ′ = 8 MPa;Ap = 750 mm2.
Three levels of prestressing force are considered: Pi = 0 , 472.5 kN and 945 kN
Comments: When Pi = 0 , the section is reinforced with unstressed tendons. When Pi = 945
kN, the section is fully-prestressed with an initial prestress of 0.7 fpu. The moment and curvature
corresponding to various values of top fibre strain are presented in Table B.3 and the moment
curvature plots are shown in Figure B.4.
Note that the level of prestress has little effect on the ultimate strength of the section, but a
very significant effect on the cracking moment and the post-cracking stiffness of the section, ie. a
very significant effect on the behaviour under service loads.
Moment
(kNm) εo = -0.0035
400
εo = -0.0035
Pi = 945
300
Pi = 472.5 Pi = 0
200
PI shown in kN
100
0 20 40 60 80 100
Curvature x 10-6 (mm-1)
Figure B.4 Moment versus curvature for prestressed, rectangular sections

40
Table B.3
Ap = 750 mm2 and Pi = 0 kN Ap = 750 mm2 and Pi = 472.5 kN
εεεεo x
10-6
dn
(mm)
εεεεb x
10-6
εεεεp M
kNm
κκκκ x 10-6
mm-1
εεεεo x
10-6
dn
(mm)
εεεεb x
10-6
εεεεp M
kNm
κκκκ x 10-6
mm-1
-166 203.6 160 .00008 44.63* 0.815 59 -295 .00315 0 -0.886
-200 186.0 230 .00012 46.62 1.076 -413 288.3 160 127.0* 1.433
-500 136.8 969 .0006 80.36 3.670 -500 254.7 285 .00345 141.7 1.963
-1000 109.4 2658 .0017 131.9 9.145 -1000 168.7 1372 .00414 203.0 5.93
-1500 99.69 4519 .0030 172.9 15.05 -1500 137.2 2874 .00514 254.1 10.94
-2000 93.82 6527 .0044 211.5 21.30 -1750 128.3 3705 .00570 279.7 13.64
-2500 89.77 8639 .0059 271.5 27.85 -2000 121.7 4575 .0063 293.1 16.44
-2800 87.94 9937 .0067 312.0 31.84 -2500 111.9 6441 .0076 331.2 22.35
-3500 85.28 12916 .0088 384.0 41.04 -3000 105.0 8428 .0089 387.9 28.57
-3750 80.68 14843 .0102 388.5 46.48 -3400 90.27 11667 .0112 393.8 37.67
-4000 75.79 17111 .0118 386.2 52.78 -3500 87.10 12574 .0119 391.8 40.19
-5000 67.78 24506 .0171 379.5 73.77 -4000 75.79 17111 .0152 386.1 52.78
-6000 69.48 28543 .0199 371.8 86.36 -5000 67.78 24506 .0205 379.5 73.77
-7000 77.30 29223 .0201 360.1 90.56 -6000 69.48 28543 .0233 371.8 86.36
Ap = 750 mm2 and Pi = 945 kN
εεεεo x
10-6
dn
(mm)
εεεεb x
10-6
εεεεp M
kNm
κκκκ x 10-6
mm-1
118.1 -591 .0063 0 -1.772
-660 322.0 160 .0067 209.4* 2.05
-750 292.7 274 .0067 227.1 2.56
-1000 238.9 674 .0069 267.0 4.19
-1250 204.9 1190 .0073 298.0 6.10
-1500 182.0 1797 .0077 325.4 8.24
-1750 165.7 2476 .0081 351.4 10.56
-2000 153.6 3210 .0086 376.9 13.02
-2200 145.6 3846 .0091 396.2 15.11
-2300 139.7 4284 .0094 400.0 16.46
-2400 134.2 4754 .0097 388.6 17.88
-2500 128.9 5256 .0100 385.7 19.39
-2750 116.8 6669 .0110 384.7 23.55
-3000 105.8 8342 .0120 390.2 28.34
-3400 90.27 11670 .0146 393.8 37.67
-3500 87.10 12574 .0153 391.9 40.19
-4000 75.79 17111 .0185 386.2 52.78
-6000 69.48 28540 .0266 371.8 86.36
-7000 77.30 29250 360.1 90.56
* The cracking moment applied to the uncracked cross-section.
41
APPENDIX C - DESIGN CALCULATIONS
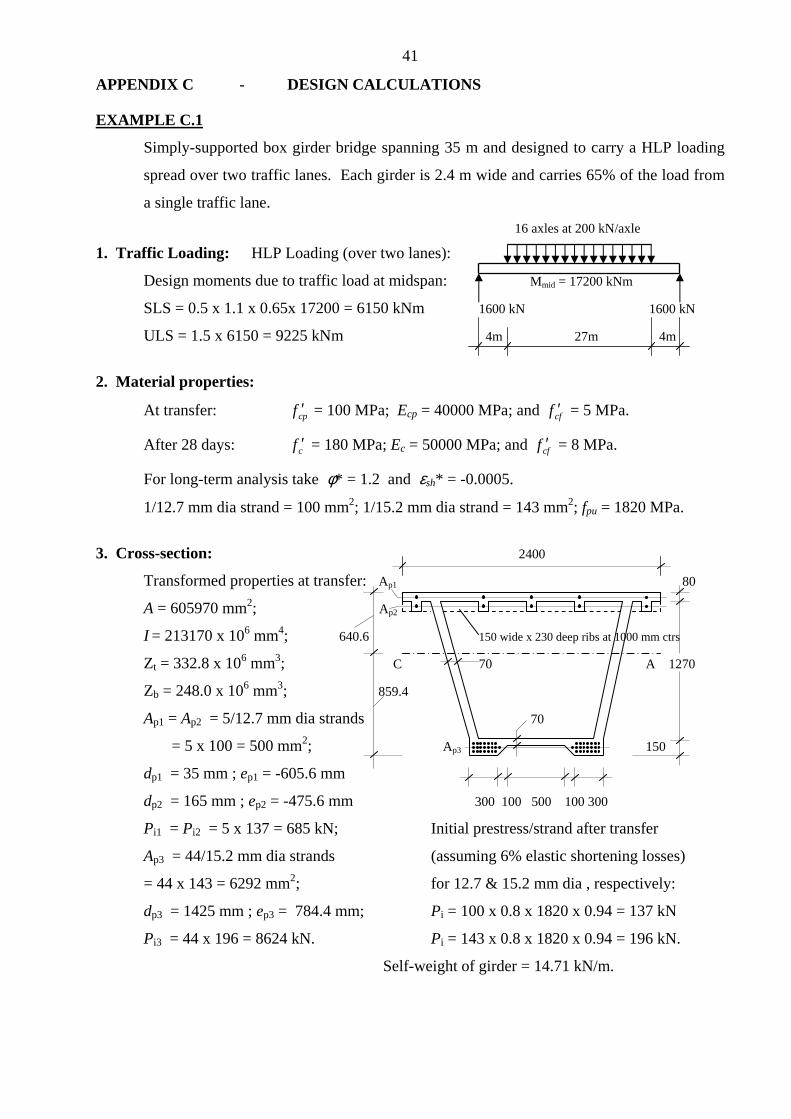
EXAMPLE C.1
Simply-supported box girder bridge spanning 35 m and designed to carry a HLP loading
spread over two traffic lanes. Each girder is 2.4 m wide and carries 65% of the load from
a single traffic lane.
16 axles at 200 kN/axle
1. Traffic Loading: HLP Loading (over two lanes):
Design moments due to traffic load at midspan: Mmid = 17200 kNm
SLS = 0.5 x 1.1 x 0.65x 17200 = 6150 kNm 1600 kN 1600 kN
ULS = 1.5 x 6150 = 9225 kNm 4m 27m 4m
2. Material properties:
At transfer: cpf ′ = 100 MPa; Ecp = 40000 MPa; and cff ′ = 5 MPa.
After 28 days: cf ′ = 180 MPa; Ec = 50000 MPa; and cff ′ = 8 MPa.
For long-term analysis take φ* = 1.2 and εsh* = -0.0005.
1/12.7 mm dia strand = 100 mm2; 1/15.2 mm dia strand = 143 mm2; fpu = 1820 MPa.
3. Cross-section: 2400
Transformed properties at transfer: Ap1 80
A = 605970 mm2; Ap2
I = 213170 x 106 mm4; 640.6 150 wide x 230 deep ribs at 1000 mm ctrs
Zt = 332.8 x 106 mm3; C 70 A 1270
Zb = 248.0 x 106 mm3; 859.4
Ap1 = Ap2 = 5/12.7 mm dia strands 70
= 5 x 100 = 500 mm2; Ap3 150
dp1 = 35 mm ; ep1 = -605.6 mm
dp2 = 165 mm ; ep2 = -475.6 mm 300 100 500 100 300
Pi1 = Pi2 = 5 x 137 = 685 kN; Initial prestress/strand after transfer
Ap3 = 44/15.2 mm dia strands (assuming 6% elastic shortening losses)
= 44 x 143 = 6292 mm2; for 12.7 & 15.2 mm dia , respectively:
dp3 = 1425 mm ; ep3 = 784.4 mm; Pi = 100 x 0.8 x 1820 x 0.94 = 137 kN
Pi3 = 44 x 196 = 8624 kN. Pi = 143 x 0.8 x 1820 x 0.94 = 196 kN.
Self-weight of girder = 14.71 kN/m.
42
4. Extreme fibre stresses at transfer:
Pi1 =Pi2 = 685 kN; ep1 = -605.6 mm; ep2 = -475.6 mm; Pi3 = 8624 kN; ep3 = 784.4 mm.
At support:
6
33
108.332
10)4.7848624)6.4756.605(685(
6059700
10)8624685685(
×××+−−+×++−=topσ
61.110.1849.16 +=+−= MPa
6
33
100.248
10)4.7848624)6.4756.605(685(
605970
10)8624685685(
×××+−−−×++−=botσ
78.4029.2449.16 −=−−= MPa
At midspan:
Moment due to self-weight = 14.71 x 352/8 = 2252 kNm
16.5108.332
10225241.4
6
6
−=××−+=topσ MPa
70.31100.248
10225278.40
6
6
−=××+−=botσ MPa.
Note that the maximum compressive stress at transfer is less than 0.6cpf ′ = 60 MPa and the
maximum tensile stress is less than 5 MPa.
5. Deflection at transfer:
The curvature at the supports (κs) and at midspan (κm) immediately after transfer are
610707.0150040000
)78.4061.1()( −×−=×
+−=−−
=DEc
bottops
σσκ mm-1
610442.0150040000
)70.3116.5()( −×−=×+−−=
−−=
DEc
bottopm
σσκ mm-1
and the deflection at midspan is
4.74)707.0442.010707.0(96
350002
−=−−×+−=∆ mm )( ↑
6. Long-term analysis under sustained loads:
• The sustained load is taken to be self-weight + 3.0 kN/m = 17.71 kN/m.
• The moment at midspan due to sustained load is Msus= 17.71 x 352/8= 2712 kNm.
• The age-adjusted effective modulus method is used to determine time-dependent
behaviour. Taking Ec = 40000 MPa (as most of the sustained load is applied at
transfer, ie. prestress and self-weight), φ* = 1.2, χ = 0.8, εsh* = -0.0005 and 2.5%

43
relaxation in the strand, the instantaneous and final stresses and strains at the sections
at midspan and at the supports are shown below.
σp1i = 1335
-164 -889 -6.54 -7.14 σp1* = 1154
σp2i = 1324
time ∞ σp2* = 1139
t = 0
σp3i = 1227
σp3* = 996
-746 -1746 -21.77 -29.84
Section Strain x 10-6 Stress (MPa)
At t = 0: κi = -0.388 x 10⁻⁶ mm-1
At time ∞: κ = -0.571 x 10⁻⁶ mm-1
Section at midspan
σp1i = 1373
+40 -459 +1.61 +0.64 σp1* = 1235
σp2i = 1355
time ∞ σp2* = 1204
t = 0
σp3i = 1177
σp3* = 901
-1019 -2268 -31.09 -40.78
Section Strain x 10-6 Stress (MPa)
At t = 0: κi = -0.706 x 10⁻⁶ mm-1
At time ∞: κ = -1.206 x 10⁻⁶ mm-1
Section at support
7. Final deflection under sustained loads:
The final deflection at midspan under the sustained load after creep and shrinkage is
7.103)21.1571.01021.1(96
350002
−=−−×+−=∆ mm )( ↑
Note: From a time analysis, the final curvature at the support is –1.21 x 10⁻⁶ mm-1.
As calculated at step5, the deflection at midspan immediately after transfer is 74.4
mm )(↑ . This upward deflection decreases when the additional superimposed dead load is
44
applied and then gradually increases with time to a final value of 103.7 mm )(↑ . Any
traffic load will reduce this upward camber.
8. Losses of prestress at midspan:
From the results of the time analysis presented in Step 6:
Prior to transfer: σp1 = σp2 = σp3 = 1371 MPa.
After transfer: σp1 = 1335 MPa (2.6% immediate losses)
σp2 = 1324 MPa. (3.4% immediate losses)
σp3 = 1227 MPa. (10.5% immediate losses)
After time-dependent losses: σp1 = 1154 MPa (15.8% total losses) and
σp2 = 1139 MPa (16.9% total losses)
σp3 = 996 MPa (27.4% total losses).
9. Stresses (after all losses) and deflection due full traffic load:
Midspan moment due to HLP loading (serviceability limit state) is M = 6150 kNm.
Extreme fibre stresses at midspan:
62.25108.332
10615014.7
6
6
−=××−−=topσ MPa
03.3100.248
10615077.21
6
6
+=××+−=botσ MPa < cff ′ (= 8 MPa).
Cracking is not likely under full service loads.
The curvature at midspan caused by the HLP loading is therefore
66
6
10577.01021317050000
106150 −×=××
×==IE
M
c
κ mm-1
and the corresponding instantaneous deflection is
6.7310577.06.9
35000 62
=××=∆ − mm )(↓ = Span/475.
The nett midspan deflection under the full in-service HLP loading after all losses is
upward and equal to -103.7 + 73.6 = -30.1 mm )(↑ .
10. Flexural strength (ultimate limit state):
For D = 1500 mm, εt,p = 0.0015 and εt,u = 0.007. By equating the compressive and
tensile forces of the cross-section at ultimate, the value of dn is found to be 62.97 mm.

45
top flange
0.0035 0.85f’c = 153 MPa
7.92 C1
b = 2400 mm dn=62.97 55.05 C2
80 Ap1 εpt1 Tp1
0.0001 T1
0.0015 1.799 26.99 T2
5 MPa T3
b = 5x80+2x70=540 mm 98.95
Ap2 0.007 Tp2
Ap3 εpt2 Tp3
For horizontal equilibrium, the value of dn is 62.97 mm and therefore
C1 = 7.92 x 153 x 2400 x 10-3 = 2907 kN
C2 = 0.5 x 55.05 x 153 x 2400 x 10-3 = 10107 kN
ΣC = 13014 kN
T1 = 0.5 x 5.0 x 1.799 x 2400 x 10-3 = 11 kN
T2 = 5.0 x 15.23 x 2400 x 10-3 +5.0 x 9.95 x 540 x 10-3 = 210 kN
T3 = 0.5 x 5.0 x 98.95 x 540 x 10-3 = 134 kN
εpt1 = -0.0035 x (62.97-35)/62.97 = -0.001555; εce1 = -7.48/50000 = -0.000150;
εpe1 = σpe1/Ep = 1154/2x105 = 0.005770
∴εp1 = .005770 - .001555 + .000150 = 0.004365 and σp1= εp1 Ep = 873 MPa.
εpt2 >> εpy (= 0.009) and hence σp2 = fpy = 1800 MPa. Therefore,
Tp1 = 500 x 870 x 10-3 = 437 kN
Tp2 = 500 x 1800 x 10-3 = 900 kN
Tp2 = 6292 x 1800 x 10-3 = 11326 kN
ΣT = 13018 kN ≈ ΣC ∴ ok
Taking moments of these internal forces about the top fibre gives the ultimate strength of
the section:
Mu = [11326 x 1425 + 900 x 165 + 437 x 35 + 11 x 64.17 + 210 x 74.0
+ 134 x 122.9 - 2907 x 3.96 - 10107 x 26.27] x 10-3
= 16050 kNm
46
and the design ultimate moment is φ Mu = 0.8 x 16050 = 12840 kNm.
The design moment for the strength limit state is
M* = 1.25 x 2712 + 9225 = 12615 kNm < φ Mu
Therefore, the section has adequate flexural strength and since dn << 0.4d the section is
ductile. In this case, the resultant of the tensile forces located in the tension zone (ie. the
resultant of T1 ,T2, T3, Tp2 and Tp3) is located at d = 1295 mm below the top fibre.
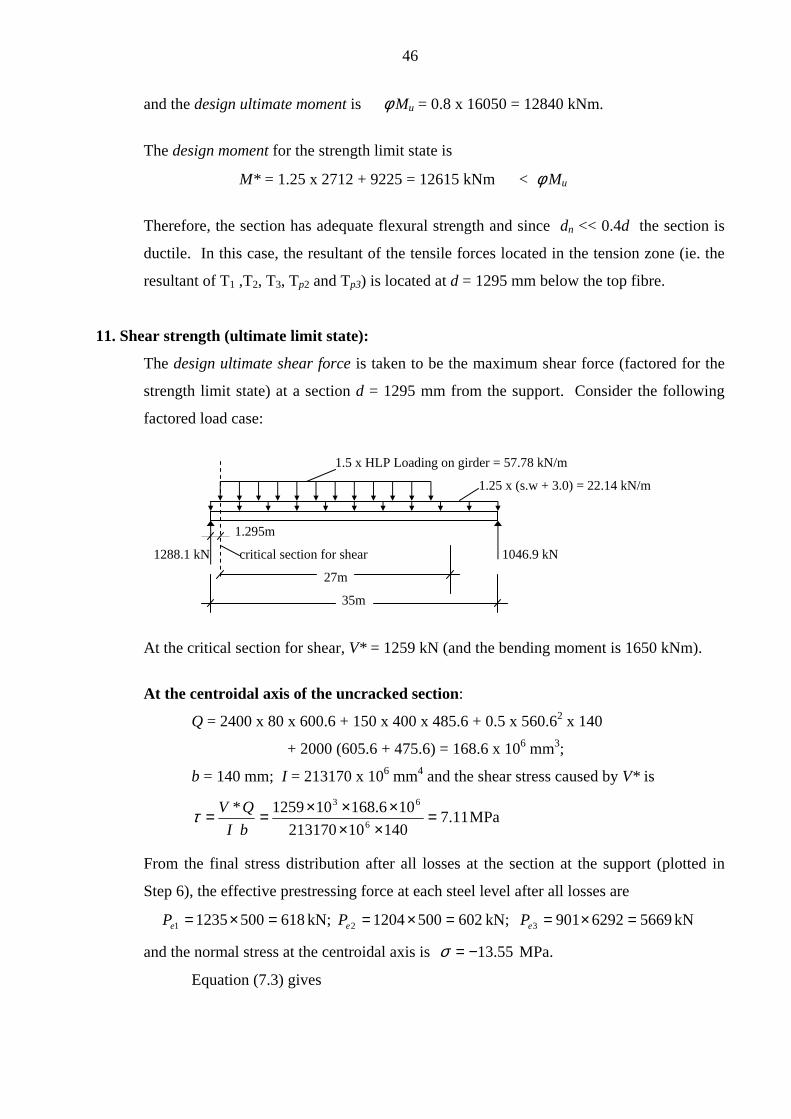
11. Shear strength (ultimate limit state):
The design ultimate shear force is taken to be the maximum shear force (factored for the
strength limit state) at a section d = 1295 mm from the support. Consider the following
factored load case:
1.5 x HLP Loading on girder = 57.78 kN/m
1.25 x (s.w + 3.0) = 22.14 kN/m
1.295m
1288.1 kN critical section for shear 1046.9 kN
27m
35m
At the critical section for shear, V* = 1259 kN (and the bending moment is 1650 kNm).
At the centroidal axis of the uncracked section:
Q = 2400 x 80 x 600.6 + 150 x 400 x 485.6 + 0.5 x 560.62 x 140
+ 2000 (605.6 + 475.6) = 168.6 x 106 mm3;
b = 140 mm; I = 213170 x 106 mm4 and the shear stress caused by V* is
11.714010213170
106.168101259*6
63
=××
×××==bI
QVτ MPa
From the final stress distribution after all losses at the section at the support (plotted in
Step 6), the effective prestressing force at each steel level after all losses are
61850012351 =×=eP kN; 60250012042 =×=eP kN; 566962929013 =×=eP kN
and the normal stress at the centroidal axis is 55.13−=σ MPa.
Equation (7.3) gives
47
05.311.7)2
55.13(
2
55.13 221 +=+−+−=σ MPa < 5.0+0.13 cf ′ (= 6.74 MPa)
In the web just below the top flange:
Q = 2400 x 80 x 600.6 + 2000 x 605.6 = 116.5 x 106 mm3
and the shear stress caused by V* is
92.414010213170
105.1161012596
63
=××
×××=τ MPa.
The normal stress is obtained from the final stress distribution after all losses at the
support (plotted in Step 6) and is equal to
05.1−=σ MPa.
From Equation (7.3),
42.492.4)2
05.1(
2
05.1 221 +=+−+−=σ MPa < 5.0+0.13 cf ′ (= 6.74 MPa).
Hence, the girder satisfies the shear strength design requirements.
12. Design of Deck:
Loads: Dead load: 50mm bitumen seal = 1.0 kPa
Self-weight: 80mm slab = 2.0 kPa
150 x 80mm rib = 0.30 kN/m
150 x 140mm rib = 0.53 kN/m
Wheel load: W7 (on 500mmx200mm area) = 70.0 kN
Dynamic allowance (25%) = 17.5 kN
Total wheel load = 87.5 kN
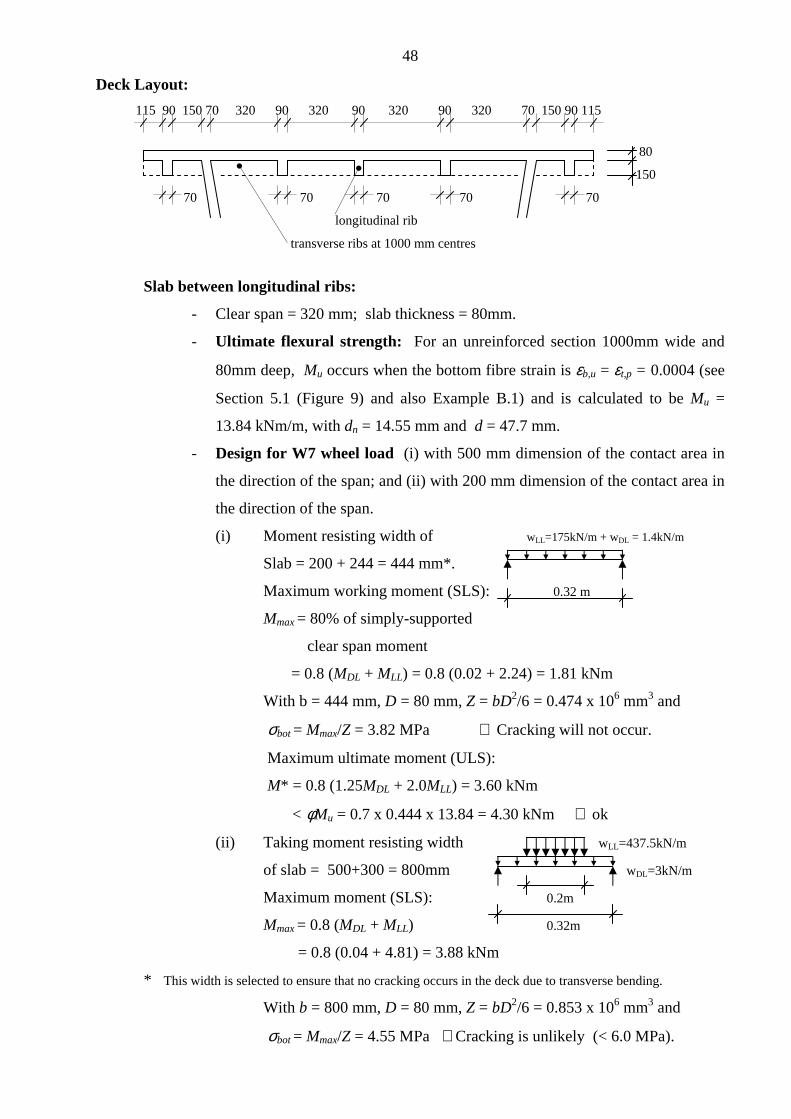
48
Deck Layout:
115 90 150 70 320 90 320 90 320 90 320 70 150 90 115
80
150
70 70 70 70 70
longitudinal rib
transverse ribs at 1000 mm centres
Slab between longitudinal ribs:
- Clear span = 320 mm; slab thickness = 80mm.
- Ultimate flexural strength: For an unreinforced section 1000mm wide and
80mm deep, Mu occurs when the bottom fibre strain is εb,u = εt,p = 0.0004 (see
Section 5.1 (Figure 9) and also Example B.1) and is calculated to be Mu =
13.84 kNm/m, with dn = 14.55 mm and d = 47.7 mm.
- Design for W7 wheel load (i) with 500 mm dimension of the contact area in
the direction of the span; and (ii) with 200 mm dimension of the contact area in
the direction of the span.
(i) Moment resisting width of wLL=175kN/m + wDL = 1.4kN/m
Slab = 200 + 244 = 444 mm*.
Maximum working moment (SLS): 0.32 m
Mmax = 80% of simply-supported
clear span moment
= 0.8 (MDL + MLL) = 0.8 (0.02 + 2.24) = 1.81 kNm
With b = 444 mm, D = 80 mm, Z = bD2/6 = 0.474 x 106 mm3 and
σbot = Mmax/Z = 3.82 MPa ∴ Cracking will not occur.
Maximum ultimate moment (ULS):
M* = 0.8 (1.25MDL + 2.0MLL) = 3.60 kNm
< φMu = 0.7 x 0.444 x 13.84 = 4.30 kNm ∴ ok
(ii) Taking moment resisting width wLL=437.5kN/m
of slab = 500+300 = 800mm wDL=3kN/m
Maximum moment (SLS): 0.2m
Mmax = 0.8 (MDL + MLL) 0.32m
= 0.8 (0.04 + 4.81) = 3.88 kNm
* This width is selected to ensure that no cracking occurs in the deck due to transverse bending.
With b = 800 mm, D = 80 mm, Z = bD2/6 = 0.853 x 106 mm3 and
σbot = Mmax/Z = 4.55 MPa ∴Cracking is unlikely (< 6.0 MPa).

49
Maximum ultimate moment (ULS):
M* = 0.8 (1.25MDL + 2.0MLL) = 7.74 kNm
< φMu = 0.7 x (0.8 x 13.84) = 7.75 kNm ∴ ok
- Check beam shear at d = 47.7mm from support. From (ii) with wheel load
located 47.7mm from support: V* = 95.0 kN; b = 800 mm; d = 47.7 mm and
hence
23.2800)12/80800(
2/408001095*3
23
max1 =××
×××===bI
QVτσ MPa < (5.0+0.13√ cf ′ )
- Check punching shear under wheel load:
V* = 2.0 x 87.5 = 175.0 kN; d = 47.7 mm and u = 2(500+200+2x47.7) = 1591
mm. From Eqn 6.8 and taking σcp= 0, φVuo = 265.6 kN > V* ∴ ok.
Longitudinal pretensioned ribs:
- Span = 1000 mm; wDL = 1.53 kN/m. 160 90 160
- The load from one W7 wheel is 35 z 80
- assumed to be carried by 1.5 ribs. 130 150
- Max. +ve moment occurs with one
W7 wheel load at midspan (200mm 70
contact in direction of span) and A = 44800 mm2; z = 69.97 mm;
= 70% of simply-supported moment. I = 149.8 x 106 mm4
- Max. –ve moment with a W7 wheel load in each of the adjacent spans
= -65% of the simply-supported midspan moment.
- + ve Mmax = 0.7 (MDL + MLL) wLL=291.7kN/m
= 0.7 ( 0.19 + 13.13)
= 9.32 kNm. 0.2m
σbot = Mmax y/ I = +9.95 MPa 1.0m
The minimum residual compression due to prestress after all losses at the
bottom fibre of the rib (from the stress distribution at the support in Step
6) is –4.23 MPa. Therefore, the maximum tensile stress in the bottom
fibre of the rib is –4.23 + 9.95 = 5.72 MPa < 6.0 MPa. ∴ ok.
- - ve Mmax = - 0.65 (MDL + MLL) = - 8.65 kNm.
σtop = Mmax y/ I = +4.04 MPa. The maximum tension in the top fibre occurs at
the support (see stress distribution in Step 6) and equals +1.61 MPa.
Therefore, the maximum tensile stress in the top fibre is +1.61 + 4.04 = 5.65
MPa < 6.0 MPa. ∴ ok.

50
- At the ULS, the design +ve moment M* = 0.7 (1.25MDL + 2.0MLL) = 18.50
kNm. The ultimate moments for this pretensioned rib in +ve and –ve
bending are calculated in accordance with Section 5 and are found to be
(Mu)+ve = 34.6 kNm and (Mu)-ve = 36.4 kNm. The rib easily satisfies the
requirements for flexural strength.
Transverse post-tensioned ribs:
- Span = 1.62m; 425 150 425
- wDL = 3.01 kN/m (includes 110 z
longitudinal ribs). 1/29mm stressbar (unbonded) 230
- The load from one W7 wheel
is carried by one rib. 130
- Max. +ve moment occurs with A = 101000 mm2; z = 63.91 mm;
one W7 wheel load at midspan I = 302.0 x 106 mm4
(500mm contact dimension in dirn of span) and equals 70% of the simply-
supported midspan moment).
- After all losses, the prestressing force in the unbonded bar is Pe = 430 kN
at dp = 110 mm (ep = 46.09 mm) and the extreme fibre stresses due to Pe are
σtop = -(Pe/A) + (Peep/Zt) = -0.07 MPa and σbot = -(Pe/A) - (Peep/Zt) = -15.16
MPa.
- Serviceability Limit States:
+ ve Mmax = 0.8 (MDL + MLL) = 0.8 (0.99 + 29.97) = 24.77 kNm and the
resulting bottom fibre stress is
54.1100.302
09.1661077.2416.15
6
6
−=×
××+−=botσ MPa.
- ve Mmax = 0.7 (MDL + MLL) = 21.67 kNm and the resulting top fibre stress
is 52.4100.302
91.631067.2107.0
6
6
+=×
××+−=topσ MPa < 6.0 MPa. ∴ ok.
The transverse rib will not crack under service loads.
- Ultimate Limit States:
+ ve M* = 0.75 (1.25MDL + 2.0MLL) = 45.88 kNm. The ultimate strength of this
post-tensioned (but unreinforced) section in positive bending is Mu = 66.0
kNm and hence φMu = 0.7 x 66.0 = 46.20 kNm > M* ∴ ok.
- ve M* = 0.75 (1.25MDL + 2.0MLL) = 45.88 kNm. The ultimate strength of this
post-tensioned (but unreinforced) section in negative bending is Mu = 106.0
kNm and hence φMu = 74.2 kNm > M* ∴ ok.

51
- Check dry joint between girders:
Span = 0.78m. Maximum +ve moment at joint occurs when one W7 wheel
load is applied at midspan directly over dry joint.
+ ve Mmax = 0.8 (MDL + MLL) = 0.8 (0.23 + 11.59) = 9.46 kNm and the resulting
top and bottom fibre concrete stresses are
95.9100.302
09.1661046.916.15
6
6
−=×××+−=botσ MPa
07.2100.302
91.631046.907.0
6
6
−=×××+−=topσ MPa
Therefore, no tension will exist across the dry joint under service loads.
13. Design of anchorage zone:
The stress resultant forces away from the anchorage zone (assuming prestressing forces at
transfer of 1370 kN in top strands at dp = 100mm and 8624 kN in bottom strands at dp =
100mm)) are as follows:
80 +1.61 -0.65 T1
150 -4.89 C1
373.3 C2
-15.44
373.3 C3
-25.99
373.3 C3
70 -36.54 C5
-38.52 C6
80 -40.78
Section Stresses (MPa) Forces
T1 = 92.2 kN at dT1 = 8.6mm; C1 = 224.4 kN at dC1 = 174.1mm; C2 = 531.3 kN at dC2 =
449.0mm; C3 = 1082.7 kN at dC3 = 805.8mm; C4 = 1634.1 kN at dC4 = 1173.8mm; C5 =
3415.2 kN at dC5 = 1385.3mm; C6 = 2220.4 kN at dC6 = 1460.4mm.
Additional compressive forces representing the loss of prestress (due to elastic
shortening) are located at the level of the top and bottom steel and are calculated as (n-1)σ
Ap, where n is the modular ratio (= Ep/Ec = 5) and σ is the stress in the concrete at the
steel level. These forces are CP1 = 4.9 kN and CP2 = 973.0 kN.
The strut and tie model shown below is based on stress contours obtained from an
elastic finite element model of the anchorage zone and illustrates the flow of forces on an
elevation of the beam.
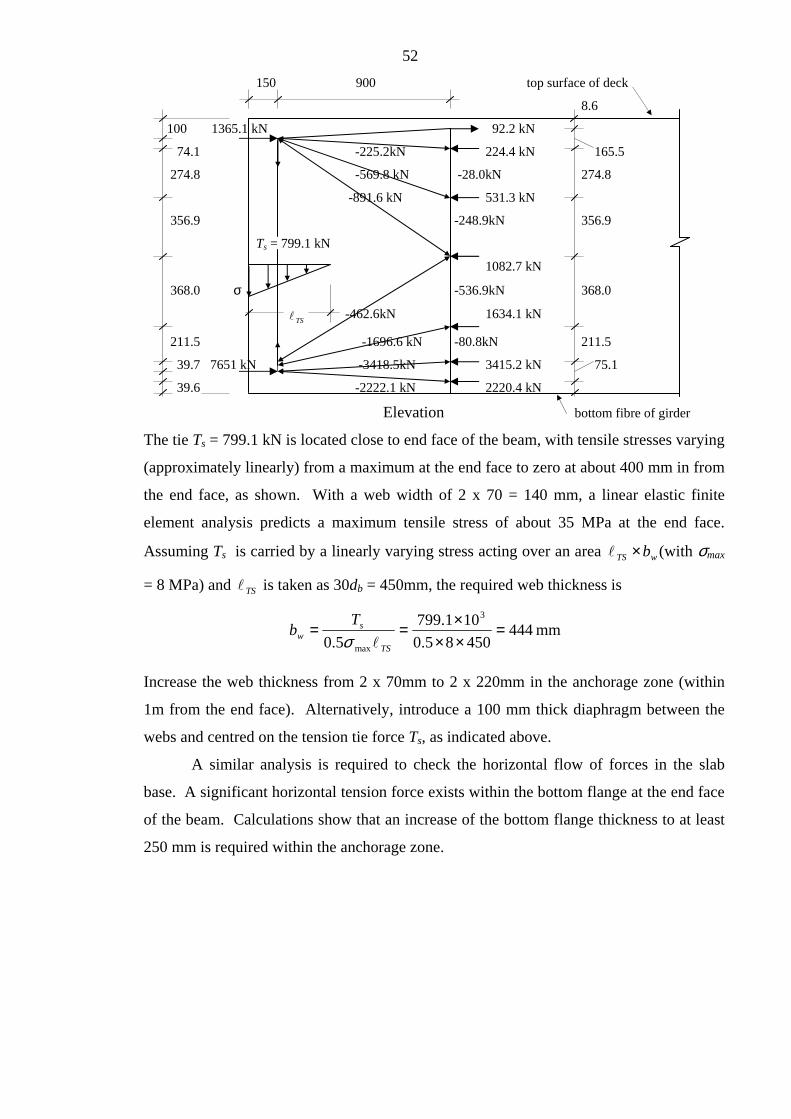
52
150 900 top surface of deck
8.6
100 1365.1 kN 92.2 kN
74.1 -225.2kN 224.4 kN 165.5
274.8 -569.8 kN -28.0kN 274.8
-891.6 kN 531.3 kN
356.9 -248.9kN 356.9
Ts = 799.1 kN
1082.7 kN
368.0 σ -536.9kN 368.0
TSl -462.6kN 1634.1 kN
211.5 -1696.6 kN -80.8kN 211.5
39.7 7651 kN -3418.5kN 3415.2 kN 75.1
39.6 -2222.1 kN 2220.4 kN
Elevation bottom fibre of girder
The tie Ts = 799.1 kN is located close to end face of the beam, with tensile stresses varying
(approximately linearly) from a maximum at the end face to zero at about 400 mm in from
the end face, as shown. With a web width of 2 x 70 = 140 mm, a linear elastic finite
element analysis predicts a maximum tensile stress of about 35 MPa at the end face.
Assuming Ts is carried by a linearly varying stress acting over an area wTS b×l (with σmax
= 8 MPa) and TSl is taken as 30db = 450mm, the required web thickness is
44445085.0
101.799
5.0
3
max
=×××==
TS
sw
Tb
lσmm
Increase the web thickness from 2 x 70mm to 2 x 220mm in the anchorage zone (within
1m from the end face). Alternatively, introduce a 100 mm thick diaphragm between the
webs and centred on the tension tie force Ts, as indicated above.
A similar analysis is required to check the horizontal flow of forces in the slab
base. A significant horizontal tension force exists within the bottom flange at the end face
of the beam. Calculations show that an increase of the bottom flange thickness to at least
250 mm is required within the anchorage zone.