expression of adipor1 and adipor2 receptors as...
TRANSCRIPT

Research ArticleExpression of AdipoR1 and AdipoR2 Receptors as Leptin-BreastCancer Regulation Mechanisms
Martha Daniela Mociño-Rodríguez,1 Jonnathan Guadalupe Santillán-Benítez,1
David Salomón Dozal-Domínguez,2 María Dolores Hernández-Navarro,1
Miriam Veronica Flores-Merino,3 Antonio Sandoval-Cabrera,2 andFrancisco Javier García Vázquez4
1Faculty of Chemistry, Autonomous University of the State of Mexico (UAEMex), Toluca, MEX, Mexico2Specialized Hemato-Oncological Laboratory of the Children’s Hospital, IMIEM, Toluca, MEX, Mexico3Molecular Biology Laboratory, Medical Research Center (CICMED), Toluca, MEX, Mexico4Laboratory of Immunohistochemistry, National Pediatrics Institute, Coyoacán, MEX, Mexico
Correspondence should be addressed to Jonnathan Guadalupe Santillán-Benítez; [email protected]
Received 24 May 2017; Accepted 20 July 2017; Published 5 September 2017
Academic Editor: Stefano M. M. Basso
Copyright © 2017 Martha Daniela Mociño-Rodríguez et al. This is an open access article distributed under the Creative CommonsAttribution License, which permits unrestricted use, distribution, and reproduction in any medium, provided the original work isproperly cited.
The development of breast cancer is influenced by the adipose tissue through the proteins leptin and adiponectin. However, there islittle research concerning AdipoR1 and AdipoR2 receptors and the influence of leptin over them. The objective of this work was toanalyze the expression of AdipoR1 and AdipoR2, modulated by differential concentrations of leptin in an obesity model (10 ng/mL,100 ng/mL, and 1000 ng/mL) associated with breast cancer in MCF-7 and HCC1937 cell lines. Each cell line was characterizedthrough immunohistochemistry, and the expression of AdipoR1 and AdipoR2 was analyzed by PCR in real time usingTaqMan® probes. Leptin induced an increase in cell population of MCF-7 (23.8%, 10 ng/mL, 48 h) and HCC1937 (17.24%,1000 ng/mL, 72 h). In MCF-7, the expression of AdipoR1 decreased (3.81%, 1000 ng/mL) and the expression of AdipoR2increased by 13.74 times (10 ng/mL) with regard to the control. In HCC1937, the expression of AdipoR1 decreased by 86.28%(10 ng/mL), as well as the expression of AdipoR2 (50.3%, 100 ng/mL). In regard to the results obtained, it could be concludedthat leptin has an effect over the expression of AdipoR1 and AdipoR2 mRNA.
1. Introduction
Over the last 20 years, the development of breast cancer hasbeen associated to lifestyle changes, primarily to obesity [1].Obesity is considered an excess in the accumulation of adi-pose tissue produced when caloric intake exceeds energyconsumption [2]. Besides storing excess calories in the formof lipids, the adipose tissue participates through diverseforms in the development of cancer due to the fact that it alsoacts as an endocrine gland, liberating the adipocytokinesleptin and adiponectin and proinflammatory molecules [3].
Leptin is a protein produced from the OB gen or “gen ofobesity” [4]. The expression of the gen is restricted to adiposetissue, and its levels are closely related to the storage of
triglycerides and the mass of adipose tissue [5]. It is apleiotropic adipocytokine which regulates the ingestion offoods, energy consumption, immunity, inflammation, hema-topoiesis, cell differentiation, and proliferation [6, 7].
Adiponectin is a protein produced exclusively in whiteadipose tissue [8] and is considered as a protection hormone,carrying out an important role in the regulation of glucosethrough a potent sensitizing effect towards insulin, whichaffects the uptake of glucose in the muscle and participatesin the homeostasis of lipids [9]. Its plasmatic concentrationhas an inversely proportional relationship towards obesity,body mass index, accumulation of visceral fat, and insulinresistance [10, 11]. It carries out its function through two spe-cific receptors, AdipoR1 and AdipoR2, which are receptors
HindawiDisease MarkersVolume 2017, Article ID 4862016, 11 pageshttps://doi.org/10.1155/2017/4862016
coupled to G proteins with six transmembrane domains.AdipoR1 is predominantly expressed in striated muscle,while AdipoR2 is mainly expressed in the liver [12]. Thebonding of adiponectin to its receptors increases the activityof the AMP-dependent protein kinase (AMPK) and theperoxisome proliferator-activated alpha receptor (PPAR-α),favoring the oxidation of fatty acids and the entrance ofglucose into tissues [13]. The activated AMPK system playsa vital role in the regulation of the energetic metabolismand cell quiescence [14, 15].
The pathologies, which modify the biology of adiposetissue, such as obesity, and produce an alteration in the secre-tion of these adipocytokines, increasing the liberation ofleptin, VEGF, IL-6, and TNF-α and decreasing the secretionof adiponectin could be linked to different carcinogenicmechanisms including cell differentiation, apoptosis, cellproliferation, angiogenesis, and alteration of steroidal sexhormone levels [9].
This variation in the secretion of adipocytokines by theadipose deposits may explain the relationship betweenobesity and the development of breast cancer, since obesesubjects present a decrease in the levels of circulatingadiponectin and increase in the plasmatic concentration ofleptin [5, 16].
The aforementioned has been observed in diverse in vitroexperiments, in which the promoting activity of proliferationin breast cancer cell lines by leptin is mediated through dif-ferent signal pathways; on one hand, it acts by inducing theP13K/Akt survival pathway, activating the phosphorylationof Akt, stimulating protein expression of PKC-alpha, acti-vating the MAPK pathway, and stimulating ERK1 andERK2 [17–20]. It activates the STAT3 pathway and inducesupregulation of c-myc at an mRNA level, as well as at a pro-tein level. Likewise, it upregulates genes of the cell cycle(cyclin D1) and reduces the expression of p53 and theproduction of Bax [21–23]. Some studies suggest that leptinmay promote angiogenesis in breast cancer through thesignaling of VEGF [24]. In this manner, it can be deducedthat the procarcinogenic effect of leptin derives from theactivation of signaling pathways implicated in the cell prolif-eration process and a downregulation of the apoptoticresponse [25, 26].
Likewise, the antiproliferative action of breast cancer cellsby adiponectin is mediated by an inactivation of protein 1and 3 expression in MAPK p44/42, a stimulation of AMPKactivity and a decrease in phosphorylation of Akt, associatedwith an increased expression of LKB1, reducing the activityof mTOR and leading to a decrease in the production ofreactive oxygen species [19, 27–29]. Studies suggest thatadiponectin modulates the cell cycle of breast cancer cells,decreasing the expression of cyclin D1 [30, 31]. In diversestudies, it has been detected that adiponectin induces cellapoptosis when a stimulus is given to cell lines with an incu-bation period longer than 48h [32, 33]. Also, an increase ofPPAR in estrogen-positive cell lines, the downregulation ofBcl2, and the activation of p53 and Bax have been detected[34, 35]. Finally, it is suggested that an interaction of adipo-nectin and estrogen pathways exists, since it is capable ofreducing aromatase and the expression of the receptor [36].
For the identification of the procarcinogenic mecha-nisms of leptin, the breast cancer cell lines MCF-7,MDA-MB-231, and T47D have been characterized forthe protein and its receptor [Ob-R), studying its effect overcell growth in the MCF-7, SK-BR-3, T47D, and ZR-75-1cell lines. An increase in cell proliferation when the cellsreceive a single stimulus of leptin and incubated between24 and 96h has been observed [21, 27, 28, 37, 38].
In order to better understand the potential involvementof leptin in the expression of adiponectin receptors, AdipoR1and AdipoR2, in the cells of breast cancer, the main objectiveof this research was to demonstrate that AdipoR1 and Adi-poR2 were expressed in MCF-7 and HCC1937 breast cancercell lines, as well as to determine and analyze the expressionof these receptors modulated by differential concentrationsof leptin [27].
2. Materials and Methods
2.1. Cell Culture. For this study, cell lines MCF-7 andHCC1937 were employed and were obtained from theAmerican Type Culture Collection (ATCC). They were cul-tivated at 37°C in an atmosphere of 5% CO2 and 85%humidity, with culture medium (RPMI 1640 medium,Gibco®, Thermo Fisher Scientific™, Dulbecco’s modifiedEagle’s medium, Caisson Labs, USA) supplemented with10% fetal bovine serum (Gibco, Thermo Fisher Scientific,USA), inactivated by heat (30min at 57°C; water bath), withmedium exchange every third day.
2.2. Immunohistochemistry. The expression of estrogens(RE), progesterone (RP), Her2, and Ki67 was determinedthrough immunohistochemistry. Once a confluence of 70%of cells was reached, they were washed with PBS (phos-phate-buffered saline, Gibco, Thermo Fisher Scientific,USA) and were suspended with 0.05% trypsin (Gibco,Canada). The recuperated cells were centrifuged for 3minat 1500 rpm, and the cell pellet was then used to prepareslides fixed with acetone. Posteriorly, the recuperation ofepitopes was done, utilizing 0.1% sodium citrate (Dako,USA, pH 6.2), inactivating endogenous peroxidase with0.9% hydrogen peroxide. The slides were washed with dis-tilled water and were placed in PBS for 5 minutes [39].The cells were then incubated during 45 minutes with thefollowing antibodies: RE 1 : 35 (Dako, USA), RP 1 : 50(Dako, USA), Her2 1 : 50 (Biocare, USA), and Ki67 1 : 100(Biocare, USA).
Next, a two-step detection system was incorporated(Mach 1 Universal HRP-Polymer Detection, Biocare, USA)during 30 minutes each. The reaction was visualized with3,3′-diaminobenzidine (Leica Biosystems, USA) and wasstained with Hill’s hematoxylin [39].
2.3. Proliferation Assay. The study of cell proliferation wascarried out through the crystal-violet assay. For this purpose,two groups of 5000 MCF-7 and HCC1937 cells were inocu-lated in 96-well culture plates and were left to grow during24 h (group 1) and 48h (group 2). Afterwards, each groupwas washed every 24 h, during 96 h, with PBS and fresh
2 Disease Markers
culture medium (supplemented with 5% SFB) with leptinstimuli, which was added (Recom Hu Leptin Active, SinoBiological, Thermo Fisher Scientific, USA) in concentrationsof 0 ng/mL (negative control), 10 ng/mL, 100ng/mL, and1000 ng/mL [27]. The decrease of SFB was done to reducethe growth factors that could interfere with the action ofleptin [40].
Cell proliferation in each cell line was determined in trip-licate for every concentration evaluated. After 24h of stimu-lation, the cells were fixed with 1.1% glutaraldehyde (Merck,Germany) during 15 minutes and then PBS was added untilthe 96 h of stimulation with leptin was concluded for eachgroup. At the end of stimulation, the fixed cells were stainedwith crystal-violet for 15 minutes, the plate was washed withwater, and 10% acetic acid was placed in each well. Immedi-ately after, the plate was read at an excitation wavelength of490nm and an emission wavelength of 630nm in a micro-plate reader (Stat Fax 2100 Microplate Reader, AwarenessTechnology Inc.)
2.4. Analysis of Microassays. The regulation of gene expres-sion of adiponectin receptors AdipoR1 and AdipoR2 wasevaluated by means of the addition of leptin to the cell linesfollowing the methodology proposed by Jardé et al., [27],with slight modifications. 2000 MCF-7 and HCC1937 cellswere cultured in 24-well culture plates, allowing them togrow during 48 h.
After 24h, 48 h, 72 h, and 96 h, the cells were washed withPBS and fresh culture medium (supplemented with 5% SFB)with leptin stimuli (0 ng/mL, 10 ng/mL, 100ng/mL, and1000 ng/mL) was added. At the end of the stimulation, theculture medium was removed and 400μL of TRIzol® reagentwas added to carry out the mRNA extraction, in accordancewith the protocol of use (Ambion™).
Once the mRNA was obtained, the acquisition of thecomplementary DNA was carried out (cDNA) from 2μg ofmRNA through the reverse transcriptase reaction, in accor-dance with the protocol of use (high-capacity RNA to cDNAkit, Applied Biosystems), obtaining 20μL of cDNA.
The cDNA of the controls of each cell line were usedto determine, through endpoint PCR (HotStarTaq DNAPolymerase, QIAGEN, Germany), the presence of AdipoR1mRNA (Fw: 5′-AATTCCTGAGCGCTTCTTTCCT-3′, Rv:5′-CATAGAAGTGGACAAAGGCTGC-3′) and AdipoR2mRNA (Fw: 5′-TGCAGCCATTATAGTCTCCCAG-3′, Rv:5′-GAATGATTCCACTCAGGCCTAG-3′), using the ACTBcontrol gen (Fw: 5′-GCACCACACCTTCTACAAAG-3′, Rv:5′-GGTCTCAAACATGATCTGGTC-3′).
Likewise, the cDNA obtained through the stimuli wasused to determine the gene expression of AdipoR1 and Adi-poR2 through real-time PCR (TaqManUniversalMix II, withUNG), utilizing TaqMan probes (Gene Expression Assays,Applied Biosystems) for AdipoR1 (Hs 01114951_ml) andAdipoR2 (Hs 00226105_ml), using the ACTB gene as acontrol (Hs 99999903_ml), following the instructions of theLightCycler® 2.0 thermocycler (Roche Diagnostics). The pro-gram utilized to carry out the PCR was 50°C for 2 minutes,95°C for 10min, 40 cycles at 95°C for 15 seconds, and 60°Cfor 1min.
For the determination of relative levels of AdipoR1 andAdipoR2 gene expression, the Pfafflmethod of relative quan-tification, based on the comparison of the threshold cycle ofa constitutive gene (mRNA of ACTB) with the test gene ofeach sample in duplicate, was carried out. The change in thefold of AdipoR1 and AdipoR2 was normalized with regardto the reference genes expressed constitutively and was thencompared with the nontreated controls as follows: 2−ΔΔCT,where ΔΔCT=ΔΔCT= (CT−target−CT−reference)treated sample−(CT−target−CT−reference)calibrating sample. “Calibrating sample”refers to the level of expression (1×) of the target genenormalized for the constitutive gen. The calibrator waschosen from the control group of each cell line and was givena value of 1 for relative expression [41–43].
3. Statistical Analysis
Statistical analysis was performed using GraphPad Prism 6software. To analyze the results of the growth curves ofeach cell line, a two-factor ANOVA was performed with ap value> 0.05, to establish the relationship between incuba-tion time and leptin concentrations.
For the analysis of gene expression results of AdipoR1and AdipoR2, we first tested a normality hypothesis usingthe Kolmogorov-Smirnov test. Subsequently, the Student’st-test was performed for the parametric variables and theMann–Whitney U test for the nonparametric variables witha p value> 0.05 for each one.
4. Results
4.1. Characterization by Immunohistochemistry. The selec-tion of the cell lines employed in this experiment was donein accordance with the molecular classification of breastcancer, in other words, in accordance with the hormonalreceptors that are found expressed by the cells.
Using the immunohistochemistry technique, each cellline was characterized according to the molecular classi-fication “triple positive” (MCF-7) and “triple negative”(HCC1937), evaluating the presence of Ki67, estrogen (RE),progesterone (RP), and Her2 (Figure 1).
MCF-7, a cell line identified as “triple positive,” had anexpression positive for Ki67 at 78% (78 cells out of 100), REat 45% (45 cells out of 100), RP at 5% (5 cells out of 100),and Her2 at 14% (14 cells out of 100).
In contrast to MCF-7, HCC1937 breast cancer cellspresented an expression negative for RE, RP, and Her2. ForKi67, they presented an expression positive at 7% (7 cellsout of 100), as shown in Figure 1.
4.2. Expression of Leptin, Adiponectin, AdipoR1, and AdipoR2in Breast Cancer Cell Lines. The mRNA of leptin andadiponectin was detected in MCF-7 breast cancer cellsthrough endpoint PCR, observing a greater expression ofleptin mRNA when compared to adiponectin mRNA, inaccordance with the bands obtained in the electrophoreticgel, as shown in Figure 2. With regard to HCC1937, atriple-negative cell line with a mutation in BRCA1 [44],
3Disease Markers

it was also possible to determine the expression of thesegenes (Figure 2).
As far as AdipoR1 and AdipoR2 mRNA is concerned, itwas detected in MCF-7 and HCC1937 cells through endpointPCR. In MCF-7, two adiponectin receptors, AdipoR1 andAdipoR2, were found to be expressed, just as Jardé et al.had reported [27]. As in the case of leptin and adiponectin,HCC1937 expresses these two receptors, a line that was notfound to be reported “positive” in literature (Figure 3).
In both cell lines, the expression of AdipoR2 mRNAis greater with regard to BACT and AdipoR1 mRNA
expression, in agreement with the bands obtained in theelectrophoretic gel, as can be seen in Figure 3.
Once it was proven that the three cell lines studiedexpress AdipoR1 and AdipoR2 mRNA, the quantitativedetermination of the expression of these receptors throughreal-time PCR, utilizing BACT as a control, went underway.
4.3. Effect of Leptin over Cell Proliferation of MCF-7 andHCC1937 Breast Cancer Cells. In the cells which weresubjected to the leptin stimuli 24 h after culture (group 1), anegative effect was observed (antiproliferative) in cell
A.1 A.2 A.3 A.4
(a)
B.1 B.2 B.3 B.4
(b)
Figure 1: Characterization through immunohistochemistry of MCF-7 and HCC1937 cells. Detection through immunohistochemistry of theKi67 protein, estrogen receptor (ER), progesterone receptor (PR), and Her2 in breast cancer cell lines. MCF-7 expression positive for Ki67(A.1), ER (A.2), PR (A.3), and Her2 (A.4). HCC1937 cells exhibited an expression positive for Ki67 (B.1), while they showed anexpression negative for ER (B.2), PR (B.3), and Her2 (B.4).
1 2 3
(a)
1 2 3
(b)
Figure 2: Detection of the expression of ABL control gene mRNA (1), adiponectin (2), and leptin (3) through endpoint PCR in MCF-7 (a)and HCC1937 (b) cells.
4 Disease Markers

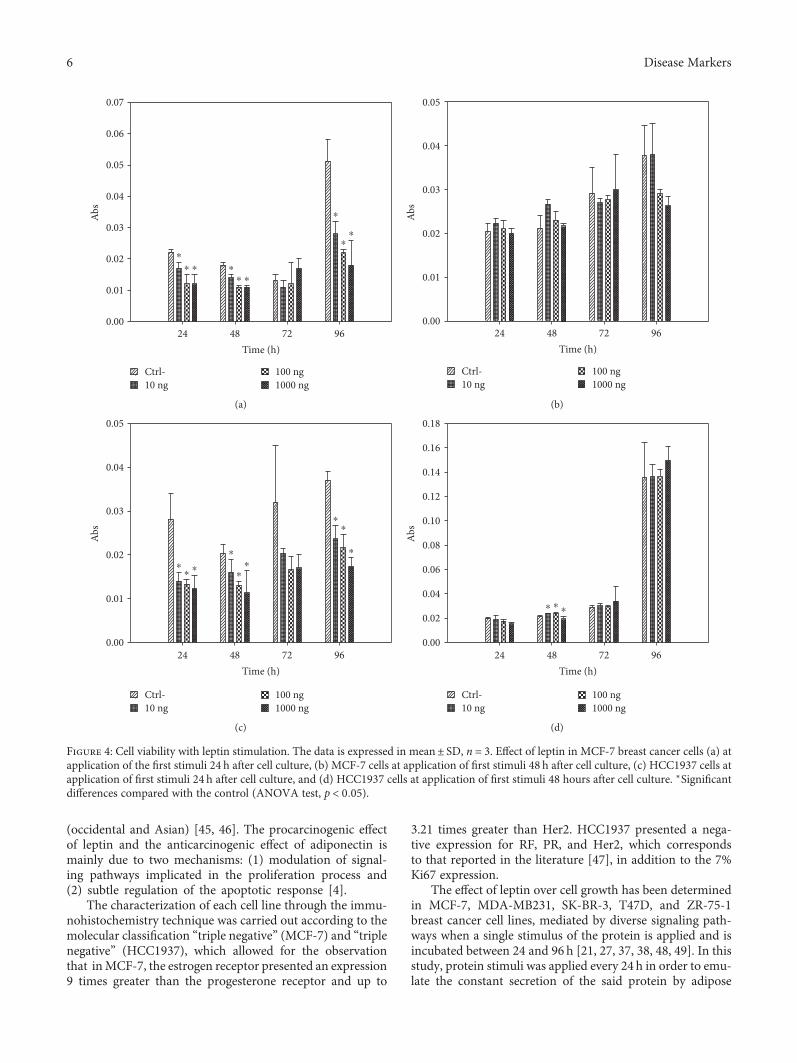
proliferation in relation to leptin concentrations.With regardto MCF-7 cells, the cell population decreased 64.71%(1000ng/mL, 96 h), except at 1000 ng/mL, where it increased30.77% after 72 h of stimulation. The cell growth ofHCC1937 decreased at all concentrations, up to 57.14%(1000ng/mL, 24h) (Figure 4).
In relation to the cells that were subjected to the leptinstimuli 48 h after culture (Group 2), a positive effect wasobserved in cell proliferation with relation to leptin concen-trations. With regard to MCF-7, the effect of this protein overcell proliferation was positive, increasing by 28.57% (10ng/mL, 48 h); this effect was maintained until 72 h, at a concen-tration of 1000 ng/mL, where there was a 3.45% increase withregard to the control. It was observed that for the concentra-tion that corresponds to normal weight (10 ng/mL), thepositive effect of leptin was maintained until 48 h anddecreased by 6.90% with the third stimuli (72 h) and posteri-orly presented an increase in the cell population once again at96 h; not so for the concentration of 100ng/mL, where at 72 hof stimulation, the cell population decreased by 26.68%. Thecell growth of HCC1937 decreased by 23.46% (1000ng/mL,24 h), except after 72 h, at which all the concentrationspresented an increase in the cell population, up to 17.24%(1000ng/mL), maintaining themselves until 96 h, wherethere was an increase of 0.49% at 10ng/mL, 0.25% at100ng/mL, and 10.31% at 1000 ng/mL with regard to thecontrol, indicating that the higher the concentration of lep-tin, the higher the increase in cell population. It was observedthat, despite the fact that the cell population was maintainedabove the control at all times and concentrations after 48 h ofstimulation, there was a gradual decrease of cells, as can beseen in Figure 4.
4.4. Expression of AdipoR1 and AdipoR2 Mediated by Leptinin Breast Cancer Cell Lines. The mRNA of AdipoR1 andAdipoR2 was detected in MCF-7 and HCC1937 cell linesthrough real-time PCR. The expression of AdipoR1 andAdipoR2 in mRNA was determined in cells that were stimu-lated with leptin at differential concentrations (0 ng/mL,10 ng/mL, 100ng/mL, and 1000 ng/mL) in both cell lines.
In MCF-7, the expression of AdipoR1 had a decrease of3.81% (1000 ng/mL) in the cells treated with leptin withregard to the control, except for 100ng/mL, where therewas a 64.03% increase in the expression of the gene. How-ever, the expression of AdipoR2 increased considerably inthe cells treated with leptin (up to 13.74 times; 10 ng/mL),with regard to the control (Figure 5).
Analyzing the normalized values of treated cells in theMCF-7 line, no statistically significant differences were foundin the expression of AdipoR1 between the controls and thecells treated with differential concentrations of leptin:10 ng/mL (p = 0 0945), 100 ng/mL (p = 0 760), and 1000 ng/mL (p = 0 7840). However, upon analyzing the normalizedvalues of treated cells for the expression of AdipoR2, statisti-cally significant differences were found between the controlsand the cells treated with differential concentrations ofleptin: 10 ng/mL (p = 0 0022), 100 ng/mL (p = 0 0022), and1000 ng/mL (p = 0 0022) (Table 1).
In HCC1937, the expression of AdipoR1 decreased incells treated with leptin with regard to the control, as muchas 86.28% (10 ng/mL), while the expression of AdipoR2 hada decrease in the cells treated with leptin with regard to thecontrol, as much as 50.3% (100 ng/mL), which can be seenin Figure 5.
Analyzing the normalized values of treated cells in theHCC1937 line, statistically significant differences were foundwith regard to the controls for the expression of AdipoR1in the cells treated: 10 ng/mL (p = 0 0043) and 1000 ng/mL(p = 0 0130). For the cells treated with 100ng/mL of leptin,no statistically significant differences were found for theexpression of AdipoR1. As for the expression of AdipoR2,upon analyzing the normalized values of treated cells, nostatistically significant differences were found between thecontrols and the cells treated with differential concentrationsof leptin: 10 ng/mL, 100 ng/mL, and 1000 ng/mL (Table 1).
5. Discussion
It has been determined that obesity and excess weight are riskfactors for the development of breast cancer in women
1 2 3
(a)
1 2 3
(b)
Figure 3: Detection of ACTB mRNA expression (1), AdipoR1 (2), and AdipoR2 (3) through endpoint PCR in MCF-7 (a) andHCC1937 cells (b).
5Disease Markers
(occidental and Asian) [45, 46]. The procarcinogenic effectof leptin and the anticarcinogenic effect of adiponectin ismainly due to two mechanisms: (1) modulation of signal-ing pathways implicated in the proliferation process and(2) subtle regulation of the apoptotic response [4].
The characterization of each cell line through the immu-nohistochemistry technique was carried out according to themolecular classification “triple negative” (MCF-7) and “triplenegative” (HCC1937), which allowed for the observationthat inMCF-7, the estrogen receptor presented an expression9 times greater than the progesterone receptor and up to
3.21 times greater than Her2. HCC1937 presented a nega-tive expression for RF, PR, and Her2, which correspondsto that reported in the literature [47], in addition to the 7%Ki67 expression.
The effect of leptin over cell growth has been determinedin MCF-7, MDA-MB231, SK-BR-3, T47D, and ZR-75-1breast cancer cell lines, mediated by diverse signaling path-ways when a single stimulus of the protein is applied and isincubated between 24 and 96 h [21, 27, 37, 38, 48, 49]. In thisstudy, protein stimuli was applied every 24 h in order to emu-late the constant secretion of the said protein by adipose
Time (h)24 48 72 96
Abs
0.00
0.01
0.02
0.03
0.04
0.05
0.06
0.07
⁎
⁎ ⁎ ⁎
⁎ ⁎
⁎
⁎
⁎
Ctrl- 10 ng
100 ng 1000 ng
(a)
Time (h)24 48 72 96
Abs
0.00
0.01
0.02
0.03
0.04
0.05
Ctrl- 10 ng
100 ng 1000 ng
(b)
Time (h)24 48 72 96
Abs
0.00
0.01
0.02
0.03
0.04
0.05
⁎
⁎⁎
⁎
⁎
⁎
⁎
⁎
⁎
Ctrl- 10 ng
100 ng 1000 ng
(c)
Time (h)24 48 72 96
Abs
0.00
0.02
0.04
0.06
0.08
0.10
0.12
0.14
0.16
0.18
⁎ ⁎⁎
Ctrl- 10 ng
100 ng 1000 ng
(d)
Figure 4: Cell viability with leptin stimulation. The data is expressed in mean± SD, n = 3. Effect of leptin in MCF-7 breast cancer cells (a) atapplication of the first stimuli 24 h after cell culture, (b) MCF-7 cells at application of first stimuli 48 h after cell culture, (c) HCC1937 cells atapplication of first stimuli 24 h after cell culture, and (d) HCC1937 cells at application of first stimuli 48 hours after cell culture. ∗Significantdifferences compared with the control (ANOVA test, p < 0 05).
6 Disease Markers

tissue in a condition of normal weight (10 ng/mL), excessweight-obesity (100 ng/mL), and a very high concentrationof leptin (1000ng/mL).
In group 1 of the MCF-7 breast cancer cells, it wasobserved that the effect of leptin over cell proliferation wasantiproliferative, decreasing up to 64.71%. It was alsoobserved that this antiproliferative effect is due to the sensi-bility of the cells while being recultured (period of cellularadaptation) and to the immediate administration of an exog-enous agent, since despite that there was a decrease in the cellpopulation during the first stimulation with leptin (24 h), inthe posterior stimulations (48 and 72 h), there was a gradualincrease in cell population with regard to the populationobtained at 24h of stimulation. An increase of 0.65% and
9.50% for the concentration of 10ng/mL at 48h and 72 h,an increase of 12.04% and 69.23% for 100ng/mL at 48hand 72h, and an increase of 12.04% and 139.74% for1000 ng/mL at 48 h and 72 h, respectively, were observed,which indicate that the greater the concentration of leptin,the greater the increase in cell population. Likewise, the cellsto which 4 stimuli of leptin were administered (96 h) showeda major decrease in cell population with regard to the control(10 ng/mL: 45.09%; 100 ng/mL: 56.86%; and 1000 ng/mL:64.71%), possibly due to a saturation of the cell receptorsby leptin.
In the MCF-7 breast cancer cells of group 2, the effect ofleptin over cell proliferation was positive, increasing up to28.57%, except for the concentration of 100ng/mL, in which
Leptin conc.Ctrl- 10 ng 100 ng 1000 ng
Rel
ativ
e exp
ress
ion
0
1
2
3
4
(a)
Leptin conc.Ctrl- 10 ng 100 ng 1000 ng
Rel
ativ
e exp
ress
ion
0
10
20
30
40
50
60
⁎
⁎
⁎
(b)
Leptin conc.
Ctrl- 10 ng 100 ng 1000 ng
Rel
ativ
e exp
ress
ion
0.0
0.5
1.0
1.5
2.0
2.5
3.0
⁎
⁎
(c)
Leptin conc.
Ctrl- 10 ng 100 ng 1000 ng
Relat
ive e
xpre
ssio
n
0.0
0.5
1.0
1.5
2.0
2.5
(d)
Figure 5: Units of relative expression of AdipoR1 and AdipoR2. The data is expressed as mean± SD. In MCF-7 breast cancer cells, there is a2.92% decrease in the expression of AdipoR1 (a) in cells treated with leptin (100 ng/mL) with regard to the control and of 3.81% for theconcentration of 1000 ng/mL, except at 10 ng/mL, where there was a 64.03% increase; the expression of AdipoR2 (b) increased by 13.74times in cells treated with leptin (10 ng/mL) with regard to the control, 9.23 times for 100 ng/mL, and 11.39 times for 1000 ng/mL, findingsignificant differences compared to the control in all concentrations. With regard to the HCC1937 breast cancer cells, the expression ofAdipoR1 (c) presented an 86.28% decrease in cells treated with leptin (10 ng/mL) with regard to the control, 13.72% (100 ng/mL), and77.14% (1000 ng/mL), finding significant differences for 10 g/mL and 1000 ng/mL; the expression of AdipoR2 (c) exhibited a 24.4%decrease in cells treated with leptin (10 ng/mL), with regard to the control, 50.3% (100 ng/mL), and 26.2% (1000 ng/mL); however, nosignificant differences were found in any of the concentrations relative to control. ∗Significant differences compared to the control(U of Mann–Whitney, p ≤ 0 05).
7Disease Markers

at 72 h of stimulation, the cell population decreased up to26.68% (10 ng/mL, 48 h) and was maintained until 72 hat the concentration of 1000 ng/mL, where there was a3.45% increase with regard to the control. This effect couldbe due to the elimination of the cellular adaptation period,since the cells were left to grow for another 24 h before theaddition of exogenous agent (leptin) to the medium,allowing the cells to grow stronger, so as to not be damagedby the protein.
In the HCC1937 breast cancer cells of group 1, the effectof leptin over cell proliferation was negative at all concentra-tions evaluated (57.14%). As in the case of the MCF-7 breastcancer cells, it was observed that this antiproliferative effect isdue to the sensibility of the cells while being recultured andthe immediate administration of leptin; since despite adecrease in the cell population during the first stimulationwith leptin (24 h), in the second, there was a small increasein the population with regard to the cells obtained at 24 hof stimulation: for the concentration of 10ng/mL, an increaseof 60%; for 100ng/mL, an increase of 40%; and for 1000 ng/mL, an increase of 28.33%. However, this effect was notmaintained with posterior stimulations.
The aforementioned results demonstrate that the periodof cellular adaptation interferes with the effect of leptin overMCF-7 and HCC1937 proliferation, in which the period ofcellular adaptation posterior to culture is between 2 and 3days. In these cell lines, there was a positive effect over cellproliferation at all concentrations administered, when thefirst stimuli was administered 48 h after cell culture. Basedon these results, it was decided that a cell stimulation be donewith leptin 48 hours after cell culture.
An important find from the detection of leptin, adipo-nectin, AdipoR1, and AdipoR2 mRNA in breast cancercells through endpoint PCR was that in HCC1937, atriple-negative cell line with a mutation in BRCA1 [44],these proteins and receptors are also found to beexpressed, information that had not been reported in theliterature. The aforementioned means that indistinctly ofthe molecular classification of breast cancer to which thecell lines belong, they can express leptin, adiponectin,and its receptors, allowing for the possibility of a futuretreatment for triple-positive breast cancer patients, patients
with negative breast cancer, and patients with triple-negativebreast cancer with mutations in BRCA1.
As for the expression assay, in MCF-7 breast cancer cells,the expression of mRNA of AdipoR2 (2.423± 2.35) wasgreater than the expression of AdipoR1 (1.679± 1.76). Forthe stimulations with leptin, it was found that the expressionof AdipoR1 mRNA decreased with regard to the control inthe cells that received 100ng/mL and 1000ng/mL of up to3.81%, while the cells that received a stimulus of 10 ng/mLshowed a 64.03% increase in expression. Surprisingly, theexpression of AdipoR2 mRNA was dramatically increasedat all concentrations of leptin: 10 ng/mL (13.75 times),100 ng/mL (9.23 times), and 1000 ng/mL (11.39 times). Onceagain, the concentration at which there was a greater increasein the expression of the adiponectin receptor was at the “nor-mal weight” concentration (10ng/mL), which could indicatethat in a condition of normal weight (10 ng/mL), at a highlevel of AdipoR1 and AdipoR2, the adiponectin could suc-cessfully carry out its antiproliferative activity of cancercells and, in this manner, generate a form of protectionfor the patient.
The reduction in the expression of AdipoR1 in MCF-7breast cancer cells corresponds with that proposed in thehypothesis of the present work, since in cells that receivedhigher concentrations of leptin (100 ng/mL=excess weight-obesity; 1000 ng/mL), a decrease in the expression of mRNAof the gen was observed with regard to the control, while thecells that received stimulation with a concentration corre-sponding to normal weight showed an increase in the expres-sion of both receptors. On the other hand, the increase in theexpression of AdipoR2 mRNA and the decrease in the cellpopulation at all concentrations at 96 h of stimulation couldindicate that the effective receptor for the in vivo signalingof adiponectin in the breast cancer tissue is AdipoR2; thiscorresponds to that found in 2009 by Jardé et al. [27].
Despite this evidence, the notion of the effective receptorfor adiponectin is uncertain, since it has been found thatwhen siRNA was used against AdipoR1, the antiproliferativeactivity of adiponectin in T47D cells was annulated [30].Likewise, studies have established a relationship betweenthe presence of AdipoR1 and a better diagnosis in gastricand colon cancers [50, 51].
With regard to the expression of AdipoR1 and AdipoR2mRNA in HCC1937 breast cancer cells, as in the case ofMCF-7 cells, the expression of AdipoR2 mRNA (1.336±0.905) was greater than the expression of AdipoR1 (1.181±0.67). However, contrary to that found in MCF-7, there wasa decrease in the expression of AdipoR1 mRNA of up to86.26% (10ng/mL), when stimulated with leptin, and up to50.3% (100 ng/mL) for the expression of AdipoR2 mRNA.These results correspond to that found in cell viability curves(Figure 4), where it can be seen, in a much more markedmanner, that there is a positive stimulation over cell prolifer-ation at all concentrations of leptin employed due to the lackof antiproliferative activity offered by adiponectin through itsreceptors, generated from the decrease in the mRNA expres-sion of these.
For HCC1937 cells, a part of the hypothesis proposed wascorroborated for AdipoR1 and AdipoR2, due to the fact that
Table 1: Relative expression of AdipoR1 and AdipoR2.
Cell lineLeptin
concentration(ng/mL)
2−ΔΔCT
AdipoR12−ΔΔCT AdipoR2
MCF-7
10 2.754± 0.701 33.31± 16.006∗∗
100 1.63± 1.74 22.354± 14.006∗∗
1000 1.615± 1.209 27.607± 21.102∗∗
HCC1937
10 0.162± 0.129∗∗ 1.01± 0.755
100 1.019± 1.423 0.664± 0.502
1000 0.27± 0.27∗ 0.986± 0.597
2−ΔΔCT Relative expression using BACT as a constitutive gene. The data isexpressed as mean ± SD, n = 6. In statistical Mann–Whitney U test,significance with regard to the control ∗p ≤ 0 05, ∗∗p ≤ 0 01.
8 Disease Markers

there was a decrease in the expression of mRNA in both cellreceptors in the cells that received stimulation from leptinevery 24 h. Contrary to what is expected, a greater decreaseof expression was found in concentrations correspondingto normal weight (10 ng/mL) and excess weight-obesity(100 ng/mL), which could indicate that in a condition ofexcess weight and obesity, there is a blockage in the expres-sion of these receptors, which leads to adiponectin not beingable to carry out its protective (antiproliferative) actionduring the development of breast cancer.
In our study, one of the limitations found was that theeffect of leptin on cell proliferation and expression of Adi-poR1 and AdipoR2 was modest, due to the range of leptinconcentrations used to perform the cellular stimulus was verywide, which did not allow to identify exactly the effect thatthis protein has on the gene expression of these receptors ina state of obesity. On the other hand, it is impossible toextrapolate the results obtained from leptin stimulation inthe cell lines with the results of expression that could beobtained directly from obese patients with breast cancerdue to the complexity of the metabolic environment of thetumor in vivo.
6. Conclusion
In this study, the effect of leptin over cell proliferation andgenic expression of AdipoR1 and AdipoR2 in MCF-7 andHCC1937 cells was modest. Indistinctly of the molecularclassification of breast cancer of the cell lines used, they allexpress leptin, adiponectin, AdipoR1, and AdipoR2. It wasdetermined that the period of cell adaptation generates aninterference with the effect of leptin over the proliferationof MCF-7 and HCC1937 cells. During the development ofbreast cancer, the capacity of proliferation (23.68% forMCF-7 and 17.24% for HCC1937), explained by the deregu-lation of leptin in obesity, could be very relevant at themoment of prescribing a treatment to the patient. Theconcentration of leptin that generated an increase in theexpression of both receptors of adiponectin was that corre-sponding to normal weight (10 ng/mL), indicating that insaid condition, adiponectin can successfully carry out itsantiproliferative activity over cancer cells and, in this man-ner, generate a form of protection for the patient.
The reduction in the expression of AdipoR1 mRNA andthe increase in the expression of AdipoR2 mRNA couldindicate that the effective receptor for the in vivo signalingof adiponectin in breast cancer tissue is AdipoR1.
Conflicts of Interest
The authors declare no conflict of interest.
Acknowledgments
This work was supported by the Autonomous Universityof the State of Mexico and the IMIEM Specialized Hemato-Oncological Laboratory.
References
[1] T. Jardé, F. Caldefie-Chézet, M. Damez et al., “Leptin andleptin receptor involvement in cancer development: a studyon human primary breast carcinoma,” Oncology Reports,vol. 19, pp. 905–911, 2008.
[2] L. M. Morimoto, E. White, Z. Chen et al., “Obesity, body size,and risk of postmenopausal breast cancer: the women’s healthinitiative (United States),” Cancer Causes and Control, vol. 13,pp. 741–751, 2002.
[3] M. J. Khandekar, P. Cohen, and B. M. Spiegelman, “Molecularmechanisms of cancer development in obesity,” NatureReviews, vol. 11, pp. 886–895, 2011.
[4] T. Jardé, S. Perrier, M. P. Vasson, and F. Caldefie-Chézet,“Molecular mechanisms of leptin and adiponectin in breastcancer,” European Journal of Cancer, vol. 47, pp. 33–43, 2011.
[5] C. E. Ruhl and J. E. Everhart, “Leptin concentrations in theUnited States: relations with demographic and anthropometricmeasures,” The American Journal of Clinical Nutrition, vol. 74,pp. 295–301, 2001.
[6] H. S. Moon, M. Dalamaga, S. Y. Kim et al., “Leptin’s role inlipodystrophic and nonlipodystrophic insulin resistant anddiabetic individuals,” Endocrine Reviews, vol. 34, pp. 377–412, 2013.
[7] M. Dalamaga, S. H. Chou, K. Shields, P. Papageorgiou, S. A.Polyzos, and C. S. Mantzoros, “Leptin at the intersection ofneuroendocrinology and metabolism: current evidence andtherapeutic perspectives,” Cell Metabolism, vol. 18, pp. 29–42, 2013.
[8] D. Housa, J. Housová, Z. Vernerová, and M. Haluzík, “Adipo-cytokines and cancer,” Physiological Research, vol. 55, pp. 233–244, 2006.
[9] L. Delort, T. Jardé, V. Dubois, M. P. Vasson, and F. Caldefie-Chézet, “New insights into anticarcinogenic properties ofadiponectin: a potential therapeutic approach in breastcancer?,” Vitamins and Hormones, vol. 90, pp. 397–417,2012.
[10] Y. Matsuzawa, T. Funahashi, S. Kihara, and I. Shimomura,“Adiponectin and metabolic syndrome,” Arteriosclerosis,Thrombosis, and Vascular Biology, vol. 24, pp. 29–33, 2004.
[11] C. M. López Fontana, M. E. Maselli Artola, N. Di MiltaMónaco et al., “Influencia de la leptina y la adiponectina sobreel cáncer de próstata,” Archivos Españoles de Urología, vol. 62,no. 2, pp. 103–108, 2009.
[12] J. Thundyil, D. Pavlovski, C. G. Sobey, and T. V. Arumugam,“Adiponectin receptor signalling in the brain,” British Journalof Pharmacology, vol. 165, pp. 313–327, 2011.
[13] M.-H. Lee, R. L. Klein, H. M. El-Shewy, D. K. Luttrell, andL. M. Luttrell, “The adiponectin receptors AdipoR1 andAdipoR2 activate ERK1/2 through a Src/Ras-dependentpathway and stimulate cell growth,” Biochemistry, vol. 47,no. 44, pp. 11682–11692, 2008.
[14] M. Chandran, S. A. Phillips, T. Ciaraldi, and R. R. Henry,“Adiponectin: more than just another fat cell hormone?,”Diabetes Care, vol. 26, pp. 2442–2450, 2003.
[15] A. Fujimoto, S. Akifusa, N. Kamio, T. Hirofuji, K. Nonaka,and Y. Yamashita, “Involvement of mTOR in globularadiponectin-induced generation of reactive oxygen species,”Free Radical Research, vol. 44, pp. 128–134, 2010.
[16] Y. Arita, S. Kihara, N. Ouchi et al., “Paradoxical decrease of anadipose-specific protein, adiponectin, in obesity,” Biochemical
9Disease Markers

and Biophysical Research Communications, vol. 257, no. 1,pp. 79–83, 1999.
[17] R. Fusco, M. Galgani, C. Procaccini et al., “Cellular andmolecular crosstalk between leptin receptor and estrogenreceptor- {alpha} in breast cancer: molecular basis for a noveltherapeutic setting,” Endocrine-Related Cancer, vol. 17, no. 2,pp. 373–382, 2010.
[18] K. A. Frankenberry, H. Skinner, P. Somasundar, D. W.McFadden, and L. C. Vona-Davis, “Leptin receptor expressionand cell signaling in breast cancer,” International Journal ofOncology, vol. 28, no. 4, pp. 985–993, 2006.
[19] K. J. Nkhata, A. Ray, T. F. Schuster, M. E. Grossmann, andM. P. Cleary, “Effects of adiponectin and leptin co-treatmenton human breast cancer cell growth,” Oncology Reports,vol. 21, no. 6, pp. 1611–1619, 2009.
[20] C. Garofalo, D. Sisci, and E. Surmacz, “Leptin interferes withthe effects of the antiestrogen ICI 182, 780 in MCF-7 breastcancer cells,” Clinical Cancer Research, vol. 10, no. 19,pp. 6466–6475, 2004.
[21] N. Yin, D. Wang, H. Zhang et al., “Molecular mechanismsinvolved in the growth stimulation of breast cancer cells byleptin,” Cancer Research, vol. 64, pp. 5870–5875, 2004.
[22] J. G. Santillan Benitez, A. Ordoñez, Z. H. Mendieta, andL. M. Gómez Oliván, “La leptina en la carcinogénesismamaria. Vías de señalización,” Química Viva, vol. 2, no. 11,pp. 91–111, 2012.
[23] M. Okumura, M. Yamamoto, H. Sakuma et al., “Leptinand high glucose stimulate cell proliferation in MCF-7human breast cancer cells: reciprocal involvement of PKC-alpha and PPAR expression,” Biochimica et Biophysica Acta(BBA) - Molecular Cell Research, vol. 1592, no. 2, pp. 107–116, 2002.
[24] R. R. Gonzalez, S. Cherfils, M. Escobar et al., “Leptin signalingpromotes the growth of mammary tumors and increases theexpression of vascular endothelial growth factor (VEGF) andits receptor type two (VEGF-R2),” The Journal of BiologicalChemistry, vol. 281, no. 36, pp. 26320–26328, 2006.
[25] N. A. Binai, A. Damert, G. Carra et al., “Expression of estrogenreceptor alpha increases leptin-induced STAT3 activity inbreast cancer cells,” International Journal of Cancer, vol. 127,no. 1, pp. 55–66, 2010.
[26] C. Chen, Y. C. Chang, C. L. Liu, K. J. Chang, and I. C. Guo,“Leptin-induced growth of human ZR-75-1 breast cancer cellsis associated with up-regulation of cyclin D1 and c-Myc anddownregulation of tumor suppressor p53 and p21WAF1/CIP1,” Breast Cancer Research and Treatment, vol. 98, no. 2,pp. 121–132, 2006.
[27] T. Jarde, F. Caldefie-Chezet, N. Goncalves-Mendes et al.,“Involvement of adiponectin and leptin in breast cancer: clin-ical and in vitro studies,” Endocrine-Related Cancer, vol. 16,no. 4, pp. 1197–1210, 2009.
[28] M. N. Dieudonne, M. Bussiere, E. Dos Santos, M. C. Leneveu,Y. Giudicelli, and R. Pecquery, “Adiponectin mediates anti-proliferative and apoptotic responses in human MCF7breast cancer cells,” Biochemical and Biophysical ResearchCommunications, vol. 345, no. 1, pp. 271–279, 2006.
[29] L. Taliaferro-Smith, A. Nagalingam, D. Zhong, W. Zhou, N. K.Saxena, and D. Sharma, “LKB1 is required for adiponectin-mediated modulation of AMPK-S6K axis and inhibition ofmigration and invasion of breast cancer cells,” Oncogene,vol. 28, no. 29, pp. 2621–2633, 2009.
[30] S. Nakayama, Y. Miyoshi, H. Ishihara, and S. Noguchi,“Growth inhibitory effect of adiponectin via adiponectinreceptor 1 on human breast cancer cells through inhibitionof S-phase entry without inducing apoptosis,” Breast CancerResearch and Treatment, vol. 112, no. 3, pp. 405–410, 2007.
[31] Y. Wang, J. B. Lam, K. S. Lam et al., “Adiponectin modulatesthe glycogen synthase kinase-3beta/beta-catenin signalingpathway and attenuates mammary tumorigenesis of MDA-MB-231 cells in nude mice,” Cancer Research, vol. 66, no. 23,pp. 11462–11470, 2006.
[32] J. H. Kang, Y. Y. Lee, B. Y. Yu et al., “Adiponectin inducesgrowth arrest and apoptosis of MDA-MB-231 breast cancercell,” Archives of Pharmacal Research, vol. 28, no. 11,pp. 1263–1269, 2005.
[33] A. Korner, K. Pazaitou-Panayiotou, T. Kelesidis et al.,“Total and high-molecular-weight adiponectin in breastcancer: in vitro and in vivo studies,” The Journal ofClinical Endocrinology & Metabolism, vol. 92, no. 3,pp. 1041–1048, 2007.
[34] M. E. Grossmann, K. J. Nkhata, K. MizunoN, A. Ray, andM. P. Cleary, “Effects of adiponectin on breast cancer cellgrowth and signaling,” British Journal of Cancer, vol. 98,pp. 370–379, 2008.
[35] E. Dos Santos, D. Benaitreau, M. N. Dieudonne et al.,“Adiponectin mediates an antiproliferative response inhuman MDA-MB 231 breast cancer cells,” Oncology Reports,vol. 20, no. 4, pp. 971–977, 2008.
[36] O. Treeck, C. Lattrich, I. Juhasz-Boess, S. Buchholz, G. Pfeiler,and O. Ortmann, “Adiponectin differentially affects geneexpression in human mammary epithelial and breast cancercells,” British Journal of Cancer, vol. 99, no. 8, pp. 1246–1250, 2008.
[37] D. Soma, J. Kitayama, H. Yamashita, H. Miyato, M. Ishikawa,and H. Nagawa, “Leptin augments proliferation of breast can-cer cells via transactivation of HER2,” The Journal of SurgicalResearch, vol. 149, no. 1, pp. 9–14, 2008.
[38] P. Somasundar, A. K. Yu, L. Vona-Davis, andD.W.McFadden,“Differential effects of leptin on cancer in vitro,” The Journal ofSurgical Research, vol. 113, no. 1, pp. 50–55, 2003.
[39] F. J. García Vázquez and J. E. Farfán Morales, “Manual Técni-cas de Herramientas en Patología,” Inmunohistoquímica,vol. 1, 2014.
[40] V. Dubois, L. Delort, H. Billard, M. P. Vasson, and F.Caldefie-Chezet, “Breast cancer and obesity: in vitro inter-ferences between adipokines and proangiogenic featuresand/or antitumor therapies?,” PLoS One, vol. 3, no. 8,article e58541, 2013.
[41] K. J. Livak and T. D. Schmittgen, “Analysis of relative geneexpression data using real-time quantitative PCR and the2(− Delta DeltaC(T)) method,” Methods, vol. 25, pp. 402–408, 2001.
[42] M. W. Pfaffl, “A new mathematical model for relative quanti-fication in real-time RT-PCR,” Nucleic Acids Research,vol. 29, pp. 2003–2007, 2001.
[43] T. D. Schmittgen and K. J. Livak, “Analyzing real-time PCRdata by the comparative CT method,” Nature Protocols,vol. 3, pp. 1100–1108, 2008.
[44] G. E. Tomlinson, T. T. Chen, V. A. Stasny et al., “Characteriza-tion of a breast cancer cell line derived from a germ-lineBRCA1 mutation carrier,” Cancer Research, vol. 58,pp. 3237–3242, 1998.
10 Disease Markers

[45] A. M. Lorincz and S. Sukumar, “Molecular links betweenobesity and breast cancer,” Endocrine-Related Cancer, vol. 13,pp. 279–292, 2006.
[46] R. T. Chlebowski, E. Aiello, and A. McTiernan, “Weight loss inbreast cancer patient management,” Journal of Clinical Oncol-ogy, vol. 20, no. 4, pp. 1128–1143, 2002.
[47] A. F. Gazdar, V. Kurvari, A. Virmani et al., “Characterizationof paired tumor and non-tumor cell lines established frompatients with breast cancer,” International Journal of Cancer,vol. 78, pp. 766–774, 1998.
[48] M. N. Dieudonne, F. Machinal-Quelin, V. Serazin-Leroy,M. C. Leneveu, R. Pecquery, and Y. Giudicelli, “Leptinmediates a proliferative response in human MCF7 breastcancer cells,” Biochemical and Biophysical Research Commu-nications, vol. 293, no. 1, pp. 622–628, 2002.
[49] S. Naviglio, D. Di Gesto, A. Sorrentino et al., “Leptin enhancesgrowth inhibition by cAMP elevating agents through apopto-sis of MDA-MB-231 breast cancer cells,” Cancer Biology &Therapy, vol. 8, no. 12, pp. 1183–1190, 2009.
[50] T. Tsukada, S. Fushida, S. Harada et al., “Adiponectinreceptor-1 expression is associated with good prognosis ingastric cancer,” Journal of Experimental & Clinical CancerResearch, vol. 30, p. 107, 2011.
[51] A. Y. Kim, Y. S. Lee, K. H. Kim et al., “Adiponectin repressescolon cancer cell proliferation via AdipoR1- and -R2-mediatedAMPK activation,” Molecular Endocrinology, vol. 24, no. 7,pp. 1441–1452, 2010.
11Disease Markers

Submit your manuscripts athttps://www.hindawi.com
Stem CellsInternational
Hindawi Publishing Corporationhttp://www.hindawi.com Volume 2014
Hindawi Publishing Corporationhttp://www.hindawi.com Volume 2014
MEDIATORSINFLAMMATION
of
Hindawi Publishing Corporationhttp://www.hindawi.com Volume 2014
Behavioural Neurology
EndocrinologyInternational Journal of
Hindawi Publishing Corporationhttp://www.hindawi.com Volume 2014
Hindawi Publishing Corporationhttp://www.hindawi.com Volume 2014
Disease Markers
Hindawi Publishing Corporationhttp://www.hindawi.com Volume 2014
BioMed Research International
OncologyJournal of
Hindawi Publishing Corporationhttp://www.hindawi.com Volume 2014
Hindawi Publishing Corporationhttp://www.hindawi.com Volume 2014
Oxidative Medicine and Cellular Longevity
Hindawi Publishing Corporationhttp://www.hindawi.com Volume 2014
PPAR Research
The Scientific World JournalHindawi Publishing Corporation http://www.hindawi.com Volume 2014
Immunology ResearchHindawi Publishing Corporationhttp://www.hindawi.com Volume 2014
Journal of
ObesityJournal of
Hindawi Publishing Corporationhttp://www.hindawi.com Volume 2014
Hindawi Publishing Corporationhttp://www.hindawi.com Volume 2014
Computational and Mathematical Methods in Medicine
OphthalmologyJournal of
Hindawi Publishing Corporationhttp://www.hindawi.com Volume 2014
Diabetes ResearchJournal of
Hindawi Publishing Corporationhttp://www.hindawi.com Volume 2014
Hindawi Publishing Corporationhttp://www.hindawi.com Volume 2014
Research and TreatmentAIDS
Hindawi Publishing Corporationhttp://www.hindawi.com Volume 2014
Gastroenterology Research and Practice
Hindawi Publishing Corporationhttp://www.hindawi.com Volume 2014
Parkinson’s Disease
Evidence-Based Complementary and Alternative Medicine
Volume 2014Hindawi Publishing Corporationhttp://www.hindawi.com