exploring the neurodevelopment of visual statistical
TRANSCRIPT

Available online at www.sciencedirect.com
www.elsevier.com/locate/brainres
b r a i n r e s e a r c h 1 5 9 7 ( 2 0 1 5 ) 9 5 – 1 0 7
http://dx.doi.org/100006-8993/& 2014 El
nCorrespondenceE-mail addresses
[email protected] (A.M
Research Report
Exploring the neurodevelopment of visual statisticallearning using event-related brain potentials
Ethan Josta,b,n, Christopher M. Conwayc, John D. Purdyd, Anne M. Walke,Michelle A. Hendrickse
aDepartment of Psychology, Cornell University; Ithaca, NY, USAbDepartment of Radiology, Memorial Sloan Kettering Cancer Center; New York, NY, USAcDepartment of Psychology, Georgia State University; Atlanta, GA, USAdDepartment of Speech, Language, & Hearing Sciences, Purdue University; West Lafayette, IN, USAeDepartment of Psychology, Saint Louis University; St. Louis, MO, USA
a r t i c l e i n f o
Article history:
Accepted 12 October 2014
Implicit statistical learning (ISL) allows for the learning of environmental patterns and is
thought to be important for many aspects of perception, cognition, and language
Available online 2 December 2014
Keywords:
Statistical learning
ERP
Cognitive development
.1016/j.brainres.2014.10.01sevier B.V. All rights res
to: Department of Psych: [email protected] (E. Jo. Walk), [email protected]
a b s t r a c t
development. However, very little is known about the development of the underlying
neural mechanisms that support ISL. To explore the neurodevelopment of ISL, we
investigated the event-related potential (ERP) correlates of learning in adults, older
children (aged 9–12), and younger children (aged 6–9) using a novel predictor-target
paradigm. In this task, which was a modification of the standard oddball paradigm,
participants were instructed to view a serial input stream of visual stimuli and to respond
with a button press when a particular target appeared. Unbeknownst to the participants,
covert statistical probabilities were embedded in the task such that the target was
predicted to varying degrees by different predictor stimuli. The results were similar across
all three age groups: a P300 component that was elicited by the high predictor stimulus
after sufficient exposure to the statistical probabilities. These neurophysiological findings
provide evidence for developmental invariance in ISL, with adult-like competence reached
by at least age 6.
& 2014 Elsevier B.V. All rights reserved.
7erved.
ology, Uris Hall, Cornell University, Ithaca, NY 14853.st), [email protected] (C.M. Conway), [email protected] (J.D. Purdy),du (M.A. Hendricks).
1. Introduction
Implicit statistical learning (ISL) refers to the automatic,incidental, and effortless acquisition of statistical patternsin the environment (Cleeremans et al., 1998; Conway and
Christiansen, 2006; Eimer, Goschke, Schlaghecken, & Sturmer,1996; Fiser and Aslin, 2002; Perruchet and Pacton, 2006). The
use of ISL processes are believed to play an important role in
language learning (Conway et al., 2010; Misyak et al., 2010;
Saffran, 2003; Saffran et al., 1996) in addition to other aspects

b r a i n r e s e a r c h 1 5 9 7 ( 2 0 1 5 ) 9 5 – 1 0 796
of cognitive development such as visual perception (Fiser and
Aslin, 2002; Turk-Browne et al., 2010), motor skill learning
(Robertson, 2007), and social intuition (Lieberman, 2000).
These abilities are domain-general in the sense that the same
general mechanisms appear to be used across multiple
domains in parallel (Saffran and Thiessen, 2007). However,
few studies have probed the neural mechanisms mediating
ISL in adults, let alone in children, making it difficult to
specify the neurocognitive development of these processes.Reber (1993) suggested that implicit learning is developmen-
tally invariant, a claim which has been supported by recent
Fig. 1 – An example sequence of colored circles for each of the thrconditions). In the example three filler circles are used prior to thone to five. After the appearance of either the target or filler follothe target is brown, but circle color was randomly distributed a
-100 0 100 200 300 400 500 600 700 800 900
-10
-5
0
5
10
Time (ms)
Vol
tage
(uV
)
Adults - First Two Blocks of Trials
Zero ProbabilityHigh ProbabilityLow Probability
Fig. 2 – Averaged ERP waveforms in the centro-parietal region (Pblocks (right).
work examining saccadic eye movements in a behaviorallearning paradigm (Amso and Davidow, 2012). However, otherresearch has provided evidence of developmental differences(Barry, 2007; McNealy et al., 2010; Mecklenbräuker et al., 2003;Thomas et al., 2004). Perhaps not surprisingly, in most caseswhere developmental differences in implicit learning are found,adults out-perform children. However, the evidence is notstraightforward. Some proposals take the somewhat paradoxicalstance that cognitive limitations may confer a computationaladvantage for learning (Conway et al., 2003; Elman, 1993;Newport, 1990), which would indicate that ISL might be moreefficient in childhood. Overall, relatively little is known about the
ee stimulus types (high-, low-, and zero-probability predictore appearance of a predictor, but this number could vary fromwing a predictor, the process would repeat. In this examplecross conditions for each participant.
-100 0 100 200 300 400 500 600 700 800 900
-10
-5
0
5
10
Time (ms)
Vol
tage
(uV
)
Adults - Last Two Blocks of Trials
Oz) for the adult group, for first two blocks (left) and last two

b r a i n r e s e a r c h 1 5 9 7 ( 2 0 1 5 ) 9 5 – 1 0 7 97
development of ISL, especially in the visual modality. Even lessis known about the development of the underlying neurobiolo-gical mechanisms that support such learning.
To investigate the neural mechanisms of ISL acrossdevelopment, the event related potential (ERP) technique isadvantageous because it provides a direct neurophysiologicalmeasure of learning, making it potentially more sensitive toimplicit (unconscious) learning mechanisms compared tobehavioral measures. ERP also provides a precise temporalprofile of neural information processing, which can revealeffects that other neuroscience techniques such as fMRIcannot. Only a handful of previous studies has used ERPs toinvestigate ISL in adults (Abla et al., 2008; Christiansen et al.,2012; Sanders et al., 2002). One ERP component that appearsto be associated with the acquisition of statistical sequential
-100 0 100 200 300 400 500 600 700 800 900
-10
-5
0
5
10
Time (ms)
Vol
tage
(uV
)
-100 0 100 200 300 40
-10
-5
0
5
10
Tim
Vol
tage
(uV
)
-100 0 100 200 300 400 500 600 700 800 900
-10
-5
0
5
10
Time (ms)
Vol
tage
(uV
)
-100 0 100 200 300 40
-10
-5
0
5
10
Tim
Vol
tage
(uV
)
-100 0 100 200 300 400 500 600 700 800 900
-10
-5
0
5
10
Time (ms)
Vol
tage
(uV
)
-100 0 100 200 300 40
-10
-5
0
5
10
Time
Vol
tage
(uV
)
Zero ProbabilityHigh ProbabilityLow Probability
LAn FRz
LCn CNz
LPo POz
Fig. 3 – Waveform distribution for the first two blocks for the adusensors together at nine different regions, uniformly distributed
patterns is the P300, a positive deflection in voltage potentialthat occurs approximately 300 ms after the presentation of astimulus and may be a correlate of context-updating andstimulus discrimination (Patel and Azzam, 2005; Eimer et al.,1996; Ferdinand, Mecklinger et al., 2008; Schlaghecken et al.,2000). The P300 component has been suggested to reflectstimulus-evaluation processes (Rüsseler and Roesler, 2000),specifically the evaluation of incoming information and theupdating of contextual representations (Ferdinand et al.,2008). Verleger (1988) has suggested interpreting the P300 asa correlate of “context closure”. This slightly more nuancedview of the context updating interpretation hypothesizes thatthe P300 is evoked by predictable, awaited events in highlystructured tasks as subjects learn to associate and chunkadjacent elements.
0 500 600 700 800 900
e (ms)
-100 0 100 200 300 400 500 600 700 800 900
-10
-5
0
5
10
Time (ms)
Vol
tage
(uV
)
0 500 600 700 800 900
e (ms)
-100 0 100 200 300 400 500 600 700 800 900
-10
-5
0
5
10
Time (ms)
Vol
tage
(uV
)
0 500 600 700 800 900
(ms)
-100 0 100 200 300 400 500 600 700 800 900
-10
-5
0
5
10
Time (ms)
Vol
tage
(uV
)
RAn
RCn
RPo
lt group. Regions of interest were created by averaging sets ofacross the scalp, as shown in Fig. 2.

b r a i n r e s e a r c h 1 5 9 7 ( 2 0 1 5 ) 9 5 – 1 0 798
Even fewer studies have investigated the ERP correlates ofISL in infants or children (e.g., Teinonen et al., 2009) and toour knowledge, no single study has used ERP to directlycompare such learning across different ages. Thus, in orderto investigate the neurodevelopment of ISL, we developed anovel ERP paradigm that is conducive for use with both adultsand children. The task involved viewing a stream of visualstimuli containing covert statistical patterns governing theprobability of a target stimulus’ appearance (see Fig. 1). ERPresponses to three different types of stimuli (a high-probability predictor, a low-probability predictor, and azero-probability predictor) that reflected differing transitionalprobabilities for three groups of participants (adults, olderchildren, and younger children) were compared. To ascertainhow much exposure to the task was required before learning
-100 0 100 200 300 400 500 600 700 800 900
-10
-5
0
5
10
Time (ms)
Vol
tage
(uV
)
-100 0 100 200 300 4
-10
-5
0
5
10
Tim
Vol
tage
(uV
)
-100 0 100 200 300 400 500 600 700 800 900
-10
-5
0
5
10
Time (ms)
Vol
tage
(uV
)
-100 0 100 200 300 4
-10
-5
0
5
10
Tim
Vol
tage
(uV
)
-100 0 100 200 300 400 500 600 700 800 900
-10
-5
0
5
10
Time (ms)
Vol
tage
(uV
)
-100 0 100 200 300 4
-10
-5
0
5
10
Tim
Vol
tage
(uV
)
Zero ProbabilityHigh ProbabilityLow Probability
LAn FRz
LCn CNz
LPo POz
Fig. 4 – Waveform distribution for the
occurred, we compared ERP responses elicited early in thetask versus later in the task.
2. Results
2.1. ERP results for adults
Fig. 2 shows the grand averaged centro-parietal ERP wave-forms for the adults, time-locked to each of the threepredictor types, for the first two blocks (left) and last twoblocks (right) of the experiment. Visual inspection suggeststhat there are no clear differences between waveforms in thefirst two blocks of the experiment. On the other hand, in thelast two blocks, there is a prominent late positivity – similar
00 500 600 700 800 900
e (ms)
-100 0 100 200 300 400 500 600 700 800 900
-10
-5
0
5
10
Time (ms)
Vol
tage
(uV
)
00 500 600 700 800 900
e (ms)
-100 0 100 200 300 400 500 600 700 800 900
-10
-5
0
5
10
Time (ms)
Vol
tage
(uV
)
00 500 600 700 800 900
e (ms)
-100 0 100 200 300 400 500 600 700 800 900
-10
-5
0
5
10
Time (ms)
Vol
tage
(uV
)
RAn
RCn
RPo
last two blocks for the adult group.

b r a i n r e s e a r c h 1 5 9 7 ( 2 0 1 5 ) 9 5 – 1 0 7 99
in appearance to a P300 component – that is associated withthe high-probability predictor condition specifically. Figs. 3and 4 show the waveform distributions across the entirescalp for the first two and last two blocks, respectively.
In order to verify visual inspection, a 9 (region) x 3(predictor) x 2 (block) repeated measures ANOVA was con-ducted using mean amplitude waveforms as the dependentvariable, and the factors of region of interest (nine sensorsites distributed symmetrically across the array), predictortype (high-, low-, and zero-probability predictor conditions),and block (first two blocks vs. last two blocks). A 300–600 mstime window was selected to examine the P300 componentfor the adult participants. The Greenhouse-Geisser correctionfor nonsphericity of variance was applied in the calculation ofreported p values for all ERP analyses reported.
The 9x3�2 ANOVA found a significant main effect forregion (F(2, 62)¼15.22, po.001, η2p¼ .559). The interactions ofregion x predictor (F(4, 43)¼5.87, p¼ .001, η2p¼ .328) and regionx block (F(3, 37)¼5.27, p¼ .004, η2p¼ .305) were also statisticallysignificant. Importantly, pairwise comparisons in the POzregion indicated significant differences between the high-versus low-probability predictor (t(12)¼3.53, p¼ .004, r¼ .484)and the high- versus zero-probability predictor conditions(t(12)¼4.58, p¼ .001, r¼ .626) in the last two blocks. Thishighlights the presence of a P300-like component in the adultdata during the last two, but not the first two, blocks.
In sum, the adult ERP data suggests that ISL – learning thatthe high-probability predictor was a reliable predictor of thetarget – was reflected by a P300-like component that occurredin the last two blocks of the experiment.
2.2. ERP results for older children
Fig. 5 shows the grand averaged ERP waveforms for the olderchildren. Visual inspection suggests that the last two blocks lookvery similar to the adults as there is a P300-like late positivityassociated with the high-probability predictor condition. Due tothe apparent latency of waveform onset, a time window of 400–700ms was chosen for both groups of children for purposes ofanalysis. Figs. 6 and 7 show the waveform distributions across
-100 0 100 200 300 400 500 600 700 800 900
-10
-5
0
5
10
Time (ms)
Vol
tage
(uV
)
Older Children - First Two Blocks of Trials
Zero ProbabilityHigh ProbabilityLow Probability
Fig. 5 – ERP waveforms in the centro-parietal region (POz) for the(right).
the entire scalp for the first two and last two blocks of theexperiment, respectively.
A 9x3�2 repeated measures ANOVA was conducted forthe 400–700 ms latency period as was done with the adults.The ANOVA found a marginal main effect for region(F(1, 19)¼3.66, p¼ .058, η2p¼ .220). The interaction of region xpredictor was significant (F(4, 53)¼4.10, p¼ .005, η2p¼ .240). Arelevant significant difference was found in the last twoblocks between the high- and low-probability predictor con-ditions (t(13)¼2.78, p¼ .016, r¼ .301), although the effect didnot obtain for the comparison between the high- and zero-probability predictors in the last two blocks. These resultsdemonstrate the adult-like appearance of a P300 componentin the older child group by the end of the experiment.
These ERP data present neurophysiological evidence thatjust like the adults, older children exhibited a P300-likecomponent that was elicited by the end of the experimentfor the high-probability predictor condition, suggesting thatlearning did occur.
2.3. ERP effects for younger children
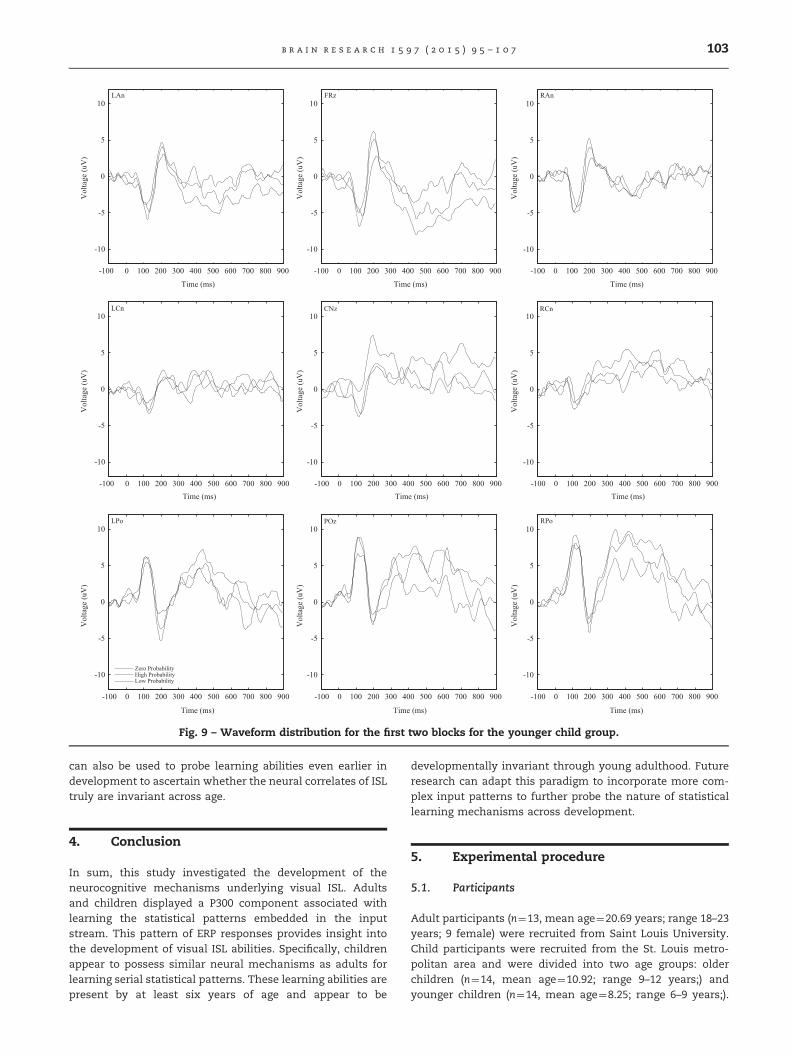
Fig. 8 shows the grand averaged ERP waveforms for theyounger children. Visual inspection suggests that similar toboth the adults and older children, there is a P300-likecomponent in the last two blocks associated with the highpredictor condition. Figs. 9 and 10 show the waveformdistribution across the scalp in the first two and last twoblocks, respectively.
To verify the visual inspection, a 9x3�2 repeated mea-sures ANOVA was conducted for the 400–700 ms latencyperiod as before. The ANOVA found a marginal main effectfor region (F(1, 19)¼3.55, p¼ .06, η2p¼ .214). The interaction ofregion x predictor was significant (F(2, 29)¼3.72, p¼ .033,η2p¼ .223). The high-predictor was significantly different fromthe low-predictor (t(13)¼2.56, p¼ .024, r¼ .243) and the zero-predictor (t(13)¼2.43, p¼ .03, r¼ .223) in the last two blocks,but not in the first two blocks, suggesting that the P300-likecomponent did not emerge until the end of the experiment.
In sum, like the adults and older children, the youngerchildren displayed a P300-like component that was evoked by
-100 0 100 200 300 400 500 600 700 800 900
-10
-5
0
5
10
Time (ms)
Vol
tage
(uV
)
Older Children - Last Two Blocks of Trials
older child group, for first two blocks (left) and last two blocks

-100 0 100 200 300 400 500 600 700 800 900
-10
-5
0
5
10
Time (ms)
Vol
tage
(uV
)V
olta
ge (u
V)
Vol
tage
(uV
)
Vol
tage
(uV
)V
olta
ge (u
V)
Vol
tage
(uV
)
Vol
tage
(uV
)V
olta
ge (u
V)
Vol
tage
(uV
)
-100 0 100 200 300 400 500 600 700 800 900
-10
-5
0
5
10
Time (ms)-100 0 100 200 300 400 500 600 700 800 900
-10
-5
0
5
10
Time (ms)
-100 0 100 200 300 400 500 600 700 800 900
-10
-5
0
5
10
Time (ms)
-100 0 100 200 300 400 500 600 700 800 900
-10
-5
0
5
10
Time (ms)
-100 0 100 200 300 400 500 600 700 800 900
-10
-5
0
5
10
Time (ms)
-100 0 100 200 300 400 500 600 700 800 900
-10
-5
0
5
10
Time (ms)
-100 0 100 200 300 400 500 600 700 800 900
-10
-5
0
5
10
Time (ms)
-100 0 100 200 300 400 500 600 700 800 900
-10
-5
0
5
10
Time (ms)
Zero ProbabilityHigh ProbabilityLow Probability
LAn FRz RAn
LCn CNz RCn
LPo POz RPo
Fig. 6 – Waveform distribution for the first two blocks for the older child group.
b r a i n r e s e a r c h 1 5 9 7 ( 2 0 1 5 ) 9 5 – 1 0 7100
the high-probability predictor and emerged only in the lasttwo blocks of the experiment.
2.4. Between groups analysis of ERP data
To compare the ERP correlates of statistical learning acrossthe three age groups (n¼41), we computed difference wavesbetween the high- and low-probability predictors as well asbetween the high- and zero-probability predictors for each ofthe three participant groups. We then submitted the differ-ence waves to a 9 (region) x 2 (difference wave type) x 2(block) x 3 (group) repeated measures ANOVA, with the agegroup included as a between subjects factor. The timewindows used for each group in the previous sets of analyseswere conserved. Conducting this analysis on the difference
waves rather than the mean amplitude waveforms serves asa way to normalize potential group differences in overallwaveform amplitudes.
The results revealed a main effect for region (F(2, 68)¼11.12, po.001, η2p¼ .226). The interaction of region x block wasalso significant (F(3, 114)¼3.84, p¼ .012, η2p¼ .092). Critically,the test of between subjects’ effects indicated a null result(F(2, 38)¼1.46, p¼ .244, η2p¼ .071).
3. Discussion
The present study sought to explore the neurodevelopmentof visual ISL using a novel paradigm in conjunction with ERP.The task was a modification of the standard “odd-ball”

-100 0 100 200 300 400 500 600 700 800 900
-10
-5
0
5
10
Time (ms)
Vol
tage
(uV
)V
olta
ge (u
V)
Vol
tage
(uV
)
Vol
tage
(uV
)V
olta
ge (u
V)
Vol
tage
(uV
)
Vol
tage
(uV
)V
olta
ge (u
V)
Vol
tage
(uV
)
-100 0 100 200 300 400 500 600 700 800 900
-10
-5
0
5
10
Time (ms)-100 0 100 200 300 400 500 600 700 800 900
-10
-5
0
5
10
Time (ms)
-100 0 100 200 300 400 500 600 700 800 900
-10
-5
0
5
10
Time (ms)-100 0 100 200 300 400 500 600 700 800 900
-10
-5
0
5
10
Time (ms)-100 0 100 200 300 400 500 600 700 800 900
-10
-5
0
5
10
Time (ms)
-100 0 100 200 300 400 500 600 700 800 900
-10
-5
0
5
10
Time (ms)
-100 0 100 200 300 400 500 600 700 800 900
-10
-5
0
5
10
Time (ms)
-100 0 100 200 300 400 500 600 700 800 900
-10
-5
0
5
10
Time (ms)
Zero ProbabilityHigh ProbabilityLow Probability
LAn FRz RAn
LCn CNz RCn
LPo POz RPo
Fig. 7 – Waveform distribution for the last two blocks for the older child group.
b r a i n r e s e a r c h 1 5 9 7 ( 2 0 1 5 ) 9 5 – 1 0 7 101
paradigm that has been used extensively in ERP research(Huettel and McCarthy, 2004). However, instead of measuringERPs to the appearance of a target stimulus, this newparadigm allowed us to investigate the ERP waveformselicited in response to the occurrence of stimuli that pre-dicted the target with varying probabilities. This allowed us toprobe the neural responses in relation to learning simplesequential statistics embedded within the serial inputstream. Advantages of this design are that it is a relativelysimple task and thus amenable to use with children, it allowsan online measure of learning by comparing learning effectsat the beginning versus the ending of the task, and it can beeasily “scaled up” in future studies by making the predictivestatistics more complex.
The neurophysiological findings revealed that all three agegroups (adults, older children 9–12 years old, and younger
children 6–9 years old) displayed a late positivity in thecentro-parietal region in response to the presentation of thehigh-probability predictor. The timing and topography of thiswaveform appear similar to the classic P300 component. TheP300 is thought to be an index of target detection andevaluation (Van Zuijen et al., 2006), and also has been elicitedin other types of ISL and sequence learning tasks (Baldwinand Kutas, 1997; Carrión and Bly, 2007; Rüsseler et al., 2003).This component was observed primarily during the last twoblocks of trials, but not during the first two, suggesting thatduring the course of the experiment, participants graduallylearned the statistical regularities governing the occurrenceof the target, and only showed neural-related correlates oflearning after a sufficient amount of exposure. In effect, thepresence of the P300, normally elicited by the appearance ofan infrequent target during the standard oddball task, was

-100 0 100 200 300 400 500 600 700 800 900
-10
-5
0
5
10
Time (ms)
Volt
age
(uV
)
-100 0 100 200 300 400 500 600 700 800 900
-10
-5
0
5
10
Time (ms)
Volt
age
(uV
)
Younger Children - First Two Blocks of Trials Younger Children - Last Two Blocks of Trials
Zero ProbabilityHigh ProbabilityLow Probability
Fig. 8 – ERP waveforms in the centro-parietal region (POz) for the younger child group, for first two blocks (left) and last twoblocks (right).
b r a i n r e s e a r c h 1 5 9 7 ( 2 0 1 5 ) 9 5 – 1 0 7102
“shifted” earlier in the input stream so that it was elicitedfollowing the appearance of a stimulus that predicted thetarget with a high probability. To put it another way, follow-ing sufficient exposure to the statistical patterns, the partici-pants’ brains treated a stimulus that predicted the targetsimilarly to the target itself, evidence of learning the pre-dictive association between the two stimuli. This interpreta-tion is consistent with the “context closure” interpretation ofthe P300 component that suggests that the P300 reflects atype of grouping or chunking operation (Verleger, 1988). Thatis, participants appeared to form an associative “chunk”between the high-probability predictor and the target stimu-lus, based on the strength of the underlying statisticalassociation between the two stimuli. Importantly, the P300for the high-probability predictor was elicited even thoughthe three predictors were perfectly equated in terms of theirfrequency of occurrence.
A comparison of the ERP differences revealed no signifi-cant differences across age groups. This striking similarity inERP waveforms in children and adults suggests that visual ISLmight be developmentally invariant, an idea originally pro-posed by Reber for implicit learning skills more generally(Reber, 1993). Reber proposed that implicit learning wasphylogenetically old (as compared to declarative memory,for example), and argued that therefore it is a robustmechanism characterized by invariance across developmentand across species. The present findings appear to supportReber's claim; however, before settling on this conclusion, afew caveats must be considered.
First, although we detected no group differences in the ERPresponses, a null effect must, of course, be treated withcaution. Null effects with ERP findings in particular aredifficult to interpret because it is possible that there areeffects in the brain that the ERP recordings are not able todetect (Otten and Rugg, 2005). Second, it is possible, given therelatively simple statistical probabilities used in this task thatneurodevelopmental differences do exist but only with morecomplex types of input patterns. Third, it is possible thatdevelopmental differences might be more apparent in chil-dren younger than that used in the current study.
In contrast to the present findings, three other recentstudies in fact have shown precocious learning abilities earlyin development. McNealy et al. (2011) found that youngerchildren (5–7 years old) showed greater neural activation toweak statistical cues governing a novel stream of nonsensesyllables, compared to older children (9–10 and 12–13 yearolds) and adults. Similarly, Johnson and Wilbrecht (2011)found that juvenile mice required fewer trials than adultmice to reach criterion on a 4-choice reversal task, reflectingwhat the authors regarded as more efficient and more flexiblelearning abilities. Finally, using an implicit sequence learningtask, Janacsek et al. (2012) found that children younger than12 years old showed better learning compared to olderchildren and adults. Clearly, it would seem advantageousfor organisms to possess neural mechanisms that are highlyadept at learning environmental patterns. Individual differ-ences in visual ISL abilities have been shown to be associatedwith language processing skill in infants (Shafto et al., 2012),children (Conway et al., 2011), and adults (Conway et al., 2010;Misyak et al., 2010). Thus, having efficient information pro-cessing mechanisms for detecting statistical patterns early indevelopment could help explain why young children are ableto learn natural language so effectively.
Although the present findings do not establish develop-mental differences in ISL, they do point to adult-like levels ofproficiency relatively early in development. The robust visualstatistical learning skills that we observed in both groups ofchildren are consistent with other research showing thatchildren are highly skilled at learning structured statisticalpatterns in the environment (Fiser and Aslin, 2002; Kirkhamet al., 2002; Saffran et al., 1996). The present findings are alsoconsistent with Reber's (1993) claim of developmental invar-iance for implicit learning, suggesting that these learningmechanisms are highly conserved and may have a relativelyold evolutionary origin. Future research determining theparticipants’ awareness of the patterns underlying sequencessuch as those found in this study may be important, as thereis increasing interest in understanding the manner in whichexplicit instruction and/or conscious awareness interactswith ISL (Arciuli et al., 2014). Using tasks such as this one
-100 0 100 200 300 400 500 600 700 800 900
-10
-5
0
5
10
Time (ms)
Vol
tage
(uV
)V
olta
ge (u
V)
Vol
tage
(uV
)
-100 0 100 200 300 400 500 600 700 800 900
-10
-5
0
5
10
Time (ms)
-100 0 100 200 300 400 500 600 700 800 900
-10
-5
0
5
10
Time (ms)
-100 0 100 200 300 400 500 600 700 800 900
-10
-5
0
5
10
Time (ms)-100 0 100 200 300 400 500 600 700 800 900
-10
-5
0
5
10
Time (ms)-100 0 100 200 300 400 500 600 700 800 900
-10
-5
0
5
10
Time (ms)
-100 0 100 200 300 400 500 600 700 800 900
-10
-5
0
5
10
Time (ms)
-100 0 100 200 300 400 500 600 700 800 900
-10
-5
0
5
10
Time (ms)
-100 0 100 200 300 400 500 600 700 800 900
-10
-5
0
5
10
Time (ms)
Zero ProbabilityHigh ProbabilityLow Probability
LAn FRz RAn
LCn CNz RCn
LPo POz RPo
Vol
tage
(uV
)V
olta
ge (u
V)
Vol
tage
(uV
)
Vol
tage
(uV
)V
olta
ge (u
V)
Vol
tage
(uV
)
Fig. 9 – Waveform distribution for the first two blocks for the younger child group.
b r a i n r e s e a r c h 1 5 9 7 ( 2 0 1 5 ) 9 5 – 1 0 7 103
can also be used to probe learning abilities even earlier indevelopment to ascertain whether the neural correlates of ISLtruly are invariant across age.
4. Conclusion
In sum, this study investigated the development of theneurocognitive mechanisms underlying visual ISL. Adultsand children displayed a P300 component associated withlearning the statistical patterns embedded in the inputstream. This pattern of ERP responses provides insight intothe development of visual ISL abilities. Specifically, childrenappear to possess similar neural mechanisms as adults forlearning serial statistical patterns. These learning abilities arepresent by at least six years of age and appear to be
developmentally invariant through young adulthood. Futureresearch can adapt this paradigm to incorporate more com-plex input patterns to further probe the nature of statisticallearning mechanisms across development.
5. Experimental procedure
5.1. Participants
Adult participants (n¼13, mean age¼20.69 years; range 18–23years; 9 female) were recruited from Saint Louis University.Child participants were recruited from the St. Louis metro-politan area and were divided into two age groups: olderchildren (n¼14, mean age¼10.92; range 9–12 years;) andyounger children (n¼14, mean age¼8.25; range 6–9 years;).

-100 0 100 200 300 400 500 600 700 800 900
-10
-5
0
5
10
Time (ms)
Vol
tage
(uV
)
-100 0 100 200 300 400 500 600 700 800 900
-10
-5
0
5
10
Time (ms)V
olta
ge (u
V)
-100 0 100 200 300 400 500 600 700 800 900
-10
-5
0
5
10
Time (ms)
Vol
tage
(uV
)
-100 0 100 200 300 400 500 600 700 800 900
-10
-5
0
5
10
Time (ms)
Vol
tage
(uV
)
-100 0 100 200 300 400 500 600 700 800 900
-10
-5
0
5
10
Time (ms)
Vol
tage
(uV
)
-100 0 100 200 300 400 500 600 700 800 900
-10
-5
0
5
10
Time (ms)
Vol
tage
(uV
)
-100 0 100 200 300 400 500 600 700 800 900
-10
-5
0
5
10
Time (ms)
Vol
tage
(uV
)
-100 0 100 200 300 400 500 600 700 800 900
-10
-5
0
5
10
Time (ms)
Vol
tage
(uV
)
-100 0 100 200 300 400 500 600 700 800 900
-10
-5
0
5
10
Time (ms)
Vol
tage
(uV
)
Zero ProbabilityHigh ProbabilityLow Probability
LAn FRz RAn
LCn CNz RCn
LPo POz RPo
Fig. 10 – Waveform distribution for the last two blocks for the younger child group.
b r a i n r e s e a r c h 1 5 9 7 ( 2 0 1 5 ) 9 5 – 1 0 7104
All participants (or their parents) self-reported no cognitive,neurological, or psychological conditions. Participants werecompensated monetarily.
5.2. Experimental paradigm
The ISL task involved participants viewing a continuousstream of colored circles appearing in the center of themonitor, one circle at a time (Fig. 1). Participants were toldto press a keypad whenever a target color appeared. Thetarget was predictable to varying degrees by the color of thecircle immediately preceding it. Each trial consisted of at leastone and at most five “filler” circles, followed by one of three“predictor” circles, and then the possible appearance of thetarget. Filler circles were included so that the degree of targetpredictability could vary between predictor conditions while
allowing for a continuous task structure. When the high-probability predictor appeared, the target and filler followed90% and 10% of the time, respectively. When the low-probability predictor appeared, the target and filler followed20% and 80% of the time, respectively. When the zero-probability predictor appeared, the target never followed.After the presentation of the predictor/target pair, the nexttrial began immediately with one to five filler circles preced-ing the appearance of the next predictor. The assignment ofcolors (red, blue, green, brown, white) to the three predictors,fillers, and target was determined randomly for eachparticipant.
Each circle was presented on-screen for 500 ms on a blackbackground, followed by an empty black screen for 500 ms.There were 50 trials of each predictor (for a total of 150 trials),which were divided into five blocks of 30 trials each (10 trials
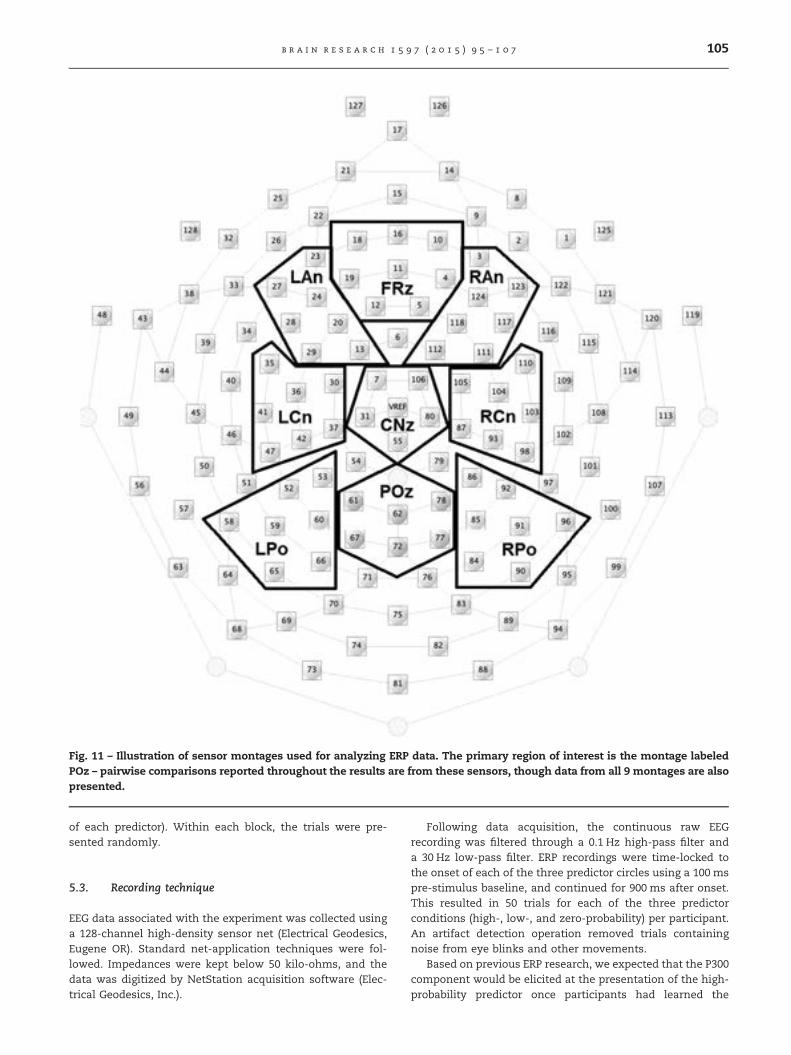
Fig. 11 – Illustration of sensor montages used for analyzing ERP data. The primary region of interest is the montage labeledPOz – pairwise comparisons reported throughout the results are from these sensors, though data from all 9 montages are alsopresented.
b r a i n r e s e a r c h 1 5 9 7 ( 2 0 1 5 ) 9 5 – 1 0 7 105
of each predictor). Within each block, the trials were pre-sented randomly.
5.3. Recording technique
EEG data associated with the experiment was collected usinga 128-channel high-density sensor net (Electrical Geodesics,Eugene OR). Standard net-application techniques were fol-lowed. Impedances were kept below 50 kilo-ohms, and thedata was digitized by NetStation acquisition software (Elec-trical Geodesics, Inc.).
Following data acquisition, the continuous raw EEGrecording was filtered through a 0.1 Hz high-pass filter anda 30 Hz low-pass filter. ERP recordings were time-locked tothe onset of each of the three predictor circles using a 100 mspre-stimulus baseline, and continued for 900 ms after onset.This resulted in 50 trials for each of the three predictorconditions (high-, low-, and zero-probability) per participant.An artifact detection operation removed trials containingnoise from eye blinks and other movements.
Based on previous ERP research, we expected that the P300component would be elicited at the presentation of the high-probability predictor once participants had learned the

b r a i n r e s e a r c h 1 5 9 7 ( 2 0 1 5 ) 9 5 – 1 0 7106
statistical association between each predictor and the target.As this component appears in the centro-parietal region ofthe scalp, this is where we focused our analyses, using amontage of the six sensors closest to where the POz electrodeis positioned in the 10–20 system (see Fig. 11).
Acknowledgments
We wish to thank A. Abegg, J. Anthony, K. Corkery, M. Dubal, J.Hedrick, F. Manzella, S. Sheldon, H. Tsujimura, and B. Winebrightfor their help with this project.
This study was supported by a grant from the NationalInstitute on Deafness and Other Communication Disorders:R01DC012037.
r e f e r e n c e s
Abla, D., Katahira, K., Okanoya, K., 2008. On-line assessment ofstatistical learning by event-related potentials. J. CognitiveNeurosci. 20, 952–964.
Amso, D., Davidow, J., 2012. The development of implicit learningfrom infancy to adulthood: item frequencies, relations, andcognitive flexibility. Dev. Psychobiol. 54 (6), 664–673.
Arciuli, J., Torkildsen, J.K., Stevens, D.J., Simpson, I.C., 2014.Statistical learning under incidental versus intentionalconditions. Front. Psychol. 5, 747.
Baldwin, K.B., Kutas, M., 1997. An ERP analysis of implicitstructured sequence learning. Psychophysiology 34, 74–86.
Barry, E., 2007. Does conceptual implicit memory develop? Therole of processing demands. J. Genet. Psychol. 168 (1), 19–36.
Carrion, R.E., Bly, B.M., 2007. Event-related potential markers ofexpectation violation in an artificial grammar learning task.NeuroReport 18, 191–195.
Christiansen, M.H., Conway, C.M., Onnis, L., 2012. Similar neuralcorrelates for language and sequential learning: evidencefrom event-related brain potentials. Lang. Cognitive Proc. 27,231–256.
Cleeremans, A., Destrebecqz, A., Boyer, M., 1998. Implicitlearning: news from the front. Trends Cogn. Sci. 2, 406–416.
Conway, C.M., Bauernschmidt, A., Huang, S.S., Pisoni, D.B., 2010.Implicit statistical learning in language processing: wordpredictability is the key. Cognition 114, 356–371.
Conway, C.M., Christiansen, M.H., 2006. Statistical learningwithin and between modalities: pitting abstract againststimulus-specific representations. Psychol. Sci. 17, 905–912.
Conway, C.M., Ellefson, M.R., Christiansen, M.H., 2003. When lessis less and when less is more: starting small with stagedinput. Lawrence Erlbaum, Mahwah, NJ810–815 (Proceedings ofthe Twenty Fifth Annual Conference of the Cognitive ScienceSociety.).
Conway, C.M., Pisoni, D.B., Anaya, E.M., Karpicke, J., Henning,S.C., 2011. Implicit sequence learning in deaf children withcochlear implants. Dev. Sci. 14, 69–82.
Eimer, M., Goschke, T., Schlaghecken, F., Stuermer, B., 1996.Explicit and implicit learning of event sequences: evidencefrom event-related brain potentials. J. Exp. Psychol. Learn. 22(4), 970–987.
Elman, J.L., 1993. Learning and development in neural networks:the importance of starting small. Cognition 48, 71–99.
Ferdinand, N., Mecklinger, A., Kray, J., 2008. Error and devianceprocessing in implicit and explicit sequence learning. J.Cognitive Neurosci. 20 (4), 629–642.
Fiser, J., Aslin, R.N., 2002. Statistical learning of new visual featurecombinations by infants. P. Natl. Acad. Sci. 99, 15822–15826.
Huettel, S., McCarthy, G., 2004. What is odd about the odd-balltask? Prefrontal cortex is activated by dynamic changes inresponse strategy. Neuropsychologia 42, 379–386.
Janacsek, K., Fiser, J., Nemeth, D., 2012. The best time to acquirenew skills: age-related differences in implicit sequencelearning across the human lifespan. Dev. Sci. 15, 496–505.
Johnson, C., Wilbrecht, L., 2011. Juvenile mice show greaterflexibility in multiple choice reversal learning than adults.Dev. Cognitive Neurosci. 1, 540–551.
Kirkham, N.Z., Slemmer, J.A., Johnson, S.P., 2002. Visual statisticallearning in infancy: evidence for a domain-general learningmechanism. Cognition 83, B35–B42.
Lieberman, M.D., 2000. Intuition: a social cognitive neuroscienceapproach. Psychol. Bull. 126, 109–137.
McNealy, K., Mazziota, J., Dapretto, M., 2010. The neural basis ofspeech parsing in children and adults. Dev. Sci. 13 (2), 385–406.
Mecklenbrauker, S., Hupbach, A., Wippich, W., 2003. Age-relatedimprovements in a conceptual implicit memory test. Mem.Cognition 31 (8), 1208–1217.
Misyak, J.B., Christiansen, M.H., Tomblin, J.B., 2010. Sequentialexpectations: the role of prediction-based learning inlanguage. Top. Cognitive Sci. 2, 138–153.
Newport, E.L., 1990. Maturational constraints on languagelearning. Cognitive Sci. 14, 11–28.
Otten, L.J., Rugg, M.D., 2005. Interpreting event-related brainpotentials. In: Handy, T.C. (Ed.), Event-Related Potentials: AMethods Handbook. MIT Press, Cambridge, MA, pp. 3–16.
Patel, S.H., Azzam, P.N., 2005. Characterization of N200 and P300:Selected studies of the event related potential. Int. J. Med. Sci.2, 147–154.
Perruchet, P., Pacton, S., 2006. Implicit learning and statisticallearning: one phenomenon, two approaches. Trends Cogn. Sci.10, 233–238.
Reber, A.S., 1993. Implicit Learning and Tacit Knowledge An Essay onthe Cognitive Unconscious. Oxford University Press, New York.
Robertson, E.M., 2007. The serial reaction time task: implicitmotor skill learning?. J. Neurosci. 27, 10073–10075.
Russeler, J., Hennighausen, E., Munte, T.F., Rosler, F., 2003.Differences in incidental and intentional learning ofsensorimotor sequences as revealed by event-related brainpotentials. Cognitive Brain Res. 15, 116–126.
Russeler, J., Roesler, F., 2000. Implicit and explicit learning ofevent sequences: Evidence for distinct coding of perceptualand motor representations. Acta Psychol. 104, 45–67.
Saffran, J.R., 2003. Statistical language learning: mechanisms andconstraints. Curr. Dir. Psychol. Sci. 12, 110–114.
Saffran, J.R., Aslin, R.N., Newport, E.L., 1996. Statistical learningby 8-month-old infants. Science 274, 1926–1928.
Saffran, J.R., Thiessen, E.D., 2007. Domain-general learningcapacities. In: Hoff, E., Shatz, M. (Eds.), Handbook of LanguageDevelopment. Blackwell, Cambridge, pp. 68–86.
Sanders, L.D., Newport, E.L., Neville, H.J., 2002. Segmentingnonsense: an event-related potential index of perceivedonsets in continuous speech. Nat. Neurosci. 5, 700–703.
Schlaghecken, F., Stuermer, B., Eimer, M., 2000. Chunkingprocesses in the learning of event sequences:electrophysiological indicators. Mem. Cognition 28 (5),821–831.
Shafto, C.L., Conway, C.M., Field, S.L., Houston, D.M., 2012. Visualsequence learning in infancy: domain-general and domain-specific associations with language. Infancy 17 (3), 247–271.
Teinonen, T., Fellman, V., Naatanen, R., Alku, P., Huotilainen, M.M., 2009. Statistical language learning in neonates revealed byevent-related brain potentials. BMC Neurosci. 10 (1), 21.
Thomas, K., Hunt, R., Vizueta, N., Sommer, T., Durston, S., Yang, Y.,Worden, M.S., 2004. Evidence of developmental differences inimplicit sequence learning: an fMRI study of children andadults. J. Cognitive Neurosci. 16 (8), 1339–1351.

b r a i n r e s e a r c h 1 5 9 7 ( 2 0 1 5 ) 9 5 – 1 0 7 107
Turk-Browne, N.B., Scholl, B.J., Johnson, M.K., Chun, M.M., 2010.
Implicit perceptual anticipation triggered by statistical
learning. J. Neurosci. 30, 11177–11187.Van Zuijen, T., Simoens, V., Paavilainen, P., Naatanen, R.,
Tervaniemi, M., 2006. Implicit, intuitive, and explicit
knowledge of abstract regularities in a sound sequence: an
event-related brain potential study. J. Cognitive Neurosci. 18(8), 1292–1303.
Verleger, R., 1988. Event-related potentials and cognition: acritique of the context updating hypothesis and an alternativeinterpretation of P3. Behav. Brain Sci. 11 (3).