exploring heritability of functional brain networks …
TRANSCRIPT

EXPLORING HERITABILITY OF FUNCTIONAL BRAIN NETWORKS WITH INEXACTGRAPH MATCHING
Sofia Ira Ktena, Salim Arslan, Sarah Parisot, Daniel Rueckert
Biomedical Image Analysis Group, Imperial College London, UK
ABSTRACT
Data-driven brain parcellations aim to provide a more accu-rate representation of an individual’s functional connectivity,since they are able to capture individual variability that arisesdue to development or disease. This renders comparisons be-tween the emerging brain connectivity networks more chal-lenging, since correspondences between their elements arenot preserved. Unveiling these correspondences is of ma-jor importance to keep track of local functional connectivitychanges. We propose a novel method based on graph editdistance for the comparison of brain graphs directly in theirdomain, that can accurately reflect similarities between indi-vidual networks while providing the network element corre-spondences. This method is validated on a dataset of 116 twinsubjects provided by the Human Connectome Project.
Index Terms— functional brain connectivity, twin study,graph matching
1. INTRODUCTION
The extremely complex circuit of our central nervous sys-tem constitutes the primary means of information transmis-sion within the brain, and is responsible for different cognitivefunctions. Structural brain connectivity can be examined atthe macroscale to obtain a complete map of the neuroanatom-ical connections between brain regions, the so-called humanconnectome [1]. Functional connectivity, in turn, can be usedto explore the temporal dependency between neurophysiolog-ical events and expresses network behaviour underlying highlevel cognitive processes [2].
Individual differences in network topology of the connec-tome have previously been associated with heritable pheno-types such as intelligence [3], giving rise to questions regard-ing the heritability of network topology itself. Addressingthese questions would be a leap forward in understandingmechanisms through which genetic influences on brain mor-phology eventually contribute to human behaviour in healthand disease. In this context, twin designs have recently beenused to study the genetic influence on both structural [4, 5]and functional [6, 7, 8] brain connectivity. More specifically,Bohlken et al. [4] studied the extent to which genes shape thetopology of structural brain connectivity. They estimated a
significant heritability index for normalised clustering coeffi-cient and characteristic path length. A similar study [5] per-formed probabilistic tractography on healthy adults and ob-tained similarly significant heritability for global efficiencyand network strength. Global efficiency of functional net-works was also found to be under genetic control in [6], whileFu et al. [7] tried to gain insight into the genetic basis of rest-ing state networks (RSNs) with a voxelwise genetic analysis.Yang et al. [8] explored the heritability of intrinsic connec-tivity networks (ICNs) and found interactions between themto be mostly influenced by environmental factors, despite thefact that the activity of most ICNs is driven by genetic factors.
In all studies mentioned above, brain parcellations havebeen employed to construct lower dimensional graph rep-resentations of the brain networks. The delineation of dis-tinct brain regions is often based on information derivedfrom anatomical atlases or regions of interest reported inthe literature [9]. However, anatomical landmarks like thesulci and gyri might not necessarily align with functionalboundaries between brain regions, hence data-driven ap-proaches have also been used to parcellate the brain. Thesecan be group-based, ensuring correspondences between sub-jects, or tailored for individual subjects to account for inter-subject variability and discard the constraints of standardisedanatomy [10, 11]. In the latter case, however, correspon-dences across parcellations/subjects are not preserved, whileindividual networks might even entail a different numberof nodes. Thus, these methods require more sophisticatedapproaches for graph comparison than the standard networkmeasures used in the previous studies.
This problem is addressed in [12] by aligning the individ-ual connectivity matrices with simulated annealing to studythe differences in structural connectivity between age groups.However, this method does not account for any characteristicinformation of a region, other than its connectivity profile tothe rest of the brain. A graph kernel, which captures struc-tural, geometric and functional information, is used in [13]to evaluate similarity between graphs. Nevertheless, the lat-ter does not provide element correspondences of the networkscompared. In this work we propose a method based on graphedit distance to assess brain graph similarity and obtain el-ement correspondences between individual subject networksand show that it can successfully reflect genetic similarities.
arX
iv:1
703.
1006
2v1
[q-
bio.
NC
] 2
9 M
ar 2
017

Fig. 1: Parcellations of an individual’s left hemisphere ob-tained with k-means clustering (the contribution of rs-fMRItimeseries against spatial coordinates is c = 10, 50, 75, 100%from left to right, while the number of parcels remains thesame). The higher the contribution of rs-fMRI time series theless the smoothness and spatial contiguity of the parcels, i.e.parcels may be spatially scattered across the hemisphere.
2. METHODS
2.1. Dataset and preprocessing
The dataset used in this study is minimally preprocessed andprovided by the Human Connectome Project [14]. It con-sists of 50 healthy unrelated subjects, 66 female monozygotic(MZ) twins and 50 female dizygotic (DZ) twins. The avail-able data for each subject include two resting-state fMRI (rs-fMRI) sessions that are preprocessed to remove spatial arti-facts and distortions and are, finally, converted to a standard“grayordinate” space to facilitate cross-subject comparisons.Additionally, the time series for each grayordinate is denoisedand normalised to zero mean and unit variance.
2.2. Network construction
In order to obtain a network representation of an individ-ual’s functional brain connectivity, the network elements, i.e.nodes and edges, need to be defined. In this study, k-meansclustering is applied to the rs-fMRI data [15], in order to par-cellate the brain into N regions with distinct rs-fMRI acti-vation patterns. The number of parcels, N , may vary anddetermines the number of nodes within the network. The spa-tial coordinates can also be taken into account along with thefMRI time series during clustering. The effect of introduc-ing such spatial information on the parcellation is illustratedin Fig. 1. Subsequently, the average time series within eachparcel is used to represent the corresponding node. The con-nection strength between two nodes, namely the edge weight,is estimated from the partial correlation of the representativetime series, in order to discard the indirect functional connec-tions between two cortical regions.
2.3. Similarity estimates
1) Matrix alignment with simulated annealing (SA). Simu-lated annealing was used in [12] to align structural connec-tivity networks generated with random parcellations. It is a
anatomical labelsk-means parcellation functional network
fusiform
inferiorparie
tal
inferiorte
mporal
lateraloccipital
middletemporal
superiorparie
tal
label histogram
(a) (b) (c)
(d)
lateral occipital
middle temporal
inferiorparietal
fusiforminferior
temporal
Fig. 2: (a) Single-subject parcellation of an individual’s cor-tex with a parcel pi covering part of the occipital, temporaland parietal lobes highlighted. (b) Anatomical labels from theDesikan atlas for the same subject, with the boundary of theregion corresponding to pi outlined. (c) Functional networkwith nodes obtained using parcellation (a) and edge weightsestimated with partial correlation between the representativers-fMRI time series of the connected nodes; the node ni cor-responding to pi is highlighted with a gray color. (d) Anatom-ical label histogram for node ni.
commonly used method for multiple sequence alignment ofbiological sequences. In this approach, a series of node re-orderings is attempted in one of the adjacency matrices, inorder to find a better alignment that minimizes the distancemetric between the two matrices, which in this case is the ab-solute or square distance. Simulated annealing is a global op-timization technique which uses a “temperature factor” thatdetermines the rate at which reorderings take place and thelikelihood of each reordering. The implementation is basedon the matrix alignment function of the Brain ConnectivityToolbox (http://www.brain-connectivity-toolbox.net [16]).
2) Graph edit distance (GED). Graph edit distance is anon-negative function that evaluates the similarity betweentwo graphs directly in their domain G and is able to modelstructural network variations in an intuitive way. In order tocalculate the graph edit distance, the minimum cost edit paththat transforms one graph into another needs to be estimated.The total cost of this edit path is defined as the sum of all editoperations, which in this case might include node and edgeadditions, deletions and substitutions:
dGED(G,G′) = mino∈O
∑i
c(oi) (1)
where c(oi) is the cost of edit operation oi, o = (o1, . . . , ok)is an edit sequence from G to G′, and O the finite set of editsequences from G to G′.
Graph edit distance allows us to incorporate label infor-mation about the network elements in the distance estimate.In the proposed approach, the histogram of anatomical labelsof the voxels constituting a parcel is used to characterize eachnode (Fig. 2).
Edit costs. The costs of edit operations are defined asfollows: a cost of |eij | is used for inserting or deleting anedge of weight eij . The cost of node insertion or deletionis equal to the cost of insertion or deletion of all edges at-
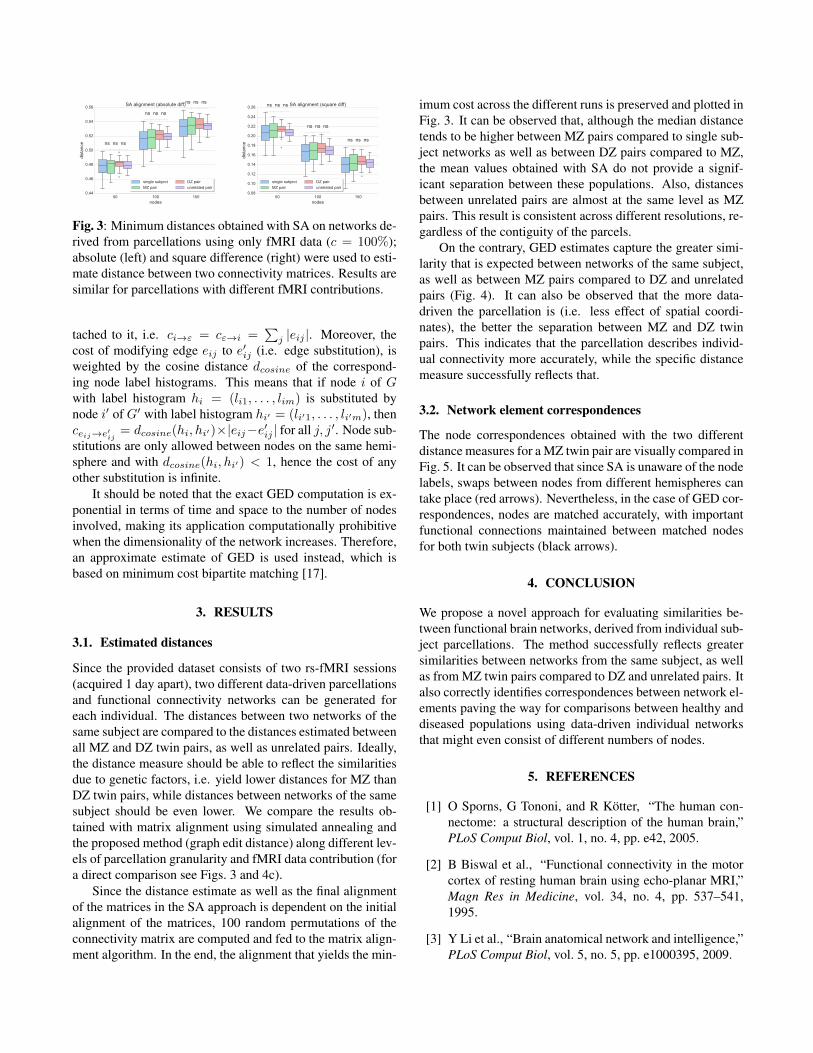
Fig. 3: Minimum distances obtained with SA on networks de-rived from parcellations using only fMRI data (c = 100%);absolute (left) and square difference (right) were used to esti-mate distance between two connectivity matrices. Results aresimilar for parcellations with different fMRI contributions.
tached to it, i.e. ci→ε = cε→i =∑
j |eij |. Moreover, thecost of modifying edge eij to e′ij (i.e. edge substitution), isweighted by the cosine distance dcosine of the correspond-ing node label histograms. This means that if node i of Gwith label histogram hi = (li1, . . . , lim) is substituted bynode i′ of G′ with label histogram hi′ = (li′1, . . . , li′m), thenceij→e′ij
= dcosine(hi, hi′)×|eij−e′ij | for all j, j′. Node sub-stitutions are only allowed between nodes on the same hemi-sphere and with dcosine(hi, hi′) < 1, hence the cost of anyother substitution is infinite.
It should be noted that the exact GED computation is ex-ponential in terms of time and space to the number of nodesinvolved, making its application computationally prohibitivewhen the dimensionality of the network increases. Therefore,an approximate estimate of GED is used instead, which isbased on minimum cost bipartite matching [17].
3. RESULTS
3.1. Estimated distances
Since the provided dataset consists of two rs-fMRI sessions(acquired 1 day apart), two different data-driven parcellationsand functional connectivity networks can be generated foreach individual. The distances between two networks of thesame subject are compared to the distances estimated betweenall MZ and DZ twin pairs, as well as unrelated pairs. Ideally,the distance measure should be able to reflect the similaritiesdue to genetic factors, i.e. yield lower distances for MZ thanDZ twin pairs, while distances between networks of the samesubject should be even lower. We compare the results ob-tained with matrix alignment using simulated annealing andthe proposed method (graph edit distance) along different lev-els of parcellation granularity and fMRI data contribution (fora direct comparison see Figs. 3 and 4c).
Since the distance estimate as well as the final alignmentof the matrices in the SA approach is dependent on the initialalignment of the matrices, 100 random permutations of theconnectivity matrix are computed and fed to the matrix align-ment algorithm. In the end, the alignment that yields the min-
imum cost across the different runs is preserved and plotted inFig. 3. It can be observed that, although the median distancetends to be higher between MZ pairs compared to single sub-ject networks as well as between DZ pairs compared to MZ,the mean values obtained with SA do not provide a signif-icant separation between these populations. Also, distancesbetween unrelated pairs are almost at the same level as MZpairs. This result is consistent across different resolutions, re-gardless of the contiguity of the parcels.
On the contrary, GED estimates capture the greater simi-larity that is expected between networks of the same subject,as well as between MZ pairs compared to DZ and unrelatedpairs (Fig. 4). It can also be observed that the more data-driven the parcellation is (i.e. less effect of spatial coordi-nates), the better the separation between MZ and DZ twinpairs. This indicates that the parcellation describes individ-ual connectivity more accurately, while the specific distancemeasure successfully reflects that.
3.2. Network element correspondences
The node correspondences obtained with the two differentdistance measures for a MZ twin pair are visually compared inFig. 5. It can be observed that since SA is unaware of the nodelabels, swaps between nodes from different hemispheres cantake place (red arrows). Nevertheless, in the case of GED cor-respondences, nodes are matched accurately, with importantfunctional connections maintained between matched nodesfor both twin subjects (black arrows).
4. CONCLUSION
We propose a novel approach for evaluating similarities be-tween functional brain networks, derived from individual sub-ject parcellations. The method successfully reflects greatersimilarities between networks from the same subject, as wellas from MZ twin pairs compared to DZ and unrelated pairs. Italso correctly identifies correspondences between network el-ements paving the way for comparisons between healthy anddiseased populations using data-driven individual networksthat might even consist of different numbers of nodes.
5. REFERENCES
[1] O Sporns, G Tononi, and R Kötter, “The human con-nectome: a structural description of the human brain,”PLoS Comput Biol, vol. 1, no. 4, pp. e42, 2005.
[2] B Biswal et al., “Functional connectivity in the motorcortex of resting human brain using echo-planar MRI,”Magn Res in Medicine, vol. 34, no. 4, pp. 537–541,1995.
[3] Y Li et al., “Brain anatomical network and intelligence,”PLoS Comput Biol, vol. 5, no. 5, pp. e1000395, 2009.

(a) (b) (c)
Fig. 4: GED values calculated for networks of size N = 50, 100, 150 and varying contribution of rs-fMRI data to the parcella-tion. Permutation test results are shown as non-significant (n.s.), p < 0.05 (*), p < 0.01 (**), p < 0.0001 (****).
(b)
(a)
(c)(b)
Fig. 5: Node correspondences indicated with matching col-ors between twin1 (a) and twin2 for a MZ pair obtainedwith matrix alignment (b) and graph edit distance (c). Redarrows show mismatched nodes/node swaps from differenthemispheres. Black arrows show correctly matched nodes.
[4] MM Bohlken et al., “Heritability of structural brain net-work topology: a DTI study of 156 twins,” Hum BrainMapp, vol. 35, no. 10, pp. 5295–5305, 2014.
[5] L Zhan et al., “Heritability of brain network topology in853 twins and siblings,” in ISBI, 2015, pp. 449–453.
[6] MP van den Heuvel et al., “Genetic control of functionalbrain network efficiency in children,” Eur Neuropsych,vol. 23, no. 1, pp. 19–23, 2013.
[7] Y Fu et al., “Genetic influences on resting-state func-
tional networks: A twin study,” Hum Brain Mapp, vol.36, no. 10, pp. 3959–3972, 2015.
[8] Z Yang et al., “Genetic and environmental contribu-tions to functional connectivity architecture of the hu-man brain,” Cereb Cortex, vol. 26, no. 5, pp. 2341–2352, 2016.
[9] R Salvador et al., “Neurophysiological architecture offunctional magnetic resonance images of human brain,”Cereb Cortex, vol. 15, no. 9, pp. 1332–1342, 2005.
[10] S Arslan, S Parisot, and D Rueckert, “Joint spectral de-composition for the parcellation of the human cerebralcortex using resting-state fmri,” in IPMI, 2015, pp. 85–97.
[11] S Parisot et al., “GraMPa: Graph-based multi-modalparcellation of the cortex using fusion moves,” in MIC-CAI, 2016, pp. 148–156.
[12] O Tymofiyeva et al., “Brain without anatomy: construc-tion and comparison of fully network-driven structuralmri connectomes,” PloS One, vol. 9, no. 5, 2014.
[13] S Takerkart et al., “Graph-based inter-subject patternanalysis of fMRI data,” PloS One, vol. 9, no. 8, 2014.
[14] MF Glasser et al., “The minimal preprocessing pipelinesfor the human connectome project,” NeuroImage, vol.80, pp. 105–124, 2013.
[15] B Thirion et al., “Which fMRI clustering gives goodbrain parcellations?,” Front in Neurosc, vol. 8, pp. 167,2014.
[16] M Rubinov and O Sporns, “Complex network measuresof brain connectivity: uses and interpretations,” Neu-roImage, vol. 52, no. 3, pp. 1059–1069, 2010.
[17] K Riesen, M Neuhaus, and H Bunke, “Bipartite graphmatching for computing the edit distance of graphs,”in Graph-Based Representations in Pattern Recognition,pp. 1–12. Springer, 2007.