experimental vibration-based damage detection in aluminum
TRANSCRIPT

Experimental Vibration-based Damage
Detection in Aluminum Plates and Blocks
Using the Acoustic Emission Signals
NDTiC 2015
Edmonton, AB
M. Mirsadeghi, M. Sanati, R. Hugo, S. Park
Department of Mechanical & Manufacturing EngineeringSchulich School of Engineering at the University of Calgary
ND
T in C
anada 2015 Conference, June 15-17, 2015, E
dmonton, A
B (C
anada) - ww
w.ndt.net/app.N
DT
Canada2015

Outline
• Introduction
• Objective
• Theoretical Background
• Experimental Setup
• Results
• Discussion
• Summary
2

Introduction:
NDE Motivation
3
Incidents� Crack propagation in pipelines
� Fatigue and fracture in aircraft structures and engine blades
� Explosions in boilers and nuclear
facilities
� Crack initiation in bridges
Applications� Pipelines and Corrosion monitoring
� Aerospace structures� Civil infrastructures: Ship hulls,
bridges and buildings
� Composite Damage Detection
AcellentTechnologies Inc
Demands� Safe and stable operation of
structures � Enhancing Maintenance Strategies
� Utilizing cost effective NDT

Introduction
4
Challenges:
• Limitation in applying high frequency excitation
• Mostly suitable for rotating
machinery
• Noise and signal spikes
• Defect classification uncertainty
Vibration-based Damage Detection
Advantages:
• Independent to the structural complexity
• Calculation weight
• Global method (compared to
radiography and conventional ultrasonic methods)
• Can be applied in working
conditions
NDT Methods X-ray
Ultrasonic
Eddy Current
Magnetic Particle Testing
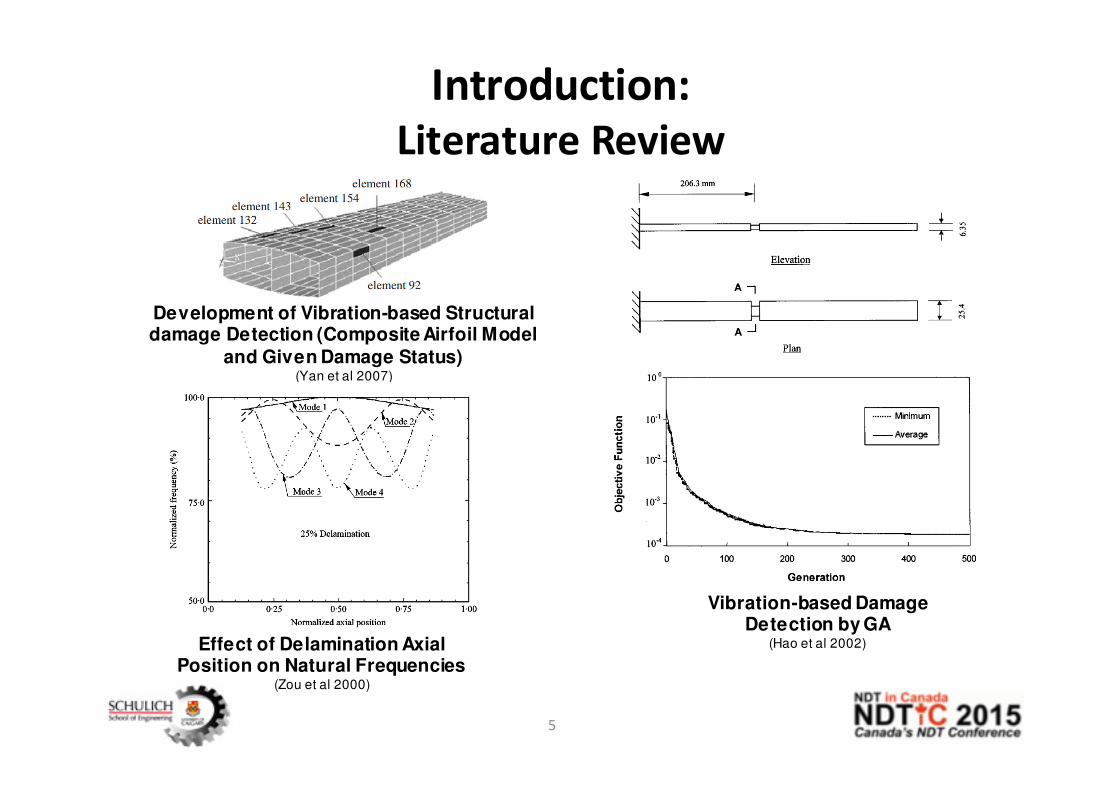
Introduction:
Literature Review
5
Vibration-based Damage Detection by GA
(Hao et al 2002)Effect of Delamination Axial Position on Natural Frequencies
(Zou et al 2000)
Development of Vibration-based Structural damage Detection (Composite Airfoil Model
and Given Damage Status)(Yan et al 2007)
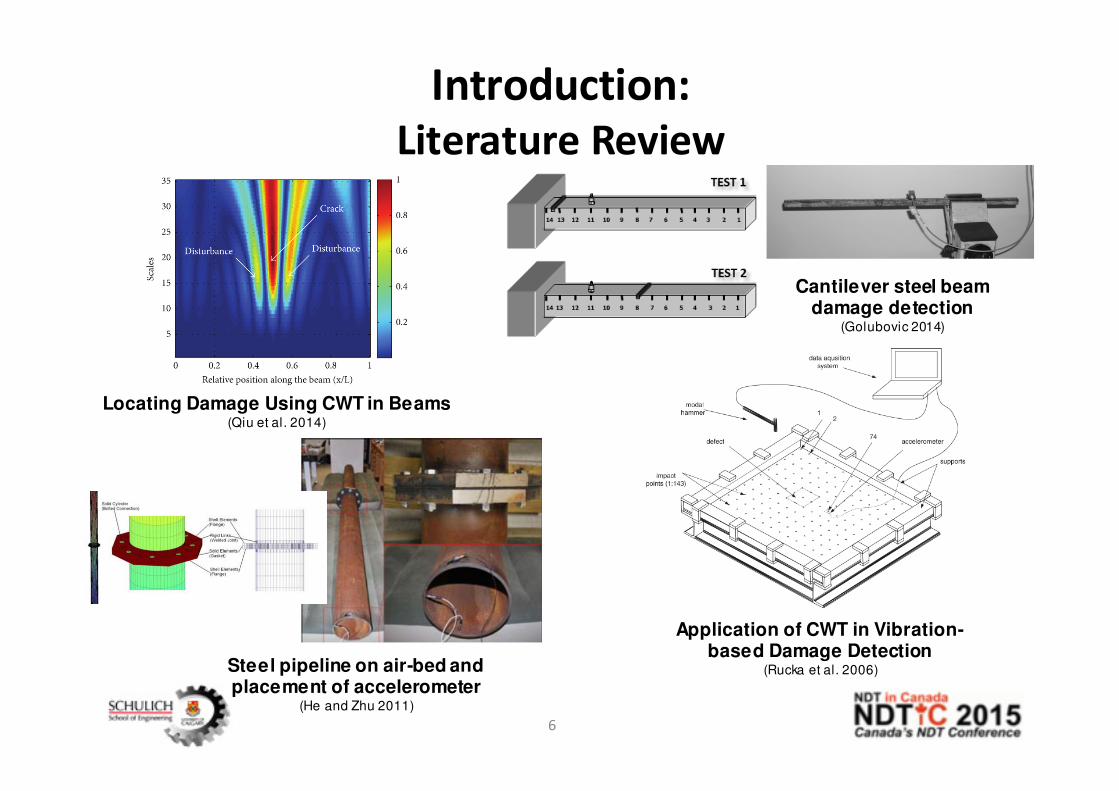
Introduction:
Literature Review
6
Steel pipeline on air-bed and placement of accelerometer
(He and Zhu 2011)
Cantilever steel beam damage detection
(Golubovic 2014)
Application of CWT in Vibration-based Damage Detection
(Rucka et al. 2006)
Locating Damage Using CWT in Beams(Qiu et al. 2014)
Objectives
7
Vibration based damage detection using AE sensors, and investigating the effect of sensor position
A. Implementation of the experimental procedure and computing FRFs
� Instrumentation and data acquisition
� Processing the signal and plotting FRFs
� Repeating experiments
B. Modal parameters extraction and analysis
� Analyzing variation of the modal parameters
� Mode sensitivity discussion

Experimental Setup
8
Target Structure Properties
Material Aluminum 6061
Dimensions
Plate 152x76x6.3 mm
Block 1 (B1) 152x50.8x25.4 mm
Block 2 (B2) 152x50.8x38.1mm
Boundary ConditionsFree (Using Foam 15cm
thickness)
a. Plate (152x76x6.3 mm) b. Block 1 (152x50.8x25.4) c. Block 2 (152x50.8x38.1 mm)
Test Steps
1 Healthy Structure
2 Damage 1 through hole 8mm diameter
3 Damage 2 through hole 12.5mm diameter
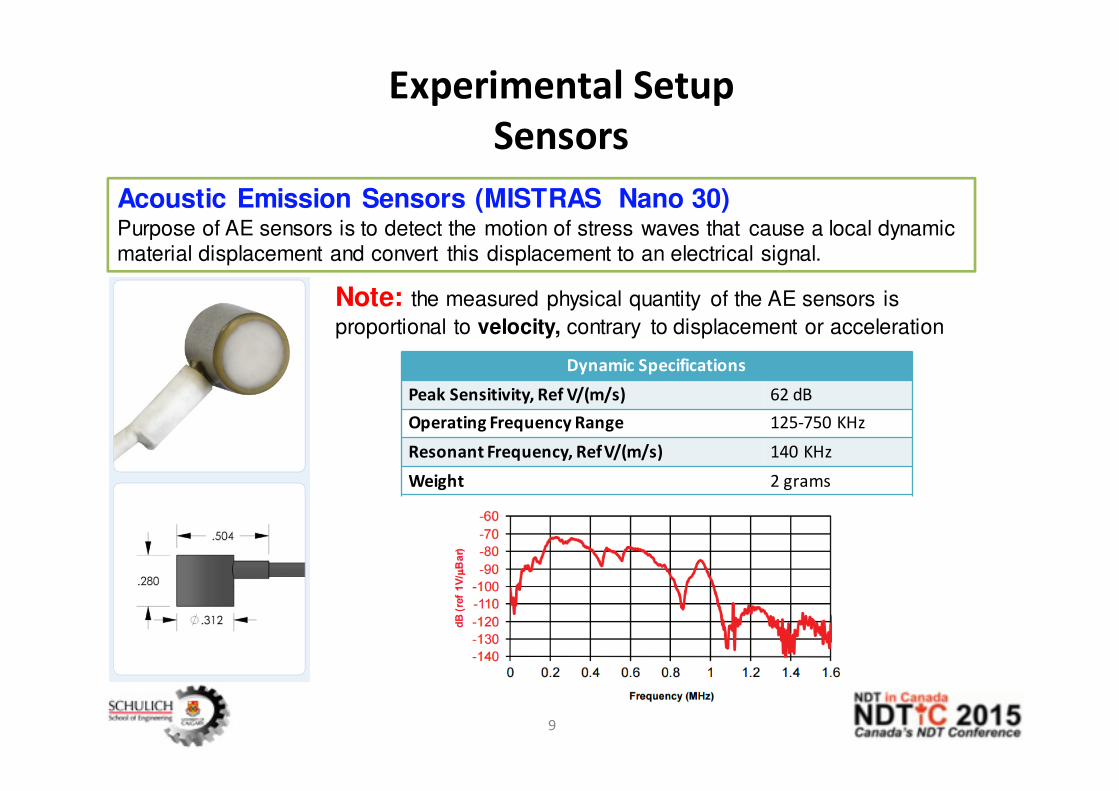
Experimental Setup
Sensors
9
Acoustic Emission Sensors (MISTRAS Nano 30)Purpose of AE sensors is to detect the motion of stress waves that cause a local dynamic material displacement and convert this displacement to an electrical signal.
Dynamic Specifications
Peak Sensitivity, Ref V/(m/s) 62 dB
Operating Frequency Range 125-750 KHz
Resonant Frequency, RefV/(m/s) 140 KHz
Weight 2 grams
Note: the measured physical quantity of the AE sensors is
proportional to velocity, contrary to displacement or acceleration
Results
10
The figures have been prepared based on following considerations:
1. The plate provide eight natural frequency, however we have focused on the first two natural frequencies to get more reliable results due to higher amplitudes in actuation signal power spectrum.
2. The block specimens typically have two natural frequencies.
3. The figures have been windowed to provide information about changes in dynamic behaviour of the structures in more sensitive modes.
4. The legends are Healthy, Damage 1 and Damage 2 which denote the
reference signal, damage case 1 (through hole 8mm diameter) and damage case 2 (through hole 12.5 mm) respectively.
Results
Specimen: Plate
11
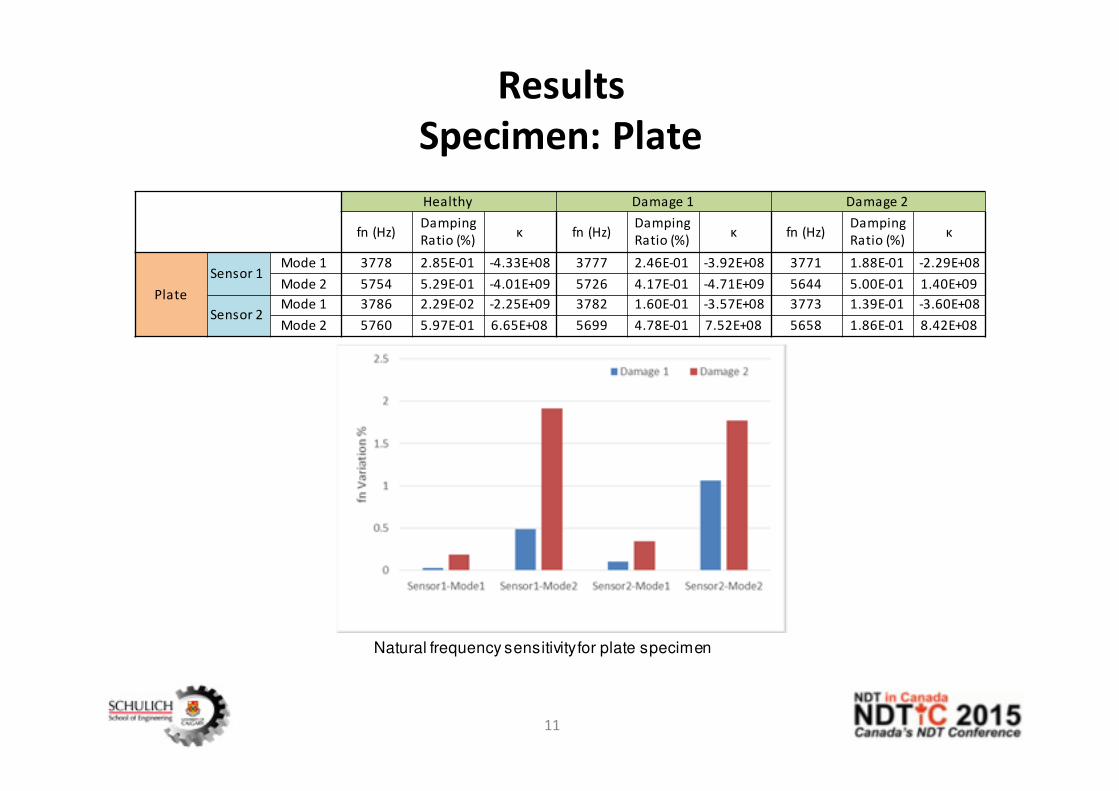
Healthy Damage 1 Damage 2
fn (Hz)Damping
Ratio (%)κ fn (Hz)
Damping
Ratio (%)κ fn (Hz)
Damping
Ratio (%)κ
Plate
Sensor 1Mode 1 3778 2.85E-01 -4.33E+08 3777 2.46E-01 -3.92E+08 3771 1.88E-01 -2.29E+08
Mode 2 5754 5.29E-01 -4.01E+09 5726 4.17E-01 -4.71E+09 5644 5.00E-01 1.40E+09
Sensor 2Mode 1 3786 2.29E-02 -2.25E+09 3782 1.60E-01 -3.57E+08 3773 1.39E-01 -3.60E+08
Mode 2 5760 5.97E-01 6.65E+08 5699 4.78E-01 7.52E+08 5658 1.86E-01 8.42E+08
Natural frequency sensitivity for plate specimen
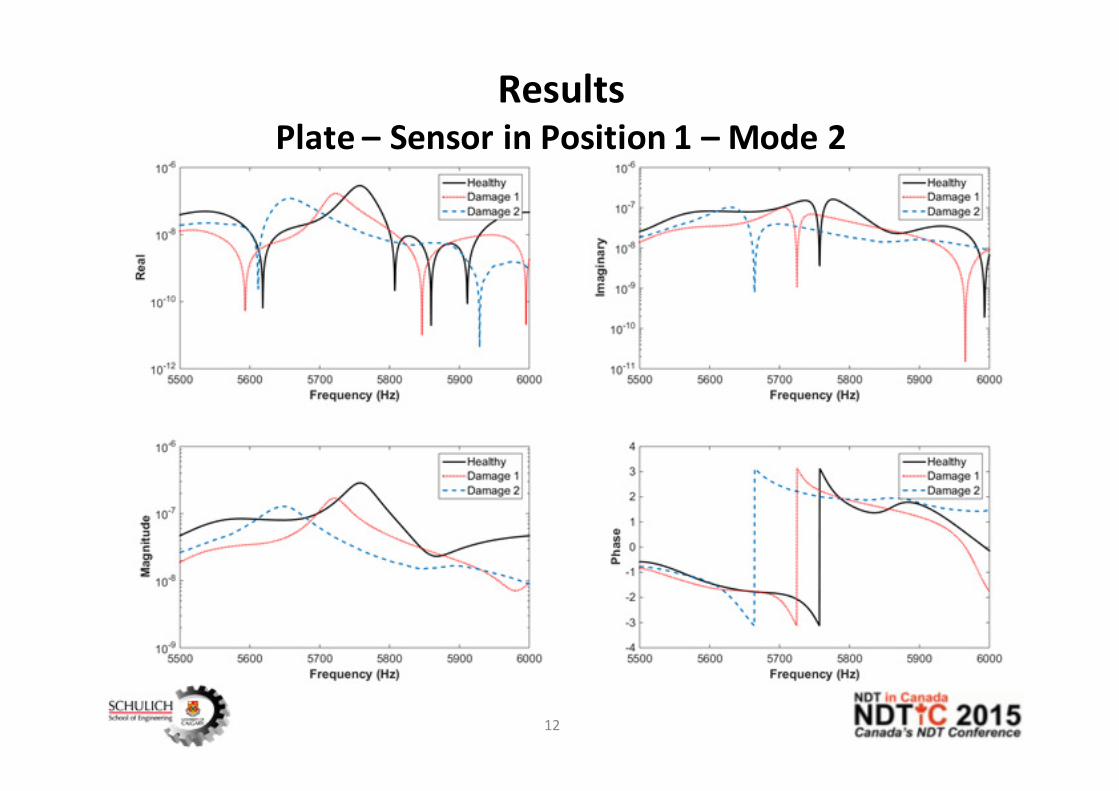
ResultsPlate – Sensor in Position 1 – Mode 2
12
Results
Specimen: Block 1
13
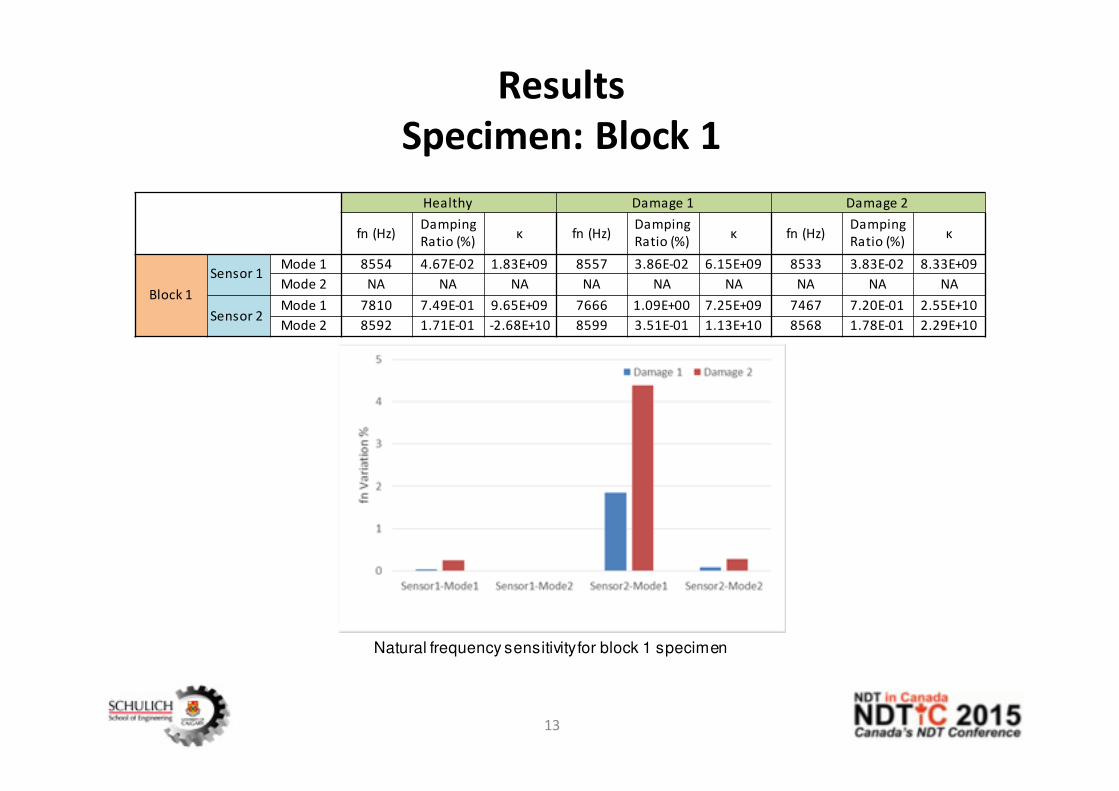
Healthy Damage 1 Damage 2
fn (Hz)Damping
Ratio (%)κ fn (Hz)
Damping
Ratio (%)κ fn (Hz)
Damping
Ratio (%)κ
Block 1
Sensor 1Mode 1 8554 4.67E-02 1.83E+09 8557 3.86E-02 6.15E+09 8533 3.83E-02 8.33E+09
Mode 2 NA NA NA NA NA NA NA NA NA
Sensor 2Mode 1 7810 7.49E-01 9.65E+09 7666 1.09E+00 7.25E+09 7467 7.20E-01 2.55E+10
Mode 2 8592 1.71E-01 -2.68E+10 8599 3.51E-01 1.13E+10 8568 1.78E-01 2.29E+10
Natural frequency sensitivity for block 1 specimen
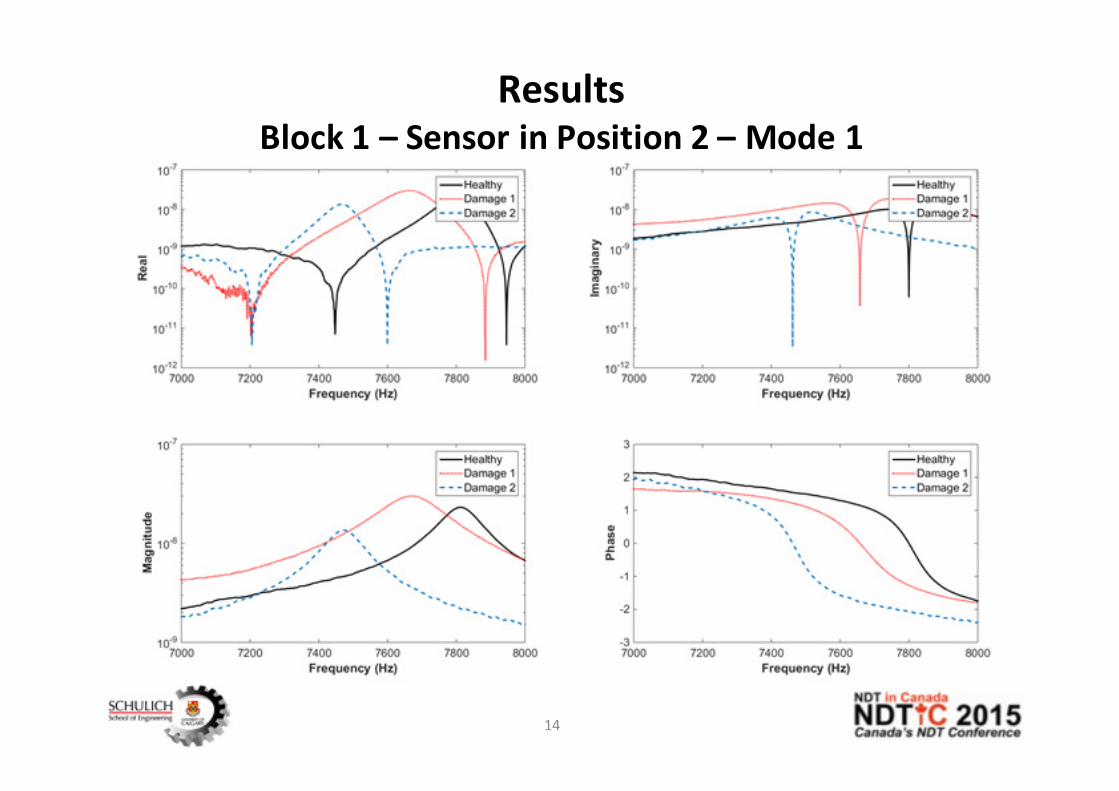
ResultsBlock 1 – Sensor in Position 2 – Mode 1
14

Results
Specimen: Block 2
15
Healthy Damage 1 Damage 2
fn (Hz)Damping
Ratio (%)κ fn (Hz)
Damping
Ratio (%)κ fn (Hz)
Damping
Ratio (%)κ
Block 2
Sensor 1Mode 1 8674 4.17E-02 4.63E+09 8687 4.47E-02 4.33E+09 8680 3.77E-02 2.76E+10
Mode 2 NA NA NA NA NA NA 8723 4.72E-02 4.67E+10
Sensor 2Mode 1 8702 1.86E-01 -2.55E+10 8710 1.04E-01 1.60E+10 8748 3.55E-01 8.70E+09
Mode 2 9125 2.46E-01 -7.84E+10 8972 1.67E-01 2.70E+10 8748 3.55E-01 8.70E+09
Natural frequency sensitivity for block 2 specimen

ResultsBlock 2– Sensor in Position 2- Mode 1 and 2
16
Discussion
17
• The material discontinuity in the structure could make specific changes to dynamic behavior of the specimen
• The second mode of the plate structure is more sensitive to the damage.
• Sensor positioning is significant to provide enough information about the structure.
• Different trend for natural frequencies variation in experiments for block 2.
• The effect of specimen geometry
• As the acoustic emission sensors have been used we can not provide exact units for the FRFs, however the measured quantity is proportional to the velocity.

Discussion
18
Assumptions
• The experiments were performed in free-free boundary condition using the 15cm thickness foam.
• The hammer exactly excites the same point in experiments for different damage levels.
• The effect of adhesive material used for mounting sensors is negligible
Limitations
• Analysis in the low frequency range of AE sensors
• Excitation signal frequency limitation (Max 12500 Hz)
• Challenge in computing stiffness
• Unable to compare mode shapes unless many sensors are used
• Insensitive modes to specific damages
Summary
19
• Vibration-based damage detection is a global method and independent of complexities of test objects.
• Experimental vibration-based damage detection using the acoustic emission
sensors was performed.
• It was shown that specific modes of vibration for the different specimens
provides more sensitivity to the damage and is preferred to be used for damage detection.
• Sensor location effect in detection of different modes of structure was studied.
Future Work• Parametric FE study using a verified numerical model• Extending studies to high frequency excitation signal
• Investigation of various kinds of defects (corrosion, fatigue crack, etc.)• Development of methods for reducing noise levels.

Thank You
20