vibration characteristics and damage detection in a
TRANSCRIPT
Vibration Characteristics and Damage Detection in a Suspension Bridge
Wasanthi R. Wickramasinghe, David P. Thambiratnam, Tommy H.T. Chan & Theanh
Nguyen
*School of Civil Engineering & Built Environment,
Queensland University of Technology (QUT),
Brisbane, Australia.
Abstract
Suspension bridges are flexible and vibration sensitive structures that exhibit complex and
multi-modal vibration. Due to this, the usual vibration based methods could face a challenge
when used for damage detection in these structures. This paper develops and applies a mode
shape component specific damage index (DI) to detect and locate damage in a suspension
bridge with pre-tensioned cables. This is important as suspension bridges are large structures
and damage in them during their long service lives could easily go un-noticed. The capability
of the proposed vibration based DI is demonstrated through its application to detect and
locate single and multiple damages with varied locations and severity in the cables of the
suspension bridge. The outcome of this research will enhance the safety and performance of
these bridges which play an important role in the transport network.
KEYWORDS:
Suspension bridges, Vibration characteristics, Cables, Vibration based damage detection,
Modal flexibility, Component specific damage index, Noise
*Corresponding author e-mail: [email protected]; Tel: 61 7 3138 1467; Fax: 61 7
3138 1170
1. Introduction
As transport infrastructure systems, particularly bridges, in many countries are rapidly
aging, structural deterioration can set in. Environmental influences, changes in load
characteristics and random actions [1] accelerate the structural deterioration and can cause
damage leading to expensive retrofitting or bridge failure. The importance of detecting
damage in these bridges at an early stage and carrying out the necessary retrofitting to
prevent bridge failure is therefore obvious.
Structural Health Monitoring (SHM) has emerged as an approach that can address this
need. Current SHM systems are integrated with a variety of damage detection methods,
which are global and local in nature. Limitations in local methods necessitate the non-
destructive and global techniques for damage diagnosis. This has led to continuous
development in vibration based damage detection (VBDD) methods in SHM systems. The
basic principle of vibration based SHM is that the damage in a structure changes its structural
properties which in turn results in changes in its vibration characteristics. A change in the
vibration characteristics can hence be used to detect damage in a structure. In the context of
VBDD technology, methods that use Damage Indices (DIs) are effective, inexpensive and
have the ability to automate the damage assessment process [2, 3]. Many researchers have
used Damage Index (DI) methods to successfully detect and locate damage in structures
constructed with different material such as steel [4, 5], composites [6] reinforced concrete [3]
and timber [7]. In the literature, different vibration characteristics such as natural frequencies
[8, 9], damping ratios [10, 11], mode shapes [12, 13], derivatives of mode shapes [4, 14, 15],
modal flexibility [7, 16-23] and modal strain energy values [3, 24-26] have been used to
developed the DIs for damage detection in various structures. A special DI based on
Poincare´ maps (which contain data for the displacements and the velocities of the structure)
was proposed by Manoach and Trendafilova [27] to identify damage in rectangular plates.
Suspension bridges are increasingly used in today’s infrastructure system to span
large distances and are rich in architectural features and aesthetical aspects. They are large
structures and their main cables may be subjected to severe corrosion and fatigue damage,
which can go unnoticed. These bridges are flexible structures with low stiffness and low
mass. They are vibration sensitive and exhibit complex vibration characteristics. Such
vibration is multi-modal and coupled and hence it is difficult to identify the damage sensitive
modes for use with the normal vibration based methods for detecting damage. Due to this
reason the use of vibration based DI to assess damage in suspension bridge cables has been
limited.
Among different VBDD techniques the traditional modal flexibility (MF) method is a
promising method which incorporates the natural frequencies and mass normalized mode
shapes. It usually requires a few of the lower order modes for detecting damage in structures
and has been used by a number of researchers for locating damage in beam and plate like
structures [16-18, 26, 28]. Wang et al. [19] identified that MF was a sensitive damage
indicator compared with other modal indices in detecting damage in the bearings, decks and

hangers of the Tsing Ma Bridge. Choi et al. [7] also used the changes in flexibility to develop
a new hybrid algorithm to estimate damage severity in timber structures. Relative flexibility
change (RFC) between intact and damaged states of the cable stayed bridge was studied by
Ni et al. [20], whose RFC index was successful in locating damage in single damage
scenarios in the absence of ambient effects. However difficulties were encountered in
detecting and locating damage in cross girders. Moragaspitiya et al. [21] predicted the axial
shortening of vertical load bearing elements of reinforced concrete buildings using the MF
method. Montazer and Seyedpoor [22] developed a new damage index named as strain
change based on flexibility index (SCBFI) which was used for locating multiple damage
cases in truss systems and demonstrated its capability. Recently, Sung et al. [23] developed a
method based on MF to detect damage in cantilever beam type structures. It was successfully
applied to identify damage in a ten story building by both numerically and experimentally for
single and multiple damage cases. The literature confirms that the MF method has a wide
variety of applications in damage diagnosis studies but not in detecting and locating damage
in the main cables of suspension bridges.
This paper develops and applies a mode shape component specific damage index (DI)
that can successfully detect and locate damage in the main cables of a suspension bridge with
pre-tensioned cables. These are very important components of a suspension bridge. This
special VBDD method is a modified form of the traditional MF method and incorporates only
a few lower order modes and their components. It is able to overcome the issues associated
with the complex vibration exhibited by suspension bridges and is easy to calculate and
apply. The effectiveness of the proposed DI is demonstrated under a range of damage
scenarios.
To illustrate the proposed method a laboratory model of a suspension bridge with
three sets of cables namely; top supporting cables (TSC), pre-tensioned reverse profiled
(bottom) cables (RPC) in the vertical plane and pre-tensioned bi-concave side cables (BCSC)
in the horizontal plane is considered. These cables serve different structural actions in the
bridge. A FE model of this bridge was developed and validated using vibration data from the
laboratory performed experiments. This was then used to examine the competency of the
component specific DI under different damage scenarios involving single and multiple
damages and varying damage intensities in the different cables of this rather complex bridge
structure. It is shown that the proposed DI provides better and more reliable results compared
to those from the traditional MF method. This paper illustrates the application of the
proposed DI to a three dimensional suspension bridge model which exhibits complex
vibration characteristics. Other case studies related to real suspension bridges are presented in
reference [29]. The research outcomes will enable the timely retrofitting of cables to ensure
the safe operation of suspension bridges in the infrastructure and optimal allocation of public
resources for retrofitting and maintenance.
2. Vibration Based Component Specific Damage Indices
The MF method is a widely accepted technique in damage detection which associates
vibration characteristics of a structure that include natural frequencies and mass normalized
mode shapes. MF of a structure converges rapidly with increasing frequency and can be
therefore computed using only a few lower order modes [16]. It does not require any
analytical model of a structure to evaluate the flexibility and can be used with only the
experimental data collected from the structure (data from experimental modal analysis
(EMA) can be used directly in computing MF). However, online monitoring systems
instrumented in large scale structures can only measure ambient vibration response which
means mass normalized mode shape data is not available. In order to apply the MF method in
large scale structures, many researchers [30-33] developed various methods to calculate the
MF with ambient vibration measurements with and without use of FEM. The MF method is
widely used in SHM application due to its accuracy, convenient computation and ease of
application [21]. The MF, Fx at a location x of a structure can be written as;
𝐹𝑥 = ∑
1
𝜔𝑖2
𝑚
𝑖=1
𝜙𝑥𝑖𝜙𝑥𝑖𝑇 (1)
Where i (i=1, 2, 3 …m) is the mode number considered and xi is the value of the ith
mode shape at x. In complex structures measured modes are less than the analytical modes
available, with only a limited number of lower order modes being measured practically [20].
In the above Eq., m and i are the total number of modes considered and the natural
frequency of the structure at mode i, respectively.
When a structure is subjected to damage or deterioration, its stiffness is reduced and
the flexibility is increased. This modifies its vibration characteristics. The resulting modal
flexibilities of the structure are represented in Eqs. 2 and 3 respectively at the damaged and
undamaged states of the structure.
𝐹𝑥𝐷 = [∑
1
𝜔𝑖2
𝑚
𝑖=1
𝜙𝑥𝑖𝜙𝑥𝑖𝑇 ]
𝐷
(2)
𝐹𝑥𝐻 = [∑
1
𝜔𝑖2
𝑚
𝑖=1
𝜙𝑥𝑖𝜙𝑥𝑖𝑇 ]
𝐻
(3)
Here, subscripts D and H denote the damaged and undamaged (healthy) states of the
structure respectively. Eq. 4 below captures the change in MF of the structure due to damage.
In order to determine the MF at undamaged and damaged states, sensors attached to the
suspension bridges can be used to collect the acceleration data and calculate iandxi
(vibration properties) by modal analysis methods such as Data Driven Stochastic Subspace
Identification (SSI-DATA) (described in section 3.4). In measuring vibration properties, the
first state where the vibration properties are measured defines the baseline (healthy) state,
whereas all subsequent measurements correspond to the damaged state.
𝐹𝑥𝐷 − 𝐹𝑥𝐻 = [∑
1
𝜔𝑖2
𝑚
𝑖=1
𝜙𝑥𝑖𝜙𝑥𝑖𝑇 ]
𝐷
− [∑1
𝜔𝑖2
𝑚
𝑖=1
𝜙𝑥𝑖𝜙𝑥𝑖𝑇 ]
𝐻
(4)
In this study, FxD - FxH is normalized by the FxH and hence the damage index for
locating damage in a structure is written as in Eq. 5. The normalized damage index (defined
below) determines the relative change of modal flexibility, which detects the damage quite
accurately.
𝐷𝐼 =
[∑1
𝜔𝑖2
𝑚𝑖=1 𝜙𝑥𝑖𝜙𝑥𝑖
𝑇 ]𝐷
− [∑1
𝜔𝑖2
𝑚𝑖=1 𝜙𝑥𝑖𝜙𝑥𝑖
𝑇 ]𝐻
[∑1
𝜔𝑖2
𝑚𝑖=1 𝜙𝑥𝑖𝜙𝑥𝑖
𝑇 ]𝐻
(5)
In general, suspension bridges can vibrate with lateral, vertical, torsional and coupled
modes [34]. It is very difficult to identify damage sensitive modes in a suspension bridge and
in particular to measure the rotational coordinates of torsional and coupled modes practically.
Most damage detection methods therefore, incorporate mode shapes that include translational
coordinates. Further, as the significant mode shape components can be measured in the lateral
and vertical directions, this paper defines and tests two corresponding damage indices. One
index is based on the structure’s vertical components of mode shapes and the other is based
on its lateral components of mode shapes. Eq. 5 is hence rewritten as Eqs. 6 and 7 to
accommodate the proposed component specific DIs, where the subscripts V and L denote the
vertical and lateral components of mode shapes, respectively. Component specific DIs based
on modal flexibility have not been treated in the literature, but Li, Yang and Hu [35] have
proposed the consideration of mode shape components for modal strain energy.
𝐷𝐼𝑉 =
[∑1
𝜔𝑖2
𝑚𝑖=1 𝜙𝑥𝑖𝜙𝑥𝑖
𝑇 ]𝐷𝑉
− [∑1
𝜔𝑖2
𝑚𝑖=1 𝜙𝑥𝑖𝜙𝑥𝑖
𝑇 ]𝐻𝑉
[∑1
𝜔𝑖2
𝑚𝑖=1 𝜙𝑥𝑖𝜙𝑥𝑖
𝑇 ]𝐻𝑉
(6)
𝐷𝐼𝐿 =
[∑1
𝜔𝑖2
𝑚𝑖=1 𝜙𝑥𝑖𝜙𝑥𝑖
𝑇 ]𝐷𝐿
− [∑1
𝜔𝑖2
𝑚𝑖=1 𝜙𝑥𝑖𝜙𝑥𝑖
𝑇 ]𝐻𝐿
[∑1
𝜔𝑖2
𝑚𝑖=1 𝜙𝑥𝑖𝜙𝑥𝑖
𝑇 ]𝐻𝐿
(7)
Since damage alters the stiffness of the structure and increases its flexibility,
theoretically, peaks should appear in the damage index curves defined in Eqs. 6 and 7
corresponding to the damage location. However, each vibration mode in the suspension
bridge has components in the lateral and vertical directions. The mass participating in each
direction (mass participation factor) varies for the different vibration modes in the suspension
bridge. The mode shape component with a higher mass participation will contribute towards
the prediction of damage more accurately. It is hence worthwhile to study the competency of
the DIs based on the vertical and lateral components of the different modes for detecting and
locating damage in suspension bridges.
This paper compares the performance of the proposed component specific DIs (defined
in Eqs. 6 and. 7 above) with that of the (component specific) MF difference (defined in Eqs. 8
and 9) based on the originally developed MF method by Pandey and Biswas [16, 18]. In this
study, MF difference is also calculated using both vertical and lateral components of mode
shapes as shown in Eqs. 8 and 9 respectively. These equations were obtained by rewriting Eq.
4 for the two specific components of the mode shapes considered herein.
𝑀𝐹𝐷𝑉 = [∑
1
𝜔𝑖2
𝑚
𝑖=1
𝜙𝑥𝑖𝜙𝑥𝑖𝑇 ]
𝐷𝑉
− [∑1
𝜔𝑖2
𝑚
𝑖=1
𝜙𝑥𝑖𝜙𝑥𝑖𝑇 ]
𝐻𝑉
(8)
𝑀𝐹𝐷𝐿 = [∑
1
𝜔𝑖2
𝑚
𝑖=1
𝜙𝑥𝑖𝜙𝑥𝑖𝑇 ]
𝐷𝐿
− [∑1
𝜔𝑖2
𝑚
𝑖=1
𝜙𝑥𝑖𝜙𝑥𝑖𝑇 ]
𝐻𝐿
(9)
3. Experimental Testing of the Suspension Bridge Model
FE modelling is extensively used in damage detection studies due to the difficulty of
applying a physical damage to real structures. In this paper, therefore, a validated FE model
using the results of self-performed experiments on the laboratory suspension bridge model
was used to simulate various damage scenarios. It was then used to obtain the vibration
properties in both the damaged and undamaged states and thereby to verify the proposed

damage detection methodology. Two different tests were conducted on the laboratory model,
namely; static and vibration tests which were used to obtain static and dynamic behaviours
respectively.
3.1 Laboratory suspension bridge model for vibration testing
The laboratory suspension bridge model used in this study was designed and
constructed in the Structures Laboratory at Queensland University of Technology. It consists
of two components: namely, cable bridge model and support system (as shown in Fig. 1). In
this paper, the cable bridge model is the main focus and its vibration parameters are the major
concern in experimental testing. The support system provides anchorage to the cable bridge
model.
Fig. 1. (a) The laboratory suspension bridge model (b) Schematic diagram of the laboratory suspension bridge
model
(a)
(b)
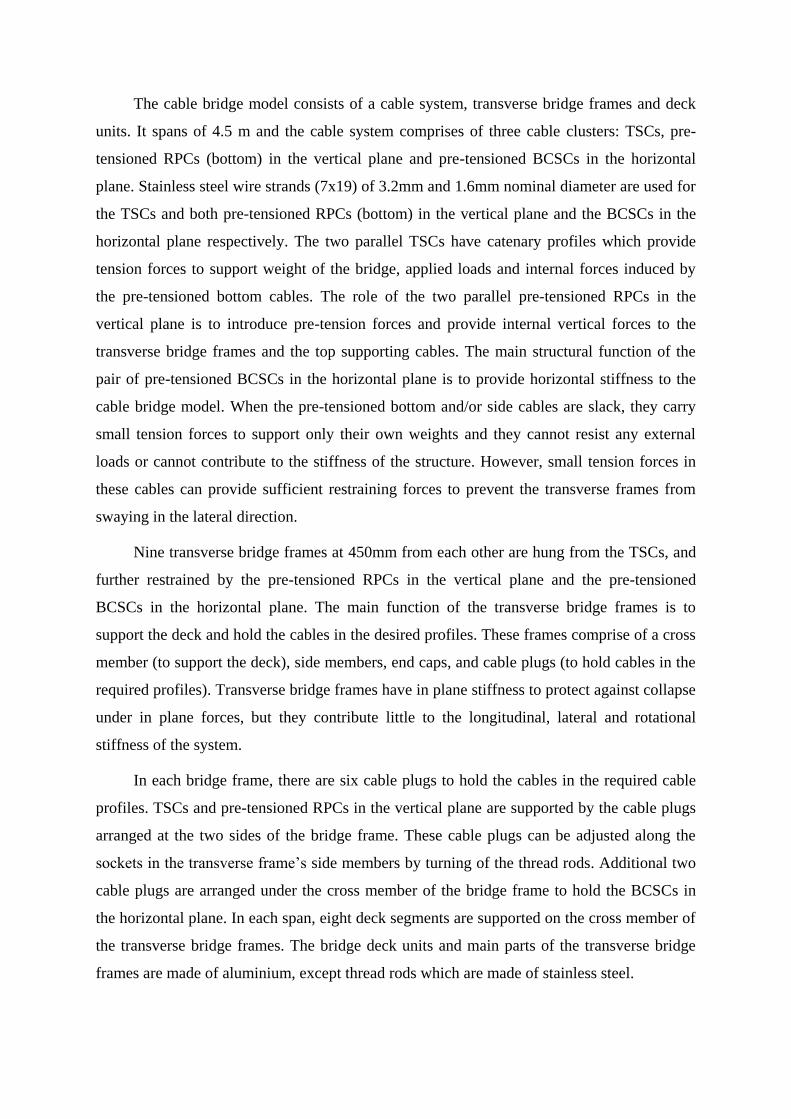
The cable bridge model consists of a cable system, transverse bridge frames and deck
units. It spans of 4.5 m and the cable system comprises of three cable clusters: TSCs, pre-
tensioned RPCs (bottom) in the vertical plane and pre-tensioned BCSCs in the horizontal
plane. Stainless steel wire strands (7x19) of 3.2mm and 1.6mm nominal diameter are used for
the TSCs and both pre-tensioned RPCs (bottom) in the vertical plane and the BCSCs in the
horizontal plane respectively. The two parallel TSCs have catenary profiles which provide
tension forces to support weight of the bridge, applied loads and internal forces induced by
the pre-tensioned bottom cables. The role of the two parallel pre-tensioned RPCs in the
vertical plane is to introduce pre-tension forces and provide internal vertical forces to the
transverse bridge frames and the top supporting cables. The main structural function of the
pair of pre-tensioned BCSCs in the horizontal plane is to provide horizontal stiffness to the
cable bridge model. When the pre-tensioned bottom and/or side cables are slack, they carry
small tension forces to support only their own weights and they cannot resist any external
loads or cannot contribute to the stiffness of the structure. However, small tension forces in
these cables can provide sufficient restraining forces to prevent the transverse frames from
swaying in the lateral direction.
Nine transverse bridge frames at 450mm from each other are hung from the TSCs, and
further restrained by the pre-tensioned RPCs in the vertical plane and the pre-tensioned
BCSCs in the horizontal plane. The main function of the transverse bridge frames is to
support the deck and hold the cables in the desired profiles. These frames comprise of a cross
member (to support the deck), side members, end caps, and cable plugs (to hold cables in the
required profiles). Transverse bridge frames have in plane stiffness to protect against collapse
under in plane forces, but they contribute little to the longitudinal, lateral and rotational
stiffness of the system.
In each bridge frame, there are six cable plugs to hold the cables in the required cable
profiles. TSCs and pre-tensioned RPCs in the vertical plane are supported by the cable plugs
arranged at the two sides of the bridge frame. These cable plugs can be adjusted along the
sockets in the transverse frame’s side members by turning of the thread rods. Additional two
cable plugs are arranged under the cross member of the bridge frame to hold the BCSCs in
the horizontal plane. In each span, eight deck segments are supported on the cross member of
the transverse bridge frames. The bridge deck units and main parts of the transverse bridge
frames are made of aluminium, except thread rods which are made of stainless steel.

Anchorage to the cable bridge is provided by the support system. It encompasses
headstocks, cable clamps, load cells, turnbuckles, end supports and basements. The two
aluminium headstocks of the support system can provide the required support to the cables to
suit the different cable configurations. The details of the support system are illustrated in Fig.
2.
Fig. 2. The support system
Twelve aluminium specimens with two transducer specific strain gauges mounted on
either side are used to measure the tension forces in the cables and are called load cells (Fig.
2). In order to measure these tension forces, load cells were connected to an Electronic Data
Acquisition System (eDAQ).
3.2 Experimental vibration testing
Once the calibration of load cells was completed, two experimental tests: static and
vibration tests were conducted. Two bridge model cases were considered to investigate the
static and dynamic behaviour of the bridge. In case 1, the bridge model was designed to have
cable configuration with only TSCs and bottom pre-tensioned RPCs (in the vertical plane)
with the desired tension forces of 1400N and 300N respectively. In case 2, the bridge model
was designed to have all the pre-tensioned cables including TSCs, bottom pre-tensioned
RPCs and pre-tensioned BCSCs with the desired tension forces of 1400N, 400N and 300N
respectively. Due to the sensitivity of the load cells, results will be presented for average
values of the tension force during testing. A preliminary FE model was developed to
approximately identify the static and dynamic behaviour of the bridge before conducting
experiments. The experimental process including both static and vibration tests are shown in
Fig. 3.
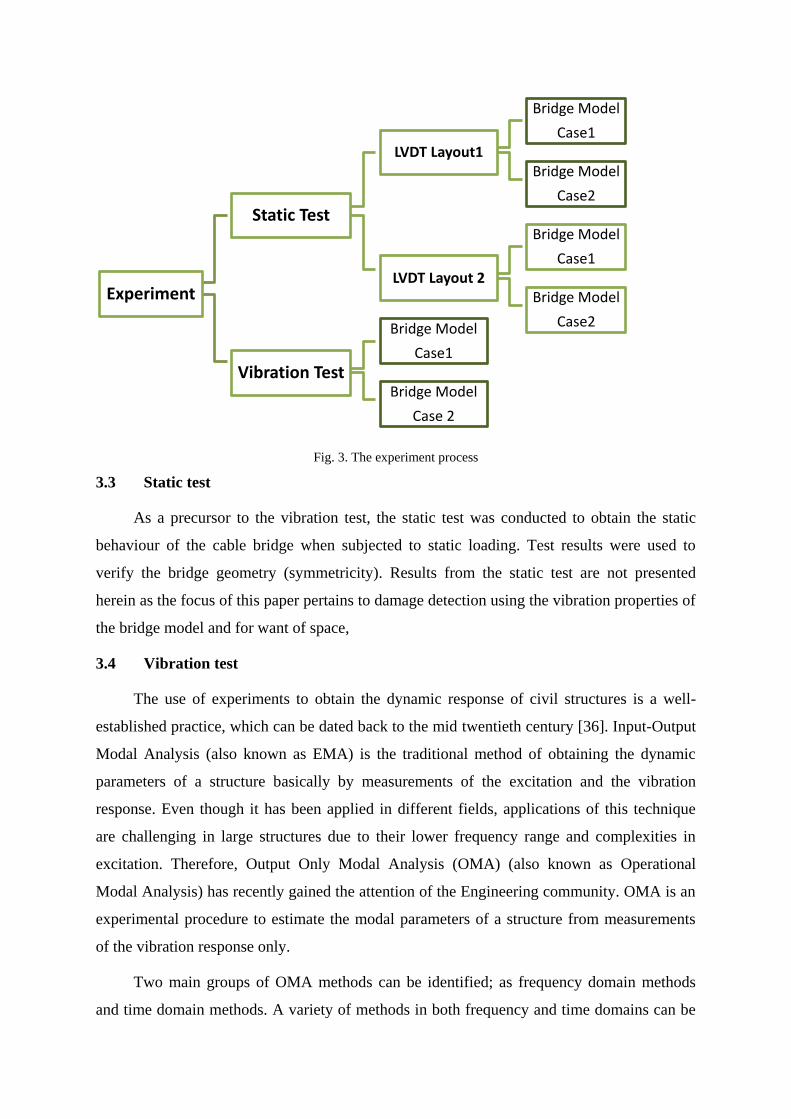
Fig. 3. The experiment process
3.3 Static test
As a precursor to the vibration test, the static test was conducted to obtain the static
behaviour of the cable bridge when subjected to static loading. Test results were used to
verify the bridge geometry (symmetricity). Results from the static test are not presented
herein as the focus of this paper pertains to damage detection using the vibration properties of
the bridge model and for want of space,
3.4 Vibration test
The use of experiments to obtain the dynamic response of civil structures is a well-
established practice, which can be dated back to the mid twentieth century [36]. Input-Output
Modal Analysis (also known as EMA) is the traditional method of obtaining the dynamic
parameters of a structure basically by measurements of the excitation and the vibration
response. Even though it has been applied in different fields, applications of this technique
are challenging in large structures due to their lower frequency range and complexities in
excitation. Therefore, Output Only Modal Analysis (OMA) (also known as Operational
Modal Analysis) has recently gained the attention of the Engineering community. OMA is an
experimental procedure to estimate the modal parameters of a structure from measurements
of the vibration response only.
Two main groups of OMA methods can be identified; as frequency domain methods
and time domain methods. A variety of methods in both frequency and time domains can be
Experiment
Static Test
LVDT Layout1
Bridge Model
Case1
Bridge Model
Case2
LVDT Layout 2
Bridge Model
Case1
Bridge Model
Case2
Vibration Test
Bridge Model
Case1
Bridge Model
Case 2
classified under OMA [37]. Among these methods, Data Driven Stochastic Subspace
Identification (SSI-DATA) has been identified as the well-known robust time domain method
in the OMA family. It can take into account furious modes from measurement noise, avoid
spectrum leakage and cope well with dense and closely spaced modes [38-40]. SSI-DATA
method relies on directly fitting parametric state space models to the measured responses of a
linear and time invariant physical system [40]. Among different estimation algorithms for
SSI-DATA (Structural Vibration Solutions A/S. 2011), Un-weighted Principal Component
(UPC) has been most commonly used in OMA of civil structure. In this experiment, modal
parameters were extracted by the SSI-DATA (UPC) in ARTeMIS modal analysis software.
The instrument setup used in the experiment, testing procedure and vibration test results are
discussed briefly in the next few sections.
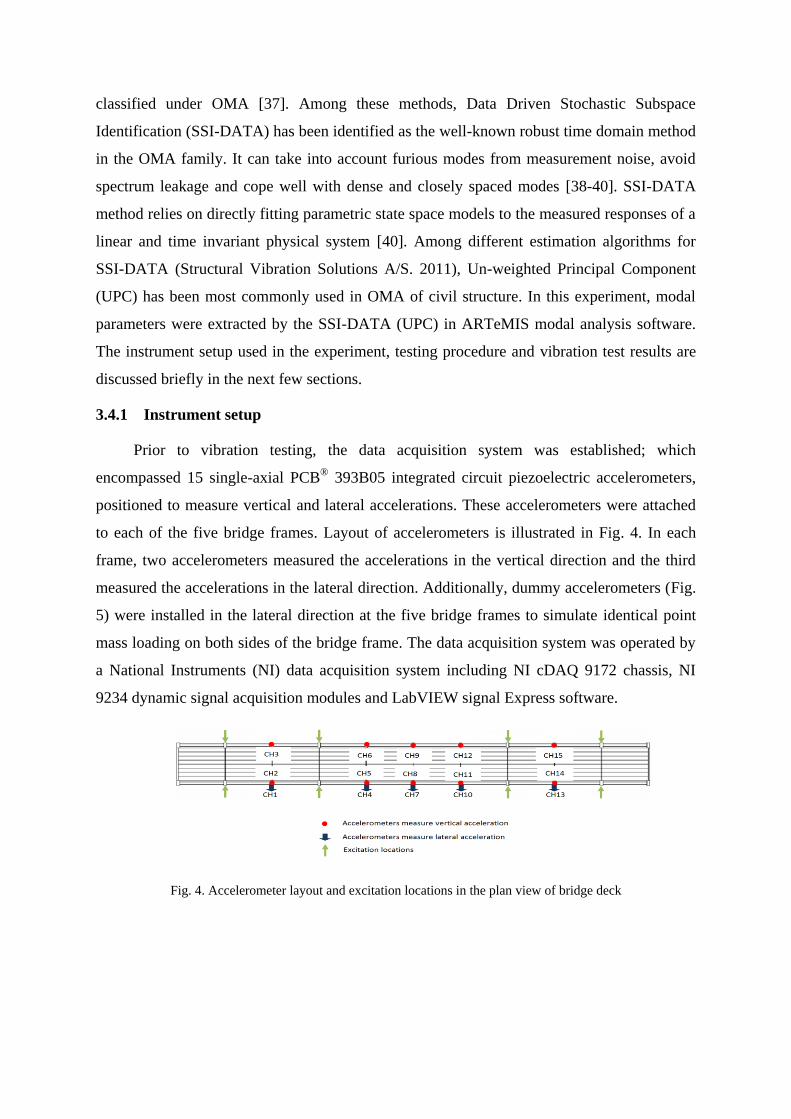
3.4.1 Instrument setup
Prior to vibration testing, the data acquisition system was established; which
encompassed 15 single-axial PCB®
393B05 integrated circuit piezoelectric accelerometers,
positioned to measure vertical and lateral accelerations. These accelerometers were attached
to each of the five bridge frames. Layout of accelerometers is illustrated in Fig. 4. In each
frame, two accelerometers measured the accelerations in the vertical direction and the third
measured the accelerations in the lateral direction. Additionally, dummy accelerometers (Fig.
5) were installed in the lateral direction at the five bridge frames to simulate identical point
mass loading on both sides of the bridge frame. The data acquisition system was operated by
a National Instruments (NI) data acquisition system including NI cDAQ 9172 chassis, NI
9234 dynamic signal acquisition modules and LabVIEW signal Express software.
Fig. 4. Accelerometer layout and excitation locations in the plan view of bridge deck
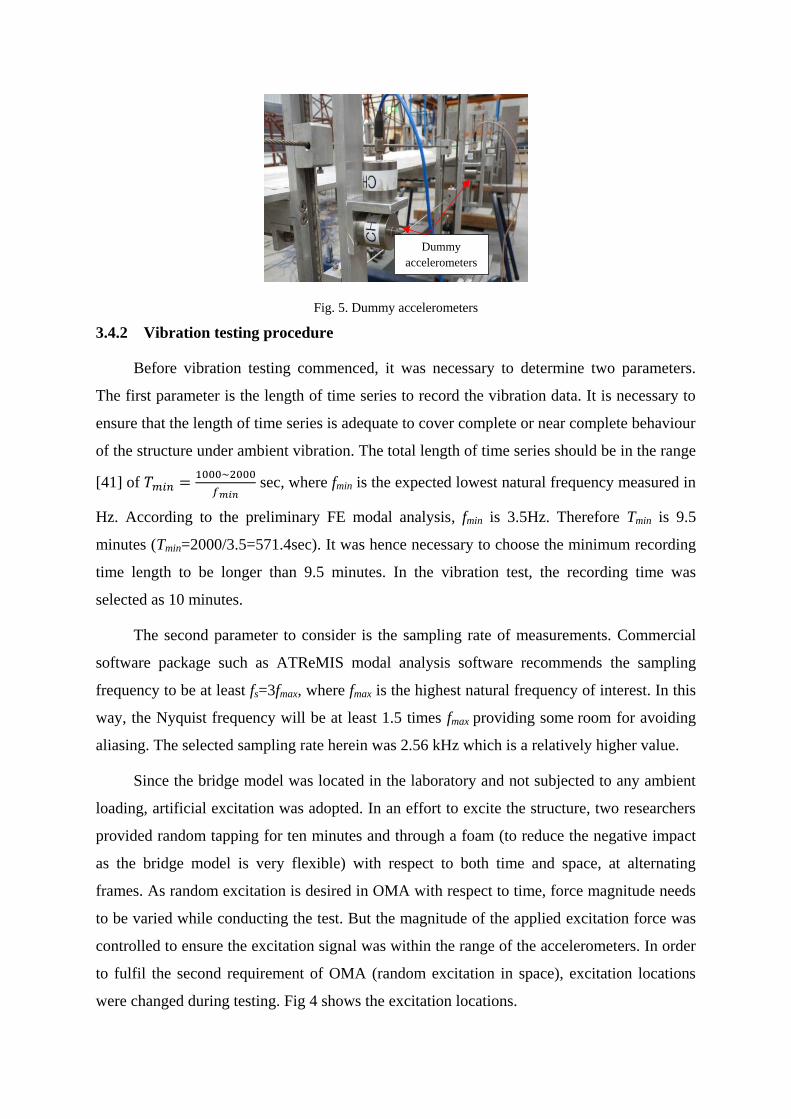
Fig. 5. Dummy accelerometers
3.4.2 Vibration testing procedure
Before vibration testing commenced, it was necessary to determine two parameters.
The first parameter is the length of time series to record the vibration data. It is necessary to
ensure that the length of time series is adequate to cover complete or near complete behaviour
of the structure under ambient vibration. The total length of time series should be in the range
[41] of 𝑇𝑚𝑖𝑛 =1000~2000
𝑓𝑚𝑖𝑛 sec, where fmin is the expected lowest natural frequency measured in
Hz. According to the preliminary FE modal analysis, fmin is 3.5Hz. Therefore Tmin is 9.5
minutes (Tmin=2000/3.5=571.4sec). It was hence necessary to choose the minimum recording
time length to be longer than 9.5 minutes. In the vibration test, the recording time was
selected as 10 minutes.
The second parameter to consider is the sampling rate of measurements. Commercial
software package such as ATReMIS modal analysis software recommends the sampling
frequency to be at least fs=3fmax, where fmax is the highest natural frequency of interest. In this
way, the Nyquist frequency will be at least 1.5 times fmax providing some room for avoiding
aliasing. The selected sampling rate herein was 2.56 kHz which is a relatively higher value.
Since the bridge model was located in the laboratory and not subjected to any ambient
loading, artificial excitation was adopted. In an effort to excite the structure, two researchers
provided random tapping for ten minutes and through a foam (to reduce the negative impact
as the bridge model is very flexible) with respect to both time and space, at alternating
frames. As random excitation is desired in OMA with respect to time, force magnitude needs
to be varied while conducting the test. But the magnitude of the applied excitation force was
controlled to ensure the excitation signal was within the range of the accelerometers. In order
to fulfil the second requirement of OMA (random excitation in space), excitation locations
were changed during testing. Fig 4 shows the excitation locations.
Dummy
accelerometers
Before conducting any tests, the twelve load cells were checked carefully and the
turnbuckles attached to the cables were adjusted to obtain the required tension forces. Load
cell readings were automatically recorded by eDAQ while conducting the experiments to
check any tension losses during testing. All the acceleration data was captured in the time
domain and was transferred to the ARTeMIS modal analysis software to obtain the modal
parameters.
3.4.3 Vibration test results
The natural frequencies and mode shapes were determined by SSI-DATA (UPC) in
ARTeMIS modal analysis software. Two bridge model cases were considered in the vibration
tests. In bridge model case1, TSCs and pre-tensioned RPCs were setup to average tension
values of 1446N and 326N respectively. In bridge model case2, TSCs, pre-tensioned RPCs
and pre-tensioned BCSCs were set up to average tension values of 1403N, 485N and 270N
respectively. In each bridge model case only the first five modes were obtained in the
experiment for the damage detection studies. Two sets of vibration test results were obtained
from the two different bridge models, to enhance the validation of the FE models. The natural
frequencies for the bridge model cases1 and 2 (Table 3 and Table 4) and the graphical
representation of the mode shapes will be presented and compared with the corresponding
numerical results in the next section on FE model validation.
4 Validation of the FE Model of the Laboratory Bridge Structure
The numerical model was developed to represent the actual laboratory structure as
close as possible. It was hence necessary to replicate all the geometric features of this
complex structure precisely. To achieve this, the commercial finite element analysis software
package ANSYS Workbench [42] which is facilitated with graphical user interface for
developing complex models as multibody parts, was used.
4.1 Geometry of the laboratory bridge structure
The geometry of the laboratory bridge structure was modelled in the DesignModeler
module of ANSYS Workbench. It was modelled as a three dimensional FE model with three
parts namely; bridge (nine transverse bridge frames and cables), deck and end supports. As
mentioned before, all the bridge members were aluminium except the thread rods and cables
which were stainless steel. Member sizes used for the FE modelling of the laboratory bridge
structure are presented in Table 1 and the corresponding material characteristics are given in
Table 2.
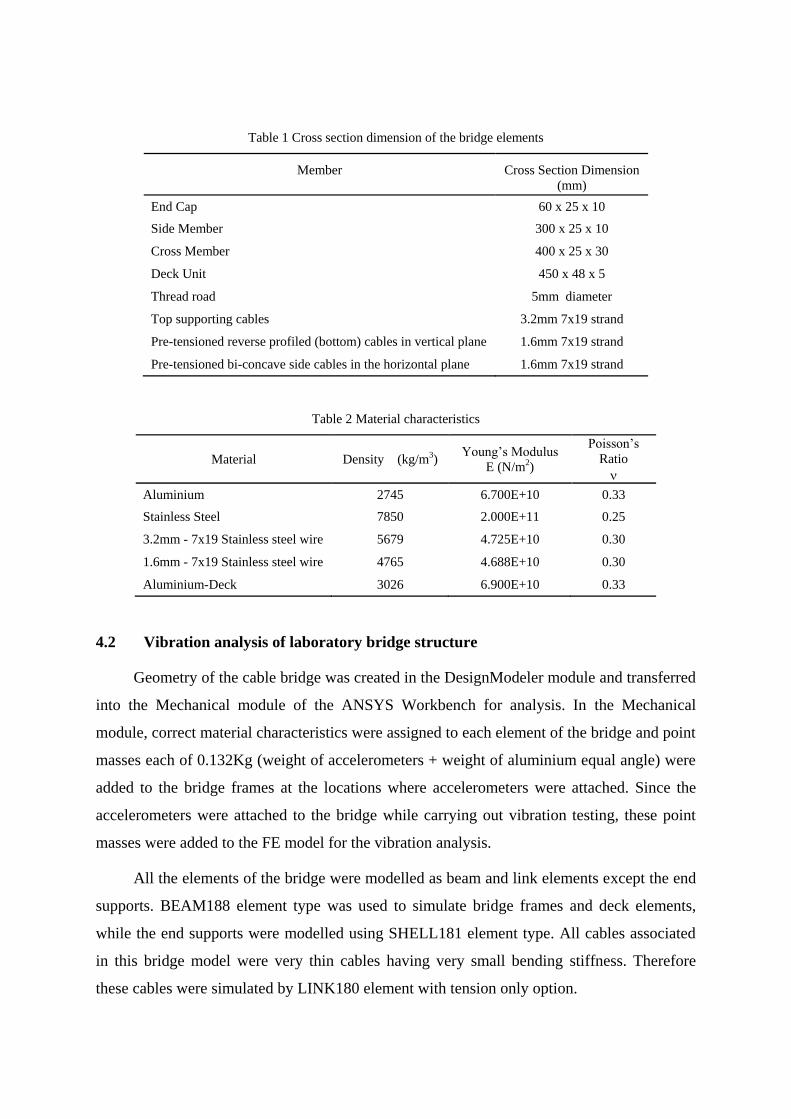
Table 1 Cross section dimension of the bridge elements
Member Cross Section Dimension
(mm)
End Cap 60 x 25 x 10
Side Member 300 x 25 x 10
Cross Member 400 x 25 x 30
Deck Unit 450 x 48 x 5
Thread road 5mm diameter
Top supporting cables 3.2mm 7x19 strand
Pre-tensioned reverse profiled (bottom) cables in vertical plane 1.6mm 7x19 strand
Pre-tensioned bi-concave side cables in the horizontal plane 1.6mm 7x19 strand
Table 2 Material characteristics
Material Density (kg/m3) Young’s Modulus
E (N/m2)
Poisson’s
Ratio
Aluminium 2745 6.700E+10 0.33
Stainless Steel 7850 2.000E+11 0.25
3.2mm - 7x19 Stainless steel wire 5679 4.725E+10 0.30
1.6mm - 7x19 Stainless steel wire 4765 4.688E+10 0.30
Aluminium-Deck 3026 6.900E+10 0.33
4.2 Vibration analysis of laboratory bridge structure
Geometry of the cable bridge was created in the DesignModeler module and transferred
into the Mechanical module of the ANSYS Workbench for analysis. In the Mechanical
module, correct material characteristics were assigned to each element of the bridge and point
masses each of 0.132Kg (weight of accelerometers + weight of aluminium equal angle) were
added to the bridge frames at the locations where accelerometers were attached. Since the
accelerometers were attached to the bridge while carrying out vibration testing, these point
masses were added to the FE model for the vibration analysis.
All the elements of the bridge were modelled as beam and link elements except the end
supports. BEAM188 element type was used to simulate bridge frames and deck elements,
while the end supports were modelled using SHELL181 element type. All cables associated
in this bridge model were very thin cables having very small bending stiffness. Therefore
these cables were simulated by LINK180 element with tension only option.
In the FE model, connectivity of the cables and cable plugs in bridge frames were
modelled as rigid connections as there was no allowance for the cables to rotate or displace at
those locations in the cable bridge model. In the nine transverse bridge frames, all the
members were considered as rigidly connected together at the intersection locations.
A Pre-stressed Modal Analysis was conducted to obtain the natural frequencies and
mode shapes of the bridge FE model. Towards this end, initially, a nonlinear static analysis
with large deflection option was conducted to obtain the stress stiffening matrix caused by the
internal forces due to the dead loads acting on the bridge. Later, the modal analysis was
performed on the basis of the deformed equilibrium configuration of the bridge to obtain the
natural frequencies and mode shapes.
In the experiments, vibration tests were conducted for the two bridge model cases. FE
models for each test case were developed and a comparison of results with those obtained
experimentally is presented in the next section.
4.3 Vibration test data and validation of the FE model
To validate the FE model, a comparison of experimental and FE model results was made. The
tension forces of cables, natural frequencies and mode shapes obtained from the FE analysis
were compared with those from the vibration tests. To achieve the validation of the FE model
in this study, model updating was done manually to modify the structural parameters of the
FE model such that the difference in the natural frequencies obtained FE model and from the
experiment are minimised. With the change of structural parameters such as cable tension,
connectivity of structural elements, support conditions and member offsets, the initial FE
model was updated. Validation results are presented in the next section.
The comparison of the tension forces of the cables and natural frequencies of the
bridge obtained from FE analysis and experiment was conducted by calculating relative
errors:
𝑇𝑒𝑟𝑟𝑜𝑟 =(𝑇𝑒𝑥𝑝−𝑇𝑓𝑒𝑚)
𝑇𝑒𝑥𝑝 × 100 and 𝑓𝑒𝑟𝑟𝑜𝑟 =
(𝑓𝑒𝑥𝑝−𝑓𝑓𝑒𝑚)
𝑓𝑒𝑥𝑝 × 100 respectively.
In the above expressions Texp and fexp are tension force and natural frequency obtained in the
experiment and Tfem and ffem are those obtained in the FE analysis. In addition, mode shapes
are also compared. Tables 3 and 4 present the tension forces and first five natural frequencies
obtained from the experiment and the FE model. It can be observed that the difference
between the experimental and FE results is less than 9% which demonstrates a very good
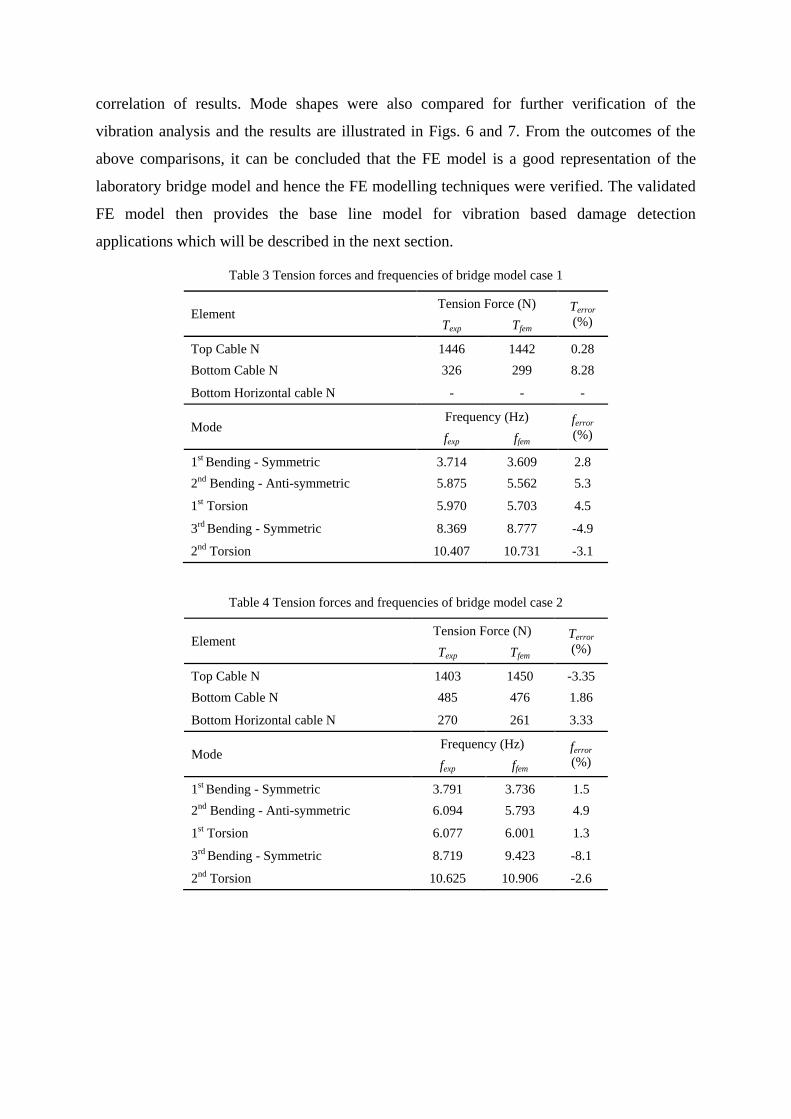
correlation of results. Mode shapes were also compared for further verification of the
vibration analysis and the results are illustrated in Figs. 6 and 7. From the outcomes of the
above comparisons, it can be concluded that the FE model is a good representation of the
laboratory bridge model and hence the FE modelling techniques were verified. The validated
FE model then provides the base line model for vibration based damage detection
applications which will be described in the next section.
Table 3 Tension forces and frequencies of bridge model case 1
Element Tension Force (N) Terror
(%) Texp Tfem
Top Cable N 1446 1442 0.28
Bottom Cable N 326 299 8.28
Bottom Horizontal cable N - - -
Mode Frequency (Hz) ferror
(%) fexp ffem
1st Bending - Symmetric 3.714 3.609 2.8
2nd Bending - Anti-symmetric 5.875 5.562 5.3
1st Torsion 5.970 5.703 4.5
3rd Bending - Symmetric 8.369 8.777 -4.9
2nd Torsion 10.407 10.731 -3.1
Table 4 Tension forces and frequencies of bridge model case 2
Element Tension Force (N) Terror
(%) Texp Tfem
Top Cable N 1403 1450 -3.35
Bottom Cable N 485 476 1.86
Bottom Horizontal cable N 270 261 3.33
Mode Frequency (Hz) ferror
(%) fexp ffem
1st Bending - Symmetric 3.791 3.736 1.5
2nd Bending - Anti-symmetric 6.094 5.793 4.9
1st Torsion 6.077 6.001 1.3
3rd Bending - Symmetric 8.719 9.423 -8.1
2nd Torsion 10.625 10.906 -2.6

Mode FEM Experiment
1st M
ode
2n
d M
ode
3rd
Mode
4th
Mode
5th
Mode
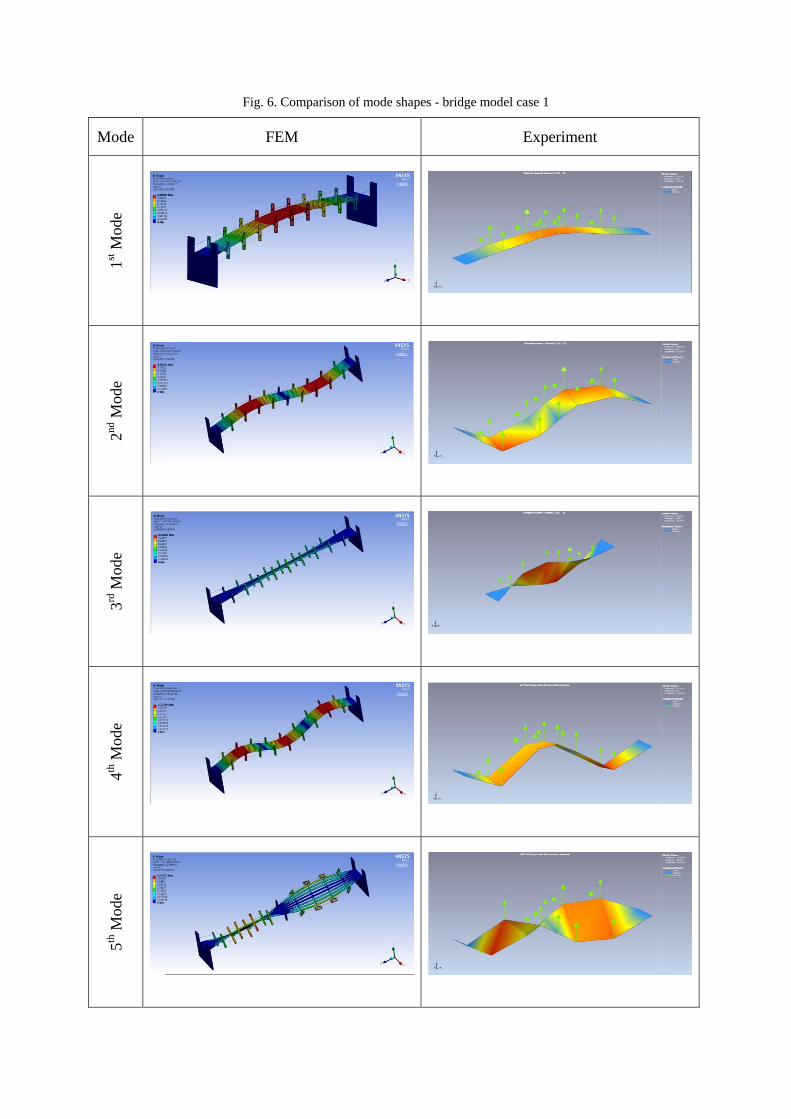
Fig. 6. Comparison of mode shapes - bridge model case 1
Mode FEM Experiment
1st M
ode
2n
d M
ode
3rd
Mode
4th
Mode
5th
Mode
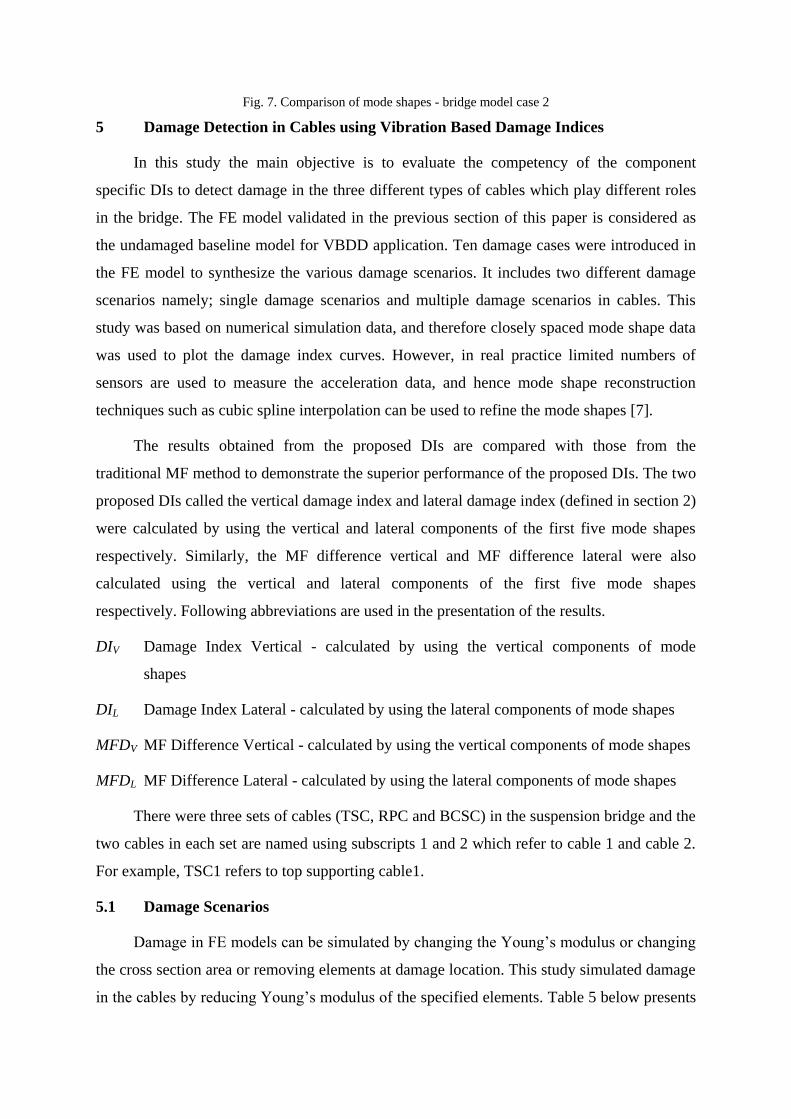
Fig. 7. Comparison of mode shapes - bridge model case 2
5 Damage Detection in Cables using Vibration Based Damage Indices
In this study the main objective is to evaluate the competency of the component
specific DIs to detect damage in the three different types of cables which play different roles
in the bridge. The FE model validated in the previous section of this paper is considered as
the undamaged baseline model for VBDD application. Ten damage cases were introduced in
the FE model to synthesize the various damage scenarios. It includes two different damage
scenarios namely; single damage scenarios and multiple damage scenarios in cables. This
study was based on numerical simulation data, and therefore closely spaced mode shape data
was used to plot the damage index curves. However, in real practice limited numbers of
sensors are used to measure the acceleration data, and hence mode shape reconstruction
techniques such as cubic spline interpolation can be used to refine the mode shapes [7].
The results obtained from the proposed DIs are compared with those from the
traditional MF method to demonstrate the superior performance of the proposed DIs. The two
proposed DIs called the vertical damage index and lateral damage index (defined in section 2)
were calculated by using the vertical and lateral components of the first five mode shapes
respectively. Similarly, the MF difference vertical and MF difference lateral were also
calculated using the vertical and lateral components of the first five mode shapes
respectively. Following abbreviations are used in the presentation of the results.
DIV Damage Index Vertical - calculated by using the vertical components of mode
shapes
DIL Damage Index Lateral - calculated by using the lateral components of mode shapes
MFDV MF Difference Vertical - calculated by using the vertical components of mode shapes
MFDL MF Difference Lateral - calculated by using the lateral components of mode shapes
There were three sets of cables (TSC, RPC and BCSC) in the suspension bridge and the
two cables in each set are named using subscripts 1 and 2 which refer to cable 1 and cable 2.
For example, TSC1 refers to top supporting cable1.
5.1 Damage Scenarios
Damage in FE models can be simulated by changing the Young’s modulus or changing
the cross section area or removing elements at damage location. This study simulated damage
in the cables by reducing Young’s modulus of the specified elements. Table 5 below presents

the details of the damage cases considered in this study. In this Table, X is measured along
the span of the bridge starting from the right hand end support (Fig. 1).
Table 5 Damage scenarios
Damage Case Location Severity of
Damage
Single Damage Scenario
DC 1 Damage at middle of TSC1
(X=2.250m to X=2.475m) 20%
DC 2 Damage at quarter of TSC 1
(X=1.125m to X=1.350m) 20%
DC 3 Damage at corner of TSC 2
(X=4.275m to X=4.500m) 20%
DC 4 Damage at quarter of RPC1
(X=0.900m to X=1.350m) 20%
DC 5 Damage at corner of RPC1
(X=4.275m to X=4.500m) 20%
DC 6 Damage at middle of BCSC1
(X=2.025 to X=2.475) 20%
DC 7 Damage at corner of BCSC1
(X=4.275m to X=4.500m) 20%
Multiple damage scenario
DC 8
Damage at two locations of TSC1
(X=1.125m to X=1.350m)
and
(X=3.150m to X=3.375m)
20%
10%
DC 9
Damage at two locations of RPC 1
(X=2.025m to X=2.475m)
and
(X=3.150m to X=3.600m)
20%
10%
DC 10
Damage at two locations of BCSC 1
(X=0.900m to X=1.350m)
and
(X=3.150m to X=3.600m)
20%
10%
In single damage scenarios, 20% stiffness reduction of the cable were considered, while
10% and 20% stiffness reduction in two different locations of the cable were considered to
cater for multiple damage scenarios. In real situations damage severity of cables had reached
30% [43] and therefore the damage severities (10% and 20%) considered in this study are
reasonable. Moreover, the length of the damage simulated was small and ranged from 5% to
10% of the total cable length.
5.2 Damage detection without noise in modal data
Damage detection results for each damage case considered are illustrated below.
Results include plots of damage indices (DIV and DIL) and plots of MF difference (MFDV and
MFDL) in both damaged and undamaged cables. True damage location is indicated with red
dotted lines.
5.2.1 Single Damage Scenarios
Seven damage cases were examined to study the damage locating capability of the
component specific DIs and MF difference by using vertical and lateral
components of mode shapes.
Damage Case 1 (DC 1) - damage in TSC1 at mid-span
The first damage case studied is that in the middle of the TSC 1 with a 20% stiffness
reduction. Numerical results of the damage indices (a) DIV, (b) DIL , (c) MFDV and (d) MFDL
are shown in Fig. 8. In Fig. 8 (a), the DIV for the damaged cable (TSC 1) reaches its
maximum value at the nodes of the damaged location and no significant change can be
observed in the DIV curve for the undamaged cable (TSC 2). In Fig. 8 (b), the DIL curves
show maximum values at the damaged location in both damaged and undamaged cables and
hence the results are unreliable and unable to identify the damaged cable. Similar trends can
be observed in the MFDV and MFDL plots in Fig. 8 (c) and (d) respectively. In this damage
case both DIV and MFDV which use the vertical components of the mode shapes, are able to
detect the damage successfully at the middle of the cable, and confirm the actual location of
the damage.
Further, DIV curves plotted using the first three and first five modes for the damaged
cable (TSC 1) are illustrated in Fig. 8 (e). It is evident that these two plots have very small
deviations and demonstrate that the influence of higher order modes beyond mode 3 is very
small. The 8.1% validation error in the fourth mode (in bridge model case 2) will therefore

not contribute much to the damage detection results. The DIs for all other damage cases were
hence plotted using the first five mode shapes and natural frequencies.
Fig. 8. DC1 - Damage indices (a) DIV (b) DIL and MF difference (c) MFDV (d) MFDL (e) DIV curve plotted
using first three and first five modes
Damage Case 2 (DC 2) - damage in TSC1 at quarter span
Fig. 9 illustrates both the DIs and MF difference curves for the second damage case
with a 20% stiffness reduction at quarter span of the TSC 1. It can be seen that the plot of DIV
peaks at the exact damage location for TSC 1 with no significant changes in the plot of DIV
for TSC 2. As also observed in the previous damage case, plots of DIL show peaks at the
damage location for both the damaged TSC 1 as well as the undamaged TSC 2. MFDV curve
peaks at damage location in TSC 1 and successfully locates the damage, while the MFDL
curves have their maximum values at the damaged location in both the damaged and
undamaged cables and are hence unable to identify the damaged cable successfully. Based on
the examination of the four graphs, it can be concluded that incorporating the vertical
components of mode shapes for detecting damage in a suspended cable of this bridge
(a) (b)
(c) (d)
(e)
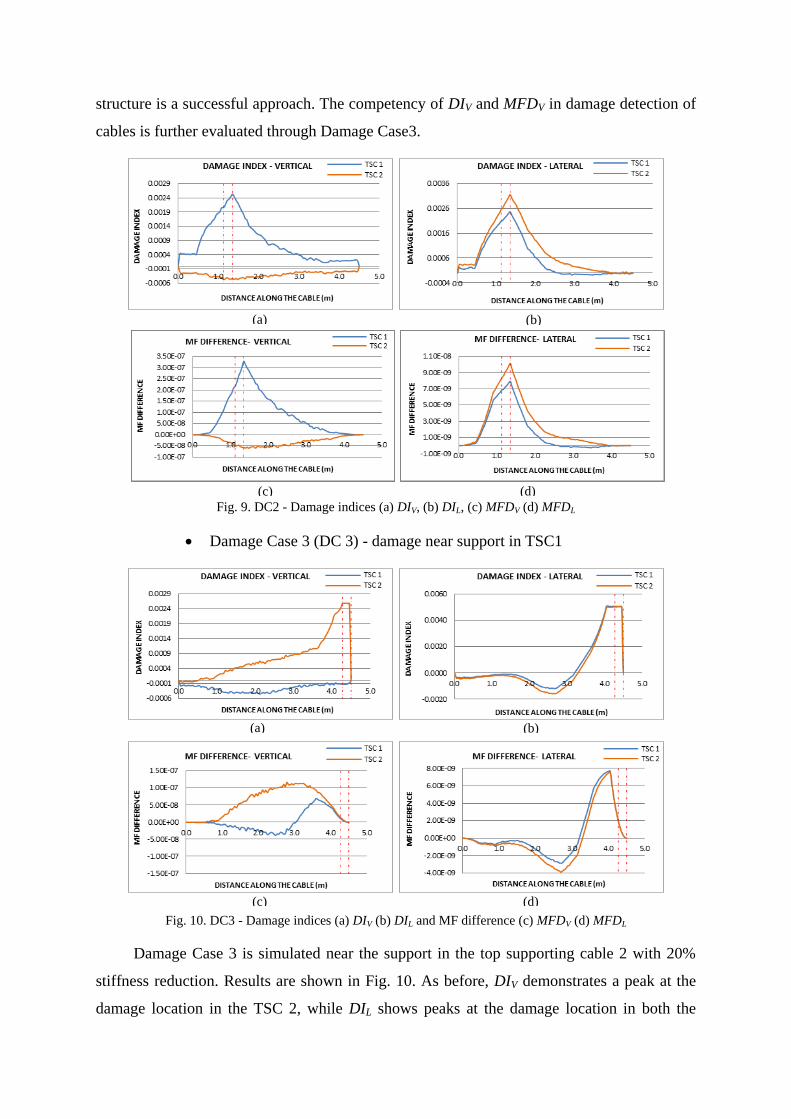
structure is a successful approach. The competency of DIV and MFDV in damage detection of
cables is further evaluated through Damage Case3.
Fig. 9. DC2 - Damage indices (a) DIV, (b) DIL, (c) MFDV (d) MFDL
Damage Case 3 (DC 3) - damage near support in TSC1
Fig. 10. DC3 - Damage indices (a) DIV (b) DIL and MF difference (c) MFDV (d) MFDL
Damage Case 3 is simulated near the support in the top supporting cable 2 with 20%
stiffness reduction. Results are shown in Fig. 10. As before, DIV demonstrates a peak at the
damage location in the TSC 2, while DIL shows peaks at the damage location in both the
(a) (b)
(c) (d)
(a) (b)
(c) (d)
undamaged TSC 1 and damaged TSC 2. MFDV and MFDL demonstrate incorrect damage
locating results. This further verifies the superior performance of DIV compared to the other
damage indices to detect damage in the TSC of a suspension bridge.
In other damage cases, similar trends were observed in the results obtained with both
MFDV and MFDL. Hereafter, therefore, only results from DIV and DIL are presented for the
other damage cases.
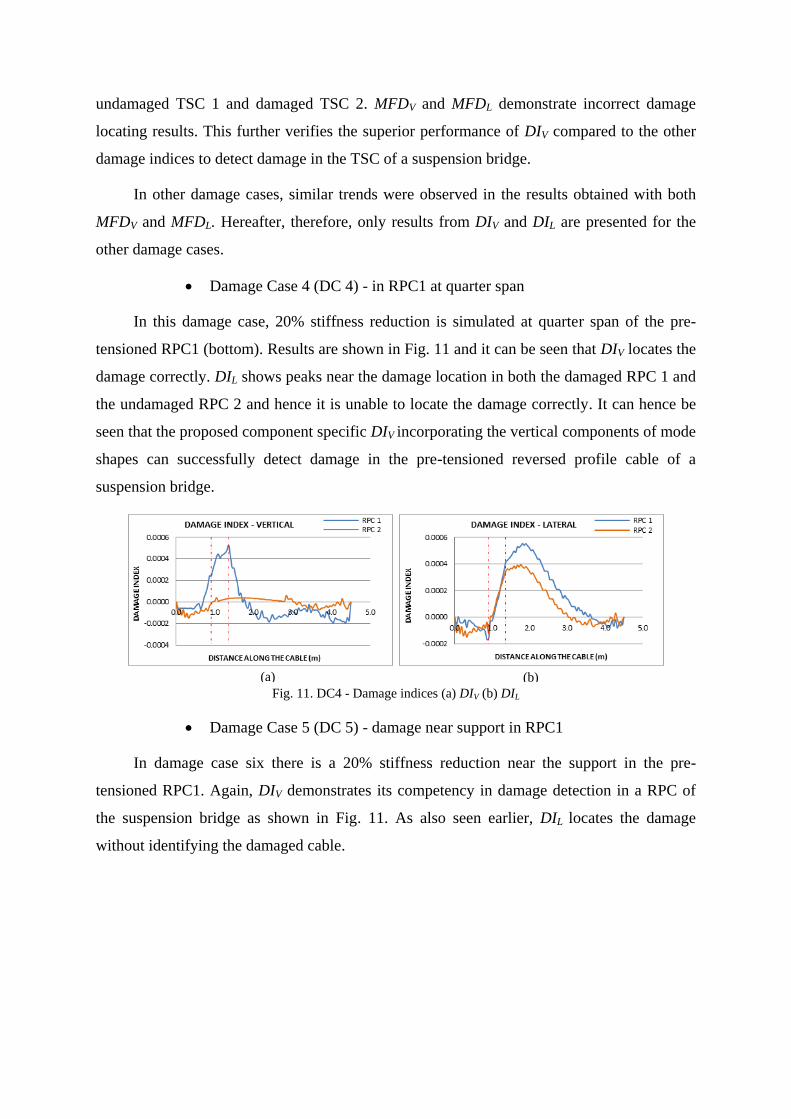
Damage Case 4 (DC 4) - in RPC1 at quarter span
In this damage case, 20% stiffness reduction is simulated at quarter span of the pre-
tensioned RPC1 (bottom). Results are shown in Fig. 11 and it can be seen that DIV locates the
damage correctly. DIL shows peaks near the damage location in both the damaged RPC 1 and
the undamaged RPC 2 and hence it is unable to locate the damage correctly. It can hence be
seen that the proposed component specific DIV incorporating the vertical components of mode
shapes can successfully detect damage in the pre-tensioned reversed profile cable of a
suspension bridge.
Fig. 11. DC4 - Damage indices (a) DIV (b) DIL
Damage Case 5 (DC 5) - damage near support in RPC1
In damage case six there is a 20% stiffness reduction near the support in the pre-
tensioned RPC1. Again, DIV demonstrates its competency in damage detection in a RPC of
the suspension bridge as shown in Fig. 11. As also seen earlier, DIL locates the damage
without identifying the damaged cable.
(a) (b)

Fig. 12. DC5 - Damage indices (a) DIV (b) DIL
Damage Case 6 (DC 6) and Damage Case 7 (DC 7) - damage in BCSC1 at
mid span and near support
The last damage cases studied under the single damage scenarios are with 20% stiffness
reduction in the pre-tensioned BCSC1 in the horizontal plane at mid span and near the
support. Results are shown in Fig. 13. It is evident that DIV is able to locate the damage in the
BCSC correctly in both cases while DIL gives inconsistent results.
Fig. 13. DC6 - Damage indices (a) DIV (b) DIL and DC7 - Damage indices (c) DIV (d) DIL
5.2.2 Multiple Damage Scenarios
Three damage cases are examined to study the damage locating capability of
component specific DIs and MF difference calculated using vertical and lateral
components of mode shapes.
(a) (b)
(a) (b)
(c) (d)

Damage Case 8 (DC 8) - multiple damage in TSC1
Two locations in TSC1 are subjected to a 20% and 10% stiffness reductions in the FE
model to simulate damage. Results are shown in Fig. 14 and it is clearly evident that both DIV
and MFDV for TSC1 show two peaks corresponding to the two damage locations while DIV
and MFDV for TSC2 have no significant variations. DIL and MFDL for both TSC1 and TSC2
have peaks at the damaged locations hence they give incorrect predictions.
Fig. 14. DC8 - Damage indices (a) DIV (b) DIL, (c) MFDV and (d) MFDL
Damage Case 9 (DC 9) - damage in RPC1
In this damage case, 20% and 10% stiffness reductions are simulated at mid and quarter
spans of the pre-tensioned RPC1. Results are shown in Fig. 15 from which it is evident that
that DIV for RPC1 and RPC 2 has peaks at the damage locations of RPC1 while DIL for these
two cables gives inconsistent predictions.
Fig. 15. DC9 - Damage indices (a) DIV (b) DIL
(a) (b)
(c) (d)
(a) (b)

Damage Case 10 (DC 10) - damage in BCSC`1
The last damage cases studied under the multiple damage scenarios are with 20% and
10% stiffness reductions in the pre-tensioned BCSC1 in the horizontal plane at different
locations and the results are shown in Fig. 16. The results verify that DIV is competent to
detect and locate multiple damages in the pre-tensioned BCSC of a suspension bridge
structure. In all further evaluations, only the damage index DIV will be used.
Fig. 16. DC10 - Damage indices (a) DIV (b) DIL
5.3 Damage detection with noise in modal data
In reality, measured vibration responses are associated with uncertainties such as
measurement noise and computational errors in modal frequencies and mode shapes,
respectively [44]. It is therefore necessary to examine the performance of the two component
specific DIs in the presence of noise in the modal data. In this study, vibration responses are
generated using a validated FE model and there is no noise associated with numerical
simulations. As the measurement noise associated with frequencies is very low, 5% random
noise is introduced to mode shapes generated from the FE model. Few selected damage cases
were examined under the noisy modal data. The contaminated signal for mode shape can be
represented as [45];
𝜙𝑥𝑖̅̅ ̅̅ = 𝜙𝑥𝑖 (1 + 𝛾𝑥
𝜙𝜌𝑥
𝜙|𝜙𝑚𝑎𝑥,𝑖|) (10)
Where 𝜙𝑥𝑖̅̅ ̅̅ and 𝜙𝑥𝑖 are mode shape components of the i
th mode at location x with and
without noise, respectively; 𝛾𝑥𝜙 is a random number with a mean equal to zero and a variance
equals to 1; 𝜌𝑥𝜙 refers to the random noise level considered and 𝜙𝑚𝑎𝑥,𝑖 is the largest component
in the ith
mode shape.
Figs. 17 to 20 illustrate the results for locating damage using DIV with and without
noise under damage cases DC1, DC2, DC3 and DC8 respectively. The DIV plots under noisy
modal data, for the damage cases considered have similar features as observed earlier for
(a) (b)

noise free condition. They have clear peaks at the damage locations in both single and
multiple damage cases. This shows that DIV using the vertical components of the vibration
modes performs well for locating damage even in the presence of 5% noise in the mode shape
data.
The results in this section confirm that the proposed component specific DIV is capable
of detecting and locating damage in all three types of cables in the suspension bridge
structure.
Fig. 17. DC1 - DIV
Fig. 18. DC2 - DIV
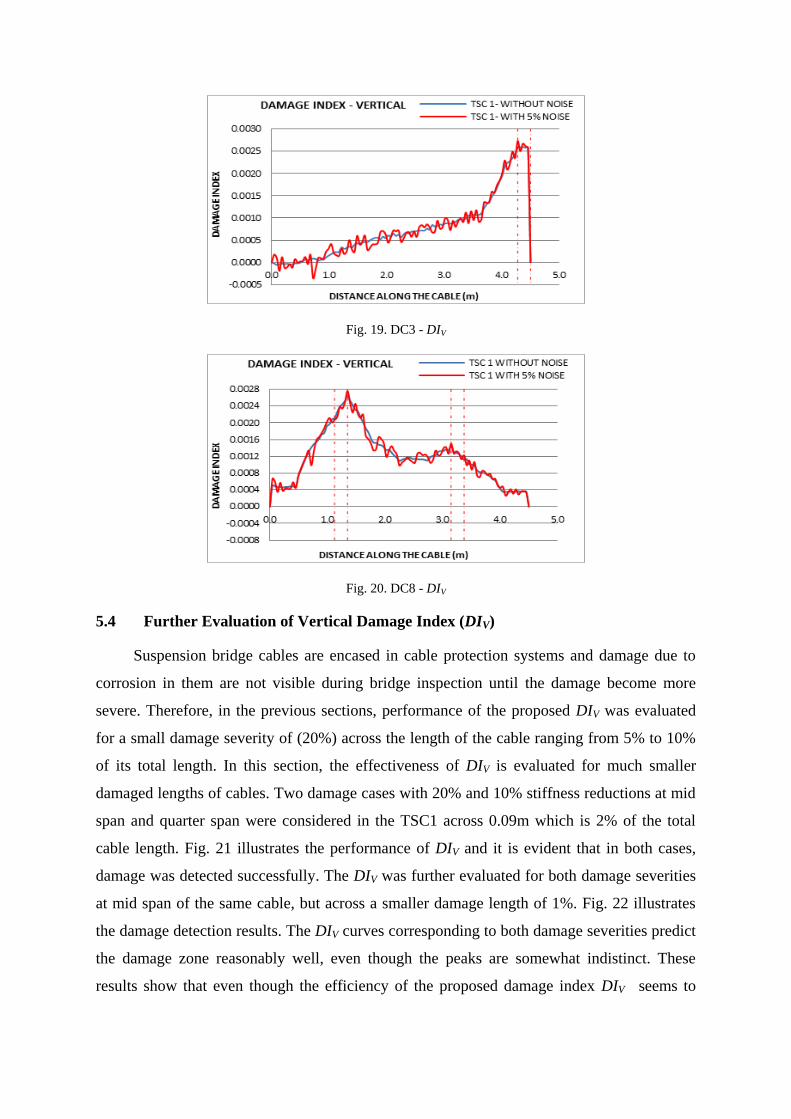
Fig. 19. DC3 - DIV
Fig. 20. DC8 - DIV
5.4 Further Evaluation of Vertical Damage Index (DIV)
Suspension bridge cables are encased in cable protection systems and damage due to
corrosion in them are not visible during bridge inspection until the damage become more
severe. Therefore, in the previous sections, performance of the proposed DIV was evaluated
for a small damage severity of (20%) across the length of the cable ranging from 5% to 10%
of its total length. In this section, the effectiveness of DIV is evaluated for much smaller
damaged lengths of cables. Two damage cases with 20% and 10% stiffness reductions at mid
span and quarter span were considered in the TSC1 across 0.09m which is 2% of the total
cable length. Fig. 21 illustrates the performance of DIV and it is evident that in both cases,
damage was detected successfully. The DIV was further evaluated for both damage severities
at mid span of the same cable, but across a smaller damage length of 1%. Fig. 22 illustrates
the damage detection results. The DIV curves corresponding to both damage severities predict
the damage zone reasonably well, even though the peaks are somewhat indistinct. These
results show that even though the efficiency of the proposed damage index DIV seems to
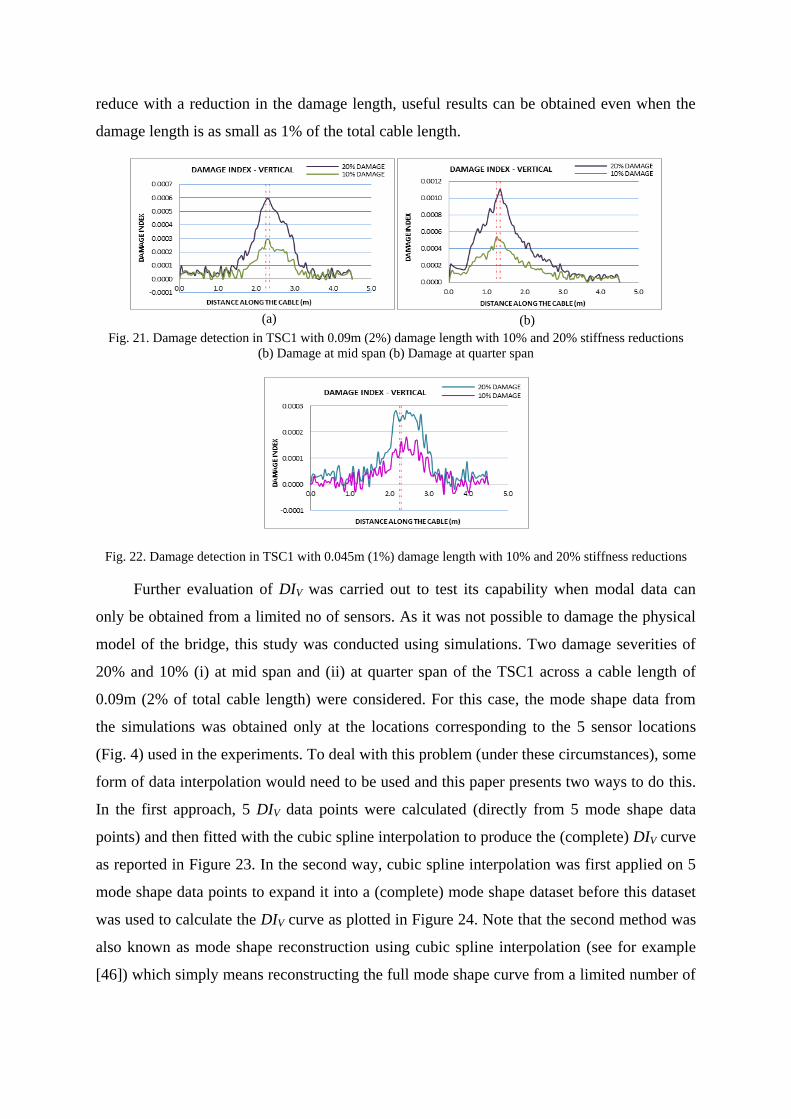
reduce with a reduction in the damage length, useful results can be obtained even when the
damage length is as small as 1% of the total cable length.
Fig. 21. Damage detection in TSC1 with 0.09m (2%) damage length with 10% and 20% stiffness reductions
(b) Damage at mid span (b) Damage at quarter span
Fig. 22. Damage detection in TSC1 with 0.045m (1%) damage length with 10% and 20% stiffness reductions
Further evaluation of DIV was carried out to test its capability when modal data can
only be obtained from a limited no of sensors. As it was not possible to damage the physical
model of the bridge, this study was conducted using simulations. Two damage severities of
20% and 10% (i) at mid span and (ii) at quarter span of the TSC1 across a cable length of
0.09m (2% of total cable length) were considered. For this case, the mode shape data from
the simulations was obtained only at the locations corresponding to the 5 sensor locations
(Fig. 4) used in the experiments. To deal with this problem (under these circumstances), some
form of data interpolation would need to be used and this paper presents two ways to do this.
In the first approach, 5 DIV data points were calculated (directly from 5 mode shape data
points) and then fitted with the cubic spline interpolation to produce the (complete) DIV curve
as reported in Figure 23. In the second way, cubic spline interpolation was first applied on 5
mode shape data points to expand it into a (complete) mode shape dataset before this dataset
was used to calculate the DIV curve as plotted in Figure 24. Note that the second method was
also known as mode shape reconstruction using cubic spline interpolation (see for example
[46]) which simply means reconstructing the full mode shape curve from a limited number of
(a) (b)
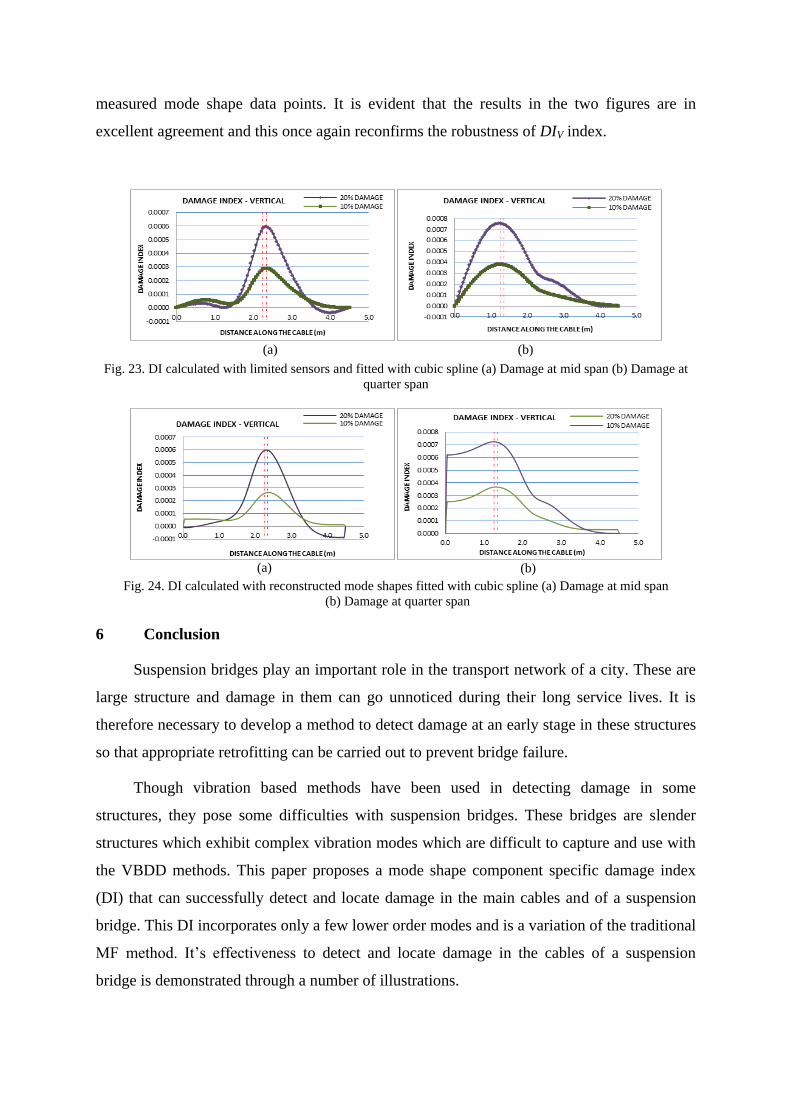
measured mode shape data points. It is evident that the results in the two figures are in
excellent agreement and this once again reconfirms the robustness of DIV index.
Fig. 23. DI calculated with limited sensors and fitted with cubic spline (a) Damage at mid span (b) Damage at
quarter span
Fig. 24. DI calculated with reconstructed mode shapes fitted with cubic spline (a) Damage at mid span
(b) Damage at quarter span
6 Conclusion
Suspension bridges play an important role in the transport network of a city. These are
large structure and damage in them can go unnoticed during their long service lives. It is
therefore necessary to develop a method to detect damage at an early stage in these structures
so that appropriate retrofitting can be carried out to prevent bridge failure.
Though vibration based methods have been used in detecting damage in some
structures, they pose some difficulties with suspension bridges. These bridges are slender
structures which exhibit complex vibration modes which are difficult to capture and use with
the VBDD methods. This paper proposes a mode shape component specific damage index
(DI) that can successfully detect and locate damage in the main cables and of a suspension
bridge. This DI incorporates only a few lower order modes and is a variation of the traditional
MF method. It’s effectiveness to detect and locate damage in the cables of a suspension
bridge is demonstrated through a number of illustrations.
(a) (b)
(a) (b)

A laboratory model of a suspension bridge with pre-tension cables was selected to test
the damage detection process. This bridge model had top supporting cables, bottom pre-
tensioned reverse profile cables in the vertical plane and pre-tensioned bi-concave side cables
in the horizontal plane. Since vertical and torsional vibration modes were present in the first
few vibration modes, components specific DIs (DIL and DIV) which incorporate only the
lateral and vertical components of the mode shapes respectively were developed and applied
to detect and locate damage in the three different types of the cables under single and
multiple damage scenarios. It has been shown that the vertical damage index calculated using
only the vertical components of the mode shapes (DIV) can detect and locate damage
successfully in all three types of cables under both single and multiple damage scenarios.
The main findings of this study are presented below:
Results obtained with the proposed DIV showed its superior damage detection
capability compared with the traditional MF difference method.
The proposed DIV was capable of successfully detecting damage in all three
cable types; the top supporting, bottom reverse profiled and bi-concave side
cables, under all damage scenarios considered. Damage severities of 10%-20%
stiffness reductions across 1% - 10% cable lengths were treated.
It was shown that DIV can successfully detect and locate damage even in the
presence of 5% measurement noise in mode shape data for the all damage
scenarios considered.
Damage detection capability of DIV with limited modal data was also shown. It
was evident that DIV can accurately detect damage with 10% to 20% of stiffness
reductions across 2% of cable length, when modal data from a limited number
of locations is used.
The contribution of higher order modes to the damage detection ability of the
proposed DI was small and reasonably accurate damage detection results can be
obtained using only the first three modes of vibration (with the proposed DI).
Due to the higher modal mass distribution in the vertical direction of this bridge,
DIV showed better performance in damage detection. This is also evidenced by
the fact that the dominant vibration in this suspension bridge model was in the
vertical direction, and therefore, DIV showed better performance in damage
detection in the cables of this suspension bridge.

Overall, the applicability of a component specific DI for detecting and locating damage in the
different cables of this rather complex suspension bridge structure with pre-tensioned cables
has been demonstrated. The findings of this study can be used to detect damage in the main
cables of suspension bridges to enhance their life spans.
7 Acknowledgments
This research forms a part of a study of structural health monitoring of structures at
Queensland University of Technology, Australia. Wasanthi R. Wickramasinghe is a PhD
student supported by Queensland university of Technology Postgraduate Research Award.
The guidance provided by the supervisors is greatly appreciated. Further, facilities provided
to conduct the experiment by Banyo Pilot Plant Precinct and Engineering Precinct of QUT
are also acknowledged.
8 References
[1] H.W. Shih, D. Thambiratnam, T.H.T. Chan, Damage detection in truss bridges using vibration based multi-criteria approach, Structural Engineering and Mechanics, 39 (2011) 187-206. [2] T.M. Whalen, The behavior of higher order mode shape derivatives in damaged, beam-like structures, Journal of sound and vibration, 309 (2008) 426-464. [3] B.L. Wahalathantri, D.P. Thambiratnam, T.H. Chan, S. Fawzia, Vibration based baseline updating method to localize crack formation and propagation in reinforced concrete members, Journal of Sound and Vibration, 344 (2015) 258-276. [4] A. Alvandi, C. Cremona, Assessment of vibration-based damage identification techniques, Journal of Sound and Vibration, 292 (2006) 179-202. [5] F.L. Wang, T.H. Chan, D.P. Thambiratnam, A.C. Tan, C.J. Cowled, Correlation-based damage detection for complicated truss bridges using multi-layer genetic algorithm, Advances in Structural Engineering, 15 (2012) 693-706. [6] Y. Yan, H. Hao, L. Yam, Vibration-based construction and extraction of structural damage feature index, International journal of solids and structures, 41 (2004) 6661-6676. [7] F. Choi, J. Li, B. Samali, K. Crews, Application of the modified damage index method to timber beams, Engineering Structures, 30 (2008) 1124-1145. [8] J.T. Kim, J.H. Park, B.J. Lee, Vibration-based damage monitoring in model plate-girder bridges under uncertain temperature conditions, Engineering Structures, 29 (2007) 1354-1365. [9] Y. Zhang, L. Wang, S.T. Lie, Z. Xiang, Damage detection in plates structures based on frequency shift surface curvature, Journal of Sound and Vibration, 332 (2013) 6665-6684. [10] H.A. Razak, F. Choi, The effect of corrosion on the natural frequency and modal damping of reinforced concrete beams, Engineering Structures, 23 (2001) 1126-1133. [11] R. Curadelli, J. Riera, D. Ambrosini, M. Amani, Damage detection by means of structural damping identification, Engineering Structures, 30 (2008) 3497-3504. [12] R.J. Allemang, The modal assurance criterion–twenty years of use and abuse, Sound and vibration, 37 (2003) 14-23. [13] S. Choi, S. Park, N. Stubbs, Nondestructive damage detection in structures using changes in compliance, International Journal of Solids and Structures, 42 (2005) 4494-4513. [14] V. Dawari, G. Vesmawala, Modal Curvature and Modal Flexibility Methods for Honeycomb Damage Identification in Reinforced Concrete Beams, Procedia Engineering, 51 (2013) 119-124.

[15] M. Cao, M. Radzieński, W. Xu, W. Ostachowicz, Identification of multiple damage in beams based on robust curvature mode shapes, Mechanical Systems and Signal Processing, 46 (2014) 468-480. [16] A.K. Pandey, M. Biswas, Damage detection in structures using changes in flexibility, Journal of Sound and Vibration, 169 (1994) 3-17. [17] T. Toksoy, A. Aktan, Bridge-condition assessment by modal flexibility, Experimental Mechanics, 34 (1994) 271-278. [18] A. Pandey, M. Biswas, Experimental verification of flexibility difference method for locating damage in structures, Journal of Sound and Vibration, 184 (1995) 311-328. [19] J.Y. Wang, J.M. Ko, Y.Q. Ni, Modal sensitivity analysis of Tsing Ma Bridge for structural damage detection, in: SPIE's 5th Annual International Symposium on Nondestructive Evaluation and Health Monitoring of Aging Infrastructure, International Society for Optics and Photonics, 2000, pp. 300-311. [20] Y. Ni, H. Zhou, K. Chan, J. Ko, Modal Flexibility Analysis of Cable‐Stayed Ting Kau Bridge for Damage Identification, Computer‐Aided Civil and Infrastructure Engineering, 23 (2008) 223-236. [21] P.H.N. Moragaspitiya, D.P. Thambiratnam, N.J. Perera, T.H.T. Chan, Development of a vibration based method to update axial shortening of vertical load bearing elements in reinforced concrete buildings, Engineering Structures, 46 (2013) 49-61. [22] M. Montazer, S. Seyedpoor, A New Flexibility Based Damage Index for Damage Detection of Truss Structures, Shock and Vibration, 2014 (2014). [23] S. Sung, K. Koo, H. Jung, Modal flexibility-based damage detection of cantilever beam-type structures using baseline modification, Journal of Sound and Vibration, (2014). [24] N. Stubbs, J. Kim, K. Topole, An efficient and robust algorithm for damage localization in offshore platforms, in: Proc. ASCE Tenth Structures Congress, 1992. [25] P. Cornwell, S.W. Doebling, C.R. Farrar, Application of the strain energy damage detection method to plate-like structures, Journal of Sound and Vibration, 224 (1999) 359-374. [26] H.W. Shih, D. Thambiratnam, T.H.T. Chan, Vibration based structural damage detection in flexural members using multi-criteria approach, Journal of Sound and Vibration, 323 (2009) 645-661. [27] E. Manoach, I. Trendafilova, Large amplitude vibrations and damage detection of rectangular plates, Journal of Sound and Vibration, 315 (2008) 591-606. [28] C.R. Farrar, D.A. Jauregui, Comparative study of damage identification algorithms applied to a bridge: I. Experiment, Smart Materials and Structures, 7 (1998) 704. [29] W.R. Wickramasinghe, Damage detection in suspension bridges using vibration characteristics in: School of Civil Engineering & Built Environment, Queensland University of Technology (QUT), , 2015. [30] S.W. Doebling, C.R. Farrar, Computation of structural flexibility for bridge health monitoring using ambient modal data, in: Proceedings of the 11th ASCE Engineering Mechanics Conference, Citeseer, 1996, pp. 1114-1117. [31] Y. Gao, B. Spencer, Damage localization under ambient vibration using changes in flexibility, Earthquake Engineering and Engineering Vibration, 1 (2002) 136-144. [32] E. Parloo, B. Cauberghe, F. Benedettini, R. Alaggio, P. Guillaume, Sensitivity-based operational mode shape normalisation: application to a bridge, Mechanical Systems and Signal Processing, 19 (2005) 43-55. [33] A. Yan, J.-C. Golinval, Structural damage localization by combining flexibility and stiffness methods, Engineering Structures, 27 (2005) 1752-1761. [34] M.H. Huang, D.P. Thambiratnam, N.J. Perera, Vibration characteristics of shallow suspension bridge with pre-tensioned cables, Engineering structures, 27 (2005) 1220-1233. [35] H. Li, H. Yang, S.-L.J. Hu, Modal strain energy decomposition method for damage localization in 3D frame structures, Journal of engineering mechanics, 132 (2006) 941-951. [36] C. Rainieri, G. Fabbrocino, Operational Modal Analysis of Civil Engineering Structures: An Introduction and Guide for Applications, Springer, 2014.

[37] A. Cunha, E. Caetano, F. Magalhães, Output-only dynamic testing of bridges and special structures, Structural Concrete, 8 (2007) 67-85. [38] R. Brincker, P. Andersen, R. Cantieni, Identification and level I damage detection of the Z24 highway bridge, Experimental techniques, 25 (2001) 51-57. [39] L. Zhang, R. Brincker, P. Andersen, An overview of operational modal analysis: major development and issues, Mechanical Systems and Signal Processing, (2009). [40] T. Nguyen, T.H. Chan, D.P. Thambiratnam, Effects of wireless sensor network uncertainties on output-only modal analysis employing merged data of multiple tests, Advances in Structural Engineering, 17 (2014) 319-330. [41] R. Cantieni, Experimental methods used in system identification of civil engineering structures, in: Proceedings of the International Operational Modal Analysis Conference (IOMAC), 2005, pp. 249-260. [42] P. ANSYS Inc.(Canonsburg, 2012), Version 14.5, in: Workbench, ANSYS. [43] M.J.D. Sloane, R. Betti, G. Marconi, A.L. Hong, D. Khazem, An Experimental Analysis of a Non-Destructive Corrosion Monitoring System for Main Cables of Suspension Bridges, Journal of Bridge Engineering, (2012). [44] Z. Shi, S. Law, L. Zhang, Damage localization by directly using incomplete mode shapes, Journal of Engineering Mechanics, 126 (2000) 656-660. [45] Z. Shi, S. Law, L.M. Zhang, Structural damage detection from modal strain energy change, Journal of engineering mechanics, 126 (2000) 1216-1223. [46] A.A. Cury, C.C.H. Borges, F.S. Barbosa, A two-step technique for damage assessment using numerical and experimental vibration data, International journal of structural health monitoring, 10 (4) 417-428.