exergy analysis of olkaria i power plant, … · geothermal training programme reports 2005...
TRANSCRIPT

GEOTHERMAL TRAINING PROGRAMME Reports 2005 Orkustofnun, Grensásvegur 9, Number 5 IS-108 Reykjavík, Iceland
1
EXERGY ANALYSIS OF OLKARIA I POWER PLANT, KENYA
Clety Bore Kwambai Kenya Electricity Generating Company Ltd.
Olkaria Geothermal Power Plant P.O. Box 785, Naivasha 20117
KENYA [email protected]
ABSTRACT
The processes of electricity production from geothermal resources at Olkaria I Power Plant in Kenya were analysed using the exergy analysis method. The objectives of the analysis were to determine the overall second law (exergy) of efficiency of the power plant, pinpoint the locations and quantities of exergy losses and wastes and suggest ways to address these losses and wastes. In the analysis, the power plant was simplified into sub-systems, each with distinct exergy inflows and outflows and approximated into steady-state flow. The theory and mathematical formulations were adapted from the book ‘Exergy methods of thermal plant analysis’ and several online internet publications. Mathematical models for exergy flows were developed and analysed using the Engineering Equation Solver (EES) software to perform the calculations. The degree of thermodynamic perfection (measure of performance) was based on the rational efficiency concept. A few assumptions and simplifications were made. The results show that Olkaria I Power Plant has an overall second law of efficiency of 34.6% and an overall first law of efficiency of 15%. The analysis reveals that 6 MW of exergy are wasted in the separated brine while 11 MW exergy are lost in the steam transmission system. Significant losses are found to occur in the turbines, condensers and the GES system. Although the exergy in the wasted brine is relatively small compared to that in the steam, it could still be put to useful work at some investment cost. It is concluded that exergy analysis is an important tool for analysing the performance of geothermal plants and should be incorporated into their designs. It is suggested that the steam transmission system should be investigated further to determine the causes of exergy losses and that ways of utilizing the exergy in the brine be investigated.
1. INTRODUCTION The article ‘Energy, status report’ (World Energy Forum, 2003) indicates that the world’s energy demands have been increasing rapidly over the past few years as a result of an increase in the world’s population and economic growth. The article reports that the world energy consumption quadrupled between 1950 and 1992. Despite the high growth in energy demands, traditional world energy resources such as fossil fuels and hydro resources have been declining (World Energy Council, 2001).

Bore Kwambai Report 5 2
In addition, the links between the use of energy resources and impacts on the environment have become clearer over recent years. The increase in energy demands, decline in energy resources and the link between energy utilization and environmental impacts have resulted in calls for a sustainable approach to the development and management of the earth’s energy resources (Rosen and Dincer, 2001). With finite energy resources and large (and increasing) energy demands, it becomes increasingly important to understand the mechanisms which degrade the quality of energy and energy resources and to develop systematic approaches for improving the systems (Gong and Wall, 1997). Systems and processes that degrade the quality of energy resources can only be identified through a detailed analysis of the whole system. Exergy analysis has been cited by many researchers and practising engineers to be a powerful tool to identify and quantify energy degrading processes since it enables the types, locations and quantities of energy losses to be evaluated. The exergy analysis method has been used for analytical studies in many optimization studies of energy systems. It uses the principles of the First Law of Thermodynamics (conservation of energy) together with the Second Law of Thermodynamics for the analysis, design and improvement of energy systems. Exergy is a concept that clearly shows the usefulness of energy and shows what is consumed in the course of energy transfer and conversions.
In this report, an exergy analysis study of Olkaria I geothermal power plant in Kenya is presented. The study was carried out to determine the overall second law of efficiency for the power plant, identify the locations and processes where exergy is wasted, lost or destroyed and suggest steps that can be taken to reduce exergy losses and wastes. Olkaria I power plant is located in the Olkaria geothermal area of Kenya, about 120 km northwest of the capital city, Nairobi (Figure 1). The plant has three condensing steam turbine generating units each with a nominal rating of 15 MWe each. The first unit was commis-sioned in 1981 followed by the second and third units in 1982 and 1985, respectively. The plant currently receives steam from 26 production wells located on the Olkaria East production field, in the Great Olkaria geothermal area. Traditionally, the performance audit of the power plant was based on evaluating the specific steam consumption (SSC) index for each turbine. This is done after a major overhaul is conducted once every five years. Other measures of performance used to include monthly plant availability factors,
0°
2°S
38°C36°C
North IslandL. Turkana
Central Island
South Island
Barrier Volcano
Emuruangogolak
SilaliPaka KENYA
Nyambeni
Mt. Kenya
Longonot
Nairobi
Olorgesaille
ShomboleChyulu
Ol'DoinyoLengai
0 50 100 150
Kilometers
Volcanic centerLake
Rift FaultKilimanjaro
Suswa
Eburru
Ol'Esakut
Korosi
Kisumu
ETHIOPIA4°N
Mt. Elgon
L. Magadi
Geothermal ProspectGeothermal Field
L. Naivasha
Arus-BogoriaL. Baringo
Namarunu 2°N
4°S
LEGEND
Scale
L. Natron
TANZANIA
Olkaria
Olkaria Area of study
L. NakuruL. Victoria
FIGURE 1: Map of Kenya showing the location of Olkaria geothermal area (Lagat, 2004)
Report 5 Bore Kwambai 3
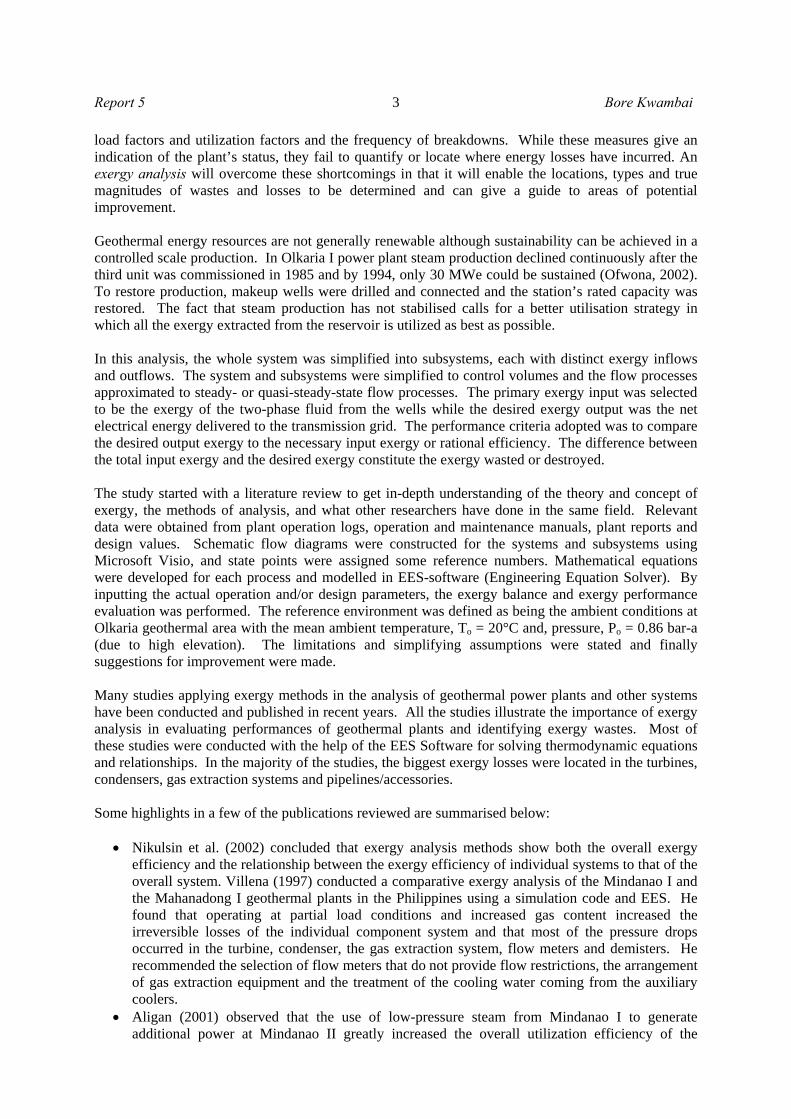
load factors and utilization factors and the frequency of breakdowns. While these measures give an indication of the plant’s status, they fail to quantify or locate where energy losses have incurred. An exergy analysis will overcome these shortcomings in that it will enable the locations, types and true magnitudes of wastes and losses to be determined and can give a guide to areas of potential improvement. Geothermal energy resources are not generally renewable although sustainability can be achieved in a controlled scale production. In Olkaria I power plant steam production declined continuously after the third unit was commissioned in 1985 and by 1994, only 30 MWe could be sustained (Ofwona, 2002). To restore production, makeup wells were drilled and connected and the station’s rated capacity was restored. The fact that steam production has not stabilised calls for a better utilisation strategy in which all the exergy extracted from the reservoir is utilized as best as possible. In this analysis, the whole system was simplified into subsystems, each with distinct exergy inflows and outflows. The system and subsystems were simplified to control volumes and the flow processes approximated to steady- or quasi-steady-state flow processes. The primary exergy input was selected to be the exergy of the two-phase fluid from the wells while the desired exergy output was the net electrical energy delivered to the transmission grid. The performance criteria adopted was to compare the desired output exergy to the necessary input exergy or rational efficiency. The difference between the total input exergy and the desired exergy constitute the exergy wasted or destroyed. The study started with a literature review to get in-depth understanding of the theory and concept of exergy, the methods of analysis, and what other researchers have done in the same field. Relevant data were obtained from plant operation logs, operation and maintenance manuals, plant reports and design values. Schematic flow diagrams were constructed for the systems and subsystems using Microsoft Visio, and state points were assigned some reference numbers. Mathematical equations were developed for each process and modelled in EES-software (Engineering Equation Solver). By inputting the actual operation and/or design parameters, the exergy balance and exergy performance evaluation was performed. The reference environment was defined as being the ambient conditions at Olkaria geothermal area with the mean ambient temperature, To = 20°C and, pressure, Po = 0.86 bar-a (due to high elevation). The limitations and simplifying assumptions were stated and finally suggestions for improvement were made. Many studies applying exergy methods in the analysis of geothermal power plants and other systems have been conducted and published in recent years. All the studies illustrate the importance of exergy analysis in evaluating performances of geothermal plants and identifying exergy wastes. Most of these studies were conducted with the help of the EES Software for solving thermodynamic equations and relationships. In the majority of the studies, the biggest exergy losses were located in the turbines, condensers, gas extraction systems and pipelines/accessories. Some highlights in a few of the publications reviewed are summarised below:
• Nikulsin et al. (2002) concluded that exergy analysis methods show both the overall exergy efficiency and the relationship between the exergy efficiency of individual systems to that of the overall system. Villena (1997) conducted a comparative exergy analysis of the Mindanao I and the Mahanadong I geothermal plants in the Philippines using a simulation code and EES. He found that operating at partial load conditions and increased gas content increased the irreversible losses of the individual component system and that most of the pressure drops occurred in the turbine, condenser, the gas extraction system, flow meters and demisters. He recommended the selection of flow meters that do not provide flow restrictions, the arrangement of gas extraction equipment and the treatment of the cooling water coming from the auxiliary coolers.
• Aligan (2001) observed that the use of low-pressure steam from Mindanao I to generate additional power at Mindanao II greatly increased the overall utilization efficiency of the

Bore Kwambai Report 5 4
geothermal resource in the field and concluded that the turbines and the cooling water systems were the major sources of overall exergy losses. Bettagli and Bidini (1996) carried an out an energy-exergy analysis of the entire geothermal fluid network in Larderello, Italy where they analysed the various types of losses in the system and found that the exergy losses of the transportation network were much lower than those of the production plant and had little effect on the overall efficiency. They found that the main exergy losses were concentrated in the turbine, condenser and cooling tower. They concluded that it would be pointless to make large investments to improve the other components since they would have minimal effects on the overall system compared to the cited plant components.
• Soekono (1995) conducted an exergy and energy audit of the Darajat geothermal plant in the Philippines after pressure declined in its reservoir. He found that most of the exergy losses were located at the condenser and turbine and considerable losses also occurred in the wellbore pipes and valves. He suggested that the performance of the turbine could be improved through retrofitting so that the inter-stage temperature drops could be equalised as required. Dorj (2005) demonstrated that exergy analysis plays a great role in plant and system design as locations for potential exergy losses can be identified in advance and focused on in the design stage.
2. THEORETICAL ANALYSIS 2.1 The concept of exergy In the real world, states of complete equilibrium are hardly attainable. Any system that is at a temperature, pressure or chemical composition above that of its surroundings is not in equilibrium and has a potential to do work. This work potential is referred to as the exergy of the system. When the properties of a system are equal to those of its environment, the exergy of the system is zero. The state in which a system and its surroundings are in equilibrium is known as the dead state. Exergy is a measure of how a system deviates from a state of equilibrium with its environment and is, therefore, a property of the system and its surroundings. Exergy is another word used to describe available energy or the measure of energy available to do work above a heat sink (Rosen and Dincer, 2001). Exergy presents the most natural and convenient universal standard of energy quality by using environmental parameters as the reference states and is a common standard for examining the exploitability of a reservoir. The exergy of a resource gives an indication of how much work can be done by the resource within a given environment. The exergy concept explicitly shows the usefulness (quality) of energy and matter in addition to what is consumed in the course of energy transfer or conversion steps. When exergy looses its quality, it results in exergy destroyed. Other terms commonly used to refer to exergy include: available energy, availability and exsergy. Kotas (1995) states that ‘the exergy of a steady stream of matter is equal to the maximum amount of work obtainable when the stream is brought from its initial state to the dead state by processes during which the stream may interact only with the environment’. Thus, the exergy of a stream is a property of the state of the stream and the state of the environment. Once a system is in equilibrium with its surroundings, it is not possible to use the energy within the system to produce work. At this point, the exergy of the system has been completely destroyed. Exergy like energy exists in kinetic, potential, chemical and physical exergy forms. The kinetic and potential exergies are high-grade exergy forms associated with ordered forms of matter and fully convertible to useful work. Chemical and physical exergies on the other hand are low-grade forms associated with disordered forms of matter and cannot easily be converted to work.

Report 5 Bore Kwambai 5
2.2 Exergy and energy Energy is defined as motion or the ability to cause motion and is always conserved in a process (obeys the First Law of Thermodynamics). On the other hand, exergy is defined as work or the ability to cause work and is always conserved in a reversible process, but is always consumed in an irreversible process (obeys the Second Law of Thermodynamics). While energy is a measure of quantity, exergy is a measure of quantity and quality. Exergy like energy can be transported across the boundary of a system. For each energy transfer, there is a corresponding exergy transfer. The First Law of Thermodynamics states that energy can neither be created nor destroyed. Energy is available in many different forms and may be converted between these forms. The Second Law of Thermodynamics states that conversions of energy are possible only if the total entropy increases. By introducing exergy, energy and entropy may be treated simultaneously. The quality of energy is described by the concept of entropy. High entropy is equal to a low quality of energy. Different energy forms have different qualities, indicating to what extent they are theoretically convertible to mechanical work. This limitation, a law of nature, implies that total energy quality always decreases in each conversion (the Second Law of Thermodynamics). 2.3 Exergy analysis (exergy balance) Figure 2 illustrates exergy flow through a system or process. One of the main uses of the concept of exergy is an exergy balance in the analysis of thermal systems. An exergy balance (exergy analysis) can be looked at as a statement of the law of degradation energy (Kotas, 1995). An exergy analysis is a mathematical tool for evaluation of exergy flows through a system and has been cited as a powerful tool for optimization studies and as a primary tool in addressing the impact of energy resource utilization on environment. A careful evaluation of processes using exergy analysis enables the identification of the source of inefficiencies and waste which leads to improved designs and resultant savings. Exergy analysis is a tool for identifying the types, locations and magnitudes of thermal losses. Identifying and quantifying these losses allows for the evaluation and improvement of the designs of thermodynamic systems. It is an effective method, using conservation of mass and the conservation of energy principle together with the Second Law of Thermodynamics for design and analysis of energy systems. Exergy balance methods, commonly known as exergy analysis, can indicate the quantity and quality of heat losses and the locations of energy degradation (quantify and identify causes of energy degradation). Most cases of thermodynamic imperfection cannot be detected by an energy analysis (Rosen, 2002). Certain processes like throttling, heat transfers, expansion and friction involve no energy losses but they degrade the quality of energy and its ability to do work and therefore involve exergy losses.
FIGURE 2: Illustration of exergy flow through a system
GROSS EXERGY INPUT
USEFUL EXERGY OUTPUT
WASTED EXERGY OUTPUT
EXERGY DESTROYED
SYSTEM OR
PROCESS
GROSS EXERGY INPUT
USEFUL EXERGY OUTPUT
WASTED EXERGY OUTPUT
EXERGY DESTROYED
SYSTEM OR
PROCESS

Bore Kwambai Report 5 6
2.4 Mathematical expressions of exergy balance General exergy expressions: For a stream of matter, the total exergy flow Etotal (kJ), can be expressed as:
OPHPEKEtotal EEEEE +++= (1)
where EKE = Kinetic exergy; EPE = Potential exergy; EPH = Physical exergy; EO = Chemical exergy. Both EKE and EPE are associated with high-grade energy and are fully convertible to work, while EPH and EO are low-grade energy where the stream has to undergo physical and chemical processes while interacting with the environment. For this study, only physical-exergy shall be considered since the process involves only fixed composition flows (Rosen, 1999). Therefore, exergy will be expressed as equal to the maximum work when the stream of a substance is brought from its initial state to the environmental state defined by P0 and T0 by physical processes involving only thermal interaction with the environment (Kotas, 1995):
[ ])()( 000 ssThhmEE iiiPHtotal −−−== (2) where i = Refers to state points;
0 = Refers to the environmental state; m = Mass flow rate (kg/s); h = Enthalpy (kJ/kg );
s = Entropy ( kJ/kgK); T = Temperature (K). Control volume exergy balance For a control volume, an exergy balance equation can be expressed as:
destroyedwastedesiredinput EEEE ++= (3)
where Einput = Total exergy inflow into the control volume; Edesired = Total desired exergy output (net work output); Ewaste = Sum of exergy from the system other than the desired; Edestroyed = Sum of exergy lost in the system as a result of irreversibilities. Edestroyed is directly related to entropy generation by the equation:
sTEdestroyed 0= (4) Criteria of performance The performance criteria of exergy systems depend on exergy transfer rates in and out of control volumes. Kotas (1995) categorized exergy transfers as those that represent the desired output of the process and those which represent the necessary input. Exergy inputs and outputs may be work, exergy associated with heat transfer, exergy associated with the flow of matter in or out of a control region or change of exergy of a stream of matter passing through a control region such as a throttle valve or a heat exchanger. The most commonly used measure of the performance of a system in terms of exergy is the exergy efficiency which is a measure of the performance of a system relative to the maximum theoretical

Report 5 Bore Kwambai 7
performance of the system. There are three kinds of exergy efficiency terms often used namely; simple, rational and efficiency with transiting exergy. Simple efficiency is defined as a ratio of the sum of exergy outputs to the sum of exergy inputs. Rational efficiency is defined as the ratio of the sum of desired exergy outputs to the sum of the necessary exergy inputs. Efficiency with transiting exergy is the ratio of exergy outputs minus the unused exergy outputs to the total exergy input. The Rational analysis concept will be used for this study since it is the most appropriate measure of performance. The rational exergy efficiency is expressed as:
input
desired
EE
=εη (5)
destroyedoutputinput EEE += (6)
wastedesiredoutput EEE += (7)
where Edesired = Sum of desired exergy outputs (net positive work by the system); Edestroyed = Exergy rate lost in the system as a result of irreversibilities; Ewaste = Exergy exiting the system which still has capacity to do work.
2.5 Conceptual framework This study is based on the concept that for a system that undergoes a process under steady- or quasi-steady-state conditions, the exergetic efficiency (second law efficiency, effectiveness or rational efficiency) is a valid measure of the performance of the system from a thermodynamic point of view. Thus, a physical exergy analysis of a geothermal plant used in conjunction with an energy analysis enables the locations, types and true magnitudes of wastes and losses to be determined. More revealing insights can be made if the analysis is conducted using varying reference environments and then compared using the same reference environment. 2.6 Reference environment Exergy is evaluated with respect to a reference-environment model. The state of the reference environment is specified by its temperature, pressure and chemical composition. The results are relative to the specified reference environment, which in most applications is modelled after the actual local environment. The environment is assumed to be a very large simple compressible system modelled as a thermal reservoir with a uniform and constant temperature, T0, and pressure, P0. The environment must be a large reservoir so that its intensive properties are not significantly changed by the processes taking place. For practical analysis, the earth’s atmosphere, the earth’s crust, the ocean or large rivers or lakes are often considered as environments although they are not absolutely uniform and their properties may not be constant. A global standard environment can be defined in terms of standard atmospheric conditions at sea level and a universal chemical composition. Since temperature conditions and air pressure vary from place to place, it is necessary to introduce local standards. The more a system deviates from its environment, the more exergy it carries. For this analysis, the reference environment will be the local environment at Olkaria geothermal area of Kenya, at an altitude of 1900 metres above sea level. The mean ambient temperature T0 is 20°C and atmospheric pressure P0 is 0.86 bar-a. The standard international air composition modelled by Dincer and Cengel (2001) will be assumed.

Bore Kwambai Report 5 8
3. METHODOLOGY 3.1 General approach The system was simplified into control volumes with distinct exergy inflows and outflows from each volume representing the different process flows. The processes were approximated to steady or quasi-steady- state flow conditions. The desired exergy output was compared to the necessary exergy input (rational efficiency). A project layout (structure) was designed and schematic flow diagrams were drawn for the system and the subsystems (processes). Relevant data were acquired and processed using an Excel spread sheet. Equations for analysis of each subsystem were derived and a model created in EES. By inputting the real operation and/or design parameters, the exergy balance and exergy performance evaluation were performed. The reference environment was defined as being the local environment of the Olkaria area. The limitations and simplifying assumptions were stated and finally conclusions and suggestions were made. 3.2 Scope and limitations This study considers the total exergy of fluids received from the production geothermal wells as the available exergy for the system and that from the connected wells as the primary exergy input into the system. The net electrical energy delivered to the transmission grid is the overall desired exergy output. The processes analysed include two-phase fluid production and separation, steam transmission, steam expansion and condensation, NCG removal and cooling. Each of the processes consists of exergy inputs and exergy outputs with some exergy losses. As mentioned before, this study is limited to the analysis of the physical exergy. The other forms of exergy are ignored as being insignificant to the processes involved. The wells outputs are not uniform but for this analysis, they will be assumed to be uniform. Most measurements are not available online and therefore instantaneous readings are used. Where data are missing, estimations or design values are used. 3.3 Sources of data
The data used in this analysis were obtained from the following sources:
• Actual plant operations logs for 30 July 2005, the logs used included: daily plant logs, turbine logs, auxiliary equipment logs and occurrence book;
• Daily steam field monitoring reports; • Status report on steam production for September, 2002; • Efficiency test reports for 1997, 2000 and 2004 (units 3, 2 and 1, respectively); • Turbine maintenance manuals for plant design parameters; • Internet downloads for universal parameters.
3.4 General assumptions The following general assumptions were made in the exergy calculations:
1. NCG (non-condensable gases) was treated as pure CO2 and was assumed to be 0.25% of steam by weight.

Report 5 Bore Kwambai 9
2. Any mass of air that leaks into the system becomes part of the NCG and has the same exergy value.
3. Geothermal fluid was assumed to have the same properties as pure water. 4. The systems and processes were approximated as steady-state control volumes. 5. Pressure drops between state points are neglected in the calculations and all processes are
considered adiabatic (no heat exchange with the environment). 6. Where no actual data was available or they were unreliable, design values were used in
calculations. 7. Kinetic exergy, potential exergy and chemical exergy were neglected 8. Specific assumptions were made in the analysis of each subsystem
3.5 Analysis and treatment of data The data were compiled, organised and prepared to suit processing using EES. The preparation of the data was made using the Microsoft Excel spreadsheet. The obtained data were then imported into EES to calculate exergy losses and exergetic efficiencies. SI units were used for all analyses. 3.6 Accuracy and general sources of error The most likely cause of error is the accuracy of measuring instruments. The instruments are not always in excellent calibration and hence results are not always conclusive. Generally, possible sources of errors include:
1. The production value for the wells was based on the steam production update of September 2002. A lot could have changed since then and the unaccounted for changes could introduce errors and inaccuracies.
2. The output from the wells was assumed to be constant and steady but in reality, this may not be the case. Some wells are known to be cyclic and this introduces some errors.
3. Heat and pressure losses were ignored for most processes yet they could be significant in some processes, thus likely to contribute to errors.
4. The values used for the reference environment were the mean ambient conditions. Due to variations in the local ambient conditions, the actual environmental conditions on the day of the analysis may have been different from the mean values, which introduces errors in the calculations.
5. It was assumed that NCG is 0.25% of steam by mass and its properties approximated to CO2 in all calculations although actual values may be different which is a source of errors.
6. Mass flow rates at some state points have been calculated as being equivalent to the specified discharge (name-plate rating) of equipment installed which is not always the case.
7. Using manual logs introduces human error in the reading, recording and interpretation of data. It depends on the operators’ judgement.
8. Steam flow into the turbine was based on past efficiency test results. This could introduce inaccuracies because many changes can have occurred over time.
4. PLANT AND PROCESS DESCRIPTION OF OLKARIA I GEOTHERMAL PLANT 4.1 General plant overview The Olkaria I geothermal power plant is located in the Olkaria East geothermal field which is one of seven geothermal fields that make up the Olkaria geothermal system. The power plant was the pioneer geothermal power plant in Africa and is one of four geothermal power plants currently in

Bore Kwambai Report 5 10
operation in Kenya. The plant has an installed capacity of 45 MWe and is owned and operated by the Kenya Electricity Generating Company Ltd. (KenGen). The Olkaria geothermal system is one of the several geothermal systems on the floor of Kenya’s rift valley (Figure 1). The geothermal system in this field is related to plate tectonics involving faulting and rifting of the continental plate and the resulting volcanic activity during the formation of the African rift valley. Fluid flows and hydrothermal features in the field are mainly controlled by faults (Lagat, 2004). The heat sources to the systems are magmatic intrusions located at depths of 5-8 km. The geothermal reservoir is a high-temperature liquid-dominated type with reservoir temperature ranges of 200-340°C and an average of 230-260°C. The chemistry of the fluids show they are chloride waters with alkaline pH and low total dissolved solids (TDS) and bicarbonate content. Chloride concentrations range from 100 to 1100 ppm and the non-condensable gases (NCG) are about 0.25% of the steam (Karingithi, 2002). Exploration activities in the field date back to the 1950’s when two exploration wells were drilled to 501 and 942 m, but did not produce. In the 1970’s, detailed exploration funded jointly by UNDP and the Kenya government was carried out and the results were encouraging. This was followed by appraisal and production drilling and in 1976, a feasibility study indicated that the resource was viable for electricity production and recommended a 30 MWe plant with a possibility of additional 15 MWe. The first 15 MWe steam turbine was commissioned in March 1981 and was immediately followed by a second and third similar plants in 1982 and 1985, respectively, bringing the station capacity to 45 MWe. The station has been in commercial operation since then. 4.2 Steam field description
The production field at Olkaria I power plant (Figure 3) is divided into eastern and western sectors. There are a total of 34 drilled wells in the field of which 26 are currently producing. The deepest producing well is OW-19 drilled to 2484 m. The shallowest producing well is OW-10, drilled to 1049 m. The wells discharge two-phase fluid with discharge enthalpies ranging from 1400 to 2600 kJ/kg. The two-phase fluid is separated by cyclone separators located at the wellheads. Most wells have individual separating equipment but some wells have shared separating equipment. The wellhead equipment include master valves, auxiliary valves, cyclone separators and hot water collecting tanks, wellhead silencers, bursting discs and ball check valves. The mean properties of geothermal fluids from Olkaria I steam field are given in Table 1. The wells at Olkaria I field discharge at mean wellhead pressures of 7 bar-a. The separated brine is disposed through the wellhead silencers into open cooling ponds from where it drains into open drains for surface disposal. The steam FIGURE 3: Map of Olkaria I East geothermal field

Report 5 Bore Kwambai 11
is fed into steam gathering and transmission pipelines for delivery to the generating units. The steam gathering and transmission pipelines consist of small diameter steam gathering pipes and larger diameter steam transmission pipes. There are 3 steam transmission pipes which are interconnected near the power plant. All the pipes are insulated with calcium silicate blocks (or fibreglass wool) and covered with a sheet of aluminium cladding. The pipelines have expansion loops and drain pots located at the bottom of the steam pipes to collect condensate that forms due to heat losses. Steam traps and orifice plates are installed on the drain pots to remove the condensate. Steam pressure controllers are installed on the steam vent pipes and control the main steam pressure by venting any excess steam into the atmosphere and maintaining the desired steam pressure. The pressure control equipment consists of pneumatic control valves, electro-pneumatic converters and pressure controllers. Moisture separator vessels are located before the turbine inlet to remove any moisture and maintain a high steam quality before entering the turbine.
TABLE 1: Mean properties of geothermal fluids from Olkaria I steam field
Process parameter Unit Value Mean well head pressure (WHP) bar-a 7.17 Mean separator pressure bar-a 6.06 Mean output enthalpy kJ/kg 2192 Total steam available kg/s 196.36 Total brine available kg/s 69.92 Total steam output (connected) kg/s 142.28 Mean quality X 0.75 Mean main steam pressure/temperature bar-a/°C 5.73 / 157.71 Total steam to flow meters kg/s 118 Mean fluid chemistry Unit Quantity % of NCG NCG (0.25% of steam) CO2 mmol/kg 30 77 H2S mmol/kg 5 14 H2 mmol/kg 2.3 6 N2 mmol/kg 1.14 3 SiO2 ppm 600 Cl ppm 520 Na ppm 400
4.3 General equipment description The power plant has three 15 MWe turbine generator sets and related auxiliaries. The three sets are identical in design, construction and operation although they can vary in performance. The general plant layout is shown in Appendix I. A summary of the equipment specifications is given in Table 2. The steam turbines are 4-stage, single cylinder, single-pressure, single-flow condensing turbines. The blades are impulse reaction types with both rotating and stationary blades (diaphragms). The design inlet pressure is 5.0 bar-a dry steam and the exhaust pressure is 0.127 bar-a. The turbine rotors are rigidly coupled to the generator rotors and rotate together at a rotational speed of 3000 RPM. The steam condensers are direct contact types located below the turbines (bottom exhaust). They are fitted with spray nozzles to spray cold water inside the condenser chamber and maintain the desired vacuum (0.127 bar-a). The connection to the turbine is a rubber expansion joint to allow relative expansion. The condenser has a main chamber and a gas cooling section to sub cool the NCG. The condensers drain into the seal pit tank via a barometric leg pipe.
Bore Kwambai Report 5 12
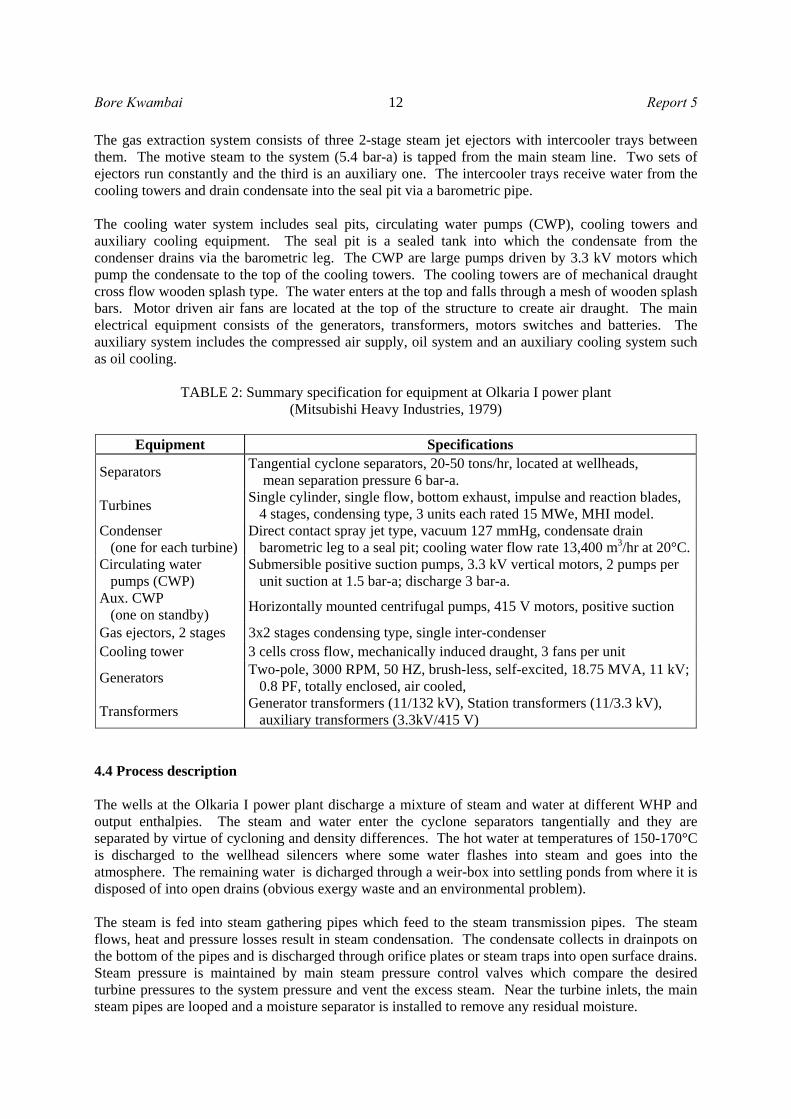
The gas extraction system consists of three 2-stage steam jet ejectors with intercooler trays between them. The motive steam to the system (5.4 bar-a) is tapped from the main steam line. Two sets of ejectors run constantly and the third is an auxiliary one. The intercooler trays receive water from the cooling towers and drain condensate into the seal pit via a barometric pipe. The cooling water system includes seal pits, circulating water pumps (CWP), cooling towers and auxiliary cooling equipment. The seal pit is a sealed tank into which the condensate from the condenser drains via the barometric leg. The CWP are large pumps driven by 3.3 kV motors which pump the condensate to the top of the cooling towers. The cooling towers are of mechanical draught cross flow wooden splash type. The water enters at the top and falls through a mesh of wooden splash bars. Motor driven air fans are located at the top of the structure to create air draught. The main electrical equipment consists of the generators, transformers, motors switches and batteries. The auxiliary system includes the compressed air supply, oil system and an auxiliary cooling system such as oil cooling.
TABLE 2: Summary specification for equipment at Olkaria I power plant (Mitsubishi Heavy Industries, 1979)
Equipment Specifications
Separators Tangential cyclone separators, 20-50 tons/hr, located at wellheads, mean separation pressure 6 bar-a.
Turbines Single cylinder, single flow, bottom exhaust, impulse and reaction blades, 4 stages, condensing type, 3 units each rated 15 MWe, MHI model.
Condenser (one for each turbine)
Direct contact spray jet type, vacuum 127 mmHg, condensate drain barometric leg to a seal pit; cooling water flow rate 13,400 m3/hr at 20°C.
Circulating water pumps (CWP)
Submersible positive suction pumps, 3.3 kV vertical motors, 2 pumps per unit suction at 1.5 bar-a; discharge 3 bar-a.
Aux. CWP (one on standby) Horizontally mounted centrifugal pumps, 415 V motors, positive suction
Gas ejectors, 2 stages 3x2 stages condensing type, single inter-condenser Cooling tower 3 cells cross flow, mechanically induced draught, 3 fans per unit
Generators Two-pole, 3000 RPM, 50 HZ, brush-less, self-excited, 18.75 MVA, 11 kV; 0.8 PF, totally enclosed, air cooled,
Transformers Generator transformers (11/132 kV), Station transformers (11/3.3 kV), auxiliary transformers (3.3kV/415 V)
4.4 Process description The wells at the Olkaria I power plant discharge a mixture of steam and water at different WHP and output enthalpies. The steam and water enter the cyclone separators tangentially and they are separated by virtue of cycloning and density differences. The hot water at temperatures of 150-170°C is discharged to the wellhead silencers where some water flashes into steam and goes into the atmosphere. The remaining water is dicharged through a weir-box into settling ponds from where it is disposed of into open drains (obvious exergy waste and an environmental problem). The steam is fed into steam gathering pipes which feed to the steam transmission pipes. The steam flows, heat and pressure losses result in steam condensation. The condensate collects in drainpots on the bottom of the pipes and is discharged through orifice plates or steam traps into open surface drains. Steam pressure is maintained by main steam pressure control valves which compare the desired turbine pressures to the system pressure and vent the excess steam. Near the turbine inlets, the main steam pipes are looped and a moisture separator is installed to remove any residual moisture.

Report 5 Bore Kwambai 13
Steam enters the turbine at high quality (> 0.99) and at inlet temperature and pressure. It is expanded through the turbine and in the process transmits work to the turbine rotor. Under ideal conditions, the expansion process is isentropic but due to irreversibilities inherent to the turbine design, it never is. For this reason, an isentropic efficiency is determined at design and construction and the value is given by the manufacturer. The turbine rotor is coupled to the generator rotor which transforms the mechanical energy of rotation into electrical energy. Part of the electrical energy generated is used to run the auxiliary equipment (parasitic loads). What remains (desired output) is stepped up in voltage from 11 to 132 kV and fed to the national grid. The steam exits the turbine with low enthalphy, low pressure and high wetness and is exhausted into the condenser where it is condensed by sprays of cold water in the condenser. A vacuum condition is maintained inside the condenser which improves the performance of the turbine. The condensate at about 50°C is drained into a seal pit located below the condenser. Geothermal steam contains some non-condensable gases (NCG). When the steam condenses, the NCG do not and if nothing is done about it, will create back pressure and lower the condenser vacuum and turbine performance. At Olkaria I, these gases are removed using steam jet gas ejectors. Some steam is tapped out before the turbine inlet and is used to extract the gases from the condensers. The mixture of the motive steam and the gases is discharged into the atmosphere. From the seal pit, the condensate is pumped to the cooling towers where it falls in droplets across a stream of atmospheric air created by air suction fans located at the top of the cooling tower. The water is cooled by evaporation and conduction-convection as a result of the interaction with the stream of air. The water leaves the cooling tower at about 20°C and is siphoned into the condenser. Excess condensate is disposed of by overflow at the sealpit. Some of the condensate is lost as carryover. 5. EXERGY ANALYSIS OF OLKARIA I POWER PLANT 5.1 Introduction In all geothermal power plants, a stream of geothermal fluid is brought to the surface with a pressure and temperature which exceeds that of the atmosphere and therefore has the ability to do work (exergy). The fluid is passed through a series of processes from which work is extracted and heat is exchanged between the fluid and its surroundings. Finally, the fluid is discharged into the surroundings which is in a state that is influenced by the prevailing ambient conditions. A geothermal fluid does not experience a cycle but rather a series of processes from an initial state to a final state. For this analysis, the primary exergy input is the total exergy of the two-phase fluid extracted from the connected production wells with the reference environment being the mean ambient conditions at the power plant. The overall desired exergy output is the net electrical energy produced. The fluid from the wells undergoes a series of processes from fluid separation to steam cooling (condensation) during which some useful work is extracted. With reference to the definitions of exergy, the exergy for Olkaria I power plant is the maximum possible amount of work that can be extracted from the geothermal fluids leaving the wells with reference to the mean ambient conditions at the plant site. 5.2 Overall exergy flow analysis Process description: Figure 4 shows a flow diagram for the exergy flow at Olkaria I power plant. The exergy flow processes have been simplified to consist of a well separation, steam transmission, steam expansion-energy conversion, steam condensing and cooling water systems. A quantity of exergy is received from the production wells connected to the system. The steam is passed through the

Bore Kwambai Report 5 14
processes (subsystems) and from each process; some desired exergy output is obtained which goes to the next subsystem. The overall desired output from the plant is the net electrical energy which is fed to the national grid. Overall exergy balance (For normal steady-state conditions): The exergy entering the system consists of the exergy of the two-phase flow from the wells and the exergy of air entering the cooling towers. The exergy leaving the system consists of the net electrical energy sent out (Wnett), exergy of separated brine disposed (E2), exergy lost through drains, leakages and vents (E2d), exergy of GES exhaust (E13), exergy of condensate overflowing at the seal pit(E15), exergy of air leaving the cooling towers (E18). Some exergy (IProcesses) is destroyed due to the internal irreversibilities of the processes. With reference to Figure 4, this can be expressed as below:
ocessesd IEEEEEEE Pr18151322171 ∑∑∑ ∑∑∑∑ ∑ +++++=+ (8) Performance criteria: The overall objective of this system is to convert the exergy received from the wells into net electrical energy which is the desired output. The rational efficiency will be the ratio of the net electrical energy produced to the total exergy of the geothermal fluids from connected production wells. This is expressed as:
∑∑=
11εη
mWnett
overall (9)
where m = Mass flowrate (kg/s); ε = Specific exergy (kJ/kg). Assumptions: 1. Wells’ output is constant;
2. Generated power is constant; 3. Heat and pressure losses are negligible.
5.3 Production and separation processes System description: Figure 5 shows a simplified arrangement of the wellhead equipment at Olkaria I plant. The geothermal wells produce a mixture of steam and water from a liquid-dominated geothermal reservoir (hmean = 2230 kJ/kg). The fluids reach the wellhead at well output conditions (WHPmean = 7 bar-a) and enter the separator vessel tangentially. The fluid expands in the separator
FIGURE 4: Overall exergy flow diagram for Olkaria I power plant

Report 5 Bore Kwambai 15
(Pmean = 6 bar-a) and the steam and water is separated by cyclone action and density difference. The hot water leaves the separator and is discharged into the wellhead silencer for onward disposal. The steam leaves the separator and is fed into the steam gathering system. Exergy balance equations: The exergy entering the system is the exergy of the two-phase fluid discharging from the wells into the separators (1). The exergy leaving the system is the sum of the exergy of the steam (3) and of the separated hot water going to the silencer (2). The exergy of the steam is the desired output. Some exergy is consumed (destroyed) in the process. These are neglected in this analysis. The exergy balance equation is stated as follows:
separationwatersteamtotal IEEE ∑∑ ∑∑ ++= (10)
where Etotal = Exergy rate in the two-phase flow from the wells; Esteam = Exergy rate in the steam from the wells; Ewater = Exergy rate in the separated water from the well;
Iseparation = Exergy destruction rate in the separation processes; (exergy destruction is neglected for this study). The exergy rate E (kJ/s) is expressed as:
( ) ( )[ ]000 ssThhmmE −−−== ε (11) where m = Mass flow rate (kJ/s); h = Enthalpy of the fluid (kJ/kg); ε = Specific exergy (kJ/ ) With reference to Figure 5, the exergy balance equation becomes:
separationImmm ∑∑ ∑∑ ++= 332211 εεε (12)
Performance criteria: The role of this system is to separate the two-phase fluids into water and steam, dispose of the waste water and deliver the steam to the steam gathering and transmission system. Normally, the performance of separators is a measure of the dryness of the steam leaving the separators. In exergy terms, the desired exergy output is the exergy of the steam considering that the hot water goes to waste. In this case, the criteria of performance will be the ratio of the exergy of steam leaving the separators (desired exergy) to the exergy of fluids entering the separators (rational efficiency).
∑∑
∑∑ ==
11
33
1
3
εε
ηmm
EE
separation (13)
Assumptions: 1. Production rate from the wells is smooth and constant;
2. Changes in wells output rates since September 2002 are negligible; 3. The separation processes are isenthalpic and adiabatic.
FIGURE 5: Flow diagram for production and separation processes at Olkaria I

Bore Kwambai Report 5 16
5.4 Steam transmission processes Description: The transmission system arrangement is shown in Figure 6. The steam from the connected (3) wells is fed into steam gathering pipes which feed into three steam transmission pipes. Heat and pressure losses in the steam pipelines result in exergy drops which cause condensation of some steam. The condensate is collected in drain pots and disposed of via steam traps or orifice plates. Pressure on the main steam pipeline is kept within the desired value by pressure controllers installed on the main steam pipeline. Excess steam is vented out by steam pressure control valves. A moisture separator collects and drains out any residual moisture in the steam before the steam enters the turbines. All the drains and vents discharge to the atmosphere (2d). The steam flow metering devices (one for each unit) are located after the outlets of the moisture separators and are the exit points of this system (4). Exergy balance equations: The exergy into this system is the sum of the exergy of the steam leaving the separators of the connected wells (3). The exergy leaving the system is the exergy of steam flowing through the flow meters (4). The exergy wasted (leakage and vent out) and exergy destroyed (heat loss and pressure drops) shall be treated as exergy lost (2d) and is the difference between the sum of exergy in and the sum of exergy out. The exergy balance for this system can be expressed as:
∑∑∑ += lostttss Emm εε (14)
where ms = Mass flow rate of steam from the well; εs = Specific exergy of steam from the well; mt = Mass flow rate of steam going into the orifice flow meters; εt = Specific exergy value of steam at entry into the flow meters; Elost = Exergy lost in the transmission processes. With reference to Figure 6, the exergy balance is expressed as:
∑∑∑ +ε=ε lost4433 Emm (15)
∑∑∑ ∑∑∑ ++++= oppressuredrheatlossventedleakagesdrainslost EEEEEE (16) Performance criteria: The purpose of this system is to transmit the separated steam from the wellhead separators to the turbines as efficiently as possible. The desired exergy output is the exergy of steam entering the flow meters. The criteria of performance will therefore be the ratio of exergy of steam reaching the flow meters to the exergy of steam entering the system. For an ideal system, the exergy entering the system will be equal to the exergy leaving the system.
FIGURE 6: Simplified flow diagram for the steam transmission system at Olkaria I plant

Report 5 Bore Kwambai 17
∑∑
∑∑ ==
33
55
3
5
εε
ηmm
EE
ts (17)
Assumptions: 1. The SSC rates of 1997, 2000 and 2004 are still valid measures; 2. The exergy wasted and exergy destroyed has been grouped under exergy lost. 5.5 Steam expansion through the turbines Process description: The flow processes for the steam expansion and energy conversion are shown in Figure 7. Auxiliary steam (8) is tapped from the main steam pipe after the orifice flow meters but before the steam enters the turbines. The steam enters the turbine (5) with properties characterised by inlet conditions. The inlet into the turbines is controlled by emergency stop valves and governor valves. At the inlet, the steam first enters the steam chest which balances the thrust on the first stage turbine blades. The steam is then guided into the 1st stage row of blades by steam nozzles and expands through the first row of blades. The steam is then expanded through the 2nd 3rd and 4th rows of blades and is exhausted into the condenser (6) which is kept at a vacuum pressure of 0.1 bar-a by condensing the steam. This process is shown by process 5-6actual on the T-s diagram (Figure 8). As the steam is expanded through the rows of blades (stages), a significant part of the exergy is converted into mechanical energy in the form of rotation of the turbine rotor. Most of the exergy in the steam is converted by the 1st stage blades and the steam exits this stage at a mean pressure of 1 bar gauge. The turbine and the generator rotors are coupled together and therefore rotate together at 3000 RPM. The generator rotor carries the magnetic field and by rotation, converts the mechanical energy (rotor rotation) into electrical energy (Wgross). The amount of gross electrical energy generated depends on the efficiency of the turbines and generators. Exergy balance equations: The exergy input is the exergy of steam entering the turbine (5). The exergy output consist of the work produced (Wgross) and the exergy of steam exhaust from the turbine
FIGURE 7: Flow diagram for the steam expansion processes at Olkaria I plant
FIGURE 8: T-s diagram representing geothermal fluid flow processes at Olkaria I plant
0.0 1.0 2.0 3.0 4.0 5.0 6.0 7.0 8.0 9.00
50
100
150
200
250
300
350
400
s[kJ/kg-K]
T [°
C] 15 bar
7 bar
6 bar
5 bar
0.2 bar
0.1 bar
0.2 0.4 0.6 0.8
Steam
Reservoir condition
Wellbore flow
Separator
SteamSeparated water
Actual condensation process
Design condensation process
ActualIdeal
1
2 35-Turbine inlet
6-Ideal6-Actual
Expansion

Bore Kwambai Report 5 18
(6). The electrical energy produced is the desired exergy output. The exergy of the steam exiting the turbine is part of the exergy waste. Some exergy is destroyed due to the irreversibilities of the processes involved. With reference to Figure 7, the exergy balance is written as:
processWgross IEEE ∑∑ ∑∑ ++= 65 (18)
where E5 = Exergy rate of steam entering the turbine; EWgross = Exergy rate of gross electrical energy from generator; E6 = Exergy rate of steam exiting turbine; IProcess = Exergy destruction rate in exergy conversion processes. Applying exergy terms:
( )[ ])( 0500555 ssThhmE −−−= (19) ( )[ ])0600666 ( ssThhmE −−−= (20)
65 mm = (21) MWeEWgross = (22)
where m5 = Mass flow rate of steam entering the turbine; h5, s5 = Enthalpy and entropy of steam at entry into turbine; To = Reference environment temperature (°K); h0, s0 = Enthalpy and entropy of the steam at environment conditions.
Ideal expansion process: For an ideal process, the expansion of steam through the turbine is isentropic which means that s5=s6. Therefore the ideal quality of steam (x) at exit (6) becomes:
abarfabarg
abarf
ssss
x−−
−
−
−=
1.01.0
1.066 (23)
where sf and sg are the liquid and gas phase entropies at exit conditions (0.1 bar-a) For an isentropic expansion, the expression for enthalpy at exit (h6) becomes:
abarfgsabarfs hxhh −− += 1.061.06 (24) The ideal work done (in kW) is given by:
[ ]655 hhmWideal −= (25) The ideal steam exit temperature will be given by:
),1.0( 56 SSabar
PTT sats =−
== (26)
Actual expansion process: In practice, the turbine isentropic efficiency (ηts) is given by the manufacturer after construction of turbines. Therefore, the actual work (kW) done will be given by:
)( idealtsactual WW η= (27)
The actual exit enthalpy will be given by:
idealtsactualactual WWhhm η==− )( 655 (28) The actual steam quality at exit will be given by:

Report 5 Bore Kwambai 19
abarfabarg
abarfactualactual hh
hhX
−−
−
−
−=
1.01.0
1.066 (29)
The actual exit temperature will be given by:
),1.0( 66 actualsatactual hhabarpTT =−== (30)
Actual exergy value of steam at turbine exit (6) becomes:
( ) ( )[ ]0600666 ssThhmE actualactual −−−= (31) Performance criteria: The objective of this process is to convert as much of the exergy of the steam entering the turbine into electrical energy. The measure of performance will be the ratio of the gross work output (electrical energy produced) to the exergy of steam used to produce the work. The exergy used is the exergy yielded by the steam as it expands through the turbine, the difference between the exergy of steam at inlet and the exergy of steam at outlet. With reference to Figure 7, the exergy efficiency of the turbine-generator will be given by:
∑∑
∑−
=actual
gross
EEW
65εη (32)
Assumptions: 1. The process is adiabatic; 2. No leakages of steam. 5.6 Steam condensing processes Description: The flow processes in steam condensation are illustrated in Figure 9. Steam leaving the turbine (6) is exhausted into the condenser where it is mixed with a spray of cold water (14) from the cooling towers. The steam condenses on the water droplets and the condensate drains through a barometric leg (7) into a seal pit tank located 9 m below the bottom of the condenser to overcome atmospheric pressure. Non-condensable gases (NCG) are sucked from the condenser (10) by gas ejectors.
Exergy balance equations: The exergy in the process is the sum of the exergy of the cooling water (14) and the exergy of exhaust steam (6). Exergy leaving the system is the sum of the exergy of the condensate (7) and exergy of the NCG (10). Some exergy is destroyed/lost due to irreversibilities of the process. In equation form:
∑ ∑ ∑ ∑∑ ++=+ − processNCGcondensatewatercexhaust IEEEE (33) With reference to Figure 7, this equation becomes:
∑∑∑∑∑ ++=+ IEEEE 107146 (34) where E6 = Exergy contained in the turbine exhaust steam;
FIGURE 9: Flow diagram showing steam condensing processes at Olkaria I plant

Bore Kwambai Report 5 20
E14 = Exergy of cooling water entering the condenser; E7 = Exergy in condensate leaving the condenser; E10 = Exergy in NCG leaving the condenser; Iprocess = Exergy destroyed by irreversibilities of the process. Being a steady-state process:
∑∑∑∑ +=+ 107146 mmmm (35) Criteria of performance: The desired function for this process is to effectively condense exhaust steam by maximizing the exergy of the mixed stream. The performance criteria will the ratio of the exergy gained by cold fluid to the exergy lost by the exhaust steam (effectiveness of the heat transfer units). This is expressed as:
)()(
766
14714
εεεεη
−−
=m
mcondenser (36)
Assumptions: 1. Steady state process (mass flow rates are constant): 0=∑ im 2. Adiabatic process (no heat losses): Q = 0 5.7 Non-condensable gas extraction Description: The flow arrangement for the gas extraction system is given in Figure 10. Motive steam is tapped from the main steam line (8) and delivered to the gas extraction system (GES). The high-velocity steam creates suction by passing through a convergent-divergent nozzle. The low-pressure point of the first stage ejector nozzle is connected to the gas cooler section of the condenser. The non-condensable gases (NCG) with some water vapour flow into the ejector nozzle (10) as a result of the low-pressure suction. The NCG together with the motive steam are condensed in the inter-condenser by cold water (11) from the cooling tower. The NCG are sucked again from the inter-condenser by the second stage ejector nozzle and are discharged into the atmosphere (13) for dispersal. The condensate from the inter-condenser drains into the seal pit (12).
Exergy equations: Exergy input is the sum of the exergies of the motive steam (8), NCG (10) and cooling water (11) entering the GES. The exergy output is the sum of the exergies of condensate leaving the inter- condenser (12) and the NCG-steam mixture leaving the 2nd stage ejector (13). Some exergy is lost due to irreversibilities of the processes. The exergy flows are expressed in the equations below:
∑∑∑∑ ∑∑ ++=++ IEEEEE exhaustconcwncgsteam (37)
FIGURE 10: Layout diagram for the gas extraction (GES) system at Olkaria I plant

Report 5 Bore Kwambai 21
( ) ( )[ ]000 SSThhmmE gesgesgessteamgesges −−−== ε (38)
( ) ( )[ ]000 SSThhmmE ncgncgncgncgncgncg −−−== ε (39)
( ) ( )[ ]000 SSThhmmE cwcwcwcwcwcw −−−== ε (40)
( ) ( )[ ]000 SSThhmmE conconconconconcon −−−== ε (41)
( ) ( )[ ]000 SSThhmmE exhaustexhaustexhaustexhaustexhaustexhaust −−−== ε (42) Performance criteria: The desired function for this process is to maximize the extraction of the NCG from the condenser. Looking at the system as a heat exchanger, the desired action is to maximize the energy gained by the NCG stream and the cooling water at the expense of the exergy lost by the motive steam. Therefore, the performance criteria will be expressed as a ratio of the sum of the exergy gained by the condensing fluid and the NCG steam to the exergy lost by the GES motive steam (effectiveness of the heat transfer). In equation form with reference to Figure 10:
)()()()(
12881388
111211101310
εεεεεεεεη
−+−−+−
=ba
ges mmmm (43)
where m8a,b = Mass flow rates of motive steam into ejector 1 and 2, respectively; m10 = Mass flow rate of NCG from condenser; m11 = Mass flow rate of cooling water into the inter-condenser. Assumptions made: 1. NCG is pure CO2 and is 0.25% of steam by weight;
2. NCG in the motive steam is neglected; 3. All the motive steam in the 1st stage condenses in the inter condenser and
only NCG goes to the 2nd stage; 4. NCG leaving the 2nd stage ejector has equal conditions as motive steam.
5.8 Cooling processes Description: Figure 11 shows the flow arrangement for the cooling system. This system covers the seal pit and the cooling towers. The condensate leaves the condenser and enters the seal pit (7). Excess condensate overflows at the seal pit (15). The circulating condensate (16) is pumped by a circulating water pump (CWP) to the top of the cooling towers. Water reaches the top of the cooling towers and is poured onto hot water basins where it falls down through spray nozzles. The hot water falls through a splash bar grid and the water droplets are split into very fine droplets by the grid. As the water droplets fall down and break up into fine droplets, a stream of air (17) flows across the water droplets thus creating cooling by evaporation and convection-conduction mechanisms. The stream of air is created by suction of air fans (Wfans) located at the top of the cooling towers.
FIGURE 11: Flow diagram for Olkaria I cooling system

Bore Kwambai Report 5 22
The water droplets eventually fall into the cold pond from where it is syphoned into the condenser inlet pipeline (19). Some water goes to the auxiliary cooling (20) and the rest into the condenser (14). Warm moist air leaves the cooling tower (18) driven out by air fans (Wfans). Some condensate is lost to the air. Exergy balance equations: Exergy into this system consists of the sum of exergies of the condensate leaving the condenser, the exergy of air entering the cooling towers and the work done by the fans and pumps. The exergy leaving the system consist of exergies of the moist air leaving the cooling towers, the condensate overflowing at the seal pit and the cold water leaving the cooling tower pond. Some exergy is lost by the irreversibilities in the processes. In equation form with reference to Figure 9:
∑∑ ∑∑ ∑ ∑ ∑∑ +++=+++ IEEEWWEE fanspumps 151918177 (44)
where E7 = Exergy rate of condensate leaving the condenser; E15 = Exergy rate of condensate overflowing at seal pit; E17 = Exergy rate of air entering the cooling tower; E1 = Exergy rate of warm moist air leaving the cooling tower; E19 = Exergy rate of water leaving the cold pond of cooling tower; I = Exergy destroyed or lost in the processes; Wfans,Wpumps = Exergy rate of work done by the fans and pumps. Performance criteria: The desired function for this process is to cool the condensate by transferring the exergy in the condensate to the atmospheric air. Looking at the system as a heat exchanger, the objective is to maximize the exergy gained by the stream of cooling air at the expense of the exergy lost by the condensate. Therefore, the performance criteria will be expressed as the ratio of exergy gain of cold fluid to the exergy loss of condensate (effectiveness of the heat transfer):
)()(
191616
171817
εεεεη
−−
=mm
cs (45)
However, a more reasonable performance measure is the coefficient of performance (COP) which is the ratio of exergy lost by the condensate (desired action) to the sum of the work of pumps and fans (work input). In equation, this becomes
pumpsfans
cs WWmcop
+−
=)( 191616 εε (46)
Assumptions: 1. Carryover and drift losses are 5% of condensate entering the cooling towers;
2. Only the water leaving the cooling tower shall be considered to be cooled; 3. CWP are assumed to operate at 60% of the rated capacity.
6. RESULTS AND DISCUSSION OF RESULTS 6.1 Summary of exergy analysis for the whole plant In this analysis, the wells that were connected to the system were OW-2, 5, 11, 15, 16, 18, 19, 22, 24/28, 26, 30 and 32 (Figure 3 and Appendix II) (KenGen, 2005a): The output of OW-30 was assumed to be 8/11 of the combined outputs of OW-29/30. The output of the wells was based on the monitoring results of September 2002 and was assumed to be valid. The power plant operating parameters (Appendix III) were based on the readings obtained on 30th July 2005 (KenGen, 2005a).

Report 5 Bore Kwambai 23
The analysis was done using EES software (see Appendix IV). The summary exergy results for the production, separation and transmission processes are given in Table 3. The exergy results for the steam expansion-energy conversion and steam condensation process are given in Table 4. The GES and the cooling system exergy flows are summarized in Tables 5 and 6, respectively. The summarized results of the overall plant exergy flows are presented in Table 7. A graphical presentation of the exergy flow is shown by a Grassman diagram (Figure 12). The exergy analysis results for each system are discussed in the following sections. 6.2 Fluid production, separation and transmission processes The results for the exergy of the production, separation and transmission processes are summarised in Table 3. The overall exergy efficiency for the production-separation process was 96%. This shows that the exergy in the liquid phase is small compared to the exergy in the steam phase. The total exergy from the connected wells was 109 MW out of which the exergy in the waste water was 6 MW. However, this low-enthalpy exergy can still be utilised. Assuming a typical binary plant with an overall efficiency of 15% (typical value), about 1.0 MWe can be obtained from the waste water which is significant. In addition, the exergy of the waste water can be utilised for direct uses such as aquaculture, greenhouse heating or recreation (hot spas and swimming pools) which require low temperature fluids. TABLE 3: Summary of results for the exergy analysis of separation and steam transmission processes
Description Location Value
Available exergy (MW) 1 159 Exergy of water from connected wells (MW) 2 6 Exergy of steam from connected wells (MW) 3 109 Overall efficiency of separation processes (%) 96 Exergy losses in steam transmission (drains, leakages, vents etc) (MW) 2d 11
Exergy of steam at main steam flow meters (MW) 4 92 Transmission efficiency (%) 90
The exergy entering the steam transmission system is 103 MW. The exergy lost in the steam transmission processes amounted to 11 MW giving an exergy efficiency of 90% for the system. Several reasons are responsible for these exergy losses. The missing, inefficient or damaged insulation which results in heat loss and steam condensation is one possible cause that should be looked into. Drain devices such as orifice plates which are widely used at Olkaria I power plant are inefficient and discharge continuously even when condensate is low. Some drain equipment could also be malfunctioning resulting in continuous draining and wastage. Pressure losses also occur due to frictional losses which are considerable because of increased pipe roughness as a result of corrosion and scaling and the inevitable expansion loops. The steam pressure is usually not constant due to the cyclic nature of wells and variations in system demands which result in the venting of excess steam into the atmosphere, thus wasted exergy. This vented exergy could be contained in the reservoir by introducing additional control valves in some big cyclic wells such as OW-32. 6.3 Steam expansion and condensing processes The results of the exergy analysis for the steam expansion and condensing processes are summarized in Table 4 below. The exergy points refer to Figures 5 and 6. The total exergy rate at the inlets into the turbines was found to be 89 MW. The total exergy drop across the turbines was found to be 59
Bore Kwambai Report 5 24
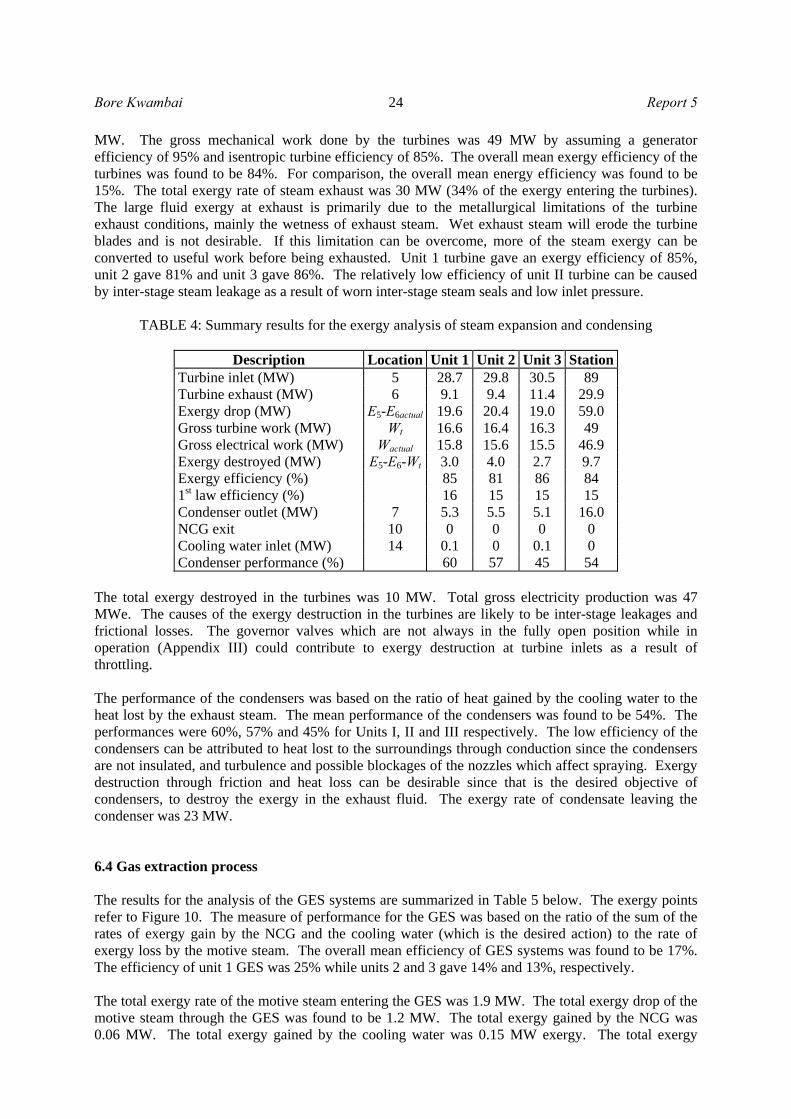
MW. The gross mechanical work done by the turbines was 49 MW by assuming a generator efficiency of 95% and isentropic turbine efficiency of 85%. The overall mean exergy efficiency of the turbines was found to be 84%. For comparison, the overall mean energy efficiency was found to be 15%. The total exergy rate of steam exhaust was 30 MW (34% of the exergy entering the turbines). The large fluid exergy at exhaust is primarily due to the metallurgical limitations of the turbine exhaust conditions, mainly the wetness of exhaust steam. Wet exhaust steam will erode the turbine blades and is not desirable. If this limitation can be overcome, more of the steam exergy can be converted to useful work before being exhausted. Unit 1 turbine gave an exergy efficiency of 85%, unit 2 gave 81% and unit 3 gave 86%. The relatively low efficiency of unit II turbine can be caused by inter-stage steam leakage as a result of worn inter-stage steam seals and low inlet pressure.
TABLE 4: Summary results for the exergy analysis of steam expansion and condensing
Description Location Unit 1 Unit 2 Unit 3 Station Turbine inlet (MW) 5 28.7 29.8 30.5 89 Turbine exhaust (MW) 6 9.1 9.4 11.4 29.9 Exergy drop (MW) E5-E6actual 19.6 20.4 19.0 59.0 Gross turbine work (MW) Wt 16.6 16.4 16.3 49 Gross electrical work (MW) Wactual 15.8 15.6 15.5 46.9 Exergy destroyed (MW) E5-E6-Wt 3.0 4.0 2.7 9.7 Exergy efficiency (%) 85 81 86 84 1st law efficiency (%) 16 15 15 15 Condenser outlet (MW) 7 5.3 5.5 5.1 16.0 NCG exit 10 0 0 0 0 Cooling water inlet (MW) 14 0.1 0 0.1 0 Condenser performance (%) 60 57 45 54
The total exergy destroyed in the turbines was 10 MW. Total gross electricity production was 47 MWe. The causes of the exergy destruction in the turbines are likely to be inter-stage leakages and frictional losses. The governor valves which are not always in the fully open position while in operation (Appendix III) could contribute to exergy destruction at turbine inlets as a result of throttling. The performance of the condensers was based on the ratio of heat gained by the cooling water to the heat lost by the exhaust steam. The mean performance of the condensers was found to be 54%. The performances were 60%, 57% and 45% for Units I, II and III respectively. The low efficiency of the condensers can be attributed to heat lost to the surroundings through conduction since the condensers are not insulated, and turbulence and possible blockages of the nozzles which affect spraying. Exergy destruction through friction and heat loss can be desirable since that is the desired objective of condensers, to destroy the exergy in the exhaust fluid. The exergy rate of condensate leaving the condenser was 23 MW. 6.4 Gas extraction process The results for the analysis of the GES systems are summarized in Table 5 below. The exergy points refer to Figure 10. The measure of performance for the GES was based on the ratio of the sum of the rates of exergy gain by the NCG and the cooling water (which is the desired action) to the rate of exergy loss by the motive steam. The overall mean efficiency of GES systems was found to be 17%. The efficiency of unit 1 GES was 25% while units 2 and 3 gave 14% and 13%, respectively. The total exergy rate of the motive steam entering the GES was 1.9 MW. The total exergy drop of the motive steam through the GES was found to be 1.2 MW. The total exergy gained by the NCG was 0.06 MW. The total exergy gained by the cooling water was 0.15 MW exergy. The total exergy

Report 5 Bore Kwambai 25
leaving through the exhaust was 0.69 MW. The irreversibility rate (exergy not accounted for) was found to be 1 MW. The exergy destruction is likely to be caused by the turbulence in the steam flow through the nozzles and in the inter-condensers. Some significant exergy is lost in the form of noise and heat loss since the system is not insulated.
TABLE 5: Summary results of exergy analysis of the GES systems
Description Exergy point Unit 1 Unit 2 Unit 3 Total or mean
Steam inflow (MW) 8 0.63 0.63 0.63 1.89 NCG from condenser (MW) 10 -.01 -.01 -.01 -0.03 Cold water to intercooler (MW) 11 0 0 0 0 Condensate drain of intercooler – cooling water (cw) 12cw 0.08 .04 .04 0.15
Condensate drain of intercooler – steam (s) 12s 0.008 0.003 0.003 0.014
NCG exhaust 13ncg 0.015 0.015 0.015 0.045 Motive steam exhaust 13s 0.22 0.22 0.22 0.69 Overall performance (%) 25 14 13 17
6.5 Cooling system process The results for the exergy analysis for the cooling water system are given in Table 6. The exergy points refer to Figure 11. The measure of the performance applied for the cooling system was the ratio of the cooling effect on the condensate to the exergy of the electrical work input to achieve the cooling (COP). The overall COP for the plant was found to be 12.21. This means that more heat exergy is removed per unit of power used. The high COP can be related to the fact that the input exergy is high quality compared to the exergy extracted. The high performance of this system was found to be significant to the overall plant performance as it affects the condenser inlet temperature which in turn affects the steam cooling and condenser vacuum. Unit I cooling system gave a COP of 12.53 while units II and III gave 12.25 and 11.84 respectively. The low COP of unit III cooling system can be attributed to collapsed grids, missing basin board nozzles, carryover and leakages. Collapsed grids give rise to poor distribution of water. The power rate of the air fans is constant but varies for the pumps. Fan blade conditions and fan angle setting affect the load on the fan motor and the amount of air flow. The pumps have been estimated to operate at 60% of rated load because the discharge valves are not always fully open.
TABLE 6: Summary results for the exergy analysis of the cooling processes
Description Exergy point Unit 1 Unit 2 Unit 3 Total or mean
Condenser drains (MW) 7 5.74 5.54 5.45 16.73 Seal pit condensate overflow (MW) 15 0.2 0.3 0.2 0.7 Air flow into the cooling tower (MW) 17 Air flow out of the cooling tower (MW) 18 No data was available for these processesCold water from the cooling tower (MW) 19 0.113 0.018 0.113 0.244 Electrical work on fans (MW) Wfans 0.282 0.282 0.282 0.846 Electrical work on pumps (MW) Wpumps 0.192 0.192 0.192 0.576 Performance of the system COP 12.53 12.25 11.84 12.21

Bore Kwambai Report 5 26
6.6 Results for overall plant exergy analysis The summarised results of the exergy analysis for the whole plant are presented in Table 7. The exergy points refer to Figure 3. The overall exergy flows are given in Table 8. The results show that the total available exergy at Olkaria I power plant is 159 MW. Of this available exergy, 7.6 MW exergy exists in the brine which is disposed of at the wellheads; 152 MW is contained in the steam.
TABLE 7: Summary results for the exergy analysis of the whole plant
Process/System Total
exergy (MW)
Desired exergy output
(MW)
Wasted exergy output
(MW)
Exergy destroyed
(MW)
Exergy efficiency
(%) Separation 109 103 6 96 Transmission 103 92 11 90 Turbines 89 49 30 10 84 Condenser 30 15 1 14 52 GES 1.89 0.33 1.56 - 17 Cooling system 0.5 7 7 (desired) 11.3 Overall 135 44.7 90 34
TABLE 8: Overall exergy flows in the plant
Item QuantityTotal available exergy (MW) 159 Total exergy used (MW) 135 Gross electric work (MW) 46.9 Auxiliary electric consumption (MW) 2.3 Net electric production (MW) 44.1 Overall 1st law efficiency % 14.5 Overall 2nd law efficiency % 34.6
From the wells connected to the system at the time of analysis, a total of 103 MW exergy was received in the form of steam and 6 MW was wasted in the separated brine. A total of 11 MW of the steam exergy is lost in the transmission and 1.9 MW exergy goes to the gas extraction system. The total exergy received at the turbine inlets is 89 MW. The exergy drop through the turbines amounted to 60 MW against a gross work developed by the turbine amounting to 49.5 MW. The total exergy in the steam exhausted into the condenser amounted to 30 MW. The overall exergy efficiency of the power plant was found to be 42% with reference to the total exergy from the connected wells. For comparison, the overall plant energy efficiency was found to be 15%. The large difference in the efficiencies shows that most of the energy received at the wells exits the plant while still containing substantial exergy. The turbines showed high exergy efficiencies because most of the exergy is exhausted into the condensers and not consumed or destroyed. This means that an improvement of the turbines will enable them to extract more work from the fluids or alternatively, other ways of using the exergy from the fluids exiting the system can be devised. The greatest exergy losses occur in the condensers where most of the exergy is rejected and destroyed. Substantial exergy losses occur in the transmission system and this can be addressed. The exergy in the waste water is relatively small but is significant and can be used to do more work either with a binary system or by direct use. The exergy losses in the turbines are largely intrinsic but the effects of inter-stage leakages are likely to contribute to the low efficiencies.

Report 5 Bore Kwambai 27
6.7 Presentation of overall plant exergy flows at Olkaria I plant Figure 12 shows a pictorial presentation of the overall plant exergy flows at Olkaria I powerplant in a Grassman presentation.
7. CONCLUSIONS AND SUGGESTIONS 7.1 Conclusions The importance of exergy analysis in the evaluation of the performance of power plants has been proven. An exergy analysis of Olkaria I power plant was carried out and the locations and quantities of exergy losses, wastes and destructions in the different processes of the plant were pinpointed. In addition, the exergy analysis enabled the degree of thermodynamic imperfections for the processes to be determined. The modelling of the plant in an EES computer package resulted in a detailed simulation. The major exergy losses were found to occur in the steam transmission, turbines, condensers and gas ejectors. The irreversibilities in the turbines were due to metallurgical limitations. The exergy waste in the brine is small but can be used to produce useful work. From the results, the following conclusions have been drawn:
1. The total exergy available from production wells at Olkaria I power plant was calculated to be 159 MW. The total exergy received from wells connected during the analysis was found to be 109 MW out of which 103 MW is contained in the steam phase.
2. The overall exergy efficiency for the power plant is 34.6 and the overall energy efficiency is 15%, in both cases with respect to the exergy from the connected wells.
3. The mean exergy efficiency for the turbines was 84%. 4. The exergy contained in the waste brine is small compared to that in the steam. However an
extra 1.0 MWe work could be obtained by utilising the wasted brine in a typical binary plant with 15% efficiency.
5. Exergy losses and wastes occurred in: Separated brine (6 MW), transmission system (11 MW), turbines (10 MW) and the condensers (30 MW). A substantial amount of exergy is exhausted to the condensers because of the limitations of the wetness of the exhaust steam. The steam transmission system should be investigated further.
Exergy Exhausted to Condenser
Net Electrical Energy45.2MW
Exergy drop in
Turbines
Auxiliary Power
1.71MW
Exergy to GES
Exergy lost in transmission
Exergy lost in waste
water
Reserve Exergy
Exergy MW
159
109
89
103
92
45.3
0
Total Available exergy
79
49.7
Exergy Exhausted to Condenser
Net Electrical Energy45.2MW
Exergy drop in
Turbines
Auxiliary Power
1.71MW
Exergy to GES
Exergy lost in transmission
Exergy lost in waste
water
Reserve Exergy
Exergy MW
159
109
89
103
92
45.3
0
Total Available exergy
79
49.7
FIGURE 12: Grassman presentation of the overall exergy flow for Olkaria I plant

Bore Kwambai Report 5 28
7.2 Suggested improvements The exergy of separated brine presents one potential for improvement. The 6 MW exergy wasted in the separated brine which is disposed of at the wellheads can be utilised by employing a binary plant to generate more electricity. With a typical binary plant of 15% efficiency, about 1 MWe can be produced, which is significant. The wasted brine can further be utilised for direct uses such as hot spas and medicinal uses which can generate a lot of revenue (for example as the Blue Lagoon of Iceland). Besides getting more from the resource, it will also be a way to address environmental issues. The exergy lost in the steam transmission system, amounting to 11 MW, needs to be investigated. The insulation, condensate drains and pressure venting devices should be given attention. The effectiveness of the insulation for the entire pipeline should be studied and all missing insulation replaced. The performance of the condensate drain equipment needs to be inspected to identify which are continuously draining. The orifice plate drains are ineffective since they vent continuously and should be replaced with steam traps. Some of the steam traps are faulty and result in continuous draining and need to be replaced or repaired. A study should be conducted into the viability of installing an additional pressure control valve at the wellheads of a few large production wells so that excess steam is contained in the wellbore instead of being vented. Such control valves could be designed to be the first to respond before the main vent station takes over. The causes of exergy destruction in the turbines are mainly related to their design and frictional losses. A large amount of exergy is exhausted into the condensers because of constraints of the metallurgical requirements which limit the minimum dryness of steam at the turbine exit. However, the influence of inter-stage leakages should be investigated and rectified as necessary. It is possible that some inter-stage seals are worn thereby allowing some steam to pass without doing work. The impact of the partial openings of the governor valves also needs to be investigated. For all the turbines, the openings of the governor valves at full load were about 60% (Appendix III). This throttling of steam flow destroys part of its exergy and the governors should operate as close to fully open as possible. A detailed exergy analysis and plant optimisation studies should be conducted combining both Olkaria I & II power plants using actual operating conditions. This should be preceded by checking the accuracy of all the instruments by calibration, especially for Olkaria I and all relevant measuring instruments should be installed. Exergy analysis should be incorporated in any future designs of geothermal plants in Kenya.
ACKNOWLEDGEMENTS
I wish to express my sincere gratitude to the Government of Iceland, the United Nations University Geothermal Training Programme (UNU-GTP) and my employer, KenGen for giving me the opportunity to participate in the 27th session of UNU-GTP. My heartfelt gratitude goes to Dr. Ingvar B. Fridleifsson, director of UNU-GTP, Mr. Lúdvík S. Georgsson, deputy director and Mrs. Gudrún Bjarnadóttir, the administrative assistant for their guidance, assistance and warm care throughout the course. I wish to extend my gratitude to the staff of Iceland GeoSurvey (ISOR) and Orkustofnun for sharing their time and resources with us and for their comprehensive lectures and presentations during the course. I will not forget the institutions from which information was gathered during the coursework and field trips namely: Reykjavik Energy, Rafhönnun Consulting Engineers, Hitaveita Sudurnesja and Nordurorka hf. Ltd. among others. My special thanks go to my supervisors Prof. Páll Valdimarsson and associate Prof. Halldór Pálsson, for their dedicated support and guidance during project preparation, research and writing which made it possible for me to complete this report. To all the UNU Fellows, I am grateful for the company, discussions and sharing we had during the six months we were together.

Report 5 Bore Kwambai 29
Last but not least, I am grateful to my dear wife, Diana for her endurance, emotional support, prayers and encouragement throughout the course and to our beloved children for their prayers, patience and encouragement throughout my stay in Iceland. It would have been impossible for me to go through this training without your support.
NOMENCLATURE
General E = Exergy (kJ) g = Gravitational force (m/s2) h = Specific enthalpy (kJ/kg) I = Irreversibility m = Mass flow (kg/s) s = Specific entropy (kJ/kg-K) T = Temperature (°C) X = Quality W = Power (W) Greek symbols η = Efficiency (%) ε = Specific exergy (kJ/kg) Subscripts a = Air s = Steam t = Total w = Water 0 = Dead state 1,2,.. = State points Abbreviations CHP = Combined heat and power COP = Coefficient of performance CS = Cooling system CWP = Circulating water pump EES = Engineering Equation Solver EJ = Ejector GES = Gas extraction system NCG = Non-condensable gases SSC = Specific steam consumption WHP = Wellhead pressure
REFERENCES
Aligan, M.A., 2001: Exergy analysis of Mindanao 1 and Mindanao II geothermal power plants, Philippines. University of Auckland, Geothermal Institute, Diploma course project 2001.03.
Bettagli, N., and Bidini, G., 1996: Larderello-Farinello-Valle Secolo geothermal area: Exergy analysis of the transportation network and of the electric power plants. Geothermics, 25-1, 3-16.

Bore Kwambai Report 5 30
Dincer, I., and Cengel, Y.A., 2001: Energy, entropy and exergy concepts and their roles in thermal engineering. Entropy, 3, 116-149.
Dorj, P., 2005: Thermoeconomic analysis of a new geothermal utilization CHP plant in Tsetserleg, Mongolia. University of Iceland, MSc thesis, UNU-GTP, Iceland, report 2, 74 pp.
Gong, M., and Wall, G., 1997: On exergetics, economics and optimization of technical processes to meet environmental conditions. Proceedings of the conference: Thermodynamic analysis and improvement of energy systems, Beijing, China, 453-460.
Karingithi, C., 2002: Hydrothermal mineral buffers controlling reactive gases concentration in the Greater Olkaria geothermal system, Kenya. University of Iceland, MSc thesis, UNU-GTP, Iceland report 2, 51 pp.
Kariuki, M., and Wambugu, J., 2002: Status report on steam production, Olkaria East field 2002/2003. KenGen Co. Ltd., internal report (September 2002).
KenGen 2005a: Turbine and auxiliary log sheets 30.07.2005, Olkaria I power station. KenGen, unpublished internal report.
KenGen 2005b: Daily log sheet 30.07.2005, Olkaria I power station. KenGen, unpublished internal report.
Kotas, T.J., 1995: The exergy method of thermal plant analysis. Krieger Publishing Co. Ltd, Florida, USA, 327 pp.
Lagat, J.K., 2004: Geology, hydrothermal alteration and fluid inclusion studies of the Olkaria Domes geothermal field, Kenya. University of Iceland, MSc thesis, UNU-GTP, Iceland, report 2, 71 pp.
Mitsubishi Heavy Industries, 1979: Turbine maintenance manual Vol. 1. Mitsubishi, Olkaria power plant maintenance records.
Nikulsin, V., Wu, C., and Nikulshina, V., 2002: Exergy efficiency calculations of energy intensive systems. Internat. J. of Exergy, 2, 78-86.
Ofwona, C., 2002: A reservoir study of the Olkaria East geothermal system, Kenya. University of Iceland, MSc Thesis, UNU-GTP, Iceland, report 1, 74 pp.
Rosen, M.A., 1999: Second law analysis, approaches and implications. Internat. J. of Energy Research, 23, 415-429.
Rosen, M.A., 2002: Does industry embrace exergy? Internat. J. of Exergy, 2- 4, 221-223.
Rosen, M., and Dincer, I., 2001: Exergy as the confluence of energy, environment and sustainable development. Internat. J. on Exergy, 1, 3-13.
Soekono, H., 1995: Exergy audit and plant optimization of Darajat geothermal power plant, Indonesia. University of Auckland, Geothermal Institute, Diploma course project GTHRM-19.
Villena, J., 1997: Energy analysis and design comparison Mindanao 1 and Mahanadong 1 geothermal power plants, Philippines. University of Auckland, Geothermal Institute, Diploma course project GTHRM-27.
World Energy Council, 2001: Survey of energy resources 2001. World Energy Council website: http://www.worldenergy.org/wec-geis/publications/.
Worldwide Energy Forum, 2003: The right to energy association, energy status report 2003. World Energy Forum website: http://www.energiesosfutur.org/.

Report 5 Bore Kwambai 31
APPENDIX I: Main flow diagram for Olkaria 1 power plant
FIGURE 1: Main flow diagram for Olkaria 1 power plant

Bore Kwambai Report 5 32
APPENDIX II: Output parameters for Olkaria I production wells (Kariuki and Wambugu, 2002; KenGen, 2005b,)
The table below is the summary of Olkaria east wells output as measured in September 2002. The wells connected to the system during the analysis are recorded in the daily log sheet are shown as On while those not in the system are shown as Shut.
Well No OW-
Discharge WHP
(bar-a)
Separator pressure (bar-a)
Enthalpy (kJ/kg)
Steam flow (kg/s)
Water flow
(kg/s) Quality Status
30/7/05
2 7.00 6.20 2168 4.64 1.81 0.72 On 5 7.05 6.40 2313 12.39 3.39 0.79 On 8 6.00 5.90 2486 6.44 0.94 0.87 Shut
10 6.35 5.80 2520 4.06 0.50 0.89 Shut 11 7.00 6.00 1941 3.94 1.92 0.67 On 13 6.10 5.90 2614 3.47 0.25 0.93 Shut 15 6.10 5.60 2034 5.64 2.94 0.66 On 16 6.00 5.80 1444 8.08 13.61 0.37 On 18 6.00 6.00 2663 6.50 0.31 0.96 On 19 8.50 5.80 1912 5.36 3.58 0.60 On 20 6.00 6.00 2595 5.64 0.47 0.92 Shut 21 6.20 5.80 2228 3.83 1.28 0.75 Shut 22 6.00 6.10 1746 3.64 3.39 0.52 Shut 23 6.30 6.20 2104 4.22 1.89 0.69 Shut
24/28 6.50,9.0 6.30 2539 9.81 1.14 0.90 On 25 9.50 6.20 2219 3.81 1.33 0.74 Shut 26 8.50 8.20 1856 9.69 7.75 0.56 On
27/31/33 6.5,7.5,7.0 5.10 2481 18.97 2.83 0.87 Shut 29/30 10.3,9.50 5.10 2398 39.94 8.44 0.83 On
32 7.20 6.80 2335 36.28 9.36 0.79 On Mean/Total 7.17 6.06 2229.8 196.36 67.14 0.75

Report 5 Bore Kwambai 33
APPENDIX III: Operating parameters for Olkaria I power plant (KenGen, 2005a and 2005b; Mitsubishi Heavy Industries, 1979)
The measured performance values for Olkaria I power plant together with some design values are shown in the table below. The measurements are based on readings taken on 30.07.2005.
Parameter Units Design value Unit 1 Unit 2 Unit 3 Total mean
Gross generator outputs kWh 15,000 380,000 375,400 372,000 1,127,400Auxiliary consumption kWh 18,270 9,570 13,030 40,870
Specific steam consumption kg/kWh 9.166 8.60 (2004)
9.16 (2000)
9.266 (1997) 9.166
Main steam pressure bar-a 5.66 5.56 5.56 5.60 Moisture separator pressure bar-a 5.46 5.56 5.46 5.50 Turbine inlet pressure bar-a 4.2 5.26 5.06 5.26 5.20 Turbine steam chest pressure bar-a 5.16 5.06 5.26 5.16 Turbine 1st stage pressure bar-a 2.06 2.01 1.86 1.98 Turbine exhaust temperature °C 50 60 57 56 Gland steam pressure bar-a 1.10 1.11 1.11 1.11 Ejector intercooler drains temperature °C 78 57 65*
(Estimate) 67
Condenser vacuum mmHg 515 520 460 500 Condenser inlet water temperature °C 25 22 25 24
Condenser outlet water temperature °C 48.7 50 47 55 51
Gas ejector steam pressure bar-a 5.26 5.26 5.26 5.26 2nd stage ejector exit temperature °C 65.20 65.5 63.3 64.3
L/H gov v/v open % 94 80 56 77
R/H gov. v/v open % Mean
30 (62)
50 (65)
46 (51)
42 (59)
Mass flow rate of steam into turbine t/h 137,890 137,890 137,890 413,670
Mass flow rate of steam into GES1 kg/h 1,380 1,380 1,380 4,140
Mass flow rate of steam into GES2 kg/h 1,580 1,580 1,580 4,740
Flow rate of water into GES condenser m3/h 14 14 14 42
Flow rate of water into condenser m3/h 2300 2300 2300 6,900
Flow rate of water into cooling tower m3/h 2,620 2,620 2,620 7,860
Flow rate of water out of cooling tower m3/h 2,342 2,342 2,342 7,026

Bore Kwambai Report 5 34
APPENDIX IV: Sample of EES calculation model "ENVIRONMENT CONDITIONS" h_0=ENTHALPY(Water,T=20,P=P_0) s_0=ENTROPY(Water,T=20,P=P_0) T_0=293.15 P_0=0.86 "Separation" m_DOT_n=m_DOT_s+m_DOT_w E_n=m_DOT_n*((h_n-h_0)-T_0*(s_n-s_0)) E_w=m_DOT_w*((h_w-h_0)-T_0*(s_w-s_0)) E_s=m_DOT_s*((h_s-h_0)-T_0*(s_s-s_0)) s_s=ENTROPY(Steam,X=1,P=P_n) h_s=ENTHALPY(Steam,X=1,P=P_n) h_w=ENTHALPY(Water,x=0,P=P_n) s_w=ENTROPY(Water,X=0,P=P_n) X_n=m_DOT_s/m_DOT_n s_n=ENTROPY(Water,h=h_n,P=P_n) "Total output" m_dot_ts=SumParametric('Table 1','m_dot_s') m_dot_tw=SumParametric('Table 1','m_dot_w') m_dot_t=m_dot_ts+m_dot_tw E_t=SumParametric('Table 1','E_n') {E_t=Available Exergy (exergy from all the wells at Olkaria 1)} E_ts=SumParametric('Table 1','E_s') {E_ts=total exergy of steam from Olkaria 1 wells} E_tw=SumParametric('Table 1','E_w') {E_tw=total exergy of separated water from Olkaria 1wells} eta_separation=E_ts/E_t {Overall Exergy Performance of Separation process} "Steam transmission" {Wells connected for the analysis are 2,5,10,15,16,18,19,24/28,26,30,32} m_dot_steam_conwells=SumParametric('Table 2','m_dot_s') m_dot_water_conwells=SumParametric('Table 2','m_dot_w') m_dot_total_conwells=m_dot_steam_conwells+m_dot_water_conwells E_STEAM_conwells=SumParametric('Table 2','E_s') E_WATER_conwells=SumParametric('Table 2','E_w') E_total_conwells=E_STEAM_conwells+E_WATER_conwells E_3=E_steam_conwells {E_3=total exergy of steam into the transmission from connected wells} E_4=E_41+E_42+E_43 {E_4=total exergy of steam reaching the flow meters} E_41=m_dot_41*(h_41-h_0-T_0*(s_41-s_0)) E_42=m_dot_42*(h_42-h_0-T_0*(s_42-s_0)) E_43=m_dot_43*(h_43-h_0-T_0*(s_43-s_0)) h_41=ENTHALPY(Steam,X=0.999,P=P_41) h_42=ENTHALPY(Steam,X=0.999,P=P_42) h_43=ENTHALPY(Steam,X=0.999,P=P_43) s_41=ENTROPY(Steam,X=0.999,P=P_41) s_42=ENTROPY(Steam,X=0.999,P=P_42) s_43=ENTROPY(Steam,X=0.999,P=P_43) m_dot_41=ssc_1*W1_actual+m_dot_81+gs m_dot_42=ssc_2*W2_actual+m_dot_82+gs m_dot_43=ssc_3*W3_actual+m_dot_83+gs m_dot_4=m_dot_41+m_dot_42+m_dot_43 {Total steamflow crossing the flow meters} gs=0.231{Gland steam flow} m_dot_81=0.822 {mass flow rate into unit 1 ejectors}

Report 5 Bore Kwambai 35
m_dot_82=0.822 {mass flow rate into unit 2 ejectors} m_dot_83=0.822 {mass flow rate into unit 3 ejectors} ssc_1=2.39 {Specific steam consumption for unit 1 2004} ssc_2=2.53{Specific steam consumption for unit 2 2000} ssc_3=2.57 {Specific steam consumption for unit 1 1997} p_41=5.46 {Moisture separator pressure for unit 1} p_42=5.56 {Moisture separator pressure for unit 2} p_43=5.56 {Moisture separator pressure for unit 3} W1_actual=15.833 {MWe load on unit 1} W2_actual=15.642 {MWe load on unit 2} W3_actual=15.500 {MWe load on unit 3} eta_transmission=E_4/E_3 {Overall Exergy Performance of transmission process} Loss_transmission=E_3-E_4 {Exergy wasted and lost during steam transmission} {EXERGY ANALYSIS OF TURBINES} {UNIT 1} E_51=M_dot_51*(H_51-H_0-T_0*(S_51-S_0)) H_51=ENTHALPY(Steam,X=X_5,P=P_51) S_51=ENTROPY(Steam,X=X_5,P=P_51) m_dot_51=ssc_1*W1_actual "FOR AN ISENTROPIC EXPANSION" S_61s=S_51 E_61s=M_dot_51*(H_61s-H_0-T_0*(S_61s-S_0)) H_61s=ENTHALPY(Steam,X=X_61s,P=P_6) X_61s=(s_61s-Sf_6)/(sg_6-sf_6) Sf_6=ENTROPY(WATER,X=0,P=p_6) Sg_6=ENTROPY(Steam,X=1,P=p_6) W1_s=M_dot_51*(h_51-h_61s) "Design performance" ETA_s=0.85 {Isentropic efficiency for the turbine assumed to be 85% for all turbines} W1_d=W1_s*ETA_s E_61d=M_dot_51*(H_61d-H_0-T_0*(S_61d-S_0)) H_61d=H_51-W1_d/M_dot_51 S_61d=ENTROPY(WATER,X=X_61d,P=p_6) X_61d=(H_61d-h_6f)/(h_6g-h_6f) h_6f=ENTHALPY(water,x=0,P=p_6) h_6g=ENTHALPY(Steam,x=1,P=p_6) "Actual performance" ETA_generator=0.95 {Estimated efficiency of all the generators} W1_t=W1_actual/ETA_generator {W1_t=actual work exergy developed by the turbine to the generator} E_61actual=M_dot_51*(H_61actual-H_0-T_0*(S_61actual-S_0)) s_61actual=ENTROPY(Steam,h=h_61actual,P=p_61actual) h_61actual=h_51-W1_t*1000/m_dot_51 h_61gactual=ENTHALPY(Steam,x=1,P=p_61actual) h_61factual=ENTHALPY(water,x=0,P=p_61actual) eta_energy1=W1_t*1000/(m_dot_51*h_51) eta_exergy1=W1_t*1000/(E_51-E_61actual) p_51=5.26 {Turbine inlet pressure bar-a (4.3 bar-g)} p_6=0.127 {Design Condenser absolute pressure (95.6 mmHg) for all condensers} p_61actual=0.173 {Measured Condenser absolute pressure 515mmHg}

Bore Kwambai Report 5 36
X_5=1 {Dryness of steam at inlet is assumed 100%} "Overall turbine performance" m_dot_5=m_dot_51+m_dot_52+m_dot_53{total mass flow of steam entering the turbines} E_5=E_51+E_52+E_53{Total exergy entering the turbines} E_6actual=E_61actual+E_62actual+E_63actual{Total actual exergy of steam leaving the turbines} W_t=w1_t+w2_t+w3_t {Total work exergy delivered by the turbines to the generators} Eta_energyoverall=Average(Eta_energy1,eta_energy2,eta_energy3) Wt_actual=W1_actual+w2_actual+w3_actual {Actual electrical energy generated} eta_exergyoverall=Average(eta_exergy1,eta_exergy2,eta_exergy3) "CONDENSERS" "Unit 1" E_141=m_dot_141*(h_141-h_0-T_0*(s_141-s_0)) h_141=ENTHALPY(water,p=p_0,T=T_141) s_141=ENTROPY(water,p=p_0,T=T_141) E_71cw=m_dot_141*(h_71-h_0-T_0*(s_71-s_0)) h_71=ENTHALPY(water,x=0,T=T_71) s_71=ENTROPY(water,x=0,T=T_71) e_71steam=m_dot_51*(h_71-h_0-T_0*(s_71-s_0)) e_71=E_71cw+e_71steam eta_condenser1=(e_71cw-e_141)/(e_61actual-e_71steam) m_dot_141=638.89 {mass flow rate of cooling water into condenser 1(kg/s)} T_141=25 {Temperature of cooling water at inlet into condenser 1} T_71=56 {Temperature of condensate from condenser 1} "Condensers overall" eta_meancon=Average(eta_condenser1,eta_condenser2,eta_condenser3) "GAS EJECTORS" ncg=.0025 {Assumed that NCG = 0.25% of steam by mass} "Unit 1" E_81=m_dot_81*(h_41-h_0-T_0*(s_41-s_0)) e_101=m_dot_101*(h_101-h_0-T_0*(s_101-s_0)) h_101=ENTHALPY(CarbonDioxide,T=T_ex1,P=P_61actual) s_101=ENTROPY(CarbonDioxide,T=T_ex1,P=p_61actual) m_dot_101=ncg*m_dot_51 {mass flow rate of NCG from condenser 1} T_ex1=50 {exhaust temperature of unit 1 turbine} E_111=m_dot_111*(h_111-h_0-T_0*(s_111-s_0)) m_dot_111=3.89 {mass flow rate of ejector 1 cooling water} h_111=enthalpy(water,p=p_0,T=T_141) s_111=entropy(water,p=p_0,T=T_141) e_121s=(1380/3600)*(h_121-h_0-T_0*(s_121-s_0)) s_121=entropy(water,x=0,T=T_121) h_121=enthalpy(water,x=0,T=T_121) e_121cw=m_dot_111*(h_121-h_0-T_0*(s_121-s_0)) T_121=78 {condensate drain temperature of ejector 1 intercondenser} e_131s=(1580/3600)*(h_131s-h_0-T_0*(s_131s-s_0))

Report 5 Bore Kwambai 37
h_131s=enthalpy(steam,x=1,p=p_0) s_131s=entropy(steam,x=1,p=p_0) e_131ncg=m_dot_101*(h_131ncg-h_0-T_0*(s_131ncg-s_0)) h_131ncg=enthalpy(carbondioxide,T=154,p=5.4) s_131ncg=entropy(carbondioxide,T=154,p=5.4) eta_ges1=((e_131ncg-e_101)+(e_121cw-E_111))/(E_81-(e_131s+e_121s)) {Ratio of exergy gained by NCG and cooling water to exergy lost by the motive steam} {mean efficiencies of gas extraction system} eta_gesmean=Average(eta_ges1,eta_ges2,eta_ges3) {COOLING SYSTEM} W_fans=rating_fan*3 W_pumps=rating_pump*2*0.6 {The pumps are assumed to be at 60% rated load} Rating_pump=160 {W} Rating_fan=94 {kW} "Unit 1" E_161=m_dot_161*(h_71-h_0-T_0*(s_71-s_0)) e_191=m_dot_191*(h_141-h_0-T_0*(s_141-s_0)) m_dot_161=2620*980/3600 m_dot_151=m_dot_51+m_dot_191-m_dot_161 m_dot_191=2342*980/3600 e_151=m_dot_151*(h_151-h_0-T_0*(s_151-s_0)) h_151=enthalpy(water,x=0,T=T_151) s_151=entropy(water,x=0,T=T_151) T_151=54 COP_cooling1=(e_161-e_191)/(w_fans+w_pumps) "Overall cooling system performance" COP_Overall=Average(COP_cooling1,COP_cooling2,COP_cooling3) Work_cooling=3*(w_fans+w_pumps) {OVERALL PLANT PERFORMANCE} W1_Auxiliary=0.7613 W2_Auxiliary=0.4063 W3_Auxiliary=0.5429 Wt_Auxiliary=W1_Auxiliary+W2_Auxiliary+W3_Auxiliary Work_net=Wt_actual-Wt_Auxiliary "Efficiency as a function of total two phase fluid exergy of connected wells" Eta_overall=Work_net*1000/E_total_conwells "Efficiency as a function of total steam exergy" eta_overallsteam=Work_net*1000/E_steam_conwells