executive turnover in uk firms: the impact of cadbury · executive turnover in uk firms: the impact...
TRANSCRIPT

1
Executive Turnover in UK Firms: the impact of
Cadbury
by
Elisabeth Dedman
Department of EconomicsUniversity of Bristol
e-mail: [email protected]
October 2000
Acknowledgements: This paper has benefited from the comments of Daniel Dedman,David Demery, Clive Lennox, Ken Peasnell and Ian Tonks. Mistakes remain theresponsibility of the author.

2
Executive Turnover in UK Firms: the impact of Cadbury
Abstract
This study examines the determinants of non-routine CEO departure in acomprehensive sample of UK listed firms between 1990 and 1995. It looksat whether the Cadbury Report, published in December 1992 has had animpact on the agency problem of managerial entrenchment. I find astrong negative relationship between firm performance and theprobability of non-routine CEO departure, with evidence that thedisciplinary process has become more efficient in the post-Cadburyregime. In addition, I find weak evidence that the insulatory effect of CEOstock ownership diminishes in power in the later regime. Whilst dividingthe roles of CEO and chairman reduces the entrenchment of the CEO, thenumber of non-executive directors has no impact on the probability of hisdismissal following poor firm performance.
JEL Classification: G3
Keywords: Corporate governance; managerial entrenchment; board structure

3
1. Introduction
This study examines the determinants of forced CEO departure in UK All Share
firms. The study period is centred on the implementation date of the Cadbury Code
(30 June 1993) and 2110 firm years are employed in the analysis. Specifically, I
investigate whether the introduction of the Cadbury reforms is associated with a
change in the determinants of non-routine CEO departure in UK listed firms. This
enables us to draw conclusions about whether the reforms caused a reduction in the
power of managers to resist replacement – managerial entrenchment.
At the extreme, allowing inefficient managers to maintain their control over corporate
resources in competitive product markets will result in control of those resources
being reallocated via the bankruptcy process. However, this may not be the most
efficient way of transferring control from weak managers to strong managers; the
discount at which assets are traded in such situations may mean that the residual
claimants (ie the equity holders) receive nothing. Such risks increase the rate of return
required by shareholders (Manne 1965). The presence of an active takeover market
reduces these risks and leads to investors demanding lower rates of return. The market
for corporate control therefore provides a more efficient way of reallocating control of
corporate resources. However, even this has been criticised as a ‘discipline of last
resort’, the argument being that managers should be subject to labour market
discipline, simply being replaced by better quality managers if they fail to meet
shareholder expectations (Fama 1980). Aware that they face such discipline,
managers have incentives to ‘entrench’ themselves, making themselves more costly to
displace. Jensen and Ruback (1983) argue that the resistance to replacement exhibited
by poor managers may be the costliest of all agency problems.

4
In December 1992, the UK Committee on the Financial Aspects of Corporate
Governance (the Cadbury Committee) published their final report. In it, they called
for improvements in the structure of UK boards, particularly in limiting the power of
the chief executive officer (CEO). Two recommendations, which reflected perceived
best practice, and which have since been widely adopted, are the separation of the
roles of CEO and chairman of the board, and keeping a minimum of three non-
executive directors on the board. Around the same time, the Institutional Shareholders
Committee issued a document encouraging its members to take a more proactive
interest in the governance of their investee firms, urging them to use the power of
their votes largely to back management, so that the threat of the withdrawal of support
would carry some weight with management.
This study looks for evidence that the Cadbury board structure reforms and the
concomitant increase in emphasis on institutional monitoring has reduced managerial
entrenchment. If the Cadbury reforms have reduced the power of UK top managers
such that it is now easier to dismiss them for poor performance, then UK firms may
find that external finance is available to them at more competitive rates (Shleifer and
Vishny 1997). Increased monitoring by institutions will decrease the risk of other
providers of finance at no extra cost. A reduction in managerial entrenchment may
therefore reduce firms’ cost of capital, increasing their competitiveness, and is
therefore desirable to shareholders.
There are many US studies which provide evidence of a significant negative
relationship between firm performance and top executive departure; there are fewer
such studies using UK data. This paper extends the work conducted on UK firms by
using a more comprehensive dataset than earlier studies. The other major contribution
of this study is that it examines the relationship between CEO departure, firm

5
performance and corporate governance measures across different regulatory time
periods (pre- and post-Cadbury), and provides evidence that Cadbury has served to
reduce managerial entrenchment, by strengthening the association between firm
performance and CEO survival, although, even before Cadbury, there was a strong
association between firm performance and CEO departure. Evidence that the Cadbury
reforms have affected managerial entrenchment, provides implications for future
governance reform policy.
The paper is structured as follows. Section 2 provides a review of relevant literature
while section 3 develops the hypotheses to be tested; section 4 describes the sample
and data and defines some terms used in the study; section 5 discusses the results of
univariate tests comparing non-routine CEO departure firms with no departure firms;
section 6 discusses the regression results; and section 7 summarises and concludes.
2. Literature Review
2.1 The association between firm performance and non-routine top executive
departure
Extant literature provides consistent evidence of a negative association between non-
routine top executive departures and poor firm performance.
Coughlan and Schmidt (1985) examine whether the probability of changes in top
management is conditional on stock price performance. Controlling for routine
retirements by eliminating CEOs aged 64 or over, they find performance year
cumulative abnormal stock returns to be negatively and significantly related to the
probability of CEO departure; this relationship is insignificant in the older group.
Warner, Watts and Wruck (1988) also explore the association between firms’ stock
returns and subsequent top management changes. They construct a sample of non-

6
routine departure firms by reading press articles surrounding top management changes
and eliminating departures due to takeovers, death, illness, management succession
and retirement. They find a strong negative relation between non-routine top
executive departure and final year of office market-adjusted stock returns. Ranking
firms by annual stock returns into deciles and observing turnover rates, they find that,
although in both the full sample and the forced departure sub-sample, firms in the
bottom decile are much more likely to experience turnover than firms in the top
decile, the turnover frequencies do not decline monotonically. The actual turnover
rate of 6% for firms in the lowest performance decile of the forced departure group
implies that management turnover is not highly sensitive to stock returns.
Weisbach (1988) argues that the probability of a bad CEO being fired is impounded in
the firm’s stock price. Low prior period CARs may reflect the market’s belief that it
will be difficult to displace entrenched managers, so two firms with equal
performance but different levels of entrenchment may have different prior year stock
returns. He therefore includes an accounting based measure in his analysis, as
accounting earnings do not reflect the market’s anticipation of CEO departure. His
performance measure is industry-adjusted return on assets. His results indicate that
boards use accounting performance measures more than stock returns when deciding
whether to dismiss a CEO; also that it can take up to two years for such action to be
taken. Denis and Denis (1995) find significantly negative CARs for 250 days prior to
the announcement of a forced resignation. They also find that CEO departure firms’
changes in ROA are significantly lower than the industry median for years –3 to –1,
where departure occurs in Year 0.
In the UK, Dahya, Lonie and Power (1998) find prior year abnormal stock returns to
be negatively associated with non-routine top executive departure, where top

7
executive is defined as CEO or chairman. However, this study uses a sample of CEO
departures drawn from the Extel news service database. There is some recent
evidence (Dedman and Lin, 2000) that firms who do not officially release CEO
departure news (such that it would be reported by Extel) vary significantly from
official announcers with respect to prior market performance. This suggests a bias
may exist in this sample. Also, Dahya et al (1998) adopt a matched sampling
approach in their multivariate tests. One of the fundamental requirements of such an
approach is that of controlling for important factors. The control sample of Dahya et
al (1998) is significantly larger (about 3 times the size) than the experimental sample.
As size is a significant factor in so many studies of firm behaviour, failure to control
for this may seriously bias their results.
2.2 The association between ownership structure and non-routine top executive
departure
Ownership structure may affect the association between firm performance and the
probability of top executive dismissal. The higher the ownership stake of the manager,
the more difficult he is to dismiss due to his voting power and the negative signal he
could send to the market by dumping his stock. Salancik and Pfeffer (1980), find that
CEO tenure is positively related to the firm being owner managed, ie the manager
owns at least 4% of the firm’s common stock. However, Weisbach (1988) finds that
CEO ownership has no significant effect on the probability of his losing his job.
Denis, Denis and Sarin (1997) show a substantial drop in the rate of non-routine top
executive departures for managerial ownership levels in excess of 10% of equity.
Their regression analysis reveals that top executive turnover is negatively related to
firm performance where the executive owns less than 1% of the firm’s common stock,
but that this relationship becomes insignificant at higher levels of managerial

8
ownership. In the UK, Dahya et al (1998) find that non-routine executive turnover is
much more common in firms where top executive ownership is less than 1% than in
firms with larger managerial stakes. In fact, they find no incidence of forced top
executive departure where the manager’s stake exceeds 10% of equity. This conflicts
with the finding of Gilson (1989), who examines CEO turnover in a sample of poorly
performing US firms. In 6% of cases, the departing manager held more than 10% of
the firm’s common stock, suggesting that stock ownership does not insulate managers
of US firms when performance is sufficiently poor.
Gilson (1989) also finds leverage to be positively related to CEO departure in poorly
performing firms. This may be due to the power of debtholders in times of financial
crisis. As a condition of continued support for the firm, debtholders may demand the
replacement of the top manager.
Economies of scale in monitoring, coupled with the negative impact of large scale
sales of stock, render institutional blockholders more powerful than small investors in
terms of their influence on investee firms (Black and Coffee 1994). Denis et al (1997)
find the presence of an institution holding an equity stake of more than 5%, positively
affects the probability of top executive turnover, although the level of institutional
ownership is not significant. In the UK, Dahya et al (1998) find that the level of
institutional ownership negatively influences the probability of a forced top executive
departure. This apparent conflict may be due in part to their control sample
comprising much larger firms than their departure sample, and institutional investors
gravitating towards larger firms.

9
2.3 The association between board structure and non-routine top executive departure
The two main aspects of board structure considered in existing empirical research are
the combination of non-executives and executives which makes up the board, and
whether the roles of CEO and chairman are combined. Outside directors are subject to
different incentives and disciplinary mechanisms than those of inside directors. The
risk to their valuable reputations motivates them to act as effective monitors of the
executive directors (Fama and Jensen 1983). Combining the roles of CEO and
chairman was seen as an overallocation of power to a single individual by the
Cadbury Committee (1992), and the high proportion of firms which have complied
with the recommendation to divide these roles is evidence that there is some cost to
the firm of maintaining a combined CEO/chairman (Dedman 2000). It may therefore
be predicted that dividing the roles at the top of the firm and employing sufficient
non-executive directors will reduce the power of the top executive, and strengthen the
observed negative relationship between firm performance and the probability of top
executive departure.
Salancik and Pfeffer (1980) fail to find a significant association between CEO tenure
and the proportion of inside directors on the board. However, Weisbach (1988) finds
that an outsider dominated board (where outside directors make up at least 60% of the
board) has a significant positive impact on the probability of a CEO losing his job. He
also finds that the stake of the top two officers is negatively related to the proportion
of outside directors on the board, as is the stake of the whole board. The results
regarding the impact of board structure in Denis et al (1997) are consistent with the
earlier findings of Weisbach, although weaker with respect to the influence of outside
directors on top executive departure.

10
Dahya et al (1998) find that, after controlling for ownership characteristics,
performance and firm size, combining the roles of CEO and chairman has a negative
impact on the probability of top executive non-routine departure in the UK. However,
the proportion of non-executives on the board has no significant effect.
2.4 Summary
Evidence from both the UK and US indicates that good firm performance is positively
associated with the continuance of top management. In the presence of poor firm
performance there is evidence that corporate governance measures, such as board and
ownership structure, can increase the likelihood of top management departure.
3. Hypothesis Development
This section uses evidence from prior (mainly US-based) literature to develop
hypotheses to be tested on a UK sample spanning two regulatory time periods. The
hypotheses (a) relate to general effects, while the hypotheses (b) look for structural
changes in observed relationships in the post-Cadbury time period.
Prior US research has consistently shown a negative relationship between firm
performance and the probability of CEO departure. There is evidence that both stock
price-based and accounting-based measures are significantly related to the chance of a
CEO losing his job. There is also evidence that it can take up to two years for the
disciplinary process to remove the CEO (Coughlan and Schmidt 1985, Warner et al
1988, Weisbach 1988).
H1a: The incidence of non-routine CEO departure will be negatively
related to the prior performance of the firm.
If the reforms initiated by the Cadbury Code have taken away some of the insulation
from removal previously enjoyed by managers, then we might expect to see a

11
structural change in the relationship between firm performance and CEO departure,
between the two time periods (pre- and post-Cadbury). Specifically, we might expect
to see any observed relationship becoming stronger in the post-Cadbury time period.
H1b: The negative relationship between non-routine CEO departure
and prior firm performance will be stronger post-Cadbury.
Previous authors have examined the effect of the firm’s ownership structure on the
probability of the manager of a poorly performing firm being replaced. The
relationship between firm performance and non-routine CEO departure has been
found to be positively influenced by the presence of institutional blockholders (Denis
et al 1997) and by the ratio of debt to equity (Gilson 1989), and negatively affected by
the ownership levels of the CEO (Denis et al 1997, Dahya et al 1998). These findings
lead to the following testable hypotheses:
H2a: The incidence of non-routine CEO departure will be positively
associated with institutional ownership and gearing, and negatively
associated with levels of CEO ownership.
I also test whether the Cadbury reforms have encouraged institutions and debtholders
to lobby for the removal of managers of under-performing firms to the extent that
these managers are no longer protected by having high levels of stock ownership.
H2b: Post-Cadbury, there will be a stronger positive association
between non-routine CEO departure and institutional ownership and
gearing levels, and a less negative relationship between the probability
of non-routine CEO departure and CEO ownership.
The final set of hypotheses examine the association between CEO departure
and the structure of the firm’s board.

12
H3a: The probability of non-routine CEO turnover will be positively
associated with the proportion of non-executive directors on the board
and negatively associated with the CEO also holding the title of
Chairman of the board.
The Cadbury Code emphasised the role of non-executive directors and called for an
end to the practice of CEOs having ‘unfettered power’. We might therefore expect to
observe non-executives having more power post-Cadbury; we may also witness a
reduction in the insulation enjoyed by joint CEO/chairmen.
H3b: Post-Cadbury, there will be a stronger positive relation between
CEO departure and the proportion of non-executives on the board, and
a more negative association between CEO departure and the CEO also
holding the title of Chairman of the board.
These hypotheses are tested on samples of firms as described in the next section.
4. Sample and Data
4.1 The Sample
The sample is based on FT All Share firms which appear in the Index in April of each
year from 1990 to 1995. To be included in the sample each firm must have board
structure data available in the Corporate Registers for the year of inclusion in the
Index and the subsequent year; share price performance data must be available in
Datastream; and accounting data must be available from the Global Vantage database.
The basic sample therefore comprises 2110 firm years.
4.2 Identifying CEO Departures
The name of the top executive (CEO or MD where there is no named CEO) is taken
from the Stock Exchange Yearbook (SEYB) for the accounting year of inclusion in

13
the All Share Index (Year 0) plus the following year. A change is deemed to have
occurred where the title holder has changed between Year 0 and Year 1. However, the
SEYB reports the board as it stands at the report date, which may be two or three
months later than the firm year end. In order to classify the change events in the
correct year, the dates of changes are checked using Extel and the Financial Times
(FT). Where a change occurs, Year 0 is the last full accounting year of service of the
outgoing CEO.1
4.3 Definition of Non-routine Departure
In this study we are interested in the effect of the Cadbury reforms on the propensity
of boards to force out poorly performing top executives. Departures due to retirement,
death or illness, normal succession, CEO’s leaving to take up another post, and the
firm splitting the roles of CEO and chairman are interesting in their own right, but are
not the issue here. In order to screen out such departures, press reports (from the FT)
regarding the departure are studied and each departure is subsequently classified as
being due to retirement; resignation; new job (where the CEO leaves to take up a
similar position elsewhere); death or illness; dismissal; succession (where the CEO
becomes chairman or vice-chairman); split (where the CEO was also chairman but
divided the roles and kept the chairman position); or remains unclassified because no
news articles are available. The non-routine departure (NRD) sub-sample consists of
departures due to dismissal or resignation.2 This classification system is more
comprehensive than those generally employed in prior studies and should therefore
result in a less noisy measure of forced CEO departure.
1 For ease, I now refer to the top executive in this study as the CEO, whether he is the CEO or the MD.2 Unreported t-tests on the means of the dismissal and the resignation sub-samples reveal no significantdifferences between these sets.
14
4.4 Firm Performance Measures
Consistent with Warner et al (1988), stock price performance is measured as the
firm’s annual share return to the accounting year end, Year 0, minus the return on the
All Share Index for the same 12 month period (MadjRet). A lag of this is also used
(MadjRet1), ie the market-adjusted return in the previous year, Year -1. This measure
of stock price performance abstracts from general market movements and can be
thought of as an approximation of the firm’s risk-adjusted return (on the assumption
that the firm’s beta is one).
Accounting performance (ROA) is measured as the firms earnings before
extraordinary activities for accounting year end 0, deflated by the book value of total
assets at the same date. An industry relative measure of accounting performance is
also used (RelROA). This is ROA less the ROA for the median firm in the same 2-
digit SIC classification from the whole population of firms on the Global Vantage
(GV) database. This is comparable to the accounting based performance measure
employed by Weisbach (1988). This measure may be thought of as the firm’s risk-
adjusted accounting return.
4.5 Board and Ownership Structure
In addition, the effects of board and ownership structure on the likelihood of CEO
departure, are examined. I use the dummy variable (‘Split’) which is coded one if the
CEO is not also the chairman, and also include the proportion of non-executive
directors on the board (‘Propnex’) both measured as at accounting year end, Year 0.
The proportion of equity held by institutional blockholders (with stakes of at least
3%) is used as a measure of institutional ownership (‘Propinst’). The ratio of debt to

15
debt and equity, as at Year End 0 is also included in the tests as a measure of firms’
gearing (‘Lev’).
This information is collected from the Hemington Scott Corporate Registers. Lack of
data availability further reduces the sample here, but firms in the reduced sample do
not differ significantly with regard to size and performance to firms in the larger
sample, so sample bias problems are assumed to be minor.
4.6 Definition of Post-Cadbury
In order to ascertain whether the Cadbury Report has had any observable effect on
managerial entrenchment, the sample is partitioned into pre-Cadbury and post-
Cadbury firm years. Departures (or lack of them) from firms in this study occur
within 12 months of the accounting year end, Year 0. Firms with accounting year ends
prior to 1st July 1992 will therefore experience any departure before the
implementation date of 30 June 1993. Firms with accounting year ends prior to 1st
July 1992 are therefore classified as pre-Cadbury; those with later year ends are
categorised as post-Cadbury.
4.7 Description of Sample Firms
Table 1 describes the sample. It shows that much of the data is non-normally
distributed. Skewness is non-zero and most of the data is leptokurtic in distribution.
The size variable, initially measured as the book value of firms’ total assets, is log-
transformed and the distribution of the transformed variable approaches normal. This
is the base sample which will be employed in the analysis.
Table 1 about here
16
5. Univariate Analysis
This section contains descriptive analyses of various sub-samples of the base dataset
described in the previous section.
5.1 Departure Rates Pre- and post-Cadbury
Table 2 examines the rates of CEO departures across sample firms in each time period
under study. Panel A compares the rates of total CEO departures. Prior to Cadbury,
the turnover rate was 11.4%, which does not differ significantly (in chi-squared tests)
from the rate of 11.8% in post-Cadbury firms.
Panel B breaks down the departures in each period by reason. A chi-squared test
conducted on this panel yields insignificant results, indicating that reasons for CEO
departures are not dependent upon the time period in which they occurred. Testing the
individual rows of Panel B also yields insignificant chi-squared statistics except in the
case of the new job category. This may be evidence of changes in the managerial
labour market, but the sample size is too small for sound inferences to be drawn.
Panel C gives the proportion of each period’s CEO change firms which experience a
non-routine departure. These proportions (36.4% pre-Cadbury and 34.1% post-
Cadbury) do not differ significantly in chi-squared tests.
Table 2 demonstrates that there has been no significant change in rates of CEO
departures, or forced CEO departures, between the two regulatory regimes. Any
impact on managerial entrenchment made by the Cadbury Code is not observable at
such a simple level.
Table 2 about here

17
5.2 A Comparison of Non-routine Departure Firms with No-departure and Other
Departure-type Firms
Table 3 compares the non-routine departure firms to firms with no departure for each
time period. Departures due to dismissal or resignation are classified as non-routine
departures (NRD).
Apart from pre-Cadbury median lagged industry-adjusted return on assets, firms in
the NRD sub-sample suffer the worst performance of the three groups, whatever the
performance measure employed, in both time periods. This suggests that poorly
performing firms are more likely to replace their top manager than well performing
firms.
In both time periods, the NRD firms are more likely to divide the roles of CEO and
chairman of the board. This is consistent with the results in Dahya et al (1988) who
found that combining the roles negatively influenced the probability of CEO
departure for reasons other than departure. (Note that the sample in Dahya et al (1988)
comprised pre-Cadbury firms only.)
The number and proportion of non-executive directors appears to be very similar
across sub-groups in both time periods.
In terms of outside ownership, post-Cadbury NRD firms have the highest mean and
median proportion of their equity held by institutional blockholders (stakes >=3%).
Post-Cadbury NRD firms also have the highest gearing ratio of the three groups. This
suggests that large blockholders and debtholders may have been playing a more
proactive governance role since 1993.
CEO ownership levels are at their lowest in the NRD group both pre- and post-
Cadbury. This supports prior UK work which suggests stock ownership is a

18
managerial entrenchment device (Dahya et al, 1998). However, average CEO
ownership levels amongst NRD CEOs are higher post-Cadbury, which may indicate a
reduction in the protection from dismissal offered to CEOs by share ownership. In
order to both control for the non-normal distribution of the CEO ownership variable,
and to replicate earlier work, I introduce two dummy variables into Table 3. The first,
OwnDum, is an indicator variable, taking the value of one if the CEO owns at least
4% of the firm’s equity. This is the threshold employed by Salancik and Pfeffer
(1980). The second, OwnDum2 is also an indicator variable, but takes the value of
one if the CEO owns at least 1% of the firm’s equity. This is the ownership limit used
by Dahya et al (1998). In both time periods, the NRD category has the lowest
proportion of CEOs reaching these two ownership thresholds. However, there is a
noticeable reduction in the proportion of NRD firms whose CEOs surpass these limits
in the post-Cadbury period. This implies that there is, in fact, an increase in the
entrenchment capability of CEO ownership in the later time period.
Tenure is shorter for NRD CEOs in both time periods. This supports the contention
that, given enough time in office, CEOs are able to insulate themselves from
dismissal, perhaps in ways which are difficult to observe (eg in the recruitment of
sympathetic board members – see Shivdasani and Yermack, 1999). Alternatively, it
may simply illustrate how firms observe the performance of CEOs for the first few
years in office, and how some CEOs fail to survive this test.
Age is highest in the ‘other departure’ sub-group. This is as would be expected, given
that this group includes CEOs who are retiring or succeeding to the position of
chairman.
Finally, size does not appear to vary widely across sub-groups, failing to support
earlier work by Denis et al (1997) in the US and Dayha et al (1998) in the UK. I

19
attribute the apparent inconsistencies firstly to differences between the two countries,
and to the methodology employed by Dahya et al. (As mentioned earlier, they fail to
match their control and experimental samples by firm size, which is often correlated
to other variables in accounting research.)
Table 3 about here
5.3 Departure Rates and Firm Performance
In Table 4 the sample firms are divided into deciles according to their market adjusted
annual stock returns for Years 0 and -1. Although the table shows that the probability
of non-routine departure does not increase monotonically as performance decreases
(this is what Warner 1988 also found), some interesting patterns emerge. Prior to
Cadbury, 72% of non-routine departures were from the bottom half of performers by
market adjusted stock returns for Year 0 (the last full year the CEO was in office);
post-Cadbury this had risen to 89%. Pre-Cadbury 74% of departures were in the
lowest half of performers as measured by penultimate CEO year (Year –1) stock
returns; post-Cadbury this had dropped to 62%. This may indicate that the labour
market has increased the speed at which it disciplines poorly performing CEOs.
Table 4 about here
5.4 Departure Rates and Firm Ownership
Prior literature suggests that the relationship between firm performance and top
executive dismissal may be influenced by the ownership structure of the firm.
Salancik and Pfeffer (1980) find that the average tenure of CEOs who own at least 4%
of the firm’s common stock is much longer than that of CEOs with lower levels of
ownership (16 years in owner managed firms versus 5.41 years in externally
controlled firms and 4.89 years in management controlled firms). Dahya et al (1998)

20
find a forced departure rate of 4.3% for firms whose CEO owns less than 1% of
equity; 0.3% for firms whose CEO owns 1%-5% of equity; and 0.9% where the CEO
owns between 5% and 10% of stock. They find no incidence of forced departure
where the CEO owns more than 10% of stock.
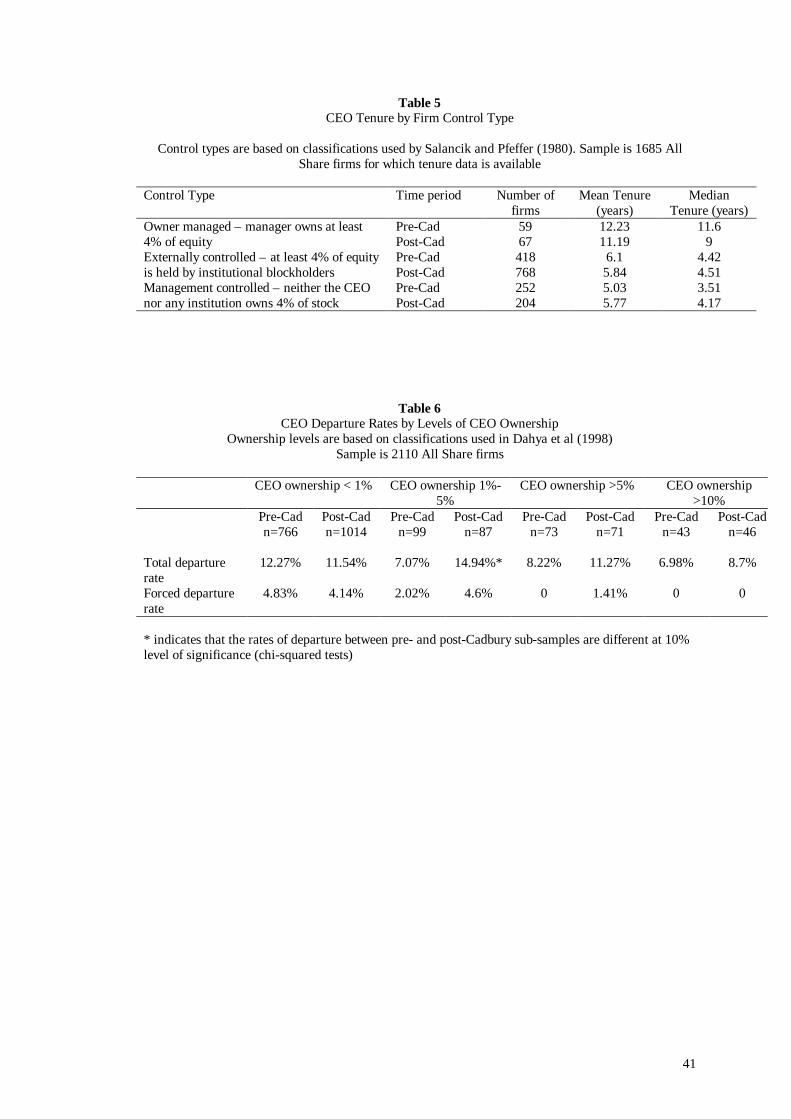
Table 5 replicates Salancik and Pfeffer’s (1980) firm control types and finds that in
the UK, as in the US, the tenure of CEOs in owner-managed firms is much longer
than the tenure of managers in externally-controlled or manager-controlled firms.
Although this relation holds in both time periods, the average tenure of CEOs of
owner-managed firms has fallen by 8.5% post-Cadbury.
Table 5 about here
Table 6 partitions the sample according to the CEO ownership classifications used by
Dahya et al (1998). For CEO ownership levels of less than 1% our forced departure
rates are similar, at over 4%. However, I find higher non-routine turnover rates for
CEO ownership of 1%-5%, with a large (though statistically insignificant) increase in
the rate (from 2.02% to 4.6%) in the post-Cadbury regime. For CEO ownership levels
in excess of 5%, there are no forced departures in our pre-Cadbury sample, although
post-Cadbury 1.41% of firms experienced non-routine top executive departure in this
ownership category. Like Dahya et al (1998), I find no forced CEO departures where
that executive owns 10% or more of the firm’s stock. Rates of top executive turnover
partitioned with respect to top executive ownership stakes imply that CEO ownership
insulates managers from dismissal, although there is an apparent reduction in this
protection post-Cadbury. However, it must be noted that neither Dahya et al nor Table
6 allow for firm performance in this analysis. Both sets of results would also be
explained by a positive relationship between CEO ownership and firm performance.

21
Table 6 about here
5.5 Summary
The univariate tests in this section provide useful indicators of associations between
firm performance, governance variables, regulatory regime and non-routine CEO
departures in UK All Share firms in the first half of the 1990s.
Firstly, there is no apparent change in the rate of CEO departure between the two
regimes. The reasons for departure are also generally independent of the time period
in which they occur.
Non-routine departure (NRD) firms suffer worse accounting and stock market
performance than both no-departure firms and other departure type firms. This holds
true for both Year 0 and Year –1 performance in each time period. However, tests in
this section also indicate that, in the post-Cadbury regime, Year 0 performance is
more strongly related to non-routine departure, consistent with an acceleration in the
disciplinary process between the two time periods.
Whilst there is some evidence to suggest that combining the roles of CEO and
chairman of the board may serve to entrench the top manager, there is no indication
that non-executive directors affect the likelihood of non-routine CEO departure.
Descriptive analysis points to there being a positive association between the
proportion of a firm’s equity held by institutional blockholders and non-routine
departure; NRD firms are also more highly geared than other firms in the sample.
Replications of tests by Salancik and Pfeffer (1980) and Dahya et al (1998) generate
results consistent with these authors, in that non-routine top executive turnover occurs
at a much lower frequency where CEO share ownership is high. However, I extend

22
their results by showing that the insulatory effect of managerial share ownership
appears to have diminished post-Cadbury.
The following section uses multivariate analysis to examine the hypotheses generated
in section 3.
6. The Determinants of Non-routine Top Executive Departures
This section reports the results of multivariate tests on the sample firms, examining
the effects of firm performance, ownership structure and board structure on the
probability of non-routine, or forced, CEO departure. The tests employed are logit and
ordinary least squares regression. The dependent variable used in the logit analysis is
non-routine departure (NRD), the sum of resignations and dismissals. Non-NRD firms
are no-departure firms plus firms whose CEOs leave for other reasons, these being
retirement, succession, splitting the roles of CEO and chairman, getting a new job,
death or illness, or those firms whose departures I was unable to classify. The
dependent variable employed in the OLS tests is CEO tenure, measured as the
difference in years between the accounting year end of the last full year the CEO held
office (Year End 0) and the date he was appointed to the position. Data availability
restricts the sample size to 1685 firms when tenure is the dependent variable.
6.1 The Association Between Firm Performance and Non-routine Top Executive
Departure
This sub-section provides tests of the following hypotheses:
H1a: The incidence of non-routine CEO departure will be negatively
related to the performance of the firm.
H1b: The negative relationship between non-routine CEO departure
and firm performance will be stronger post-Cadbury.

23
Table 7 reports the results of logit regressions which examine the association between
the probability of a forced CEO departure and final (Year 0) and prior to final year
(Year –1) firm performance. The results of Model 1a support the findings of the
univariate tests, and indicate that non-routine chief executive departure is negatively
related to final and penultimate year market adjusted stock returns, although this
association is only significant for the accounting year immediately prior to the
departure (Year 0). Model 1b provides more detail, and suggests that, whilst
penultimate year stock market performance was significantly associated with non-
routine CEO turnover prior to Cadbury, a significant negative shift in the relationship
renders it insignificant post-Cadbury. Model 1b also contains evidence that the
significant negative association between Year 0 share returns and CEO departure
which existed prior to Cadbury, has become even stronger since Cadbury (see the
significant negative coefficient on the interaction term MadjRet*PostCad). This
evidence suggests that, in the UK prior to Cadbury, it could take up to two years for a
poorly performing manager to be fully disciplined by the labour market, a finding
consistent with earlier US work (eg see Coughlan and Schmidt 1985, Warner et al
1988). However, it appears that, post-Cadbury, the disciplinary process is working
faster, with CEOs more likely to lose their jobs following only one year of stock
market underperformance by their firms.
Models 2a and 2b show a negative, though generally insignificant, association
between the firm’s accounting performance and the likelihood of the CEO resigning
or being fired. Model 2b suggest that, pre-Cadbury, penultimate year ROA may have
played a role in boards’ retain/dismiss decisions, but this association is no longer
significant in the later time period.
24
Models 3a and 3b indicate that firms use industry-adjusted accounting performance
measures when deciding whether to retain their CEOs. This is consistent with results
obtained in the US by Weisbach (1988), although it is Year 0 RelROA which is
significant in the UK. (It is lagged change in industry adjusted earnings which
Weisbach finds significant.)
Table 7 therefore informs us that it is final year market adjusted share returns and
final year industry-adjusted accounting returns which are most strongly associated
with non-routine CEO departures in the UK. This supports hypothesis H1a.
Furthermore, in support of hypothesis H1b, there is evidence that the disciplinary
process has been operating more quickly in the later regime.
6.2 The Association between Ownership Structure, Board structure and Non-
routine CEO Departure
This section looks for evidence to support the following hypotheses:
H2a: The incidence of non-routine CEO departure will be positively
associated with institutional ownership and gearing, and negatively
associated with levels of CEO ownership.
H2b: Post-Cadbury, there will be a stronger positive association
between non-routine CEO departure and institutional ownership and
gearing levels, and a less negative relationship between the probability
of non-routine CEO departure and CEO ownership.
H3a: The probability of non-routine CEO turnover will be positively
associated with the proportion of non-executive directors on the board
and negatively associated with the CEO also holding the title of
Chairman of the board.

25
H3b: Post-Cadbury, there will be a stronger positive relation between
CEO departure and the proportion of non-executives on the board, and
a more negative association between CEO departure and the CEO also
holding the title of Chairman of the board.
The results of the tests are reported in Table 8. The performance variable used is
industry-adjusted return on assets. This is to control for possible share price effects of
the market anticipating a CEO departure. To control for the non-normal distribution
of CEO ownership, a dummy variable (OwnDum2) is employed which takes the value
of one if the CEO owns at least 1% of the firm’s issued equity.3 This variable was
chosen to test the findings of earlier work, which has shown that managerial
entrenchment occurs at very low levels of stock ownership (Denis et al 1997, Dahya
et al 1998).
Model 1a provides evidence that the amount of equity held by institutional
blockholders has a significant positive association with the probability of non-routine
CEO departure. The sign on the gearing term is positive, as predicted by H3a, but is
not significant. The indicator variable, OwnDum2, is negative and highly significant,
suggesting that, even at low levels of managerial ownership, CEOs are able to reduce
the chance of them being forced to leave. Model 1b fails to provide any substantive
support for H1b. Although there is some indication that there has been a positive shift
in the influence of institutional investors post-Cadbury, the coefficient on the
interaction term is insignificant. The signs on the interaction terms measuring changes
in the effects of gearing and CEO ownership are both opposite to the predictions of
H3b, although the coefficients are not statistically significant.
3 The results remain qualitatively unchanged if stock market performance variables are used instead ofaccounting returns. Also, the results are robust to substituting a dummy variable (OwnDum), which iscoded one if the CEO owns at least 4% of equity, for OwnDum2.

26
Models 2a and 2b test hypotheses 3a and 3b respectively. Little support is found for
these hypotheses using this dataset. Model 2a provides no evidence of a positive
association between the proportion of non-executive directors on the board and the
likelihood of non-routine CEO turnover. Repeating the tests using a dummy variable
coded one if the board comprises at least 60% non-executives also fails to yield
significant results. I am therefore unable to find evidence in a UK dataset to support
the US findings of Weisbach (1988)4. The coefficient on the CEO/chairman split
variable is positive and significant in Model 2b, suggesting that dividing the roles at
the top of the firm reduces managerial entrenchment and providing support for similar
findings in the UK by Dahya et al (1998).
4 Although it should be noted that Weisbach (1988) screened out ‘grey’ directors.

27
7. Summary and Conclusions
This paper has examined a sample of 2110 All Share firm years for an association
between CEO departure, firm performance and board and ownership structure. It has
also looked for changes in observed relationships since Cadbury.
The rate of non-routine CEO departure in this sample is very low, at around 4%,
though there is considerable variation between firms in different performance
categories. Other univariate tests included in section 5 strongly indicate that non-
routine CEO departure is negatively associated with firm performance and also with
the equity ownership of the CEO. They also suggest that there may have been some
shift in the influence of these variables between the two time periods, with the extra
weight put on Year 0 stock market performance post-Cadbury pointing to a decrease
in the time taken to discipline poorly-performing managers. The insulatory effect of
share ownership appears to have diminished in the later regime. There is therefore
evidence that managerial entrenchment has been reduced by the Cadbury Committee.
Multivariate analysis conducted in section 6 supports the findings of a strong negative
association between firm performance and forced CEO departure. There is evidence
of some strengthening in this relationship post-Cadbury, and also that firms with poor
stock market performance are relieving their top managers of their posts more quickly
in the later time period.
Ownership structure seems to influence CEO survival probabilities, with the
proportion of equity held by institutional blockholders positively affecting the
probability of forced departure. However, there is little to suggest that this type of
owner have become more powerful as monitors post-Cadbury.

28
CEO ownership has a powerful negative impact on the likelihood of forced CEO
departure. Various measures of CEO ownership are employed. Whilst they are all
significant, I choose to report the results using OwnDum2, a dummy variable coded
one if the CEO owns just 1% or more of the firm’s stock. This supports the findings
of earlier work which has found evidence of managerial entrenchment at surprisingly
low levels of CEO equity ownership. Multivariate tests fail to confirm earlier
evidence that the entrenchment power of share ownership has diminished post-
Cadbury. The proportion of non-executives on the board has no significant influence
on the incidence of CEO departure, but dividing the roles of CEO and chairman
positively affects the chances of non-routine CEO departure, as predicted. However,
there is no significant change in the board structure variables across time periods,
implying that the Cadbury Code has failed to reduce the power of the CEO over the
board.
It seems that there is a stronger association between firm performance and CEO
survival in the post-Cadbury time period. However, there is little evidence that
individual governance mechanisms have brought about this change.
Consistent with prior studies, the paper finds a strong association between the
probability of non-routine CEO departure in Year 1 and stock market performance in
Year 0 and Year –1 in the early sample. However, I find evidence that the process of
labour market discipline has increased in speed since Cadbury, as only final year
(Year 0) stock market performance is significant in the later sample. Although firms
experiencing a non-routine CEO departure have significantly lower industry adjusted
accounting returns than firms with no departure, accounting measures of performance
are not significantly related to CEO departure in the regression analysis. However,

29
Year –1 accounting performance has a positive and significant impact on CEO tenure
as at Year 0.
The UK sample is similar to the US sample of Salancik and Pfeffer (1980) in that
CEOs of owner managed firms enjoy significantly longer periods in office than
managers of other control type firms. However, further analysis reveals that, whilst
ownership of at least 4% of the firm’s stock significantly positively affects tenure pre-
Cadbury, there is no significant association between the two post-Cadbury. Although
non-routine departure rates decline as levels of CEO ownership increase, no
significant association is found between CEO ownership and forced CEO departure in
either time period in the logit analysis.
The univariate tables show that post-Cadbury, levels of institutional ownership and
gearing are significantly higher in non-routine departure firms than in no departure
firms. However, in the later regression analysis, these variables fail to reach
significant levels.
This study therefore provides evidence that managers of firms which underperform
the stock market are more likely to face labour market discipline (ie to lose their jobs)
than managers of firms which perform well. It also suggests that the Cadbury reforms
have served to reduce managerial entrenchment, by reducing the insulatory effect of
managerial stock ownership and increasing the power of the board. Additionally,
there is weak evidence that external owners reduce the likelihood of poorly
performing managers remaining in post.

30
BIBLIOGRAPHY
Beasley, M., 1996, An empirical analysis of the relation between the board of director
composition and financial statement fraud, The Accounting Review, Vol. 71 pp. 443-
465.
Black, B. and J. Coffee, 1994, Hail Britannia?: Institutional investor behavior under
limited regulation, Michigan Law Review, Vol. 92, pp. 1997-2087.
Borokhovich, K., Brunarski, K. and R. Parrino, 1997, CEO contracting and anti-
takeover amendments, Journal of Finance, Vol. 52.
Brickley, J., Coles, J., and G. Jarrell, 1997, Leadership structure: Separating the CEO
and Chairman of the Board, Journal of Corporate Finance, pp. 189-220.
Chew, D.H. (Ed), 1997, Studies in International Corporate Finance and Governance
Systems: a comparison of the US, Japan and Europe, Oxford.
Conyon, M., 1994, Tenure and contracts: the experience of UK CEOs, Personnel
Review, Vol. 23, pp. 25-33.
Conyon, M. and P. Gregg, 1994, Pay at the top: a study of the sensitivity of top
director remuneration to company specific shocks, National Institute Economic
Review, August.
Conyon, M., 1996, Does the market for top executives work? CEO pay and turnover
in small UK companies, Unpublished working paper, Warwick Business School.
Conyon, M., 1994, Corporate governance changes in UK companies between 1988
and 1993, Corporate Governance Research Papers, Vol 2.
31
Cosh, A. and A. Hughes, 1997, The changing anatomy of corporate control and the
market for executives in the United Kingdom, Journal of Law and Society, Vol. 24.
Coughlan, A., and R. Schmidt, 1985, Executive compensation, management turnover,
and firm performance: An empirical investigation, Journal of Accounting and
Economics, Vol. 7, pp. 43-66.
Dahya, J., Lonie, A., and D. Power, 1998, Ownership structure, firm performance and
top executive change: an analysis of UK firms, Journal of Business Finance and
Accounting, Vol. 25, pp.1089-118
Dedman, E., 2000, An investigation into the determinants of UK board structure
before and after Cadbury, Corporate Governance: an international review, Vol 8.
Dedman, E. and Lin, S., 2000, The market reaction to CEO departures: evidence from
the UK, University of Bristol Working Paper.
Denis, D. and D. Denis, 1995, Performance changes following top management
dismissals, Journal of Finance, Vol. 50, No. 1, pp. 1029-57.
Denis, D., Denis, D., and A. Sarin, 1997, Ownership structure and top executive
turnover, Journal of Financial Economics, Vol. 45, pp. 193-221.
Fama, E., 1980, Agency problems and the theory of the firm, Journal of Political
Economy, Vol. 88, pp.288-307.
Fama, E., and M. Jensen, 1983, Separation of ownership and control, Journal of Law
and Economics, Vol. 26, pp. 301-325.

32
The Final Report of the Committee on Corporate Governance, (The Hampel Report),
1998, Gee, London.
Franks, J. and C. Mayer, 1996, Hostile takeovers and the correction of management
failure, Journal of Financial Economics, Vol. 40, pp. 163-181.
Gibbons, R. and K.J. Murphy, 1992, Optimal Incentive Contracts in the Presence of
Career Concerns: Theory and evidence, Journal of Political Economy, Vol. 100
pp.468-505
Gilson, S., 1989, Management turnover and financial distress, Journal of Financial
Economics, Vol. 25, pp. 241-262.
Hart, O., 1995, Corporate governance: some theory and implications, Economic
Journal 105 (430), pp. 678 – 689.
Healy, P., 1985, The effect of bonus schemes on accounting decisions, Journal of
Accounting and Economics, Vol. 7, pp.85-107.
Holland, J., 1995, The corporate governance role of financial institutions in their
investee companies, Chartered Association of Certified Accountants, Research
Report No. 46, November.
Holland, J., 1998, Influence and intervention by financial institutions in their investee
firms, Corporate Governance: an international review, Vol. 6, pp.249-264.
Hosmer, D. and S. Lemeshow, 1989, Applied Logistic Regression, Wiley.

33
Jensen, M., and W.H. Meckling, 1976, Theory of the firm: Managerial behavior,
agency costs and ownership structure, Journal of Financial Economics, Vol. 3, pp305-
360.
Jensen, M. and K. Murphy, 1990, Performance pay and top management incentives,
Journal of Political Economy, Vol. 98, pp. 225-264.
Jensen, M., and R. Ruback, 1983, The market for corporate control: The scientific
evidence, Journal of Financial Economics, Vol. 11, pp.5-50.
Mallin, C., (1997) Investor Voting Rights, in Corporate Governance: Responsibilities,
Risks and Remunerations (Eds Keasey and Wright)
Manne, H., 1965, Mergers and the market for corporate control, Journal of Political
Economy, Vol. 75, pp. 110-126.
Martin, K., and J. McConnell, 1991, Corporate performance, corporate takeovers, and
management turnover, Journal of Finance, Vol. 46, pp. 671-688.
Midgely, 1975, Companies and TheirShareholders: The Uneasy Relationship,
Butterworths.
Morck, R., Shleifer, A. and R. Vishny, 1998, Management ownership and market
valuation: an empirical analysis, Journal of Financial Economics, Vol. 20, pp. 293-
316.
Palepu, K., 1986, Predicting Takeover Targets, Journal of Accounting and
Economics, Vol. 8, pp. 3-35.

34
The Report of the Committee on the Financial Aspects of Corporate Governance,
1992, Gee, London.
The Roles and Responsibilities of Investors, Institutional Shareholders’ Committee,
1992.
Savage, N. and R. Bradgate, 1993, Business Law (2nd ed), Butterworths.
Salancik, G.R., and J. Pfeffer, 1980, Effects of ownership and performance on
executive tenure in US corporations, Academy of Management Journal, Vol. 23, pp.
653-664.
Sealy, L., 1992, Cases and Materials in Company Law (5th ed), Butterworths.
Shivdasani, A., 1993, Board composition, ownership structure, and hostile takeovers,
Journal of Accounting and Economics, Vol. 16, pp. 167-198.
Shivdasani, A., and D. Yermack, 1999, CEO involvement in the selection of new
board members: an empirical analysis, Journal of Finance, Vol. 54, pp. 1829-1853.
Shleifer, A., and R. Vishny, 1989, Managerial entrenchment: The case of manager-
specific investments, Journal of Financial Economics, Vol. 25, pp. 123-140.
Shleifer, A., and R. Vishny, 1997, A survey of corporate governance, Journal of
Finance, Vol. LII No. 2, pp. 737-783.
Smith, C. and R. Watts, 1982, Incentive and tax effects of executive compensation
plans, Australian Journal of Management, Vol. 7, pp. 139-157.
Tricker, R.I., 1994, International Corporate Governance: Texts, readings and cases,
Prentice Hall.

35
Warner, J., Watts, R., and K. Wruck, 1988, Stock prices and top management
changes, Journal of Financial Economics, Vol. 20, pp. 461-492.
Watts, R.L. and J.L. Zimmerman, 1978, Towards a Positive Theory of the
Determination of Accounting Standards, Accounting Review, Vol. 53, No. 1, pp.112-
134
Watts, R.L. and J.L. Zimmerman, 1986, Positive Accounting Theory, Prentice-Hall.
Watts, R.L. and J.L. Zimmerman, 1990, Positive Accounting Theory: A Ten Year
Perspective, Accounting Review, Vol. 65, No. 1, pp. 131-155
Weisbach, M., 1988, Outside directors and CEO turnover, Journal of Financial
Economics, Vol. 20, pp. 431-460.

36
Table 1Performance, ownership and board structure characteristics of sample firms.
Sample contains 938 pre-Cadbury and 1172 post-Cadbury firm years.
25th
percentileMedian(Mean)
75th
percentileSkewness Kurtosis
Performance characteristics
Current year market adjustedstock returns (MadjRet)
-0.19 0.00 (0.04)*
0.22 3.12 28.99
Prior year market adjusted stockreturns (MadjRet1)
-0.18 -0.00(0.05)*
0.213 5.53 71.36
Current year industry adjustedreturn on assets (Rel ROA)
-0.02 0.01(0.01)*
0.03 -2.54 24.82
Prior year industry adjusted returnon assets (RelROA1)
-0.01 0.01(0.01)*
0.04 -5.46 85.69
Unadjusted ROA 0.04 0.07(0.06)*
0.09 -2.32 21.85
Unadjusted lagged ROA (ROA1) 0.04 0.07(0.07)*
0.1 -2.78 27.55
Ownership structurecharacteristics
CEO ownership (%) 0.01 0.09(2.4)
0.87 5.57 38.94
% of equity held by institutionalblockholders (>3% stake)
11.8 21.33(23.81)
33.59 0.78 0.36
Gearing ratio 3.9 16.45(19.33)
29.78 1.95 10.98
Board structure characteristics
CEO/ chairman roles divided 77.27%
Number of non-executives 2 3(3.32)
4 0.80 1.83
Proportion of non-executives 0.29 0.4(0.39)
0.5 -0.33 0.1
Other characteristics
Firm size (BV of total assets in£m)
87.81 211.18(833.05)
666.7 7.68 81.47
Firm size (log of BV of totalassets)
4.48 5.35(5.56)
6.50 0.54 -0.25
CEO tenure 1.92 4.33(5.97)
7.75 2.18 6.07
CEO age 46.5 50.95(51.15)
55.24 0.23 0.05
* T statistic significant at 1% level – we can therefore reject the null hypothesis that mean = 0.

37
Table 2Incidence of top executive departure by time period.
Panel A displays the total proportion of departures; Panel B classifies identified departures. Sampleconsists of 2110 firm years.
Pre-Cadburyn=938
Post-Cadburyn=1172
A. Percentage (number) of firms experiencing top executivedeparture
11.41%(107)
11.77%(138)
B. Percentage (number) of all departures due to:
Dismissal 13.08%(14)
15.94%(22)
Resignation 23.37%(25)
18.12%(25)
Retirement 7.48%(8)
13.04%(18)
CEO gets a new job 1.87%(2)
6.52%(9)
CEO/chairman split 28.97%(31)
23.19%(32)
Death/illness 5.61%(6)
2.9%(4)
Succession 13.08%(14)
13.77%(19)
Unclassified 6.54%(7)
6.52%(9)
Total 100%(107)
100%(138)
C. Percentage (number) of CEO change firms experiencingnon-routine top executive departure
36.44%(39)
34.06%(47)

Table 3Summary Statistics of Firm Characteristics Grouped According to CEO Departure Class and Regulatory Time Period
Pre-Cadbury
Dismissals +Resignations (NRD)
No Departures Other Departures Dismissals +Resignations (NRD)
N=39 N=831 N=68 N=47ROA Mean 0.043 0.074 0.059
Median 0.049 0.073 0.059 0.042Std Dev 0.073 0.048 0.048 0.147
ROA1 Mean 0.04 0.074 0.056 -0.005Median 0.051 0.072 0.058 0.036Std Dev 0.078 0.047 0.042 0.156
RelROA Mean -0.017 0.013 -0.001 -0.059Median -0.015 0.009 0Std Dev 0.067 0.045 0.042 0.149
RelROA1 Mean 0.002 0.014 0.002 0.006Median 0.002 0.013 0 0.001Std Dev 0.04 0.071 0.035 0.065
Madjret Mean -0.202 -0.002 -0.049 -0.299Median -0.198 -0.038 -0.037 -0.205Std Dev 0.375 0.43 0.286 0.328
Madjret1 Mean -0.19 -0.034 -0.053 0.065Median -0.196 -0.048 -0.06 -0.034Std Dev 0.236 0.282 0.216 0.448
Nexecs Mean 3.235 3.276 3.081 3.649Median 3 3 3Std Dev 2.389 1.977 1.602 1.874
Propnex Mean 33.97% 37.04% 34.31% 40.77%Median 32.29% 37.5% 34.52% 42.86%Std Dev 0.164 0.168 0.132 0.151
Propinst Mean 25.69% 24.21% 23.22% 28.42%Median 20.51% 22.1% 19.98% 29.18%Std Dev 15.369 14.713 12.647 16.338

Lev Mean 20.72% 18.891% 22.804% 25.703%Median 16.12% 15.653% 19.67% 22.347%Std Dev 18.904 17.274 16.844 20.443
CEOOwn Mean 0.47% 2.48% 2.08% 0.84%Median 0.04% 0.1% 0.04% 0.05%Std Dev 1.091 7.557 3.946 1.464
Split Mean 84.62% 71.66% 47.06% 86.96%OwnDum Mean 23.08% 47.05% 27.94% 17.02%OwnDum2 Mean 30.77% 59.69% 38.24% 19.15%Tenure (years) Mean 4.428 5.883 8.135 4.032
Median 2.878 4.082 5.504 3.125Std Dev 4.45 6.136 8.869 3.273
Age (years) Mean 50.691 50.466 56.005 49.388Median 52.227 50 56.452 50.163Std Dev 5.527 6.682 6.844 5.468
Log Assets Mean 5.895 5.563 5.982 5.737Median 5.82 5.264 5.812 5.382Std Dev 1.374 1.359 1.25 1.402
ROA = earnings before interest and tax, divided by the book value of assetsROA1 = previous year ROARelROA = firm ROA minus the ROA of the median firm in the same 2 digit SIC class for that yearRelROA1 = previous year RelROAMadjRet = firm’s annual stock return, to the accounting year end, minus the return on the FT All Share Index for the same periodMadjRet1 = previous year MadjRetSplit = a dummy variable coded 1 if the firm divides the roles of CEO and chairman of the boardNexecs = the number of non-executive directors on the boardPropnex = the number of non-executive directors divided by the total number of directors on the boardPropinst = the sum of all stakes of at least 3% held by institutional investorsLev = the firm’s total debt, divided by total debt plus equityCEOOwn = the number of shares held by the CEO, divided by the number of shares in issueTenure = the length of time, in years, the CEO has held his position at the top of the firmAge = the CEO’s age, in years, as at the accounting year endLog Assets = the natural log of the total book value of the firm’s asssets, as at the year end.

40
Table 4Non-routine departure rates for sample firms partitioned by whether departure occurs pre- or post-
Cadbury and divided into deciles by stock market performance. Numbers in parentheses are absolutenumbers of non-routine CEO departures for all firms in that decile and time period.
Decile Pre-Cadbury non-routine
CEO departure ratePerformance
measure = MadjRetn=938
Post-Cadbury non-routine
CEO departure ratePerformance
measure = MadRetn=1172
Pre-Cadbury non-routine
CEO departure ratePerformance
measure = MadjRet1n=938
Post-Cadbury non-routine
CEO departure ratePerformance
measure = MadRet1n=1172
1 9.67% (9) 15.38% (18) 9.68% (9) 3.42% (4)2 6.38% (6) 5.17% (6) 10.64% (10) 6.84% (8)3 8.51% (8) 6.78% (8) 3.19% (3) 5.13% (6)4 3.23% (3) 4.27% (5) 1.08% (1) 5.13% (6)5 2.15% (2) 4.27% (5) 6.45% (6) 4.24% (5)6 2.15% (2) 1.0% (1) 3.16% (3) 4.24% (5)7 3.19% (3) 1.7% (2) 3.19% (3) 1.71% (2)8 2.13% (2) 1.7% (2) 1.06% (1) 1.71% (2)9 2.13% (2) 0 (0) 2.15% (2) 1.71% (2)10 2.13% (2) 0 (0) 1.05% (1) 5.93% (7)
Totals 4.16% (39) 4.01% (47) 4.16% (39) 4.01% (47)
MadjRet is the firm’s market adusted stock return for the last full accounting year that the CEO heldoffice.MadjRet1 is the one year lag of MadjRet.Decile 1 contains the worst performing firms; decile 10 the best.
41
Table 5CEO Tenure by Firm Control Type
Control types are based on classifications used by Salancik and Pfeffer (1980). Sample is 1685 AllShare firms for which tenure data is available
Control Type Time period Number offirms
Mean Tenure(years)
MedianTenure (years)
Owner managed – manager owns at least4% of equity
Pre-CadPost-Cad
5967
12.2311.19
11.69
Externally controlled – at least 4% of equityis held by institutional blockholders
Pre-CadPost-Cad
418768
6.15.84
4.424.51
Management controlled – neither the CEOnor any institution owns 4% of stock
Pre-CadPost-Cad
252204
5.035.77
3.514.17
Table 6CEO Departure Rates by Levels of CEO Ownership
Ownership levels are based on classifications used in Dahya et al (1998)Sample is 2110 All Share firms
CEO ownership < 1% CEO ownership 1%-5%
CEO ownership >5% CEO ownership>10%
Pre-Cadn=766
Post-Cadn=1014
Pre-Cadn=99
Post-Cadn=87
Pre-Cadn=73
Post-Cadn=71
Pre-Cadn=43
Post-Cadn=46
Total departurerate
12.27% 11.54% 7.07% 14.94%* 8.22% 11.27% 6.98% 8.7%
Forced departurerate
4.83% 4.14% 2.02% 4.6% 0 1.41% 0 0
* indicates that the rates of departure between pre- and post-Cadbury sub-samples are different at 10%level of significance (chi-squared tests)

42
Table 7Tests of the association between non-routine top executive departure (NRD) and firm performance
(P-value of Wald chi-squared statistic in parentheses)
Model 1a: ln{P(NRD)/1-P(NRD)} = a + b.Madjret + c.Madjret1Model 1b: ln{P(NRD)/1-P(NRD)} = a + b.Madjret + c.Madjret*PostCad + d.Madjret1 +
f.Madjret1*PostCad + g.PostCadModel 2a: ln{P(NRD)/1-P(NRD)} = a + b.ROA + c.ROA1Model 2b: ln{P(NRD)/1-P(NRD)} = a + b.ROA + c.ROA*PostCad + d.ROA1 + f.ROA1*PostCad +
g.PostCadModel 3a ln{P(NRD)/1-P(NRD)} = a + b.RelROA + c.RelROA1Model 3b ln{P(NRD)/1-P(NRD)} a + b.RelROA + c.RelROA*PostCad + d.RelROA1 +
f.RelROA1*PostCad + g.PostCad
Variable Model 1a Model 1b Model 2a Model 2b Model 3a Model 3b
Intercept -3.4454(0.0001)
-3.5758(0.0001)
-2.8749(0.0001)
-2.4198(0.0001)
-3.25(0.0001)
-3.1231(0.0001)
Madjret -2.6144(0.0001)
-1.6132(0.0023)
Madjret*PostCad -1.8795(0.0099)
Madjret1 -0.4381(0.1717)
-2.3011(0.0006)
MadjRet1*PostCad 2.3333(0.0012)
ROA -0.9240(0.8015)
-3.6706(0.4692)
ROA*PostCad 3.7342(0.6049)
ROA1 -4.8140(0.1657)
-8.6465(0.0964)
ROA1*PostCad 3.5316(0.6171)
RelROA -6.8907(0.0001)
-12.6398(0.0008)
RelROA*PostCad 6.0239(0.1304)
RelROA1 3.6632(0.1259)
1.4922(0.7552)
RelROA1*PostCad 3.3696(0.545)
PostCad 0.0097(0.9746)
-0.5562(0.0356)
-0.2139(0.4251)
p-value of -2 Log LScore
0.0001 0.0001 0.0001 0.0001 0.0001 0.0001
% Correctly Classified 72.9% 75.2% 64.3% 64.4% 61.9% 63.9%
Number of NRD firms 86 86 86 86 73 73Number of non-NRDfirms
2024 2024 2024 2024 1679 1697

43
Table 8Tests of the association between non-routine top executive departure (CEO tenure), firm performance
and ownership structure(P-value of Wald Chi-square statistic in parentheses)
Model1a:
ln{P(NRD)/1-P(NRD)} = a + b.RelROA + c.RelROA1+ d.Propinst + f.Lev + g.OwnDum2
Model1b:
ln{P(NRD)/1-P(NRD)} = a + b.RelROA + c.RelROA1 + d.Propinst + f.Propinst*PostCad + g.Lev+ h.Lev*PostCad + i.OwnDum2 + j.OwnDum2*PostCad + k.PostCad
Model2a:
ln{P(NRD)/1-P(NRD)} = a + b.RelROA + c.RelROA1+ d.Propnex + f.Split
Model2b:
ln{P(NRD)/1-P(NRD)} = a + b.RelROA + c.RelROA1 + d.Propnex+ f.Propnex*PostCad + g.Split+ h.Split*PostCad + i.PostCad
Variable Model 1a Model 1b Model 2a Model 2b
Intercept -3.4127(0.0001)
-3.2763(0.0001)
-3.5216(0.0001)
-3.6741(0.0001)
RelROA -6.7646(0.0001)
-7.0352(0.0001)
-7.0637(0.0001)
-7.4752(0.0001)
RelROA1 4.3445(0.1269)
4.4057(0.1253)
2.9502(0.2639)
3.0601(0.2568)
Propinst 0.0203(0.0185)
0.0124(0.4013)
Propinst*PostCad 0.0119(0.5107)
Lev 0.0055(0.4498)
0.0110(0.3817)
Lev*PostCad -0.0084(0.5823)
OwnDum2 -1.1583(0.0001)
-0.9974(0.0362)
OwnDum2*PostCad -0.2749(0.6586)
Propnex -0.5693(0.5168)
-0.7980(0.5317)
Propnex*PostCad 0.7308(0.6776)
Split 0.5078(0.1967)
1.0776(0.0870)
Split*PostCad -0.9745(0.2267)
PostCad -0.2192(0.7585)
0.1423(0.8808)
p-value of -2 Log LScore/ F-statistic
0.0001 0.0001 0.0001 0.0001
% Correctly Classified 70.2% 70.3% 64.6% 64.9%
Number of NRD firms 58 58 58 58Number of non-NRDfirms
1361 1361 1469 1469
n 1419 1419 1527 1527