top executive turnover in japanese non-listed firms...
TRANSCRIPT

1
Top Executive Turnover in Japanese Non-listed Firms:
Causes and Consequences1
Iichiro Uesugi2 Yukiko Saito3
3/14/2009
Abstract
We examine the pattern of top executive turnover among small non-listed businesses in Japan
using a unique panel data set of about 25,000 firms for 2001-2007 and find the following. First,
the likelihood of a change in top executive among non-listed firms is independent of their
ex-ante performance, especially when the firms are owned by the top executives themselves or
by their relatives. Second, non-listed firms which experienced a top executive turnover saw an
improvement in ex-post performance relative to firms without turnover. The extent of the
improvement is similar between non-listed firms and listed firms. All of the above results
indicate that underperforming non-listed firms do not face disciplinary pressure to replace their
executive, but that once new top executives are in place, they exert high managerial effort and
thus significantly improve their firm’s profitability.
1 Excellent research assistance was provided by Yugo Shinozuka. We are also grateful for the permission to use the firm-level database maintained by the Research Institute of Economy, Trade and Industry (RIETI). 2 Institute of Economic Research, Hitotsubashi University; Email: [email protected] 3 Institute of Economic Research, Hitotsubashi University and Fujitsu Research Institute

2
1. Introduction
One of the worrying trends for Japan’s economy is that, for many years now, the number of
firms exiting the market has been considerably greater than the number of firms entering. As a
result, the total number of firms in Japan has dropped sharply in the past two decades: from 5.35
million in 1986 to 4.21 million in 2006. Most of the decline can be attributed to the small and
medium enterprise (SME) sector, where the number of firms has declined from 5.33 million in
1986 to 4.20 million in 2006.
One of the primary reasons for the shrinking population of SMEs is thought to be
difficulties in attaining a smooth transition in management or a smooth transfer of the business
from aging managers to their successors. The Small and Medium Enterprise Agency (2006)
estimated that a quarter of all firm exits are explained by the failure to find a new top executive.
In order to slow down the decline in the firm population, policy responses by the government
have included a reduction in the inheritance tax for stocks held by owner-managers. This policy
is designed to facilitate the process of top executive turnover among small businesses.
An important question in this context, however, is whether present patterns of top
executive turnover in Japan’s SME sector are efficient. If poor performance is not punished by
the replacement of firms’ top management or if the profitability of firms with new top
executives does not improve, the government’s policies to promote smooth managerial
transition may be misguided. Against this background, the purpose of this paper is to examine
the determinants of top executive turnovers and their effectiveness in improving the ex-post
performance of firms, focusing on small businesses in Japan. Many of the previous studies on
the determinants of top executive turnover, including Kaplan and Minton (1994), Kang and
Shivdasani (1995), and Denis, Denis, and Sarin (1997), find that underperforming firms are
more likely to replace their top executives than well-performing firms. They also find that
ownership structures affect the turnover sensitivity to firm performance. However, the focus of
these studies is limited to large listed firms and does not cover small businesses. Another strand
of literature, which includes Huson, Malatesta, and Parrino (2004), Bennendsen el al. (2007),
and Perez-Gonzalez (2006), focuses on the ex-post performance of firms that experienced
managerial turnovers. However, their analyses are again either limited to large public firms
(Huson et al. (2004)) or to a comparison between types of management turnover rather than a
comparison between firms that experienced management turnover and those that did not
(Bennendsen et al. (2007) and Perez-Gonzalez (2006)).
Our study therefore represents the first attempt to comprehensively examine the causes
and consequences of managerial turnover among small privately-held business and compare the
results with those for large public firms. Top executive turnovers among small non-listed firms
are expected to be quite different from those among large listed firms in the way turnovers are

3
determined and the way they affect firms’ performance. First, most small non-listed firms are
run by owner-managers, while only a small minority of large listed firms are owned by their
managers. When there is an effective external control threat by outside shareholders, this threat
is likely to raise the probability that poorly performing top executives are replaced by other,
more competent executives. However, managerial ownership reduces the relative importance of
outside shareholders, insulates firms from such external controls, and eventually allows
inefficient incumbent executives to stay in the firm. Managerial ownership may also result in
insufficient performance improvements since it constrains the choice of succeeding managers to
a limited pool of managerial talent.
Second, the shares of small privately-held firms are illiquid since they are not listed on
the stock market and some of the external control mechanisms which require frequent market
transactions are not applicable. For example, non-listed firms rarely face a threat of takeover
which might lead directors to take disciplinary action, including the replacement of managers.
Note, however, that certain other control mechanisms are still effective for non-listed firms,
such as controls by the banks that extend loans to such firms. As suggested by Diamond (1984)
in his theoretical model, banks are able to engage in monitoring activities as a delegated monitor
and exert external controls over borrowing firms, including the replacement of incumbent
managers.
Employing a unique panel data set of about 25,000 small non-listed firms for
2001-2007 as well as a panel data set of about 2,200 large listed firms for the same period, this
paper provides two strands of analysis. First, we examine the determinants of top executive
turnover, including firm characteristics, executive characteristics, managerial ownership, and
bank-firm relationships. Second, we examine the ex-post performance of firms that experienced
top executive turnover in comparison with that of firms that did not experience such turnover.
We compare these two groups of firms using a matching estimation method.
We find that the likelihood of a change in top executives among non-listed firms is
independent of their ex-ante performance, especially in the case of firms that are owned by top
executives themselves or by their relatives. This contrasts with the finding that the management
turnover likelihood among listed firms is negatively associated with their performance. We also
find that non-listed firms that experienced a top executive turnover subsequently performed
better than firms with no turnover. Moreover, the extent of performance improvements
following managerial replacements is similar for small non-listed firms and large listed firms.
All of the above indicate that non-listed firms, most of which are operated by owner-managers,
do not experience disciplinary executive turnovers when they underperform. This is in sharp
contrast with listed firms, which face a significant increase in the likelihood of management
replacement when they underperform. However, once new top executives assume the

4
presidency of these non-listed firms, they exert high managerial effort and, as in the case of their
listed counterpart, improve the firm’s performance.
The paper proceeds as follows. Section 2 summarizes the previous literature and
presents the empirical hypotheses. Section 3 then describes the data and the empirical approach
used for the analysis, while Section 4 presents the empirical results. Section 5 concludes.
2. Empirical Hypotheses
Regarding the literature on top executive turnovers, one strand of research examines the
determinants of these turnovers. Previous studies focus on disciplinary events such as a
downturn of firms’ business and examine if the probability of executive turnover is higher
among underperforming firms. Many previous studies, concentrating on a variety of countries
including the United States, Germany, and Japan, point to a significant association between poor
performance and a higher incidence of management replacements.4 The pioneering studies on
Japanese firms are Kaplan and Minton (1994) and Kang and Shivdasani (1995). Analyzing the
likelihood of outside board member appointments, Kaplan and Minton found that outside
members previously employed by banks or other, non-financial firms are more frequently
appointed as board members when the firm’s stock performance is poor. They also found that
these appointments subsequently increase the turnover of top executives within the firm.
Meanwhile, Kang and Shivdasani examined the relationship between top executive turnover and
firm performance and found that the likelihood of turnover is significantly related to
industry-adjusted returns on assets, excess stock returns, and negative operating income.
Unfortunately, not only in the case of studies on Japan but also those on other
countries, the scope of the analysis of the determinants of executive turnover is limited to large
listed firms and small non-listed enterprises are not included. From the disciplinary point of
view, small privately-held enterprises differ from large listed firms in two ways. First, most
small non-listed firms are operated by owner-managers, while only a small minority of large
listed firms are run by the owner-mangers. On the one hand, managerial ownership has a
positive aspect in that it increases the power of top executives with sizable voting power and
better aligns the interests of the two different groups of top managers and shareholders. Since
agency problems are alleviated by managerial ownership, this is likely to increase the value of
the firm. On the other hand, managerial equity ownership has negative implications for external
control over the firm. Firms with owner-managers are insulated from external controls and thus
can retain underperforming incumbent executives. Second, private firms whose shares are not
traded on the stock market are less likely to face the threat of takeovers posed by external
4 For studies on the United States and Germany, see Denis, Denis, and Sarin (1997) and Kaplan (1994), respectively.

5
controls than public firms. Shares issued by private firms are illiquid and some of the means to
gain external control of a firm including takeover bids are difficult to exercise. Therefore,
private firms are less likely to be pressured into replacing their management even when they
underperform. In sum, for small non-listed firms, which are in most cases managed by their
owners, we arrive at the following hypothesis on top executive turnover.
Hypothesis 1: Top executive turnover for small non-listed firms is less sensitive to their
performance than for large publicly listed firms.
A related empirical hypothesis regarding the determinants of executive turnover
concerns the effect of firms’ governance mechanism. Denis, Denis, and Sarin (1997) report that
the probability of top executive turnover is inversely related to the ownership stake of officers
and directors. What Denis, Denis and Sarin found for large listed firms in the United States may
also apply to non-listed firms with outside managers. Along a similar vein, Kang and Shivdasani,
focusing on the role of large shareholders and banks, found that the sensitivity of turnovers to
firms’ performance is higher for firms with ties to main banks than those without such ties. In
addition, they found that successors are more likely to come from outside the firm when firms
have large shareholders and a main bank relationships. The role played by banks and corporate
shareholders is also emphasized by Kaplan and Minton (1994), who show that underperforming
firms are more likely to appoint outside board members from banks and non-financial
corporations. What all these studies suggest is that outside shareholders, especially large ones,
and main banks provide external control mechanisms for the governance of firms. Thus, these
studies suggest the following hypothesis regarding the role of outside shareholders and main
banks.
Hypothesis 2: A separation of ownership and management as well as close bank-firm
relationships increase the sensitivity of top executive turnover to firm performance.
Another strand of literature, including Huson, Malatesta and Parrino (2004), mostly concentrate
on publicly listed firms and concerns their performance after managerial turnovers. They
examine the relationship between CEO turnover and firms’ financial performance and contrast
two hypotheses regarding firms’ ex-post performance: the improved management hypothesis
and the “scapegoat” hypothesis. The former states that management turnovers are likely to
improve managerial quality and therefore ex-post performance. In contrast, the latter holds that
firm performance has little to do with managerial quality and that managerial turnovers make no
difference in ex-post firm performance. Comparing turnover and non-turnover firms, Huson,

6
Malatesta, and Parrino find a greater subsequent improvement in performance for turnover than
for non-turnover firms and infer that the turnover improved managerial quality and this in turn
positively contributed to firm performance. However, we should note that there may be
differences in terms of the pool of available managerial talent between large listed firms and
small non-listed businesses. Partly due to their small size, and partly due to the implicit
constraint that succeeding executives must come from the family of the owner, non-listed firms
may be limited in the extent to which they can improve the quality of their management
following executive turnover. 5 Based on the above discussion, we posit the following
hypothesis.
Hypothesis 3: The ex-post performance of small non-listed firms experiencing management
turnover improves relative to that of firms experiencing no such turnover. However, the extent
of improvement is less sizable among small non-listed firms than among large public firms.
3. Data Set and Empirical Approach
3.1 Data
We construct a firm-level panel data set to analyze the determinants of top executive turnover
and the ex-post performance of firms that experienced executive turnover. Our data set consists
of firms that responded to the Surveys of the Financial Environment (SFE) implemented by the
Small and Medium Enterprise Agency (SMEA) of Japan in 2001-2003. For each SFE, a
representative sample of 15,000 firms was randomly selected and sent questionnaires. The
number of responding firms for each of the years was 7,656, 8,446, and 8,040, respectively. For
each of these firms, we then added data from the Financial Information Database (FID) which
covers the years 2001-2007 and is collated by Tokyo Shoko Research, Inc., a commercial credit
research firm. The FID contains the balance sheet and income statements of firms as well as
information on other firm characteristics. These include the name and age of the representative
of a firm, the year/month that he/she assumed the presidency, the names of major stockholders,
the names of the banks each firm transacted with, and whether the firm is listed or not.
For our analysis, we need information for at least three periods in order to examine the
determinants of top executive turnover and the effect of turnovers on firms’ ex-post performance.
That is, we need to know whether the top executive of a firm changed between year t-1 and t
and the development of the firm’s performance between year t and t+1. In practice, in order to
measure firms’ ex-post performance, it may be preferable to use more data points than t+1, and
we actually have data for t+2 and t+3 for the analysis. Using this information, we estimate a
5 This argument is based on Bennendsen et al. (2007).

7
probit model that takes account of the various factors that are likely to affect whether firms
replace their top executive. Further, using the data for year t and t+i, where i=1, 2, 3, we
measure the effect of top executive turnover on firms’ ex-post performance by observing the
difference between firms that experienced executive turnover and those that did not.
Using seven years of data, we construct three panel data sets for the years 2001-2005,
2002-2006, and 2003-2007. We then concatenate these three data sets into one panel data set.
The initial year of each panel data set is labeled year t-1, the second year is year t, and the final
year is year t+3. We add dummies representing the initial year in order to distinguish these three
panel data sets with different starting years. For our analysis, we exclude the following
observations from our data set. First, observations where any of the variables calculated as
ratios in the analysis (described in the next subsection) fall into either the upper or lower 1
percentile of the total distribution were omitted from the sample. Next, based on the information
on each firm’s listing status in 2004, the data set is divided into two: a data set consisting of
non-listed, privately-held firms and a data set consisting of listed firms. Note that our main
focus is on the non-listed firms and the information on listed firms is mainly used for
comparison with non-listed firms.
After screening our data as aforementioned, we are left with 25,290 observations of
private firms and 2,198 observations of publicly listed firms. Among them, 1,526 and 284 firms
respectively experienced a top executive turnover in the years 2002-2004. This implies that the
top executive of the rest of the firms was unchanged. Note here that turnover rates differ
significantly depending on whether firms are run by owner-managers or not. The turnover rate is
high in the case of firms managed by outside top executives, while it is low in the case of firms
run by owner-managers.
(Insert Table 1)
Table 1 shows the numbers of turnovers and the corresponding turnover rates for our
data set. For the sample of non-listed firms, the turnover rate within one year is 6.0 percent,
while for the sample of listed firms it is 12.9 percent. Furthermore, the most significant
difference in terms of turnover rates can be found between firms run by outside executives and
those run by owner-managers: Using a dummy variable to proxy managerial ownership of a
firm that takes a value of one if the last name of the firm’s top executive matches at least one of
the last names of major shareholders and zero otherwise, we find that for firms with managerial
ownership, the turnover rate is 3.5 percent, while in the case of firms run by outside managers,
the figure becomes much higher, 17.7 percent.

8
3.2 Variables
(Insert Table 2)
This section presents a detailed description of the variables used in the analysis. Definitions are
provided in Table 2. First, in order to distinguish whether a firm replaces its top executive or not
in a year, we use a binary variable labeled TURNOVER. Turning to explanatory variables, the
first category measures firms’ performance and includes the return on assets (ROA) and the
capital ratio (CAP). The second category also measures firms’ performance, but focuses on
whether a firm is in financial distress. Variables in this category are a dummy for a default
(DEFAULT), a dummy for a negative ROA (ROA_NG), meaning that the firm is in deficit, a
dummy for interest coverage being less than or equal to unity (ICOVER_SM), meaning that the
operating profit is insufficient to cover interest expenses, and a dummy for a negative capital
ratio (CAP_NG), that is, the firm has negative net worth. The third category measures the credit
availability for a firm using the ratio of long-term loans (LONG) and short-term loans (SHORT)
to the total asset amount. In addition, to measure firms’ liquidity, the ratio of cash and deposits
to the total asset amount (CASH) is used. Further, the ratio of interest payments to the total loan
amount outstanding (RATE) is used, with a higher ratio indicating that credit is more limited.
Note, however, that these variables are also affected by the demand for credit and do not
necessarily represent the availability of funds. The fourth category consists of variables that
control for firm age (FIRMAGE), firm size (LnEMP), and the demand for funds for capital
investment (FIXED). Note that the variable LnEMP is also a proxy for the size of the human
resources pool from which incumbent executives choose their successors. The fifth category is
made up of variables representing the characteristics of top executives in terms of their age
(AGE) and tenure (TENURE), i.e., the number of years they have served in their current
managerial position. The final category of variables measures the extent of external control of a
firm. As a proxy for managerial ownership, a binary variable representing whether a family
member of the top executive is a major shareholder (OWNERSHIP) is used. Managerial
ownership is expected to reduce the external pressure on the incumbent management. In
addition, to consider another potential source of external control, namely financial institutions, a
variable indicating whether the bank listed first by a firm in the FID is also a major shareholder
(MAINBANK). 6 Most of the firms in the sample have established lending relationships with
banks. However, a certain number of firms in the sample receive not only loans but also equity
from these banks, suggesting a certain degree of outside control.
6 The variable is similar to the one employed in Kang and Shivdasani (1995) to measure the degree of bank monitoring.

9
3.3 Empirical Approach
Using the data set just described, we proceed to examine the three hypotheses stated in Section
2. Note, however, that a simple comparison of the ex-post performance of firms that
experienced a top executive turnover and those that did not is inappropriate because of possible
selection bias. For example, if firms with an executive turnover are riskier than those without,
then a simple comparison of the ex-post performance between these two groups confounds
ex-ante riskiness and ex-post riskiness (changes in borrowers’ riskiness after the top executive
turnover). To circumvent this problem, we need to control for any possible selection bias in our
estimation. To do so, we employ a matching estimation approach. The procedure is as follows:
(i) We implement a probit estimation that models the probability of top executive turnover in
year t conditional on covariates observed in year t-1. Firms that experience turnover
( 1tTURNOVER ) are labeled treatment observations. We then attach a propensity score to each
observation. The propensity score e is defined as
11 1Pr ttt XTURNOVERXe , (1)
where 1tX is a vector of covariates in the probit estimation. We focus on privately-held firms
and implement baseline estimations. We also implement another set of estimations for public
firms, which we call reference estimations.
(ii) Next, we implement another set of probit estimations including cross terms multiplied by the
variables measuring the extent of external control of a firm, MAINBANK and OWNERSHIP. We
implement estimations not only for non-listed firms but also for public firms. Estimations of (i)
and (ii) are used to examine Hypotheses 1 and 2.
(iii) For each treatment observation, we identify matched observations from the sample of firms
without turnover. The matched observations are those that have the “closest” propensity scores
to a particular treatment observation and are labeled control observations. These matched
observations are chosen from the same calendar year as the treatment observation. It should also
be noted that we use a non-treated observation more than once as a control, that is, a
non-treatment observation may be used as a control for one treatment observation and as a
control for another treatment observation at the same time. There are several matching
algorithms to find the “closest” control observations. As a base-line for our analysis, we employ
10
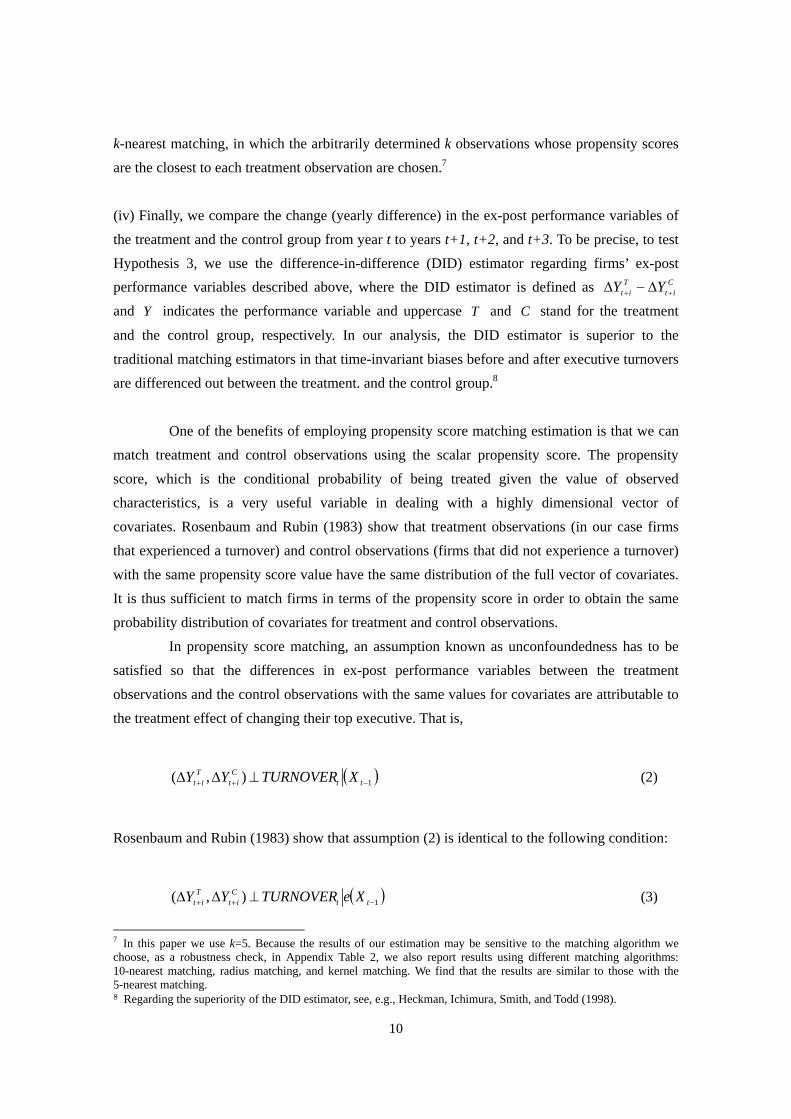
k-nearest matching, in which the arbitrarily determined k observations whose propensity scores
are the closest to each treatment observation are chosen.7
(iv) Finally, we compare the change (yearly difference) in the ex-post performance variables of
the treatment and the control group from year t to years t+1, t+2, and t+3. To be precise, to test
Hypothesis 3, we use the difference-in-difference (DID) estimator regarding firms’ ex-post
performance variables described above, where the DID estimator is defined as Cit
Tit YY
and Y indicates the performance variable and uppercase T and C stand for the treatment
and the control group, respectively. In our analysis, the DID estimator is superior to the
traditional matching estimators in that time-invariant biases before and after executive turnovers
are differenced out between the treatment. and the control group.8
One of the benefits of employing propensity score matching estimation is that we can
match treatment and control observations using the scalar propensity score. The propensity
score, which is the conditional probability of being treated given the value of observed
characteristics, is a very useful variable in dealing with a highly dimensional vector of
covariates. Rosenbaum and Rubin (1983) show that treatment observations (in our case firms
that experienced a turnover) and control observations (firms that did not experience a turnover)
with the same propensity score value have the same distribution of the full vector of covariates.
It is thus sufficient to match firms in terms of the propensity score in order to obtain the same
probability distribution of covariates for treatment and control observations.
In propensity score matching, an assumption known as unconfoundedness has to be
satisfied so that the differences in ex-post performance variables between the treatment
observations and the control observations with the same values for covariates are attributable to
the treatment effect of changing their top executive. That is,
1),( ttC
itT
it XTURNOVERYY (2)
Rosenbaum and Rubin (1983) show that assumption (2) is identical to the following condition:
1),( ttC
itT
it XeTURNOVERYY (3)
7 In this paper we use k=5. Because the results of our estimation may be sensitive to the matching algorithm we choose, as a robustness check, in Appendix Table 2, we also report results using different matching algorithms: 10-nearest matching, radius matching, and kernel matching. We find that the results are similar to those with the 5-nearest matching. 8 Regarding the superiority of the DID estimator, see, e.g., Heckman, Ichimura, Smith, and Todd (1998).

11
Although there is no direct test for unconfoundedness, this assumption indicates the need to
control for all relevant variables 1tX that influence treatment assignments and ex-post
performance variables. We believe that our data is rich enough to include the necessary
covariates. Furthermore, the DID matching estimator that we use allows for the existence of
differences in time-invariant unobservable characteristics between the treatment and the control
group.
In addition to unconfoundedness, the following balancing condition of pretreatment
variables given the propensity score must be satisfied (Becker and Ichino (2002)).
11 ttt XeXTURNOVER (4)
In other words, for a given propensity score, treatment observations are randomly chosen, and
therefore, the treatment sample and the non-treated sample are on average identical.
In order to verify that (4) holds, we implement the following testing procedure after
the first step of the matching observation: (i) based on the estimated probit model, we split the
sample such that the average propensity scores of the treated and non-treated groups do not
differ, and (ii) within all intervals, test that the means of every element of 1tX do not differ
significantly between treated and non-treated observations. If there are no statistically
significant differences between the two, then we can proceed to estimate the treatment effect in
the second step with some confidence. In our estimation for the treatment effects to be presented
in the next section, we satisfy this balancing condition.
4. Results
4.1 Determinants of Top Executive Turnovers
We start with the baseline probit estimation. Table 3 lists the means of the variables we use in
this estimation.
(Insert Table 3)
In the probit estimation we obtain conditional probabilities of a firm changing its top executive
in year t given the values of observed firm performance, financial distress, credit availability,
and other firm characteristics in year t-1. The dependent binary variable represents a turnover of
the top executive in year t ( tTURNOVER ). The following explanatory variables are used. First,

12
regarding firm performance, the return on total assets ( 1tROA ) to measure firms’ annual profits
and the capital-asset ratio ( 1tCAP ) to measure firms’ net worth are employed. Given the
possibility that managerial turnovers may occur more frequently in times of financial distress,
we use one dummy variable indicating whether the capital ratio is negative ( 1_ tNGCAP ). The
next set of explanatory variables focuses on firms’ credit availability conditions. We include the
long-term borrowing ratio ( 1tLONG ), the short-term borrowing ratio ( 1tSHORT ), liquidity as
measured by the cash and deposit to asset ratio ( 1tCASH ), and the interest payment rate
( 1tRATE ). In addition, we use variables on other firm characteristics, including firm age
( 1tFIRMAGE ), firm size expressed in terms of the log of the number of employees ( 1tLnEMP ),
and the ratio of fixed tangible assets to total assets ( 1tFIXED ). We also employ variables on the
characteristics of top executives, including the age of the top executive ( 1tAGE ) and his/her
years of tenure ( 1tTENURE ). Finally, we include the proxy for the managerial ownership
( 1tOWNERSHIP ) and the main bank relationship ( 1tMAINBANK ).
(Insert Table 4)
The baseline probit estimation results on top executive turnovers are presented in
Table 4. In the estimation for non-listed firms, there are several significant coefficients. First,
the performance variables 1tROA and 1tCAP are negative and weakly significant. This
indicates that badly performing firms are more likely to change their top executive than
well-performing firms. Next, one of the variables indicating credit availability conditions,
1tLONG , is negative and significant, which indicates that financially constrained firms facing a
limited availability of long-term loans are more likely to change their top executive.
1tLnEMP has a positive and significant coefficient indicating that larger firms with abundant
human resources and hence a larger pool of potential successors to the top executive tend to
replace their executive more frequently than other firms. The age of the outgoing top executive
( 1tAGE ) and his/her years of tenure ( 1tTENURE ) are positive and significant, indicating that
older top executives who have been president for many years are more likely to be replaced.
Finally, the sign on 1tOWNERSHIP is negative and significant, while that on 1tMAINBANK
is positive but insignificant.
In order to compare non-listed private firms with publicly listed firms, we also
conducted a reference estimation results for publicly listed firms and the results are shown in the
right-hand column of Table 4. As can be seen, there are only a few variables with significant
coefficients, including 1tROA , 1tAGE , and 1tOWNERSHIP . The coefficient on 1tROA is
significantly negative and its marginal effect on the turnover probability is more sizable than in
the case of non-listed firms. For 1tAGE and 1tOWNERSHIP , the signs of the coefficients are

13
the same as those for non-listed firms.
Regarding Hypothesis 1, which suggests that executive turnover in small firms is less
sensitive to firm performance, the results thus far are rather mixed. On the one hand, and in line
with the hypothesis, the turnover probability is less sensitive to firm profitability ( 1tROA )
among non-listed private firms than among publicly listed firms; on the other hand, though, it is
more sensitive to firms’ net worth ( 1tCAP ) among non-listed than among listed firms. Further,
we have not yet closely examined Hypothesis 2, which predicts that the variables
1tOWNERSHIP and 1tMAINBANK affect the sensitivity of managerial turnover to firm
performance. Hence, we will examine these two hypotheses with a more detailed specification.
(Insert Table 5)
In the next probit estimation, we introduce cross terms in which each of the
explanatory variables representing firm performance are multiplied by 1tOWNERSHIP in order
to examine if their parameters are significantly affected by firms’ managerial ownership. Note
that we first focus on 1tOWNERSHIP and its cross terms only rather than focusing on both
1tOWNERSHIP and 1tMAINBANK and their respective cross terms, since 1tMAINBANK is
insignificant in the previous estimation and we do not expect to obtain meaningful statistical
inferences from the estimation by including 1tMAINBANK as an explanatory variable. The
estimation results for non-listed and listed firms are shown in the left- and right-hand columns
of Table 5, respectively. There are important differences between Tables 4 and 5 in terms of the
results for the performance variables for non-listed firm. 1tROA becomes insignificant in Table
5, while it was negative and significant in Table 4, implying that a decrease in profits has no
significant impact on the probability of top executive turnover. Moreover, in Table 5, the sign of
the coefficient on 1tCAP becomes significantly negative, while that of the coefficient on
11 * tt OWNERSHIPCAP is significantly positive. This indicates that a lower capital ratio
increases the likelihood of management turnover among firms without managerial ownership,
while it does not have a significant impact on the likelihood of management turnover among
firms with managerial ownership. In contrast, the introduction of the cross terms does not
significantly affect the estimation results for listed firms. As in Table 4, we observe a negative
and significant coefficient on 1tROA in Table 5, indicating that the top executive turnover
likelihood increases among underperforming listed firms. Hence, by introducing additional
explanatory variables, we find a significant difference between non-listed firms and listed firms
in terms of the response to the firm’s performance, which is consistent with Hypothesis 1. We
also find that the separation of ownership and management in non-listed firms increases the
sensitivity of top executive turnover to firms’ net worth, which is consistent with Hypothesis 2.

14
Regarding the examination of another part of Hypothesis 2, that is, the role of
bank-firm relationships, we find no significant changes in the turnover sensitivity to firm
performance. We introduce another probit estimation that includes both 1tOWNERSHIP and
1tMAINBANK as well as their respective cross terms with performance variables. The results
are shown in Table 6 and are qualitatively similar to those in Table 5 in that all the newly
introduced variables, that is, 1tMAINBANK and its cross terms, are statistically insignificant.
Thus, we fail to find evidence suggesting that bank-firm relationships play a role in affecting the
sensitivity of top executive turnover to firm performance as Hypothesis 2 predicts.
(Insert Table 6)
On balance, regarding the relationship between performance and top executive
turnover among non-listed firms, disciplinary pressure seems to be weaker among non-listed
firms than listed firms. Furthermore, for non-listed firms with managerial ownership, the
disciplinary pressure becomes even weaker. The only exception is when firms run by outside
managers observe a decrease in their net worth. In this case, firms tend to replace their top
executive more frequently than firms that does not experience a decrease in net worth. These
results contrast with the results for the listed firms in which managerial turnovers are always
significantly associated with firms’ poor performance. Hence, in general, we can say that the
results of our empirical analysis support Hypotheses 1 and 2.
4.2 Effects on Ex-post Firm Performance
Having obtained the propensity score for each observation, we match each treatment
observation of a firm that experienced a top executive turnover in year t with control
observations of firms that did not experience a turnover in that year. There are 1,526 treatment
observations that experienced a turnover. We choose five neighboring control observations for
each treatment observation in the same calendar year in terms of the distance measured by the
propensity scores. We employ the specification of the probit estimation underlying Table 5 and
calculate the propensity scores based on its parameters.9
For these treatment and control observations that are matched, in order to examine
Hypothesis 3, we use several variables to measure the change in borrowers’ performance
between year t and year t+i, where i = 1, 2, 3. For both the treatment and the control group, the
change in the performance variables is measured by jitROA )( j
tj
it ROAROA , jitCAP , and
jitICOVER , where },{ CTj and T and C stand for the treatment and the control group,
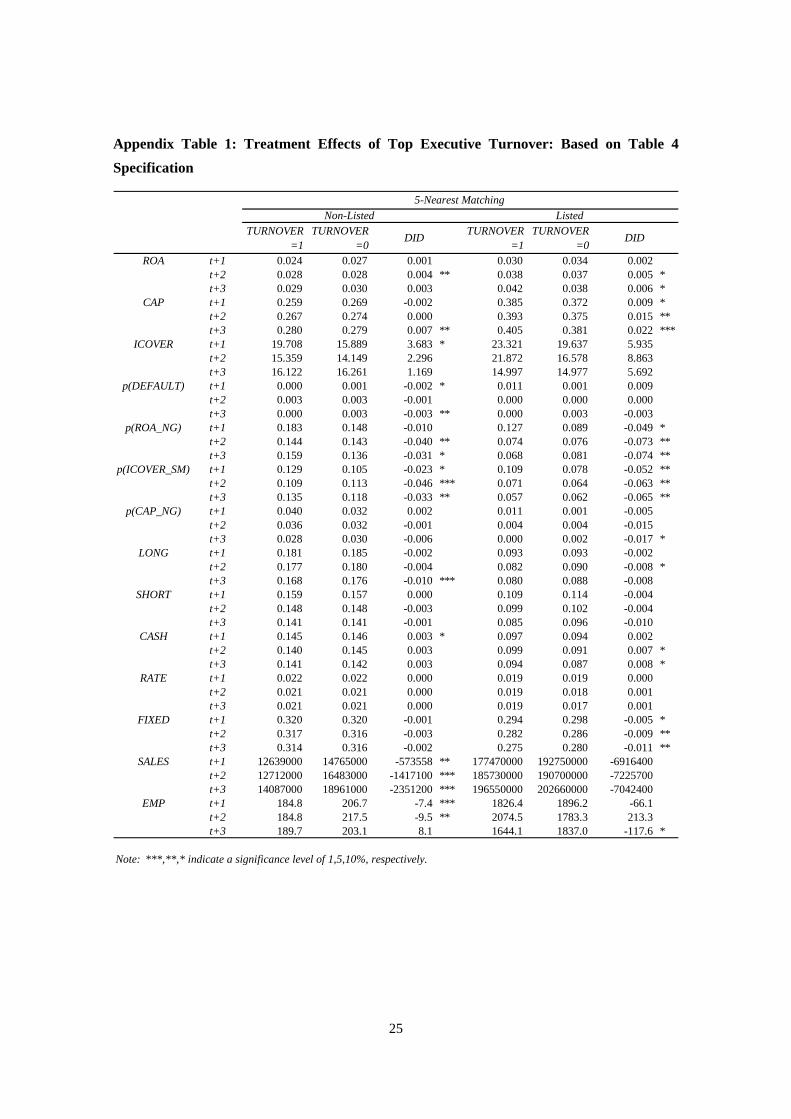
9 We employ a different set of propensity scores based on the specification of the probit estimation underlying Table 4 as a robustness check. The results, presented in Appendix Table 1, show no qualitative difference from those in Table 7.

15
respectively. We examine the change in the probability of financial distress. We use several
ways to define borrower financial distress, including default, a negative ROA, interest coverage
less than or equal to unity, and a negative capital ratio. We measure the probability of a firm
falling into a certain type of distress and then take the difference in this probability between year
t and year t+i. Hence, the change in distress probabilities is measured
by )1( DEFAULTp jit , 10 )1_( NGROAp j
it , )1_( SMICOVERp jit , and
)1_( NGCAPp jit , where },{ CTj . Furthermore, we measure the change in several other
variables describing firms’ circumstances, including credit availability conditions ( jitLONG ,
jitSHORT , j
itCASH jitRATE ), the fixed tangible assets ratio ( j
itFIXED ), sales
( jitSALES ), and employment ( j
itEMP ).
(Insert Table 7)
Turning to the results, we begin with the treatment effect of top executive turnover
among non-listed firms, which is shown in the central column labeled “DID.” Among the firm
performance variables, TtROA 2 is significantly higher, by 0.3 percentage points, than
CtROA 2 and T
tCAP 3 is significantly higher, by 0.7 percentage points, than CtCAP 3 .
Regarding the financial distress variables, )1(3 DEFAULTpTt , )1_(2 NGROApT
t , and
)1_(2 SMICOVERpTt are significantly lower than )1(3 DEFAULTpC
t ,
)1_(2 NGROApCt , and )1_(2 SMICOVERpC
t , by 0.4, 3.4, and 3.9 percentage points,
respectively. These results indicate that firms that experienced a management turnover are less
likely to suffer from financial distresses than those that did not. [Interestingly, the better firm
performance among non-listed firms is accompanied by a decreased dependence on long-term
loans, shrinking sales, and lower employment.
Next, we look at the treatment effect of top executive turnover among listed firms. We
find that listed firms that have experienced an executive turnover saw an increase in their
profitability and a decrease in their probability of falling into financial distress, indicating that
executive turnovers improve firms’ performance. In contrast with the case of non-listed firms,
this increasing profitability is accompanied by a reduced dependence on fixed tangible assets
rather than by lower employment.
In sum, in the predictions of Hypothesis 3 do not seem to be supported. That is, we fail
to find conclusive evidence that managerial turnovers improve the firm performance of large
listed firms more than that of small non-listed firms. Instead, we find that both non-listed firms
and listed firms experience a significant improvement in their profitability when a top executive
10 Since we do not have data on defaults in year t, )1(1 DEFAULTp j
t is actually )1(1 DEFAULTp jt .

16
turnover occurs. One of the few differences among the two groups of firms is that non-listed
firms significantly reduce their sales and employment after a top executive turnover, while listed
firms reduce their capital stock.
5. Conclusion
In this paper, we examined the process of top executive turnover in small non-listed businesses
in Japan using a unique panel data set of about 25,000 firms in 2001-2007. Consistent with our
first and second hypotheses, the likelihood of a change in top executives of non-listed firms is
independent of their ex-ante performance, especially when the firms are operated by the owners
themselves or by their relatives. Also, non-listed firms which experienced a top executive
turnover saw an improvement in their ex-post performance relative to firms with no turnover.
Moreover, the extent of the improvement in firm performance following an executive turnover
is similar for non-listed and listed firms, a result that is in conflict with our third hypothesis. All
of these results suggest that underperforming non-listed firms do not face the threat of
disciplinary executive turnover. However, when a turnover does take place, firms profitability
improves significantly, suggesting that the new top executives exert high managerial effort.
The improvement in the performance of non-listed firms that experienced managerial
turnover provides some evidence that such firms deserve policy assistance. Without any
assistance, such firms may end up exiting the market, resulting in the potential loss of valuable
resources such as accumulated intangible assets. Needless to say, for an optimal design of
policies to facilitate business transfers, it is important to identify and target firms that are likely
to experience an improvement in business performance as a result. Further, not only the
relationship between managerial turnover and firm performance, but also how the relationship is
affected by policies needs to be examined. These are difficult but intriguing research issues for
the future.

17
References
Bennendsen, M., Nielsen, K., Perez-Gonzalez, F., and Wolfenson, D., 2007. Inside the Family
Firm: The Role of Families in Succession Decisions and Performance. Quarterly Journal of
Economics 122(2), 647-691.
Denis, D.,Denis, D., Sarin, A., 1997. Ownership Structure and Top Executive Turnover. Journal
of Financial Economics 45(2), 193-221.
Huson, M., Malatesta, P., Parrino, R., 2004. Managerial Succession and Firm Performance.
Journal of Financial Economics 74(2), 237-275.
Kaplan, S., 1994. Top Executives, Turnover and Firm Performance in Germany. Journal of Law,
Economics and Organization 10(1), 142-59.
Kaplan, S., Minton, B., 1994. Outside Activity in Japanese Companies: Determinants and
Managerial Implications. Journal of Financial Economics 36, 225-58.
Kang, J., Shivdasani, A., 1995. Firm Performance, Corporate Governance, and Top Executive
Turnover in Japan. Journal of Financial Economics 38, 29-58.
Perez-Gonzalez, F.,2006. Inherited Control and Firm Performance. The American Economic
Review 96(5), 1559-1588.
Small and Medium Enterprise Agency, 2006. White Paper on Small and Medium Enterprises in
Japan.

18
Table 1: Number of turnovers and turnover ratio
AllOWNERSH
IP=1O WNERS
HIP=0All
OWNERSHIP=1
O WNERSHIP=0
TURNOVER(t)=1Number of Firms 1526 722 804 284 48 236
Ratio 0.060 0.035 0.177 0.129 0.055 0.177
ListedNon-Listed

19
Table 2: Definitions of Variables
Turnover of Firms’ Top Executive TURNOVER 1 if a new top executive assumes presidency of the firm in the year, 0
otherwise. Firm Performance ROA Ratio of pre-tax operating profits to total assets. CAP Ratio of capital to total assets. Financial Distress
DEFAULT 1 if a firm defaults, 0 otherwise. ROA_NG 1 if ROA is negative (the borrower is in deficit), 0 otherwise. ICOVER_SM 1 if ICOVER is less than or equal to one, 0 otherwise. CAP_NG 1 if CAP is negative (the borrower has negative net worth),
0 otherwise. Credit Availability LONG Ratio of long-term loans (loans with more than 1 year maturity) to
total assets. SHORT Ratio of short-term loans (loans with less than 1 year maturity) to total
assets. CASH Ratio of cash and deposit holdings to total assets. RATE Ratio on interest expenses to total loan amount. Other Firm Characteristics FIRMAGE Number of years since the establishment of the firm. LnEMP Log of the number of employees. FIXED Ratio of fixed tangible assets to total assets. Characteristics of Top Executive AGE Age of the top executive. TENURE Number of years the incumbent top executive has been president of
the firm. Governance OWNERSHIP 1 if a family member of the CEO of the firm is a major shareholder, 0
otherwise. MAINBANK 1 if the bank listed first by the firm is a major shareholder, 0
otherwise.
Note: Dummy variables for the industry of the firm are also included in the empirical analysis.

20
Table 3: Summary Statistics
AllOWNERSH
IP=1O WNERS
HIP=0All
OWNERSHIP=1
O WNERSHIP=0
ROA(t-1) 0.019 0.018 0.022 0.035 0.049 0.027(0.055) (0.055) (0.051) (0.046) (0.053) (0.039)
CAP(t-1) 0.234 0.236 0.224 0.388 0.421 0.366(0.212) (0.212) (0.212) (0.190) (0.186) (0.190)
CAP_NG(t-1) 0.062 0.062 0.061 0(0.241) (0.241) (0.239)
LONG(t-1) 0.252 0.269 0.177 0.098 0.107 0.093(0.200) (0.198) (0.189) (0.103) (0.107) (0.101)
SHORT(t-1) 0.160 0.156 0.180 0.116 0.106 0.123(0.160) (0.157) (0.170) (0.118) (0.111) (0.122)
CASH(t-1) 0.170 0.178 0.134 0.113 0.147 0.091(0.125) (0.126) (0.112) (0.090) (0.101) (0.073)
RATE(t-1) 0.025 0.026 0.021 0.020 0.020 0.019(0.012) (0.012) (0.012) (0.011) (0.012) (0.010)
FIRMAGE(t-1) 39.705 39.887 38.869 50.374 42.861 55.277(22.306) (22.604) (20.871) (24.408) (23.189) (23.940)
LnEMP(t-1) 3.581 3.406 4.383 6.323 5.831 6.644(1.321) (1.236) (1.397) (1.235) (0.976) (1.280)
E MP(t-1) 98.2 71.4 221.0 1496.0 542.0 2118.6(403.701) (160.695) (879.074) (4555.2) (790.970) (5736.917)
FIXED(t-1) 0.303 0.301 0.313 0.308 0.306 0.309(0.203) (0.198) (0.225) (0.186) (0.183) (0.188)
AGE(t-1) 58.775 58.045 62.120 60.662 56.914 63.108(9.484) (9.683) (7.676) (8.423) (9.938) (6.140)
TENURE(t-1) 12.591 14.160 5.405 8.280 14.347 4.320(10.584) (10.590) (6.965) (9.267) (10.438) (5.583)
OWNERSHIP 0.821 1 0 0.395 1 0(0.384) (0.489)
MAINBANK 0.015 0.007 0.053 0.270 0.232 0.295(0.121) (0.082) (0.224) (0.444) (0.422) (0.456)
Number ofobservations
25290 20757 4533 2198 868 1330
(Standard Deviations )
Non-Listed Listed
Mean

21
Table 4: Probit Estimation Results: Baseline
ROA -0.511 * -2.008 **(0.285) (0.952)
CAP -0.194 * 0.033(0.101) (0.285)
CAP_NG -0.002(0.071)
LONG -0.515 *** -0.261(0.107) (0.461)
SHORT -0.191 * 0.377(0.105) (0.397)
CASH -0.086 -0.413(0.136) (0.547)
RATE -1.760 0.724(1.238) (3.663)
FIRMAGE 0.0003 0.00004(0.001) (0.002)
LnEMP 0.075 *** -0.015(0.012) (0.034)
FIXED 0.082 -0.316(0.085) (0.250)
AGE 0.037 *** 0.041 ***(0.002) (0.006)
TENURE 0.004 ** 0.001(0.001) (0.005)
OWNERSHIP -0.737 *** -0.463 ***(0.036) (0.113)
MAINBANK 0.096 -0.109(0.084) (0.084)
Constant -3.437 *** -3.233 ***(0.175) (0.502)
IndustryDummiesNumber ofobservationsPseudo R-sqLog Likelihood
Note: ***,**,* indicate a significance level of 1,5,10%, respectively.
Dependent variable: TURNOVERNon-listed Listed
25290
Yes Yes
0.154-4877.125
2198
0.094-766.653

22
Table 5: Probit Estimation Results: Including OWNERSHIP and Its Cross Terms
ROA -0.481 -2.584 **(0.465) (1.143)
CAP -0.401 *** 0.090(0.139) (0.307)
CAP_NG 0.066(0.109)
LONG -0.491 *** -0.239(0.108) (0.460)
SHORT -0.189 * 0.377(0.105) (0.397)
CASH -0.105 -0.509(0.136) (0.556)
RATE -1.630 1.294(1.237) (3.662)
FIRMAGE 0.000 0.000(0.001) (0.002)
LnEMP 0.076 *** -0.008(0.012) (0.034)
FIXED 0.075 -0.295(0.086) (0.244)
AGE 0.037 *** 0.041 ***(0.002) (0.006)
TENURE 0.003 ** 0.001(0.001) (0.005)
OWNERSHIP -0.813 *** -0.486 **(0.055) (0.225)
OWNERSHIP*ROA -0.010 2.315(0.575) (1.919)
OWNERSHIP*CAP 0.342 ** -0.131(0.156) (0.465)
OWNERSHIP*CAP_NG -0.130(0.144)
Constant -3.403 *** -3.378 ***(0.177) (0.508)
Industry Dummies Yes YesNumber of observationsPseudo R-sqLog Likelihood
Note: ***,**,* indicate a significance level of 1,5,10%, respectively.
Dependent variable: TURNOVERNon-listed Listed
25292
-4872.846
22010.094
-766.9650.155

23
Table 6: Probit Estimation Results: Including OWNERSHIP and MAINBANK
ROA -0.410 -1.969(0.475) (1.223)
CAP -0.387 *** -0.020(0.142) (0.321)
CAP_NG 0.091(0.112)
LONG -0.493 *** -0.170(0.108) (0.458)
SHORT -0.190 * 0.387(0.105) (0.398)
CASH -0.107 -0.488(0.136) (0.552)
RATE -1.574 1.063(1.237) (3.647)
FIRMAGE 0.000 0.000(0.001) (0.002)
LnEMP 0.074 *** -0.015(0.012) (0.034)
FIXED 0.071 -0.306(0.086) (0.244)
AGE 0.037 *** 0.041 ***(0.002) (0.006)
TENURE 0.003 ** 0.001(0.001) (0.005)
OWNERSHIP -0.805 *** -0.502 **(0.055) (0.224)
MAINBANK 0.181 -0.185(0.136) (0.181)
OWNERSHIP*ROA -0.064 1.996(0.581) (1.910)
OWNERSHIP*CAP 0.329 ** -0.068(0.158) (0.460)
OWNERSHIP*CAP_NG -0.152(0.145)
MAINBANK*ROA -1.046 -2.886(1.853) (2.381)
MAINBANK*CAP -0.197 0.382(0.436) (0.443)
MAINBANK*CAP_NG -0.435(0.432)
Constant -3.401 *** -3.289 ***(0.177) (0.504)
Industry DummiesNumber of observationsPseudo R-sqLog LikelihoodNote: ***,**,* indicate a significance level of 1,5,10%, respectively.
-4871.515 -765.571
Yes Yes
0.155 0.095
Dependent Variable: TURNOVERNon-listed Listed
25290 2198

24
Table 7: Treatment Effects of Top Executive Turnovers: Based on Table 5 Specification
TURNOVER=1
TURNOVER=0
TURNOVER=1
TURNOVER=0
ROA t+1 0.024 0.027 0.001 0.030 0.034 0.003 t+2 0.028 0.029 0.003 * 0.038 0.036 0.005 * t+3 0.029 0.030 0.002 0.042 0.038 0.006 **CAP t+1 0.259 0.271 -0.002 0.385 0.391 0.009 t+2 0.267 0.279 0.000 0.393 0.393 0.013 * t+3 0.280 0.285 0.007 ** 0.405 0.400 0.020 **ICOVER t+1 19.708 15.190 3.665 * 23.321 23.048 4.969 t+2 15.359 14.856 1.813 21.872 19.488 8.616 t+3 16.122 17.149 0.482 14.997 18.255 3.135p(DEFAULT) t+1 0.000 0.002 -0.002 ** 0.011 0.000 0.011 * t+2 0.003 0.003 -0.001 0.000 0.000 0.000 t+3 0.000 0.004 -0.004 *** 0.000 0.002 -0.002p(ROA_NG) t+1 0.183 0.147 -0.010 0.127 0.074 -0.039 t+2 0.144 0.143 -0.034 ** 0.074 0.084 -0.087 *** t+3 0.159 0.137 -0.024 0.068 0.082 -0.087 ***p(ICOVER_SM) t+1 0.129 0.117 -0.027 ** 0.109 0.055 -0.037 t+2 0.109 0.118 -0.039 *** 0.071 0.069 -0.077 *** t+3 0.135 0.116 -0.024 0.057 0.057 -0.074 ***p(CAP_NG) t+1 0.040 0.033 0.001 0.011 0.001 -0.009 t+2 0.036 0.029 0.002 0.004 0.000 -0.015 * t+3 0.028 0.029 -0.005 0.000 0.000 -0.019 **LONG t+1 0.181 0.184 -0.002 0.093 0.082 0.000 t+2 0.177 0.180 -0.005 0.082 0.079 -0.004 t+3 0.168 0.176 -0.011 *** 0.080 0.074 -0.002SHORT t+1 0.159 0.156 -0.001 0.109 0.104 -0.002 t+2 0.148 0.147 -0.003 0.099 0.093 -0.003 t+3 0.141 0.139 0.000 0.085 0.087 -0.009CASH t+1 0.145 0.147 0.002 0.097 0.096 0.003 t+2 0.140 0.145 0.001 0.099 0.093 0.008 * t+3 0.141 0.144 0.002 0.094 0.087 0.010 **RATE t+1 0.022 0.021 0.000 0.019 0.018 0.001 t+2 0.021 0.021 0.000 0.019 0.017 0.001 t+3 0.021 0.021 0.000 0.019 0.017 0.001FIXED t+1 0.320 0.318 -0.001 0.294 0.285 -0.004 t+2 0.317 0.314 -0.001 0.282 0.274 -0.007 * t+3 0.314 0.313 -0.002 0.275 0.266 -0.009 *SALES t+1 12639000 13848000 -423222 * 177470000 212520000 -6771800 t+2 12712000 14350000 -1017900 ** 185730000 225460000 -8930800 t+3 14087000 14994000 -1013700 * 196550000 237840000 -7808900EMP t+1 184.8 210.9 -11.6 *** 1826.4 1930.0 -54.8 t+2 184.8 221.3 -16.2 *** 2074.5 1929.5 220.3 t+3 189.7 209.5 0.6 1644.1 1943.8 -102.1
Note: ***,**,* indicate a significance level of 1,5,10%, respectively.
DID DID
5-Nearest Matching
Non-Listed Listed
25
Appendix Table 1: Treatment Effects of Top Executive Turnover: Based on Table 4
Specification
TURNOVER=1
TURNOVER=0
TURNOVER=1
TURNOVER=0
ROA t+1 0.024 0.027 0.001 0.030 0.034 0.002 t+2 0.028 0.028 0.004 ** 0.038 0.037 0.005 * t+3 0.029 0.030 0.003 0.042 0.038 0.006 *
CAP t+1 0.259 0.269 -0.002 0.385 0.372 0.009 * t+2 0.267 0.274 0.000 0.393 0.375 0.015 ** t+3 0.280 0.279 0.007 ** 0.405 0.381 0.022 ***
ICOVER t+1 19.708 15.889 3.683 * 23.321 19.637 5.935 t+2 15.359 14.149 2.296 21.872 16.578 8.863 t+3 16.122 16.261 1.169 14.997 14.977 5.692
p(DEFAULT) t+1 0.000 0.001 -0.002 * 0.011 0.001 0.009 t+2 0.003 0.003 -0.001 0.000 0.000 0.000 t+3 0.000 0.003 -0.003 ** 0.000 0.003 -0.003
p(ROA_NG) t+1 0.183 0.148 -0.010 0.127 0.089 -0.049 * t+2 0.144 0.143 -0.040 ** 0.074 0.076 -0.073 ** t+3 0.159 0.136 -0.031 * 0.068 0.081 -0.074 **
p(ICOVER_SM) t+1 0.129 0.105 -0.023 * 0.109 0.078 -0.052 ** t+2 0.109 0.113 -0.046 *** 0.071 0.064 -0.063 ** t+3 0.135 0.118 -0.033 ** 0.057 0.062 -0.065 **
p(CAP_NG) t+1 0.040 0.032 0.002 0.011 0.001 -0.005 t+2 0.036 0.032 -0.001 0.004 0.004 -0.015 t+3 0.028 0.030 -0.006 0.000 0.002 -0.017 *
LONG t+1 0.181 0.185 -0.002 0.093 0.093 -0.002 t+2 0.177 0.180 -0.004 0.082 0.090 -0.008 * t+3 0.168 0.176 -0.010 *** 0.080 0.088 -0.008
SHORT t+1 0.159 0.157 0.000 0.109 0.114 -0.004 t+2 0.148 0.148 -0.003 0.099 0.102 -0.004 t+3 0.141 0.141 -0.001 0.085 0.096 -0.010
CASH t+1 0.145 0.146 0.003 * 0.097 0.094 0.002 t+2 0.140 0.145 0.003 0.099 0.091 0.007 * t+3 0.141 0.142 0.003 0.094 0.087 0.008 *
RATE t+1 0.022 0.022 0.000 0.019 0.019 0.000 t+2 0.021 0.021 0.000 0.019 0.018 0.001 t+3 0.021 0.021 0.000 0.019 0.017 0.001
FIXED t+1 0.320 0.320 -0.001 0.294 0.298 -0.005 * t+2 0.317 0.316 -0.003 0.282 0.286 -0.009 ** t+3 0.314 0.316 -0.002 0.275 0.280 -0.011 **
SALES t+1 12639000 14765000 -573558 ** 177470000 192750000 -6916400 t+2 12712000 16483000 -1417100 *** 185730000 190700000 -7225700 t+3 14087000 18961000 -2351200 *** 196550000 202660000 -7042400
EMP t+1 184.8 206.7 -7.4 *** 1826.4 1896.2 -66.1 t+2 184.8 217.5 -9.5 ** 2074.5 1783.3 213.3 t+3 189.7 203.1 8.1 1644.1 1837.0 -117.6 *
Note: ***,**,* indicate a significance level of 1,5,10%, respectively.
DID DID
5-Nearest Matching
Non-Listed Listed

26
Appendix Table 2: Treatment Effects with Different Matching Algorithms
ROA t+1 0.000 0.003 0.000 0.002 0.000 0.002 t+2 0.003 * 0.005 * 0.003 ** 0.006 ** 0.003 * 0.006 ** t+3 0.003 0.006 * 0.003 0.008 *** 0.003 0.007 **CAP t+1 -0.001 0.009 * -0.001 0.009 * -0.001 0.009 * t+2 0.000 0.011 * 0.002 0.012 * 0.001 0.012 ** t+3 0.005 * 0.018 ** 0.007 ** 0.021 *** 0.006 * 0.022 ***ICOVER t+1 3.974 ** 5.510 2.998 3.811 3.258 * 4.161 t+2 2.254 9.797 * 0.309 8.558 0.846 8.710 t+3 1.438 2.962 0.423 3.245 0.670 2.612p(DEFAULT) t+1 -0.002 ** 0.011 * -0.002 ** 0.011 * -0.002 ** 0.011 * t+2 -0.002 0.000 -0.001 0.000 -0.001 0.000 t+3 -0.004 *** -0.003 -0.003 *** -0.002 * -0.003 *** -0.002 **p(ROA_NG) t+1 -0.003 -0.038 -0.004 -0.031 -0.004 -0.031 t+2 -0.030 * -0.083 *** -0.033 ** -0.074 *** -0.033 ** -0.074 *** t+3 -0.022 -0.077 *** -0.025 * -0.078 *** -0.024 -0.075 ***p(ICOVER_SM) t+1 -0.021 -0.039 -0.018 -0.036 -0.018 -0.035 t+2 -0.035 ** -0.069 *** -0.034 ** -0.065 *** -0.035 ** -0.064 ** t+3 -0.025 -0.069 ** -0.021 -0.073 *** -0.021 -0.070 ***p(CAP_NG) t+1 0.001 -0.008 0.001 -0.007 0.002 -0.007 t+2 0.002 -0.013 0.001 -0.014 0.001 -0.014 t+3 -0.004 -0.017 ** -0.003 -0.018 ** -0.003 -0.018 **LONG t+1 -0.002 0.000 -0.003 -0.001 -0.003 -0.001 t+2 -0.004 -0.005 -0.006 * -0.005 -0.005 * -0.006 t+3 -0.010 ** -0.002 -0.010 *** -0.003 -0.010 *** -0.004SHORT t+1 -0.001 -0.003 -0.002 -0.003 -0.001 -0.002 t+2 -0.003 -0.002 -0.004 -0.004 -0.003 -0.003 t+3 0.000 -0.007 -0.001 -0.011 * 0.000 -0.009CASH t+1 0.002 0.001 0.003 0.001 0.003 0.001 t+2 0.001 0.007 * 0.002 0.006 0.002 0.006 t+3 0.001 0.009 ** 0.002 0.007 0.002 0.007RATE t+1 0.000 0.001 0.000 0.001 0.000 0.001 t+2 0.000 0.000 0.000 0.001 0.000 0.000 t+3 0.000 0.001 0.000 0.001 0.000 0.001FIXED t+1 -0.001 -0.004 -0.001 -0.004 * -0.001 -0.004 t+2 -0.001 -0.007 * -0.002 -0.008 ** -0.001 -0.007 * t+3 -0.001 -0.009 * -0.002 -0.010 ** -0.001 -0.009 **SALES t+1 -541242 ** -7522100 * -451416 * -8073200 ** -477759 ** -7684600 * t+2 -1297900 *** -9414600 -927111 ** -7644300 -1041700 *** -7457300 t+3 -1469000 ** -8126600 -1131700 ** -5825200 -1368600 *** -5935400EMP t+1 -9.4 *** -102.8 -5.2 *** -149.1 ** -5.0 *** -141.1 ** t+2 -15.5 *** 189.2 -8.2 *** 173.8 -8.2 *** 183.0 t+3 1.1 -127.3 * -3.9 -143.4 ** -2.3 -134.1 **
Note: ***,**,* indicate a significance level of 1,5,10%, respectively.
10-nearest matching
Non-listed Listed
DID DID
radius matching
Non-listed Listed
DID DIDDID DID
kernel matching
Non-listed Listed