executive summary of desktop computer displays: life cycle assessment… · 2015-05-14 · chapter...
TRANSCRIPT
EXECUTIVE SUMMARY
EXECUTIVE SUMMARY
This report presents the results of a voluntary, cooperative project among the Design for
the Environment (DfE) Program in the Economics, Exposure, and Technology Division of the
U.S. Environmental Protection Agency’s (EPA) Office of Pollution Prevention and Toxics, the
University of Tennessee (UT) Center for Clean Products and Clean Technologies, the electronics
industry, and other interested parties to develop a model and assess the life-cycle environmental
impacts of flat panel display (FPD) and cathode ray tube (CRT) technologies that can be used for
desktop computer displays. The DfE Computer Display Project (CDP) report provides a baseline
analysis and the opportunity to use the model as a stepping stone for further analyses and
improvement assessments for these technologies.
The DfE CDP uses life-cycle assessment (LCA) as an environmental evaluation tool that
looks at the full life cycle of the product from materials acquisition to manufacturing, use, and
final disposition. As defined by the Society of Environmental Toxicology and Chemistry, there
are four major components of an LCA study: goal definition and scoping, life-cycle inventory,
impact assessment, and improvement assessment. The more recent International Standards
Organizations definition of LCA includes the same first three components, but replaces the
improvement assessment component of LCA with a life-cycle interpretation component. LCAs
are generally global and non-site specific in scope.
The DfE CDP analysis also incorporates some elements of the Cleaner Technologies
Substitutes Assessment (CTSA) methodology (Kincaid et al., 1996), which was developed under
the DfE Program to help businesses make environmentally informed choices and design for the
environment. The CTSA process involves comparative evaluations of the relative human and
ecological risk, energy and natural resource use, performance, and cost of substitute technologies,
processes, products, or materials.
This project focuses on the LCA, while including some CTSA-related analyses. It
performs the broad analysis of the LCA, which also incorporates many of the CTSA components
(e.g., risk, energy impacts, natural resource use) into the impact assessment. The analysis also
assesses more specific impacts for selected materials and acknowledges product cost and
performance, typical of a CTSA. As only selected materials are qualitatively evaluated for the
CTSA, this project is an LCA with a streamlined CTSA component.
LCAs evaluate the environmental impacts from each of the following major life-cycle
stages: raw materials extraction/acquisition; materials processing; product manufacture; product
use, maintenance, and repair; and final disposition/end-of-life. The inputs (e.g., resources and
energy) and outputs (e.g., products, emissions, and waste) within each life-cycle stage, as well as
the interaction between each stage (e.g., transportation) are evaluated to determine the
environmental impacts.
In this study and project report, the goal and scope of the CDP are the subject of
Chapter 1. The life-cycle inventory (LCI), which involves the quantification of raw material and
fuel inputs, and solid, liquid, and gaseous emissions and effluents, is the subject of Chapter 2.
The life-cycle impact assessment (LCIA) involves the translation of the environmental burdens
identified in the LCI into environmental impacts and is the subject of Chapter 3. The
improvement assessment or life-cycle interpretation is left to the electronics industry given the
ES-1

EXECUTIVE SUMMARY
results of this study. The report also includes a qualitative risk screening of selected materials to
represent the CTSA component of the report in Chapter 4. The summary and conclusions are
presented in Chapter 5.
I. GOAL DEFINITION AND SCOPE
Purpose and Need
The purpose of this study is two-fold: (1) to establish a scientific baseline that evaluates
the life-cycle environmental impacts of active matrix liquid crystal display (LCD) and cathode
ray tube (CRT) technologies for desktop computers, by combining LCA and CTSA
methodologies; and (2) to develop a model that can be used with updated data for future life-
cycle analyses. This study is designed to provide the electronics industry with information
needed to improve the environmental attributes of desktop computer displays. The evaluation
considers impacts related to material consumption, energy, air resources, water resources,
landfills, human toxicity, and ecological toxicity. It is intended to provide valuable data not
previously published, and an opportunity to use the model developed for this project in future
improvement evaluations that consider life-cycle impacts. It will also provide the industry and
consumers with valuable information to make environmentally informed decisions regarding
display technologies, and enable them to consider the relative environmental merits of a
technology along with its performance and cost. While there has been some work done on the
life-cycle environmental impacts of either CRTs or LCDs, there has not been a quantitative LCA
of both CRTs and LCDs.
At present, computer displays using CRTs dominate worldwide markets. The LCD, first
used predominately in notebook computers, is now moving into the desktop computer market.
CRTs use larger amounts of energy to operate than LCDs, and are associated with disposal
concerns due to leaded glass in the displays. LCDs may consume more energy during
manufacturing and contain small amounts of mercury. Given the expected market growth of
LCDs for computer displays, the various environmental concerns throughout the life cycle of the
computer displays, and the fact that the relative life-cycle environmental impacts of LCDs and
CRTs have not been scientifically established to date, there is a need for an environmental life-
cycle assessment of both of these types of desktop computer display technologies.
Targeted Audience and Use of the Study
The electronics industry is expected to be one of the primary users of the study results.
The study is intended to provide industry with an analysis that evaluates the life-cycle
environmental impacts of selected computer display technologies. Another result of the study is
an accounting of the relative environmental impacts of various components of the computer
displays, thus identifying opportunities for product improvements to reduce potential adverse
environmental impacts and costs. Since this study incorporates a more detailed health effects
component than in traditional LCAs, the electronics industry can use the tools and data to
evaluate the health, environmental, and energy implications of the technologies. With this
evaluation, the U.S. electronics industry may be more prepared to meet the demands of extended
product responsibility that are growing in popularity in the global marketplace, and better able to
ES-2

EXECUTIVE SUMMARY
meet competitive challenges in the world market. In addition, the results and model in this study
will provide a baseline LCA upon which alternative technologies can be evaluated. This will
allow for more expedited display-related LCA studies, which are growing in popularity by
industry and may be demanded by original equipment manufacturers (OEMs) or international
organizations.
EPA and interested members of the public can also benefit from the results of the project.
The project has provided a forum for industry and public stakeholders to work cooperatively, and
the results can be used by stakeholders as a scientific reference for the evaluated display
technologies. The results of the project could also be of value to other industries involved in
designing environmental improvements into the life cycle of consumer products.
Product System
The product system being analyzed in this study is a standard desktop computer display
that functions as a graphical interface between computer processing units and users. Besides the
CRT display, several FPD technologies were considered for inclusion in this study. Among the
FPD technologies that exist, the amorphous silicon (a:Si) thin-film transistor- (TFT) active
matrix LCD technology meets the requirements of the functional unit within the parameters of
this analysis and is assessed in this study.
The product system is the computer display itself and does not include the central
processing unit (CPU) of the computer that sends signals to operate the display. It is assumed
that the LCDs operate with an analog interface, and therefore are compatible with current CRT
CPUs as plug-and-play alternatives.
In an LCA, product systems are evaluated on a functionally equivalent basis. The
functional unit is used as the basis for the inventory and impact assessment to provide a reference
to which the inputs and outputs are related. For this project, the functional unit is one desktop
computer display over its lifespan, which meets the functional unit specifications presented in
Table ES-1. The CRT technology is the current industry standard for this product system.
Table ES-1. Functional unit specifications
Specification Measure
display size a 17" (CRT); 15" (LCD)
diagonal viewing area a 15.9" (CRT); 15" (LCD)
viewing area dimensions 12.8" x 9.5" (122 in2) (CRT); 12" x 9" (108 in2) (LCD)
resolution 1024 x 768 color pixels
brightness 200 cd/m2
contrast ratio 100:1
color 262,000 colors a An LCD is manufactured such that its nearest equivalent to the 17" CRT display is the 15" LCD. This is because
the viewing area of a 17" CRT is about 15.9 inches and the viewing area of a 15" LCD is 15 inches. LCDs are not
manufactured to be exactly equivalent to the viewing area of the CRT.
ES-3
EXECUTIVE SUMMARY
Assessment Boundaries
In a comprehensive cradle-to-grave analysis, the display system includes five life-cycle
stages: (1) raw materials extraction/acquisition; (2) materials processing; (3) product
manufacture; (4) product use, maintenance and repair; and (5) final disposition/end-of-life. Also
included are the activities that are required to affect movement between the stages (e.g.,
transportation).
The geographic boundaries of this assessment depend on the life-cycle stage. This LCA
focuses on the U.S. display market; therefore, the geographic boundary for the use and
disposition stages of displays is limited to the United States. The geographic boundaries for raw
material extraction, material processing, and product manufacture are worldwide (although actual
product manufacturing data were only collected from the United States, Japan, and Korea,
described in Chapter 2 of the report). While the geographic boundaries show where impacts
might occur for various life-cycle stages, traditional LCAs do not provide an actual spatial
relationship of impacts. That is, particular impacts cannot be attributed to a specific location.
Rather, impacts are generally presented on a global or regional scale.
Considering the temporal boundaries, this study addresses impacts from the life cycle of a
desktop computer display manufactured using 1997-2000 technology. The use and disposition
stages cover a period that represents the life of a display. The lifespan, labeled as the “effective”
life, is defined as the period of time the display is in use by primary, secondary, or even tertiary
users before reaching its final disposition. The effective life, used as the baseline scenario, is
estimated based on past and current use patterns of displays and represents a realistic estimate of
the lifespan. As the effective life is subject to many variables, including fluctuating market
trends, an alternative lifespan is presented in a sensitivity analysis. The alternative lifespan, or
“manufactured” life, defined as the designed durability of a display (e.g., the time a display or
key display component will operate before failing), is approximated based on the manufacturer’s
estimated durability of the display.
Impacts from the infrastructure needed to support the manufacturing facilities (e.g.,
maintenance of manufacturing plants) are beyond the scope of this study. However, maintenance
of clean rooms used in the manufacturing of LCDs (and other components), which require
substantial amounts of energy, are considered part of the manufacturing process.
Impacts from the transportation and distribution of materials, products, and wastes
throughout the life-cycle of a display were originally included in the scope of the CDP LCA.
However, only a small part of the overall transport in the life of a monitor was either reported in
primary data collected for this project or available in secondary data. Inconsistencies between
primary and secondary transportation data sources and the overall poor quality of transport data
prevented an accurate assessment of the transportation inventory and impacts. Therefore,
transportation impacts were excluded from the analysis. Section 2.6 describes transport data
limitations and uncertainties in detail.
ES-4

EXECUTIVE SUMMARY
II. LIFE-CYCLE INVENTORY (LCI)
General Methodology
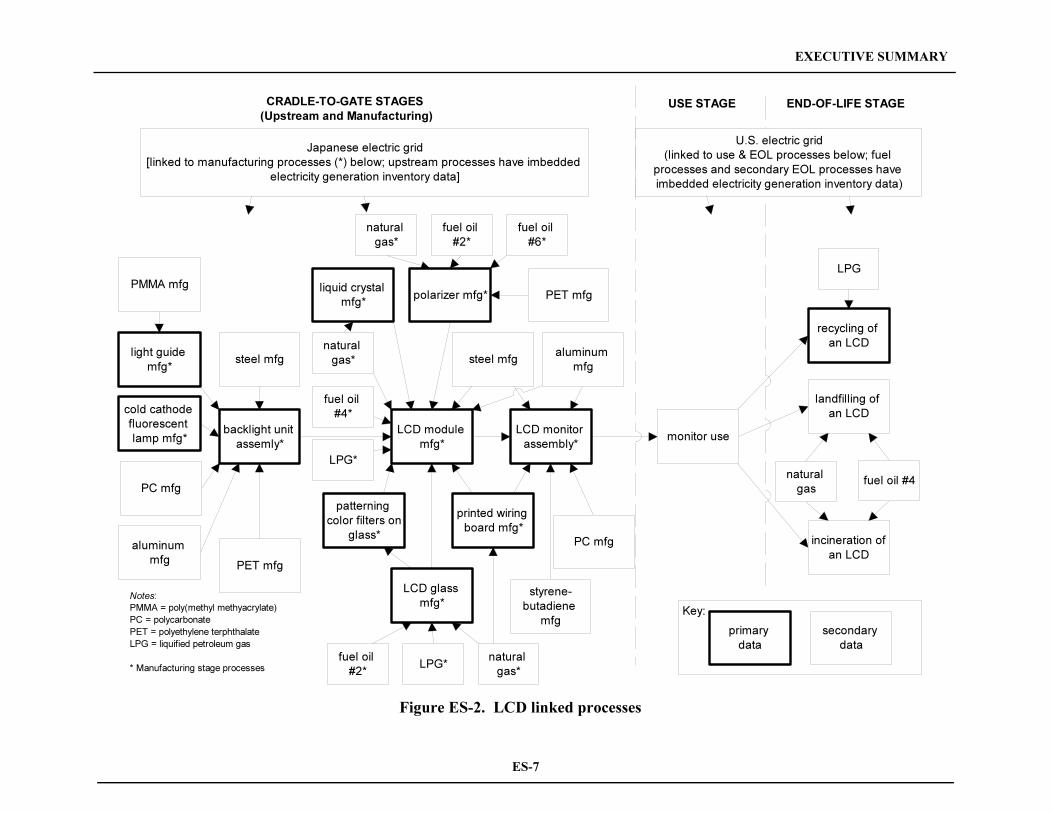
An LCI is the identification and quantification of the material and resource inputs and
emission and product outputs from the unit processes in the life cycle of a product system. For
the DfE CDP, LCI inputs include materials used in the computer display product itself, ancillary
materials used in processing and manufacturing the displays, and energy and other resources
consumed in the manufacturing, use, or final disposition of the displays. Outputs include
products, air emissions, water effluents, and releases to land. Figures ES-1 and ES-2 show the
unit processes that are included in the scope of this project for the CRT and LCD life cycles,
respectively.
ES-5

EXECUTIVE SUMMARY
Key:
CRT glass
mfg*
steel mfg
CRT monitor
assembly* monitor use
landfilling of a
CRT
printed wiring
board mfg* ferrite mfg aluminum mfg
CRT mfg*
recycling of a
CRT
incineration of
a CRT
lead mfg frit mfg*
Invar mfg
HIPS mfg
ABS mfg
PC mfg
styrene
butadiene mfg
Notes:
LPG = liquified petroleum gas
HIPS = high impact polystyrene
ABS = acrylonitrile butadiene styrene
PC = polycarbonate
* Manufacturing stage processes
Japanese electric grid
[linked to manufacturing processes (*) below; upstream processes have imbedded
electricity generation inventory data]
U.S. electric grid
(linked to use & EOL processes below; fuel processes
and secondary EOL processes have imbedded
electricity generation inventory data)
CRADLE-TO-GATE STAGES
(Upstream and Manufacturing) USE STAGE END-OF-LIFE STAGE
fuel oil #2*
fuel oil #4*
LPG*
fuel oil #6*
natural
gas*
LPG
natural
gas fuel oil #4
primary
data
secondary
data
Figure ES-1. CRT linked processes
ES-6
EXECUTIVE SUMMARY
Key:
LCD module
mfg* monitor use
landfilling of
an LCD
liquid crystal
mfg* polarizer mfg* PET mfg
recycling of
an LCD
incineration of
an LCD
printed wiring
board mfg*
patterning
color filters on
glass*
LCD glass
mfg* styrene-
butadiene
mfg
Japanese electric grid
[linked to manufacturing processes (*) below; upstream processes have imbedded
electricity generation inventory data]
U.S. electric grid
(linked to use & EOL processes below; fuel
processes and secondary EOL processes have
imbedded electricity generation inventory data)
CRADLE-TO-GATE STAGES
(Upstream and Manufacturing) USE STAGE END-OF-LIFE STAGE
natural
gas*
LPG
natural
gas fuel oil #4
primary
data
secondary
data
fuel oil
#2*
fuel oil
#6*
steel mfg aluminum
mfg
LCD monitor
assembly*
natural
gas*
fuel oil
#4*
LPG*
PC mfg
fuel oil LPG*
natural
PMMA mfg
backlight unit
assemly*
light guide
mfg* steel mfg
cold cathode
fluorescent
lamp mfg*
PC mfg
Notes:
PMMA = poly(methyl methyacrylate)
PC = polycarbonate
PET = polyethylene terphthalate
LPG = liquified petroleum gas
* Manufacturing stage processes
aluminum
mfg PET mfg
#2* gas*
Figure ES-2. LCD linked processes
ES-7

EXECUTIVE SUMMARY
Data were also collected on the final disposition of emissions outputs, such as whether
outputs are released directly to the environment, recycled, treated, and/or disposed. This
information helps determine which impacts will be calculated for a particular inventory item.
Methods for calculating impacts are discussed in Chapter 3, Life-cycle Impact Assessment.
Given the enormous amount of data involved in inventorying all of the inputs and outputs
for a product system, decision rules, based on the mass, environmental, energy, and functional
significance, were used to determine which materials or unit processes to include in the LCI.
Decision rules are designed to make data collection manageable while still representative of the
product system and its impacts. Data were collected from both primary and secondary sources.
Table ES-2 lists the types of data (primary or secondary) used for each life-cycle stage in the
CDP LCI. In general, greater emphasis was placed on collecting data and/or developing models
for the product manufacturing, use, and end-of-life life-cycle stages.
Table ES-2. Data types by life-cycle stage
Life-cycle stage Data types
Upstream
(materials extraction and processing)
Secondary data.
Product and component manufacturing Primary data, except secondary data used for frit.
Use Modeled using secondary data; maintenance and repair are not
included in the analysis.
Final disposition
(recycling and/or disposal)
Modeled using secondary data plus primary data from CRT
recycling facilities.
Packaging, transportation, distribution Not included.
In the CDP LCI, data were allocated to the functional unit (i.e., a desktop computer
display over its lifetime) as appropriate. The data that were collected for this study were either
obtained from questionnaires developed for this project (i.e., primary data) or from existing
databases (i.e., secondary data). LCI data were imported into a Life-Cycle Design Software Tool
developed by the UT Center for Clean Products and Clean Technologies with funding from the
EPA Office of Research and Development and Saturn Corporation. The UT Life-Cycle Design
Software Tool organizes data in such a way that each process inventory is independent.
Customized “profiles” (e.g., the manufacture of a CRT or the whole life-cycle of an LCD) can be
developed by linking processes.
LCI data quality was evaluated based on the following data quality indicators (DQIs): (1)
the source type (i.e., primary or secondary data sources); (2) the method in which the data were
obtained (i.e., measured, calculated, estimated); and (3) the time period for which the data are
representative. Any proprietary information required for the assessment was aggregated to
protect confidentiality.
A critical review process was maintained in the CDP LCA to help ensure that appropriate
methods were employed and study goals were met. A project Core Group and Technical Work
Group, both consisting of representatives from industry, academia, and government, including
EPA’s DfE Work Group, provided critical reviews of the assessment. The Core Group served as
the project steering committee and was responsible for approving all major scoping assumptions
and decisions. The Technical Work Group and EPA’s DfE Work Group provided technical
ES-8

EXECUTIVE SUMMARY
guidance and were given the opportunity to review all major project deliverables, including the
final LCA report.
Upstream Life-cycle Stage Methodology
The materials extraction and processing inventories for key materials were obtained from
a secondary LCI database developed by Ecobilan (1999). The U.S. electric grid inventory was
developed from secondary sources by UT. The U.S. electric grid inventory was then modified,
based on the distribution of fuels used in Japan, to develop the Japanese electric grid, which was
used where manufacturing occurs in Asia. Electricity consumed in the life-cycles of the monitors
was linked to the inventory of inputs and outputs from the U.S. or Japanese electric grid
inventories, as appropriate.
Manufacturing Stage Methodology
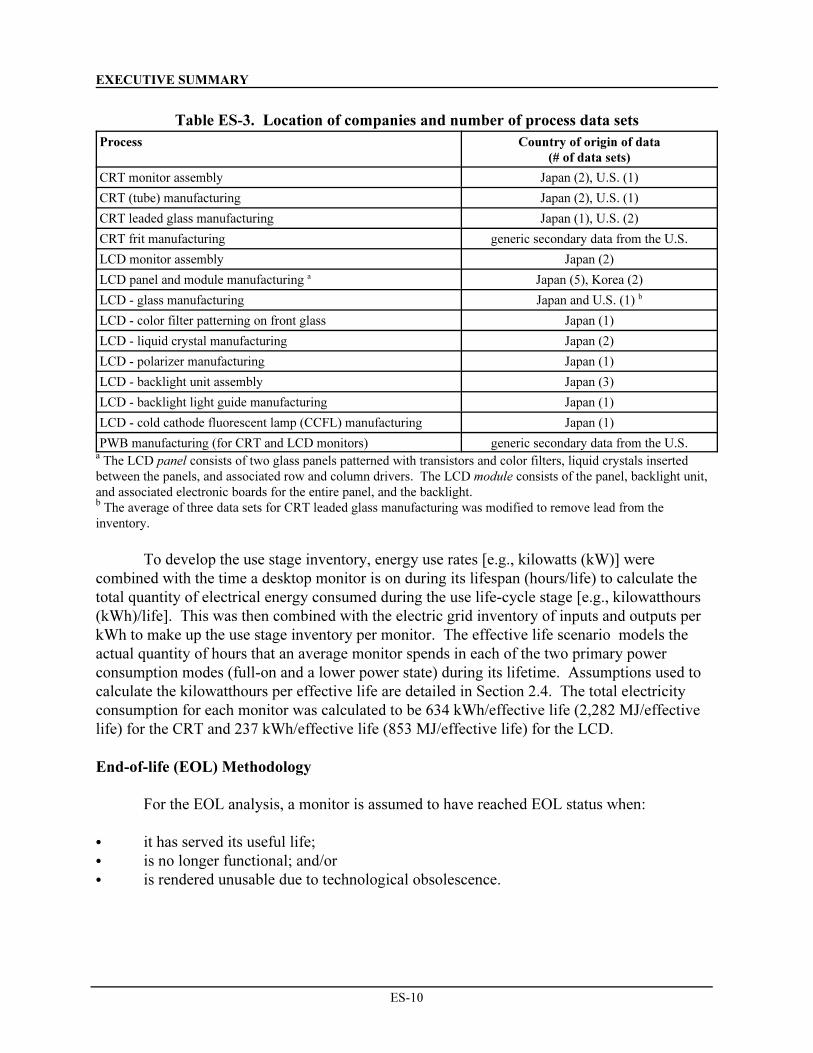
The inventories for the product manufacturing life-cycle stage were developed from
primary data collected from manufacturers in Asia and the United States. The manufacturing
processes included in the study, as well as the number of data sets for each process and the
country of origin of the data, are presented in Table ES-3. A total of 27 product manufacturing
questionnaires were collected for 11 different processes. Allocation of data to the functional unit
was conducted as necessary. Processes for which we collected more than one company’s data
were averaged together.
The quality of the manufacturing stage data can be evaluated against two factors: (1) the
date of the data; and (2) the type of data (i.e., measured, calculated or estimated). The data
collection phase of this project began in 1997 and extended through 2000. Some processes are
more sensitive to production dates than others. Most processes included in this analysis are
mature technologies and are not expected to differ significantly between the years 1997 and
2000. However, an exception is LCD panel/module manufacturing, which is an evolving and
rapidly advancing process and has seen changes between these years. For the LCD panel and
module manufacturing process, most data were from 1998 and 1999.
Data quality indicators were developed based on whether data were measured, calculated,
or estimated, as reported in company data questionnaires. The weighted average of data
collected and their associated DQIs are as follows: for the CRT, 43% of the data were measured,
34% calculated, 13% estimated, and 10% were not classified. For the LCD, a similar distribution
shows 33% measured, 30% calculated, 23% estimated, and 14% not classified.
Product Use Life-cycle Stage Methodology
The baseline analysis in this project employs an effective life use stage scenario (the
actual amount of time a monitor is used, by one or multiple users, before it is disposed of,
recycled, or re-manufactured). A manufactured life scenario (the amount of time either an entire
monitor or a single component will last before reaching a point where the equipment no longer
functions, independent of user choice) is evaluated in a sensitivity analysis.
ES-9
EXECUTIVE SUMMARY
Table ES-3. Location of companies and number of process data sets
Process Country of origin of data
(# of data sets)
CRT monitor assembly Japan (2), U.S. (1)
CRT (tube) manufacturing Japan (2), U.S. (1)
CRT leaded glass manufacturing Japan (1), U.S. (2)
CRT frit manufacturing generic secondary data from the U.S.
LCD monitor assembly Japan (2)
LCD panel and module manufacturing a Japan (5), Korea (2)
LCD - glass manufacturing Japan and U.S. (1) b
LCD - color filter patterning on front glass Japan (1)
LCD - liquid crystal manufacturing Japan (2)
LCD - polarizer manufacturing Japan (1)
LCD - backlight unit assembly Japan (3)
LCD - backlight light guide manufacturing Japan (1)
LCD - cold cathode fluorescent lamp (CCFL) manufacturing Japan (1)
PWB manufacturing (for CRT and LCD monitors) generic secondary data from the U.S. a The LCD panel consists of two glass panels patterned with transistors and color filters, liquid crystals inserted
between the panels, and associated row and column drivers. The LCD module consists of the panel, backlight unit,
and associated electronic boards for the entire panel, and the backlight. b The average of three data sets for CRT leaded glass manufacturing was modified to remove lead from the
inventory.
To develop the use stage inventory, energy use rates [e.g., kilowatts (kW)] were
combined with the time a desktop monitor is on during its lifespan (hours/life) to calculate the
total quantity of electrical energy consumed during the use life-cycle stage [e.g., kilowatthours
(kWh)/life]. This was then combined with the electric grid inventory of inputs and outputs per
kWh to make up the use stage inventory per monitor. The effective life scenario models the
actual quantity of hours that an average monitor spends in each of the two primary power
consumption modes (full-on and a lower power state) during its lifetime. Assumptions used to
calculate the kilowatthours per effective life are detailed in Section 2.4. The total electricity
consumption for each monitor was calculated to be 634 kWh/effective life (2,282 MJ/effective
life) for the CRT and 237 kWh/effective life (853 MJ/effective life) for the LCD.
End-of-life (EOL) Methodology
For the EOL analysis, a monitor is assumed to have reached EOL status when:
C it has served its useful life;
C is no longer functional; and/or
C is rendered unusable due to technological obsolescence.
ES-10
EXECUTIVE SUMMARY
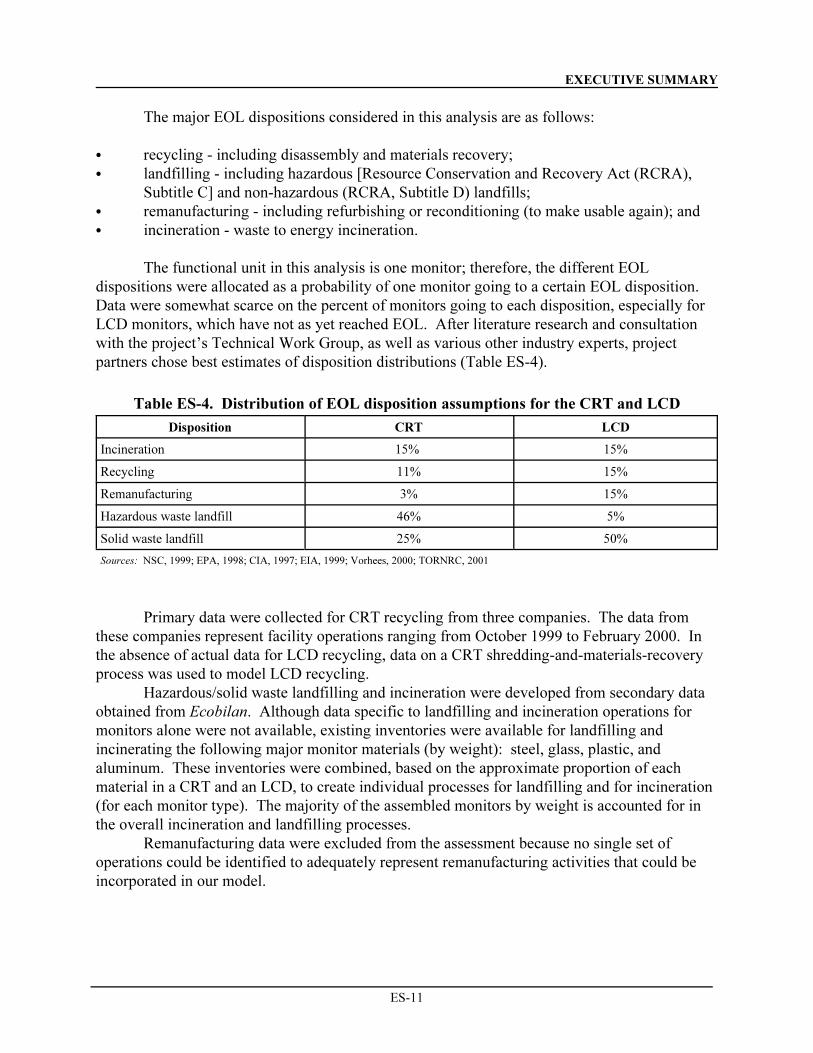
The major EOL dispositions considered in this analysis are as follows:
C recycling - including disassembly and materials recovery;
C landfilling - including hazardous [Resource Conservation and Recovery Act (RCRA),
Subtitle C] and non-hazardous (RCRA, Subtitle D) landfills;
C remanufacturing - including refurbishing or reconditioning (to make usable again); and
C incineration - waste to energy incineration.
The functional unit in this analysis is one monitor; therefore, the different EOL
dispositions were allocated as a probability of one monitor going to a certain EOL disposition.
Data were somewhat scarce on the percent of monitors going to each disposition, especially for
LCD monitors, which have not as yet reached EOL. After literature research and consultation
with the project’s Technical Work Group, as well as various other industry experts, project
partners chose best estimates of disposition distributions (Table ES-4).
Table ES-4. Distribution of EOL disposition assumptions for the CRT and LCD
Disposition CRT LCD
Incineration 15% 15%
Recycling 11% 15%
Remanufacturing 3% 15%
Hazardous waste landfill 46% 5%
Solid waste landfill 25% 50%
Sources: NSC, 1999; EPA, 1998; CIA, 1997; EIA, 1999; Vorhees, 2000; TORNRC, 2001
Primary data were collected for CRT recycling from three companies. The data from
these companies represent facility operations ranging from October 1999 to February 2000. In
the absence of actual data for LCD recycling, data on a CRT shredding-and-materials-recovery
process was used to model LCD recycling.
Hazardous/solid waste landfilling and incineration were developed from secondary data
obtained from Ecobilan. Although data specific to landfilling and incineration operations for
monitors alone were not available, existing inventories were available for landfilling and
incinerating the following major monitor materials (by weight): steel, glass, plastic, and
aluminum. These inventories were combined, based on the approximate proportion of each
material in a CRT and an LCD, to create individual processes for landfilling and for incineration
(for each monitor type). The majority of the assembled monitors by weight is accounted for in
the overall incineration and landfilling processes.
Remanufacturing data were excluded from the assessment because no single set of
operations could be identified to adequately represent remanufacturing activities that could be
incorporated in our model.
ES-11

EXECUTIVE SUMMARY
LCI Limitations and Uncertainties
Several factors contribute to the overall quality of data for each life-cycle stage. For
example, the manufacturing stage includes several different processes that were collected from
several different companies. The quality of one data set from one company may be very different
from that of another company. Relative data quality estimates have been made for each life-cycle
stage, including electricity generation, which is included in the results of more than one life-cycle
stage (Table ES-7). The table also lists the major limitations associated with each life-cycle
stage.
Table ES-7. Relative data quality and major limitations
Life-cycle stage Relative data quality Major limitations
Upstream Moderate Used only secondary data, which has undetermined
quality and not originally collected for the purpose of
the CDP.
Manufacturing Moderate to high A few data points remain in question.
Use Moderate to high Assumptions regarding use patterns were made.
EOL Low to moderate Used only secondary data for incineration and
landfilling processes; no data available for
remanufacturing process.
Electricity generation High Used secondary data, however it was collected and
modeled for the CDP, resulting in a higher quality
rating despite use of secondary data.
Although the manufacturing stage was rated in Table ES-7 as having moderate to high
data quality, some of the few data points that remained in question had large effects on the results
and are therefore described below. Of the data collected from manufacturers, several attempts
were made to verify or eliminate outliers in the data; however, uncertainty in some data remained
due to large data ranges and outliers. Specific data with the greatest uncertainty include: (1) LCD
glass manufacturing data; (2) CRT and LCD glass manufacturing energy inputs; (3) the
distribution and amount of fuel/electricity inputs for LCD module manufacturing; and (4) the use
of a large amount of liquified natural gas (LNG) as an “ancillary material” in LCD module
manufacturing and not as a fuel.
Uncertainties in the LCD glass manufacturing data stem from the fact that no LCD glass
manufacturers were willing to supply inventory data. Therefore, the LCD glass manufacturing
inventory was derived from the CRT glass manufacturing data modified to exclude leaded
compounds from the inventory. Thus, the baseline analysis in this study assumes the energy use
per kilogram of CRT glass and LCD glass are equivalent, which is uncertain. In addition to the
uncertainty in the difference between energy used to manufacture CRT glass and LCD glass, the
energy reported to produce a kilogram of CRT glass varied greatly between the three data sets
received for this project, with the highest total energy value being about 150 times that of the
smallest value. Due to this large discrepancy and because there were not enough data sets to
evaluate the data for outliers, the glass energy data were evaluated in a sensitivity analysis. The
high glass energy use values were mostly a function of liquefied petroleum gas (LPG) used as a
fuel.
ES-12

EXECUTIVE SUMMARY
Other data for which large ranges were reported, and which could be important to the
results, are energy data from LCD panel/module manufacturing. Energy data provided by six
LCD panel/module manufacturers were highly variable in both the distribution of energy sources
and the total energy required to produce one LCD panel. The percent of energy from electricity
ranged from approximately 3% to 87%, and the total energy per panel ranged from 440 MJ to
7,000 MJ. The average energy use per panel was approximately 2,270 MJ, and the standard
deviation was about 2,910 MJ.
Given the wide variability in the data and large standard deviation, CDP researchers
evaluated these data for outliers. One data set was found to be a minor outlier and another was
found to be a major outlier. These outliers were excluded from the averages used in the baseline
analysis, but included in the averages used in a sensitivity analysis (see Section 2.7.3.3).
Finally, a large amount of LNG (194 kg, on average) was reported to be used as an
ancillary material (not a fuel) in LCD panel/module manufacturing. CDP researchers confirmed
this application of LNG and the amount with the company providing the data, but it is still
uncertain due to problems in communication (e.g., the language barrier). This data point
remained in the inventory data set for LCD manufacturing, and was assumed to indeed be an
ancillary material, and not a fuel. Keeping the LNG ancillary material in the inventory will not
affect the energy impact results, since LNG used as an ancillary material is only linked to the
production of that material, and not to the use of it as a fuel.
Baseline LCI Results
Tables ES-5 and ES-6 present the total quantity of inputs and outputs for each life-cycle
stage of the CRT and LCD based on input and output types.
ES-13

EXECUTIVE SUMMARY
Table ES-5. CRT inventory by life-cycle stage
Inventory type Upstream Mfg Use EOL Total Units a
Inputs
Primary materials 1.58e+01 4.21e+02 2.19e+02 -3.32e+00 6.53e+02 kg
Ancillary materials 2.11e+00 3.54e+00 3.47e+00 1.07e+01 1.98e+01 kg
Water 5.54e+02 1.14e+04 1.14e+03 -2.73e+01 1.31e+04 kg (or L)
Fuels 8.00e+00 4.28e+02 0 -2.95e+00 4.33e+02 kg
Electricity 7.32e+01 1.29e+02 2.29e+03 2.29e-01 2.49e+03 MJ b
Total energy 3.66e+02 1.83e+04 2.29e+03 -1.28e+02 2.08e+04 MJ b
Outputs
Air pollutants 3.00e+01 1.83e+02 4.49e+02 2.47e+00 6.64e+02 kg
Wastewater 1.70e+01 1.51e+03 0 -3.65e+00 1.52e+03 kg (or L)
Water pollutants 8.12e-01 2.01e+01 7.02e-02 -6.18e-02 2.09e+01 kg
Hazardous waste 4.89e+02 1.13e+02 0 8.28e+00 9.46e+00 kg
Solid waste 9.55e+00 8.12e+01 8.33e+01 -1.66e+00 1.72e+02 kg
Radioactive waste 4.39e-04 1.80e-04 2.28e-03 2.29e-07 2.90e-03 kg
Radioactivity 3.80e+07 3.78e+06 4.80e+07 4.80e+03 8.98e+07 Bq a
Per functional unit (i.e., one CRT monitor over its effective life). b
3.6 MJ = 1 kWh
Table ES-6. LCD inventory by life-cycle stage
Inventory type Upstream Mfg Use EOL Total Units a
Inputs
Primary materials 2.35e+02 4.92e+01 8.01e+01 -2.19e+00 3.62e+02 kg
Ancillary materials 1.06e+00 2.04e+02 1.29e+00 2.11e+00 2.08e+02 kg
Water 2.63e+02 2.15e+03 4.25e+02 -1.80e+01 2.82e+03 kg
Fuels 1.47e+01 2.58e+01 0 -1.95e+00 3.86e+01 kg (or L)
Electricity 3.46e+01 3.16e+02 8.53e+02 1.62e-01 1.20e+03 MJ b
Total energy 6.33e+02 1.44e+03 8.53e+02 -8.44e+01 2.84e+03 MJ b
Outputs
Air pollutants 1.12e+02 6.48e+01 1.68e+02 1.30e+00 3.46e+02 kg
Wastewater 8.57e+00 3.12e+03 0 -2.41e+00 3.13e+03 kg
Water pollutants 4.60e-01 1.23e+00 2.62e-02 -4.09e-02 1.68e+00 kg (or L)
Hazardous waste 6.72e-03 4.64e+00 0 1.64e+00 6.29e+00 kg
Solid waste 1.31e+01 1.26e+01 3.11e+01 -4.42e+00 5.23e+01 kg
Radioactive waste 2.21e+01 3.14e+03 3.11e+01 -5.23e+00 3.19e+03 kg
Radioactivity 1.20e+07 1.02e+07 1.79e+07 3.40e+03 4.01e+07 Bq a
Per functional unit (i.e., one LCD monitor over its effective life). b
3.6 MJ = 1 kWh
ES-14

EXECUTIVE SUMMARY
The total inventory results for life-cycle inputs reveal that more primary materials,1 water,
fuels, electricity, and total energy (i.e., fuel energy plus electricity) are used throughout the CRT
life-cycle, while more ancillary materials are used throughout the LCD life-cycle. For the life-
cycle outputs, the CRT releases more air emissions; water pollutants; hazardous, solid, and
radioactive waste; and radioactivity than the LCD. The LCD releases more total wastewater than
the CRT. Complete inventory tables for each input and output type by life-cycle stage for the
CRT and LCD are provided in Appendix J.
For the CRT (Table ES-5), of the inputs measured in mass, the water inputs in the
manufacturing life-cycle stage constitute the majority of the inputs for the entire life cycle.
Water inputs from the LPG production process constitute almost 80% of the water inputs for all
life-cycle stages. In this inventory, the LPG is used in large quantities as a fuel in CRT glass
manufacturing. When considering which life-cycle stage contributes most to an inventory
category, the manufacturing stage has the largest inventory by mass for primary materials,
ancillary materials, water inputs, and fuel inputs. This is also due to the production of LPG as
needed for CRT glass production. Fuel inputs are dominated by the manufacturing stage and
electricity inputs are dominated by the use stage. The total energy (which is calculated by
converting the mass of the fuel into units of energy and combining the fuel energy with the
electrical energy) is dominated by the manufacturing life-cycle stage, again mostly due to the
large LPG fuel energy used in CRT glass production.
CRT outputs measured in mass include air emissions, wastewater, water pollutants, and
hazardous, solid, and radioactive waste. Wastewater, by mass (or volume), constitutes the
greatest output; however, total wastewater volume is not used to calculate water-related impacts.
Instead, individual water pollutants are used to calculate water-related impacts. Of the remaining
outputs measured in mass, which are used to calculate impacts (i.e., air emissions, and hazardous,
solid and radioactive waste), air emissions are the greatest contributor to outputs in mass. Note
that radioactivity is measured in Bequerels (Bq) and cannot be compared on the same scale.
Considering each CRT inventory type and their contributions by life-cycle stage, the mass
of wastewater and water pollutants are greatest in the manufacturing life-cycle stage (again due to
LPG consumption). The outputs of air emissions, hazardous waste, solid waste, radioactive
waste, and radioactivity all have the greatest contribution from the use stage.
For the CRT outputs, all the totals represented in Table ES-5 include outputs to all
dispositions. For example, water outputs sent offsite to treatment as well as those directly
discharged to surface waters are all included. Similarly, hazardous, solid and radioactive waste
outputs may be landfilled, treated, or recycled. The inventory shows these as totals; however,
when impacts are calculated, the dispositions dictate which inventory items will be used to
calculate impacts (Chapter 3).
For the LCD (Table ES-6), of the inputs measured in mass, the water inputs constitute the
majority of the inputs for the entire life cycle, and most of the water inputs are in the
manufacturing life-cycle stage. When considering which life-cycle stage contributes most to an
inventory category, the manufacturing stage has the largest inventory by mass for ancillary
materials, fuels, and water inputs. Primary material inputs are dominated by the upstream stages,
1 Note that the total mass of primary materials includes the inputs to each process, which may duplicate
materials used in processes subsequent to other processes. For example, the primary materials used in steel
production are added to the steel used as a primary material for monitor assembly.
ES-15

EXECUTIVE SUMMARY
while electricity inputs are dominated by the use stage. The total energy is dominated by the
manufacturing life-cycle stage. Note that LPG production from glass manufacturing does not
dominate much of the LCD inventory as it did for the CRT, because of the smaller amount of
glass used in the LCD compared to the CRT.
Of the LCD outputs measured in mass (air emissions, wastewater, water pollutants and
hazardous, solid, and radioactive waste), wastewater constitutes the greatest output; however,
total wastewater volume alone is not used to calculate impacts. Of the remaining outputs
measured in mass, which are used to calculate impacts (i.e., air emissions, water pollutants, and
hazardous, solid and radioactive waste), air emissions are the greatest contributor to the outputs.
Note again, as mentioned for the CRT, that radioactivity is measured in Bequerels (Bq) and
cannot be compared on the same scale.
Considering each LCD output type and their contributions by life-cycle stage, the mass of
water pollutants is greatest in the manufacturing life-cycle stage, due to the fuel production
processes that support fuel consumption in the manufacturing processes being included in the
manufacturing life-cycle stage. Wastewater and hazardous waste outputs are greatest in the
manufacturing stage; air emissions, solid waste, radioactive waste, and radioactivity have the
greatest contribution from the use stage. As with the CRT, all the output totals represented in
Table ES-6 include outputs to all dispositions.
III. LIFE-CYCLE IMPACT ASSESSMENT (LCIA)
LCIA Methodology
LCIA involves the translation of the environmental burdens identified in the LCI into
environmental impacts. LCIA does not seek to determine actual impacts, but rather to link the
data gathered from the LCI to impact categories and to quantify the relative magnitude of
contribution to the impact category (Fava et al., 1993; Barnthouse et al., 1997). Further, impacts
in different impact categories are generally calculated based on differing scales and therefore
cannot be directly compared.
Within LCA, the LCI is a well established methodology; however, LCIA methods are less
well defined and continue to evolve (Barnthouse et al.,1997; Fava et al., 1993). For toxicity
impacts in particular, there are some methods being applied in practice (e.g., toxicity potentials,
critical volume, and direct valuation) (Guinee et al., 1996; ILSI, 1996; Curran, 1996), while
others are in development. However, there is currently no general consensus among the LCA
community as to one method over another.
The UT LCIA methodology employed in this study calculates life-cycle impact category
indicators for a number of traditional impact categories, such as global warming, stratospheric
ozone depletion, photochemical smog, and energy consumption. Furthermore, the method
calculates relative category indicators for potential chronic human health, aquatic ecotoxicity,
and terrestrial ecotoxicity impacts in order to address project partner’s interest in human and
ecological toxicity and to fill a common gap in LCIAs.
LCIAs generally classify the consumption and loading data from the inventory stage into
various impact categories (know as “classification”). “Characterization” methods are then used
to quantify the magnitude of the contribution that loading or consumption could have in
producing the associated impact. The impact categories included in the CDP LCIA are as
ES-16

EXECUTIVE SUMMARY
follows: renewable resource use, nonrenewable materials use/depletion, energy use, solid waste
landfill use, hazardous waste landfill use, radioactive waste landfill use, global warming,
stratospheric ozone depletion, photochemical smog, acidification, air quality (particulate matter
loading), water eutrophication (nutrient enrichment), water quality (biological oxygen demand
[BOD] and total suspended solids [TSS]), radioactivity, chronic human health effects
(occupational and public), aesthetic impacts (odor), aquatic ecotoxicity, and terrestrial
ecotoxicity.
Classification of an inventory item into impact categories depends on whether the
inventory item is an input or output, what the disposition of the output is, and in some cases the
material properties of the inventory item. Outputs with direct release dispositions are classified
into impact categories for which impacts will be calculated in the characterization phase of the
LCIA. Outputs sent to treatment or recycle/reuse are considered inputs to treatment or
recycle/reuse processes and impacts are not calculated until direct releases from these processes
occur. Once impact categories for each inventory item are classified, life-cycle impact category
indicators are quantitatively estimated through the characterization step.
The characterization step of LCIA includes the conversion and aggregation of LCI results
to common units within an impact category. Different assessment tools are used to quantify the
magnitude of potential impacts, depending on the impact category. Three types of approaches
are used in the characterization method for the CDP:
C Loading - An impact score is based on the inventory amount (e.g., resource use).
C Equivalency - An impact score is based on the inventory amount weighed by a certain
effect, equivalent to a reference chemical [e.g., global warming impacts relative to carbon
dioxide (CO2)].
- Full equivalency - all substances are addressed in a unified, technical model.
- Partial equivalency - a subset of substances can be converted into equivalency
factors.
C Scoring of inherent properties - An impact score is based on the inventory amount
weighed by a score representing a certain effect for a specific material (e.g., toxicity
impacts are weighed using a toxicity scoring method).
The scoring of inherent properties method is employed for the human and ecological
toxicity impact categories, based on the CHEMS-1 method described by Swanson et al. (1997).
The scoring method provides a hazard value (HV) for each potentially toxic material, which is
then multiplied by the inventory amount to calculate the toxicity impact score.
Using the various approaches, the UT LCIA method calculates impact scores for each
inventory item for each applicable impact category. Impact scores are therefore based on either a
direct measure of the inventory amount or some modification (e.g., equivalency or scoring) of
that amount based on the potential effect the inventory item may have on a particular impact
category. The specific calculation methods for each impact category are detailed in Chapter 3.
Impact scores are then aggregated within each impact category to calculate the various life-cycle
impact category indicators.
ES-17

EXECUTIVE SUMMARY
General LCIA Methodology Limitations and Uncertainties
The purpose of an LCIA is to evaluate the relative potential impacts of a product system
for various impact categories. There is no intent to measure the actual impacts or provide spatial
or temporal relationships linking the inventory to specific impacts. The LCIA is intended to
provide a screening-level evaluation of impacts. In addition to lacking temporal or spatial
relationships and providing only relative impacts, LCA is also limited by the availability and
quality of the inventory data. Data collection can be very time consuming and expensive.
Confidentiality issues may also inhibit the availability of primary data.
Uncertainties are inherent in each parameter used to calculate impacts. For example,
toxicity data require extrapolations from animals to humans and from high to low doses (for
chronic effects) and can have a high degree of uncertainty.
Uncertainties also are inherent in chemical ranking and scoring systems, such as the
scoring of inherent properties approach used for human health and ecotoxicity effects. In
particular, systems that do not consider the fate and transport of chemicals in the environment
can contribute to misclassifications of chemicals with respect to risk. Also, uncertainty is
introduced where it was assumed that all chronic endpoints are equivalent, which is likely not the
case. The human health and ecotoxicity impact characterization methods presented here are
screening tools that cannot substitute for more detailed risk characterization methods. However,
it should be noted that in LCA, chemical toxicity is often not considered at all. This
methodology is an attempt to consider chemical toxicity where it is often ignored.
Uncertainty in the inventory data depends on the responses to the data collection
questionnaires and other limitations identified during inventory data collection. These
uncertainties are carried into impact assessment. In this LCA, there was uncertainty in the
inventory data, which included but was not limited to the following:
C missing individual inventory items,
C missing processes or sets of data,
C measurement uncertainty,
C estimation uncertainty,
C allocation uncertainty/working with aggregated data, and
C unspeciated chemical data.
The goal definition and scoping process helped reduce the uncertainty from missing data,
although it is certain that some missing data still exist. As far as possible, the remaining
uncertainties were reduced primarily through quality assurance/quality control measures (e.g.,
performing systematic double-checks of all calculations on manipulated data).
Baseline LCIA Results
Table ES-8 presents the baseline CRT and LCD LCIA indicator results for each impact
category. Appendix M presents complete LCIA results by material, process, and life-cycle stage.
The indicator results presented in Table ES-8 are the result of the characterization step of LCIA
methodology where LCI results are converted to common units and aggregated within an impact
ES-18

EXECUTIVE SUMMARY
category. Note that the impact category indicator results are in a number of different units and
therefore can not be summed or compared across impact categories.
As shown in the table, under the baseline conditions the CRT indicators are greater than
the LCD indicators in the following categories: renewable resource use, nonrenewable resource
use, energy use, solid waste landfill use, hazardous waste landfill use, radioactive waste landfill
use, global warming, ozone depletion, photochemical smog, acidification, air particulates,
biological oxygen demand (BOD), total suspended solids (TSS), radioactivity, chronic public
health effects, chronic occupational health effects, aesthetics, and terrestrial toxicity. The LCD
indicators are greater than the CRT indicators in the following categories: water eutrophication
and aquatic toxicity. In addition, as noted in Table ES-8, if phased-out substances are removed
from the CRT and LCD inventories, the LCD ozone depletion indicator would exceed that of the
CRT. Details of each impact category and major contributors to the impacts in those categories
are presented in Chapter 3.
Summary of Top Contributors by Impact Category
Tables ES-9 and ES-10 summarize the top contributors to CRT and LCD life-cycle
impacts by impact category. As shown in Table ES-9, CRT impacts are largely driven by two
factors: (1) the large amount of LPG fuel used in CRT glass/frit manufacturing, and (2) the
relatively large amount of electricity consumed during the use stage. The LPG production
process yields the CRT’s top contributor in eight of 20 impact categories. Most of this LPG is
used as a fuel source in CRT glass manufacturing in the glass/frit process group, which, in turn,
produces the top contributor to two of 20 impact categories. Thus, LPG used in the glass/frit
process group (primarily CRT glass manufacturing) is ultimately the key driver for CRT impacts
in ten categories. Similarly, outputs from electricity generation during the use stage result in the
Table ES-8. Baseline life-cycle impact category indicatorsa
Impact category Units per monitor CRT LCD
Renewable resource use kg 1.31E+04 2.80E+03
Nonrenewable resource use kg 6.68E+02 3.64E+02
Energy use MJ 2.08E+04 2.84E+03
Solid waste landfill use m 3 1.67E-01 5.43E-02
Hazardous waste landfill use m 3 1.68E-02 3.61E-03
Radioactive waste landfill use m 3 1.81E-04 9.22E-05
Global warming kg-CO2 equivalents 6.95E+02 5.93E+02
Ozone depletion kg-CFC-11 equivalents 2.05E-05b,c 1.37E-05b
Photochemical smog kg-ethene equivalents 1.71E-01 1.41E-01
Acidification kg-SO2 equivalents 5.25E+00 2.96E+00
Air particulates kg 3.01E-01 1.15E-01
Water eutrophication kg-phosphate equivalents 4.82E-02 4.96E-02
Water quality, BOD kg 1.95E-01 2.83E-02
Water quality, TSS kg 8.74E-01 6.15E-02
Radioactivity Bq 3.85E+07d 1.22E+07d
ES-19

c
EXECUTIVE SUMMARY
Table ES-8. Baseline life-cycle impact category indicatorsa
Impact category Units per monitor CRT LCD
Chronic health effects, occupational tox-kg 9.34E+02 6.96E+02
Chronic health effects, public tox-kg 1.98E+03 9.02E+02
Aesthetics (odor) m 3 7.58E+06 5.04E+06
Aquatic toxicity tox-kg 2.25E-01 5.19E+00
Terrestrial toxicity tox-kg 1.97E+03 8.94E+02 a
Bold indicates the larger value within an impact category when comparing the CRT and LCD. b
Several of the substances included in this category were phased out of production by January 1, 1996. Excluding
phased out substances decreases the CRT ozone depletion indicator to 1.09E-05 kg CFC-11 equivalents per monitor
and the LCD ozone depletion indicator to 1.18E-05 kg CFC-11 equivalents per monitor. These ozone depletion
indicators are probably more representative of the CDP temporal boundaries and current operating practices. See
section 3.3.6 for details.
Although the CRT indicator appears larger than the LCD indicator, uncertainties in the inventory make it difficult
to determine which monitor has the greater value. Therefore, this value is not shown in bold. d
Radioactivity impacts are being driven by radioactive releases from nuclear fuel reprocessing in France, which are
included in the electricity data in some of the upstream, materials processing data sets. See section 3.3.12 for details.
top contributor to seven CRT impact categories. Note that in 14 of the 20 impact categories, the
top contributor to CRT impacts is responsible for more than 50% of impacts.
LCD impacts are not as dominated by a few data points, but a few processes (LCD
monitor/module manufacturing and electricity generation in the use stage) are responsible for a
large percent of the impacts. As shown in Table ES-10, both of these processes result in the top
contributors to six LCD impact categories each. In addition, the process to produce LNG used as
an ancillary material in LCD monitor/module manufacturing is the top contributor to an
additional impact category (photochemical smog). Note that in 11 of the 20 impact categories,
the top contributor to LCD impacts is responsible for more than 50% of impacts.
As a number of the impact results for both monitor types, and for the CRT in particular,
are being driven by a few data points with relatively high uncertainty, sensitivity analyses of the
baseline results were also conducted.
Table ES-9. Summary of top contributors to CRT impacts by impact category
Impact category Top contributors
Life-cycle
stage
Process group Material Contribution
to impact
score
Renewable resource
use
Manufacturing LPG production water 79%
Nonrenewable
resource use
Manufacturing LPG production Petroleum (in ground) 56%
Energy use Manufacturing CRT glass/frit mfg. Liquefied petroleum
gas
72%
Solid waste landfill
use
Use U.S. electric grid Coal waste 38%
ES-20

EXECUTIVE SUMMARY
Table ES-9. Summary of top contributors to CRT impacts by impact category
Impact category Top contributors
Life-cycle
stage
Process group Material Contribution
to impact
score
Hazardous waste
landfill use
End-of-life CRT landfilling EOL CRT monitor,
landfilled
91%
Radioactive waste
landfill use
Use U.S. electric grid Low-level radioactive
waste
61%
Global warming Use U.S. electric grid Carbon dioxide 64%
Ozone depletion Use U.S. electric grid Bromomethane 49%
Photochemical smog Manufacturing LPG production Hydrocarbons,
unspeciated
36%
Acidification Use U.S. electric grid Sulfur dioxide 47%
Air particulates Manufacturing LPG production PM 43%
Water eutrophication Manufacturing LPG production COD 72%
Water quality, BOD Manufacturing LPG production BOD 96%
Water quality, TSS Manufacturing LPG production Suspended solids 97%
Radioactivity Materials
Processing
Steel production, cold-
rolled, semi-finished
Plutonium-241
(isotope)
62%
Chronic health effects,
occupational
Manufacturing CRT glass/frit
manufacturing
Liquefied petroleum
gas
78%
Chronic health effects,
public
Use U.S. electric grid Sulfur dioxide 83%
Aesthetics (odor) Manufacturing LPG production Hydrogen sulfide 94%
Aquatic toxicity Manufacturing CRT tube
manufacturing
Phosphorus
(yellow or white)
26%
Terrestrial toxicity Use U.S. electric grid Sulfur dioxide 83%
Table ES-10. Summary of top contributors to LCD impacts by impact category
Impact category Top contributors
Life-cycle stage Process group Material Contribution
to impact
score
Renewable resource
use
Manufacturing LCD monitor/module mfg. Water 38%
Nonrenewable resource
use
Materials
processing
Natural gas production Natural gas
(in ground)
65%
Energy use Use LCD monitor use Electricity 30%
Solid waste landfill use Use U.S. electric grid Coal waste 44%
Hazardous waste
landfill use
End-of-life LCD landfilling EOL LCD
monitor,
landfilled
97%
Radioactive waste
landfill use
Use U.S. electric grid Low-level
radioactive waste
44%
ES-21

EXECUTIVE SUMMARY
Table ES-10. Summary of top contributors to LCD impacts by impact category
Impact category Top contributors
Life-cycle stage Process group Material Contribution
to impact
score
Global warming Manufacturing LCD monitor/module mfg. Sulfur
hexafluoride
29%
Ozone depletion Manufacturing LCD panel components
manufacturing
HCFC-225cb 34%
Photochemical smog Materials
processing
Natural gas production Nonmethane
hydrocarbons,
unspeciated
45%
Acidification Use U.S. electric grid Sulfur dioxide 31%
Air particulates Materials
processing
Steel production, cold-
rolled, semi-finished
PM 45%
Water eutrophication Manufacturing LCD monitor/module mfg. Nitrogen 67%
Water quality, BOD Manufacturing LCD monitor/module mfg. BOD 61%
Water quality, TSS Manufacturing LPG production Suspended solids 66%
Radioactivity Materials
processing
Steel production, cold-
rolled, semi-finished
Plutonium-241
(isotope)
96%
Chronic health effects,
occupational
Manufacturing LCD monitor/module mfg. Liquefied natural
gas
58%
Chronic health effects,
public
Use U.S. electric grid Sulfur dioxide 68%
Aesthetics (odor) Manufacturing LPG production Hydrogen sulfide 94%
Aquatic toxicity Manufacturing LCD monitor/module mfg. Phosphorus
(yellow or white)
98%
Terrestrial toxicity Use U.S. electric grid Sulfur dioxide 68%
Sensitivity Analyses
Due to assumptions and uncertainties in this LCA, as in any LCA, the following
sensitivity analyses of the baseline results were conducted: use stage manufactured life scenario,
modified glass energy assumptions, modified LCD module manufacturing energy assumptions,
and modified LCD EOL distribution assumptions. The sensitivity analyses were chosen because
they evaluated data with either the greatest uncertainties or with large uncertainty and major
contributors to the inventory results. Table ES-11 shows the different sensitivity analyses or
scenarios that are considered in the impact assessment results.
ES-22

EXECUTIVE SUMMARY
Table ES-11. List of sensitivity analysis scenarios
Monitor
type
Sensitivity analysis scenario
Baseline analyses (for reference)
CRT
LCD
Effective life scenario with average glass energy inputs (all glass manufacturing energy data used)
Effective life scenario with average glass energy inputs (all glass manufacturing energy data used)
and outliers in the LCD module manufacturing energy data removed
Sensitivity analyses
CRT
LCD
Manufactured life scenario same as baseline except lifespan is based on manufactured life instead of
effective life, which results in some revised functional equivalency calculations
Manufactured life scenario same as baseline except lifespan is based on manufactured life, which
results in some revised functional equivalency calculations
CRT
LCD
Modified glass energy scenario same as baseline except comparatively high glass manufacturing
energy inputs are removed
Modified glass energy scenario same as baseline except comparatively high glass manufacturing
energy inputs are removed
LCD Modified LCD module energy scenario same as baseline except LCD monitor/ module manufacturing
energy outliers are included in the average
LCD Modified LCD EOL scenario same as baseline except LCD EOL dispositions are modified
Based on the sensitivity analyses, it appears that CRT life-cycle impacts are highly
sensitive to the glass energy data, and less sensitive to the lifespan assumptions (lifespan
assumptions greatly affect the magnitude of CRT life-cycle impacts, but they do not greatly affect
the distribution of impacts among life-cycle stages). LCD impacts are less sensitive to the glass
energy data and in fact are not greatly affected by any of the sensitivity analysis scenarios, except
the longer lifespan under the manufactured life scenario.
Sensitivity results are also useful to interested members of the public who may be
evaluating the relative impacts of different monitor types and are interested in whether the CRT
or LCD has greater life-cycle impacts in any given impact category. Table ES-12 presents the
monitor type with greatest impacts by impact category and by scenario. This information helps
us determine whether major assumptions (e.g., the monitor lifespan and LCD EOL distribution
assumptions) or uncertain data (e.g., glass energy data and LCD monitor manufacturing energy)
are driving results. As shown in the table, the modified glass energy scenario is the only scenario
that significantly changes from the baseline. Under this scenario, life-cycle impact results in
seven categories reverse direction from the baseline assessment, such that the LCD has greater
impacts than the CRT. Therefore, under this scenario, a total of nine out of 20 categories are
greater for the LCD than the CRT, compared to two out of 20 categories under the baseline
scenario. The only other scenario that affects these results is the manufactured life scenario,
when impacts in the water eutrophication category are greater for the CRT than the LCD.
ES-23

EXECUTIVE SUMMARY
Table ES-12. Summary of CRT and LCD LCIA results
Impact category Monitor type with greatest impacts by scenario
Baseline Manu
factured
life
Modified
glass energy
Modified
LCD module
energy
Modified
LCD EOL
distributiona
Renewable resource use CRT CRT CRT CRT CRT
Nonrenewable resource use CRT CRT LCD CRT CRT
Energy use CRT CRT CRT CRT CRT
Solid waste landfill use CRT CRT CRT CRT CRT
Hazardous waste landfill use CRT CRT CRT CRT CRT
Radioactive waste landfill use CRT CRT CRT CRT CRT
Global warming CRT CRT LCD CRT CRT
Ozone depletion b b b b b
Photochemical smog CRT CRT LCD CRT CRT
Acidification CRT CRT CRT CRT CRT
Air particulates CRT CRT CRT CRT CRT
Water eutrophication LCD CRT LCD LCD LCD
Water quality, BOD CRT CRT LCD CRT CRT
Water quality, TSS CRT CRT LCD CRT CRT
Radioactivity CRT CRT CRT CRT CRT
Chronic health effects, occupational CRT CRT LCD CRT CRT
Chronic health effects, public CRT CRT CRT CRT CRT
Aesthetics (odor) CRT CRT LCD CRT CRT
Aquatic toxicity LCD LCD LCD LCD LCD
Terrestrial toxicity CRT CRT CRT CRT CRT a Based on a qualitative evaluation, not quantitative results. b CRT impacts are greater than LCD impacts in this category when all data are included in the inventories, including
data for substances that have been phased out. However, LCD impacts are greater than CRT impacts when phased
out substances are removed from the inventories (see Section 3.3.6).
IV. QUALITATIVE RISK SCREENING OF SELECTED CHEMICALS
The scope of the DfE CDP included a streamlined Cleaner Technologies Substitutes
Assessment (CTSA) component to perform a qualitative risk screening of specific materials or
processes. Traditionally, the DfE Program has conducted CTSAs that perform detailed risk
characterizations of alternative chemical processes. The streamlined CTSA for the CDP takes a
more detailed look than the LCA at the toxic effects of chemicals used in a process, without
conducting a complete risk characterization typical of past CTSAs.
Within the human and environmental health effects impact categories of the LCIA, the
input and output amounts are used as surrogates for exposure. The additional CTSA-related
analyses are intended to better understand the potential exposures to those materials, during any
processes that use those materials, in order to try to better understand potential chemical risks.
Lead, mercury, and liquid crystals were selected by the CDP Core Group for further
analysis. These materials were selected for their known or suspected toxicity to humans and the
ES-24

EXECUTIVE SUMMARY
environment, or because they are of particular interest to industry or the U.S. EPA. The analysis
of each material summarized or evaluated the following key areas:
C Use of the materials in computer displays;
C Life-cycle inputs and outputs of the materials from computer displays;
C Life-cycle impacts associated with the material inputs and outputs;
C Potential exposures to the material including occupational, public, and ecological
exposures;
C Potential human health effects;
C U.S. environmental regulations for the material; and
C Alternatives to reduce the use of the material in computer displays.
The following are the conclusions drawn from the analyses of lead, mercury, and liquid crystal
use in the life cycle of both CRTs and LCDs.
Lead
Lead is found in glass components of CRTs, as well as in electronics components (printed
wiring boards and their components) of both CRTs and LCDs. It is also a top priority toxic
material at the U.S. EPA and the subject of electronics industry efforts to reduce or eliminate its
use. The following conclusions were drawn from a focused look at lead’s role in the life cycle of
the computer display, and its effects on human health and the environment:
• Due to the much greater quantity of lead in the CRT than the LCD, lead-based life-cycle
impacts from the CRT ranged from moderately to significantly greater than those from
the LCD in every category, with the exception of solid waste landfill use. The most
significant difference was in non-renewable resource consumption, where the CRT
consumed over 40 thousand times the mass of non-renewable resources attributable to
lead over the course of its life cycle than those consumed by the LCD. Other categories
where CRTs had notably greater differences in impacts occurred in hazardous waste
landfill use, chronic public health effects, and terrestrial toxicity.
• Contributions of lead-based impacts are small relative to the total life-cycle impacts from
other materials in the CRT (e.g., glass, copper wire), with the greatest impacts from lead-
based CRT outputs occurring in the categories of non-renewable resources, aquatic
toxicity, and chronic public health effects (ranging from 0.1 to 0.2% of the overall impact
scores in each category).
• For workers, inhalation is the most likely route of exposure to lead which may result in
health concerns. General population exposure to lead is most likely to come from
incidental ingestion of lead in the soil, or ingestion of lead brought into the household on
workers clothing or on shoes. Studies have discovered potentially high concentrations of
lead in households within close proximity to certain facilities that use lead.
• Significant worker exposures to lead have been documented by existing studies of several
processes which contribute to the life-cycle of the computer displays (e.g., lead smelting).
These exposures have been as high as 90 times the OSHA recommended safety levels for
exposure to workers at lead smelters. The resulting occupational chronic health effects to
ES-25

EXECUTIVE SUMMARY
workers from lead exposure likely have been underestimated by the CDP LCIA
methodology, which uses material inputs, and not outputs, as surrogates for exposure.
• Lead and lead compounds pose serious chronic health hazards to humans who may
become over-exposed either in the workplace, or through the ambient environment. Lead
exposure is associated with a range of adverse human health effects, including effects on
the nervous system, reproductive and developmental problems, and cancer. Lead persists
in the environment, but is relatively immobile in water under most surface and
groundwater conditions.
• Alternatives are being developed, such as lead-free solders and glass components, that
will potentially minimize the future lead content in both CRTs and LCDs.
Mercury
Mercury is contained within the fluorescent tubes that provide the source of light in the
LCD. Mercury is also emitted from some fuel combustion processes, such as coal-fired
electricity generation processes, which contribute to the life-cycle impacts of both CRTs and
LCDs. EPA’s concern with mercury and the potential for exposure during manufacturing and
end-of-life processes warranted a more detailed analysis of mercury in the CDP. The following
conclusions were drawn from a focused look at mercury’s role in the life cycle of the computer
display, and its effects on human health and the environment:
• The mercury emitted from the generation of power consumed by the CRT (7.75 mg)
exceeds the entire amount of mercury emissions from the LCD, including both the
mercury used in LCD backlights (3.99 mg) and the mercury emissions from electricity
generation (3.22 mg). Although this was not expected because mercury is used
intentionally in an LCD, but not in a CRT, the results are not surprising since mercury
emissions from coal-fired power plants are known to be one of the largest anthropogenic
sources of mercury in the United States. Because the CRT consumes significantly more
electricity in the use stage than the LCD, its use stage emissions of mercury are
proportionately higher than those of the LCD.
• Contributions from mercury-based impacts are not significant relative to the total life-
cycle impacts from other materials (e.g., glass, copper wire) in the CRT or LCD, with the
greatest impacts from mercury-based outputs occurring in the aquatic toxicity category
(0.4% for CRTs, 0.01% for LCDs).
• Possible pathways of worker exposure during backlight fabrication include inhalation of
mercury vapors, and dermal exposure or ingestion of mercury on skin. The most likely
pathway for general population exposure is inhalation of mercury released into the air.
• Exposure data relevant to the manufacturing of mercury backlights were not available,
therefore specific conclusions about the potential magnitude of worker exposures could
not be made. Occupational chronic health effects to workers from mercury exposures
calculated during the impact assessment (3.99e-06 tox-kg for LCD, none for CRT) likely
have been underestimated by the CDP LCIA methodology, which uses material inputs as
surrogates for exposure.
• Mercury and mercury compounds pose serious chronic health hazards to humans who are
exposed. EPA has determined that mercury chloride and methyl mercury are possible
ES-26

EXECUTIVE SUMMARY
human carcinogens. Mercury poses serious chronic health hazards to humans, affecting
the nervous system, brain, and kidneys.
• Alternative backlights have been developed that not only eliminate mercury from the
light, but also improve on many of the optical characteristics of the displays. Current
development is focused on improving the energy efficiency of the alternative lights.
Liquid Crystals
Liquid crystals (LCs) are organic compounds responsible for generating the image in an
LCD. LCs are not present in CRTs. The toxicity of the LCs in LCDs has been alluded to in the
literature, yet there is very little known about the toxicity of these materials. By including LCs in
a more detailed analysis, this section attempted to better characterize any potential hazard and/or
potential exposure of LCs from the manufacturing, use, and disposal of LCD monitors. The
following conclusions were drawn from a focused look at LC’s role in the life cycle of the
computer display, and its effects on human health and the environment.
• LCs are combined into mixtures of as many as 20 or more compounds selected from
hundreds of potential liquid crystal compounds. Because of the possible variations in
mixtures and the sheer number of compounds available, a select number of liquid crystals
were used to assess potential human health hazards.
• LCs do not appear to contribute significantly to any of the impact categories defined for
this study. The total score for LCD occupational impacts based on potential worker
exposure to LCs of 4.18 tox-grams, calculated using default toxicity values, represents
less than 0.01% of the total overall chronic occupational health effects impact score of
898 tox-kg for the functional unit of one LCD.
• Impacts were not calculated for LC releases in the CDP LCIA because data regarding LC
outputs were not available to the project. LCs are not used to fabricate CRTs and so
have no environmental impacts in the CRT life cycle.
• Occupational exposures to LCs during the fabrication of the LCD panels are not expected
to be significant. The enclosed nature of the chamber in which the LCDs are assembled,
combined with the equipment (e.g., gloves, aprons) worn by workers in a clean room
environment, are both expected to act to minimize exposures. Other occupational
exposures may exist that have not been identified.
• Toxicological testing by a manufacturer of LC substances and mixtures showed that
95.6% (562 of 588) of the liquid crystals tested displayed no acute toxic potential to
humans. Twenty-five of the remaining twenty-six chemicals had the potential to exhibit
harmful effects to humans, while the remaining crystal was classified as toxic (EU
classification) and thus was discontinued. An EPA review of toxicity data for the
confidential LC compounds was unable to identify any relevant toxicity information.
Insufficient toxicity data exist to assess the toxicity of specific LC compounds.
• Testing for mutagenic and carcinogenic effects by the supplier showed that 99.9% (614
out of 615) of the liquid crystal compounds tested displayed no mutagenic effects. The
remaining chemical that showed mutagenic potential was excluded from further
development. Additionally, mutagenicity testing of ten LC substances using mammalian
cells showed no suspicion of mutagenic potential.
ES-27
EXECUTIVE SUMMARY
V. SUMMARY AND CONCLUSIONS
The purpose of the CDP, as stated in Chapter 1, is to provide a scientific baseline of life-
cycle environmental impacts of CRTs and LCDs, and to develop a life-cycle model for future
analyses. The primary targeted audience is the electronics industry, for whom results may
provide insight into improvement opportunities in the life cycle of CRTs and/or LCDs. In
addition, the general public may also find results useful when considering environmental impacts
of each display type. This report, however, does not include direct comparative assertions or
improvement assessments based on the results. Alternatively, results and conclusions are
described in terms of the overall LCI versus the LCIA, and details of the impact assessment,
including the additional assessments of lead, mercury and liquid crystals, and the sensitivity
analyses. Major uncertainties, cost and performance considerations, suggestions for
improvement opportunities, and suggestions for further research are also provided.
LCI vs. LCIA
Inventory data provide information on how much material is being consumed in the life
cycle (i.e., inputs) and how much material is generated/released (i.e., outputs). The LCI alone,
however, does not always translate directly into impact categories that may be of interest.
Impacts are sometimes driven by materials other than the top inventory contributors. For
example, the top air emission for LCDs is carbon dioxide, however the greatest global warming
impact score is from SF6 in the LCD monitor/module manufacturing process.
Some impact categories associated with ancillary materials and water pollutant inventory
types had different outcomes in the LCI versus the LCIA. For example, the three impact
categories affected by the ancillary materials inventory had greater impacts for the CRT (Table
ES-8), although the ancillary material inventory had greater amounts of inputs for the LCD (see
Tables ES-5 and ES-6). In this case, both primary and ancillary materials contribute to the
impact categories, contributing to the differing results.
In addition, the LCD had greater inventory amounts of wastewater outputs than the CRT;
however, the impacts related to water releases are in some cases greater for the CRT than the
LCD. In the LCIA, the LCD has greater impacts for water eutrophication and aquatic toxicity,
but not for the two water quality categories (BOD and TSS), chronic health effects to the public,
nor terrestrial toxicity, all of which include water emissions in calculating the impact score.
These results show that the inventory results may not directly translate into impact results.
CRT and LCD Baseline LCIA Results
The LCIA results showed that the CRT has greater total life-cycle impact indicators than
the LCD in most of the impact categories (see Table ES-8). In the baseline scenario, the CRT
has greater impacts than the LCD in all but two impact categories (eutrophication and aquatic
toxicity). However, note that for the ozone depletion category, the LCIs for both the CRT and
LCD contain data for substances that were phased out of production by 1996 due to their ozone
depletion potential. Whether these emissions still occur in countries that were signatories to the
Montreal Protocol and its Amendments and Adjustments (such as the United States and Japan) is
not known, but considered to be unlikely. When phased-out substances are included in the
ES-28
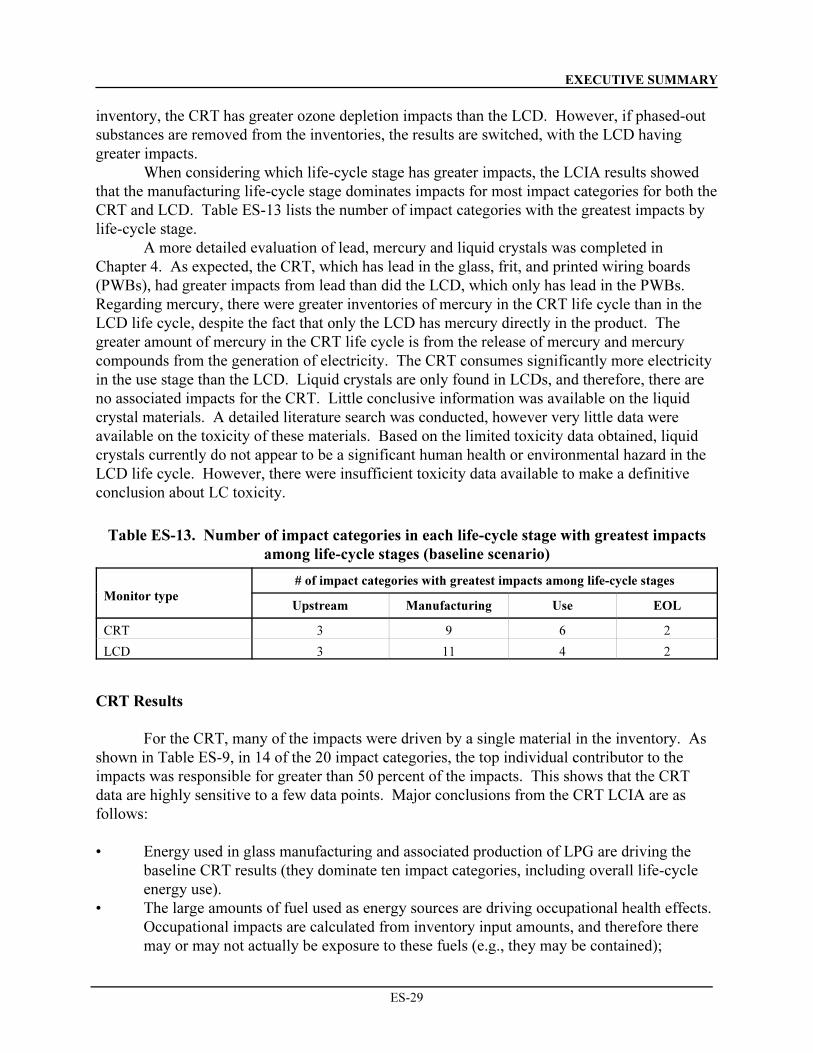
EXECUTIVE SUMMARY
inventory, the CRT has greater ozone depletion impacts than the LCD. However, if phased-out
substances are removed from the inventories, the results are switched, with the LCD having
greater impacts.
When considering which life-cycle stage has greater impacts, the LCIA results showed
that the manufacturing life-cycle stage dominates impacts for most impact categories for both the
CRT and LCD. Table ES-13 lists the number of impact categories with the greatest impacts by
life-cycle stage.
A more detailed evaluation of lead, mercury and liquid crystals was completed in
Chapter 4. As expected, the CRT, which has lead in the glass, frit, and printed wiring boards
(PWBs), had greater impacts from lead than did the LCD, which only has lead in the PWBs.
Regarding mercury, there were greater inventories of mercury in the CRT life cycle than in the
LCD life cycle, despite the fact that only the LCD has mercury directly in the product. The
greater amount of mercury in the CRT life cycle is from the release of mercury and mercury
compounds from the generation of electricity. The CRT consumes significantly more electricity
in the use stage than the LCD. Liquid crystals are only found in LCDs, and therefore, there are
no associated impacts for the CRT. Little conclusive information was available on the liquid
crystal materials. A detailed literature search was conducted, however very little data were
available on the toxicity of these materials. Based on the limited toxicity data obtained, liquid
crystals currently do not appear to be a significant human health or environmental hazard in the
LCD life cycle. However, there were insufficient toxicity data available to make a definitive
conclusion about LC toxicity.
Table ES-13. Number of impact categories in each life-cycle stage with greatest impacts
among life-cycle stages (baseline scenario)
Monitor type
# of impact categories with greatest impacts among life-cycle stages
Upstream Manufacturing Use EOL
CRT 3 9 6 2
LCD 3 11 4 2
CRT Results
For the CRT, many of the impacts were driven by a single material in the inventory. As
shown in Table ES-9, in 14 of the 20 impact categories, the top individual contributor to the
impacts was responsible for greater than 50 percent of the impacts. This shows that the CRT
data are highly sensitive to a few data points. Major conclusions from the CRT LCIA are as
follows:
• Energy used in glass manufacturing and associated production of LPG are driving the
baseline CRT results (they dominate ten impact categories, including overall life-cycle
energy use).
• The large amounts of fuel used as energy sources are driving occupational health effects.
Occupational impacts are calculated from inventory input amounts, and therefore there
may or may not actually be exposure to these fuels (e.g., they may be contained);
ES-29

EXECUTIVE SUMMARY
however, the results illustrate the potential for health effects, especially under spill or
upset conditions.
• The generation of electricity for the use stage dominates seven impact categories.
• Air emissions of sulfur dioxide from electricity generation (for the use life-cycle stage)
drive chronic public health effects, acidification, and terrestrial toxicity impacts. This
may be a concern, for example, in areas in nonattainment of regulated levels of sulfur
dioxide in the United States.
The use of LPG fuel in glass manufacturing dominated ten impact categories: two
directly from the LPG used in glass/frit manufacturing (energy use impacts and chronic
occupational health effects) and eight from LPG production (renewable resource use,
nonrenewable resource use, photochemical smog, air particulates, water eutrophication, BOD
water quality, TSS water quality, and aesthetics). In addition, impacts from the generation of
electricity during the use stage dominated seven impact categories: solid waste landfill use,
radioactive waste landfill use, global warming, ozone depletion, acidification, chronic public
health, and terrestrial toxicity. The CRT tube manufacturing process, which represents the most
functionally and physically (by mass) significant component of the CRT monitor, only dominated
one impact category (aquatic toxicity). Twenty-six percent of the aquatic toxicity score was from
phosphorus outputs from tube manufacturing, while most of the rest were from the materials
processing life-cycle stage. The remaining two impact categories (hazardous waste landfill use
and radioactivity) had greatest impacts from the landfilling of the assumed hazardous proportion
of CRT monitors, and the release of Plutonium-241 in steel production, respectively (Table
ES-9). The radioactivity impacts are driven by the radionuclide Pu-241, due to the electric grid
inventory included in the steel production secondary data set, which includes nuclear fuel
reprocessing.
The large amount of LPG reported for glass manufacturing was originally questioned
during the data collection and verification stage of this project. While no compelling reason
could justify removing the LPG data in the baseline case, a sensitivity analysis was conducted in
which the glass energy data were modified. Other sensitivity analyses were also conducted (i.e.,
manufactured life, modified LCD monitor manufacturing energy, and modified LCD EOL
distributions). However, the only scenario that substantially altered results was the modified
glass energy scenario (see Table ES-12). It is likely that the actual energy inputs to the glass
manufacturing process is somewhere between the baseline and modified glass scenarios. More
information is needed on energy used in glass manufacturing, which is driving CRT baseline
results.
The additional analyses for the CRT of lead and mercury also revealed that the use of lead
could present health risks, but the CDP method for calculating occupational impacts uses only
process inputs (not outputs) and may not adequately represent occupational exposures and risks.
Further refinement of the occupational impact analysis may be warranted.
Although there is no mercury in the CRT monitor, mercury emissions from electricity
generation in the CRT life cycle were greater (in mass) than the mercury used in the LCD.
Therefore, to reduce mercury emissions from the CRT life cycle, efforts to reduce electricity
consumption could be taken. Additionally, changes to the electric grid could also reduce
mercury emissions from the CRT life-cycle.
ES-30
EXECUTIVE SUMMARY
LCD Results
The LCD impact results were less sensitive to an individual input or output than the CRT
results, although in 11 of the 20 impact categories an individual input was still responsible for
greater than 50% of the total impacts. In general, the LCD results are less uncertain than the
CRT results. This is because most of the CRT results are being driven by either glass input data
or data from secondary sources, while LCD impacts are being driven more by data from primary
sources. Some results to note are as follows:
• The LCD monitor/module manufacturing process group had greatest impacts in six
impact categories (Table 3-58).
• Although the top contributor to the energy impact category was electricity consumed in
the use stage (30%), the overall energy impacts were greater from the manufacturing
stage than the use stage.
• In the glass energy sensitivity scenario, the use stage had greatest energy impacts,
although only by a small margin over the manufacturing stage (see Figure 3-26).
• Sulfur dioxide [emitted from electricity generation in the use stage, and constituting only
0.37% of the air emission inventory (see Table 2-49)] dominates the acidification, chronic
public health, and terrestrial toxicity impact categories (Table 3-58). The high public
health and terrestrial toxicity scores are due to its low non-cancer toxicity value and
resulting high hazard value (HV).
• Sulfur hexafluoride (SF6) from LCD monitor/module manufacturing was the single
greatest contributor to the global warming impact score; however, carbon dioxide from
the use stage and the materials processing stage also contributed significantly to the
global warming impacts (Table 3-25).
• The glass energy inputs did not directly dominate any impact categories, as they did for
the CRT (due to the smaller mass of glass in the LCD); however, LPG production
(required for the glass energy fuel) dominated two categories: TSS water quality and
aesthetics (Table 3-58).
• LNG as an ancillary inventory material was questionably very large and had greatest
impacts in two categories: nonrenewable resource use and photochemical smog (Table 3
58; shown there as “Natural Gas Production” due to that process being used as a surrogate
for LNG production).
The additional analyses of lead, mercury, and liquid crystals showed that the LCIA alone
is not adequate enough to determine all the potential impacts within the life-cycle of the LCD
monitors. Further, the LCIA method in this LCA used only process inputs as surrogates for
occupational exposure. If the occupational impacts methodology were refined, outputs into the
occupational environment should also be considered.
For mercury, which is found in the backlights of the LCD monitors, there is nearly the
same amount of mercury by mass emitted to the air during electricity generation as there is
mercury used to make the backlight unit. The mass of mercury input for backlights is only about
20% greater than the mercury air emissions from electricity generation (across all life-cycle
stages).
ES-31
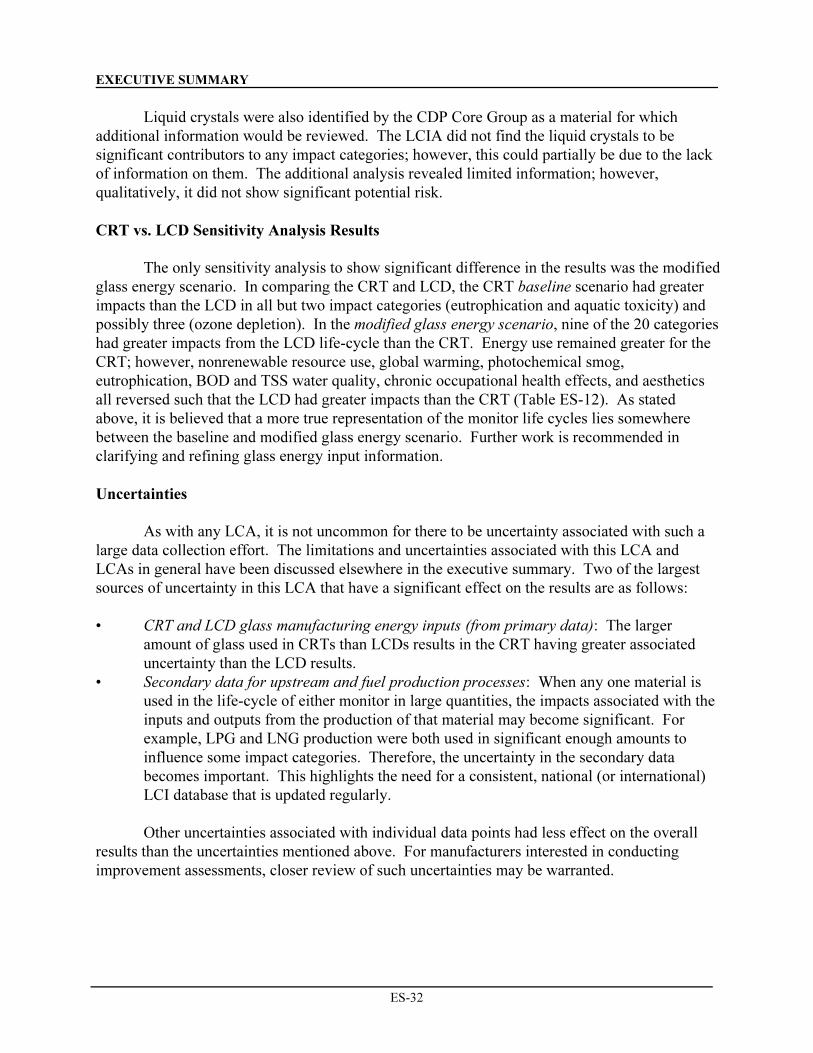
EXECUTIVE SUMMARY
Liquid crystals were also identified by the CDP Core Group as a material for which
additional information would be reviewed. The LCIA did not find the liquid crystals to be
significant contributors to any impact categories; however, this could partially be due to the lack
of information on them. The additional analysis revealed limited information; however,
qualitatively, it did not show significant potential risk.
CRT vs. LCD Sensitivity Analysis Results
The only sensitivity analysis to show significant difference in the results was the modified
glass energy scenario. In comparing the CRT and LCD, the CRT baseline scenario had greater
impacts than the LCD in all but two impact categories (eutrophication and aquatic toxicity) and
possibly three (ozone depletion). In the modified glass energy scenario, nine of the 20 categories
had greater impacts from the LCD life-cycle than the CRT. Energy use remained greater for the
CRT; however, nonrenewable resource use, global warming, photochemical smog,
eutrophication, BOD and TSS water quality, chronic occupational health effects, and aesthetics
all reversed such that the LCD had greater impacts than the CRT (Table ES-12). As stated
above, it is believed that a more true representation of the monitor life cycles lies somewhere
between the baseline and modified glass energy scenario. Further work is recommended in
clarifying and refining glass energy input information.
Uncertainties
As with any LCA, it is not uncommon for there to be uncertainty associated with such a
large data collection effort. The limitations and uncertainties associated with this LCA and
LCAs in general have been discussed elsewhere in the executive summary. Two of the largest
sources of uncertainty in this LCA that have a significant effect on the results are as follows:
• CRT and LCD glass manufacturing energy inputs (from primary data): The larger
amount of glass used in CRTs than LCDs results in the CRT having greater associated
uncertainty than the LCD results.
• Secondary data for upstream and fuel production processes: When any one material is
used in the life-cycle of either monitor in large quantities, the impacts associated with the
inputs and outputs from the production of that material may become significant. For
example, LPG and LNG production were both used in significant enough amounts to
influence some impact categories. Therefore, the uncertainty in the secondary data
becomes important. This highlights the need for a consistent, national (or international)
LCI database that is updated regularly.
Other uncertainties associated with individual data points had less effect on the overall
results than the uncertainties mentioned above. For manufacturers interested in conducting
improvement assessments, closer review of such uncertainties may be warranted.
ES-32
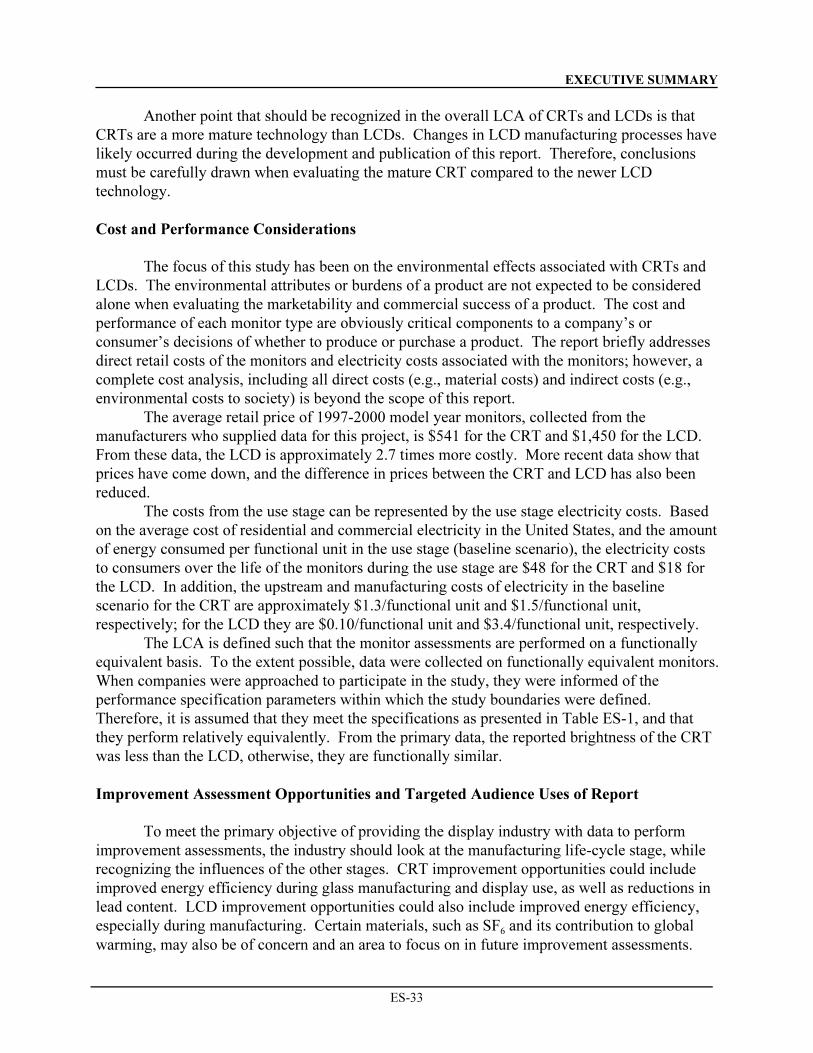
EXECUTIVE SUMMARY
Another point that should be recognized in the overall LCA of CRTs and LCDs is that
CRTs are a more mature technology than LCDs. Changes in LCD manufacturing processes have
likely occurred during the development and publication of this report. Therefore, conclusions
must be carefully drawn when evaluating the mature CRT compared to the newer LCD
technology.
Cost and Performance Considerations
The focus of this study has been on the environmental effects associated with CRTs and
LCDs. The environmental attributes or burdens of a product are not expected to be considered
alone when evaluating the marketability and commercial success of a product. The cost and
performance of each monitor type are obviously critical components to a company’s or
consumer’s decisions of whether to produce or purchase a product. The report briefly addresses
direct retail costs of the monitors and electricity costs associated with the monitors; however, a
complete cost analysis, including all direct costs (e.g., material costs) and indirect costs (e.g.,
environmental costs to society) is beyond the scope of this report.
The average retail price of 1997-2000 model year monitors, collected from the
manufacturers who supplied data for this project, is $541 for the CRT and $1,450 for the LCD.
From these data, the LCD is approximately 2.7 times more costly. More recent data show that
prices have come down, and the difference in prices between the CRT and LCD has also been
reduced.
The costs from the use stage can be represented by the use stage electricity costs. Based
on the average cost of residential and commercial electricity in the United States, and the amount
of energy consumed per functional unit in the use stage (baseline scenario), the electricity costs
to consumers over the life of the monitors during the use stage are $48 for the CRT and $18 for
the LCD. In addition, the upstream and manufacturing costs of electricity in the baseline
scenario for the CRT are approximately $1.3/functional unit and $1.5/functional unit,
respectively; for the LCD they are $0.10/functional unit and $3.4/functional unit, respectively.
The LCA is defined such that the monitor assessments are performed on a functionally
equivalent basis. To the extent possible, data were collected on functionally equivalent monitors.
When companies were approached to participate in the study, they were informed of the
performance specification parameters within which the study boundaries were defined.
Therefore, it is assumed that they meet the specifications as presented in Table ES-1, and that
they perform relatively equivalently. From the primary data, the reported brightness of the CRT
was less than the LCD, otherwise, they are functionally similar.
Improvement Assessment Opportunities and Targeted Audience Uses of Report
To meet the primary objective of providing the display industry with data to perform
improvement assessments, the industry should look at the manufacturing life-cycle stage, while
recognizing the influences of the other stages. CRT improvement opportunities could include
improved energy efficiency during glass manufacturing and display use, as well as reductions in
lead content. LCD improvement opportunities could also include improved energy efficiency,
especially during manufacturing. Certain materials, such as SF6 and its contribution to global
warming, may also be of concern and an area to focus on in future improvement assessments.
ES-33

EXECUTIVE SUMMARY
In addition, any improvement assessment should consider how changes in one life-cycle
stage will affect impacts in other stages. For example, in Chapter 4 we saw that the mercury
inputs and outputs from the intentional use of mercury in an LCD backlight are less (by mass)
than the mercury emissions from the CRT use stage, due to the relative energy usage by the CRT
and the emissions of mercury from electricity generation. In this example, we can see that on a
pure mass basis, a product’s energy efficiency is a key consideration and any changes in
manufacturing should consider if it will affect changes in use.
Another objective of this study was to provide an LCA model for future analyses.
Companies or individuals who have more current data for the CRT or LCD can apply them to the
model presented here. For example, changes in an individual process can be identified and
incorporated into the model. The other processes that are not expected to change significantly
can be left unchanged, and only limited data would need to be altered. This would reduce the
time and resources that would normally be required for a complete analysis.
Finally, those interested in comparing the results of the two monitors can apply their own
set of importance weights to each impact category to determine their individual decision. For
example, if energy impacts are much more important than aesthetics to a particular person, they
can weigh energy more heavily in concluding which monitor may have fewer environmental
impacts, while keeping in mind the data limitations and uncertainties, as well as cost and
performance considerations.
Suggestions for Future Research
Areas where future research could be conducted to refine and/or continue the use of the
results in this study are as follows:
• gather more information on energy use in glass manufacturing;
• develop consistent materials and fuel processing data in a national (or international) LCI
database that is updated regularly;
• refine and/or update some of the LCD manufacturing data (e.g., LNG data);
• collect more complete EOL data (e.g., remanufacturing data, and primary data for
incineration and landfilling) to determine better representation of the EOL impacts;
• conduct more research on the EOL options for LCDs;
• collect more detailed data on landfilling and other treatment processes, such as water
treatment where no impacts were calculated;
• update manufacturing data to meet more recent monitor model years;
• conduct a more focused analysis on selected areas for detailed improvement assessments;
and
• evaluate process changes or other alternatives against an “average 1997-2000 model year”
to evaluate impacts of changes or improvements over time.
ES-34

REFERENCES
REFERENCES
Barnthouse, L., J. Fava, K. Humphreys, R. Hunt, L. Laibson, S. Noesen, J. Owens, J. Todd, B.
Vigon, K. Weitz, J. Young (Eds.). 1997. Life-Cycle Impact Assessment: The State-of-
the-Art. Society of Environmental Toxicology and Chemistry, Pensacola, FL.
CIA (Computer Industry Almanac, Inc.). 1997. Computer Industry Almanac. Arlington Heights,
IL.
Curran, M.A. 1996. Environmental Life Cycle Assessment. McGraw-Hill: New York
EIA (Energy Information Administration). 1999. 1997 Residential Energy Consumption Survey,
Housing Characteristics report. Web site available at:
http://www.eia.doe.gov/emeu/consumption/reports.html (under 'Residential Households').
Ecobilan. 1999. DEAM, life-cycle inventory database developed by the Ecobilan Group,
copyright 1999.
EPA (Environmental Protection Agency). 1998. “Characterization of Municipal Solid Waste in
the United States: 1997 update.” Report No. EPA530-R-98-007.
Fava, J., F. Consoli, R. Denison, K. Dickson, T. Mohin, and B. Vigon (Eds.). 1993. A
Conceptual Framework for Life-Cycle Impact Assessment. Society of Environmental
Toxicology and Chemistry (SETAC) and SETAC Foundation for Environmental
Education. Pensacola, FL.
Guinee, J., R. Heijungs, L. van Oers, D. van de Meent, T. Vermeire, M. Rikken. 1996. LCA
Impact Assessment of Toxic Releases. The Hague, The Netherlands.
IISI (International Iron and Steel Institute). 2001. World Steel Trends and Statistics. Web site
accessed at http://www.worldsteel.org/trends_indicators/figures_3.html, on July 31, 2001.
Kincaid, L. et al. 1996. Cleaner Technologies Substitutes Assessment - A Methodology &
Resource Guide. U.S. Environmental Protection Agency, Office of Pollution Prevention
and Toxics. EPA 744-R-95-002. Washington, DC.
NSC (National Safety Council). 1999. Electronic Product Recovery and Recycling Baseline
Report: Recycling of Selected Electronic Products in the United States, Washington,
D.C. May.
ES-35

REFERENCES
Swanson, M.B., G.A. Davis, L.E. Kincaid, T.W. Schultz, J.E. Bartmess, S.L. Jones, E.L. George.
1997. “A Screening Method for Ranking and Scoring Chemicals by Potential Human
Health and Environmental Impacts.” Environmental Toxicology and Chemistry.
16(2): 372-383.
TORNRC (The Oak Ridge National Recycle Center). 2001. Personal communication with D.
McFarland and A. Bradley, TORNRC, and R. Dhingra, University of Tennessee, Center
for Clean Products and Clean Technologies. April.
Vorhees, G. 2000. Personal communication with G. Vorhees, Envirocycle, and M. L. Socolof,
University of Tennessee, Center for Clean Products and Clean Technologies. July.
ES-36