omparative life cycle assessment report of food packaging ... · comparative life cycle assessment...
TRANSCRIPT

Final assessment report
COMPARATIVE LIFE CYCLE ASSESSMENT REPORT OF FOOD PACKAGING
PRODUCTS February 25, 2011
For
Cascades Speciality Products Group Consumer Product Packaging ATTN: Mr. Mathieu Roberge Research & Development Manager 455 Marie-Victorin Blvd., P.O. box 30 Kingsey Falls, Québec (Québec) J0A 1B0
By
Claude Belley Eco-Consultant Chemical Engineering Department École Polytechnique de Montréal
Pr. Réjean Samson, Eng., P.h.D. Project Director
Submitted by
OFFICE OF RESEARCH/CENTRE FOR TECHNOLOGICAL DEVELOPMENT (B.R.C.D.T.) ÉCOLE POLYTECHNIQUE DE MONTRÉAL Université de Montréal Campus P.O. box 6079, Stn. Centre-ville Montréal (Québec) H3C 3A7

CIRAIG Pi33 - Rapport d’avancement
Avril 2009 ACV comparative de produits d’emballage alimentaire Page ii
CIRAIG
Interuniversity Research Centre for the Life Cycle
of Products, Processes and Services
École Polytechnique de Montréal
Chemical Engineering Department
2900 Édouard-Montpetit Blvd.
Montréal (Québec) Canada
P.O. box 6079, Stn. Centre-ville
H3C 3A7
www.ciraig.org
WORK GROUP
By Signature
Claude Belley, DÉES éco-conseil
Life cycle assessment
Renée Michaud, Eng., M.Eng.
Technical support and revision
Collaborators
Édouard Clément, Eng., M.Sc.A.
Project coordination
Réjean Samson, Eng., Ph.D.
Scientific direction
Jean-François Ménard, Eng.
Post review modifications


CIRAIG Cascades Specialty Products Group
CIRAIG.org © 2011 Comparative LCA of food
packaging trays Page v
EXECUTIVE SUMMARY
The Cascades Speciality Products Group, Consumer Product Packaging (CSPG, CPP) mandated the Interuniversity Research Centre for the Life Cycle of Products, Processes and Services (CIRAIG) to carry out a comparative life cycle assessment (LCA) of the various tray materials used to manufacture these. They are used to package fruits and vegetables in Québec. Seven types of packaging materials were considered:
100% virgin extruded polystyrene foam (XPS)
90% virgin-10% recycled oriented polystyrene (OPS)
90% virgin-10% recycled polyethylene terephthalate (PET)
100% recycled PET (RPET)
90% virgin-10% recycled polylactide polymer (PLA)
90% virgin-10% recycled polypropylene (PP)
100% recycled moulded pulp (MP)
The results especially aim to help CSPG, CPP enhance its understanding of the impacts associated with its products.
This document constitutes the final project report and includes the LCA model used for the assessment of the life cycle of the trays, and the assessment and interpretation of the potential impacts results.
The study’s functional unit is as follows:
Contain and permit the stacking and retailing of an amount of fruits or vegetables that can be contained in a tray volume of 52 in.3 to consumers in Québec in 2010.
The volume refers to a tray that measures 8.38 inches in length, 5.88 inches in width and 1.06 inches in height.
The study includes all of the flows and processes involved in the production, distribution and end-of-life stages of the trays, including the production and transport of the resources consumed and the management of the waste generated at each stage. The following elements were excluded from the system boundaries:
For the plastic trays other than the XPS one, the transport of the plastic granulates from the production sites to the plastic sheet extrusion sites;
The warehousing and handling of the trays by retailers (and wholesalers or other intermediaries, if applicable);
The production and transport of the plastic film used to package the fruits and vegetables;
Human activities (e.g. employees’ daily travel);
The life cycles of the capital goods (e.g., roads, production equipment), with the exception of those already included in the ecoinvent data modules used in the LCA model.
In addition, the materials recovered by the studied systems (plastic scraps and old newpapers) are considered to be resources consumed by these systems (and not as waste generated by other systems). The recovery (i.e. collection and recycling) processes are therefore entirely attributed to the use of these materials and the studied systems. However, in the same fashion, the recovery of the trays at the end of their service lives is therefore not attributed to the studied systems.

CIRAIG Cascades Specialty Products Group
CIRAIG.org © 2011 Comparative LCA of food
packaging trays Page vi
This study relied on available preliminary data whenever possible (i.e., data specific to the studied packaging options). These preliminary data were collected from CSPG, CPP and its suppliers and represent annual averages. Any missing, incomplete or inaccessible data were then completed with assumptions and secondary data (i.e., generic or theoretical data available in the literature and life cycle inventory (LCI) databases, and especially the European database, ecoinvent (version 2.0 – www.ecoinvent.ch)).
Though most of the generic data modules that were used were taken directly from ecoinvent, several were adapted to increase their representativeness of the products and context being assessed. More specifically, for all of the activities that take place in Québec, Ontario or the United States, the generic modules were adapted by replacing the European electricity grid mixes with the Québec/Ontario/American grid mixes.
The data collected were then 1) related to the reference flow based on the functional unit – one 52-in.3 tray; 2) modeled using the SimaPro (www.pre.nl/simapro) software and 3) assessed based on the IMPACT2002+ (Jolliet et al., 2003) impact assessment method.
The results obtained using the IMPACT2002+ method indicate that the main contributors to the human health, ecosystem quality, climate change and resource depletion damage categories and the aquatic acidification and eutrophication impact categories are, over the entire life cycles of the trays, production-related processes (including raw materials and manufacturing energy production).
From a comparative perspective, the results also provide answers as to the potential environmental gains associated with the use of different materials (virgin or recycled) to manufacture the trays, without, however, confirming whether one or another posts better performances in all damage categories. More specifically:
Options showing the least potential in damage/impact
The XPS and MP trays stand out since they are among the options showing the least potential damage/impact for all categories.
Options showing the greatest potential in damage/impact
PLA, PP, PET and OPS show the highest potential for climate change and resource depletion categories.
PLA and PET show the highest potential human health damages;
PLA and PP show the highest potential for the aquatic acidification impact;
PLA shows much higher scores for the ecosystem quality damage and aquatic eutrophication impact categories;
Several parameters used to model the systems have a certain degree of uncertainty, especially with regards to the assumption and generic data modules and various methodological choices. Seven sensitivity analyses were therefore carried out as part of this assessment:
Tray weight;
Recycled plastics production;
The presumed energy contexts of the various alternatives;
The recycling boundaries based on the system expansion approach;
Tray delivery distances (to retailers);

CIRAIG Cascades Specialty Products Group
CIRAIG.org © 2011 Comparative LCA of food
packaging trays Page vii
The potential impacts (second assessment based on another LCIA method).
The sensitivity analyses do not alter the preliminary conclusions, and XPS and MP remain the materials with the least potential impacts. The sensitivity analyses also show that the plastic systems are very sensitive to the electricity grid mix used during the manufacturing of the trays.
No conclusions should be drawn from this study out of its original context.
To increase the credibility of the study and make it possible to disseminate the results to a wider audience, in keeping the ISO 14040 and 14044 standards, the study was the subject of a critical review by a review committee (see Section 2.2.10 and Appendix F).

CIRAIG Cascades Specialty Products Group
CIRAIG.org © 2011 Comparative LCA of food
packaging trays Page viii
TABLE OF CONTENTS
1 INTRODUCTION ...................................................................................................................... 1
2 STUDY MODEL ........................................................................................................................ 2
2.1 STUDY OBJECTIVES ....................................................................................................................... 2 2.1.1 Aim ............................................................................................................................................ 2 2.1.2 Application ................................................................................................................................ 2 2.1.3 Target audience ...................................................................................................................... 2
2.2 SCOPE OF THE STUDY .................................................................................................................... 3 2.2.1 Function, functional unit and reference flow ....................................................................... 3 2.2.2 Boundaries and description of the product systems .......................................................... 3 2.2.3 Cut-off criteria .......................................................................................................................... 6 2.2.4 Allocation approach ................................................................................................................ 6 2.2.5 General assumptions .............................................................................................................. 7 2.2.6 Life cycle inventory (LCI) data............................................................................................... 8 2.2.7 Life cycle impact assessment (LCIA) ................................................................................... 9 2.2.8 Calculation method ............................................................................................................... 10 2.2.9 Result validation and interpretation .................................................................................... 10 2.2.10 Critical review .................................................................................................................... 10 2.2.11 Applications and limitations of the LCA ......................................................................... 11
3 RESULTS ...............................................................................................................................12
3.1 INVENTORY RESULTS ................................................................................................................... 12 3.2 IMPACT ASSESSMENT RESULTS ................................................................................................... 12
3.2.1 Analysis of the environmental profiles of different trays .................................................. 22 3.2.2 Comparing the environmental profiles ............................................................................... 23
3.3 INVENTORY DATA QUALITY ASSESSMENT .................................................................................... 26 3.4 SENSITIVITY ANALYSES ................................................................................................................ 26 3.5 LIMITATIONS OF THE LCIA AND LCI ASSESSMENT...................................................................... 28
4 CONCLUSION ........................................................................................................................29
5 REFERENCES .......................................................................................................................30
APPENDIX A: LIFE CYCLE ASSESSMENT METHOD (LCA) .....................................................31
APPENDIX B: LIFE CYCLE IMPACT (LCI) ASSESSMENT METHOD ........................................32
APPENDIX C: DATA......................................................................................................................33
APPENDIX D: RESULTS ...............................................................................................................34
APPENDIX E: SENSITIVITY ANALYSES .....................................................................................35

CIRAIG Cascades Specialty Products Group
CIRAIG.org © 2011 Comparative LCA of food
packaging trays Page ix
TABLES AND FIGURES
Tables
Table 2-1: Studied food tray options ................................................................................ 2
Table 2-2: Québec, Ontario and North American grid mixes ............................................ 9
Table 2-3: IMPACT2002+ damages and impacts .......................................................... 10
Table 3-1: Relative contributions (in %) of the foreground processes to the total for each tray system.................................................................................................. 19
Table 3-2: Major contributors and environmental parameters (a: emissions to air, w: emissions to water, s: emissions to soil, r: resources from nature) .............. 20
Table 3-3: Hierarchy and system comparison for each damage/impact category .......... 23
Figures
Figure 2-1: Boundaries of the product system ................................................................. 5
Figure 3-1: Potential human health damages of the life cycle of the tray ....................... 13
Figure 3-2 Potential ecosystem quality damages of the life cycle of the tray.................. 14
Figure 3-3 : Potential climate change damages of the life cycle of the tray .................... 15
Figure 3-4 : Potential resource use damage of the life cycle of the tray ......................... 16
Figure 3-5 : Potential aquatic acidification impact of the life cycle of the tray ................. 17
Figure 3-6 : Potential aquatic eutrophication impact of the life cycle of the tray ............. 18
Figure 3-7: System hierarchy for each damage/impact category ................................... 25

CIRAIG Cascades Specialty Products Group
CIRAIG.org © 2011 Comparative LCA of food
packaging trays Page x
ACRONYMS AND ABBREVIATIONS
ACV-C Consequential life cycle assessment
CIRAIG Interuniversity Research Centre for the Life Cycle of Products, Processes and Services
CO2 Carbon dioxide
CSPG Cascades Specialty Products Group, Consumer Product Packaging
ISO International Organization for Standardization
LCA Life cycle assessment
LCA-A Attributional life cycle assessment (or descriptive life cycle assessment)
LCI Life cycle inventory
LCIA Life cycle impact assessment
LUCAS Life Cycle Impact Assessment Method Used for a Canadian-Specific Context
OPS Oriented polystyrene
PET Terephthalate polystyrene
PLA Polylactide polymer
MP Recycled moulded pulp
PP Polypropylene
XPS Extruded polystyrene foam
TLS Technical landfill site

CIRAIG Cascades Specialty Products Group
CIRAIG.org © 2011 Comparative LCA of food packaging trays Page 1
1 INTRODUCTION
A member of the Cascades Specialty Products Group, the Consumer Product Packaging sector designs, manufactures and markets packaging products made of moulded pulp and plastic, some of which are 100% recyclable. It covers the food, hardware and consumer product industries. Its diversified portfolio also includes site furnishings and construction materials made of 100% recycled plastic.
In an effort to reduce its potential environmental impacts, CSPG, CPP is currently carrying out internal evaluations of the environmental performances of its products. The company seeks to compare its own products and take a proactive stance given the increased number of green procurement policies of business and institutional buyers.
CSPG, CPP therefore mandated the Interuniversity Research Centre for the Life Cycle of Products, Processes and Services (CIRAIG) to carry out a comparative life cycle assessment of the various materials used to manufacture the trays on which fruits and vegetables are sold in Québec. Based on internationally-recognized methodologies, life cycle assessment makes it possible to evaluate the potential environmental impacts of a product or activity throughout its life cycle. It therefore constitutes a holistic approach that determines a system’s hot spots and ensures that the chosen solutions do not simply transfer the harmful effects from one life cycle stage or impact category to another.
The following chapter (Chapter 2) details the objectives of the study and the methodology used as part of the first phase of the LCA, as required by ISO (ISO 14040 and 14044). Chapter 3 details the results of the subsequent phases of the LCA.
Finally, it should be noted that Appendix A includes the LCA methodology and a section on field-specific terminology.
CIRAIG Cascades Specialty Products Group
CIRAIG.org © 2011 Comparative LCA of food packaging trays Page 2
2 STUDY MODEL
In the following section, the first phase of the LCA – the definition of the objectives and scope of the study – is described in keeping with the ISO 14044 standard. This chapter therefore presents the study model that defines the methodological framework to which all subsequent LCA phases must conform.
2.1 Study objectives
2.1.1 Aim
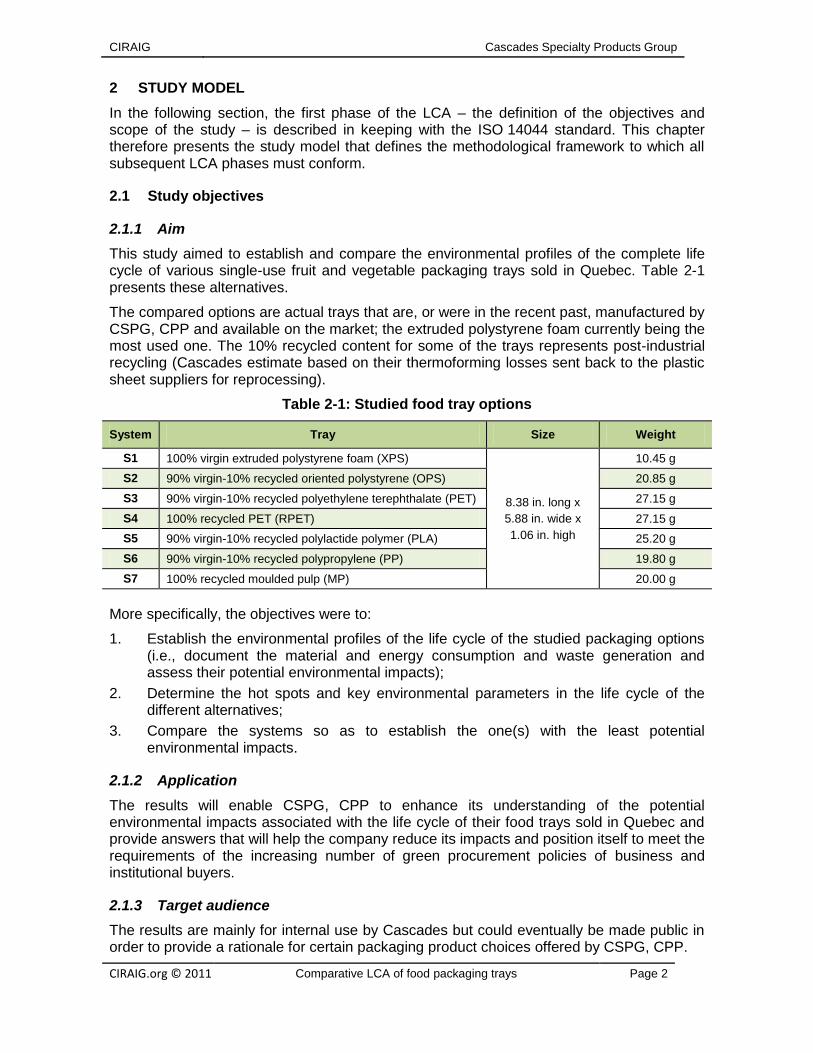
This study aimed to establish and compare the environmental profiles of the complete life cycle of various single-use fruit and vegetable packaging trays sold in Quebec. Table 2-1 presents these alternatives.
The compared options are actual trays that are, or were in the recent past, manufactured by CSPG, CPP and available on the market; the extruded polystyrene foam currently being the most used one. The 10% recycled content for some of the trays represents post-industrial recycling (Cascades estimate based on their thermoforming losses sent back to the plastic sheet suppliers for reprocessing).
Table 2-1: Studied food tray options
System Tray Size Weight
S1 100% virgin extruded polystyrene foam (XPS)
8.38 in. long x
5.88 in. wide x
1.06 in. high
10.45 g
S2 90% virgin-10% recycled oriented polystyrene (OPS) 20.85 g
S3 90% virgin-10% recycled polyethylene terephthalate (PET) 27.15 g
S4 100% recycled PET (RPET) 27.15 g
S5 90% virgin-10% recycled polylactide polymer (PLA) 25.20 g
S6 90% virgin-10% recycled polypropylene (PP) 19.80 g
S7 100% recycled moulded pulp (MP) 20.00 g
More specifically, the objectives were to:
1. Establish the environmental profiles of the life cycle of the studied packaging options (i.e., document the material and energy consumption and waste generation and assess their potential environmental impacts);
2. Determine the hot spots and key environmental parameters in the life cycle of the different alternatives;
3. Compare the systems so as to establish the one(s) with the least potential environmental impacts.
2.1.2 Application
The results will enable CSPG, CPP to enhance its understanding of the potential environmental impacts associated with the life cycle of their food trays sold in Quebec and provide answers that will help the company reduce its impacts and position itself to meet the requirements of the increasing number of green procurement policies of business and institutional buyers.
2.1.3 Target audience
The results are mainly for internal use by Cascades but could eventually be made public in order to provide a rationale for certain packaging product choices offered by CSPG, CPP.

CIRAIG Cascades Specialty Products Group
CIRAIG.org © 2011 Comparative LCA of food packaging trays Page 3
2.2 Scope of the study
2.2.1 Function, functional unit and reference flow
The main function of the studied systems is to:
Contain and permit the sale of an amount (volume) of fruits or vegetables at the retailer to consumers.
It is important to note that:
1. The tray has a very short service life since the food items are placed in the tray at the retailer a short time before they are sold and the tray is generally disposed of once the consumer arrives home. It is a single-use item.
2. The trays are essentially used for convenience purposes at the retailer, the food items being pre-weighted and priced. By way of its rigidity, the tray does provide the food items a measure of physical protection from the damage that could occur during manual handling but that’s not the essential function of the tray. The food items and tray are generally then wrapped in a plastic film which does provide chemical and microbiological protection to the food. The use of the trays and of the plastic film facilitates the stacking of the food items on the display shelves and their handling by the consumers without being actually touched by them thus increasing hygienic conditions.
3. The food items considered here are fruits and vegetables, basically dry food, so there isn’t any liquid generated by the food items during the time they are packaged in the tray.
4. All the trays have the same dimensions and can thus hold the same volume of food items.
All these considerations make the studied trays equivalent in regard to this very specific function even if their individual technical characteristics (e.g. rigidity, water-resistance) are not the same. No actual performance measurements were made but the fact that each tray is actually used in stores for the considered function supports this equivalency assumption.
The functional unit is to:
Contain and permit the stacking and retailing of an amount of fruits or vegetables that can be contained in a tray volume of 52 in.3 to consumers in Québec in 2010.
The volume refers to a tray 8.38 inches long, 5.88 inches wide and 1.06 inches deep.
Finally, the reference flows are the amounts of product necessary to deliver the functional unit – one tray of each type. The characteristics of each tray are presented in Table 2-1.
2.2.2 Boundaries and description of the product systems
The following paragraphs describe the studied systems and detail the processes and flows that were initially included and excluded from the assessment.
2.2.2.1 General description of the system
As illustrated in Figure 2-1, the life cycle of the trays begins with the production of the raw materials that go into their manufacturing, including their transport, transformation and packaging. The packaged trays are then delivered to the retailers, where they are used to package fruits and vegetables and sealed with a plastic film. They are then transported to the consumer’s house and finally to the end-of-life treatment site.
The foreground system includes the preproduction, production, distribution, use and end-of-life life cycle stages.
CIRAIG Cascades Specialty Products Group
CIRAIG.org © 2011 Comparative LCA of food packaging trays Page 4
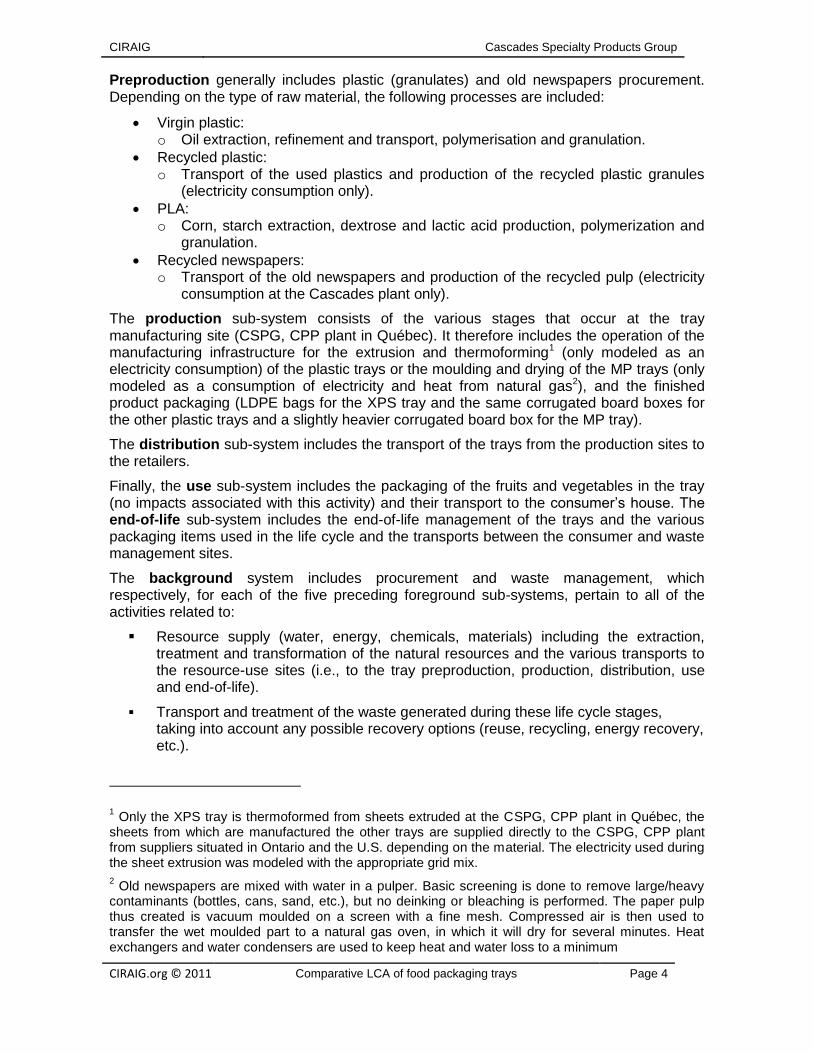
Preproduction generally includes plastic (granulates) and old newspapers procurement. Depending on the type of raw material, the following processes are included:
Virgin plastic: o Oil extraction, refinement and transport, polymerisation and granulation.
Recycled plastic: o Transport of the used plastics and production of the recycled plastic granules
(electricity consumption only).
PLA: o Corn, starch extraction, dextrose and lactic acid production, polymerization and
granulation.
Recycled newspapers: o Transport of the old newspapers and production of the recycled pulp (electricity
consumption at the Cascades plant only).
The production sub-system consists of the various stages that occur at the tray manufacturing site (CSPG, CPP plant in Québec). It therefore includes the operation of the manufacturing infrastructure for the extrusion and thermoforming1 (only modeled as an electricity consumption) of the plastic trays or the moulding and drying of the MP trays (only modeled as a consumption of electricity and heat from natural gas2), and the finished product packaging (LDPE bags for the XPS tray and the same corrugated board boxes for the other plastic trays and a slightly heavier corrugated board box for the MP tray).
The distribution sub-system includes the transport of the trays from the production sites to the retailers.
Finally, the use sub-system includes the packaging of the fruits and vegetables in the tray (no impacts associated with this activity) and their transport to the consumer’s house. The end-of-life sub-system includes the end-of-life management of the trays and the various packaging items used in the life cycle and the transports between the consumer and waste management sites.
The background system includes procurement and waste management, which respectively, for each of the five preceding foreground sub-systems, pertain to all of the activities related to:
Resource supply (water, energy, chemicals, materials) including the extraction, treatment and transformation of the natural resources and the various transports to the resource-use sites (i.e., to the tray preproduction, production, distribution, use and end-of-life).
Transport and treatment of the waste generated during these life cycle stages, taking into account any possible recovery options (reuse, recycling, energy recovery, etc.).
1 Only the XPS tray is thermoformed from sheets extruded at the CSPG, CPP plant in Québec, the
sheets from which are manufactured the other trays are supplied directly to the CSPG, CPP plant from suppliers situated in Ontario and the U.S. depending on the material. The electricity used during the sheet extrusion was modeled with the appropriate grid mix.
2 Old newspapers are mixed with water in a pulper. Basic screening is done to remove large/heavy
contaminants (bottles, cans, sand, etc.), but no deinking or bleaching is performed. The paper pulp thus created is vacuum moulded on a screen with a fine mesh. Compressed air is then used to transfer the wet moulded part to a natural gas oven, in which it will dry for several minutes. Heat exchangers and water condensers are used to keep heat and water loss to a minimum

CIRAIG Cascades Groupe Produits Spécialisés
CIRAIG.org © 2009 ACV comparative de produits d’emballage alimentaire Page 5
Figure 2-1: Boundaries of the product system3
3 The European flag appearing in the virgin plastic granulates production (for the XPS, OPS, PET and PP trays), the LDPE distribution bag
production (for the XPS tray) and the corrugated board distribution box production (for all but the XPS tray) only represent the fact that these processes were modeled with European data from the ecoinvent database, whereas they are most probably produced in North America.
Procurement
Landfilling Recycling
Consumer use
Plastic
scraps
1. Preproduction 2. Production 3. Distribution 4. Use
5. End-of-Life
Waste management
Food packaging at
retailer
Legend
Excluded processes
T Transport
Molded recycle pulp tray
manufacture (MP)
Plastic tray manufacture
(XPS, OPS, (R)PET, PP, PLA)
Virgin plastic granulates production
(XPS, OPS, PET, PP, PLA)
Plastic sheet production
(XPS, OPS, (R)PET, PP, PLA)
Extrusion
Recycling/Regrind
OPS/(R)PET PP,PLAXPS AllRecycled plastic granulates production
(OPS, (R)PET, PP, PLA)
PLAXPS, OPS, PET, PP
PP, PLAOPS, (R)PET
MPOld
newspapers
T
T
T
T
T
T
T T
T
T
Included processes
Molded recycle pulp
production (MP)
MPTruck: 365 km
Truck: 200 km
XPS – Train: 2870 km + Truck: 45 km
All others – 0 km
Truck: 106 km
Truck: 106 km
Car: 5 km
Truck: 50 km Truck: 50 km
XPS – 0 km
OPS – Truck: 680 km
PET, RPET – Truck: 750 km
PLA – Truck: 1580 km
PP – Truck: 2020 km
LDPE distribution bag
production
XPS
Corrugated board
distribution box production
OPS, (R)PET, PP, PLA, MP
Thermoforming
Packaging
Moulding and drying
Packaging
T Truck: 8 km
T
Truck: 8 km
Europe
USA
Ontario
Quebec

CIRAIG Cascades Groupe Produits Spécialisés
CIRAIG.org © 2009 Comparative LCA of food packaging products Page 6
2.2.2.2 Processes and flows included and excluded from the system boundaries
The following elements were excluded from the system:
For the plastic trays other than the XPS one, the transport of the plastic granulates from the production sites to the plastic sheet extrusion sites, no information was available;
The warehousing and handling of the trays by retailers (and wholesalers or other intermediaries, if applicable1), assumed to be identical for all trays;
The production and transport of the plastic film also used to package the fruits and vegetables, assumed to be identical for all trays;
Human activities (e.g. employees’ daily travel), no information was available;
The life cycles of the capital goods associated with the Cascades tray manufacturing plant and the plastic granulates production plants, no information was available2.
2.2.3 Cut-off criteria
No cut-off criteria (based on mass, energy or environmental relevance as suggested by the ISO standards) were used during the modeling of the systems to exclude processes from the boundaries, all available information was used. When confronted with missing data, assumptions were made to fill these gaps (see Section 2.2.5).
2.2.4 Allocation approach
Waste should normally be managed by the system that generates it. But when waste is used as a resource within other systems (i.e., outside the boundaries of the system that generated it), there is open-loop product recovery, and the impacts attributed to each of these systems must be determined using an allocation rule.
Therefore, the approach used in this study was chiefly based on the economic value of the sub-product (i.e., it allocates the environmental costs of the recovery as the economic costs are allocated to it). In other words, a recovered sub-product is either considered to be a waste product of the system that generates it or a resource of the system that recovers it, depending on its economic value before and after recovery.
More specifically, the material recovered by the studied systems (plastic and newspaper) was considered to be a resource consumed by the system (and not a waste from another system that must be managed by it). The recuperation (collection and transport) and recycling processes were therefore entirely allocated to the user of these recovered materials and therefore to the studied systems. In the same way, the recuperation and recycling of the tray at the end of its service life was not allocated to the studied systems
1 The XPS trays are more bulky than the other trays and would thus need, for a same number of
trays, a larger warehousing area during storage; however it was assumed that proper stock management alleviates this problem and permits the use of the same warehousing area as for the other trays.
2 The ecoinvent datasets used in the LCA models include for the most part the associated capital
goods.

CIRAIG Cascades Groupe Produits Spécialisés
CIRAIG.org © 2009 Comparative LCA of food packaging products Page 7
(the inventory associated with the recuperation and landfilling of the disposed fraction of the trays was however included).
It is possible to avoid the allocation of the impacts associated with the secondary function (e.g. providing recycled materials to another user) by extending the boundaries of the system to include the processes that are affected by this function (e.g., by crediting the impact of virgin plastic production offset by the recycling). This approach is normally used in more elaborate LCAs to assess the consequences of the studied system on other systems or guide specific decisions.
2.2.5 General assumptions
This sub-section presents the general assumptions pertaining to the studied systems.
The OPS and XPS granulates production processes were considered identical;
The tray manufacturing (only the electricity consumption for the sheet extrusion and thermoforming was considered) was assumed to be the identical for all plastic trays, per kilogram of tray, based on the primary data obtained for the XPS tray from CSPG, CPP1;
The truck transport during the distribution of the trays to the retailers was modelled as volume limited (or volume based) since the trailer of the truck is full before its weight limit is reached because of the bulk of the packaged trays;
The average transport distance of the trays to the retailers was assumed to be 106 km (based on the practitioner’s and Cascades representative’s professional judgement);
No tray loss was assumed during the distribution transport between the manufacturing site and the retailers;
The average transport distance of the trays to the consumer’s house was assumed to be 5 km (based on the practitioner’s and Cascades representative’s professional judgement);
The average transport distance of the trays at the end of their service lives to the waste management (i.e. landfill) sites was assumed to be 50 km (based on the practitioner’s and Cascades representative’s professional judgement);
The plastics average recycling rates were assumed to be 0% for the XPS, 15% for OPS, 38% for the PET and RPET, 17% for the PP and 0% for the PLA2, based on the latest residential solid waste characterization published by Recyc-Quebec (Recyc-Quebec, 2009);
1 This is probably not be the case because of the different physical characteristics of the
materials; for example PP and PS have similar extrusion temperatures and normally do not require a pre-drying step, PLA would also have similar extrusion conditions but would require a pre-drying step before extrusion, whereas PET and RPET would have higher extrusion temperatures.
2 The recycling rate for XPS was assumed to be 0% even if some recycling is done in the
province (in the Victoriaville area) since it is only on a very marginal scale compared to the total amount of XPS disposed of in landfills. PLA is not provided a specific identification number in the recycling plastic code system and as such would be considered non-recyclable in the sorting facilities.

CIRAIG Cascades Groupe Produits Spécialisés
CIRAIG.org © 2009 Comparative LCA of food packaging products Page 8
The average recycling rate for the MP trays was assumed to be 41% (Recyc-Quebec, 2009);
The average corrugated board recycling rate was assumed to be 56% (Recyc-Quebec, 2009).
2.2.6 Life cycle inventory (LCI) data
The data required for the LCA pertained to the raw materials used, the energy consumed and the waste generated during each life cycle stage of the trays. Appendix C details this information, which is required to establish the inventory of the seven studied systems, and provides an overview of the main hypotheses and data sources used to model the systems.
This study mainly relied on available primary data (i.e., data specific to the studied packaging options). Primary data were collected from CSPG, CPP and it suppliers by way of questionnaires and direct communications, they represent annual averages.
Any missing, incomplete or inaccessible data was completed with hypotheses and secondary data (i.e., generic or theoretical data available in the literature of life cycle inventory (LCI) databases, essentially from the internationally-recognized European ecoinvent database (www.ecoinvent.ch), version 2.0). There exists an American inventory database (U.S.LCI) administered by the National Renewable Energy Laboratory (http://www.nrel.gov/lci/) which provides more representative datasets for the American context. However, it is much less comprehensive in its coverage of human activities (400+ processes compared to 4000+ for the ecoinvent database) and presents numerous data gaps in its modeling of these activities (e.g., hydroelectricity generation is an empty dataset). For these reasons and for consistency purposes1, only the ecoinvent database was used as the source of secondary data.
Though most of the generic datasets used were taken directly from ecoinvent, several were adapted to enhance their representativeness of the products and context being assessed. These datasets chiefly pertain to technological averages that are representative of the European context. For all of the activities taking place in Québec, Ontario or the United States, the generic modules were adapted by replacing the European electricity grid mixes with:
The average Québec, Ontarian or North American grid mixes (presented in Table 2-2) for the foreground processes (i.e., the processes directly related to the life cycle of the trays) taking place in Québec, Ontario and the United States, respectively; for example, the tray manufacturing occurs in Québec and the electricity used was modeled with the Hydro-Québec grid mix. Only the contributions of the different electricity generation modes (e.g., coal, nuclear and hydro power plants) were adapted, the modeling of the generation modes and the distribution grid (including grid losses), i.e., the datasets representing them, was not changed and was still based on European, and in some case Swiss, conditions.
The North American grid mix for the background processes (i.e., all of the processes directly and indirectly related to the foreground processes; for example, all of the resources consumed to generate the electricity consumed by the foreground
1 The ecoinvent is consistent in its modeling of processes boundaries (e.g. it includes
infrastructure), allocation procedures and substances nomenclature.

CIRAIG Cascades Groupe Produits Spécialisés
CIRAIG.org © 2009 Comparative LCA of food packaging products Page 9
processes). The North American grid mix is more appropriate in this case since the supply and waste management during the various life cycle stages are not only carried out in Québec or Ontario.
Table 2-2: Québec, Ontario and North American grid mixes
Electricity generation mode Québec Ontario North America
Coal 0.7% 17.7% 45.1%
Oil 0.3% 0.5% 4.4%
Natural gas 0.5% 8.8% 17.3%
Nuclear 3.2% 50.2% 19.3%
Hydroelectric 95.1% 22.3% 13.6%
Wind 0.2% 0.2% 0.3%
Photovoltaic 0.0% 0.0% 0.0%
Biomass 0.0% 0.4% 0.0%
Total may make more than 100% because of rounding
In addition, several processes without equivalencies in the ecoinvent database were modeled from proxy data. However, this way of making up for the missing data reduces the technological representativeness of the results.
Finally, data collection for this project was limited to the information that was easily accessible.
2.2.7 Life cycle impact assessment (LCIA)
The life cycle impact assessment (LCIA) was carried out using the internationally-recognized IMPACT2002+ method (Jolliet et al., 2003)1 (version 2.05 as implemented in the SimaPro LCA software), which provides factors for the thirteen impact category indicators in order to convert them into only four damage category indicators, greatly facilitating results interpretation and communication.
Table 2-3 details the impact and damage categories that the IMPACT2002+ method considers. It is important to note that:
These categories do not cover all of the possible environmental impacts of human activities. Several types of impacts including noise, odours and electromagnetic fields are not considered in this assessment since their methodological developments remain lacking or insufficient.
Aquatic eutrophication and acidification are not considered in the IMPACT2002+ damage indicators (ecosystem quality damage category). It is therefore best to consider the four damage indicators along with the simple impact indicators for these two categories.
The global warming indicator results are calculated considering a 500 year time horizon in the IMPACT 2002+ method whereas a 100 year time horizon is considered in most other method and generally used GHG protocols. This choice was made by the developers of the method in regards to the long-term perspective associated with LCA.
1 For further information, see http://www.sph.umich.edu/riskcenter/jolliet/impact2002.htm

CIRAIG Cascades Groupe Produits Spécialisés
CIRAIG.org © 2009 Comparative LCA of food packaging products Page 10
Table 2-3: IMPACT2002+ damages and impacts
Damage category Impact category
Human health
Human toxicity (carcinogens)
Human toxicity (non-carcinogens)
Respiratory effects due to inorganic substances
Ionizing radiations
Ozone layer depletion
Respiratory effects due to organic substances (photochemical oxidation)
Ecosystem quality
Aquatic ecotoxicity
Land ecotoxicity
Soil acidification/nutriphication
Land occupation
Climate change Global warming
Resources Non-renewable primary energy
Ore mining
Impacts that are not characterized in a damage category
Aquatic acidification
Aquatic eutrophication
2.2.8 Calculation method
The inventory calculation and the assessment of the potential impacts of the inventoried emissions were carried out using the SimaPro software developed by PRé Consultants (www.pre.nl).
2.2.9 Result validation and interpretation
The preliminary assessment (based on easily-accessible data) made it possible to evaluate the extent of the contributions of the various stages of the life cycle and limit the time invested in exploring minor issues. The data quality assessment and sensitivity analyses made it possible to measure the importance of validating the hypotheses and directing the remainder of the data collection process. More specifically, the final results of the LCA illustrate:
1. The overall material and energy consumption and the various environmental emissions of the studied systems;
2. A contribution analysis to the studied impact categories to determine the hot spots of the life cycles and target possible enhancements;
3. Sensitivity analyses to test certain conclusions;
4. Conclusions on the relative performances of the alternatives and potential enhancement options (of the studied systems and the study itself).
2.2.10 Critical review
To increase the credibility of the study and enable the dissemination of the results to a wider audience, in keeping with the ISO 14040 and 14044 standards, this study was the subject of a critical review.
The review was done by a committee composed of:

CIRAIG Cascades Groupe Produits Spécialisés
CIRAIG.org © 2009 Comparative LCA of food packaging products Page 11
Nathan Ayer, EarthShift, Dartmouth, NS, Canada (chairman of the committee);
Ludovic Capt, Balcan Plastics Ltd., Montreal, QC, Canada
Mathieu Guillemette, Éco Entreprises Québec, Montreal, QC, Canada
Marina Pietrosel, Éco Entreprises Québec, Montreal, QC, Canada
The review was conducted as follows:
1. The report and accompanying appendixes were submitted to the review committee.
2. The committee provided comments on the report according to the ISO 14044 standard section on critical reviews.
3. The report and systems modeling were modified accordingly and answers were provided to the review comments.
4. The modified report and answers to the review comments were submitted the review committee.
5. A final review statement was provided by the review committee.
All comments and answers to them are presented in Appendix F.
2.2.11 Applications and limitations of the LCA
No interpretations of a specific environmental impact should be carried out and no conclusions should be drawn beyond the context of this study. Since it is generally impossible to obtain data on competitors’ products, information on the environmental performances of the products must refer exclusively to the CSPG, CPP context.
It is therefore not recommended to publically compare the performances of Cascades products to those of the industry based on the results of this study.
The main limitations of the conclusions also pertain to:
The completeness and validity of the inventory data;
The completeness and validity of the LCIA methods, especially since they do not cover all of the substances that contribute to the various impact categories or all of the environmental impacts of human activities (e.g. noise, odours, radiation, electromagnetic fields).
It should also be noted that the results of the LCA represent potential environmental impacts and not actual ones.

CIRAIG Cascades Groupe Produits Spécialisés
CIRAIG.org © 2009 Comparative LCA of food packaging products Page 12
3 RESULTS
The inventory data and environmental impacts associated with the life cycles of each type of tray were assessed and interpreted based on the methodological framework presented earlier.
3.1 Inventory results
For each of the seven systems, the material and energy needs (transport and equipment) of the reference flows were determined. These intermediate product flows presented in Appendix C were then converted into elementary flows, mainly through secondary data. These elementary flows represent the flows exchanged with the environment (and not with other processes).
Appendix D details the inventory results: the elementary flows as they pertain to the functional unit (i.e., associated with the life cycle of a 52-in.3-tray). However, these flows are not the same from one system to another and differ in terms of their mass and environmental relevance. As presented in the following chapter, the characterization and aggregation of these flows within the impact and damage categories facilitates results interpretation.

CIRAIG Cascades Groupe Produits Spécialisés
CIRAIG.org © 2009 Comparative LCA of food packaging products Page 13
3.2 Impact assessment results
Figure 3-1 illustrate the environmental profiles of the life cycle of the seven trays. More specifically, these profiles correspond to the four damage indicator results and the two impact indicator results not aggregated into one of the damage category. These results are presented in Appendix D. It is important to note that the results are expressed in relative terms since they are related to the total obtained for the system that generates the highest score per category, which therefore corresponds to a value of 100%.
Table 3-1 recaps the relative contributions of the various foreground processes as they pertain to the total obtained for each system. The shaded cells (red) are contributions that are equal to or greater than 15%.
Finally, Erreur ! Source du renvoi introuvable. presents the main contributors to the tray systems. For each system, the main contributing substances are presented by damage/impact category. The third column in the table provides the total contribution for the substance, and the next columns present the contributions for foreground process for the substance. The detailed results for each of the systems are presented in Appendix D.
0%
10%
20%
30%
40%
50%
60%
70%
80%
90%
100%
XPS OPS PET RPET PLA PP MP
Human Health
% o
f w
orst
sys
tem
Virgin Material Recycled Material Transport Material Forming Packaging Distribution Transport Consumer End-of-life

CIRAIG Pi19P2 – Final report
CIRAIG.org © 2009 Comparative LCA of food
packaging products Page 14
Figure 3-1: Potential human health damages of the life cycle of the tray
0%
10%
20%
30%
40%
50%
60%
70%
80%
90%
100%
XPS OPS PET RPET PLA PP MP
Human Health
% o
f w
orst
sys
tem
Virgin Material Recycled Material Transport Material Forming Packaging Distribution Transport Consumer End-of-life

CIRAIG Pi19P2 – Final report
CIRAIG.org © 2009 Comparative LCA of food
packaging products Page 15
Figure 3-2 Potential ecosystem quality damages of the life cycle of the tray
0%
10%
20%
30%
40%
50%
60%
70%
80%
90%
100%
XPS OPS PET RPET PLA PP MP
Ecosystems Quality
% o
f w
orst
sys
tem
Virgin Material Recycled Material Transport Material Forming Packaging Distribution Transport Consumer End-of-life

CIRAIG Pi19P2 – Final report
CIRAIG.org © 2009 Comparative LCA of food
packaging products Page 16
Figure 3-3 : Potential climate change damages of the life cycle of the tray
0%
10%
20%
30%
40%
50%
60%
70%
80%
90%
100%
XPS OPS PET RPET PLA PP MP
Climate Change
% o
f w
orst
sys
tem
Virgin Material Recycled Material Transport Material Forming Packaging Distribution Transport Consumer End-of-life

CIRAIG Pi19P2 – Final report
CIRAIG.org © 2009 Comparative LCA of food
packaging products Page 17
Figure 3-4 : Potential resource use damage of the life cycle of the tray
0%
10%
20%
30%
40%
50%
60%
70%
80%
90%
100%
XPS OPS PET RPET PLA PP MP
Resources
% o
f w
orst
sys
tem
Virgin Material Recycled Material Transport Material Forming Packaging Distribution Transport Consumer End-of-life

CIRAIG Pi19P2 – Final report
CIRAIG.org © 2009 Comparative LCA of food
packaging products Page 18
Figure 3-5 : Potential aquatic acidification impact of the life cycle of the tray
0%
10%
20%
30%
40%
50%
60%
70%
80%
90%
100%
XPS OPS PET RPET PLA PP MP
Aquatic Acidification
% o
f w
orst
sys
tem
Virgin Material Recycled Material Transport Material Forming Packaging Distribution Transport Consumer End-of-life

CIRAIG Pi19P2 – Final report
CIRAIG.org © 2009 Comparative LCA of food
packaging products Page 19
Figure 3-6 : Potential aquatic eutrophication impact of the life cycle of the tray
0%
10%
20%
30%
40%
50%
60%
70%
80%
90%
100%
XPS OPS PET RPET PLA PP MP
Aquatic Eutrophication
% o
f w
orst
sys
tem
Virgin Material Recycled Material Transport Material Forming Packaging Distribution Transport Consumer End-of-life

CIRAIG Pi19P2 – Final report
CIRAIG.org © 2009 Comparative LCA of food
packaging products Page 20
Table 3-1: Relative contributions (in %) of the foreground processes to the total for each tray system
Human health Ecosystems quality Climate change
XPS OPS PET RPET PLA PP MP XPS OPS PET RPET PLA PP MP XPS OPS PET RPET PLA PP MP
Virgin Material 68 44 74 0 42 25 0 32 11 38 0 65 2 0 81 47 44 0 14 22 0
Recycled Material 0 0 0 8 0 1 0 0 1 0 6 0 1 0 0 0 0 8 1 1 0
Transport Material 13 3 1 5 2 4 5 16 7 5 8 3 9 5 6 1 2 3 3 3 1
Forming 13 44 21 76 52 66 44 45 49 37 57 27 72 22 9 44 48 80 77 69 78
Packaging 1 4 2 6 1 2 34 1 23 13 20 3 12 63 1 5 4 6 3 4 18
Distribution 1 2 1 2 1 1 6 4 7 4 7 1 4 7 1 1 1 1 1 1 1
Transport Consumer 0 0 0 0 0 0 0 0 0 0 0 0 0 0 0 0 0 0 0 0 0
End-of-life 3 3 1 4 1 1 11 3 3 1 2 1 1 3 3 2 1 2 1 1 2
Resources Aquatic acidification Aquatic eutrophication
XPS OPS PET RPET PLA PP MP XPS OPS PET RPET PLA PP MP XPS OPS PET RPET PLA PP MP
Virgin Material 88 53 50 0 29 42 0 77 50 47 0 1 13 0 70 19 67 0 56 57 0
Recycled Material 0 0 0 8 1 0 0 0 0 0 8 1 1 0 0 0 0 5 0 0 0
Transport Material 3 1 1 2 2 3 1 12 3 3 5 3 3 5 16 8 4 12 5 7 3
Forming 6 42 45 84 64 52 81 6 39 43 76 91 80 45 5 15 8 22 17 19 7
Packaging 1 3 2 4 3 3 15 1 4 3 6 2 2 32 0 30 11 33 7 9 48
Distribution 0 1 0 1 1 1 1 1 1 1 2 1 1 5 2 6 2 6 1 2 4
Transport Consumer 0 0 0 0 0 0 0 0 0 0 0 0 0 0 0 0 0 0 0 0 0
End-of-life 1 1 1 1 1 1 2 3 3 2 3 2 1 12 7 23 7 21 14 6 38

CIRAIG Pi19P2 – Final report
CIRAIG.org © 2009 Comparative LCA of food
packaging products Page 21
Table 3-2: Major contributors and environmental parameters (a: emissions to air, w: emissions to water, s: emissions to soil, r: resources from nature)
S1. XPS
Damage/ Impact category
Environmental parameter
Tota
l
Vir
gin
Mat
eri
al
Re
cycl
ed
M
ate
rial
Tran
spo
rt
Mat
eri
al
Form
ing
Pac
kagi
ng
Dis
trib
uti
on
Tran
spo
rt
Co
nsu
me
r
End
-of-
life
HH
Nitrogen oxides (a) 38% 23% 9% 2% 0% 1% 0% 2%
Sulfur dioxide (a) 23% 20% 1% 1% 0% 0% 0% 0%
Hydrocarbons, aromatic (a) 15% 14% 0% 0% 0% 0% 0% 0%
Particulates, < 2.5 um (a) 15% 8% 2% 3% 0% 0% 0% 1%
EQ
Copper (s) 23% 0% 0% 23% 0% 0% 0% 0%
Nitrogen oxides (a) 16% 10% 4% 1% 0% 0% 0% 1%
Aluminum (s) 15% 10% 3% 1% 0% 0% 0% 1%
Chromium VI (s) 12% 0% 0% 12% 0% 0% 0% 0%
CC Carbon dioxide, fossil (a) 92% 75% 5% 7% 1% 1% 0% 2%
Methane, fossil (a) 6% 6% 0% 0% 0% 0% 0% 1%
R
Oil, crude, in ground (r) 54% 49% 2% 1% 1% 0% 0% 1%
Gas, natural, in ground (r) 34% 33% 0% 0% 1% 0% 0% 0%
Uranium, in ground (r) 7% 3% 0% 4% 0% 0% 0% 0%
AAc Sulfur dioxide (a) 58% 51% 2% 3% 1% 0% 0% 0%
Nitrogen oxides (a) 41% 25% 10% 3% 0% 1% 0% 2%
AEu COD, Chemical Oxygen Demand (w) 93% 64% 16% 5% 0% 2% 0% 7%
S2. OPS
HH
Nitrogen oxides (a) 38% 15% 0% 2% 16% 2% 1% 0% 2%
Sulfur dioxide (a) 22% 13% 0% 0% 8% 0% 0% 0% 0%
Particulates, < 2.5 um (a) 18% 5% 0% 1% 10% 1% 0% 0% 1%
Hydrocarbons, aromatic (a) 10% 10% 0% 0% 0% 0% 0% 0% 0%
EQ
Zinc (s) 18% 0% 0% 3% 1% 12% 1% 0% 0%
Copper (s) 17% 0% 0% 0% 15% 2% 0% 0% 0%
Nitrogen oxides (a) 14% 6% 0% 1% 6% 1% 0% 0% 1%
Aluminum (a) 12% 0% 0% 0% 11% 1% 0% 0% 0%
CC Carbon dioxide, fossil (a) 94% 43% 0% 1% 42% 4% 1% 0% 2%
Methane, fossil (a) 5% 3% 0% 0% 1% 0% 0% 0% 0%
R
Uranium, in ground (r) 31% 2% 0% 0% 29% 0% 0% 0% 0%
Oil, crude, in ground (r) 31% 28% 0% 1% 1% 0% 0% 0% 1%
Gas, natural, in ground (r) 24% 21% 0% 0% 0% 2% 0% 0% 0%
AAc Sulfur dioxide (a) 56% 33% 0% 0% 21% 1% 0% 0% 0%
Nitrogen oxides (a) 41% 17% 0% 2% 17% 2% 1% 0% 2%
AEu COD, Chemical Oxygen Demand (w) 76% 12% 0% 8% 13% 15% 5% 0% 22%
S3. PET
HH
Hydrocarbons, aromatic (a) 56% 56% 0% 0% 0% 0% 0% 0% 0%
Nitrogen oxides (a) 16% 6% 0% 1% 8% 1% 0% 0% 1%
Particulates, < 2.5 um (a) 11% 5% 0% 0% 5% 0% 0% 0% 0%
Sulfur dioxide (a) 10% 5% 0% 0% 4% 0% 0% 0% 0%
EQ
Aluminum (a) 17% 8% 0% 0% 8% 1% 0% 0% 0%
Copper (s) 14% 1% 0% 0% 11% 1% 0% 0% 0%
Zinc (s) 13% 2% 0% 3% 1% 7% 1% 0% 0%
Nitrogen oxides (a) 9% 3% 0% 1% 4% 0% 0% 0% 0%
CC Carbon dioxide, fossil (a) 96% 42% 0% 2% 46% 4% 1% 0% 1%
Methane, fossil (a) 3% 2% 0% 0% 1% 0% 0% 0% 0%
R
Uranium, in ground (r) 35% 4% 0% 0% 31% 0% 0% 0% 0%
Oil, crude, in ground (r) 25% 22% 0% 1% 1% 0% 0% 0% 1%
Gas, natural, in ground (r) 21% 19% 0% 0% 0% 1% 0% 0% 0%
AAc Sulfur dioxide (a) 56% 31% 0% 1% 23% 1% 0% 0% 0%
Nitrogen oxides (a) 41% 15% 0% 2% 19% 2% 1% 0% 1%
AEu COD, Chemical Oxygen Demand (w) 89% 63% 0% 4% 7% 6% 2% 0% 7%

CIRAIG Pi19P2 – Final report
CIRAIG.org © 2009 Comparative LCA of food
packaging products Page 22
S4.RPET
Damage/ Impact category
Environmental parameter
Tota
l
Vir
gin
Mat
eri
al
Re
cycl
ed
M
ate
rial
Tran
spo
rt
Mat
eri
al
Form
ing
Pac
kagi
ng
Dis
trib
uti
on
Tran
spo
rt
Co
nsu
me
r
End
-of-
life
HH
Nitrogen oxides (a) 40% 3% 4% 27% 3% 1% 0% 2%
Particulates, < 2.5 um (a) 23% 2% 1% 18% 1% 1% 0% 1%
Sulfur dioxide (a) 17% 1% 0% 14% 1% 0% 0% 0%
Arsenic, ion (w) 7% 1% 0% 6% 0% 0% 0% 0%
EQ
Copper (s) 20% 1% 0% 17% 1% 0% 0% 0%
Zinc (s) 18% 1% 4% 1% 11% 1% 0% 0%
Aluminu (a)m 15% 1% 0% 13% 1% 0% 0% 0%
Nitrogen oxides (a) 10% 1% 1% 7% 1% 0% 0% 0%
CC Carbon dioxide, fossil (a) 96% 7% 3% 76% 6% 1% 0% 2%
Methane, fossil (a) 2% 0% 0% 1% 0% 0% 0% 0%
R
Uranium, in ground (r) 63% 5% 0% 58% 0% 0% 0% 0%
Coal, hard, in ground (r) 27% 2% 0% 24% 1% 0% 0% 0%
Oil, crude, in ground (r) 6% 1% 2% 2% 1% 1% 0% 1%
AAc Nitrogen oxides (a) 48% 4% 4% 33% 3% 2% 0% 2%
Sulfur dioxide (a) 48% 4% 1% 40% 2% 0% 0% 1%
AEu COD, Chemical Oxygen Demand (w) 80% 4% 12% 19% 17% 6% 0% 21%
S5.PLA
HH
Particulates, < 10 um (a) 41% 41% 0% 0% 0% 0% 0% 0% 0%
Sulfur dioxide (a) 20% 0% 0% 0% 20% 0% 0% 0% 0%
Nitrogen oxides (a) 15% 0% 0% 2% 12% 1% 0% 0% 1%
Hydrocarbons, armotics (a) 12% 0% 0% 0% 12% 0% 0% 0% 0%
EQ
Occupation, arable (r) 65% 65% 0% 0% 0% 0% 0% 0% 0%
Aluminum (a) 17% 0% 0% 0% 16% 0% 0% 0% 0%
Zinc (s) 4% 0% 0% 1% 0% 2% 0% 0% 0%
Copper (s) 3% 0% 0% 0% 3% 0% 0% 0% 0%
CC Carbon dioxide, fossil (a) 95% 12% 1% 3% 75% 3% 1% 0% 1%
Dinitrogen monoxidel(a) 2% 1% 0% 0% 1% 0% 0% 0% 0%
R
Coal, hard, in ground (r) 43% 11% 0% 0% 31% 0% 0% 0% 0%
Gas, natural, in ground (r) 27% 14% 0% 0% 11% 2% 0% 0% 0%
Uranium, in ground (r) 21% 3% 0% 0% 18% 0% 0% 0% 0%
AAc Sulfur dioxide (a) 71% 0% 1% 1% 69% 1% 0% 0% 0%
Nitrogen oxides (a) 23% 0% 0% 2% 18% 1% 0% 0% 1%
AEu COD, Chemical Oxygen Demand (w) 80% 41% 0% 5% 15% 3% 1% 0% 14%
S6.PP
HH
Hydrocarbons, aromatic (a) 31% 15% 0% 0% 15% 0% 0% 0% 0%
Sulfur dioxide (a) 29% 3% 0% 0% 25% 0% 0% 0% 0%
Nitrogen oxides (a) 25% 5% 0% 3% 15% 1% 0% 0% 1%
Particulates, < 2.5 um (a) 8% 2% 0% 1% 5% 0% 0% 0% 0%
EQ
Aluminum (a) 45% 0% 0% 0% 43% 1% 0% 0% 0%
Zinc (s) 13% 0% 0% 5% 1% 6% 1% 0% 0%
Nitrogen oxides (a) 9% 2% 0% 1% 6% 0% 0% 0% 0%
Copper (s) 8% 0% 0% 0% 7% 1% 0% 0% 0%
CC Carbon dioxide, fossil (a) 96% 21% 1% 3% 67% 4% 1% 0% 1%
Methane, fossil (a) 2% 1% 0% 0% 1% 0% 0% 0% 0%
R
Oil, crude, in ground (r) 32% 26% 0% 2% 3% 0% 0% 0% 1%
Coal, hard, in ground (r) 26% 1% 0% 0% 24% 0% 0% 0% 0%
Gas, natural, in ground (r) 24% 13% 0% 0% 9% 2% 0% 0% 0%
AAc Sulfur dioxide (a) 70% 8% 1% 1% 61% 1% 0% 0% 0%
Nitrogen oxides (a) 26% 5% 0% 3% 16% 1% 0% 0% 1%
AEu Phosphorus (w) 58% 55% 0% 0% 0% 3% 0% 0% 0%
COD, Chemical Oxygen Demand (w) 38% 2% 0% 6% 17% 5% 2% 0% 6%

CIRAIG Pi19P2 – Final report
CIRAIG.org © 2009 Comparative LCA of food
packaging products Page 23
S7.MP
Damage/ Impact category
Environmental parameter
Tota
l
Vir
gin
Mat
eri
al
Re
cycl
ed
M
ate
rial
Tran
spo
rt
Mat
eri
al
Form
ing
Pac
kagi
ng
Dis
trib
uti
on
Tran
spo
rt
Co
nsu
me
r
End
-of-
life
HH
Nitrogen oxides (a) 50% 4% 21% 16% 4% 0% 6%
Particulates, < 2.5 um (a) 17% 1% 5% 5% 1% 0% 4%
Sulfur dioxide (a) 13% 0% 8% 4% 0% 0% 1%
Hydrocarbons, aromatic (a) 10% 0% 8% 1% 0% 0% 0%
EQ
Zinc (s) 38% 2% 1% 33% 2% 0% 0%
Occupation, arable, non-irrigated (r) 13% 0% 0% 13% 0% 0% 0%
Aluminum (s) 12% 0% 8% 2% 0% 0% 1%
Copper (s) 9% 0% 5% 4% 0% 0% 0%
CC Carbon dioxide, fossil (a) 97% 1% 76% 17% 1% 0% 2%
Methane, fossil (a) 2% 0% 1% 0% 0% 0% 0%
R
Gas, natural, in ground (r) 87% 0% 76% 10% 0% 0% 0%
Oil, crude, in ground (r) 6% 1% 1% 2% 1% 0% 2%
Coal, hard, in ground (r) 4% 0% 1% 2% 0% 0% 0%
AAc Nitrogen oxides (a) 56% 4% 23% 18% 4% 0% 6%
Sulfur dioxide (a) 35% 1% 20% 10% 1% 0% 2%
AEu COD, Chemical Oxygen Demand (w) 75% 3% 5% 25% 3% 0% 38%
3.2.1 Analysis of the environmental profiles of different trays
According to the results obtained, the human health damages are:
Dominated by the virgin material production (granulates) for the XPS and PET trays;
Dominated almost equally by the virgin material production (granulates) and the extrusion and thermoforming for OPS and PLA trays;
Dominated by the extrusion and thermoforming for RPET and PP trays;
Dominated by the recycled pulp production and tray moulding (aggregated together in the results) and the distribution box production for the MP tray.
In the same way, the ecosystem quality damages are:
Dominated by the extrusion and thermoforming of the tray, the virgin material production and in a lesser degree by the tray distribution packaging and/or the virgin material transport, in the case of plastic trays (XPS, OPS, PET, RPET and PP);
Dominated by tray distribution box production and the production of the recycled pulp and the tray moulding in the case of MP tray;
Dominated by the virgin material production in the case of PLA tray, which can be explained by the use of large areas of arable land for the corn crop cultivation generating a very high land occupation score.
The climate change, resource depletion and aquatic acidification indicators yield similar results: the tray manufacturing processes (including raw materials production) are the main contributors to the potential impacts. With regards to resource depletion, the damages are linked to the non-renewable primary energy consumption. For the virgin petroleum based plastics, this corresponds in good part to the materials’ inherent energy (i.e., the energy content of the oil or natural gas feedstock from which are manufactured the trays) For the RPET, PLA and MP trays, this corresponds to the fossil fuel used in the recycled material production processes and those associated with the corn crop
CIRAIG Pi19P2 – Final report
CIRAIG.org © 2009 Comparative LCA of food
packaging products Page 24
cultivation and all the subsequent processes. In the case of the MP tray, the tray distribution box represents a much more important contribution (especially for the acidification category) since it is heavier than for the plastic trays.
Finally, for the aquatic eutrophication category, the contributions patterns differ between the systems. The virgin material production represents the dominant process for the XPS, PET, PP and PLA. The tray distribution box production and landfilling are the most important contributors for the OPS, RPET and MP trays. The PLA system also shows an fairly important contribution of the end-of-life stage since the distribution box and the actual tray will degrade and generate leachate contributing to the category.
It is also important to note that the recycled plastic manufacturing only considers the electric energy estimated to manufacture new granulates since no other information concerning this process was available. The impacts of the other processes involved in the recycling (the water use and water emission from the plastic scraps washing, solid waste, etc.) were thus not modeled, and this could eventually increase the scores of the recycling process. This especially applies to the RPET (100% recycled) tray but also, to a lesser degree, to the OPS, PET, PLA and PP trays, which contain 10% recycled plastic.
Virgin plastic production (XPS, OPS, PET and PP) was modeled based on generic European data, which is therefore more or less representative of the studied products. In the case of the PLA manufacturing, the inventory data was supplied by NatureWorks LLC, which was however limited since the management of the solid waste generated by the cradle-to-gate system was not included, which could also eventually increase the scores of the manufacturing process.
As previously said, the extrusion and thermoforming were modeled using the specific energy consumption data for the XPS tray provided by Cascades, i.e. the same amount of electricity per kilogram was considered for the OPS, PET, RPET, PLA and PP trays. The extrusion and thermoforming processes were however differentiated for each tray according to the appropriate grid mix (for all trays, thermoforming takes place in Québec).
Finally, the pulping and moulding processes for the MP were also modeled based on the electricity and heat consumption specific to Cascades. The waste generated by the water filtration process (sand, glass, etc.) were not considered (it is reasonable to assume that they are not significant contributors).
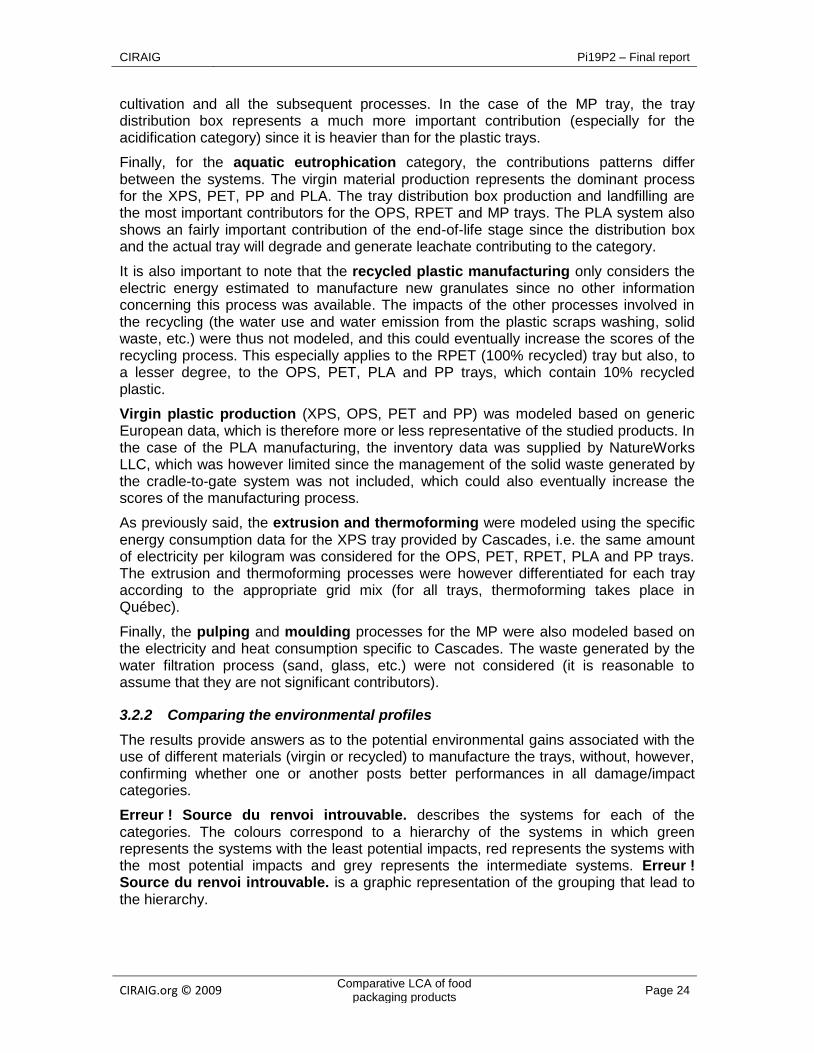
3.2.2 Comparing the environmental profiles
The results provide answers as to the potential environmental gains associated with the use of different materials (virgin or recycled) to manufacture the trays, without, however, confirming whether one or another posts better performances in all damage/impact categories.
Erreur ! Source du renvoi introuvable. describes the systems for each of the categories. The colours correspond to a hierarchy of the systems in which green represents the systems with the least potential impacts, red represents the systems with the most potential impacts and grey represents the intermediate systems. Erreur ! Source du renvoi introuvable. is a graphic representation of the grouping that lead to the hierarchy.

CIRAIG Pi19P2 – Final report
CIRAIG.org © 2009 Comparative LCA of food
packaging products Page 25
Table 3-3: Hierarchy and system comparison for each damage/impact category
XPS OPS PET RPET PLA PP MP
Human health
Ecosystems quality
Climate change
Resources
Aquatic acidification
Aquatic eutrophication
Systems with the most potential impacts
Systems with the least potential impacts
Intermediary systems
Given this hierarchy, the PLA tray holds the last place since it is, for all categories, among the systems with the most potential impacts. It is important to note that the ecosystem quality damage result singling out the PLA tray is due to the use of large areas of arable land for corn crop cultivation. The PET, OPS and PP trays follow since they are for several categories among the systems with the most potential impacts (the OPS tray seems to be better since it is among the systems with the least potential impacts for two categories). Then comes the RPET tray since it shows the least potential impacts for two categories and shows intermediate results for all the other. Finally, the XPS and MP trays come in first and second place since they show the least potential impacts for four out of the six categories.
The main advantage of the XPS tray lies in its mass, which is far less than that of other trays (up to 62% less). On the contrary, the PLA and PET trays are the heaviest of the trays and the virgin material production processes are important contributors. The main advantage of the MP tray lies in its recycled nature since no virgin material production is necessary and its manufacturing is relatively low energy intensive (58% higher than the XPS tray but 27% lower on average than the other plastic trays). The system is however penalised by a heavier distribution packaging.

CIRAIG Pi19P2 - Rapport final
CIRAIG Cascades Groupe Produits Spécialisés
CIRAIG.org © 2009 ACV comparative de produits
d’emballage alimentaire Page 26
Figure 3-7: System hierarchy for each damage/impact category
0%
10%
20%
30%
40%
50%
60%
70%
80%
90%
100%
PLA PET PP OPS RPET XPS MP PLA PP PET RPET OPS MP XPS PLA PP PET OPS RPET MP XPS PET PLA PP OPS RPET XPS MP PLA PP PET OPS RPET XPS MP PLA PP PET MP OPS RPET XPS
Human Health Ecosystems Quality Climate Change Resources Aquatic Acidification Aquatic Eutrophication
% o
f w
orst
sys
tem
Damage/Impact Categories

CIRAIG Pi19P2 - Rapport final
CIRAIG Cascades Groupe Produits Spécialisés
CIRAIG.org © 2009 ACV comparative de produits
d’emballage alimentaire Page 27
3.3 Inventory data quality assessment
An inventory data quality assessment was done. It used a qualitative approach considering the quantity (e.g. the amount of a particular material used in a system) of a unit process and the representativeness of the dataset used to model the unit process (e.g. the production of the particular material) and the contribution of the quantified dataset to the overall impact indicator results for the system. The results of this quality assessment take the form of a set of three scores (from 1 to 5, with 1 being the best and 5 the worst) per unit process and are presented in Appendix D. The first score relates to the contribution of the modeled unit process, the second to the amount of this unit process and the third to the representativeness of the dataset. Thus a unit process modeled with a dataset with a very low representativeness of the actual process but which also has a very small contribution will pose a smaller quality problem than a process which is modeled with a dataset with a medium representativeness or fairly quantified but showing a very high contribution.
These scores show that the quality of the data used in the modeling is generally adequate since the dominant processes: the virgin plastic granulates production, the plastic sheet extrusion and thermoforming and moulding of the recycled pulp tray, and the distribution box production for the MP tray, are well quantified (scores of 1 or 2) and modeled with fairly representative data (scores of 2 or 3). As was previously said, for the plastic granulates production, datasets from the potentially more representative U.S. LCI database were not used since these datasets are incomplete and somewhat inconsistent with the ecoinvent datasets used for the rest of the systems.
A Monte-Carlo uncertainty simulation was not done since the datasets for the XPS, OPS, PLA and PP virgin material production are aggregated datasets and thus have no uncertainty information associated with the included elementary flows. Considering the major contributions these datasets represent to the overall results for those systems, such an uncertainty analysis would have been prejudicial against the other systems for which uncertainty information is available for all processes.
3.4 Sensitivity analyses
Several parameters used to model the systems have a certain degree of uncertainty, especially with regards to the assumptions and generic data modules and various methodological choices. The results are linked to these parameters, and their uncertainty is therefore transferred to the conclusions.
Seven sensitivity analyses were carried out. The following paragraphs provide an overview of each of these analyses. Appendix E presents the results of these analyses.
1. Tray weight: The weight of the tray is an important parameter since it affects the amount of material used but also the amount of energy used during the tray manufacturing and its distribution (the marginal amount of energy per unit of mass is still considered in the volume based transport). A 20% higher and lower weight was considered in the analysis, thus generating a range of possible results for each tray. The results show a high degree of overlapping for the plastic trays other than the

CIRAIG Pi19P2 - Rapport final
CIRAIG Cascades Groupe Produits Spécialisés
CIRAIG.org © 2009 ACV comparative de produits
d’emballage alimentaire Page 28
XPS (i.e. lower in the comparative hierarchy), the XPS and MP trays show very little overlapping except with each other and thus maintain their better ranking overall.
2. PET recycling: In the baseline scenario, a generic process was used to model the recycled PET. The use of a recycled PET-specific process makes it possible to assess the degree to which the relative contribution of the RPET trays can change as compared to the other trays. As compared to the first approximation (simple electricity consumption), the specific process yields practically identical results and the conclusions therefore remain the same.
3. Allocation approach: In the baseline scenario, the allocation approach attributed 100% of the impacts of recycling to the user of the recycled material (the system that generates the waste to be recycled is attributed 0% of the impacts). A sensitivity analysis was carried out to include the end-of-life recycling process within the system boundaries through system expansion so as to account for the affected processes, e.g. the use of recycled plastic in the manufacturing of the tray avoids the landfilling of plastic wastes, thus the landfilling process is credited (i.e. has a negative contribution to the total score) to the system and is included in the Recycled Material life cycle step; and the recycling of the tray avoids the production of virgin plastic in other products systems, thus the virgin production process is credited to the system and is included in the End-of-Life life cycle step. The conclusions remain the same. In fact, the MP system shows an overall negative result for the ecosystem quality indicator associated with the non-deinked old newspaper used to manufacture the tray (the deinking process is avoided since the old newspaper would have been deinked had it been recycled into new newspaper).
4. The North American electricity grid mix: This analysis used the North American electricity grid for the recycled granulates/pulp production and tray manufacturing (extrusion and thermoforming). The XPS tray remains the favourite plastic option and the MP tray becomes the clear favourite for all indicators (it is practically equal to the XPS tray for the ecosystem quality and aquatic eutrophication categories) in light of its low electricity consumption (MP consumes natural gas, which, per MJ, generates less potential impacts than the North American energy grid).
5. The Québec electricity grid mix: This analysis used the Québec electricity grid for the recycled granulates/pulp production and tray manufacturing. Because the RPET system uses no virgin material and only consumes electricity during granulates production and tray manufacturing, it is comes out as the favoured option (even if it shows a little higher results than the XPS tray for the ecosystems quality category because of the corrugated board distribution box and granulates transport which have not changed). The XPS tray retains its advantage over the other plastic trays because of its lower weight. The systems that profit the most from this grid mix change are those that relied on the U.S. grid (PLA and PP trays for the recycled granulates production and the sheet extrusion), which is far more impactful as compared to the Québec grid mix than is the Ontarian mix (used by the OPS, PET and RPET trays); the PLA tray obtains an even lower result for the aquatic acidification category than the XPS tray. The MP tray shows good results compared to the plastic trays, but is still penalized for the climate change and resources depletion categories by the natural gas used to dry it once it is moulded.

CIRAIG Pi19P2 - Rapport final
CIRAIG Cascades Groupe Produits Spécialisés
CIRAIG.org © 2009 ACV comparative de produits
d’emballage alimentaire Page 29
6. The impact method: Another analysis was carried out using the European impact method RECIPE (version 1.03, Hierarchist vision as implemented in the SimaPro LCA software) to verify whether the variability of the receiving environments and characterisation models impacted the conclusions. It therefore aimed to test the robustness of the IMPACT2002+ results. This second method confirmed the advantage of the XPS and MP for the human health and ecosystem quality indicators (the climate change category contributes to these two indicators). In the case of resource consumption, the clear preference for the RPET is based on the uranium characterisation factor, which is much lower for this second assessment method (nuclear energy being the main contributor for the RPET in the IMPACT2002+, its contribution is significantly curbed).
7. The tray distribution to retailers (distance): In the baseline scenario, this distance was estimated to be 106 km for all of the scenarios and was increased to 1 500 km for the sensitivity test. Clearly, for the ecosystem quality indicator, the relative contribution of the transport increases without changing the comparative analysis of the trays. The low weight of the XPS trays puts the option ahead of MP.
The sensitivity analyses do not change the preliminary conclusions, and XPS and MP remain the systems with the least potential impacts.
3.5 Limitations of the LCIA and LCI assessment
The results presented in Section 3.2 stem from calculations carried out using the IMPACT2002+ assessment method. The characterisation results interpretation cannot only be based on the results (i.e., on the substances for which there are characterisation factors that convert the inventoried elementary flows into impact and damage indicator results). In fact, several elementary flows (432 for the PLA system and 382 for the others) could not be converted since no characterisation factors were available. They were therefore not considered during the impact assessment phase.

CIRAIG Pi19P2 - Rapport final
CIRAIG Cascades Groupe Produits Spécialisés
CIRAIG.org © 2009 ACV comparative de produits
d’emballage alimentaire Page 30
4 CONCLUSION
This project aimed to establish and compare the environmental profiles of different types of trays (XPS, OPS, PET, RPET, PLA, PP and MP).
The results obtained using the IMPACT2002+ method indicate that the main contributors to human health, ecosystem quality, climate change and resource depletion damages and aquatic acidification and eutrophication impact throughout the entire life cycles of the trays are linked to production processes (raw materials and manufacturing energy production).
From a comparative perspective, the results provide answers regarding the potential environmental gains associated with the use of different materials (virgin or recycled) for tray production, without affirming the advantage of one or another in every damage category.
Specifically, PLA, PET and PP post the worst performances while XPS and MP have the best overall performances.
The main advantage of the XPS tray lies in its mass, which is far less than that of other trays (up to 62% less). To enhance the performance of the other trays, it would be important to reduce their respective weights and optimize the subsequent transformation processes (extrusion and thermoforming or moulding).
The sensitivity analyses show that the plastic systems are very sensitive to the electricity grid mix used to form the tray, highlighting the environmental advantage of manufacturing the trays in Québec.

CIRAIG Pi19P2 - Rapport final
CIRAIG Cascades Groupe Produits Spécialisés
CIRAIG.org © 2009 ACV comparative de produits
d’emballage alimentaire Page 31
5 REFERENCES
ISO (2006a). ISO 14040: Environmental management — Life cycle assessment — Principles and framework, International Organization for Standardization, 28 p.
ISO (2006b). ISO 14044: Environmental management — Life cycle assessment — Requirements and guidelines, International Organization for Standardization, 54 p.
Recyc-Québec (2010). Caractérisation des matières résiduelles du secteur résidentiel au Québec 2006-2009, Document complémentaire, http://www.recyc-quebec.gouv.qc.ca/Upload/ Publications/doc_comp.pdf
Jolliet O, Margni M, Charles R, Humbert S, Payet J, Rebitzer G and Rosenbaum R. (2003). IMPACT 2002+: A New Life Cycle Impact Assessment Methodology, Int. Journal of LCA, 8 (6) p. 324-330

CIRAIG Pi19P2 - Rapport final
CIRAIG Cascades Groupe Produits Spécialisés
CIRAIG.org © 2009 ACV comparative de produits
d’emballage alimentaire Page 32
APPENDIX A: LIFE CYCLE ASSESSMENT METHOD (LCA)
Please refer to Pi79_Rptfin_Appendix_A_LCA_Methodology.pdf
for the content of this section.
CIRAIG Pi19P2 - Rapport final
CIRAIG Cascades Groupe Produits Spécialisés
CIRAIG.org © 2009 ACV comparative de produits
d’emballage alimentaire Page 33
APPENDIX B: LIFE CYCLE IMPACT (LCI) ASSESSMENT METHOD
Please refer to Pi79_RptFin_Appendix_B_IMPACT2002.pdf
for the content of this section.

CIRAIG Pi19P2 - Rapport final
CIRAIG Cascades Groupe Produits Spécialisés
CIRAIG.org © 2009 ACV comparative de produits
d’emballage alimentaire Page 34
APPENDIX C: DATA
Please refer to Pi79_Rptfin_Annexe_C_2010_10_27_Systèmes.xls
for the content of this section.

CIRAIG Pi19P2 - Rapport final
CIRAIG Cascades Groupe Produits Spécialisés
CIRAIG.org © 2009 ACV comparative de produits
d’emballage alimentaire Page 35
APPENDIX D: RESULTS
Please refer to Pi79_Rptfin_Appendix_D_2010_10_27_Results.xlsx
for the content of this section.

CIRAIG Pi19P2 - Rapport final
CIRAIG Cascades Groupe Produits Spécialisés
CIRAIG.org © 2009 ACV comparative de produits
d’emballage alimentaire Page 36
APPENDIX E: SENSITIVITY ANALYSES
Please refer to Pi79_Rptfin_Appendix_E_2010_10_27_Sensitivity.xlsx
for the content of this section.

CIRAIG Pi19P2 - Rapport final
CIRAIG Cascades Groupe Produits Spécialisés
CIRAIG.org © 2009 ACV comparative de produits
d’emballage alimentaire Page 37
APPENDIX F: CRITICAL REVIEW
Please refer to Final Critical Review Statement - Comparative Life Cycle Assessment of Food Packaging Products -
January 3 2011.pdf