comparative life cycle assessment of ......life cycle inventory (lci): examines the sequence of...
TRANSCRIPT
1
Peer Reviewed Report
COMPARATIVE LIFE CYCLE ASSESSMENT OF REUSABLE PLASTIC CONTAINERS AND DISPLAY-AND NON-DISPLAY-
READY CORRUGATED CONTAINERS USED FOR FRESH PRODUCE APPLICATIONS
PREPARED FOR:
IFCO Corporation
BY:
Franklin Associates, A Division of Eastern Research Group (ERG)
March 2016
2
Table of Contents
EXECUTIVE SUMMARY .......................................................................................................................... 3
ES.1. INTRODUCTION & BACKGROUND .......................................................................................... 3 ES.2. METHODOLOGY ........................................................................................................................... 4
ES.2.1. Functional Unit ......................................................................................................................... 5 ES.2.2. Product Systems Studied .......................................................................................................... 6 ES.2.3. Data Sources ............................................................................................................................12 ES.2.4. Reuse & Recycling Modeling Approach .................................................................................13 ES.2.5. Key Assumptions ....................................................................................................................15 ES.2.6. Sensitivity Analysis .................................................................................................................16
ES.3. KEY FINDINGS .............................................................................................................................17
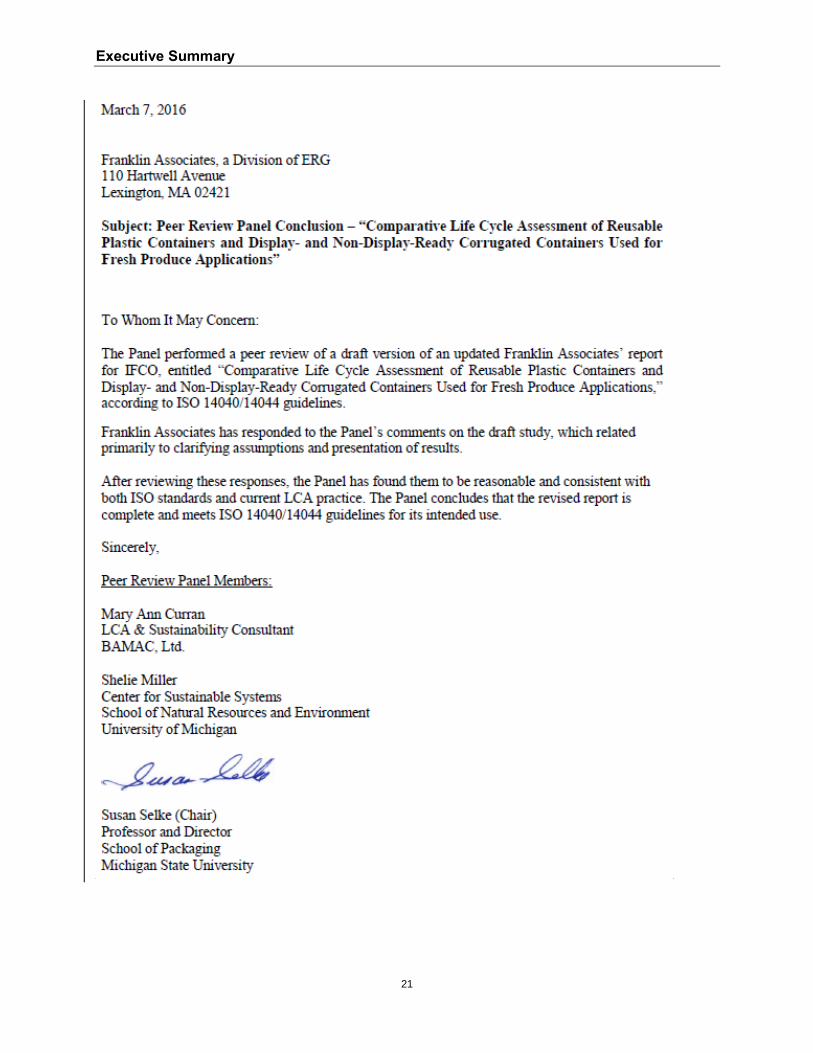
Peer Review Panel Conclusion……………………………………………………….………………… 21
List of Tables
Table ES–1. Systems Analyzed – Container Specifications ........................................................................... 8 Table ES–2. Parameter Values for the Sensitivity Analysis ..........................................................................17 Table ES–3. Weight Factors for Mixed Produce ...........................................................................................17 Table ES–4. Baseline LCIA Results for Produce Containers ........................................................................19
List of Figures
Figure ES–1. Examples of RPCs Used for Produce ...................................................................................... 3 Figure ES–2. RPC Product System Boundaries ............................................................................................10 Figure ES–3. DRC & NDC (Fiber Container) Product System Boundaries ..................................................11 Figure ES–4. Comparison of Per-Trip Ratios for Empty Container Weight to Produce Capacity Weight per
Container Type & Produce Application ........................................................................................................14 Figure ES–5. Comparison of Average Life Cycle Ratios for Empty Container Weight to Produce Capacity
Weight per Container Type & Produce Application .....................................................................................15
3
EXECUTIVE SUMMARY
ES.1. INTRODUCTION & BACKGROUND
Continuous environmental improvement has become a principle of most business and
government organizations, with particular attention to sustainability of packaging and
distribution within product supply chains. Life Cycle Assessment (LCA) has been
recognized as a scientific method for making comprehensive, quantified evaluations of
the environmental benefits and tradeoffs for the entire life cycle of a product system,
beginning with raw material extraction and continuing through disposition at the end of
its useful life. The report that follows is a comparative LCA of three options for
containers used in shipping produce throughout North America. The data sets for each
type of container are based on data from IFCO’s North American business; the three
types of containers evaluated are:
1. Reusable plastic containers (RPCs),
2. Display-ready corrugated fiber containers (DRCs), and
3. Non-display-ready corrugated fiber containers (NDCs)
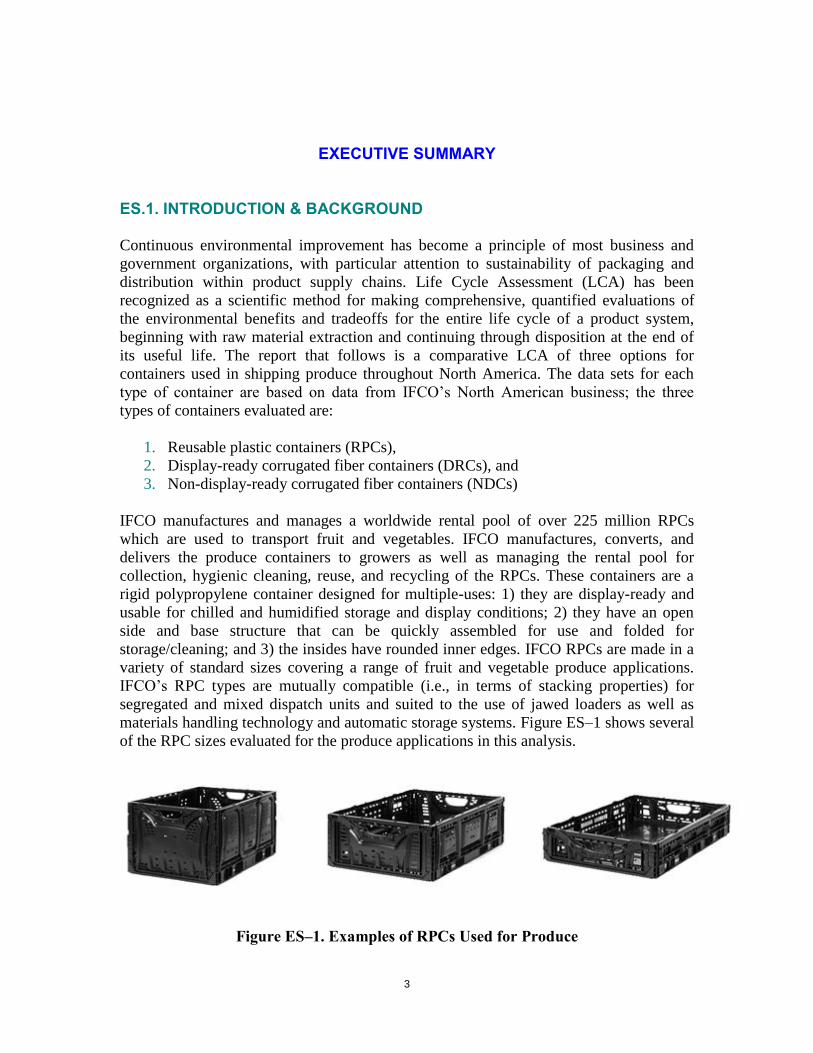
IFCO manufactures and manages a worldwide rental pool of over 225 million RPCs
which are used to transport fruit and vegetables. IFCO manufactures, converts, and
delivers the produce containers to growers as well as managing the rental pool for
collection, hygienic cleaning, reuse, and recycling of the RPCs. These containers are a
rigid polypropylene container designed for multiple-uses: 1) they are display-ready and
usable for chilled and humidified storage and display conditions; 2) they have an open
side and base structure that can be quickly assembled for use and folded for
storage/cleaning; and 3) the insides have rounded inner edges. IFCO RPCs are made in a
variety of standard sizes covering a range of fruit and vegetable produce applications.
IFCO’s RPC types are mutually compatible (i.e., in terms of stacking properties) for
segregated and mixed dispatch units and suited to the use of jawed loaders as well as
materials handling technology and automatic storage systems. Figure ES–1 shows several
of the RPC sizes evaluated for the produce applications in this analysis.
Figure ES–1. Examples of RPCs Used for Produce
4
Display-Ready Containers (DRCs) are interstacking corrugated containers which have a
minimum 60 percent of the top surface area open for display purposes. Non-Display
Ready Containers (NDCs) are containers having less than 60 percent of the top surface
area open and can include containers which are completely closed. NDCs have stacking
receptacles and tear-out panels and/or stacking tabs are optional. The conventional
corrugated DRCs and NDCs are made of corrugated fiber containerboard. Like RPCs,
different sizes of corrugated containers are used for different produce applications. The
corrugated containers analyzed in this study are those most representative of containers
used for each produce crop and, in many cases, have base dimensions similar to RPCs.
Commissioned by IFCO, Franklin Associates, A Division of ERG (hereinafter referred to
as Franklin Associates) conducted this LCA study of IFCO’s RPCs compared to
conventional fiber corrugated containers, both display- and non-display ready, used for
common produce applications—(fruits and vegetables that represent significant volume
in the fresh produce supply chain)—in North American operations.
This primary objective of this analysis was to provide IFCO with a transparent, detailed
Life Cycle Assessment (LCA) that can:
1. Determine the environmental burdens associated with IFCO’s RPCs in North
American operations,
2. Provide data to aid in the internal decision-making process
3. Generate results that may be used by IFCO to communicate, to supply chain
and/or other public stakeholders, information regarding the environmental impact
of IFCO RPCs relative to conventional fiber corrugated produce containers
The primary intended use of this study report is twofold: 1) as an internal decision-
making tool that provides results of an independently conducted LCA to IFCO; and 2) as
the basis for further study and/or communication of the potential improvement of
resource use and environmental emissions and impacts associated with the RPCs relative
to conventional fiber corrugated produce containers.
The individual chapters of the LCA report provide detail on the life cycle inventory (LCI)
of modeling the fiber corrugated and reusable RPCs; LCA results for the baseline
comparison; the parameterization of the baseline and other scenarios examined in the
sensitivity analysis and results for the sensitivity analysis. The appendices detail the
quantitative LCI and LCA results for the baseline scenario and LCA results for the
sensitivity analyses, and heating values and impact factors used in the selected life cycle
impact assessment (LCIA) characterization methodologies.
5
ES.2. METHODOLOGY
The LCA study was conducted in accordance with the international standards ISO 14040
and 14044. 1 The LCA method as defined in ISO standards has four distinct phases:
1. Goal and Scope Definition: defines the boundaries of the product system to be
examined.
2. Life Cycle Inventory (LCI): examines the sequence of steps in the life cycle
boundaries of the product system, beginning with raw material extraction and
continuing on through material production, product fabrication, use, and reuse or
recycling where applicable, and final disposition. For each life cycle step, the
inventory identifies and quantifies the material inputs, energy consumption, and
environmental emissions (atmospheric emissions, waterborne wastes, and solid
wastes). In other words, the LCI is the quantitative environmental profile of a
product system.
3. Life Cycle Impact Assessment (LCIA): characterizes the results of the LCI into
categories of environmental problems or damages based on the substance’s
relative strength of impact. Characterization models are applied to convert masses
of substances from the LCI results into common equivalents of one category
indicator.
4. Interpretation: uses the information from the LCI and LCIA to compare product
systems, rank processes, and/or pinpoint areas (e.g., material components or
processes) where changes would be most beneficial in terms of reduced
environmental impacts. The information from this type of assessment is
increasingly used as a decision-support tool.
The results presented in this report are specific to the supply chain of IFCO and should
not be interpreted as representing current or future RPCs used by other companies. The
following sections discuss the specifics of this methodology as applied in this study.
ES.2.1. Functional Unit
In any life cycle study, products are compared on the basis of providing the same defined
function or unit of service which is called the functional unit. The function of produce
containers is to transport fresh produce from growers to retail locations. In the case of the
RPCs and DRCs, the containers can also be used to display the produce at retail stores.
The analysis of NDCs does not include evaluating production and use of another type of
container used to display produce at retail.
Since this study includes both one-way and reusable containers, the additional issue of
lifetime reuses must be taken into account when determining the number of containers
and associated life cycle impacts to deliver an equivalent quantity of produce in one-way
1 ISO 14040: 2006, Environmental management – Life cycle assessment – Principles and framework;
ISO 14044: 2006, Environmental management – Life cycle assessment – Requirements and guidelines
6
and reusable containers. This study accounts for the standard LCI basis of product
functionality for reusable product systems using the average number of trips a container
is expected to make before it is removed from service for wear and damage, regardless of
the number of years it takes to make that number of trips. The number of trips a
conventional fiber corrugated container makes before it is removed from service is one
(1); whereas, the average number of trips made by the reusable plastic container (RPC) is
nearly 40.
In addition, because there are variations in sizes and capacities of the RPC and fiber
produce container systems, a functional unit of an equal number of containers is not a fair
basis of comparison. For each produce application examined in this analysis, the
functional unit must take into account the differences in the sizes and capacities of the
RPC, DRC, and NDC. For the baseline analysis, it is assumed that produce damage rates
are similar for the three types of containers. The functional unit of this LCA is based on
an equivalent quantity of produce delivered to stores: 1,000 tonnes of produce delivered
to retail stores in North America (US or Canada).
ES.2.2. Product Systems Studied
The LCA models three container options for delivering produce to retail stores: 1)
reusable plastic containers (RPCs), 2) display-ready corrugated fiber containers (DRCs),
and 3) non-display-ready corrugated fiber containers (NDCs), for several large-volume
produce applications. These three container options are compared for several produce
applications:
Apples
Bell Peppers
Carrots
Grapes
Iceberg Lettuce
Onions (Dry)
Oranges
Peaches/Nectarines
Tomatoes
Strawberries
The container options are selected based on the sizes most commonly used to ship these
types of fresh produce throughout North America. The produce applications analyzed in
this study are selected based on those with significant system volume and as a good
representation of fresh produce supply chain distribution in North America. The location
of growers for each produce investigated in this analysis is reflected in the modeling of
transportation within the container systems. For example, the bulk of apples consumed in
North America are sourced from Washington state in the US; whereas, oranges are
largely from Florida, California, and Texas.
The boundaries account for transportation requirements between all life cycle stages.
Transportation steps are modeled using both primary data and national statistics. For
transportation steps unique to IFCO RPCs (e.g., cleaning steps), distribution distances
and packing configurations are primary data obtained from IFCO; whereas, for
transportation steps common to both RPC and conventional fiber-corrugated produce
7
containers e.g., delivery from growers to retailers, packing configurations are obtained
from IFCO and distances are estimated from data on produce production by state
compiled by the US Department of Agriculture (USDA) National Agricultural Statistics
Service (NASS).2 Primary data were collected from IFCO to determine RPC packing
configurations throughout the RPC life cycle. As mentioned, the corrugated fiber produce
containers are very similar in base dimensions to the RPCs. Therefore, the packing
configuration of NDCs and DRCs were estimated assuming the same pallet load height as
for RPCs and maximum truck loading.
Though relative produce capacities are considered in this analysis, produce cultivation
and harvesting, operations for packing produce into the container, and storage and
refrigeration requirements for the produce contained in the investigated containers are
excluded. These operations are assumed to be equivalent among the types of produce
container systems. The burdens associated with the consumption of the produce from
retailers (delivery of produce from retail to consumers) are also excluded as they are not
affected by the type of produce shipping containers utilized. This analysis does not
attempt to evaluate differences in product damage associated with the use of the different
types of produce containers.
The RPC is made of polypropylene (PP) with a design unique to IFCO closed-loop fresh
produce distribution network. The conventional fiber containers are corrugated
containerboard made of a mixture of virgin and recovered fiber. Both plastic and fiber-
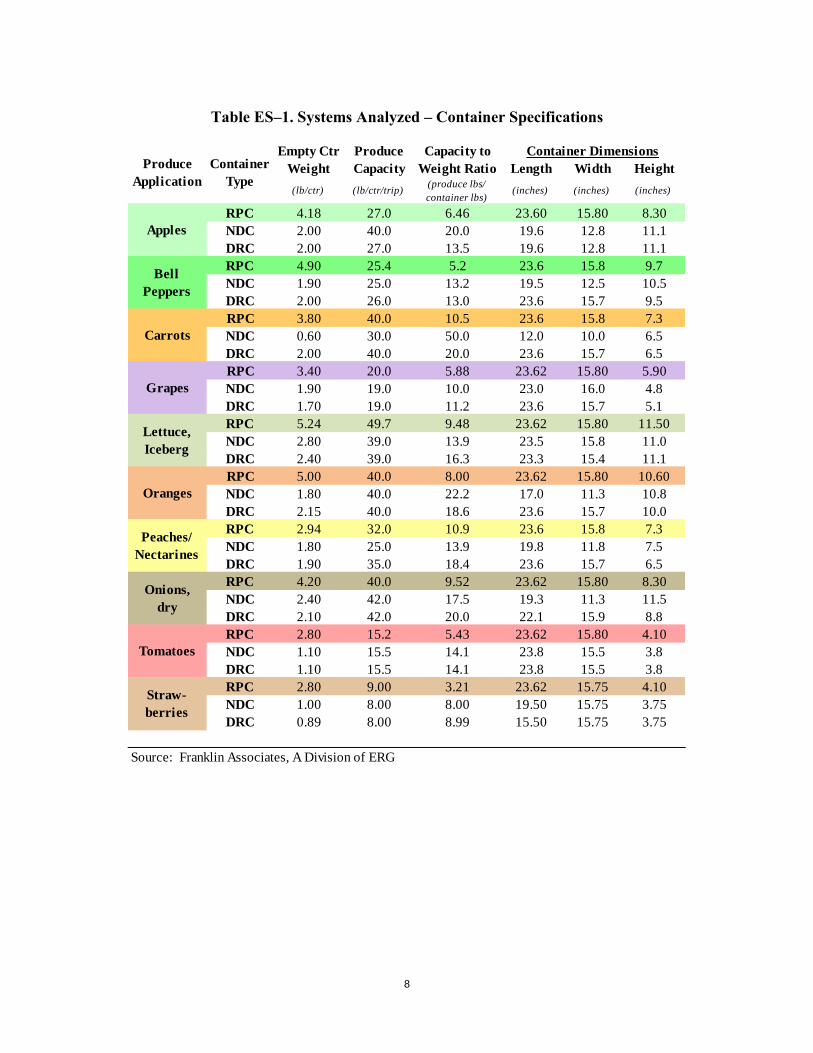
based produce containers may contain some recycled content. For each of the ten fresh
produce applications analyzed, the RPC, DRC, and NDC sizes are selected to represent
average industry-wide standards used in shipping that commodity. The container
parameters i.e., size, dimension, weight, and produce capacity used for the analyzed
produce applications are shown in Table ES–1.
2 USDA NASS (2009-2011). Crop Statistics, National Agricultural Statistics Service of the United
States Department of Agriculture. Available at:
http://www.nass.usda.gov/Data_and_Statistics/index.asp.
8
Table ES–1. Systems Analyzed – Container Specifications
Empty Ctr Produce Capacity to
Weight Capacity Weight Ratio Length Width Height
(lb/ctr) (lb/ctr/trip)(produce lbs/
container lbs)(inches) (inches) (inches)
RPC 4.18 27.0 6.46 23.60 15.80 8.30
NDC 2.00 40.0 20.0 19.6 12.8 11.1
DRC 2.00 27.0 13.5 19.6 12.8 11.1
RPC 4.90 25.4 5.2 23.6 15.8 9.7
NDC 1.90 25.0 13.2 19.5 12.5 10.5
DRC 2.00 26.0 13.0 23.6 15.7 9.5
RPC 3.80 40.0 10.5 23.6 15.8 7.3
NDC 0.60 30.0 50.0 12.0 10.0 6.5
DRC 2.00 40.0 20.0 23.6 15.7 6.5
RPC 3.40 20.0 5.88 23.62 15.80 5.90
NDC 1.90 19.0 10.0 23.0 16.0 4.8
DRC 1.70 19.0 11.2 23.6 15.7 5.1
RPC 5.24 49.7 9.48 23.62 15.80 11.50
NDC 2.80 39.0 13.9 23.5 15.8 11.0
DRC 2.40 39.0 16.3 23.3 15.4 11.1
RPC 5.00 40.0 8.00 23.62 15.80 10.60
NDC 1.80 40.0 22.2 17.0 11.3 10.8
DRC 2.15 40.0 18.6 23.6 15.7 10.0
RPC 2.94 32.0 10.9 23.6 15.8 7.3
NDC 1.80 25.0 13.9 19.8 11.8 7.5
DRC 1.90 35.0 18.4 23.6 15.7 6.5
RPC 4.20 40.0 9.52 23.62 15.80 8.30
NDC 2.40 42.0 17.5 19.3 11.3 11.5
DRC 2.10 42.0 20.0 22.1 15.9 8.8
RPC 2.80 15.2 5.43 23.62 15.80 4.10
NDC 1.10 15.5 14.1 23.8 15.5 3.8
DRC 1.10 15.5 14.1 23.8 15.5 3.8
RPC 2.80 9.00 3.21 23.62 15.75 4.10
NDC 1.00 8.00 8.00 19.50 15.75 3.75
DRC 0.89 8.00 8.99 15.50 15.75 3.75
Source: Franklin Associates, A Division of ERG
Container DimensionsProduce
Application
Container
Type
Apples
Straw-
berries
Bell
Peppers
Carrots
Grapes
Lettuce,
Iceberg
Oranges
Peaches/
Nectarines
Onions,
dry
Tomatoes
9
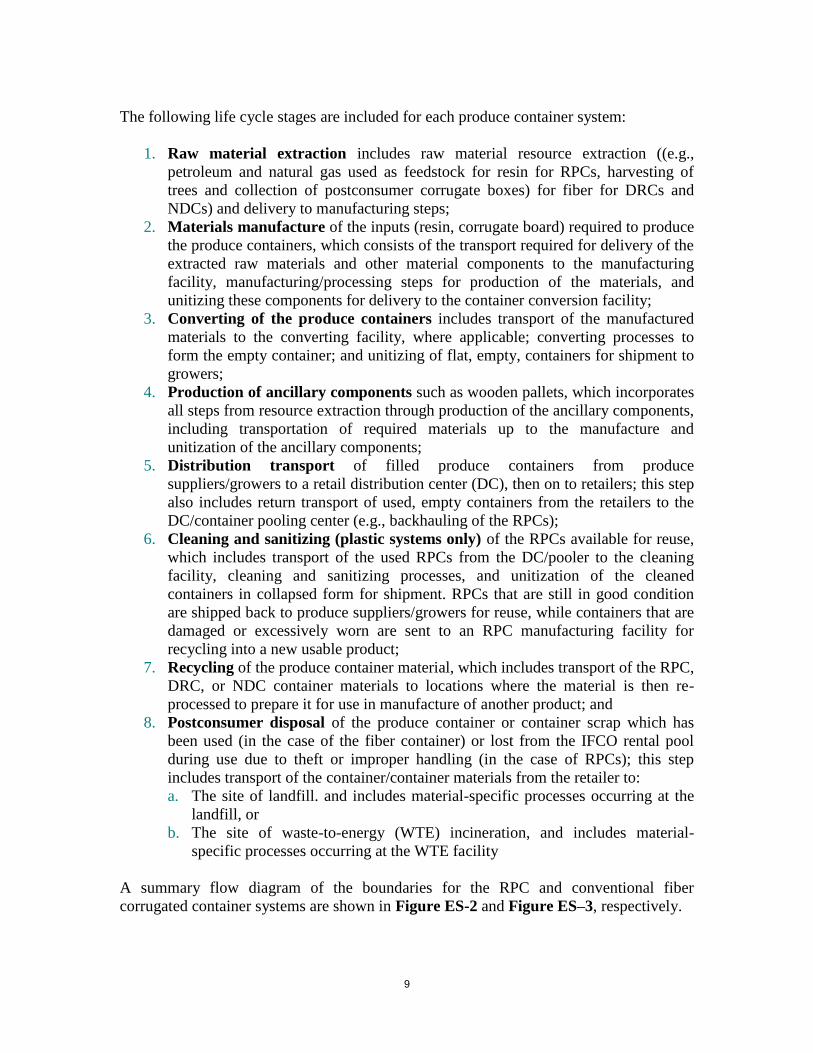
The following life cycle stages are included for each produce container system:
1. Raw material extraction includes raw material resource extraction ((e.g.,
petroleum and natural gas used as feedstock for resin for RPCs, harvesting of
trees and collection of postconsumer corrugate boxes) for fiber for DRCs and
NDCs) and delivery to manufacturing steps;
2. Materials manufacture of the inputs (resin, corrugate board) required to produce
the produce containers, which consists of the transport required for delivery of the
extracted raw materials and other material components to the manufacturing
facility, manufacturing/processing steps for production of the materials, and
unitizing these components for delivery to the container conversion facility;
3. Converting of the produce containers includes transport of the manufactured
materials to the converting facility, where applicable; converting processes to
form the empty container; and unitizing of flat, empty, containers for shipment to
growers;
4. Production of ancillary components such as wooden pallets, which incorporates
all steps from resource extraction through production of the ancillary components,
including transportation of required materials up to the manufacture and
unitization of the ancillary components;
5. Distribution transport of filled produce containers from produce
suppliers/growers to a retail distribution center (DC), then on to retailers; this step
also includes return transport of used, empty containers from the retailers to the
DC/container pooling center (e.g., backhauling of the RPCs);
6. Cleaning and sanitizing (plastic systems only) of the RPCs available for reuse,
which includes transport of the used RPCs from the DC/pooler to the cleaning
facility, cleaning and sanitizing processes, and unitization of the cleaned
containers in collapsed form for shipment. RPCs that are still in good condition
are shipped back to produce suppliers/growers for reuse, while containers that are
damaged or excessively worn are sent to an RPC manufacturing facility for
recycling into a new usable product;
7. Recycling of the produce container material, which includes transport of the RPC,
DRC, or NDC container materials to locations where the material is then re-
processed to prepare it for use in manufacture of another product; and
8. Postconsumer disposal of the produce container or container scrap which has
been used (in the case of the fiber container) or lost from the IFCO rental pool
during use due to theft or improper handling (in the case of RPCs); this step
includes transport of the container/container materials from the retailer to:
a. The site of landfill. and includes material-specific processes occurring at the
landfill, or
b. The site of waste-to-energy (WTE) incineration, and includes material-
specific processes occurring at the WTE facility
A summary flow diagram of the boundaries for the RPC and conventional fiber
corrugated container systems are shown in Figure ES-2 and Figure ES–3, respectively.

Executive Summary
10
Figure ES–2. RPC Product System Boundaries
4. Ancillary Materials
Manufacture
1.Resource Extraction
3. RPC Container
Conversion
Grower 5. Distribution
6. Cleaning &
Sanitization
Retailer
8a. Landfill
8b. Waste-
to-Energy
2. & 7.Materials Manufacture
Industrial Waste Recycling & Disposal
Containers to Recycling
Containers to
Reuse
Within Study Boundary
Outside Study Boundary
Intermediate Inputs from Technosphere
Treatment of Water
Capital Equipment
Human Capital
Elementary Inputs from Nature
Water
Raw Materials
Elementary Outputs to Nature
Water
Airborne Emissions
Waterborne Emissions
Intermediate Outputs to Technosphere
Treatment of Waste Water
Capital Equipment to be Recycled
Solid Waste to be Managed
Executive Summary
11
Figure ES–3. DRC & NDC (Fiber Container) Product System Boundaries
Executive Summary
12
ES.2.3. Data Sources
Primary data collected for this analysis include the empty container weight and materials
required for distribution of the RPCs as well as the transport distances for the distribution
specifications specific to IFCO operations in North America. Likewise, the cleaning and
servicing of used RPCs was modeled with primary data provided by IFCO. Production of the
polypropylene RPCs was modeled using primary data collected from IFCO’s suppliers. For data
that was not collected for this project, data from credible published sources or licensable
databases are used wherever possible in order to maximize transparency. Foreground data for
production of DRCs and NDCs are adapted from a gate-to-gate inventory of converted
corrugated containers published by the National Council for Air and Stream Improvement
(NCASI) in 2014.3 The LCI data for producing the virgin material and hog fuel inputs to the US
containerboard mills are represented by updated forestry LCI data from CORRIM Phase I and
Phase II Reports.4,5 The analysis used polypropylene resin data from the ACC Plastics Data
(updated in 2011) published in the US LCI Database.
ES.2.4. Recycling Methodology When material is used in one system and subsequently recovered, reprocessed, and used in
another application, there are different methods that can be used to allocate environmental
burdens among different useful lives of the material. The ISO standards for LCA note that
avoiding allocation (e.g., by expansion of system boundaries) is the preferred approach;
therefore, system expansion is the baseline approach used in this analysis. Under the system
expansion approach, recycling of a product can result in material displacement credits if the
system is a net producer of recycled material. In the case of the corrugated fiber produce boxes,
the recycling rate (95%) is greater than the recycled content of the box (15%), and the excess
recovered fiber is credited with displacing a mix of virgin unbleached fiber and recycled fiber
equivalent to the mix of virgin and recycled fiber in the recovered boxes (85% virgin, 15%
recycled).
An alternative recycling methodology used for sensitivity analysis is the “cut-off” method. With
the cut-off approach, a boundary is drawn between the initial use of the material and subsequent
recovery and recycling of the material, and recycled material leaves the system boundaries with
no collection and reprocessing burdens and no material displacement credits.
3 NCASI (2014). Life Cycle Assessment of U.S. Average Corrugated Product, Final Report. Prepared for the
Corrugated Packaging Alliance (CPA), a joint venture of the American Forest & Paper Association (AF&PA),
the Fibre Box Association (FBA), the Association of Independent Corrugated Converters (AICC), and TAPPI.
April 24, 2014. 4 Bowyer J, Briggs D, Lippke B, Perez-Garcia J, Wilson J (2004). Life Cycle Environmental Performance of
Renewable Materials in Context of Residential Building Construction: Phase I Research Report. Consortium for
Research on Renewable Industrial Materials, CORRIM Inc. Seattle, WA. Report modules accessed at:
http://www.corrim.org/pubs/reports/2005/Phase1/index.asp. 5 Lippke B, Wilson J, Johnson L, Puettmann M (2009). Phase II Research Report. Life Cycle Environmental
Performance of Renewable Materials in the Context of Building Construction. Consortium for Research on
Renewable Industrial Materials, CORRIM Inc. Seattle, WA. Report modules accessed at:
http://www.corrim.org/pubs/index.asp.
Executive Summary
13
ES.2.5. Reuse Modeling Approach
This study uses a modeling approach to account for the standard LCI basis of product
functionality in reusable product systems. In this case, the basis of comparison is the average
number of trips a corrugated container is expected to make before it is removed from service for
wear and/or damage—referred to here as the trip number (N). For the fiber produce container
system, the trip number (N) for each container is fairly straightforward because each fiber
container is used, on average, only once. Therefore, each shipment of produce in a fiber
container requires production and end-of-life management of a container. After use of the DRC
or NDC, the container is collected for end-of-life management which is, on average, a ratio of
recycling and disposal.
The IFCO plastic produce containers are reusable, on average, 39.3 times before they are
removed from service due to wear and/or damage (i.e., baseline (N) = 39.3). Thus, the material
consumed per RPC use is only a fraction of the total container weight that was originally
produced and this fraction depends on the life of the container. The more durable the container
and the more efficient the container reuse logistics, the higher the number of trips (N) the
container can make before it is removed from service for routine wear and/or damage. The
baseline (N) for RPCs is varied in the sensitivity analysis. There are also loss and breakage rates
(average 0.98%) that must be accounted for in per-use life cycle material requirements.
Production of additional containers is required to make up for the portion of containers lost
within the system due to disappearance (reflected in the analysis as the ‘loss rate’; average
0.8%). Also, a certain amount of RPC scrap will be generated from containers that are removed
from service due to breakage and/or wear. Overall, the percentage of RPC material consumed per
trip is calculated as
(1-breakage rate)/lifetime trips + loss rate = (1-0.0098)/39.3 + 0.008 = 0.033.
Production of the new RPC material may incorporate recycled resin, either internally generated
or purchased externally to meet the designated level of recycled content. The steady-state-
composition of the container supply (i.e., amount produced from virgin resin versus recycled
resin) depends on the amount of internally generated scrap and the level of recycled content
designated for each geographic scope. The internally generated recycled content of the steady-
state RPC composition is constrained by the amount of container scrap that is generated from
worn and broken containers that are returned to the manufacturer for recycling. .
RPCs tend to have a higher empty-container-weight-to-produce-capacity-weight (CW-PW) ratio.
In other words, due to their design and material, the RPCs have a higher weight than a single
corresponding fiber corrugated container. The additional weight of the empty RPC increases the
fuel requirements allocated to produce containers for each life cycle step. Also, for the RPC
systems, there are more transport steps required than for the fiber containers (i.e., for cleaning
and reuse). Overall, transportation requirements are generally higher for the RPCs as they are
heavier and are routed through centralized manufacture and servicing locations after each use
cycle. Because life cycle requirements for produce distribution are partially allocated to the
containers used to deliver the produce, it is intuitive to assume that the CW-PW would be
correlated with the environmental performance of the container system (i.e., the lower the ratio,
Executive Summary
14
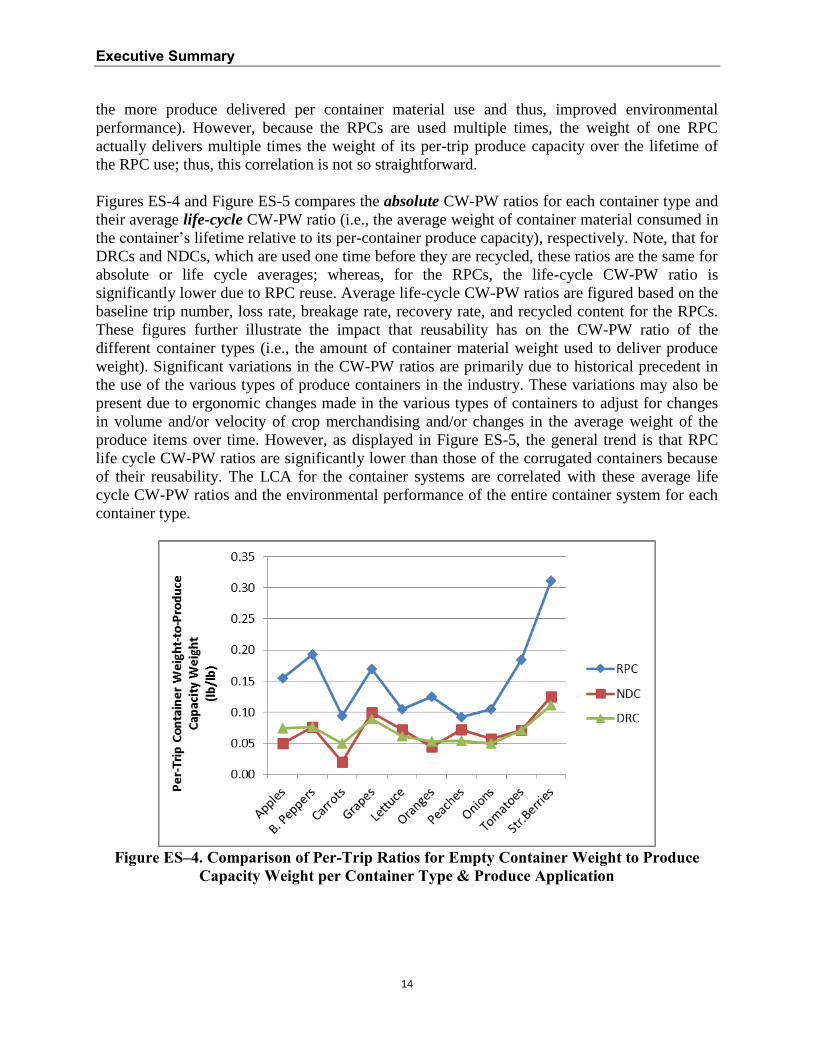
the more produce delivered per container material use and thus, improved environmental
performance). However, because the RPCs are used multiple times, the weight of one RPC
actually delivers multiple times the weight of its per-trip produce capacity over the lifetime of
the RPC use; thus, this correlation is not so straightforward.
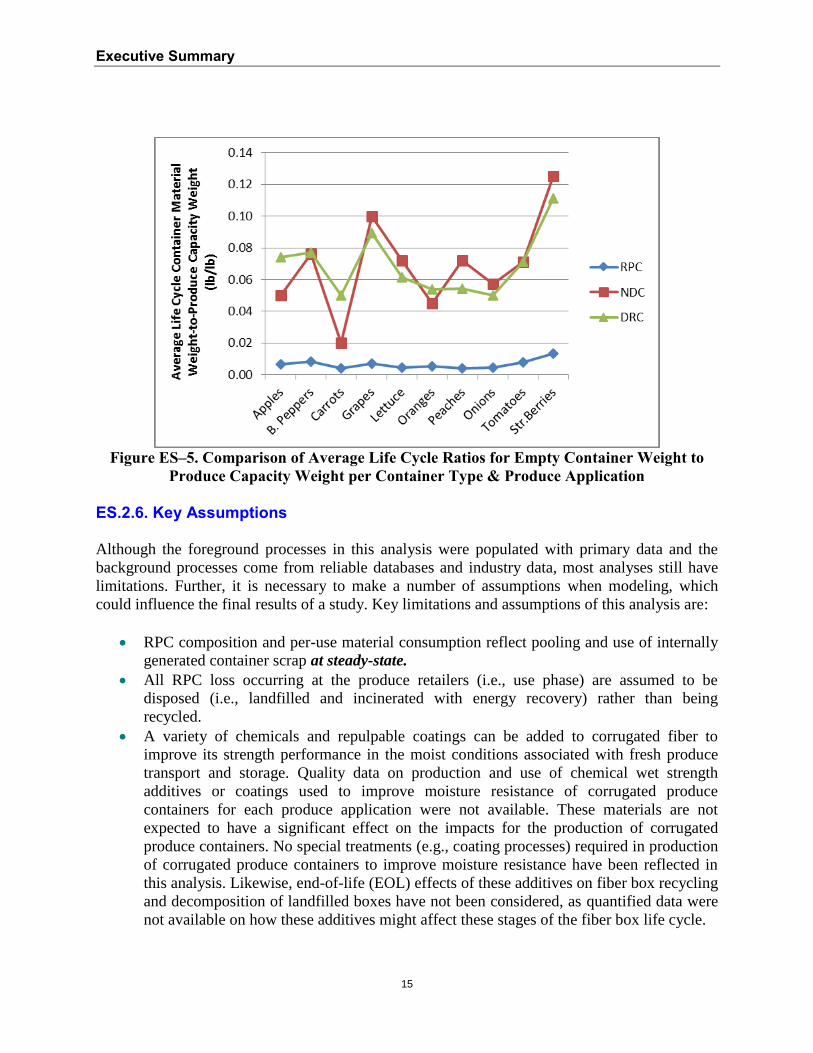
Figures ES-4 and Figure ES-5 compares the absolute CW-PW ratios for each container type and
their average life-cycle CW-PW ratio (i.e., the average weight of container material consumed in
the container’s lifetime relative to its per-container produce capacity), respectively. Note, that for
DRCs and NDCs, which are used one time before they are recycled, these ratios are the same for
absolute or life cycle averages; whereas, for the RPCs, the life-cycle CW-PW ratio is
significantly lower due to RPC reuse. Average life-cycle CW-PW ratios are figured based on the
baseline trip number, loss rate, breakage rate, recovery rate, and recycled content for the RPCs.
These figures further illustrate the impact that reusability has on the CW-PW ratio of the
different container types (i.e., the amount of container material weight used to deliver produce
weight). Significant variations in the CW-PW ratios are primarily due to historical precedent in
the use of the various types of produce containers in the industry. These variations may also be
present due to ergonomic changes made in the various types of containers to adjust for changes
in volume and/or velocity of crop merchandising and/or changes in the average weight of the
produce items over time. However, as displayed in Figure ES-5, the general trend is that RPC
life cycle CW-PW ratios are significantly lower than those of the corrugated containers because
of their reusability. The LCA for the container systems are correlated with these average life
cycle CW-PW ratios and the environmental performance of the entire container system for each
container type.
Figure ES–4. Comparison of Per-Trip Ratios for Empty Container Weight to Produce
Capacity Weight per Container Type & Produce Application
Executive Summary
15
Figure ES–5. Comparison of Average Life Cycle Ratios for Empty Container Weight to
Produce Capacity Weight per Container Type & Produce Application
ES.2.6. Key Assumptions
Although the foreground processes in this analysis were populated with primary data and the
background processes come from reliable databases and industry data, most analyses still have
limitations. Further, it is necessary to make a number of assumptions when modeling, which
could influence the final results of a study. Key limitations and assumptions of this analysis are:
RPC composition and per-use material consumption reflect pooling and use of internally
generated container scrap at steady-state.
All RPC loss occurring at the produce retailers (i.e., use phase) are assumed to be
disposed (i.e., landfilled and incinerated with energy recovery) rather than being
recycled.
A variety of chemicals and repulpable coatings can be added to corrugated fiber to
improve its strength performance in the moist conditions associated with fresh produce
transport and storage. Quality data on production and use of chemical wet strength
additives or coatings used to improve moisture resistance of corrugated produce
containers for each produce application were not available. These materials are not
expected to have a significant effect on the impacts for the production of corrugated
produce containers. No special treatments (e.g., coating processes) required in production
of corrugated produce containers to improve moisture resistance have been reflected in
this analysis. Likewise, end-of-life (EOL) effects of these additives on fiber box recycling
and decomposition of landfilled boxes have not been considered, as quantified data were
not available on how these additives might affect these stages of the fiber box life cycle.
Executive Summary
16
For the North American geographic scope, the bulk of raw material production included
in the LCI is assumed to occur in the US and associated electricity requirements are
consistently modeled with the average US fuel profile. However, in the sensitivity
analysis, regional electricity grid fuel mixes are applied for electricity requirements of
processes specific to the supply chain of RPC use (production, recycling, and cleaning) to
test the effect of this parameter on the overall results;
Inks and labels are determined to be below the one percent weight and environmental
significance cut-off criteria of the LCI per data collected for this analysis and are
excluded;
Transportation requirements inventoried for specific transportation modes are based on
industry averages for that mode; transportation modes (e.g., combination truck, single
truck, rail, barge, and ocean freighter) were selected based on primary data supplied by
the study commissioners;
Transportation requirements do not include environmental burdens for transporting the
weight of the produce contained within the RPCs, DRCs, and NDCs as the life cycle
burdens of the contained products are outside the scope of this study;
Estimates of the end results of landfilling and waste-to-energy (WTE) combustion are
limited to global warming potential (GWP) effects, electricity credits, and requirements
for transporting waste to a landfill and operating landfill equipment. Recycling energy
requirements are also taken into account.
ES.2.7. Sensitivity Analysis
The parameters varied in the sensitivity analysis in this study are:
1. Reuse rates (i.e., number of useful lives or trip number) for IFCO corporate-wide average
RPC
2. Loss rate for the RPCs at the produce retailers (use phase) through theft and/or
mishandling
3. Breakage rate for the RPCs during use, cleaning, and re-use cycles
4. Recovery yield at the RPC manufacturing facility’s container molding process (container
recycling)
5. Recycled content of the polypropylene RPC
6. Average distance from RPC use to a cleaning center to reflect centralized retailers
7. Recycling rates for end-of-life (EOL) fiber corrugated container material used in a retail
context
8. Geography dependent technologies for production, recycling, cleaning, & recycling RPCs
i.e., regional variations in electricity based on the eight North American Electric
Reliability Corporation (NERC) regional grids
9. Recycling methodology used in the LCI i.e., system expansion vs. cut-off
10. Best- and worst-case scenarios for the recycled content of fiber-based produce containers
The values for the trip number, loss rate, breakage rate, and recovery yield used in the baseline
scenario reflect the rates achieved and observed in IFCO’s North American operations; whereas,
those used in the sensitivity analysis reflect the most practical range of values given discussions
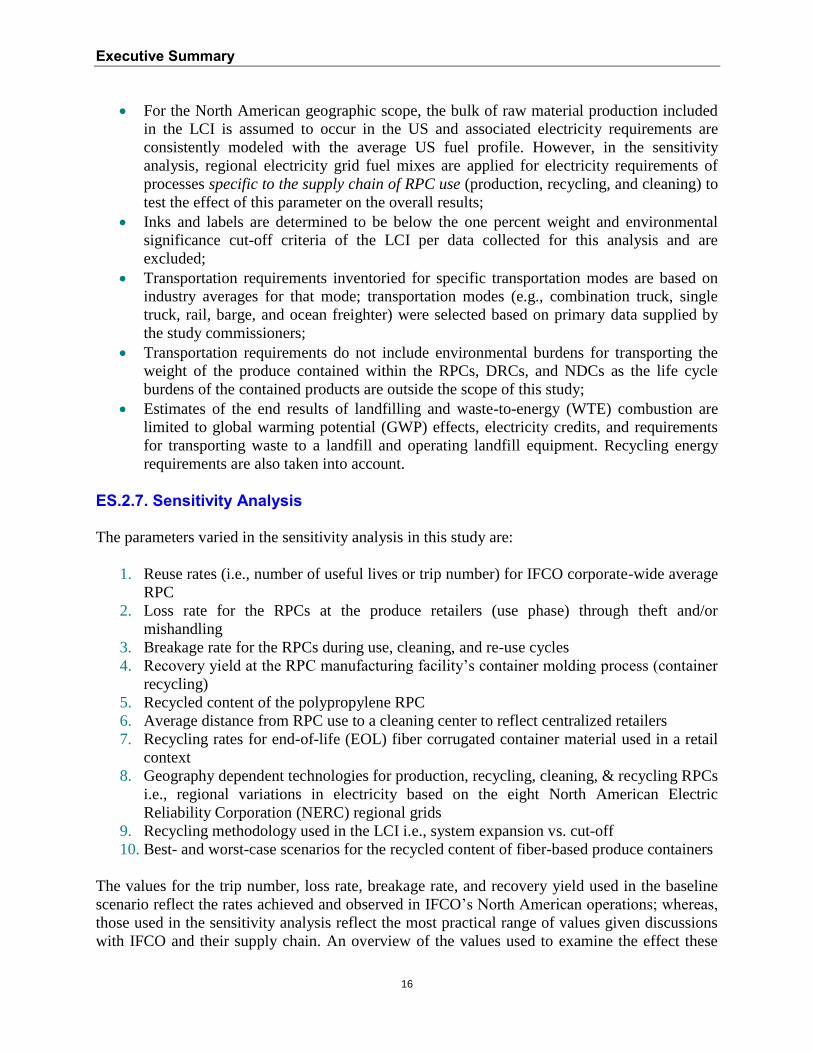
with IFCO and their supply chain. An overview of the values used to examine the effect these
Executive Summary
17
parameters have on the overall comparison of environmental burdens of the use of plastic versus
fiber produce containers is shown in Table ES–2.
Table ES–2. Parameter Values for the Sensitivity Analysis
Baseline Max or Interim Min
RPC Trip Number
39.3 72.9 23.4
RPC Loss Rate
0.80% 0.85% 0.75%
RPC Breakage Rate
0.98% 2.0% 0.10%
RPC Recycling Recovery Yield
98% 99% 97%
RPC Recycled Content
50% 100% 0%
RPC Cleaning Distance
398 miles 597 miles 199 miles
Fiber Containers' Recycling Rate
95% 78% 50%
Fiber Containers' Recycled Content
15% 52.7% 0%
Electricity Grid Mix (Region)
US Avg SPP NPCC
Recycling Allocation Methodology
System Expansion n/a Cut-Off
ES.3. KEY FINDINGS
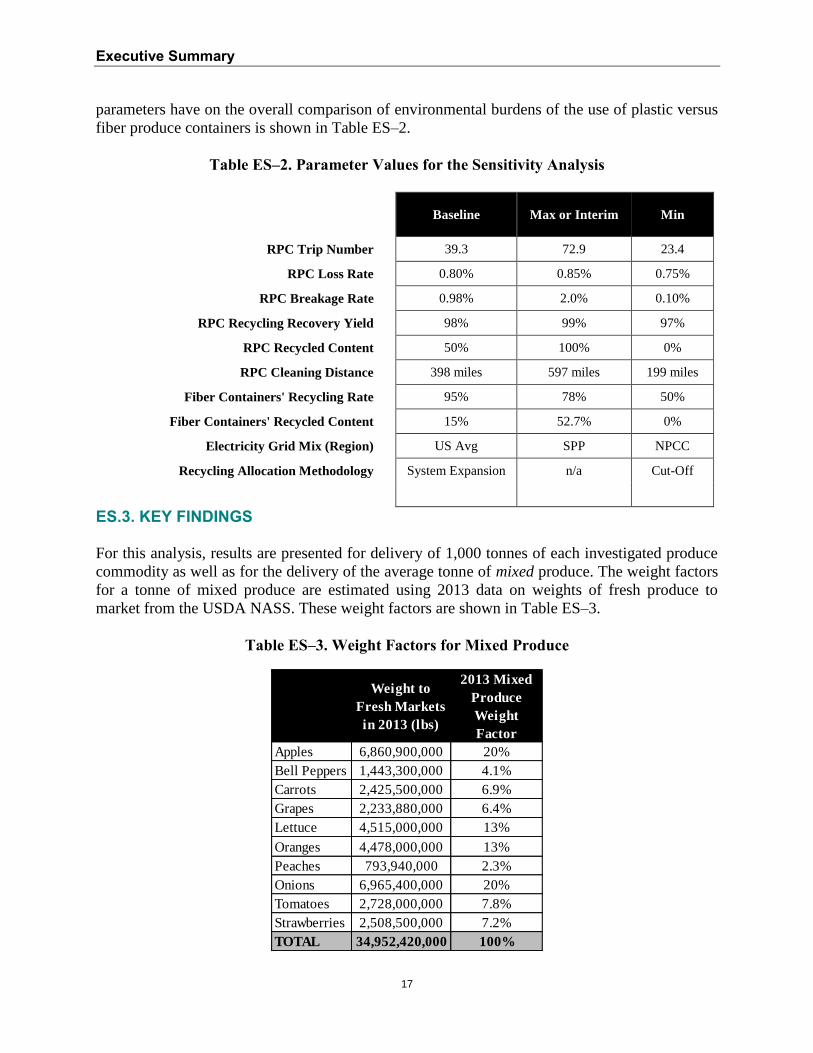
For this analysis, results are presented for delivery of 1,000 tonnes of each investigated produce
commodity as well as for the delivery of the average tonne of mixed produce. The weight factors
for a tonne of mixed produce are estimated using 2013 data on weights of fresh produce to
market from the USDA NASS. These weight factors are shown in Table ES–3.
Table ES–3. Weight Factors for Mixed Produce
Weight to
Fresh Markets
in 2013 (lbs)
2013 Mixed
Produce
Weight
Factor
Apples 6,860,900,000 20%
Bell Peppers 1,443,300,000 4.1%
Carrots 2,425,500,000 6.9%
Grapes 2,233,880,000 6.4%
Lettuce 4,515,000,000 13%
Oranges 4,478,000,000 13%
Peaches 793,940,000 2.3%
Onions 6,965,400,000 20%
Tomatoes 2,728,000,000 7.8%
Strawberries 2,508,500,000 7.2%
TOTAL 34,952,420,000 100%
Executive Summary
18
The LCI results are characterized for eight different LCIA indicators: global warming potential,
energy demand, ozone depletion potential, water consumption, acidification, eutrophication,
photochemical smog generation potential, and solid waste generation. Energy and solid waste
results are further disaggregated and presented in terms of types of energy (type by fuel source
and expended vs. feedstock) and types of solid waste (fuel-related, process and post-consumer
and landfilled, incinerated, and waste-to-energy shares).
For most of the impact categories examined in this study, the LCIA results are obtained using the
TRACI 2.1 characterization methodologies.6, TRACI 2.1 is an internationally accepted
methodology and selected by Franklin Associates as the most appropriate methodology to apply
in this study, i.e., with a North American geographic scope. Global warming potential is
characterized using factors from the Intergovernmental Panel on Climate Change (IPCC) Fifth
Assessment Report published in 20137. Cumulative energy demand is assessed with Franklin
Associates’ own method and includes both fossil and non-fossil energy. Results for water
consumption and solid waste generation are simply life cycle inventory (LCI) totals. Land-use
impacts are not included in the LCIA.
Table ES–4 compares the quantitative LCIA results for 1,000 tonnes of mixed produce delivered
in RPCs, DRCs, and NDCs in North America. This table also provides the potential
environmental savings that could be realized per 1,000 tonnes of produce by switching from
fiber produce containers to RPCs for distribution of produce in North America.
For this analysis, Franklin Associates considers that overall differences in LCI/LCIA results of
less than 25 percent for emissions, water consumption, and impact results and differences of less
than 10 percent for energy and solid waste should not be assumed to be significant. Given
uncertainties in LCI data and LCIA methods, these differences are reasonable thresholds for
considering results between product systems sufficiently disparate to be meaningful.
6 EPA’s Tool for the Reduction and Assessment of Chemical and Other Environmental Impacts (TRACI), see:
http://www.pre-sustainability.com/download/TRACI_2_1_User_Manual.pdf. 7 G. Myhre et al., Anthropogenic and Natural Radiative Forcing, in CLIMATE CHANGE 2013: THE PHYSICAL
SCIENCE BASIS. CONTRIBUTION OF WORKING GROUP I TO THE FIFTH ASSESSMENT REPORT OF THE
INTERGOVERNMENTAL PANEL ON CLIMATE CHANGE IPCC Table 8.7 at 714 (Cambridge Univ. Press 2013).

Executive Summary
19
Table ES–4. Baseline LCIA Results for Produce Containers
(Per 1,000 tonnes of produce delivered in North America)
For the baseline scenario, seven of the eight categories indicate significantly greater
environmental savings for use of IFCO RPCs relative to use of fiber DRCs and NDCs, while
differences in photochemical smog are not sufficiently disparate to make a conclusive
comparison.
Concluding Remarks
The RPC use savings are primarily due to the avoidance of energy consumption and emissions
incurred during the production of fiber DRCs and/or NDCs—processes that, despite
incorporating recovered fiber, must be repeated for the entire weight of the container for each
container use. The steady-state reuse process of delivering produce with RPCs only consumes
about 33/1000ths of the RPC container material per use cycle compared to 100 percent material
manufacturing and recycling required per use with shipments made in single-use fiber
containers.
In seven out of eight examined environmental indicators (energy demand, global warming
potential, ozone depletion potential, water consumption, acidification, eutrophication, solid waste
generation), the IFCO RPCs, as defined in this analysis, provides greater environmental savings
for delivering produce in North America than does the use of fiber corrugated containers for
these commodities.
The sensitivity analysis indicates that these conclusions are not changed for: 1) the range of
reuse rates (i.e., number of useful lives or trip number) projected for the average IFCO RPC, 2)
the range of RPC loss rates at the use phase, 3) the range of breakage rates for RPCs , 4) the
range of recovery yields at the RPC manufacturing/recycling step, 5) the range of recycled resin
content designated for reusable RPCs, 6) the variations in distances for the retail distribution to
IFCO RPC service center transportation leg, or 7) variations in the electricity grid fuel mix.
Conclusions regarding GWP shift in 3 sensitivities: 1) lower recycling rates for fiber corrugated
RPCs DRCs NDCs DRC --> RPC NDC --> RPC
Energy Demand GJ eq 1,682 2,537 2,420 34% 31%
Global Warming kg CO2 eq 87,768 127,514 121,392 31% 28%
Ozone Depletion kg CFC-11 eq 5.1E-04 0.0010 9.8E-04 51% 49%
Water Consumption m3 H2O 251 720 689 65% 64%
Acidification kg SO2 eq 345 666 633 48% 46%
Eutrophication kg N eq 17.5 63.4 60.5 72% 71%
Photochemical Smog kg O3 eq 9,539 10,155 9,554 6% 0.2%
Solid Waste kg SW 2,527 16,877 16,175 85% 84%
Meaningful difference (lower for RPCs)
Insignificant difference
Per 1,000 Tonnes of North American
Produce Delivered:
(Potential Savings: RPC Relative
to Fiber Containers)
Executive Summary
20
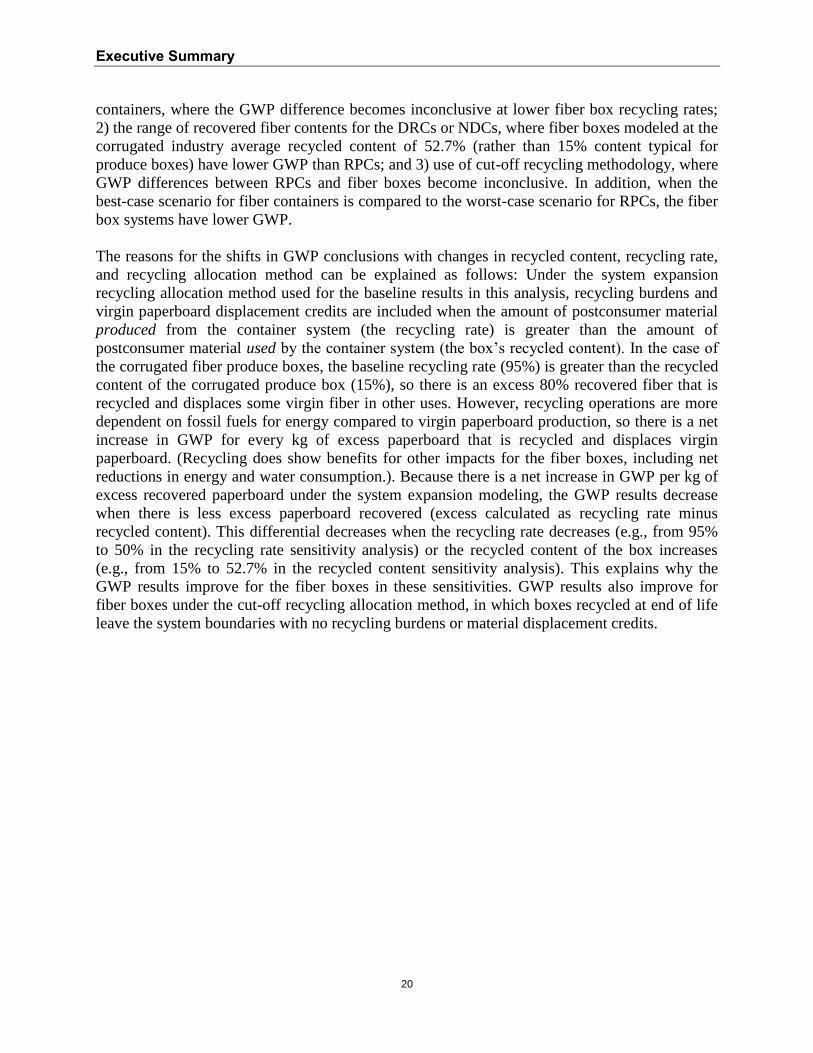
containers, where the GWP difference becomes inconclusive at lower fiber box recycling rates;
2) the range of recovered fiber contents for the DRCs or NDCs, where fiber boxes modeled at the
corrugated industry average recycled content of 52.7% (rather than 15% content typical for
produce boxes) have lower GWP than RPCs; and 3) use of cut-off recycling methodology, where
GWP differences between RPCs and fiber boxes become inconclusive. In addition, when the
best-case scenario for fiber containers is compared to the worst-case scenario for RPCs, the fiber
box systems have lower GWP.
The reasons for the shifts in GWP conclusions with changes in recycled content, recycling rate,
and recycling allocation method can be explained as follows: Under the system expansion
recycling allocation method used for the baseline results in this analysis, recycling burdens and
virgin paperboard displacement credits are included when the amount of postconsumer material
produced from the container system (the recycling rate) is greater than the amount of
postconsumer material used by the container system (the box’s recycled content). In the case of
the corrugated fiber produce boxes, the baseline recycling rate (95%) is greater than the recycled
content of the corrugated produce box (15%), so there is an excess 80% recovered fiber that is
recycled and displaces some virgin fiber in other uses. However, recycling operations are more
dependent on fossil fuels for energy compared to virgin paperboard production, so there is a net
increase in GWP for every kg of excess paperboard that is recycled and displaces virgin
paperboard. (Recycling does show benefits for other impacts for the fiber boxes, including net
reductions in energy and water consumption.). Because there is a net increase in GWP per kg of
excess recovered paperboard under the system expansion modeling, the GWP results decrease
when there is less excess paperboard recovered (excess calculated as recycling rate minus
recycled content). This differential decreases when the recycling rate decreases (e.g., from 95%
to 50% in the recycling rate sensitivity analysis) or the recycled content of the box increases
(e.g., from 15% to 52.7% in the recycled content sensitivity analysis). This explains why the
GWP results improve for the fiber boxes in these sensitivities. GWP results also improve for
fiber boxes under the cut-off recycling allocation method, in which boxes recycled at end of life
leave the system boundaries with no recycling burdens or material displacement credits.
Executive Summary
21