executive summary h-final - home | sswm · executive summary june 2002 final ... 1.2 scope of work...
TRANSCRIPT

FEDERAL DEMOCRATIC REPUBLIC
OF ETHIOPIA Addis Ababa Water and Sewerage Authority
Wastewater Masterplan
Volume 1
Executive Summary June 2002
Final
Project No.: 7 ACP.ET.104
Design Study Services
Addis Ababa Sanitation
Improvement Project
File Q 011001 001
Date
Registration number
European Commission
European Development Fund

Wastewater Masterplan NEDECO
Volume I - Executive Summary i
CONTENTS PAGE
1 INTRODUCTION 1 1.1 This Report 1 1.2 Scope of work 1 1.3 Objectives 1 1.4 Implementation Results 2 1.5 Urbanisation and Population Development 2 1.6 Water Supply 4 1.7 Sanitation 5
1.7.1 Existing Sewer System 5 1.7.2 Waste Water Treatment 6 1.7.3 On-site Sanitation Facilities 6 1.7.4 Sludge disposal 7 1.7.5 Public Health in Addis Ababa 7 1.7.6 Gender and Development 7
1.8 EIA for Recent Sanitation Projects 8
2 THE MASTERPLAN 9 2.1 Sludge Collection and Disposal 9 2.2 Sanitation 12
2.2.1 Assumed domestic and non-domestic flows and BOD loads 12 2.2.2 Kaliti catchment 13 2.2.3 Eastern catchment 20 2.2.4 Akaki catchment 25
2.3 Wastewater Treatment 30 2.3.1 Domestic Wastewater 30 2.3.2 Industrial Wastewater 30 2.3.3 Forecast to the waste water treatment works 30 2.3.4 Kaliti WWTW 31 2.3.5 Eastern Catchment WWTW 33 2.3.6 Akaki catchment WWTW 35 2.3.7 Descriptions of different waste water treatment processes 37 2.3.8 Evaluation of different treatment options 37 2.3.9 Recommendations for WWTW 39
2.4 Ranking of Components 39 2.4.1 Possible implementation schedule 43
2.5 Environmental Screening 46
3 FINANCIAL AND ECONOMIC ANALYSIS 49 3.1 Introduction 49 3.2 Financial analysis 49
3.2.1 Project capital investments 51 3.2.2 Sludge collection costs and revenues 52 3.2.3 Operating costs and revenues of AAWSA for sanitation activities 56 3.2.4 Financial project cash flow before funding 57 3.2.5 Project funding 59 3.2.6 Financial statement projections 59
3.3 Economic analysis 63 3.4 Sensitivity tests 64

Wastewater Masterplan NEDECO
Volume I - Executive Summary ii
4 SUMMARY OF RECOMMENDATIONS 67 4.1 Sewerage 67 4.2 Sludge collection, treatment and disposal 67 4.3 Wastewater treatment plants 67 4.4 Institutional 68 4.5 Financial 68 4.6 Implementation 68
5 COLOPHON 70

Wastewater Masterplan NEDECO
Volume I - Executive Summary iii
LIST OF FIGURES PAGE Figure 1-1 Population projection Addis Ababa (different studies) ....................................................3 Figure 1-2 Average daily flows to Kaliti treatment works (source : AAWSA).................................6 Figure 2-1 projected sludge production of Pit latrine and Septic Tank............................................10 Figure 2-2 proposed Sludge disposal scheme ..................................................................................11 Figure 2-3 Kaliti catchment stage 1+2.............................................................................................18 Figure 2-4 Kaliti catchment stage 3 .................................................................................................19 Figure 2-5 Kaliti catchment stage 1,2 & 3 .......................................................................................24 Figure 2-6 Eastern catchment stage 1, 2 and 3.................................................................................29 Figure 2-7 Population served and capacity of Kaliti WWTW.........................................................33 Figure 2-8 Flow and capacity of Eastern WWTW...........................................................................34 Figure 2-9 Flow and capacity to Akaki I WWTW...........................................................................36 Figure 2-10 Flow and capacity of Akaki II WWTW .......................................................................37 LIST OF TABLES PAGE Table 1-1 Population projection per sewer catchment.......................................................................4 Table 1-2 Water supply customer consumption.................................................................................4 Table 1-3 Distribution of toilet facilities by housing unit Addis Ababa (1994 CSA)........................5 Table 2-1 Estimated costs for HP vacuum trucks ............................................................................11 Table 2-2 Average domestic flow to sewer......................................................................................12 Table 2-3 Average non-domestic flow and BOD load to WWTW..................................................13 Table 2-4 Summary of future connections and hydraulic and BOD loads for the Kaliti catchment14 Table 2-5 Stage 1 sewerage costs in the Kaliti catchment ...............................................................16 Table 2-6 Stage 2 sewerage costs in the Kaliti catchment ...............................................................16 Table 2-7 Stage 3 sewerage costs in the Kaliti catchment ...............................................................17 Table 2-8 Summary of future connections and hydraulic and BOD loads for the Eastern catchment
..................................................................................................................................................20 Table 2-9 Stage 1 sewerage costs in the Eastern catchment ............................................................22 Table 2-10 Stage 2 sewerage costs in the Eastern catchment ..........................................................22 Table 2-11 Stage 3 sewerage costs in the Eastern catchment ..........................................................23 Table 2-12 Summary of future connections and hydraulic and BOD loads for the Akaki catchment
..................................................................................................................................................25 Table 2-13 Stage 1 sewerage costs in the Akaki catchment ............................................................27 Table 2-14 Stage 2 sewerage costs in the Akaki catchment ............................................................27 Table 2-15 Stage 3 sewerage costs in the Akaki catchment ............................................................27 Table 2-16 Kaliti catchment – Treatment or diversion disposal options .........................................31 Table 2-17 Estimated cost for waste water treatment options in Kaliti catchment ..........................32 Table 2-18 Eastern Catchment – Treatment or diversion options....................................................33 Table 2-19 Estimated cost for treatment options in Eastern catchment ...........................................34 Table 2-20 Akaki Catchment – Treatment or disposal options........................................................35 Table 2-21 Estimated costs for treatment options in Akaki catchment............................................36 Table 2-22 Advantages and disadvantages of the individual treatment processes...........................38 Table 2-23 Breakdown of Scores for Prioritising Sewer phasing....................................................40 Table 2-24 Kaliti catchment implementation priority......................................................................41 Table 2-25 Eastern catchment implementation priority...................................................................42 Table 2-26 Akaki catchment implementation priority .....................................................................43 Table 2-27 Implementation schedule...............................................................................................44 Table 2-28 Yearly expenditure schedule..........................................................................................45
Wastewater Masterplan NEDECO
Volume I - Executive Summary iv
Table 2-29 Proposed interventions and recommended environmental studies; Kaliti sewer District..................................................................................................................................................46
Table 2-30 Proposed interventions and recommended environmental studies; Eastern Sewer District......................................................................................................................................47
Table 2-31 Proposed interventions and recommended environmental studies; Akaki sewer District..................................................................................................................................................47
Table 2-32 Proposed interventions and recommended environmental studies; various projects.....48 Table 3-1 Investment and operating costs comparison of project options (2001 – 2020, ETB
millions) ...................................................................................................................................51 Table 3-2 Project investment summary, with case (ETB millions)..................................................51 Table 3-3 Sludge collection by 12 m3 HPV or 8 m3 vacuum truck, cost price comparison
(ETB/trip).................................................................................................................................53 Table 3-4 Septic tanks and pit latrines emptied every year (with / without case, thousands/year) ..54 Table 3-5 Sludge collection trips by truck type regardless of ownership (with / without case,
thousands of trips/year) ............................................................................................................54 Table 3-6 Sludge collection revenues and costs, AAWSA and others (with / without case, ETB
millions/year) ...........................................................................................................................55 Table 3-7 Sewer and sludge connection and maintenance costs for customers (ETB)....................55 Table 3-8 Sanitation related annual operating cost summary for AAWSA (ETB millions)............56 Table 3-9 Wastewater tariff structure, all consumers except public fountains (ETB/m3)................56 Table 3-10 Wastewater income developments.................................................................................57 Table 3-11 Summary of income developments for AAWSA (ETB million)...................................57 Table 3-12 Financial cash flows analysis for catchments and project (NPV in ETB million, at a
discount rate of 10%) ...............................................................................................................58 Table 3-13 Profit & loss account projections for sewerage and sludge activities of AAWSA (ETB
millions) ...................................................................................................................................60 Table 3-14 Flow of funds projections for sewerage and sludge activities of AAWSA (ETB
millions) ...................................................................................................................................60 Table 3-15 Balance sheet projections for sewerage and sludge activities of AAWSA (ETB
millions) ...................................................................................................................................61 Table 3-16 Merged Profit & loss account projections for AAWSA as an entity (ETB millions)....61 Table 3-17 Merged Flow of funds projections for AAWSA as an entity (ETB millions) ...............62 Table 3-18 Merged Balance sheet projections for AAWSA as an entity (ETB millions) ...............62 Table 3-19 Economic cash flows analysis for catchments and project (NPV in ETB million, at a
discount rate of 10%) ...............................................................................................................64 Table 3-20 Sensitivity of variations in contingencies on investments at project level ....................65 Table 3-21 Sensitivity on variations in working capital requirements at project level ....................65 Table 3-22 Sensitivity on combined health, forgone land use and real estate effects at project level
..................................................................................................................................................66 Table 3-23 Sensitivity on real tariff increases at project level .........................................................66

Wastewater Masterplan NEDECO
Volume I - Executive Summary v
List of Abbreviations and Expressions Abbreviation or expression Description AASIP Addis Ababa Sanitation Improvement Project AAWSA Addis Ababa Water and Sewerage Authority ADLI Agricultural Development-Led Industrialization BOD Biochemical Oxygen Demand COD Chemical Oxygen Demand CSA Central Statistical Authority CSE Conservation Strategy of Ethiopia COBWAS Community Based Water Supply and Sanitation Project DI Ductile Iron EDF European Development Fund EIA Environmental Impact Assessment EMU Environmental Monitoring Unit (AAWSA) EPA Environmental Protection Agency EPB Environmental Protection Bureau (Addis Ababa City Administration) ETB Ethiopian Birr EPE Environmental Policy of Ethiopia EU European Union EURO Euro, currency of the European Union FDRE Federal Democratic Republic of Ethiopia GoE Government of the Federal Democratic Republic of Ethiopia HP High Performance IRR Internal Rate of Return MEDAC Ministry of Economic Development Cooperation MPWFAA Masterplan Study for the Development of Wastewater Facilities for the
City of Addis Ababa (1993) NPV Net Present Value P.e. Population equivalent TDS Total Dissolved Solids ToR Terms of Reference TSS Total Suspended Solids UASB Upflow Anaerobic Sludge Blanket UNDO United Nations Industrial Development Organisation VIP Ventilated Improved Pit WID Women in Development WHO World Health Organization WTCZ Warm Temperate Climate Zone WWTW Wastewater Treatment Works

Wastewater Masterplan NEDECO
Volume I - Executive Summary 1
1 INTRODUCTION
1.1 This Report
This report is the Executive Summary of the Wastewater Masterplan, which has been updated for the Addis Ababa Water and Sewerage Authority (AAWSA). The Masterplan is a revision and update of the previous Masterplan prepared in 1993. It includes the results of studies, investigations and outline designs made in order to develop a strategy for the sewerage for the whole of Addis Ababa. This report is in four volumes: Volume I: Waste Water Masterplan - Executive Summary; Volume II: Waste Water Masterplan - Existing situation; Volume III: Waste Water Masterplan - Main Report; Volume IV: Waste Water Masterplan - Appendices. It must be emphasised that this report is an update of the 1993 Masterplan. Therefore, this report must be read in conjunction with the 1993 Masterplan. Many of the conclusions and recommendations contained in that report are still valid today.
1.2 Scope of work
The scope of works for the update of the Wastewater Masterplan study are defined in the terms of reference as: “The consultant shall review and update the Masterplan study for the development of wastewater facilities for the city of Addis Ababa. He shall identify priorities and recommend a sanitation project for possible financing by the European Development Fund (EDF) or by others." The recommended project may be multi-component. The cost estimate should not exceed Ecu 35 million. It is not expected that EDF alone will finance the implementation of all the recommended works/ services. Rather it is intended that this study should facilitate decision for financing in the sanitation sub-sector by EDF and by other multi-lateral and bi-lateral financing agencies.”
1.3 Objectives
The objective of the Masterplan is to improve the standard of living health of the citizens of Addis Ababa. To achieve this objective the Wastewater Masterplan must address the following issues. 1. Implementation and improvement of on site sanitation (by community based water and
sanitation project). 2. Collection and disposal of sludge from septic tanks and dry pit latrines. 3. Improvement of sewer connections in sewered areas. 4. Provision of sewerage to un-sewered areas in Addis Ababa. 5. Treatment of collected sewage.

Wastewater Masterplan NEDECO
Volume I - Executive Summary 2
This updated Masterplan includes items 2 to 5 above. On-site sanitation was excluded as it is a separate component.
1.4 Implementation Results
Implementation of the updated Wastewater Masterplan will result in the provision of sanitation services to Addis Ababa in 2020 as presented below. Population served by sewers 960,000 Population served by septic tanks 1,366,000 Population served by dry pit latrines 1,366,000 Government, Institutional and commercial connected 16,800 Hotels and hospitals connected 175 Main Industries connected 58 Small and medium industries connected 1,250 Total number of connections 145,000 Average sewage flow (m3/day) 160,000 Annual septic tank sludge collected and treated (m3) 454,000 Annual dry pit contents collected and disposed of (m3) 61,500 With approximately 2000 connections and foul sewage flows of approximately 1,500m3/day at present the construction and operation of the proposed sewage system will make a considerable contribution to improving the health and standard of living of the population in Addis Ababa.
1.5 Urbanisation and Population Development
The main purpose of preparing Masterplans is to bring about a better standard of living, be it in the economic sector, health sector, or social sector for the population. The actual population size of a given urban centre at any time in the future is of paramount importance in the preparation of a Masterplan as well as well during its implementation. The official population projections, based upon the results of the 1994 census have been prepared by the CSA and became available only in 1999. Methodology In the preparation a Masterplan for a given city or urban centre a major problem is the delimitation of the city boundaries. Once the boundaries of the city are defined, the next step is to assess and forecast the growth in population (the population dynamics). Finally, when the overall population has been projected, the (internal) distribution of the population within the city boundaries has to be assessed. The purpose of a population growth forecasts at city level is to anticipate the changes in population size and characteristics. There are two main methods of forecasting population growth. • Projecting the population using mathematical functions applied to population growth rates,
which are usually calculated, based on historic data. Among the common mathematical functions are linear, exponential and logistic functions;

Wastewater Masterplan NEDECO
Volume I - Executive Summary 3
• Cohort component method: This procedure takes into account the future effects of the components of population growth i.e. mortality, fertility and migration. Based on past information, assumptions are made about future trends in these components.
The projections made in the context of the 1994 Wastewater Masterplan Study (MPWFAA), the Water Supply Stage III-A study (AAWSP III) and the Urban Masterplan used mathematical functions for the population projections. The MPWFAA used the results of the 1984 census as their baseline and the AAWSP III and Urban Masterplan used the results of the 1994 census. In all cases only one growth scenario was developed. Comparison of results The population growth forecasts in the MPWFAA are relatively old and are not now considered reliable. Comparison of the three population growth scenarios of the CSA with the single growth forecasts of the AAWSP III and Urban Masterplan show some alarming differences, especially at the end of the water supply project horizon. The projections prepared by the different studies are shown in Figure 1-1. As can be seen, comparison of the AAWSP III and the Urban Masterplan population forecasts for the year 2010 - 2020, shows a substantial difference even with the high variant of the CSA projection. From a demographic point of view, the discrepancy occurred due to the different methods employed in the projection. AAWSP III and the Urban Masterplan used mathematical models with probably exponential functions. This can be observed from Figure 1-1, where the curve tends to move upwards after a few years. The CSA projection results seem more plausible as they are based on assumptions that tried to foresee the impact of the population policy of 1993 and the women policy of 1993.
Figure 1-1 Population projection Addis Ababa (different studies)
Population Projections - Addis Ababa (1994 - 2030)as prepared by various institutions and studies
2000000
2500000
3000000
3500000
4000000
4500000
5000000
5500000
6000000
6500000
7000000
2000 2005 2010 2015 2020 2025 2030
year
tota
l pop
ulat
ion
1993 WW MP WS Stage IIA
Urban MP
CSA (low)
CS A (high)
CSA (adopted)

Wastewater Masterplan NEDECO
Volume I - Executive Summary 4
In Table 1-1 it can be seen that at present about 52% of the population (1.2 million people) live in approximately 10% of the urban area. Given the fact that the overall development strategy of the Urban Masterplan foresees almost zero growth in the existing core area, by 2020 the population living in the city centre will amount to about 1.3 million people but will then represent only 32% of the total population of the city. In the medium term, the expansion areas immediately surrounding the urban area of Addis Ababa and Akaki will absorb the population growth. When they reach their saturation level (between 100 and 200 persons/ha) the growth will overflow to the future expansion areas lying to east, south west and rural Akaki areas. At the design horizon of 2020 the predicted population for Addis Ababa is 4.25 million.
Table 1-1 Population projection per sewer catchment
For definition of service area boundaries see section 2.2.
1.6 Water Supply
Addis Ababa has a potable water supply since 1901. The water supply consumption data in 1998 is shown in Table 1-2. It should be noted that the present number of customers (2001) is 180,000.
Table 1-2 Water supply customer consumption
Description No. of connections
Total consumption
<15m3/
month 16-40m3/ month
>40m3/ month
Domestic 102,900 2,663,800 1,133,600 660,200 870,000 Industry 1,000 284,300 12,000 12,700 259,600 Others 13,100 2,303,000 156,600 155,600 1,990,800 Public fountains 50 5,000 500 800 3,700
Total 117,050 5,256,100 1,302,700 829,300 3,124,100
2000 2005 2010 2015 2020
Sewer command area Area (ha)Total population
Total population
Total population
Total population
Total population
Addis Ababa 53,915 2,495,000 2,887,000 3,328,000 3,792,000 4,246,000
Kaliti 19,465 36% 2,050,790 82% 2,247,090 78% 2,397,630 72% 2,446,290 65% 2,478,180 58%
442,090 533,220 574,330 584,530 591,600
Ka-A 6,840 927,680 957,320 964,970 960,710 954,050 Ka-A sevice area existing network 165,540 189,430 198,770 200,950 202,560
Ka-B 5,660 880,180 976,120 1,019,090 1,026,890 1,029,800 Ka-B sevice area existing network 276,550 343,790 375,560 383,580 389,040
Ka-C 3,830 201,510 259,750 338,230 360,520 377,640 Ka-D 3,135 41,420 53,900 75,340 98,170 116,690
Bole 16,955 31% 242,210 10% 309,270 11% 461,700 14% 719,810 19% 995,690 23%
Bo-A 7,085 209,030 268,800 335,820 388,190 433,480 Bo-B 5,550 29,060 35,890 89,820 208,820 325,700
Bo-C 1,420 1,500 1,680 15,680 56,740 109,220
Bo-D 2,900 2,620 2,900 20,380 66,060 127,290
Akaki 17,495 32% 202,000 8% 330,640 11% 468,670 14% 625,900 17% 772,130 18%
Ak-A 5,955 42,900 90,880 138,360 185,770 219,450 Ak-B 6,300 129,260 189,360 223,770 251,440 276,580
Ak-C 5,240 29,840 50,400 106,540 188,690 276,100
Per
cent
age
of
tota
l pop
ulat
ion
Per
cent
age
of
tota
l pop
ulat
ion
Per
cent
age
of
tota
l pop
ulat
ion
perc
enta
ge o
f ci
ty a
rea
Per
cent
age
of
tota
l pop
ulat
ion
Per
cent
age
of
tota
l pop
ulat
ion

Wastewater Masterplan NEDECO
Volume I - Executive Summary 5
To assess the future demand for water, the first step was to make an assessment of the current consumption and service levels. The current situation can be summarised as follows: • The current (2000) average domestic consumption amounts to about 22 litres/capita/day. • People with in-house services (about 4% of the population) use on average between 80 and
100 litres/capita per day, while the remaining population with access to safe drinking water (94%) are served by yard connections and use between 15 and 30 litres/capita per day.
• Non-domestic use, excluding industrial water use is substantial and amounts to about 25 litres/capita day.
• The industries use about 7 litres/capita per day of which about 40% is provided by AAWSA and the remaining amount is produced by the industries themselves (deep wells).
• Actual net demand is estimated as 75 litres/capita/day. • Water sold is on average 52 litres/capita/day Present water supplies are approximately 180,000 m3/day. Following development of the Gerbi and Sibilu dams and associated treatment plants the projected capacity in 2010 will be approximately 850,000 m3/day. This increase in capacity will have a significant affect on the wastewater generated within the city. Water sold is forecast to increase from 125,000 m3/day in 2000 to 460,000 m3/day in 2020, 80% of which can be expected to be discharged as sullage and black water.
1.7 Sanitation
Sanitation services figures in Addis Ababa are shown in Table 1-3.
Table 1-3 Distribution of toilet facilities by housing unit Addis Ababa (1994 CSA) Type of sanitary facility
Flush Toilet
Private
Flush Toilet Shared
Pit Latrine Private
Pit Latrine Shared
No sanitary facility
Not Stated
No. 30,113 14,815 67,895 169,732 89,508 3,679 Percentage 8% 4% 18% 45% 24% 1%
It can be seen that the majority of the population Addis Ababa use either septic tanks or dry pit latrines.
1.7.1 Existing Sewer System
The existing sewer system is located in the Kaliti catchment. The trunk sewers have a total length of approximately 30 km with approximately 90 km of secondary sewers and laterals. The number of people connected to the existing sewer system is about 13,000 (see Figure 2-4) with institutional and commercial connections contributing a further 27,000 p.e. According to AAWSA records, there are about 1800 connections on to the existing sewer system. As the first sewers were completed in 1982 it can be seen that the rate of connections is very low and has not improved since 1993.

Wastewater Masterplan NEDECO
Volume I - Executive Summary 6
AAWSA is trying to improve the sanitation situation, however their efforts have been limited by severe budget constraints. The system of faecal sludge collection and disposal has been improved by increasing overall the capacity of sludge collection trucks, construction of sludge transfer stations and construction of drying beds and sludge lagoons at Kaliti and Kotebe. AAWSA is also slowly expanding the network of secondary sewer lines in order to give more people access to the sewerage system.
1.7.2 Waste Water Treatment
The sewage effluent is treated in a waste water treatment works at Kaliti, which consist of two treatment trains each with two facultative and two maturation ponds in series. The existing recirculation system of the treatment works is currently not in use. The capacity of the treatment works was quoted in the original design document as 7,600 m³/day with a Biochemical Oxygen Demand (BOD5) load of 3,500 kg/day. Even though, the design capacity of the works is about 7600m³/d, recent records show that the average daily dry season flow is 4,500m³/d. Based on a total sewer length of 120km and an average infiltration rate of 0.25litres/second/km it can expected that infiltration is approximately 3,000m3/day. Sewage flows are thus 1,500m3/day. The average monthly inflow at the Kaliti plant is shown in Figure 1-2. This figure gives a clear indication that during the rainy season surface water inflow can double dry season flows.
Figure 1-2 Average daily flows to Kaliti treatment works (source : AAWSA)
1.7.3 On-site Sanitation Facilities
The majority of the population of Addis Ababa uses either septic tanks or dry pit latrines. The environmental sanitation case study for Addis Ababa, conducted in 1997, indicated that about 210,000 people were using septic tanks and 1,460,000 people used individual or shared dry pit latrines.
Kaliti Treatment Plant - Average Daily flow (Sep 19 99 - Sep 2000)
0
2000
4000
6000
8000
10000
12000
14000
16000
18000
Sep Oct Nov Dec Jan Feb Mar Apr May Jun Jul Aug Sep
Month
Flo
w [m
³/day
]

Wastewater Masterplan NEDECO
Volume I - Executive Summary 7
One of the disadvantages of on-site sanitation is that emptying of the pit or the tank is required. This causes problems in the densely populated areas of Addis Ababa, as the access to the tanks or pits is difficult. Following the recommendations of the 1993 Masterplan, six 3m³ vacuum trucks and twelve small portable pumps and tankers were purchased to empty dry pit latrines in difficult areas. Due to the poor condition of most of the access tracks, steep gradients and poor pumping characteristics of the dry pit latrine contents, the operation of the portable pumps has been discontinued. The transfer stations are however used by the 3m³ vacuum trucks. The sludge of these small trucks is taken to one of the four transfer stations and transferred into a large truck. The standard procedure to empty a pit latrine is to add water to the pit and liquefy the contents to allow them to be pumped. This only liquefies part of the contents leaving most solids in the pit.
1.7.4 Sludge disposal
The sludge from the dry pit latrines and the septic tanks is treated in Kaliti and Kotebe. The sludge drying beds and lagoons in Kaliti are able to treat approximately125,000 m³/year of sludge and consists of 8 drying beds and one sludge storage lagoon. The sludge disposal facility at Kotebe has the capacity to treat approximately 150,000 m³/year and consists of 20 drying beds and 10 lagoons. The sludge lagoons are used in the rainy season to store sludge until the dry season. From the sludge lagoons the sludge can be pumped to the drying beds. The sludge cannot be directly used as a fertilizer for agriculture as it is contaminated with pathogens and helminth (intestinal worm) eggs.
1.7.5 Public Health in Addis Ababa
Diseases related to poor sanitation have been relatively constant for the last three years in Addis Ababa. In the past few years an increase in the incidence of helminth diseases has been reported. The level of diseases is highest in the four most densely populated Kebeles where poor conditions of sanitation like overflowing toilets, high sullage flows, decomposing garbage and the absence or inadequate supply of potable water is relatively common. Also the poor level of nutrition and the low standard of living of the inhabitants of these areas increases their susceptibility to diseases. As Addis Ababa has a highland climate with moderate temperatures and little rainfall outside the rainy season, the rate of diseases related to poor sanitation is lower than could be expected.
1.7.6 Gender and Development
The total Projected population of Addis Ababa for 2001 is 2,500,000 of which 1,333,000 are female, i.e. 52 per cent, compared to 48% male population. Although women form majority of the population, the isolation of women from all forms of development and lack of attention to the gender based roles that people in a community play, has been one of the major constraints to the success of various development programs in Addis Ababa. The provision of adequate sanitation is of much more importance to women than to most men.

Wastewater Masterplan NEDECO
Volume I - Executive Summary 8
1.8 EIA for Recent Sanitation Projects
Environmental Impact Assessments (EIA) have been carried out for the following: • Sludge Treatment Facility at Kotebe; • Sludge Treatment Facility at Kaliti; • Sludge Transfer Stations (4 sites); • Sludge Collection Equipment (used for collection of sludge). The main environmental issues and proposed mitigation measures at Kotebe and Kaliti Sludge Treatment Facilities can be summarised as: 1. Health and Safety
Training and awareness program for workers related to handling hazardous materials, together with the provision of adequate protective clothing and medical services.
2. Bad Odours Creation of a buffer zone between residential areas and drying beds and lagoons.
3. Contamination of Water Resources Proper dried sludge disposal at sanitary landfill sites and disposal of seepage water.
4. Attraction of sites to birds, wild animals and insects Proper disposal of dried sludge at sanitary land fills sites and management of vegetation to limit attraction to wildlife.
5. non-aesthetic views Creation of a buffer zone between residential areas and sludge treatment facilities.
6. Impacts on Land Value Minimisation of operation nuisances/improvement of operational management and improvement of landscape and environmental aesthetics.
7. Bird Strike Hazard • Kotebe site should be kept as it is now (no hiding places for birds, no nesting
opportunities, no seeds to feed on); • dykes to be walked between drying beds or lagoons on a regular daily bases to disturb
roosting; • cut grass and weeds on dykes and slopes to a maximum height of 3 cm; • cause additional disturbance by the presence of a herd of grazing animals ; • patrols around the dykes and drying beds to chase away birds, on a regular daily basis; • firing shell crackers, additional use of a shotgun, to remove individual birds; • removal of trees and shrubs from around the ponds, drying beds and sludge lagoons to
an extent of 20 m from all sides, to prevent roosting and nesting by birds of prey, Herons and Cormorant species;
• clear the sites of all rubbish, originating from sludge, as it attracts scavenger animals and birds.
It must be appreciated that both treatment sites are less attractive to bird life than the adjacent agricultural areas. Environmental Issues and proposed mitigation measures, related to Sludge Transfer Stations: • improve the design of the Transfer Stations; • timely replacement of old hoses and bad connectors. Regular cleaning of the Transfer Stations
and proper disposal of waste to a storage bin for disposal; • planting of trees to improve aesthetics; • Diversion of area where sludge spills occur to a storage tank to be emptied by a vacuum truck

Wastewater Masterplan NEDECO
Volume I - Executive Summary 9
2 THE MASTERPLAN
2.1 Sludge Collection and Disposal
The collection of sludge from the city is constrained by the following problems: • Poor access (narrow, steep unpaved roads) for suction trucks to reach and empty sludge
from septic tanks and pit latrines. • Sludge removal is difficult especially from the dry pit latrines, as the sludge contains a lot of
extraneous matter such as plastic, clothing etc. and is a solid. Sludge transfer stations Due to the Problems in removing sludge from the dry pit latrines and the difficulty in operating the small portable pumps the existing transfer stations are operating considerably below capacity. With the recommended change in strategy for dry pit latrine emptying, no further transfer stations are proposed. Septic tanks The present strategy to use vacuum trucks to empty septic tanks is working well at present and should be continued. The volumes of sludge to be collected and treated are presented in Figure 2-1. It should be noted that the sludge contains only 0.5% of solids. This is substantially less than normal, and is thought to be due to the poor construction of the septic tanks and soakage pits. It is recommended that with the introduction of HP vacuum trucks, when the existing standard vacuum tankers need replacement, AAWSA should withdraw from emptying septic tanks. Dry Pit Latrines Emptying of dry pit latrines is however proving much more difficult. Even though the volume of dry pit latrine sludge transported to Kaliti and Kotebe is substantial, much of the volume is thought to be water added to the pit to enable the sludge to be pumped. As the dried excreta in the pits, especially after a number of years is solid this procedure is failing to remove a substantial amount of the sludge. In Figure 2-1, the projection of the quantity of dry pit sludge is shown. Analysis of samples of dry pit latrine sludge discharged from the tankers show that the sludge contains 95% water (8m³ of sludge contains only 400 litres of dry pit sludge). The recommended procedure elsewhere in the world is to use a high performance vacuum truck, which removes the dry material using air to convey the material. The sludge can be moved up to 100m away using this procedure. The dry material would be disposed of to a sanitary landfill. It is recommended that at least one tanker is purchased to ensure that the procedure is appropriate for use in Ethiopia. In Figure 2-1 is also shown the total wet sludge volume for dry pits and septic tanks, when dry pit latrines are not emptied using a High Performance vacuum truck but using an conventional vacuum truck and adding water to empty the pit latrines.

Wastewater Masterplan NEDECO
Volume I - Executive Summary 10
Figure 2-1 projected sludge production of Pit latrine and Septic Tank Figure 2-1 assumes that the sludge collection efficiency ranges from 80% in 2000 to 95% 2020 for pit latrines and 90% in 2000 to 95% in 2020 for septic tanks. It can be seen that especially in a wet year the capacity of the treatment works has been reached. Either an additional sludge treatment works must be constricted or alternative sludge disposal options implemented. To reduce the amount of septic tank sludge to be treated in the sludge treatment facilities, a pilot forestry project is recommended. Within this forestry project, a part of the septic tank sludge will be used to irrigate Eucalyptus trees. It is proposed that a concrete header tank, a lined distribution ditch and a system of earth drains be constructed. Another recommended pilot project is to inject the septic tank sludge into the Kaliti sewer system at a pilot sludge injection point. With a water content of 99.5% the additional sludge load on the facultative ponds will be negligible. By implementing both projects, the amount of sludge to the sludge treatment facilities will significantly be reduced and can be expected not to exceed the capacity of the existing works. Sanitary Landfills The amount of dried sludge from the drying beds is estimated to be about 15,000 m3/year. With the large increase in sludge from the dry pit latrines, disposal of the sludge to sanitary landfill sites at Kaliti and Kotebe will be required. The recommended sludge disposal scheme using a High Performance Vacuum trucks is shown in Figure 2-2.
Slud ge p rod uct io n o f Pi t Lat r ine and Sep t ic T ank
0
100,000
200,000
300,000
400,000
500,000
600,000
700,000
2000 2002 2004 2006 2008 2010 2012 2014 2016 2018 2020
Y ear
Total Wet Sludge (Pi t Latr ine + Septi c Tank )
Septic Tank (wet sludge)
Pi t Latr ine (dr y sludge)
Existing capaci ty sludge ponds

Wastewater Masterplan NEDECO
Volume I - Executive Summary 11
Figure 2-2 proposed Sludge disposal scheme Assuming that the use of HP vacuum trucks proves successful the recommend implementation schedule and costs are shown in Table 2-1.
Table 2-1 Estimated costs for HP vacuum trucks
Sludge collection equipment Cost (Birr) Cost (Euro)
1 number HP vacuum trucks as pilot
2002 1,500,000 196,078
11 number HP vacuum trucks
2004 16,500,000 2,157,125
12 number HP vacuum trucks
2014 18,000,000 2,352,941
Sludge Disposal
Pit Latrine (Dry Sludge)
Septic Tank (Wet Sludge)
High performance Vacuum Truck
Conventional Vacuum Truck
Disposal Disposal
WWTP Forestry Drying Beds
Sanitary Landfill

Wastewater Masterplan NEDECO
Volume I - Executive Summary 12
2.2 Sanitation
One of the sewer design criteria requested by AAWSA is that where possible the sewer system is to be a gravity system i.e. no pumping stations are to be included in the new design. Because the average altitude in the north of Addis Ababa is higher than the average altitude in the south, this is relatively easily obtained. Inspection of the topographic maps has enabled the area to be divided into river catchments and sub catchments. These catchments are identical to the sewer catchments. The city of Addis Ababa is spread over three main catchments. Each catchment is separated from the next by a ridge of high ground. These catchments are:
• Kaliti catchment; • Eastern catchment; • Akaki catchment;
These catchments have been subdivided into sub-catchments that correspond to the service areas used in the design.
2.2.1 Assumed domestic and non-domestic flows and BOD loads
Domestic: The domestic connections can be divided in to residences and apartment blocks. Average number of people for one connection: Residence: 5.6 persons Apartment blocks: 110 persons (approximately 20 apartments per block) Also the water consumption differs between people living in an apartment and people living in a residence. Assuming that 80% of the water supply of people connected to the sewer system will end up in the sewer system, Table 2-2 shows the average domestic flow in to the sewer system.
Table 2-2 Average domestic flow to sewer
Year 2000 2005 2010 2015 2020
Residence [litres/capita/day] 74 80 88 96 112
Apartment blocks [litres/capita/day] 64 72 76 84 96
It has been assumed that the average BOD load will not change in time and has a value of 45 grammes/capita/day. Non-Domestic The flow and BOD load to the WWTW per connection for the non-domestic users will not change a lot in time, therefore constant loads and flows for the various non-domestic users were assumed. The assumptions of these non-domestic load and flows are shown in Table 2-3.

Wastewater Masterplan NEDECO
Volume I - Executive Summary 13
Table 2-3 Average non-domestic flow and BOD load to WWTW Average flow to sewer
[m³/connection/day] Average BOD load [kg/connection/day]
Government, Commercial 2 0.55 Hotels, hospitals, etc. 50 9 Main industries 200 450 Medium & small industries 2 1
Note:- The figures above are sector wide average values, individual discharges will vary significantly with major consumers having much higher discharges and smaller consumers discharging much less.
2.2.2 Kaliti catchment
For the Kaliti catchment, wastewater quantities for the three horizons (2005, 2010 and 2020) have been assessed. The assessments have taken into account the distribution of the population over the sewer district, the assumed development of connections to the sewer system and the projected hydraulic and BOD load. A summary of this assessment is given in Table 2-4.

Wastewater Masterplan NEDECO
Volume I - Executive Summary 14
Table 2-4 Summary of future connections and hydraulic and BOD loads for the Kaliti catchment
Note: - the 2000 flows and pollutant loads are based on observed data. The current institutional and commercial customers are major consumers and as such have higher flows and pollutant loads than would be given using the average values in Table 2-4. The domestic connections also have much lower flows and pollutant loads than those given in Table 2-2. The growth of the population in the Kaliti catchment is relatively small (see Table 2-4). The strategy therefore focuses on serving the existing population in the catchment. The strategy is divided into three stages of construction. It should be noted that the predicted pollution load is heavily dependent on the connection of the main industries in the catchment, especially between 2005 and 2010, where the pollution load of the main industries represent over 50% of the total load.
Kaliti Sewer Catchmentyear Unit 2000 2005 2010 2015 2020
Population in catchment pers. 2,050,150 2,184,750 2,297,920 2,408,610 2,478,670growth % - 6.6% 5.2% 4.8% 2.9%
Connections to sewer systemDomestic no. 1,839 5,696 14,188 39,246 66,487Government, Commercial no. 54 2,040 3,190 7,255 9,260Hotels, hospitals, etc. no. 7 8 15 52 85Industrial
main industries no. 0 11 16 26 31medium & small industries no. 4 105 175 360 530
Total 1,904 7,860 17,584 46,939 76,393
Flow into sewer systemDomestic m³/day 886 3,867 9,313 27,921 54,385Government, Commercial m³/day 243 4,080 6,380 14,510 18,520Hotels, hospitals, etc. m³/day 490 520 750 2,600 4,250Industrial
main industries m³/day 0 2,200 3,200 5,200 6,200medium & small industries m³/day 16 210 350 720 1,060
Total 1,635 10,877 19,993 50,951 84,415
BOD load of sewer systemDomestic kg/day 548 2,262 4,961 13,573 22,754Government, Commercial kg/day 107 1,122 1,755 3,990 5,093Hotels, hospitals, etc. kg/day 189 202 210 468 765Industrial
main industries kg/day 0 4,950 7,200 11,700 13,950medium & small industries kg/day 4 105 175 360 530
Total 848 8,641 14,301 30,091 43,092
Population Equivalent 18,845 192,017 317,794 668,692 957,606

Wastewater Masterplan NEDECO
Volume I - Executive Summary 15
Stage 1 The existing sewer and treatment system has some spare capacity, it is therefore possible to connect a significant amount of people to the sewer system without any major additions to the main sewer system and no increase in the capacity in the waste water treatment works.
Emphasis is therefore placed on constructing lateral sewer lines to enable people to connect within the service area of the existing sewer system. This expansion of the number of people connected to the sewer system will continue until the capacity of the existing wastewater treatment works is reached. (See Figure 2-3). Stage 1 works Construction of laterals and secondary sewers to serve an area of 1,448 hectares, the length of the new sewers will be approximately 37 km. Stage 2 In stage 2 the service area will be expanded with extra trunk lines will be built and connected to the existing sewer system. The construction of lateral sewers will continue to enable more people to connect to the sewer system. The stage 2 service area has been assessed as that area that can be connected before the capacity of the existing trunk sewers is exceeded (see Figure 2-3). Initially the capacity of Kaliti WWTW will be doubled by the construction of anaerobic ponds upstream of the existing ponds. With the continued extension of the sewer network, the capacity of the extended Kaliti wastewater treatment works will be reached and additional capacity has to be constructed. As the new sludge drying beds have been constructed in the space allocated for the works, expansion will be difficult and expensive to expand the Kaliti WWTW on the existing location, therefore a new WWTW will need to be constructed. The location of this new WWTW (Akaki II) will be within the Akaki catchment. To connect the Kaliti catchment to the Akaki II WWTW, a 7 km long trunk sewer will need to be constructed. Stage 2 works Construction of 40 km trunk sewers within the Kaliti catchment plus the construction of a 7 km trunk sewer from Kaliti to Akaki II. (5.5 km of this sewer will be used as the trunk sewer for Akaki stage 3 sewerage). Construction of laterals and secondary sewers for an area of 2,470 hectares, the length of the new sewers will be approximately 86 km. Construction of Akaki II WWTW due to flows coming from Kaliti catchment. Stage 3
In this stage the emphasis will lay on connecting the areas that are further away from the existing sewer system. These areas are the Mercato area, the area up to Hope Enterprise and the area up to the Embassy of USA. In stage 2 the capacity of the existing sewer system will have been reached, so to permit further expansion in the stage 2 service area, the capacity of the stage 2 sewer system will need to be supplemented by diverting flows to the stage 3 sewers (see ). The stage 3 trunk sewers will need to be built all the way from the treatment works to the above-mentioned areas. The construction of secondary and lateral sewers will continue. As the trunk sewers are constructed and flows increase the treatment capacity at Akaki II will need to be progressively extended.

Wastewater Masterplan NEDECO
Volume I - Executive Summary 16
Mercato area According to the Urban Masterplan the Mercato area will be completely redeveloped in the near future. The design of this western sewer line with associated secondary and lateral sewers will need to be revised and be undertaken once the development proposals are completed. Stage 3 works Construction of 62 km trunk sewers. Extension of Akaki II WWTW in phases. Construction of laterals and secondary sewers for an area of 3,547 hectares, the length of the new sewers will be approximately 124 km. Costs The costs for the implementation of the proposed sewer works in the Kaliti catchment in stage 1 2 and 3 are tabulated in Table 2-5, Table 2-6 and Table 2-7 (1 Euro = 7.65 Birr). For the purpose of this cost estimate wastewater treatment using stabilisation ponds has been assumed.
Table 2-5 Stage 1 sewerage costs in the Kaliti catchment
Description Estimated cost
(Birr) Estimated cost
(Euro) Provision of secondary lines & laterals 11,733,171 1,533,748
Rehabilitation of existing siphons 1,770,336 231,416
Rehabilitation of Karamara main line 683,052 89,288
Sanitary Landfill 1,164,000 152,157
Pilot septic tank sludge injection point 240,331 31,416
Mitigation measures for ongoing projects 6,341,750 828,987
Design and Supervision 7.5% 1,644,948 215,026
Land and property compensation 1,682,000 219,869
Contingency 10% 2,525,959 330,191
Total Stage 1 27,785,546 3,632,098
Table 2-6 Stage 2 sewerage costs in the Kaliti catchment
Description Estimated cost (Birr)
Estimated cost (Euro)
Expansion of Kaliti WWTW by anaerobic ponds 6,981,704 912,641
Mekanisa Trunk Line and laterals 13,130,712 1,716,433
Rwanda Trunk Line and laterals 1,569,576 205,173
Bole Tele-22 Round Trunk Line and laterals 11,167,363 1,459,786
Lafto Trunk Line and laterals 13,671,308 1,787,099
Meskel Square- Gotera Trunk Line and laterals 12,939,483 1,691,436
Post office-AAWSA Trunk Line and laterals 6,735,352 880,438
Kaliti Diversion sewer to Akaki II WWTW 16,085,400 2,102,667
Akaki II WWTW phase 1 63,831,160 8,343,942
Design and Supervision, 7.5% 10,958,404 1,432,471
Land and property compensation 3,693,000 482,745
Contingency 10% 16,076,346 2,101,483
Total Stage 2 176,839,809 23,116,315

Wastewater Masterplan NEDECO
Volume I - Executive Summary 17
Table 2-7 Stage 3 sewerage costs in the Kaliti catchment
Description Estimated cost
(Birr) Estimated cost
(Euro)
Mercato interceptor and laterals 110,928,255 14,500,426
Ayer Tena Interceptor and laterals 9,264,900 1,211,098
North-eastern interceptor and laterals 59,363,308 7,759,910
Expansion of Akaki II WWTW all phases 429,000,000 56,078,431
Design and Supervision, 7.5% 45,641,735 5,966,240
Land and property compensation 13,878,750 1,814,216
Contingency 10% 66,807,695 8,733,032
Total Stage 3 734,884,642 96,063,352 The estimated sewerage costs for the implementation of stages 1, 2 and 3 in the Kaliti catchment are 939,500,000 Ethiopian Birr equivalent to 122,800,000 Euro. If trickling filters are constructed instead of wastewater stabilisation ponds for the second and subsequent phases at each works, the capital cost will be 660,000,000 Birr (86,000,000 Euro).

Wastewater Masterplan NEDECO
Volume I - Executive Summary 18
Figure 2-3 Kaliti catchment stage 1+2

Wastewater Masterplan NEDECO
Volume I - Executive Summary 19
Figure 2-4 Kaliti catchment stage 3

Wastewater Masterplan NEDECO
Volume I - Executive Summary 20
2.2.3 Eastern catchment
For the Eastern catchment wastewater quantities for the three horizons (2005, 2010 and 2020) has been assessed. The assessments have taken into account the distribution of the population over the sewer district, the assumed development of connections to the sewer system, the projected hydraulic load and BOD load. A summary of this assessment is given in Table 2-8.
Table 2-8 Summary of future connections and hydraulic and BOD loads for the Eastern catchment
As there is no sewer system in the Eastern catchment, the starting point of the strategy is to construct a new wastewater treatment works and sewer system. As can be seen in Table 2-8 the growth of the population the Eastern catchment will increase in 20 years by a factor 4.
Eastern Sewer Catchmentyear Unit 2000 2005 2010 2015 2020
Population in catchment pers. 243,020 386,250 561,570 749,820 957,860growth % - 58.9% 45.4% 33.5% 27.7%
Connections to sewer systemDomestic no. 0 1,973 6,036 16,313 34,625Government, Commercial no. 0 405 990 2,475 4,335Hotels, hospitals, etc. no. 0 2 6 35 75Industrial 0 0 0 0
main industries no. 0 1 2 3 4medium & small industries no. 0 40 60 135 250
Total 0 2,421 7,094 18,961 39,289
Flow into sewer systemDomestic m³/day 0 1,340 3,958 11,607 28,332Government, Commercial m³/day 0 810 1,980 4,950 8,670Hotels, hospitals, etc. m³/day 0 100 300 1,750 3,750Industrial
main industries m³/day 0 200 400 600 800medium & small industries m³/day 0 80 120 270 500
Total 0 2,530 6,758 19,177 42,052
BOD load of sewer systemDomestic kg/day 0 784 2,108 5,643 11,854Government, Commercial kg/day 0 223 545 1,361 2,384Hotels, hospitals, etc. kg/day 0 18 54 315 675Industrial
main industries kg/day 0 450 900 1,350 1,800medium & small industries kg/day 0 40 60 135 250
Total 0 1,515 3,667 8,804 16,964
Population Equivalent 0 33,659 81,483 195,640 376,969

Wastewater Masterplan NEDECO
Volume I - Executive Summary 21
Stage 1 The first action is to construct a treatment works. Construction of the trunk sewers will start at the treatment works and expand upstream together with the construction of secondary and lateral sewers to enable people to connect to the system (see Figure 2-6). Stage 1 works Construction of 23 km trunk sewers and construction of phase 1 Eastern WWTW. Construction of laterals and secondary sewers for an area of 1,220 hectares, the length of the new sewers will be approximately 43 km. Stage 2 To extend the sewer network, new trunk lines will need to be built. These new sewer lines will connect to the stage 1 sewer system. Construction of lateral and secondary sewer lines will continue in this stage (see Figure 2-6). Stage 2 works Construction of 19 km trunk sewers. Construction of laterals and secondary sewers for an area of 1,592 hectares, the length of the new sewers will be approximately 56 km. Stage 3 The last development areas will be served by constructing new trunk sewers and associated secondary and lateral sewers. The number of people able to connect to the sewer system will increase enormously in this stage (see Figure 2-6). During this stage, the treatment works will need to be progressively extended. Stage 3 works Construction of 31 km trunk sewers and extension of Eastern WWTW phases 2 and 3. Construction of laterals and secondary sewers for an area of 2,305 hectares, the length of the new sewers will be approximately 81 km. Costs The estimated costs for the implementation of the proposed sewer works in stages 1, 2 and 3 for the Eastern catchment are shown in Table 2-9,.Table 2-10 and Table 2-11.

Wastewater Masterplan NEDECO
Volume I - Executive Summary 22
Table 2-9 Stage 1 sewerage costs in the Eastern catchment
Description Estimated cost (Birr)
Estimated cost (Euro)
Construction of treatment works 57,200,000 7,477,124
Building and Miscellaneous works for the WWTW 2,390,300 312,458
Eastern terminal trunk sewer 12,164,772 1,590,166
CMC interceptor and laterals 19,384,208 2,533,883
ILRI interceptor and laterals 7,344,847 960,111
Kotebe Interceptor and laterals 11,786,451 1,540,713
Ayat Interceptor and laterals 7,341,098 959,621
Construction of Access road & bridges 3,200,000 418,301
Sanitary landfill 1,164,000 152,157
Sludge disposal site (Forestry pilot scheme) 500,000 65,359
HP Vacuum truck 1,500,000 196,078
Laterals excluded by Interbeton 10,850,000 1,418,301
Design and Supervision, 7.5% 10,111,926 1,321,820
Land and property compensation 2,812,350 367,627
Contingency 10% 14,774,995 1,931,372
Total Stage 1 162,524,947 21,245,091
Table 2-10 Stage 2 sewerage costs in the Eastern catchment
Description Estimated cost (Birr)
Estimated cost (Euro)
Construction of treatment works 57,200,000 7,477,124
CMC interceptor and laterals 4,759,224 622,121
Kotebe Interceptor and laterals 5,234,469 684,244
Gergi interceptor and laterals 11,018,035 1,440,266
East Bole interceptor and laterals 12,889,481 1,684,900
Ayat Interceptor and laterals 19,603,305 2,562,524
Design and Supervision, 7.5% 8,302,839 1,085,338
Land and property compensation 2,671,350 349,196
Contingency 10% 12,167,870 1,590,571
Total Stage 2 133,864,573 17,496,284

Wastewater Masterplan NEDECO
Volume I - Executive Summary 23
Table 2-11 Stage 3 sewerage costs in the Eastern catchment
Description Estimated cost (Birr)
Estimated cost (Euro)
Kotebe Interceptor and laterals 889,557 116,282
Gerji interceptor and laterals 14,339,000 1,874,379
East bole interceptor and laterals 14,972,170 1,957,146
Sludge disposal site (Forestry scheme) Phase II 6,300,000 823,529
Sludge disposal site (Forestry scheme) Phase III 6,200,000 810,458
Construction of Access road & Bridge (forestry) 2,600,000 339,869
Expansion of treatment works 85,800,000 11,215,686
Design and Supervision 7.5% 9,832,555 1,285,301
Land and property compensation 2,921,850 381,9416
Contingency 10% 14,385,513 1,880,459
Total Stage 3 158,240,645 20,685,052 The estimate sewerage costs for the implementation of stages 1, 2 and 3 in the Eastern catchment are 454,700,000 Birr equivalent to 59,500,000 Euro. If trickling filters are constructed instead of wastewater stabilisation ponds for the second and subsequent phases at each works the capital cost will be 370,000,000 Birr (48,000,000 Euro).

Wastewater Masterplan NEDECO
Volume I - Executive Summary 24
Figure 2-5 Kaliti catchment stage 1,2 & 3

Wastewater Masterplan NEDECO
Volume I - Executive Summary 25
2.2.4 Akaki catchment
For the Akaki catchment, wastewater quantities for the three horizons (2005, 2010 and 2020) have been assessed. The assessments have taken into account the distribution of the population over the sewer district, the assumed development of connections to the sewer system, the projected hydraulic load and BOD load. A summary of this assessment is given in Table 2-12.
Table 2-12 Summary of future connections and hydraulic and BOD loads for the Akaki catchment
As there is no sewer system in the Akaki catchment, the starting point of the strategy is to construct a new wastewater treatment works and sewer system. As can be seen in Table 2-12 the growth of the population in the Akaki catchment will increase in 20 years by a factor of 4. The predicted growth in pollution loads is heavily dependent on the connection of the main industries. They contribute over 50% of the total BOD load in the Akaki catchment.
Akaki Sewer Catchmentyear Unit 2000 2005 2010 2015 2020
Population in catchment pers. 201,830 316,000 468,510 633,570 809,470growth % - 56.6% 48.3% 35.2% 27.8%
Connections to sewer systemDomestic no. 0 1,575 5,136 12,284 25,176Government, Commercial no. 0 320 830 1,855 3,170Hotels, hospitals, etc. no. 0 0 3 9 15Industrial 0 0 0 0
main industries no. 0 4 10 17 27medium & small industries no. 0 4 205 310 470
Total 0 1,903 6,184 14,475 28,858
Flow into sewer systemDomestic m³/day 0 1,079 3,365 8,736 20,578Government, Commercial m³/day 0 640 1,660 3,710 6,340Hotels, hospitals, etc. m³/day 0 0 150 450 750Industrial
main industries m³/day 0 800 2,000 3,400 5,400medium & small industries m³/day 0 8 410 620 940
Total 0 2,527 7,585 16,916 34,008
BOD load of sewer systemDomestic kg/day 0 632 1,792 4,247 8,609Government, Commercial kg/day 0 176 457 1,020 1,744Hotels, hospitals, etc. kg/day 0 0 27 81 135Industrial
main industries kg/day 0 1,800 4,500 7,650 12,150medium & small industries kg/day 0 4 205 310 470
Total 0 2,612 6,981 13,308 23,107
Population Equivalent 0 58,040 155,130 295,731 513,499

Wastewater Masterplan NEDECO
Volume I - Executive Summary 26
The Akaki Catchment can be divided into two areas, Lower Akaki and Upper Akaki to allow a gravity flow sewer system in the Akaki area. The sewage from the Lower Akaki area will flow by gravity to the Akaki I treatment works. The sewage from the Upper Akaki area will discharge to the Akaki II treatment works. Stage 1 The first action is to construct the Akaki I treatment works. Due to the flows coming from the Kaliti catchment to the Akaki catchment, the Akaki II treatment works will also need to be constructed. Construction of the trunk sewers will start at the treatment works and expand upstream together with the construction of secondary and lateral sewers to enable people to connect to the system (see Figure 2-6). Stage 1 works Construction of 13 km trunk sewers and construction of phase 1 of Akaki I WWTW. Construction of laterals and secondary sewers for an area of 1,143 hectares, the length of the new sewers will be approximately 40 km. Stage 2 The Upper Akaki area will discharge to the Akaki II treatment works which will need extension (in this stage the Akaki II treatment works will serve both Kaliti and Akaki). To extend the Akaki sewer network, new trunk lines will need to be built. These new sewer lines will connect to the stage 1 sewer system. Construction of lateral and secondary sewer lines will continue in this stage (see Figure 2-6). Stage2 works Construction of 20 km trunk sewers and construction of phase 1 of Akaki II WWTW. Construction of laterals and secondary sewers for an area of 1,609 hectares, the length of the new sewers will be approximately 56 km. Stage 3 The last development areas will be served by constructing new trunk sewers and associated secondary and lateral sewers. The number of people who could be connected to the sewer system will increase enormously in this stage (see Figure 2-6). Akaki I WWTW will need to be progressively expanded to 150,000 p.e. capacity. Stage 3 works Construction of trunk 15 km sewers. Extension of both Akaki I and Akaki II WWTW's. Construction of laterals and secondary sewers for an area of 1,506 hectares, the length of the new sewers will be approximately 53 km.

Wastewater Masterplan NEDECO
Volume I - Executive Summary 27
Costs The estimated costs for construction of the proposed sewer works in stages 1, 2 and 3 for the Akaki catchment are shown in Table 2-13 , Table 2-14 and Table 2-15.
Table 2-13 Stage 1 sewerage costs in the Akaki catchment
Description Estimated cost
(Birr) Estimated cost
(Euro)
Construction of Akaki 1 WWTW 64,574,745 8,441,143
Akaki main Interceptor and laterals 10,058,264 1,314,806
Akaki west Interceptor and laterals 11,461,735 1,498,266
Akaki east interceptor and laterals 3,297,348 431,026
Design and Supervision, 7.5% 6,704,407 876,393
Land and property compensation 2,070,750 270,686
Contingency 10% 9,816,725 1,283,232
Total Stage 1 107,983,974 14,115,552
Table 2-14 Stage 2 sewerage costs in the Akaki catchment
Description Estimated cost (Birr)
Estimated cost (Euro)
Expansion of Akaki II WWTW 57,200,000 7,477,124
Akaki west Interceptor and laterals 13,304,737 1,739,181
Akaki east interceptor and laterals 7,108,655 929,236
Saris Interceptor and laterals 26,510,184 3,465,384
Design and Supervision, 7.5% 7,809,268 1,020,819
Land and property compensation 2,597,500 339,542
Contingency 10% 11,453,034 1,497,129
Total Stage 2 125,983,379 16,468,416
Table 2-15 Stage 3 sewerage costs in the Akaki catchment
Description Estimated cost
(Birr) Estimated cost
(Euro)
Akaki west interceptor and laterals 4,775,558 624,256
Saris Interceptor and laterals 3,609,009 471,766
Bole Bulbula interceptor and laterals 10,936,392 1,429,594
Expansion of Akaki I WWTW 28,600,000 3,738,562
Expansion of Akaki II WWTW 143,000,000 18,692,810
Design and Supervision, 7.5% 14,319,072 1,871,774
Land and property compensation 4,730,000 618,301
Contingency 10% 20,997,003 2,744,706
Total Stage 3 230,967,035 30,191,769

Wastewater Masterplan NEDECO
Volume I - Executive Summary 28
The estimated sewerage costs for the implementation of stages 1, 2 and 3 in the Akaki catchment are 465,700,000 Birr equivalent to 60,800,000 Euro. If trickling filters are constructed instead of waste water stabilisation ponds for the second and subsequent phases at each works the capital cost will be 340,000,000 Birr (47,000,000 Euro).

Wastewater Masterplan NEDECO
Volume I - Executive Summary 29
Figure 2-6 Eastern catchment stage 1, 2 and 3

Wastewater Masterplan NEDECO
Volume I - Executive Summary 30
2.3 Wastewater Treatment
2.3.1 Domestic Wastewater
At the present time the principal sources of domestic wastewater are the residential districts and predominantly public institutional facilities. Other important sources of wastewater include commercial facilities and recreation areas. Domestic sewage flow in residential areas is characterised by very low wastewater discharge rates with regard to the standard of living of the population. The average water demand for people living in the better housing ranges between 80 and 130 litres per person per day. This depends on the sanitation facilities installed and the availability of storage tanks to overcome shortages in water supply. On average 80% of the water supply will be discharged as wastewater. Wastewater flows from institutional facilities are essentially domestic in nature. The quantity produced depends on the type and the size of each facility. See Section 2.2.1 for assumed flows and pollutant loads.
2.3.2 Industrial Wastewater
In contrast to domestic wastewater, where the composition, in terms of Biochemical Oxygen Demand (BOD), nitrogen (N) and phosphorus (P), is generally known, industrial sewage is very much dependent on the particular type of industry. An inventory of the industries was therefore made and information collected about the processes, flow, COD, BOD, N, P, heavy metals, pH, toxic compounds, temperature, etc. Based on this information the industrial pollutant loads has been calculated. AAWSA supplied information concerning water supplies to existing industries. Based on this information the industries with a high water consumption and processes with a high amount or highly concentrated wastewater discharge were visited. Detailed information was collected concerning the water and wastewater situation and to obtain an insight in to the future expected wastewater production. See Section 2.2.1 for assumed flows and pollution loads.
2.3.3 Forecast to the waste water treatment works
As stated in the previous section, the city of Addis Ababa will in the future have four waste water treatment works, one in Kaliti catchment (existing) one in the Eastern catchment and two in the Akaki catchment. The flow to the treatment works will depend on the connection rate within the catchment.

Wastewater Masterplan NEDECO
Volume I - Executive Summary 31
2.3.4 Kaliti WWTW
The existing Kaliti WWTW has a capacity of approximately 40,000 population equivalent (p.e.). The original design states that by using recirculation, the capacity of the existing ponds can be increased to 100,000 p.e. Assuming this capacity is correct, by constructing an anaerobic pond in front of each of the existing trains of ponds, the capacity of the Kaliti treatment works can be increased to 180,000 p.e. The original wastewater treatment works made provision for an additional two trains of ponds to be constructed. The space for one train has however been used to construct the sludge treatment ponds. It will therefore be difficult to construct an additional train of ponds in the remaining area. It is recommended that the surplus flow to Kaliti treatment works be diverted to Akaki II WWTW. The analysis to select the most appropriate treatment option is given below in Table 2-16.
Table 2-16 Kaliti catchment – Treatment or diversion disposal options Item Option Advantages Disadvantages Risks Assumptions
K1 Increase WWTW capacity by using recirculation of treated effluent
Pumping station already constructed
Increase in power & operating costs. Increased risk of failure
Failure of pumping station will overload WWTW
Original design calculation correct
K2 Increase WWTW capacity by installing UASB plant upstream
Easily constricted in available area, will double capacity of WWTW.
Skilled operation required Medium capital cost. Increased operating cost
Failure will overload WWTW
Plant is suitable for type of sewage
K3 Increase WWTW capacity by installing anaerobic ponds upstream
Low capital cost. Unskilled operation. Little increase in operating cost. Will double capacity of WWTW.
It improperly operated odours could occur. Difficult to locate in available area
Ponds not desludged regularly
Design loading rates applicable in Addis Ababa
K4 Increase WWTW capacity by constructing additional train of ponds
Will add 50% to existing capacity and with either UASB or anaerobic ponds will add 50% of uprated capacity
Difficult to construct as better half of expansion area taken by new sludge treatment works. No further expansion possible
Flooding in river could affect works
Original design calculations correct Land available
K5 Divert flows in excess of capacity to Akaki II WWTW
Allows for unlimited expansion of treatment capacity at Akaki II
Increased size of sewers needed in Akaki catchment
Failure of trunk sewer could pollute river.
Trunk sewer will operate without silting at initial low flows Land available at Akaki II
K6 Abandon Kaliti WWTW
Frees up area for industrial development. Reduces number of WWTW
Significant additional capital cost. Large pond area to be infilled.
Reduction in flexibility of treatment.
Land available at Akaki II
K7 Construct mechanical plant for increased loads
WWTW stays at Kaliti. Akaki II not needed for Kaliti
Increased operating cost. Mechanical plant
No experience in operating mechanical plant.
Additional land available if necessary.
K8 Construct ponds at Akaki II
Low operating cost high capital cost land available

Wastewater Masterplan NEDECO
Volume I - Executive Summary 32
The estimated total capital costs to meet the 2020 demands and the 2020 operating costs of each of the above options are given in Table 2-17.
Table 2-17 Estimated cost for waste water treatment options in Kaliti catchment
Item Option Capital costs (Birr)
Annual operating costs (Birr)
K1 Increase WWTW capacity by using recirculation of treated effluent
Nil 800,000
K2 Increase WWTW capacity by installing UASB plant upstream
12,000,000 650,000
K3 Increase WWTW capacity by installing anaerobic ponds upstream
6,6000,000 150,000
K4 Increase WWTW capacity by constructing additional train of ponds
30,000,000 75,000
K5 1) Divert flows in excess of capacity to Akaki II WWTW
20,000,000 100,000
K6 2) Abandon Kaliti WWTW 100,000,000 NA
K7 3) Construct mechanical plant for increased loads
290,000,000 25,000,000
K83) Construct ponds at Akaki II 350,000,000 3,000,000
1) Trunk sewer cost only (50% of cost should be allocated to Akaki sewerage) 2) Cost of replacement treatment works at Akaki II 3) Additional 700,000 per capacity required to meet 2020 flows Due to the higher capital cost of the UASB plant (K2) the construction of Anaerobic Ponds (K3) is recommended. Due to the difficulty in extending Kaliti (K4) the recommended option is to divert flows to Akaki II and build a waste stabilisation pond system. In the load to and the capacity of the existing Kaliti treatment works is shown. It can be seen that in 2005 the maximum capacity of the plant will be reached if the stage I and II sewer construction works are implemented as scheduled and that the diversion of flow to the Akaki II WWTW should start. The diverted loads will range from 130,000, 480,000 to 780,000 p.e. in 2010, 2015 and 2020 respectively.

Wastewater Masterplan NEDECO
Volume I - Executive Summary 33
Figure 2-7 Population served and capacity of Kaliti WWTW
2.3.5 Eastern Catchment WWTW
This will be a new works and the analysis to select the most appropriate option is given below in Table 2-18.
Table 2-18 Eastern Catchment – Treatment or diversion options Item Option Advantages Disadvantages Risks Assumptions
E1 WWTW at Bole
Stand alone operation. Akaki II plant does not need to be built so early. Failure of plant only affects eastern catchment
An additional WWTW to operate. Additional sludge treatment works required. Additional land required.
Lack of trained operators
Land available
E2 Trunk sewer to Akaki II WWTW
Reduces number of WWTW
Long trunk sewer required. Cost of treatment works still similar. Failure of Akaki II plant would affect two catchments. High capital cost.
Failure of sewer line would pollute river
Sewer line feasible along river. Sewer operates without siltation during early years. Land available
E3 Pumping station for East Bole flows with works at Kotebe.
No additional land required. Terminal trunk sewer 3km shorter
High capital and operating cost of pumping station
Power or mechanical failure of pumping station. Failure of rising main
Flows can be accurately predicted. Land available for pumping station
The estimated total capital costs to meet the 2020 demands and the 2020 annual operating costs of each of the above options is given in Table 2-19.
Population served and capacity of Kaliti WWTP
0
20,000
40,000
60,000
80,000
100,000
120,000
140,000
160,000
180,000
200,000
2000 2001 2002 2003 2004 2005 2006 2007 2008 2009 2010 2011 2012 2013 2014 2015 2016 2017 2018 2019 2020
Year
Pop
ulat
ion
equi
vale
nt
a
p.e. to WWTP stage 1 p.e. to WWTP stage 2 p.e. to WWTP stage 3 Cap. of WWTP
Using recirculation, capacity increases 60,000 p.e.
building two anaerobic ponds, capacity increases 80,000 p.e .
Existing ponds
Flows above 180,000 p.e. will be diverted to Akaki II

Wastewater Masterplan NEDECO
Volume I - Executive Summary 34
Table 2-19 Estimated cost for treatment options in Eastern catchment Item Option Capital cost
(Birr) Annual Operating
cost (Birr) E1 WWTW in catchment 57,000,000 750,000
E2 1) Trunk sewer to Akaki II WWTW 22,000,000 500,000
E3 Pumping station for East Bole flows with works at Kotebe.
66,000,000 1,200,000
1) Does not include cost of treatment works at Akaki (same cost as option E1)
It is recommended that a waste stabilisation pond system be constructed within the Eastern Catchment. The option to convey flows to Akaki II is not economic, as the saving in operating cost will not repay the cost of the trunk sewer. The saving in land purchase cost (approximately Birr 1.4 Million) does not justify the construction of a pumping station for the East Bole flows and keeping the treatment works at Kotebe. In Figure 2-8 are the projected flows and the proposed capacity of the Eastern WWTW shown. From the figure it can be seen that a capacity of 100,000 p.e. will meet the demand until the year 2012. After this the capacity of the plant will need to be increased to 200,000 p.e., which will be sufficient until the year 2016. An additional increase of 100,000 p.e. in the year 2016 is necessary to deal with the 2020 demands.
Figure 2-8 Flow and capacity of Eastern WWTW
Flow to and capacity of Eastern WWTP
0
50,000
100,000
150,000
200,000
250,000
300,000
350,000
400,000
2000 2001 2002 2003 2004 2005 2006 2007 2008 2009 2010 2011 2012 2013 2014 2015 2016 2017 2018 2019 2020
Year
Flo
w a
nd C
apac
ity [p
opul
atio
n eq
uiva
lent
]
a
Flow to WWTP stage 1 Flow to WWTP stage 2 Flow to WWTP stage 3 Cap. of WWTP

Wastewater Masterplan NEDECO
Volume I - Executive Summary 35
2.3.6 Akaki catchment WWTW
In the Akaki catchment two wastewater treatment works will need to be built. The first wastewater treatment works to be built will be Akaki I. The location of this treatment works is such that all flow from the Lower Akaki catchment can reach it by gravity. However the available space is limited, therefore it is not possible to expand the works to meet the year 2020 demand. To deal with this demand another location is available at Akaki II, which is located on the plain at the west side of the little Akaki River. All flows from the Upper Catchment will therefore be taken to Akaki II WWTW. It is therefore proposed that all flows from the upper catchment be taken to Akaki II WWTW. The analysis to select the most appropriate option is given below in Table 2-20.
Table 2-20 Akaki Catchment – Treatment or disposal options
Item Option Advantages Disadvantages Risks Assumptions
A1 Construct first treatment ponds followed by mechanical plant at Akaki I
Only one WWTW required in Akaki catchment. Gravity flow to works
Mechanical plant required for p.e. > 150,000. Akaki II still required for Kaliti
No experience in operating mechanical plant. Pollution of well field aquifer
Land available. Mechanical plant acceptable. Geotechnical conditions ok.
A2 Construct Akaki I WWTW for lower catchment and Akaki II for upper catchment
No pumping required. Mechanical plant not required. Gravity flow to works.
Two WWTW required Higher operational cost.
Pollution of well field aquifer
Geotechnical conditions ok. Land at two sites available.
A3 Construct only Akaki II WWTW with gravity sewer line connection.
Only one WWTW. No risk of pollution of well field aquifer
High capital cost of connecting trunk sewer. Pipe bridge across Akaki river. Deep excavation across ridge. Pumping Station required in wet season
Pipe bridge across Akaki river. Deep excavation across ridge. Break in sewer line pollutes river Part of WWTW in Lake Aba Samual flood plain
Geotechnical conditions ok. Land available Plant can be protected from flooding
A4 Construct only Akaki II WWTW with lower Akaki pumped to WWTW
Only one WWTW. No risk of pollution of well field aquifer Lower capital cost
Higher operating costs. Large pumping station required.
Failure of pumping station pollutes river. Operation of pumping station
Geotechnical conditions ok. Land available
The total capital costs to meet the predicted 2020 demand and the 2020 annual operating costs of these options are giving in Table 2-21.

Wastewater Masterplan NEDECO
Volume I - Executive Summary 36
Table 2-21 Estimated costs for treatment options in Akaki catchment Item Option Capital costs
(Birr) Annual operating cost
(Birr) A1 Construct first treatment ponds
followed by mechanical plant 400,000,000 38,000,000
A2 Construct Akaki I WWTW for lower catchment and Akaki II for upper catchment
620,000,000 750,000
A3 Construct only Akaki II WWTW with gravity sewer line connection.
720,000,000 1,500,000
A4 Construct only Akaki II WWTW with lower Akaki pumped to WWTW
629,000,000 22,250,000
With waste stabilisation ponds as treatment works it can be seen that the most cost effective option is to construct treatment works at both the Akaki I and Akaki II locations. The following strategy is recommended, first Akaki I is built with a capacity of 100,000 population equivalents. In the year 2012 the works will reach its capacity therefore an expansion of another 50,000 p.e. is necessary. The total capacity of the Akaki I WWTW will be 150,000 p.e. In Figure 2-9 Projected flows to and the capacity of Akaki I WWTW are shown.
Figure 2-9 Flow and capacity to Akaki I WWTW The Akaki II WWTW will serve two catchments, Kaliti (>180,000 p.e.) and the Upper Akaki area. In Figure 2-10 the projected flows to and the proposed capacity of the Akaki II WWTW is shown. In the year, 2004 part of the flows from the Kaliti catchment will need to be diverted to the Akaki II WWTW.
Population served and capacity of Akaki I WWTP
0
20,000
40,000
60,000
80,000
100,000
120,000
140,000
160,000
2000 2001 2002 2003 2004 2005 2006 2007 2008 2009 2010 2011 2012 2013 2014 2015 2016 2017 2018 2019 2020
Year
Pop
ulat
ion
equi
vale
nt
a
p.e. to WWTP stage 1 p.e. to WWTP stage 2 p.e. to WWTP stage 3 Cap. of WWTP

Wastewater Masterplan NEDECO
Volume I - Executive Summary 37
From 2004 until 2010 the proposed capacity of the Akaki II WWTW is 100,000 p.e., in 2008 the capacity will need to be increased up to 300,000 p.e. In 2012 the capacity will need to be increased by 300,000 p.e. the capacity will thus be 600,000 p.e. Another increase of the capacity of 300,000 p.e. will be needed in the year 2015. The capacity of the Akaki II treatment works will need to be 1,100,000 p.e. in the year 2019.
Figure 2-10 Flow and capacity of Akaki II WWTW
2.3.7 Descriptions of different waste water treatment processes
In the updated Masterplan the following wastewater treatment processes are considered: • Waste Stabilisation Ponds; • Conventional Activated Sludge; • Extended Aeration - Oxidation Ditch; • Sequencing Batch Reactor; • Trickling Filter. and for initial treatment processes: • Upflow Anaerobic Sludge Blanket (UASB); • Anaerobic ponds.
2.3.8 Evaluation of different treatment options
A detailed description of each individual treatment process is included I the main report. A summary of the advantages and disadvantages for each process is given in Table 2-22.
Population served and capacity of Akaki II WWTP ( K aliti > 180.000 p.e. also in catchment)
0
100,000
200,000
300,000
400,000
500,000
600,000
700,000
800,000
900,000
1,000,000
1,100,000
1,200,000
2000 2001 2002 2003 2004 2005 2006 2007 2008 2009 2010 2011 2012 2013 2014 2015 2016 2017 2018 2019 2020
Year
Pop
ulat
ion
equi
vale
nt
a
p.e. to WWTP stage 1 p.e. to WWTP stage 2 p.e. to WWTP stage 3 Cap. of WWTP

Wastewater Masterplan NEDECO
Volume I - Executive Summary 38
Table 2-22 Advantages and disadvantages of the individual treatment processes
Advantages Disadvantages
Waste stabilisation ponds • negligible energy consumption • simple operation with low maintenance
requirements • low sludge production • significant bacteriological and Helminth
egg removal
• large area of land required • possible odour and mosquito problems • algae growth affects effluent quality • medium construction costs
Conventional activated sludge • small land requirement • widely used and proven technology
• primary and secondary sedimentation required • skilled operation necessary • large quantity of unstable sludge produced • high proportion of mechanical and electrical
equipment necessary • high energy consumption • additional sludge treatment required
Oxidation ditch (Carousel) • small land requirement • robust process and proven technology • relatively simple operation • production of stabilised sludge • nitrogen reduction readily achievable
• high proportion of mechanical and electrical
equipment necessary • high energy consumption • medium construction cost • secondary sludge treatment required
Sequencing batch reactor (SBR) • small land requirement • proven technology • relatively simple operation • production of stabilised sludge • nitrogen reduction readily achievable • moderate investment
• high proportion of mechanical and electrical
equipment necessary • high energy consumption • medium construction cost • skilled operation needed
Trickling filter • low energy consumption • relatively low mechanical and electrical
equipment • simple operation • Moderate land requirement
• relatively large quantity of unstable sludge
produced • additional sludge treatment required • possible odour and fly problem • poor effluent quality concerning nitrification • Primary and secondary sedimentation required
Upflow anaerobic sludge blanket (UASB) • small land area required • generation of methane gas suitable for
energy production • low volume of stabilised sludge • relatively low investment
• limited experience with this process for treating domestic wastewater
• high ambient temperature required • secondary treatment required after reactor to
achieve effluent standard • skilled operation required • medium energy consumption
Anaerobic pond • negligible energy consumption • simple operation with low maintenance
requirements • low sludge production • low construction cost
• medium land requirement • possible odour problems

Wastewater Masterplan NEDECO
Volume I - Executive Summary 39
2.3.9 Recommendations for WWTW
Of the five treatment processes considered above, the conventional activated sludge process and sequencing batch reactor both have a high energy consumption, have a high proportion of mechanical and electrical equipment and need skilled operation. For these reasons these two processes are not considered suitable for use in Ethiopia. The remaining three treatment processes have been financially compared in Section 3.4 and it can be seen that the trickling filter treatment process has the lowest capital cost and the waste stabilisation pond treatment ponds has the lowest operating cost. The waste stabilisation pond treatment process is more robust i.e. has a wider tolerance to variation in the incoming hydraulic and pollutant load than the trickling filter treatment process and is therefore more suitable for the phase I treatment works. Following construction of the phase I works, the effluent quality and quantity can be measured and the construction of trickling filters considered for phase II. The waste stabilisation ponds are also much more tolerant of low flows and pollutant loads allowing for a slower than anticipated connection rate as observed at Kaliti. The carousel plant with a high capital and running cost is not considered suitable at the present time. The recommended option for the first phase of Akaki I, Akaki II and the Eastern catchment is to construct waste stabilisation pond systems at each location.
2.4 Ranking of Components
The outline design of the sewers showed where sewers were required to serve the anticipated populations. These sewers were then classified into three stages: • Stage 1 trunk sewers which must be constructed first i.e. trunk sewers upstream of the
treatment works. • Stage 2 trunk sewers which must connect to a stage 1 sewer and have stage 3 sewers
upstream • Stage 3 trunk sewers at the head of the system. The trunk sewers were then prioritised to assist in determining a preferred order of construction. To assist in this process, each trunk sewer was scored using the following system (see Table 2-23).

Wastewater Masterplan NEDECO
Volume I - Executive Summary 40
Table 2-23 Breakdown of Scores for Prioritising Sewer phasing
Description Points Remarks 1 Cost Per capita Connected 30
1.1 Up to 2005 0 to 1000 20 - 0 pts 20 Based on 2005 population
1.2 Up to 2020 0 to 1000 10 - 0 pts 10 Based on 2020 population
2 Expected Type of Catchment Development 25
2.1 Industrial / Commercial 10 Based on expected water consumption
2.2 High standard Domestic 10 In-house connections
2.3 Medium standard Domestic 5 In-house connections
2.4 Low standard Domestic 0 Either none or yard connections
3 Environmental Impact 25
3.1 In area vulnerable to GW pollution 5 Thickness of impermeable clay
3.2 Area causing SW pollution 5 Impermeable soils
3.3 Located within the well field protection zone 5 Proximity to well field & GW flow path
3.4 Non-effectiveness of on-site sanitation 10 Impermeability of soil
4 Infrastructure support 20
4.1 Provision of Sewers before extensive development 10 Extent of development in planned
extension area
4.2 Certainty of WS & Integrated development 10 Areas where extension of water supply
and integrated development planned
Total 100
Based on the scores a preferred order of construction was developed in each catchment (noting that a stage 2 sewer must connect to a stage 1 sewer and a stage 3 sewer to a stage 2 sewer). Kaliti Based on the scoring outlined above, the interventions in Kaliti catchment are shown in Table 2-24. It is proposed that the stage II works be split in to major interventions item K 1 to K8 as the first intervention and K 9 to K11, K16 and K17 as the second intervention. Outside the 35m Euro budget are the stage III items K12 to K14 and K17. Note that the expansion of Akaki II WWTW would be in stages following observed demand.

Wastewater Masterplan NEDECO
Volume I - Executive Summary 41
Table 2-24 Kaliti catchment implementation priority
Eastern catchment Based on the scoring outlined above, the interventions proposed in the eastern catchment area are shown in Table 2-25. The majority of the stage 1 works in this catchment have been excluded from the interventions outlined in this Masterplan as it is hoped that the works will be funded by another donor. The excluded works included the wastewater treatment works and most of the stage 1 trunk sewers. It is proposed that the current intervention be items E8 to E10, E13 and E17, the stage II trunk sewers and the secondary sewers and laterals excluded from the other intervention. Items E6, E7, E14, E15, E18 and E19 are outside of the proposed intervention. The expansion of the treatment works would depend on the observed flows and pollutant loads observed within the catchment.
Catchment Description of works
Sta
ge
Pop
ulat
ion
Equ
ival
ent s
erve
d (2
020)
Est
imat
ed c
ost
[ET
B]
Cos
t /C
apita
C
onne
cted
Sco
re
Impl
emen
tatio
n O
rder
Cum
mul
ativ
e C
ost
(Birr
)
Cum
mul
ativ
e C
ost
(Eur
o)
Kaliti K1 Provision of Secondary Lines & Laterals for
connectionsI 60,000 15,696,625 262 63 1 15,696,625 2,051,846
K2 K3 K4 Sewer rehabilitation, sludge disposal and pilot sludge injection
I 4,589,803 n/a 2 20,286,427 2,651,821
Mitigation measures for ongoing projects n/a 7,499,119 n/a n/a n/a 27,785,547 3,632,098K5 Expansion of Kaliti Treatment Plant using
Anaerobic pondsII 100,000 8,255,865 83 n/a 3 36,041,412 4,711,296
K6 Mekanisa/Old Airport II 45,000 16,090,816 358 62 4 52,132,228 6,814,670K8 Bole Tele-22 Round II 46,000 13,464,677 293 59 5 65,596,905 8,574,759K7 Rwanda II 9,000 1,916,799 213 58 6 67,513,704 8,825,321K17 Construction Akaki II phase 1 WWTP II 100,000 63,831,160 638 n/a 7 131,344,864 17,169,263K16 Construction of Kaliti to Akaki Trunk sewer II 19,477,486 n/a 8 150,822,349 19,715,340K9 Lafto II 60,750 16,737,167 276 57 9 167,559,516 21,903,205K10 Meskel Square- Gotera II 33,750 15,703,099 465 54 10 183,262,615 23,955,897K11 Post office-AAWSA II 20,250 8,173,554 404 52 11 191,436,169 25,024,336
K15 Akaki II expansion III 770,000 518,842,500 674 n/a 12 710,278,669 92,846,885K13 Ayer Tena Interceptor III 64,200 11,249,444 175 45 13 721,528,113 94,317,400K14 North-eastern interceptor and laterals III 313,000 71,390,336 228 45 14 792,918,449 103,649,471K12 Merkato interceptor and laterals III 395,000 133,402,362 338 44 15 926,320,811 121,087,688

Wastewater Masterplan NEDECO
Volume I - Executive Summary 42
Table 2-25 Eastern catchment implementation priority
Akaki Based on the scoring outlined above and the strategy that the Akaki catchment is served by two treatment works, the sewer interventions proposed in the Akaki catchment are shown in Table 2-26. Initially work will be concentrated in the lower Akaki catchment where the current intervention will undertake items A1, A2 and A4. The sewerage of the upper catchment items A3, A5 to A13 would be outside the current intervention. Expansion of both treatment works would depend on flows and pollutant loads observed within the catchments.
Catchment Description of works
Sta
ge
Pop
ulat
ion
Equ
ival
ent s
erve
d (2
020)
Est
imat
ed c
ost
[ET
B]
Cos
t /C
apita
C
onne
cted
Sco
re
Impl
emen
tatio
n O
rder
Cum
mul
ativ
e C
ost
(Birr
)
Cum
mul
ativ
e C
ost
(Eur
o)
Eastern Proposed Interbeton InterventionE16 Preparation sanitary landfill, access road
and bridges, forestry pilot project and purchase 1 HP vacuum truck
I 7,525,430 n/a 1 7,525,430 983,716
E1 Construction of treatment plant Stage 1 I 100,000 72,005,530 572 n/a 2 79,530,960 10,396,204E2 Eastern terminal trunk sewer I 208,500 14,704,942 112 62 3 94,235,902 12,318,419E4 ILRI interceptor and Laterals I 23,000 8,878,551 342 61 5 103,114,453 13,479,013E5 Kotebe Interceptor and laterals I 30,500 14,247,624 403 56 6 117,362,077 15,341,448E3 CMC interceptor and laterals I 26,500 23,431,896 578 57 9 140,793,973 18,404,441EasternE17 Laterals excluded by Interbeton I 80,000 12,830,125 228 153,624,098 20,081,581E11 East Bole interceptor and laterals II 42,000 15,507,737 228 62 4 169,131,835 22,108,737E10 Gergi interceptor and laterals II 35,000 13,318,126 275 59 6 182,449,960 23,849,668E9 Kotebe Interceptor and laterals II 21,000 6,298,220 420 59 10 188,748,180 24,672,965E13 Kotebe Interceptor and laterals III 6,000 1,077,531 228 60 11 189,825,711 24,813,818E8 CMC interceptor and laterals II 12,000 5,775,018 474 55 12 195,600,729 25,568,723
E7 Construction of treatment plant 2nd Stage II 100,000 69,179,000 572 n/a 8 264,779,729 34,611,729E15 East Bole interceptor and laterals III 22,000 18,153,281 681 55 13 282,933,010 36,984,707E14 Gergi interceptor and laterals III 28,500 17,385,583 503 53 14 300,318,593 39,257,332E6 Ayat interceptor and laterals I 2,000 8,900,849 946 48 15 309,219,441 40,420,842E12 Ayat interceptor and laterals II 22,000 23,768,473 1,080 15 332,987,914 43,527,832E18 Extension of Forest by 125 ha III 17,855,750 n/a n/a 17 350,843,664 45,861,917E19 Expansion of WWTW 3rd stage III 150,000 103,768,500 692 18 454,612,164 59,426,427

Wastewater Masterplan NEDECO
Volume I - Executive Summary 43
Table 2-26 Akaki catchment implementation priority
2.4.1 Possible implementation schedule
Based on the implementation priorities and on the requirements for wastewater treatment the following implementation and expenditure schedules have been prepared. See Table 2-27 and Table 2-28.
Catchment Description of works
Sta
ge
Pop
ulat
ion
Equ
ival
ent s
erve
d (2
020)
Est
imat
ed c
ost
[ET
B]
Cos
t /C
apita
C
onne
cted
Sco
re
Impl
emen
tatio
n O
rder
Cum
mul
ativ
e C
ost
(Birr
)
Cum
mul
ativ
e C
ost
(Eur
o)
AkakiA1 Construction of Akaki I WWTP I 100,000 77,899,636 779 n/a 1 77,899,636 10,182,959A2 Akaki main interceptor and laterals I 118,000 12,206,848 103 62 2 90,106,484 11,778,625A4 Akaki east interceptor and laterals I 52,500 4,024,239 77 55 3 94,130,723 12,304,670
A5 Construction of Akaki II WWTP Phase 2 II 100,000 69,179,000 692 n/a 4 163,309,723 21,347,676A8 Saris interceptor and laterals II 119,000 32,082,543 270 53 5 195,392,266 25,541,473A11 Saris Interceptor and laterals III 23,800 4,376,554 184 55 6 199,768,819 26,113,571A7 Akaki east interceptor and laterals II 31,000 8,620,485 278 52 7 208,389,304 27,240,432A3 Akaki west interceptor and laterals I 39,500 13,853,251 351 49 8 222,242,555 29,051,314A12 Expansion of Akaki I WWTP III 50,000 34,589,500 692 n/a 9 256,832,055 33,572,818A6 Akaki west interceptor and laterals II 91,000 16,101,351 177 54 10 272,933,406 35,677,569A9 Construction of Akaki II WWTP next phase II 250,000 172,947,500 692 n/a 11 445,880,906 58,285,086A10 Akaki west interceptor and laterals III 9,600 5,791,197 603 50 12 451,672,104 59,042,105A13 Bole Bulbula interceptor and laterals III 35,600 13,262,284 373 46 13 464,934,388 60,775,737

Wastewater Masterplan NEDECO
Volume I - Executive Summary 44
Table 2-27 Implementation schedule

Wastewater Masterplan NEDECO
Volume I - Executive Summary 45
Table 2-28 Yearly expenditure schedule

Wastewater Masterplan NEDECO
Volume I - Executive Summary 46
2.5 Environmental Screening
The proposed interventions have been assessed for their environmental impacts and allocated as categories A, B and C in conformity with the EU guidelines. See Tables 2-28 up to 2-31.
Table 2-29 Proposed interventions and recommended environmental studies; Kaliti sewer District
Proposed Project
Location
Description of Works
Recommended
Environmental
Study Provision of secondary lines & laterals for house connection
all along the existing Kaliti sewer truck lines
provision of PVC pipes of diameter 150 and 200mm including 150mm Y connections for house connection
A
Improvement work at Karamara Hotel and Bole interceptor
at Bole Karamara Hotel upgrading the existing 300mm dia. pipe to a 400mm diameter pipe
A
Rehabilitation of existing sewer lines
raising of manholes, provision of overflows, inspection and disconnecting of storm water intrusion points
A
Access road between sludge drying bed to disposal site
gravel road about 0.5 km A
Sanitary land fill site within Kaliti Wastewater treatment site
disposal site for dried sludge C
Existing pond de-sludging and maintenance
Kaliti treatment works de-sludging of facultative ponds and related maintenance works
B
Septic tank sludge injection point
selected location on the existing sewer line
protected compound with discharge to sewer
C
Expansion of Kaliti treatment plant, 2nd stage
within Kaliti treatment works compound
Construct anaerobic ponds upstream of existing facultative ponds.
C
Expansion of trunk sewers, secondary lines and laterals
Kaliti Catchment provision of 200 – 1200mm sewers, including 150mm Y fitting for house connection
B
Storm water overflows Kaliti catchment Provision to divert flood flows to rivers
B
Ayer Tena interceptor secondary sewers and laterals
Ayer Tena 300mm trunk sewer, river crossing (B)
North-East interceptor secondary sewers and laterals
North-East Addis Ababa, Saris
300-100mm trunk sewer, river crossings
(C)
Mercato interceptor secondary sewers and laterals
Mercato 300-1000mm trunk sewer, river crossings
(C)
A Project: no Environmental Impact Assessment required
B Project: Environmental Management and Monitoring required; mitigation measures to be formulated
C Project: Environmental Impact Assessment required ( ) Not in current project

Wastewater Masterplan NEDECO
Volume I - Executive Summary 47
Table 2-30 Proposed interventions and recommended environmental studies; Eastern Sewer District
Proposed Project
Location Description of Works Recommended
Environmental Study Preparation of sanitary land fill site
Kotebe disposal site for dried sludge C
Construction of treatment plant, 1st phase,
Eastern WWTW for 100,000 p.e. C
Main trunk sewer, secondary Sewer and laterals, CMC interceptor
Eastern approx. 6 km trunk sewer has to be laid before connecting this interceptor
B
Main trunk sewer, secondary Sewer and laterals, ILRI Interceptor
Eastern dia. 300mm trunk sewer, river crossings
B
Main trunk sewer, secondary Sewer and laterals, Kotebe interceptor
Kotobe dia. 600 & 400mm trunk sewer ,river crossings
B
Eastern terminal trunk sewer Eastern 6km trunk sewer B Gergi interceptor, secondary sewers and laterals
400 and 600m trunk sewer, river crossings
B
Expansion of treatment plant, 2nd and 3rd phases
Eastern WWTW for 150,000 p.e. (C)
Ayat interceptor secondary sewers and laterals
Eastern 300-600mm trunk sewer (B)
Pilot forestry project Kotebe treatment works
Sludge disposal on forest land (C)
A Project: no Environmental Impact Assessment required B Project: Environmental Management and Monitoring required; mitigation measures to be formulated C Project: Environmental Impact Assessment required ( ) Not in current project
Table 2-31 Proposed interventions and recommended environmental studies; Akaki sewer District
Proposed Project
Location Description of Works Recommended
Environmental Study
Construction of access road
to Akaki I WWTW
Akaki I WWTW gravel access road for the
construction of the WWTW
B
Construction of Akaki I
WWTW phase I
upstream of Lake
Aba Samuel
Stabilisation ponds to treat 100,000
p.e.
C
Akaki main interceptor,
secondary sewers and laterals
Akaki town dia. 800,600 & 400mm trunk line,
150-300mm secondary sewers and
laterals, river crossings
B
Akaki east interceptor,
Secondary sewers and
laterals
Western Akaki
area
dia. 600 ,500 & 400mm trunk line,
150-300mm secondary sewers and
laterals and river crossings
B
Construction of access road
to Akaki II WWTW
Akaki II WWTW Gravel access road for the
construction of the WWTW
B
Construction of Akaki II North of lake Aba Stabilisation ponds to treat 100,000 C

Wastewater Masterplan NEDECO
Volume I - Executive Summary 48
Proposed Project
Location Description of Works Recommended
Environmental Study
WWTW phase I Samuel p.e.
Expansion of Akaki II
WWTW further phases
North of lake Aba
Samuel
Expansion of WWTW to treat
1,000,000 p.e.
(C)
Saris interceptor secondary
sewers and laterals
300-400mm trunk sewer
(B)
Akaki west interceptor
secondary sewers and laterals
Akaki town 300-400mm trunk sewer
(B)
Expansion of Akaki I
WWTW
Upstream of lake
Aba Samuel
Expansion of WWTW by 50,000pe (C)
Bole Bulbula interceptor
secondary sewer and
treatments.
Bole Bulbula 300-400mm trunk sewer
( C )
A Project: no Environmental Impact Assessment required
B Project: Environmental Management and Monitoring required; mitigation measures to be formulated
C Project: Environmental Impact Assessment required ( ) Not in current project
Table 2-32 Proposed interventions and recommended environmental studies; various projects
Proposed Project
Location Description of Works Recommended
Environmental Study
Forestry development Kotebe Plot forestry project for sludge disposal (C) Sludge collection equipment Various high power vacuum trucks A Storm water overflow Various in
Kaliti
provision of station overflows to spill
flood flows to river
B
A Project: no Environmental Impact Assessment required
B Project: Environmental Management and Monitoring required; mitigation measures to be formulated
C Project: Environmental Impact Assessment required
(C) Project not in current project

Wastewater Masterplan NEDECO
Volume I - Executive Summary 49
3 FINANCIAL AND ECONOMIC ANALYSIS
3.1 Introduction
In accordance with the TOR for the Masterplan, the proposed interventions were subjected to a full financial and economic analysis. The analyses comprise:
• financial cash flow analysis for with / without project cases / individual catchments; • economic cash flow analysis for with / without project cases / individual catchments; • NPV / IRR for financial / economic analyses for the project / catchments; • a provisional project funding for the project / catchments; • sensitivity tests for key cost and revenue parameters; • intangible costs and benefits on health, environment and real estate development.
Scenario definitions with project scenarios The Masterplan contains a number of (sub) components that will be implemented. The components of the Masterplan to be implemented and their phasing are described in technical detail in sections 3 and 4 and in financial detail in the subsequent subsections of this Section. Included in the with project case are the necessary changes in the use of manpower, commodities, repair and maintenance etc. Three basic with case scenarios have been identified (see section 1.3.2) reflecting different technical options each providing the same sewerage service level. First, the feasibility of these technical options (scenarios 1-3) is tested, after which the preferred option is treated in further detail. The preferred option is referred to as the with case and is compared to the without case. without project scenario The without scenario comprises more than “do nothing”. It presumes a “continue the present situation and trends with only a number of essential replacements taking place”, i.e.:
• A very limited coverage of customers for sewerage, growing at a slow pace (0.5% p.a.); • The sewer network / sludge collection as at present, repair / replacement of assets upon
breakdown and gradual / limited deterioration of services due to the general ageing of assets;
• As a consequence of the preceding item, operating expenses are expected to rise in order to maintain service at present levels.
For both the with and without scenarios, the present study concentrates on sewerage and sludge collection activities only. Water supply systems provide an upper limit to these activities.
3.2 Financial analysis
Project investment options - Comparison of treatment types Three general types of wastewater treatment works have been mutually compared to see which is most economical. These include stabilisation ponds, carrousels and trickling filter types. Units that serve identical quantities of 100,000 person equivalents have been compared over a 20 year period. Figure 3.1 shows how the discounted costs compare for total costs, for investments only and for all operation and maintenance costs.

Wastewater Masterplan NEDECO
Volume I - Executive Summary 50
Figure 3.1 Discounted costs (ETB M) for 100,000 p.e. WWTW's 20 yrs, 10% The graph clearly shows that a trickling filter solution is most economical WWTW when both capital and running costs are taken in to account as a result of the he reduced level of capital costs. Stabilisation ponds have by far the lowest running cost. The justification for selecting stabilisation ponds rather than the trickling filter are given in Section 4 but can be summarised as: The waste stabilisation treatment process is the more robust i.e. has a wider tolerance to variation in the incoming hydraulic and pollutant load than the mechanical plants and is thus more suitable for the phase 1 plants. A significant additional advantage is that the ponds produce a high quality effluent with low levels of pathogenic micro-organisms. Effluent from the mechanical plant would require additional treatment to meet the discharge standards for inland waterways. Project investment options - Main project scenarios A broad financial analysis has been prepared at project level for three main scenarios each providing the same service level to determine which option will be worked out in detail to be compared to the without scenario. The three with scenarios (1-3) are compared to each other and to the without scenario (scenario 0) from a costing point of view: investments in new and existing assets, as well as, incremental working capital and operating costs. The analysis concentrates on the comparison of costs since profits are assumed to be equal to all with scenarios due to equal service levels provided under these scenarios. Based on the technical options presented before three scenarios have been selected for further analysis:
Discounted costs for 100,000 p.e. WWTP's over 20 y rs at 10%
0
10
20
30
40
50
60
70
Waste Stabilization Ponds Carrousel Trickling filter
Cos
ts in
mln
ET
B
all costs runnig costs only investment cost only

Wastewater Masterplan NEDECO
Volume I - Executive Summary 51
1. Provision of a sewerage system using waste stabilisation ponds for treatment 2. Provision of a sewerage system using mechanical plant (Carrousels and UASBs) 3. Provision of a sewerage system with the Eastern catchment diverted to Akaki WWTW
via a new trunk sewer. Table 3-1 shows the relevant cost details of the scenarios. It shows that scenario 2 has investments requirements that are about 25% lower than the other two with case scenarios. At the same time scenario 2 is characterised by much higher operating costs and hence working capital requirements than scenarios 1 and 3.
Table 3-1 Investment and operating costs comparison of project options (2001 – 2020, ETB millions)
Replacements Scenario
Investment new assets New assets Existing
Working capital 1)
Operating cost/yr 2)
NPV of all costs 3)
0 0.0 0.0 19.0 0.0 26.8 155 1 1,829.8 0.0 22.8 2.6 33.8 676 2 1,373.9 52.5 22.8 34.0 186.6 931 3 1,849.8 0.0 22.8 2.6 33.9 691
Note: 1) Incremental working capital requirements for the whole period only; 2) for 2020; 3) NPV at a discount rate of 10%. Taking all costs in to account scenario 1 is most feasible: NPV is ETB 676 million, 27% lower than #2 and marginally lower than #3. Scenario 0 has by far the lowest costs NPV, only 23% of scenario 1. However, this NPV corresponds to a considerable lower service level. Scenario 1 is hence the preferred scenario (with case) and is worked out in detailed comparison with scenario 0 (without case).
3.2.1 Project capital investments
The with case is characterised by a prolonged period of heavy investments. A summary for project investments is presented in Table 3-2. The table shows investments by catchment, contingencies are included at 10%. The foreign exchange component is 42%. For the without case no investment programme is envisaged that will lead to the extension of AAWSA’s sanitation operations.
Table 3-2 Project investment summary, with case (ETB millions)
Item Eastern Akaki Kaliti Project Sewer network 169.1 100.3 304.0 573.3 Treatment works 222.7 284.4 514.1 1,021.2 Sludge 1) 64.7 3) 0.0 4.2 68.9 Total 456.5 384.7 822.2 1,663.4 Contingencies 2) 45.6 38.5 82.2 166.3 Grand total 502.1 423.2 904.5 1,829.8 Note: 1) collection, treatment and disposal; 2) 10%; 3) all HPVs are included under Eastern to simplify the analysis. Figures may not add up due to rounding.

Wastewater Masterplan NEDECO
Volume I - Executive Summary 52
In the with case only the HPV trucks will be replaced once before 2020. They are included in the Eastern catchment, but to be used in Akaki and Kaliti as well. The remaining asset value at the end of the projection period is recovered through residual values: ETB 1,384 million (EUR 180.9 million) for the with case and ETB 48 million (EUR 6.3 million) for the without case. Replacement of existing assets is based on the historical purchase value at project start and the percentage that will have to be replaced every year. Percentages of average annual replacement reflect asset life. In general replacement of existing assets is expected to be 25% higher for the with case as compared to the without case. The replacement of “sludge works-fleet items” is put to zero as in both with and without cases AAWSA is expected to let the collection of wet sludge by vacuum trucks be handled by the private sector. Based on these assumptions, replacement of existing assets is expected to amount to fixed amounts of ETB 1.2 million (EUR 0.16 million) per annum for the with and ETB 1.0 million (EUR 0.13 million) per annum for the without project case throughout the projection period for AAWSA’s sanitation activities. (see financial and economic annex Table E3 for all scenarios and all catchments). Funding of the replacement of existing assets is assumed to be arranged for by AAWSA. The foreign exchange component for replacement of fixed assets is estimated at 36-37% for both cases. The amount fixed in working capital is determined through the level of operations. The incremental changes are included in the cash flow as investments. The residual value is included as a cash inflow in the feasibility analysis. The starting working capital for existing operations is based on the audited annual reports and is initially the same for both cases: 511 days of operating costs, or ETB 13.8 million (EUR 1.80 million), sanitation activities only. It is expected to be gradually reduced from 511 days to 75 days of operating cost by 2007 for the with project case (ETB 8.2 million or EUR 1.07 million by 2020). For the without case working capital requirements are expected to remain at the present level (511 days). This is expected to result in a slight net reduction of working capital over time to ETB 7.6 million (EUR 0.99 million). Details of working capital requirements are included in the financial and economic annex Tables F1 and F2 for all scenarios and all catchments.
3.2.2 Sludge collection costs and revenues
Sludge collection costs by methods Costs of sludge collection by high pressure vacuum trucks (HPV) and ordinary vacuum tankers (VAC) have been analysed. The average age of the vehicle and whether or not the cost of capital is included determines cost levels. Cost prices were calculated for fairly new, used and old trucks. Cost prices per trip for age groups are shown in Table 3-3 (see the financial and economic annex for details).

Wastewater Masterplan NEDECO
Volume I - Executive Summary 53
Table 3-3 Sludge collection by 12 m3 HPV or 8 m3 vacuum truck, cost price comparison (ETB/trip)
Truck type Incl. / excl.
capital costs Fairly new truck
(0 – 10 yrs) Used truck (5 – 15 yrs)
Old truck (10 – 20 yrs)
Including 263 222 189 12 m3 HPV Excluding 134 135 138 Including 181 169 153 8 m3 vacuum truck Excluding 100 111 122
Cost prices including the effect of aging, becoming lower over time mainly because depreciation and calculated interest are reduced. For a fairly new truck depreciation and interest charges compose 45-50% of the costs, for an old truck this is 21-27%. A charge of ETB 49 (EUR 6.40) per trip, as prevailing, would cover the costs of fuel and crew only, which is not a sustainable provision of service. Not increasing collection fares would not only mean that provision through new vehicles will become erratic within years, but also that the private companies providing the same service are forced to cannibalise their vehicles and in the medium term withdraw from the business. This would leave the clients as the main losers. Based on above calculations a tariff of at least ETB 155 (EUR 20.25), but preferably ETB 170 (EUR 22.25) seems necessary for septic tanks in, order to operate from a going concern point of view. HPV’s incur even more costs and at the same time serve people that are poorer. A tariff subsidy will be required. Furthermore it is noted that in an economic analysis it makes no difference whether trucks are bought, donated or acquired otherwise, capital costs have to be included in the cost price at all times. A cost price based on a used truck including the costs of capital employed, i.e. ETB 169/trip (EUR 22.10), seems the most reasonable starting point for determining collection tariffs in the long run. Taking this tariff as starting point, a differentiation according to consumer categories is possible. In this way, ‘poor’ clients could still pay (much) less than what institutions would pay for the same service. Sludge collection costs and revenues for project scenarios In the C-section Tables (all scenarios all catchments) of the financial and economic annex sludge collection costs and revenues are treated in detail. It has been assumed that AAWSA will not replace its VAC fleet and leave collection to others (with and without cases). For collection by HPV trucks the situation is the other way around: only AAWSA acquires a number of HPVs (with cases only). The number of people using pit latrines (PL) or septic tanks (ST) determines the quantity of sludge produced. PLs are assumed equal in with / without scenarios. STs vary by case: households that remain unconnected to the sewer system in the without case as compared to the with case use STs (see financial and economic annex Tables C5 and C6 for all scenarios and all catchments). The number of STs and PLs to be emptied each year are shown in Table 3-4 (financial and economic annex Table C19).

Wastewater Masterplan NEDECO
Volume I - Executive Summary 54
Table 3-4 Septic tanks and pit latrines emptied every year (with / without case, thousands/year)
Tank/pit 2001 2005 2010 2020 with/without with/without with/without with/without
Septic tanks 13.1 / 13.1 23.1 / 25.7 35.5 / 42.6 59.8 / 99.7 Pit latrine / vacuum truck 34.2 / 34.2 14.0 / 36.5 20.9 / 37.9 2.0 / 32.4 Pit latrine / HPV 0 / 0 5.6 / 0.0 4.3 / 0.0 8.4 / 0.0 Total 47.3 / 47.3 42.7 / 62.2 60.7 / 80.6 70.1 / 132.0 Note: Figures may not add up due to rounding. Truck trips by type evolves as in Table 3-5. The main expansion of the HPV fleet is planned for 2014. Total number of trucks operated by 2020 is expected to be about 200 for the without case (almost all 6-8 m3 VACs) and 112 for the with case (18 HPVs, the remainder 6-8 m3 VACs). Fleet size in the without case is bigger than in the with case because the sludge volume is bigger, while collection is less effective when not using HPVs. For modelling purposes all HPVs have been placed in the Eastern catchment, usage is foreseen in all catchments by share of the number of PLs. See financial and economic annex Table C10 and C11 for all scenarios and all catchments.
Table 3-5 Sludge collection trips by truck type regardless of ownership (with / without case, thousands of trips/year)
Truck type 2001 2005 2010 2020 With/without with/without with/without with/without
3 m3 vacuum 3.6 / 3.6 3.2 / 3.2 1.4 / 1.4 0 / 0 6-8 m3 vacuum 43.7 / 43.7 33.8 / 59.0 55.0 / 79.2 61.7 / 132.0 12 m3 HPV 0 / 0 5.6 / 0.0 4.3 / 0.0 8.4 / 0.0 16 m3 vacuum 0.5 / 0.5 0.5 / 0.5 0.2 / 0.2 0 / 0 Total 47.8 / 47.8 43.2 / 62.7 60.9 / 80.8 70.1 / 132.1 Note: Figures may not add up due to rounding. The tariff modification proposals by Ernst and Young has been applied. Per 2002 AAWSA collection tariffs for domestic STs / PLs rise from ETB 49 to ETB 69 per trip, for commercial entities from ETB 130 (EUR 17) to ETB 196 (EUR 25.65). For commercial providers tariffs remain the same or increase to modified AAWSA levels, hence private STs will remain at ETB 150 and commercial will increase to ETB 196. A tariff of twice the new ST tariff, viz. ETB 138 (EUR 18.05), has been established for emptying by HPV. A higher tariff is reasonable since an HPV empties much deeper than ordinary VACs. The deposit fee at AAWSA’s ponds of ETB 15 (EUR 2.00) for third providers is maintained. See financial and economic annex Table General-C12 for full details. Table 3-6 presents revenues and collection costs for AAWSA and others. The figures show that the sector as a whole is expected to make a small loss in the coming two decades. AAWSA’s operations show a small profit, mainly because of the deposit fee imposed on other providers. Was AAWSA to operate the fleet itself, it would show a small loss in the long run. A higher tariff is therefore required. Details are included in financial and economic annex Tables C14, C15 and C17 for all scenarios and all catchments.

Wastewater Masterplan NEDECO
Volume I - Executive Summary 55
Table 3-6 Sludge collection revenues and costs, AAWSA and others (with / without case, ETB millions/year)
2001 2005 2010 2020 Provider Item
with/without with/without with/without with/without Revenues 1.6 / 1.6 2.9 / 1.7 2.3 / 1.5 3.2 / 2.0 Costs 4.4 / 4.4 3.7 / 2.2 1.8 / 0.9 1.7 / 0.0 AAWSA Net profit -2.8 / -2.8 -0.8 / -0.5 0.5 / 0.7 1.5 / 2.0 Revenues 3.3 / 3.3 3.8 / 7.6 8.0 / 11.7 9.8 / 20.7 Costs 3.6 / 3.6 4.0 / 8.2 8.4 / 12.4 10.2 / 21.8 Others Net profit -0.3 / -0.3 -0.2 / -0.5 -0.5 / -0.8 -0.4 / -1.1 Revenues 4.9 / 4.9 6.7 / 9.3 10.3 / 13.2 13.0 / 22.7 Costs 8.1 / 8.1 7.7 / 10.3 10.3 / 13.3 11.9 / 21.8 All Net profit -3.1 / -3.1 -1.0 / -1.0 0.0 / -0.1 1.1 / 0.9
Note: Figures may not add up due to rounding. Sewer and sludge connection costs to customers Customers bear investment and maintenance costs to sewer or sludge infrastructure constructed around their dwellings (house connections to the sewer network and construction of PL / ST). These costs are summarised in Table 3-7 (see annex Table General-D1).
Table 3-7 Sewer and sludge connection and maintenance costs for customers (ETB)
Type Subtype Construction
cost Annual
maintenance cost Apartment 1,800 36 Residence 600 12 Small industries 600 12
Sewer connection
Others1) 1,800 36 Septic tank - 13,500 270 Pit latrine - 4,650 93
Note: 1) including main industries, government buildings, hospitals, commercial and hotels. Maintenance is taken as 2.0% of construction cost, reconstruction after 30 years as 80% of the original cost. The customer born costs are not included in the financial analysis; they do not pertain to the feasibility of AAWSA. They do appear in the economic analysis, as they are costs to the society. Further details are included in the section on economic cash flow and in the financial and economic annexes D3, D4 and D6 for all scenarios and all catchments, for financial and economic analyses. Investments by customers in new connections amounts in the long run to ETB 144 million (EUR 18.82 million) p.a. for the with case and ETB 274 million p.a. for the without case. Replacement of existing connections amounts in the long run to ETB 37 million (EUR 4.84 million) p.a. for both cases (see financial and economic annexes Table D3 and D4 for all scenarios and all catchments).

Wastewater Masterplan NEDECO
Volume I - Executive Summary 56
3.2.3 Operating costs and revenues of AAWSA for sanitation activities
Sewerage and sludge works operating costs Operating costs of existing assets are based on audited annual reports and remain unchanged. Fixed percentages over investment values have been used to for new assets: for sewer network and treatment plants; 1.5%, for buildings, 2.5%, for HPVs 12% and 3.0% for contingencies. An overview is presented in Table 3-8. Details are included in the financial and economic annex Table F1 for all scenarios and all catchments.
Table 3-8 Sanitation related annual operating cost summary for AAWSA (ETB millions)
2001 2005 2010 2020 Item
with/without with/without with/without with/without Sewerage 0 / 0 2.4 / 0.0 8.9 / 0.0 21.7 / 0.0 New assets Other 0 / 0 3.3 / 0.0 5.1 / 0.0 12.9 / 0.0 Sewerage 2.4 / 2.4 2.4 / 2.4 2.4 / 2.4 2.4 / 2.4 Existing
assets Sludge 7.4 / 7.4 5.2 / 5.2 3.9 / 3.9 3.0 / 3.0 Total 9.8 / 9.8 13.2 / 7.6 20.3 / 6.3 40.0 / 5.4 Note: Figures may not add up due to rounding. Revenues from sanitation activities Revenues are composed of wastewater and sludge collection incomes. The first will be detailed below. The latter has been treated before, only relevant data will be repeated here. Wastewater income is based on drinking water sold, regardless of the provision of sewerage service and is equal in both with and without case. The tariff proposal approved by the municipal authorities (Tariff proposal, Ernst & Young, 30.10.2000) has been applied. Table 3-9 depicts the position on wastewater tariffs (see financial and economic annex Table A12 for all scenarios and all catchments). Different tariffs exist for different categories of users, viz. households, industries, hotels etc. Nevertheless, clients seem all allocated to the household category only. Users of public fountains are not charged for sewerage services.
Table 3-9 Wastewater tariff structure, all consumers except public fountains (ETB/m3)
Tariff slab (m3/month)
2001 (historical)
2002 2003 2004 2005 2006+
#1: 0 – 7 0.00 0.00 0.00 0.00 0.00 0.00 #2: 7-20 0.08 0.35 0.40 0.45 0.50 0.55 #3: >20 0.17 0.35 0.40 0.45 0.50 0.55 Note: Tariff slab refers to the consumption of drinking water. Table 3-10 shows details on wastewater income development, for more details see financial and economic annex Tables A14 and A15 for all scenarios and all catchments.

Wastewater Masterplan NEDECO
Volume I - Executive Summary 57
Table 3-10 Wastewater income developments
Item 2001 2005 2010 2020 Drinking water sold (million m3/month)
2.8 3.6 5.1 11.6
Domestic 0.6 5.6 10.4 31.5 Non-domestic 3.3 11.6 16.2 30.7
Wastewater incomes (ETB million) Total 3.9 17.2 26.6 62.2
With case 3% 18% 28% 68% Sewerage service related 1) Without case 3% 3% 4% 3% Note: 1) sewerage income related to sewerage services provided. Income from sludge collection is less important than sewerage income. Income to AAWSA from sludge collection has been calculated before, therefore only a summary of revenues is presented in Table 3-11.
Table 3-11 Summary of income developments for AAWSA (ETB million)
Item 2001 2005 2010 2020 Watewater 3.9 / 3.9 17.2 / 17.2 26.6 / 26.6 62.2 / 62.2 Sludge collection 1.6 / 1.6 2.9 / 1.7 2.3 / 1.5 3.2 / 2.0 Total 5.6 / 5.6 20.1 / 18.9 29.0 / 28.2 65.5 / 64.2 Note: Figures may not add up due to rounding.
3.2.4 Financial project cash flow before funding
Financial project cash flows have been composed and NPV / IRR calculated for the comparison of the with / without case. Both cases are characterised by increasing costs, rather than increasing revenues. This means that the autonomous IRR / NPV, taken over the net cash flow of a project case only, will not meet the IRR / NPV standard. Only in the comparison of the with / without case cost savings appear, regarded as project benefits. This is common practice in public infrastructure projects, viz. roads, railways and ports. Generally, the comparison only shows savings in later project years, as the earlier years are characterised by (high) investments. In particular, wastewater projects are characterised by many indirect costs and benefits. With a high number of benefits outside the direct control of AAWSA this renders the feasibility for AAWSA as an entity as difficult to attain. Moreover, direct revenues from the sewerage tariff are also realised in the without case due to their link to the supply of drinking water. Making the without case from that viewpoint more financially beneficial than the with case since it gives AAWSA the revenues without any investment. To overcome this paradoxical situation, data are presented showing feasibility on IRR / NPV grounds on different levels. Viz. firstly for AAWSA as an entity, then for AAWSA with the indirect costs and benefits added. (health cost, forgone land cost, costs to customers, sludge collection cost by others and real estate developments, see financial and economic annex Table J1 for all catchments and scenarios).

Wastewater Masterplan NEDECO
Volume I - Executive Summary 58
It should be kept in mind that the feasibility of a project such as the present one is primarily judged by the economic cash flow not the financial cash flow. The financial cash flow is a prelude to the former. The financial cash flow serves to determine funding requirements for the project and the implementing agency. When sufficient funding is available, the agency will not have a financial breakdown due to the project. Table 3-12 shows the results of the analysis of the financial cash flows before finance and tax. More details are included in financial and economic annex Table J1 for all catchments and scenarios.
Table 3-12 Financial cash flows analysis for catchments and project (NPV in ETB million, at a discount rate of 10%) LINE Item Eastern Akaki Kaliti Project
1 with without with without with without With without 2 Net AAWSA cash flow 3 NPV -223 +11 -95 +30 -108 +93 -426 +134 4 IRR -6.3% 19.9% -2.3% 1,354% 1.5% 65.2% -2.2% 56.9% 5
# def. Years2) 19 19 17 1 17 1 20 1 6 Net AAWSA cash flow plus added items 7 NPV -542 -465 -356 -332 -1,542 -1,652 -2440 -2449 8
IRR -7.5% -9.4% -6.7% NA.1) NA.1) NA.1) NA.1) NA.1)
9 Comparison with to without for net AAWSA cash flow plus added items. 10 NPV -76 -24 +110 +9 11
IRR 1.9% 3.5% 3,758% 10.5%
Note: 1) NA. = not available, mathematically impossible to derive. 2) # def. = number of deficit years. Figures may not add up due to rounding. A few technical remarks can be made with respect to Table 1.17. The IRR is derived through trial-and-error. By mathematical law, the IRR can have multiple solutions or no solution at all. This occurs in particular when the net cash flow over multiple years changes from positive to negative frequently, when a cash flow stream starts with a positive value or when the flow remains negative. The issues described apply to the present analysis. Table 3-12 shows that from a financial point of view it is most efficient for AAWSA not to implement the project. This renders an autonomous IRR of 57% on project level (line 4, last column), caused by the wastewater revenue flows. Lines 10-11 show the NPV / IRR for the comparison of with to without cases for individual catchments and the project as a whole. The project as a whole shows feasible from a financial point of view at an IRR of 10.5% (NPV of ETB 9 million). The above information is used for three purposes. First, based on the above data a provisional project funding has been drawn up for discussion purposes. Second the financial projections and the funding data are used to prepare financial statements for the sewerage and sludge related activities of AAWSA. Finally, the financial cash flow data are converted in economic values to perform an economic evaluation.

Wastewater Masterplan NEDECO
Volume I - Executive Summary 59
3.2.5 Project funding
For the without case no loan or grant funding is available, no further cash flow deficits are foreseen. A provisional funding has been prepared for the with case such that deficits before finance as well charges from loans are covered (tax exemption is assumed). Funding consists of two types. First, all project investments in new assets are financed through loans / grants. Secondly, remaining deficits are covered by other means. Loan / grant funding schemes are prepared on a per catchment basis (see financial and economic annex Table J2 for all catchments and scenarios). Grant finance has been assumed for 2002 – 2005, for ETB 359.4 million (EUR 46.98 million). No charges have been included for grant financing. Loan funding has been assumed to take place in three batches for planning purposes:
• First loan batch: 2006 – 2010; • Second loan batch: 2011 – 2015; and • Third loan batch: 2016 – 2020.
Each loan batch is followed by a two year grace period. Repayment takes place in forty equal annual instalments; interest is 2.5% p.a with no commission. The total loan amount is ETB 1,470 million (EUR 192.16 million) for 2006 – 2020. A like in other countries sanitation is not extremely profitable. Loan repayments are expected to cause cash flow deficits in 2013 - 2019 adding up to ETB 145.6 million (EUR 19.03 million) for which funding needs to be found, preferably without further charges attached to it. Two options have been analysed in detail. One option is to assume funding to be obtained from the municipal or regional government. This would mean a subvention or a participation in AAWSA. A second option is to cover the remaining deficits by postponing loan repayments through postponing loan disbursements. If grant finance can be found for the investment amounts of 2006 – 2007 and 35% of the amount for 2008 (ETB 275.4 million, EUR 36.00 million), then no further deficits are expected to occur until the end of the project period.
3.2.6 Financial statement projections
Sewerage & sludge activities A summary overview of the projected profit & loss account, the flow of funds and the balance sheet is presented (Table 3-13). More detailed projections are included in financial and economic annex Tables K1, K2 and K3 for all scenarios.

Wastewater Masterplan NEDECO
Volume I - Executive Summary 60
Table 3-13 Profit & loss account projections for sewerage and sludge activities of AAWSA (ETB millions)
2001 2005 2010 2020 with without with without with without with without
Wastewater 3.9 3.9 17.2 17.2 26.6 26.6 62.2 62.2 Sludge 1.6 1.6 2.9 1.7 2.3 1.5 3.2 2.0
Income 5.6 5.6 20.1 18.9 29.0 28.2 65.5 64.2 Sewer & TP 2.4 2.4 4.8 2.4 11.3 2.4 24.1 2.4 Sludge 11.9 11.9 9.7 7.3 7.0 4.7 10.0 3.0
Other 0.0 0.0 0.9 0.0 2.7 0.0 5.9 0.0 Operating exp. 14.3 14.3 15.4 9.7 21.1 7.1 40.0 5.4 Operating profit -8.7 -8.7 4.7 9.2 7.9 21.1 25.5 58.8
Depreciation 3.7 3.7 12.4 3.8 27.9 2.0 58.1 2.3 Interest 0.0 0.0 0.0 0.0 9.5 0.0 32.5 0.0
Net profit -12.5 -12.5 -7.6 5.3 -29.5 19.1 -65.2 56.5 Note: Figures may not add up due to rounding. For all financial statements it holds true that the without case shows better results than the with case. This is due to the revenues from wastewater being equal in both cases.
Table 3-14 Flow of funds projections for sewerage and sludge activities of AAWSA (ETB millions)
2001 2005 2010 2020 with without with without With without with without
Income CF/operat.ns1) 1.22) 1.22) 4.7 9.2 -1.6 21.1 -7.0 58.8 Financing Grants 0.0 0.0 147.1 0.0 0.0 0.0 0.0 0.0
Loan disbursements 0.0 0.0 0.0 0.0 50.7 0.0 139.6 0.0 Total income 1.2 1.2 151.8 9.2 49.1 21.1 132.6 58.8 Expenditure
Investments 1.2 1.2 148.3 1.0 51.9 1.0 140.8 1.0 Working Capital 0.0 0.0 -0.3 -0.4 -0.0 -0.3 0.5 -0.0
Loan repayments 0.0 0.0 0.0 0.0 0.0 0.0 20.2 0.0 Total expenditure 1.2 1.2 148.0 0.6 51.9 0.7 161.5 1.0 Surplus/deficit 0.0 0.0 3.8 8.6 -2.8 20.4 -28.9 57.8 Note: 1) CF/operations = cash flow from operations; 2) in 2001, the Flow of Funds of financial and economic annex Table K2, a shortfall of ETB 9.9 million is predicted, however, neither the shortfall nor the breakdown of AAWSA has occurred, therefore the shortfall is merged with the surplus on cash flow from operations. Figures may not add up due to rounding.

Wastewater Masterplan NEDECO
Volume I - Executive Summary 61
Table 3-15 Balance sheet projections for sewerage and sludge activities of AAWSA (ETB millions)
2001 2005 2010 2020 With without with without With without With without
Assets Fixed assets 77.5 77.5 415.3 66.0 706.2 59.4 1,383.7 47.8 Net curr.assets 13.8 13.8 4.3 10.6 4.2 8.8 8.2 7.8
Cash balance 0.0 0.0 19.5 18.4 13.2 100.2 -23.0 485.3 Total assets 91.3 91.3 439.0 95.1 723.6 168.4 1,368.9 540.7 Liabilities
Equity (assets) 93.8 93.8 93.8 93.8 93.8 93.8 93.8 93.8 Grants 9.9 9.7 369.3 9.7 369.3 9.7 514.9 9.7 Loans 0.0 0.0 0.0 0.0 403.5 0.0 1,359.3 0.0
Ret.d earn.gs1) -12.5 -12.5 -24.1 -8.4 -143.1 64.8 -599.1 437.2 Total liabilities 91.3 91.3 439.0 95.1 723.6 168.4 1,368.9 540.7
Note: 1) ret.d earn.gs = retained earnings. Figures may not add up due to rounding. In the with case, the net value in fixed assets grows eighteen fold over the years, the without case shows a decrease by almost 40% over time. Although the financial statements for the with case do not look like a very profitable organisation, they still show a viable organisation. Sanitation activities in developing countries (including western Europe) all over the world have been only marginally feasible at the start. Affordability with the public is low whereas investments are high and take a long time to mature. All AAWSA’s activities On request of AAWSA, the consultant has prepared financial statement projections for AAWSA as an entity merged from the financial statement projections in the Tariff Study of 2000 and from the financial statement projections for AAWSA’s sanitation activities in the present Sanitation Masterplan. These projections were prepared for the with project case only. Merged projections have been limited in time to the shorter of the two (see financial and economic annex Table “E&Y MERGE” D1, D2 and D3).
Table 3-16 Merged Profit & loss account projections for AAWSA as an entity (ETB millions)
2001 2005 2010 With With With
Income 83.9 193.3 320.9 Operating expenses 96.2 123.0 163.4 Operating profit -12.3 70.4 157.6
Depreciation 24.7 68.6 91.6 Interest 7.0 17.6 31.8
Net profit -44.1 -15.9 34.2 Note: Figures may not add up due to rounding.
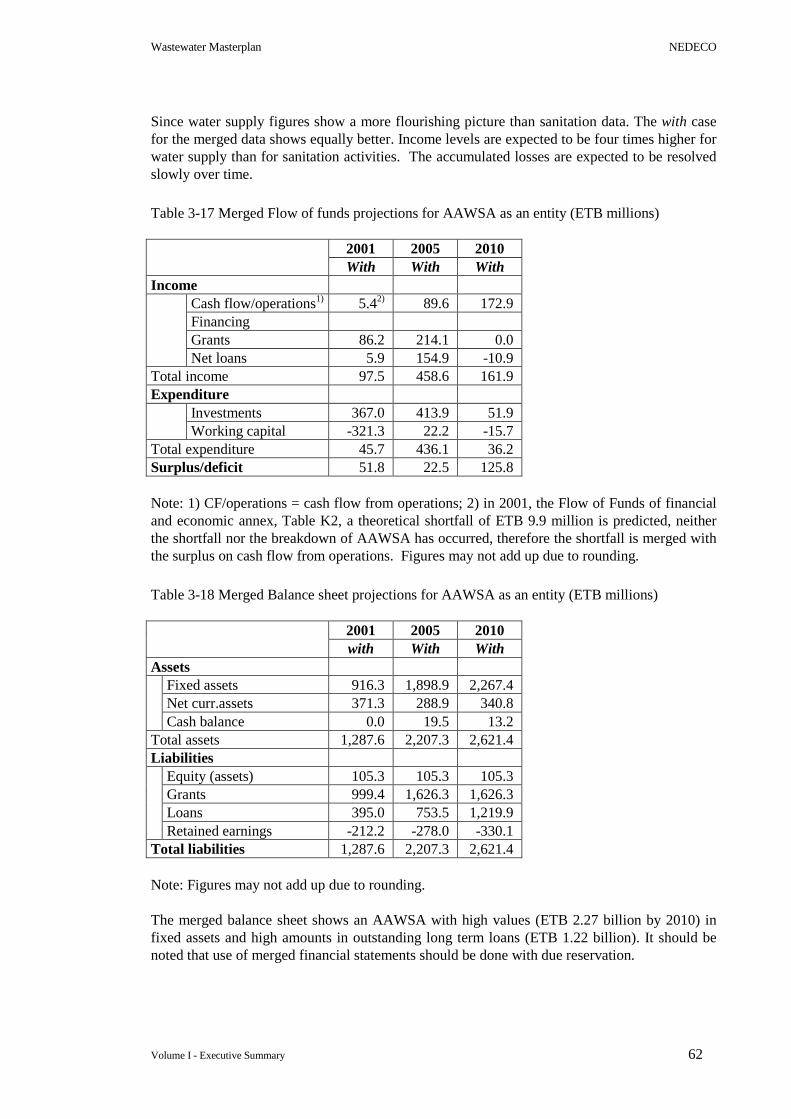
Wastewater Masterplan NEDECO
Volume I - Executive Summary 62
Since water supply figures show a more flourishing picture than sanitation data. The with case for the merged data shows equally better. Income levels are expected to be four times higher for water supply than for sanitation activities. The accumulated losses are expected to be resolved slowly over time.
Table 3-17 Merged Flow of funds projections for AAWSA as an entity (ETB millions)
2001 2005 2010 With With With
Income Cash flow/operations1) 5.42) 89.6 172.9 Financing Grants 86.2 214.1 0.0
Net loans 5.9 154.9 -10.9 Total income 97.5 458.6 161.9 Expenditure
Investments 367.0 413.9 51.9 Working capital -321.3 22.2 -15.7
Total expenditure 45.7 436.1 36.2 Surplus/deficit 51.8 22.5 125.8 Note: 1) CF/operations = cash flow from operations; 2) in 2001, the Flow of Funds of financial and economic annex, Table K2, a theoretical shortfall of ETB 9.9 million is predicted, neither the shortfall nor the breakdown of AAWSA has occurred, therefore the shortfall is merged with the surplus on cash flow from operations. Figures may not add up due to rounding.
Table 3-18 Merged Balance sheet projections for AAWSA as an entity (ETB millions)
2001 2005 2010 with With With
Assets Fixed assets 916.3 1,898.9 2,267.4 Net curr.assets 371.3 288.9 340.8
Cash balance 0.0 19.5 13.2 Total assets 1,287.6 2,207.3 2,621.4 Liabilities
Equity (assets) 105.3 105.3 105.3 Grants 999.4 1,626.3 1,626.3 Loans 395.0 753.5 1,219.9
Retained earnings -212.2 -278.0 -330.1 Total liabilities 1,287.6 2,207.3 2,621.4 Note: Figures may not add up due to rounding. The merged balance sheet shows an AAWSA with high values (ETB 2.27 billion by 2010) in fixed assets and high amounts in outstanding long term loans (ETB 1.22 billion). It should be noted that use of merged financial statements should be done with due reservation.

Wastewater Masterplan NEDECO
Volume I - Executive Summary 63
3.3 Economic analysis
To make an economic analysis therefore two steps have been made: • The consequences of the project for other actors and the society as a whole have been
added to the financial analysis; • The values used in the analysis have been converted from financial to economic.
The cost and benefit items for third parties with a direct impact on the project include:
• Sludge collection activities by private service providers; • Sludge and sewer related costs to households and entities; • Health effects with the general public; • The costs of forgone land use due to the construction of treatment plants; and • The impact on the value of real estate in the region.
All items have been converted to economic values using National Economic Parameters and Conversion Factors for Ethiopia (MEDaC, 1998). In general conversion factors amount to 0.80 – 0.90 (see financial and economic annex Table General-A4). Health benefits The difference in sanitation related health costs between with and without cases, treated as a project benefit, is calculated in economic terms at ETB 2.5 million (EUR 0.33 million) for 2005 increasing to ETB 7.1 million (EUR 0.93 million) and ETB 37.4 million (EUR 4.89 million) per annum in respectively 2010 and 2020 (see annex Table G3 for all cases and analyses). Forgone land use Capitalized over time (discount rate 10%) the forgone added value realized on land lost for agriculture is ETB 7.9 million (EUR 1.03 million) for the preferred scenario 1 (680 ha). The effects of forgone land use are marginal for the project. Real estate value development Value developments have been estimated conservatively, increasing once at 0.5% five years after connection to the sewer network (with and without cases, annex Table I1 for all cases and all analyses). The without case reflects a situation where sewer connections are much more scattered. This overstates the value development due to connections slightly. The effect of the value increase on the project are limited since they take effect only after the fifth project year (2006). Other benefits A number of other benefits exist, but remain largely intangible. Although it is obvious that their impacts will influence the project in a positive way, further studies would be needed to estimate the value of such benefits for the general public. Benefits considered are: • Time and cost savings from improved sewerage and sludge collection with AAWSA
clientele; • Increased productivity of water using industries; • Improved quality of life and general happiness for citizens; • Lower clean water treatment costs downstream; • Recreational options in the region and along the river(s); • Increased tourism; and • Improved air quality and reduced odour nuisance.

Wastewater Masterplan NEDECO
Volume I - Executive Summary 64
Economic cash flow In the financial and economic annexes Tables presenting the same values for financial and economic analyses have identical layouts, they differ in that they have the words ECONOMIC ANALYSIS written in bold italic capitals over the calendar bar. In addition, in the spreadsheet file financial values have a sky-blue background colour, whereas economic values have a sand-brown background colour. Only summarised economic cash flows are presented (Table 3-19). Wastewater revenues for which no service is rendered (97% out of 100%)are valued as transfer payments. This will decrease over time to 32% in 2020 in the with case. Full quantitative details for economic cash flows are included in economic annex Table J1 (all scenarios and all catchments).
Table 3-19 Economic cash flows analysis for catchments and project (NPV in ETB million, at a discount rate of 10%) LINE Item Eastern Akaki Kaliti Project
1 with without With Without with without With without 2 Net economic cash flow 3 NPV -458 -423 -306 -308 -1,383 -1,540 -2,148 -2,271 4
IRR -6.6% -10.8 -6.1% -10.5% -9.9% -13.5% -8.4% -12.3%
5 Comparison with to without for net economic cash flow 6 NPV -35 +3 +156 +128 7
IRR 6.4% 10.6% 3869% 16.5%
Note: Figures may not add up due to rounding. Table 3-19 clearly shows the feasibility of the project on economic grounds at an economic IRR of 16.5%. On a per catchment basis, Kaliti and Akaki are feasible, whereas Eastern is marginally feasible with an IRR bigger than zero but below the 10% cut off rate.
3.4 Sensitivity tests
Results of sensitivity tests are represented mainly through changes in the scores of compared (with to without case) IRR / NPV values. The effects of modifications to the exchange rate and to the investment amounts are strongly interlinked since a substantial proportion of the project investments are payable in foreign exchange. For any increase in investments by 10%, 6.2% is attributed to treatment works and 3.3% to sewer network. An increase in investments of 10% causes the grand total of the cost estimate to rise from ETB 1,916.0 million (EUR 250.46 million) to ETB 2,107.6 million (EUR 275.50 million). Modifications in foreign exchange rates can be treated as changes in investments. Foreign exchange shares of treatment works, sewer network, HPVs and buildings and other items are 30%, 60%, 100% and 30% respectively. As a result, a deterioration of the exchange rate of 10% between ETB and major currencies (EUR and USD) will cause the specific item to increase with 10% of the respective foreign exchange component. The cost estimate as a whole is expected to increase by 4.1% in ETB-terms after a devaluation of the ETB by 10%.

Wastewater Masterplan NEDECO
Volume I - Executive Summary 65
Impacts of increases in project investment are measured through increasing the contingency percentages. Results on the financial and economic IRRs and NPVs are presented in Table 3-20. The table shows that the project remains feasible from an economic point of view at an increase in contingencies of 20%.
Table 3-20 Sensitivity of variations in contingencies on investments at project level
Cost Estimate Financial Economic Case Contingencies
ETB m EUR m IRR NPV IRR NPV -10% 0% 1,741.2 227.69 14.5% 73 20.2% 176 Base 10% 1,916.0 250.46 10.5% 10 16.5% 24 +10% 20% 2,090.2 273.23 7.1% -54 13.4% 72 +20% 30% 2,264.4 296.00 4.1% -118 10.9% 19 Increases in working capital have been tested. At present AAWSA is operating with around 511 days worth of operating expenses. Three sensitivity cases have been tested:
• Base case: working capital new assets = 75 days, existing assets becomes 75 days (2007+);
• “ 150 days”: new assets = 150 days, existing assets becomes 150 days (2005+); • “511 days”: new assets = 511 days.
Table 3-21 shows that the different working capital alternatives have only a marginal effect on financial and economic IRR and NPV.
Table 3-21 Sensitivity on variations in working capital requirements at project level
Working capital Financial Economic Case
ETB m EUR m IRR NPV IRR NPV Base = 75 days 3.5 1.07 10.5% 10 16.5% 124 150 days 16.4 2.15 10.4% 8 16.3% 122 511 days 56.0 7.32 9.8% -3 15.6% 113 The interest rate for the loans under the provisional project funding is 2.5% p.a. in the base case. Any increase in interest causes a cost increase of about ETB 95 million (EUR 12.42 million) per percent point. Changes in interest rates have no effect on economic parameters since interest payments are valued as transfer payments (conversion factor of 0.0). A sensitivity analysis has been made of the indirect project effects concerning health, forgone land use and the development of real estate values. Effects have been tested in a combined effect only: the base case has been compared to increased effects of 10% and 20%. An increased effect of 10% causes the economic IRR to increase by 0.6% point.

Wastewater Masterplan NEDECO
Volume I - Executive Summary 66
Table 3-22 Sensitivity on combined health, forgone land use and real estate effects at project level
Item Unit Base +10% +20% Health costs ETB/case 152.50 167.75 183.00 Forgone land use ETB/ha/year 500 550 600 Real estate value Value increase 0.50 – 1.00 % 0.55 – 1.10 % 0.60 – 1.10 % Impacts Financial IRR / NPV 10.5% / 9 11.3% / 24 12.1% / 39 Economic IRR / NPV
16.5% / 124 17.1% / 138 17.7% / 152
Further real increases in tariffs by 10% and 20% have been investigated for wastewater and sludge collection. The development of tariffs under various sensitivity tests is presented in Table 3-23.
Table 3-23 Sensitivity on real tariff increases at project level
Item Unit Base +10% +20% Wastewater ETB/m3 0.55 (2006+) 0.60 (2007+) 0.65 (2008+) Sludge collection Private ST by AAWSA ETB 69 (2002+) 76 (2003+) 83 (2004+) Commercial ST by AAWSA ETB 196 (2002+) 216 (2003+) 235 (2004+) PL by VAC ETB 69 (2002+) 76 (2003+) 83 (2004+) PL by HPV ETB 138 (2002+) 152 (2003+) 166 (2004+) Private ST by non-AAWSA ETB 150 (2002+) 165 (2003+) 180 (2004+) Commercial ST non-AAWSA ETB 196 (2002+) 216 (2003+) 235 (2004+) Impacts Financial IRR / NPV 10.5% / 9.0 10.6% / 10.0 10.5% / 9.0 Economic IRR / NPV 16.5% / 124 16.7% / 129 16.7% / 134 Note: PL = pit latrine; ST = septic tank. The project shows a relatively low sensitivity for changes in tariffs. This is because wastewater tariffs are collected anyway, regardless of connection to the sewer network. The effect of a delay in implementation of the project works in beneficial to AAWSA as the payment of loan interest and the increase in operational costs are delayed increased the profits of AAWSA. In general, the project is said to have passed the sensitivity tests successfully.

Wastewater Masterplan NEDECO
Volume I - Executive Summary 67
4 SUMMARY OF RECOMMENDATIONS
This section summarised the recommendations contained in this Masterplan. The figures in brackets refer to the relevant section of Main Report.
4.1 Sewerage
Section • Secondary sewers and laterals must be constructed at the same time as their
associated trunk sewers 2.9.2
• New developments should be required to construct a sewerage system with a temporary treatment plant.
2.9.3
• All polluting industries and water consumers using more than 30m3/month system to be connected to the sewers, where available.
2.8
• Pollutant loads from industries to be consented and pre-treatment undertaken where required.
4.2.4
• Manhole covers to no longer be ventilated. Vent pipes to be installed where necessary
2.8
• Concrete pipes to be used as standard trunk sewers. 2.7.3 • Lateral sewers to be provided to allow Y-connections and stub sewers to be
located at all property boundaries. 2.9.2
• Sources of groundwater infiltration to be identified and eliminated. 2.8 • The connection of storm water and roof drains to be identified and removed. 2.9.1 • AAWSA to investigate the use of private/public partnerships to provide
sewerage in new developments 2.9.3
• New houses requesting an in-house water supply and with a sewer within 10m must connect to the sewer
2.9.3
4.2 Sludge collection, treatment and disposal
Section • Dry pit latrines should be emptied using a high performance vacuum trunk
and the dry sludge disposed of to a sanitary landfill. 3.1
• Injection of septic tank sludge in to the Kaliti sewer to be undertaken as a pilot project
3.7
• Existing vacuum trucks to only de-sludge septic tanks. 3.2 • New improved screens to be provided at the drying beds and sludge lagoons. 3.5.1 • The pilot forestry scheme to be initiated with immediate effect. 3.5.6 • The use of pour flush latrines to be encouraged, as debris cannot then be
added to the dry pits. 3.1
• New sanitary landfills to be constructed at Kaliti and Kotebe treatment work sites.
3.6
• One high power vacuum tank to be purchased as a pilot project. 3.1 • New dry pit latrines to be constructed with lined walls and base 3.1
4.3 Wastewater treatment plants
Section • First phase of each wastewater treatment plant to be wastewater stabilisation
ponds. 4.4.8

Wastewater Masterplan NEDECO
Volume I - Executive Summary 68
• A pilot trickling filter plant to be constructed to assess the suitability of this type of plant for use in Ethiopia.
4.4.8
• Proposals to de-sludge the facultative ponds in Kaliti to be formulated. 3.4.1 • Flows and pollutant loads to be regularly monitored at each works to allow
proactive extension of each works 4.5.4
4.4 Institutional
Section � Implementation of the Environmental Monitoring Unit (EMU). 5.2 � Where sewer laterals are provided connections to be undertaken by
householder with connection inspected and approved by AAWSA. 2.9.3
� Each consumer connected to the sewerage system to be registered. 2.9.1 � The enforced connection to sewer by major water consumers to be
implemented by a Directive from the Board. 2.8
� A Directive from the Board to insist on new developments being sewered. 2.9.3 � Staff recruitment and training to be coordinated with new works construction. 5.1 � AAWSA to implement the collection of “record drawings” with a locational
manhole numbering system 2.10
4.5 Financial
Section � A flat rate fee to be charged to those consumers connected to the sewerage
system. 2.9.2
� Differentiated tariffs in sludge collection to allow for affordability among the
poor and the better off. 7.3.4
� For institutional, commercial, government and similar bodies, the charge for septic tank and dry pit latrine emptying should cover all costs including overheads.
7.3.4
� Industries to be charged on both a volume and pollutant load (sewage strength) basis.
7.3.4
� Reduce working capital to 75 days. 7.3.3 � In association with financial institutions a revolving fund to be set up to
provide loans for the cost of connection to the public sewers 2.9.2
4.6 Implementation
The following implementation schedule is recommended for inclusion in the Project Dossier; Kaliti: Scheme 1 • Construct Kaliti stage 1 secondary sewers and laterals. • Sewer rehabilitation, sludge disposal and pilot sludge injection. • Extend Kaliti waste stabilization ponds to 180,000 population equivalent by using anaerobic
ponds. • Construct Kaliti phase 1 of stage 2 sewers:
o Mekanisa/Old Airport; o Bole Tele-22 Round; o Rwanda;

Wastewater Masterplan NEDECO
Volume I - Executive Summary 69
Kaliti: Scheme 2 • Construction Akaki II phase 1 WWTW (100,000 p.e.). • Construction of Kaliti to Akaki Trunk sewer. • Construct Kaliti phase 2 of stage 2 sewers:
o Lafto; o Meskel Square- Gotera; o Post office-AAWSA;
Eastern: Scheme 3 (Recommended Interbeton interventions) • Preparation sanitary landfill, access road and bridges, forestry pilot project and purchase 1
HP vacuum truck. • Construct new waste stabilisation ponds in the Eastern Catchment for a capacity of 100,000
population equivalent. • Construct Eastern stage 1 sewers:
o Eastern terminal trunk sewer; o ILRI interceptor and Laterals; o Kotebe Interceptor and laterals; o CMC interceptor and laterals.
Eastern: Scheme 4 (Recommended other interventions) • Construct Eastern stage 1 and 2 sewers:
o East Bole interceptor and laterals; o Gergi interceptor and laterals; o Kotebe Interceptor and laterals;
CMC interceptor and laterals This section summarised the recommendations contained in this Master Plan. The figures in Brackets refer to the relevant section of this report. Akaki: Scheme 5 • Construct waste stabilization ponds at Akaki I for a capacity of 100,000 population
equivalent. • Construct Akaki stage 1 sewers:
o Akaki main interceptor and laterals; o Akaki east interceptor and laterals;

Wastewater Masterplan NEDECO
Volume I - Executive Summary 70
5 COLOPHON
Client : AAWSA Project : Addis Ababa Sanitation Improvement Project File : Q 0110 01 001 Length of report : 71 pages Author : T. Hendriks, D Beale Contributions : J. Helmer, B. Jebessa, F de Zanger Project Manager : D. Beale Project Director : B. Bakker Date : 30 June 2002 File Name :Executive Summary G Final