ex-post evaluation - urban community...
TRANSCRIPT

EX-POST EVALUATION URBAN COMMUNITY INITIATIVE
(1994-1999)
FINAL REPORT AUGUST 2003

EX-POST EVALUATION URBAN COMMUNITY INITIATIVE
(1994-1999)
FINAL REPORT
AUGUST 2003
GHK 75 Avenue de Cortenberg B-1000 Brussels, Belgium
Tel: + 32 2 740 2729 Fax: + 32 2 740 2720
GHK 526 Fulham Road London SW6 5NR
Tel: + 44 20 7471 8000 Fax: + 44 20 7736 0784
http://www.ghkint.com

Ex Post Evaluation of URBAN Community Initiative 1994-1999 Final Report
i
TABLE OF CONTENTS
TABLE OF CONTENTS................................................................................................................... I EXECUTIVE SUMMARY ............................................................................................................... IV 1 INTRODUCTION....................................................................................................................... 1 1.1 Purposes of the evaluation .................................................................................................... 1 1.2 Structure of the Report........................................................................................................... 1 1.3 Method ................................................................................................................................... 2 1.4 Timing .................................................................................................................................... 5 1.5 Acknowledgements ................................................................................................................ 6 2 WHAT WAS THE URBAN I COMMUNITY INITIATIVE?......................................................... 7 2.1 The issues addressed by the URBAN I Community Initiative................................................ 7 2.2 The origins of the concept...................................................................................................... 7 2.3 URBAN I as a Community Initiative ....................................................................................... 8 2.4 The characteristics of the URBAN CI..................................................................................... 8 2.5 Link with URBAN II............................................................................................................... 10 2.6 The national contexts, and nature of the urban problem ..................................................... 11 2.7 The current and prospective challenges of deprived urban areas in the EU25................... 11 2.8 Summary.............................................................................................................................. 14 3 THE SELECTION OF URBAN PROGRAMMES AND THEIR STRATEGIES....................... 15 3.1 Commission guidelines for selecting cities and areas ......................................................... 15 3.2 Selection processes within the Member States. .................................................................. 15 3.3 Selection of “programming mechanism” .............................................................................. 17 3.4 The population and areas targeted by URBAN ................................................................... 17 3.5 What strategies were implemented?.................................................................................... 18 3.6 Expenditure under URBAN .................................................................................................. 21 3.7 Links foreseen between the URBAN strategies and other Structural Fund interventions in the city (Objectives 1, 2 and 3)...................................................................................................... 22 3.8 Summary.............................................................................................................................. 23 4 THE EFFECTIVENESS OF THE URBAN PROGRAMMES .................................................. 25 4.1 Introduction .......................................................................................................................... 25 4.2 Overall assessment of the effectiveness and achievements of URBAN ............................. 25 4.3 Effectiveness and the objective criteria and characteristics of the URBAN programmes ... 28 4.4 Factors that have supported and hindered the effectiveness of the URBAN programmes. 30 4.5 Networking activities ............................................................................................................ 41 4.6 Summary.............................................................................................................................. 44 5 THE IMPLEMENTATION OF THE URBAN PROGRAMMES ............................................... 46 5.1 Introduction .......................................................................................................................... 46

Ex Post Evaluation of URBAN Community Initiative 1994-1999 Final Report
ii
5.2 The arrangements for planning, management, implementation and evaluation ................. 46 5.3 Key factors in management and implementation................................................................. 51 5.4 Summary.............................................................................................................................. 53 6 THE IMPACT OF URBAN ...................................................................................................... 55 6.1 Introduction .......................................................................................................................... 55 6.2 Physical environment ........................................................................................................... 57 6.3 Socio-economic conditions within the URBAN areas .......................................................... 57 6.4 Social capital impacts........................................................................................................... 58 6.5 Institutional impacts.............................................................................................................. 59 6.6 City strategies ...................................................................................................................... 59 6.7 City Structure and Functionality ........................................................................................... 60 6.8 Neighbouring areas.............................................................................................................. 60 6.9 Regional Development......................................................................................................... 61 6.10 Perception of the URBAN areas ........................................................................................ 61 6.11 Summary............................................................................................................................ 63 7 THE COMMUNITY VALUE ADDED OF URBAN................................................................... 65 7.1 Introduction .......................................................................................................................... 65 7.2 URBAN I and the existing national programmes and policies ............................................. 65 7.3 Additionality and leverage.................................................................................................... 67 7.4 The promotion of transnational cooperation and learning ................................................... 68 7.5 The raising of consciousness of EU economic, cohesion and social inclusion policies ...... 68 7.6 The lessons from URBAN I that informed the current programming period ........................ 68 7.7 The application of the subsidiarity, proportionality and partnership principles .................... 69 7.8 Community value added and transaction costs ................................................................... 70 7.9 Summary.............................................................................................................................. 71 8 CONCLUSIONS AND LESSONS .......................................................................................... 73 8.1 Introduction .......................................................................................................................... 73 8.2 The URBAN Community Initiative: a success story............................................................. 73 8.3 Implications for Mid Term Review of URBAN II 2000-2006................................................. 76 8.4 Implications for the Structural Funds post-2006 .................................................................. 78 ANNEXES ..................................................................................................................................... 83 ANNEX 1 – CHARACTERISTICS OF THE URBAN I AND SELECTED UPP PROGRAMMES .. 83 ANNEX 2 - CRITERIA FOR THE SELECTION OF SAMPLE PROGRAMMES ........................... 88 ANNEX 3 – BUDGET AND EXPENDITURE OF URBAN I ........................................................... 90 ANNEX 4 – URBAN PROGRAMME STRATEGIES ..................................................................... 94 ANNEX 5 –FACTORS AFFECTING SUCCESS........................................................................... 98 ANNEX 6 –IMPACTS OF THE URBAN PROGRAMMES........................................................... 104 ANNEX 7 – RESULTS RELATING TO THE RESEARCH HYPOTHESES ................................ 109 ANNEX 8 – THE RESULTS OF THE PRIORITY EVALUATION EXERCISE............................. 116

Ex Post Evaluation of URBAN Community Initiative 1994-1999 Final Report
iii
ANNEX 9 – MANAGEMENT AND IMPLEMENTATION COSTS................................................ 120

Ex Post Evaluation of URBAN Community Initiative 1994-1999 Final Report
iv
EXECUTIVE SUMMARY
Introduction
The report presents the findings of the ex-post evaluation of URBAN I. The evaluation had three main objectives:
To establish the impact of the URBAN I Community Initiative (CI) as a catalyst for lasting improvements in socio-economic conditions for inhabitants in the programme areas;
To identify the Community value added obtained as a result of Structural Fund (SF) investment; and
To identify the lessons of the evaluation from 1994-1999 that have relevance both for the 2000-2006 programming period and for planning for the SF post 2006 in the context of enlargement.
The evaluation was based on an assessment of 118 URBAN programmes and 5 Urban Pilot Projects. The evaluation investigated the following aspects: the selection of programme areas and the strategies adopted; effectiveness; management and implementation systems; impact; and Community value added.
The methodology involved desk research, structured interviews with stakeholders, case studies, street surveys and the informed judgements of members of the evaluation team.
The team was led by GHK on behalf of the Evaluation Unit of DG Regio of the European Commission (EC), under the guidance of a Steering Group of EC officials and with the advice of three independent experts on urban issues.
The evaluation took place between November 2002 and July 2003. This period coincided with:
The submission of Final Reports for URBAN I to the EC,
The mid term evaluation of URBAN II, and
The preparation of the Third Cohesion Report, which will include recommendations for the period post-2006.
The characteristics of URBAN I
The URBAN I CI was launched in 1994 as a response to the challenges facing Europe’s towns and cities: high unemployment, the risk of social exclusion, and a neglected physical environment.
As a CI, URBAN I had a number of aims shared with other CIs: to adopt and encourage innovative approaches; to promote transnational networking and exchange of experience; and to mainstream new approaches and good practice into national policy and programmes.
There were a total of 118 URBAN programmes. The total allocated European Union (EU) funding was 900 million euros, 83% of which was from the European Regional

Ex Post Evaluation of URBAN Community Initiative 1994-1999 Final Report
v
Development Fund (ERDF), and 17% from the European Social Fund (ESF). The actual level of EU expenditure was 721.4 million euros (July 2003).1
Based on the evaluation expenditure figures, the average level of EU expenditure per programme area was 5.7 million euros, while the total investment averaged 11.8 million euros. The average EU expenditure per resident within the programme areas was 192 euros.
The 118 URBAN programme areas included nearly 3 million inhabitants. The size of programme areas varied widely from an area with a population of 1,500 (Córdoba) to the largest in Vienna with 130,000. The majority of URBAN neighbourhoods (86%) were located within cities with a population of over 100,000.
URBAN I was targeted mainly at peripheral urban areas (38% of programmes) and inner city areas (32%). Historic city centres accounted for 19% of programme areas and 12% were focused on neighbourhoods with “mixed” characteristics.
Thirty eight per cent of expenditure at the EU level went on physical and environmental regeneration; 32% supported activities in entrepreneurship and employment; 23% financed initiatives relating to social inclusion; 4% was spent on technical assistance; and 2% went into activities concerning ICT or transport. There were significant variations in the type of expenditure by member state.
URBAN was implemented in a range of different national policy contexts. Five of the 15 member states had a national urban policy when URBAN was introduced (Denmark, France, Ireland, the Netherlands and the UK). One member state (Germany) had an urban policy at the regional level. The other nine countries did not have a specific national policy relating to urban areas.
The selection of URBAN programme areas
The EC Notice2 to member states set out the following eligibility criteria:
population size (located in cities of more than 100,000 people),
the definition of the target area (geographically identifiable), and
the socio-economic characteristics of the area (high unemployment, decayed urban fabric, poor housing conditions and a lack of social amenities).
Priority was to be given to towns and cities located in Objective 1 regions, and to programmes that formed part of long-term strategies within the urban areas concerned.
In practice there were three types of programme selection process:
An open call (5 member states, as well as the Belgian region of Wallonia);
A restricted call with competition (7 member states); and,
1 The actual level of expenditure in the report is 711.5 million euros. This is based on financial information made available to the evaluation by June 2003. Data were not available for all programmes. 2 Decision 94/C 180/02, 15th June 1994, Notice to member states “Laying down guidelines for operational programmes which Member States are invited to establish in the framework of a Community Initiative concerning urban areas”
Ex Post Evaluation of URBAN Community Initiative 1994-1999 Final Report
vi
A restricted call without competition, following analysis at the national level (3 member states).
In the majority of cases, the decision-making body was located within central government. In two cases (Austria and Finland), the decision was taken in partnership with an association of local authorities.
The respective roles and responsibilities of the national authorities and the EC in the selection process were not clearly defined. This led to some difficulties in negotiations and delays in launching the programmes. However, the process was also a source of learning for URBAN II.
In general, the EC’s criteria led to the selection of the most disadvantaged districts. The average unemployment rate in the programme areas was over 20%, and in some districts as high as 40%. The programme areas also included high concentrations of immigrants and ethnic minority groups, representing up to 70% of the target population of programme areas.
The URBAN programme area strategies
The strategies adopted for the implementation of URBAN in the programme areas were of four types:
A broad integrated approach: a balanced set of economic development, social integration and environmental measures (45% of programme areas);
An integrated approach with a particular focus – economic, social or environmental (26%);
A community-focused strategy, with a particular emphasis on local community involvement in the programme (19%); and
A “flagship” strategy, which used a limited number of visible or flagship projects, as a means of generating interest in the programme (10%).
All strategies were judged to have addressed the stated programme objectives, either fully (95%) or partially (5%). They were all deemed to have addressed the areas’ key characteristics and challenges, either fully (90%) or partially (10%).
A third of programmes were subject to changes to their strategy over the programme’s lifetime. This was due to a range of factors, including: implementation issues, new policy agendas, and other occasional factors such as legal issues or the uncovering of archaeological remains.
A total of 82% of programmes were located within Objective 1 or 2 areas. Of these, 75% foresaw a strategic link between the mainstream SF programmes and URBAN. These links were often facilitated by a common management structure at the city level. This helped ensure coordination and complementarity between EU programmes.
The effectiveness of URBAN I
The criteria for the assessment of the effectiveness of each of the URBAN programmes derived from both the original objectives of the CI established at the European level and member-state specific success criteria. The latter reflected the differing issues faced and various levels of expectation.

Ex Post Evaluation of URBAN Community Initiative 1994-1999 Final Report
vii
Of the programmes examined in detail, 72% were judged to have been very successful or mostly successful. There was a high level of success across the priority regions Objective 1 and Objective 2 and across the four types of urban area. The majorities of each of the three main types of strategy were judged to have been successful. Around a third of URBAN I areas that adopted ‘flagship’ strategies were considered successful.
The most commonly cited factors supporting success were:
The combination of URBAN with existing regeneration programmes.
The synergies between the combination of selected projects within the URBAN programme.
The active participation of the local community in aspects of the management and implementation of the programme.
The most commonly cited factors hindering success were:
The lack of private sector support.
The lack of participation of the local community in aspects of the management and implementation of the programme.
The difficulties in understanding EC documents and procedures by those involved in the programme.
Although initially envisaged as a significant part of the overall programme, international networking did not play a significant role in the URBAN programmes. In the cases where it was embraced, it helped to strengthen relationships, build capacity internally, and facilitated information exchange on management issues.
The implementation of URBAN I
Local and national governments were the main actors in the planning process. The extent to which the local community played a major role differed between the programmes.
There were three types of management structure:
Municipality-led management and implementation with some community level consultation;
Committee arrangements with partnerships between regional and municipal government, institutions and the local community; and
Management led by a body set up as a separate legal entity, either at the local, city or regional level, and including representatives from a variety of levels of governance and sectors.
The nature of these arrangements and the extent of local community participation were linked to the existing administrative structures in the area. The suitability of each type of management structure was dependent upon the existing practices, traditions and experiences in each area.
The management costs are estimated on average to be around 6% of the total budget.

Ex Post Evaluation of URBAN Community Initiative 1994-1999 Final Report
viii
Local communities and associations were involved to varying degrees in the project selection process. At least 28% of URBAN programmes carried out detailed evaluations.
The key factors affecting the success of implementation and management, in descending order of importance, were:
Participation of the local community in aspects of project selection, management and implementation.
Integrated and straightforward approaches to programme management and implementation.
Strong partnerships and cooperation.
Leadership in the day to day management and overall implementation of the programme.
Capacity and experience.
The impacts of URBAN
The URBAN programme had a variety of impacts at different spatial scales, ranging from the local neighbourhood to the city level, and less commonly, at the regional level.
The three most commonly cited impacts of the URBAN Programme were:
Impacts on the physical environment;
Improvements in socio-economic conditions; and
Social capital impacts.
These were all cited as being significant in over 80% of the URBAN programmes.
Other impacts that were also significant to a lesser degree included:
Changes to institutional and governance structures
Influence on city strategies; and
Impacts on city structure and functionality
Over a quarter of programmes also had an impact on neighbouring areas. A small proportion of these impacts (7%) were seen to be negative.
Other minor impacts included influencing regional development, and the negative impact of sparking resistance from local communities to changes in their neighbourhood.
One of the most sustainable impacts from URBAN was the lasting change in the approach to urban regeneration. URBAN encouraged a move away from the usual practice of single sector working, to the integration of various stakeholders across different departments, including the community.
From the street survey, those interviewed perceived significant improvements in many aspects of the quality of life in their neighbourhood. This was particularly true for improvements in the built environment.

Ex Post Evaluation of URBAN Community Initiative 1994-1999 Final Report
ix
Overall, 35% of respondents were aware of the URBAN programme, although this percentage varied considerably between member states.
Of those respondents who were aware of URBAN, the majority attributed neighbourhood change to the programme. Other factors were also cited, including the local authority, the population itself, community organisations, and improvements in the economy.
The Community value added of URBAN I
The URBAN approach was relevant in many different national and urban contexts, both in areas designated as Objective 1 and 2, as well as in the more prosperous EU regions. National resources were already being targeted in over 80% of the URBAN areas, but these were generally being focused sectorally, and not as part of an area based integrated approach advocated by URBAN.
In eleven member states, URBAN I was original and influential, introducing an integrated approach to urban renewal, new policy instruments, and stimulating discussion on how to address disparities within urban areas.
The value added of URBAN was greatest when it was applied as part of a tool kit of urban policy and strategies. URBAN-type approaches are likely to be most successful when part of a wider urban strategy. The policy contexts need to be sympathetic at the national and urban levels.
In most member states, URBAN levered additional resources into the programme areas, and encouraged further indirect investment, both from the public and private sectors, to the benefit of the programme areas.
Although national networking in some member states was successful, the time and resources that went into these activities at a transnational level were small, and consequently they had little impact. For programmes that were involved in these activities, there were benefits in strengthened networks and capacity building.
The URBAN CI helped raise awareness and consciousness of the EU economic, cohesion and social inclusion policies. The influence was greatest at the local and municipal levels where key actors had hitherto less experience of the EU policies and funding instruments.
The lessons from URBAN I were incorporated into the guidelines for URBAN II. There is also evidence that the URBAN concept of area based integrated interventions has been applied more generally within the framework of SF programmes and within national programmes.
Many of the key decisions relating to URBAN (preparing the programme strategy and the selection of projects) were made at the municipality level, and in some cases with the involvement of the local community. This positive application of the subsidiarity principle was a key aspect of URBAN’s value added.
URBAN I was relatively small in financial terms, compared with the potential need. However, the CI was successful in terms of the improved capacity, learning and demonstration that have occurred.

Ex Post Evaluation of URBAN Community Initiative 1994-1999 Final Report
x
The application of the partnership principle allowed stakeholders from different spheres and levels of government to be involved in decision-making. This process built capacity at the municipal level, as well as within local communities, bringing empowerment to those not usually involved in managing and implementing programmes.
It is estimated that on average around 6% of the programme costs were spent on aspects of management and technical assistance. These costs are commensurate with the programme characteristics mentioned above. It is not possible to estimate what proportion of these costs were transaction costs. However, the latter are certainly offset by the Community value added that was generated by the CI.
Overall strengths and weaknesses of URBAN I
The URBAN programme was a success in a number of respects. The programme contributed to improving the quality of life in the target areas and beyond, and built capacity both at the level of the municipality and within the local communities.
URBAN I had the following strengths:
It was a simple concept, that built a link between cities and the EU.
It took an integrated approach to urban regeneration, involving a variety of actors in decision making
It contributed to building capacity at the municipality level.
It had a high visibility in the urban realm.
It targeted disadvantaged social groups.
It built social capital at the local level.
URBAN I also had a number of weaknesses:
Although the CI aimed to promote transnational exchange, this aspect of the programme was weak.
It was an administratively complex programme. This led to significant delays and consequently an underspend of the resources available.
There was a lack of systematic monitoring and evaluation structures.
It was limited in its scope to those interventions eligible under the SF regulations. In the main it excluded some important elements relating to urban deprivation such as housing, crime prevention and transport.
Implications for the mid-term review of URBAN II:
The report emphasises the following implications for the mid term review of URBAN II:
Programmes should involve civil society as fully as possible in the management and implementation of the programme.
Programmes should endeavour to build a wide local partnership to deliver the programme.
Transnational networking should be promoted, as well as national networking activities between URBAN cities.

Ex Post Evaluation of URBAN Community Initiative 1994-1999 Final Report
xi
Effective monitoring and evaluation systems should be put in place.
Timescales should be flexible, to allow for slippage, in order for the programmes to meet their objectives.
Lessons for the post 2006 period
An effective use of future SF resources might involve the specific earmarking of resources for urban interventions. The context for such interventions is changing: The EU will be enlarged substantially, and cities might be facing new challenges in order to maintain or improve their competitive position. This will require new answers. Such concepts could be focussed on ‘realising city visions’, achieving urban renaissance, incorporating notions of the ‘creative’ city, the ‘safer’ cities, the ‘engaged’ city, and promoting sustainable urban development and cooperation between urban areas within regions. Preferably these interventions should be managed by municipal level authorities. The value added of the URBAN area based intervention was often greatest when it was applied as part of a wider urban policy and strategy.
The experience of URBAN I provides some hints for such future actions. At the same time the SF should contribute to the continuation of learning through networking and the exchange of experience. The development of the capacities of urban professionals and other key actors could build on the experience of URBAN I.
The findings from this evaluation point to a number of recommendations and action points for the period post 2006:
Where appropriate SF resources should be earmarked for urban interventions within regions to be managed by local authorities. Some of these resources could be used for URBAN type interventions but the scope should be wider.
The programming of area based interventions should be flexible. In particular there may need to be a period during which capacity is build up and consensus achieved over priorities.
Area based interventions can usefully be implemented in the context of coherent strategies at the sub-city, city and regional levels.
Specific interventions to build capacity at the municipal and local community levels should be supported in order to ensure that there is sufficient knowledge to manage and deliver such programmes. This applies particularly to the Accession Countries, but is also pertinent to cities in the EU15.
Further support should be given to promoting learning from experience, the development of capacity and the transnational exchange of good practice.

Ex Post Evaluation of URBAN Community Initiative 1994-1999 Final Report
1
1 INTRODUCTION
1.1 Purposes of the evaluation
This report presents the findings of the ex-post evaluation of the URBAN Community Initiative (CI) implemented during the period 1994-1999. The URBAN CI comprised financial support from the EU to 118 URBAN programme areas located in urban areas throughout the European Union (EU). The total EU funding was 721.4 million euros (July 2003)3. The deadline for financial commitments was December 31st 1999, and the date for final payments was December 31st 2001. A second URBAN CI was launched in 2000. In the light of this, the object of this evaluation has become known as URBAN I. In addition to URBAN I the evaluation has examined 5 Urban Pilot Projects (UPPs) that were funded as innovative measures during the 1994-1999 planning period.
The report was prepared on behalf of the Evaluation Unit of the Directorate General for Regional Policy of the European Commission (EC) by GHK. GHK led a team of evaluators with knowledge of the urban regeneration process in all member states. The work has been guided by a Steering Committee comprising officials from several Directorates General of the EC. The team benefited from the advice of a panel of three experts.
As set out in the Terms of Reference, this ex-post evaluation had three main objectives:
1. To establish the impact of the URBAN I CI as a catalyst for lasting improvements in socio-economic conditions for inhabitants in the programme areas;
2. To identify the Community added value obtained as a result of Structural Fund (SF) investment; and
3. To identify the lessons of the evaluation from the 1994-1999 period that have relevance both for the 2000-2006 programming period and for planning for the SF post 2006 in the context of enlargement.
1.2 Structure of the Report
The report is structured as follows:
Section 2 presents an overview of the characteristics of the URBAN I CI, its policy context and the challenges it addresses.
Section 3 assesses the processes used for the selection of URBAN I programme areas and the strategies adopted for them.
3 The actual level of expenditure in the report is 711.5 million euros. This is based on financial information made available to the evaluation by June 2003. Data were not available for all programmes. For further details on financial data, refer to Annex 3.

Ex Post Evaluation of URBAN Community Initiative 1994-1999 Final Report
2
Section 4 begins with a definition of success in each national context, and then elaborates those factors that led to, or constrained, success in the URBAN I programmes.
Section 5 describes how the URBAN I area programmes were implemented, and assesses the aspects of the arrangements that worked well, and those that were less successful.
Section 6 provides an assessment of the impact of the URBAN I CI on the programme areas, neighbouring areas, institutions, wider strategies and regional development.
Section 7 identifies the Community value added of URBAN in terms of its originality, relevance, leverage of resources and transnational cooperation and learning. An assessment is made of this added value in comparison with the ‘transaction costs’.
Section 8 presents a summary of the key strengths and weaknesses of URBAN I CI, provides lessons for URBAN II and identifies the implications for the post-2006 programming period.
1.3 Method
To address the evaluation questions identified in the Terms of Reference, a combination of different methods was used including: literature reviews; desk research; structured interviews with stakeholders; case studies; street surveys; and the informed judgements of members of the evaluation team. This combination of approaches was necessary to address both the issues at the programme area level and in order to draw conclusions at the level of the CI as a whole. Whilst careful account has been taken of the different national contexts, the evaluation has focussed on the lessons that can be concluded at the EU level. The methodology was elaborated in an Inception Report.
1.3.1 Programme samples
Following the Terms of Reference that identified a series of specific tasks, the detailed examination of particular issues focussed on samples of the 118 programme areas. The samples “cascaded” so that programmes in the smaller samples were included in the larger samples.
For all 118 URBAN programmes, relevant documents were collected and analysed, which included original programming documents, monitoring reports, interim and final evaluation reports where these existed, and other documents relating to the programmes’ activities.
For a sample of these programmes (56), interviews were also carried out with the programme manager, and where appropriate, local stakeholders and members of the local partnership. These interviews related to the effectiveness of the programmes.
A smaller sample (35) was selected from the 56, for further analysis of the management and implementation arrangements of the programmes, also through stakeholder interviews.
In addition, a series of small-scale street surveys was undertaken in the sample of 35 programme areas, to assess the impact of the programme in terms of residents’ and non-residents’ perceptions of changes in the programme area. The methodology of this survey is further elaborated below.

Ex Post Evaluation of URBAN Community Initiative 1994-1999 Final Report
3
A further sample (20) was selected from the 35, to examine the programme selection process.
The term “programme” is used in this report to describe the individual URBAN programmes. In some member states, the programmes were approved individually by the EC on an area-by-area basis, while in other countries, they were approved as a package at the member state level. This report uses the word “programme” to describe those city-level interventions approved through both mechanisms. URBAN as a whole is referred to as the URBAN I Community Initiative (CI).
The Terms of Reference also required the evaluation to include five Urban Pilot Projects (UPPs). The following were selected by the European Commission:
Alexandroupolis (Greece)
Bilbao (Spain)
Falun (Sweden)
Helsinki (Finland)
Leipzig (Germany)
The numbers of URBAN programmes and UPPs examined for each evaluation task is summarised below. Care was taken that the samples in each case were representative of the overall population of programme areas. In order to generate economies, the smaller samples were selected from the larger samples. The choice of programme areas for each sample was based on a number of selection criteria, which are set out in Annex 2, along with a list of programmes selected. The samples of programmes for each task were approved by the EC.
Table 1.1: Sample of programmes for each evaluation task Task Number of programmes/UPPs examined
The selection of programme areas 20 URBAN programmes The strategies adopted and implemented
118 URBAN programmes and 5 UPPs
Effectiveness 56 URBAN programmes and 2 UPPs Management and implementation systems
35 URBAN programmes and 2 UPPs
Impact 118 URBAN programmes and 5 UPPs Community value added 118 URBAN programmes and 5 UPPs Conclusions and lessons 118 URBAN programmes and 5 UPPs
1.3.2 Methodological issues
The evaluation has followed closely the Terms of Reference. However, a number of important methodological issues have arisen during the work, which are worth stressing here:
A key methodological issue in the assessment of effectiveness was defining “success” in each national context. The national evaluators were required to

Ex Post Evaluation of URBAN Community Initiative 1994-1999 Final Report
4
specify what constituted success in their country, and to assess the success of each programme against these nationally defined criteria.
Although the evaluation was not a “good practice” study, the method allowed for examples of good practice to be highlighted in the different programme case study reports. These have been integrated throughout this report, to illustrate points in each section.
A series of hypotheses to be tested during the evaluation was drawn up, informed by literature reviews, and an initial assessment of the programmes. Towards the end of the evaluation, the national evaluators were asked to complete the hypothesis table in relation to their country, showing whether there was evidence to support or contradict each hypothesis. The results are given in Annex 7.
The national evaluators were also asked to complete a “Priority Evaluation” exercise, in which they were asked to distribute a hypothetical ‘pot’ of funding between different options, depending on national priorities. The results are given in Annex 8.
In some cases, independent mid term and/or final evaluations of the programmes had taken place. This evaluation made use of existing evaluation work where it existed, exploiting the investment that had already been made in such studies. In general, the information available was of good quality. However, for other programmes, information on the achievements of the programmes was more difficult to access. In particular, financial data for some programmes was still to be signed off at the time of this evaluation, before being submitted to the EC in closure reports. In these cases, data were only provided for the purposes of this evaluation as “provisional”, and therefore the information cannot be considered as final.
On the advice of the Panel of Experts, the national evaluators attempted to collect data and information on issues such as land prices, rentals and inward investment / indirect private sector leverage, in order to illustrate important local economic trends. However, there was a severe paucity of readily available data at the neighbourhood level on such indicators. Reliable data would have required longitudinal studies launched at the start of the programme, to track changes over time in the local area. In the absence of such data, some anecdotal references were collected, which attest to changes in the local economic circumstances in some areas. These are reported here.
1.3.3 Perceptions survey
The aim of the perceptions survey was to assess whether people within the URBAN programme areas (both residents and non-residents) perceived that the areas had changed over the previous 10 years. The survey also investigated respondents’ awareness of the URBAN CI, and whether the perceived changes could be attributed to URBAN or other factors.
A short questionnaire was designed to respond to the above objectives, using simple and straightforward language to avoid misunderstanding on the part of the interviewee. The surveys took place in public places, where the flow of people was high.

Ex Post Evaluation of URBAN Community Initiative 1994-1999 Final Report
5
A total of 1086 people were interviewed, of which approximately 54% were residents of the URBAN target areas. Respondents ranged in age from 20 to over 50. A balanced sample in terms of age, gender and place of residence was achieved.
As with any street survey, there were a number of limitations to the methodology:
Sample size. Approximately 40 people per programme were interviewed in a total of 35 URBAN programme areas. The small sample size in each programme area did not allow for valid comparisons between programme areas.
Interviewee understanding. As with all perception surveys, the accuracy of the results obtained depended upon the interviewee’s correct understanding of the question posed, as well as the truthfulness of the response given. The questionnaire was designed bearing this in mind, using simple and straightforward language.
Randomness limitation. The survey aimed to question a balanced sample of respondents (in terms of equal numbers of men and women, residents and non-residents and age groups). However, this may not necessarily have reflected the local population. For instance some areas may have a higher elderly population, and targeting people by age, sex and gender, may have distorted the results slightly.
Interviewer unintentional bias. A practical approach to gathering data was taken by interviewers, who placed themselves strategically in the target areas visited (i.e. in front of bus stops and busy shops). This may have had an impact on the results, as the type and flow of people who pass by can vary according to time and place. In addition, the people willing to be interviewed on the streets are not necessarily representative. They may have stopped because they had time.
Despite these caveats, the survey was a useful exercise to investigate the perceptions of people on the ground. The results were not considered in isolation; rather they provided useful insights into the impact of the programmes on the local communities, and complemented the other methodological approaches adopted in the evaluation. The results could provide a basis for further, more in-depth investigation into the perception of quality of life in urban areas.
1.4 Timing
This ex-post evaluation took place between November 2002 and July 2003. The timing is important in four respects:
1. The deadline for expenditure was December 2001, and the final reports on each of the URBAN I programme areas had to be submitted to the European Commission by 31 March 2003. Therefore, the programmes have now been completed for sometime and the sustained impacts of the programmes should be evident.
2. Most member states have not themselves carried out an ex-post evaluation of the URBAN I CI in their countries (only three have – France, Italy and Sweden). In Ireland, a Final Evaluation Report was prepared for the Operational Programme. This evaluation represents an opportunity to at least

Ex Post Evaluation of URBAN Community Initiative 1994-1999 Final Report
6
in part fill these gaps, in addition to making an assessment of the achievements and impact of URBAN I across the EU.
3. The findings of this evaluation will inform the mid-term review of the URBAN II programmes and should therefore contribute to improving the performance of these on-going programmes.
4. Policy recommendations are currently being considered for the deployment of SF for the post 2006 period. The findings from this evaluation will inform the Third Cohesion Report (due for publication December 2003), and will contribute to the body of evaluation and research evidence that will support decisions to be taken regarding the future of the SF post 2006.
1.5 Acknowledgements
This evaluation has involved a large number of consultations with those who were involved in the implementation of URBAN I, access to extensive documentation and extensive fieldwork during a short period of time. The evaluation team would like to take the opportunity to thank all those who gave their time, opinions and information. Particular thanks are due to:
Members of the Steering Committee (DG REGIO, DG EMPL, DG ENV, DG BUDG, DG ECFIN and DG AGRI);
The Panel of Experts (Ms Mireia Belil, Professor Roberto Camagni and Professor Michael Parkinson);
The team of national evaluators who undertook the field work: Athens Economics (Greece), Eau2Estudios (Spain), ECORYS (the Netherlands), GHK (Belgium, Ireland and the UK), IRS (Italy), Kaupunkitutkimus (Finland), Quaternaire (Portugal), Statistics and Research Aland (Sweden and Denmark), Urbanis (France and Luxembourg) and URBANO (Germany and Austria).

Ex Post Evaluation of URBAN Community Initiative 1994-1999 Final Report
7
2 WHAT WAS THE URBAN I COMMUNITY INITIATIVE?
2.1 The issues addressed by the URBAN I Community Initiative
The URBAN I CI was launched in 1994 (Decision 94/C 180/024) in response to the recognition that Europe’s towns and cities were facing a number of key challenges:
Pockets of high unemployment and socio-economic deprivation existed in many towns and cities.
Certain social groups in towns and cities were at risk of exclusion, particularly members of ethnic minority communities and migrants.
Certain neighbourhoods in towns and cities, including areas that had previously been neglected by public or private investment, were in need of physical and environmental regeneration to improve their attractiveness.
Although these challenges were not experienced by all urban neighbourhoods, it was evident that in most towns and cities, there were certain areas in which they were concentrated. The URBAN I CI aimed to address these issues, to improve the living conditions of citizens in these areas, and to promote aspects of ‘sustainable urban development’.
2.2 The origins of the concept
The URBAN I CI has its origins both in the policy responses to the urban crises that affected several member states in the post war period and in the organisational logic of the Structural Funds.
Whilst to some extent trends in the popularity and conditions of neighbourhoods are a ‘natural’ consequence of market forces and there has long existed a rationale for public sector interventions to address the externalities of specific urban areas in decline, the period preceding the advent of URBAN CI was particular. During the nineteen eighties many EU urban areas experienced population and economic decline and/or shifts of population from central to more suburban areas. At the same time many of the neighbourhoods that had been created, often with an emphasis on social housing, to accommodate decreases in density and continuing urbanisation were themselves experiencing problems. As a consequence of these trends neighbourhoods in crisis (“quartiers en crises”) were emerging characterised by a combination of social, economic and environmental stress.
In response to these problems a number of member states introduced area based initiatives. In the main these initiatives had a sectoral focus, emphasising interventions in a particular domain such as physical environment, housing, education or the built fabric. In the nineteen eighties however, area based initiatives tended to integrate interventions of different types and, in the light of marked rises in local unemployment gave greater emphasis to economic and employment related actions. The UK and
4 Decision 94/C 180/02, 15th June 1994, Notice to member states “Laying down guidelines for operational programmes which Member States are invited to establish in the framework of a Community Initiative concerning urban areas”

Ex Post Evaluation of URBAN Community Initiative 1994-1999 Final Report
8
Netherlands in particular have long standing traditions of such area based initiatives. The majority of EU countries were not addressing urban deprivation in this way.
The architecture of the SF allocated a small proportion of resources to innovative actions, a minority to CI and the majority to Community Support Frameworks (CSF) and Operational Programmes (OP) for interventions in priority regions. The logic of this arrangement was that innovative actions would pilot new approaches, whilst the CI would provide resources for testing approaches to problems shared by different member states. In the case of the URBAN I CI a clear link existed between the innovative actions and the CI. During the 1989-1993 period the EC supported 33 UPPs, with a total EU funding of 101 million euro. Several of these UPP were implemented outside of the defined priority regions and involved area based integrated approaches to the problems of urban deprivation. A number of the UPPs deployed both European Regional Development Fund (ERDF) and European Social Fund (ESF) resources in concert. This experience confirmed the need for and potential of interventions of this type and contributed to the design of the URBAN I CI. An additional 26 UPPs were implemented in parallel with the URBAN I CI. These projects included financial support for the exchange of experience between UPP and a centrally managed EU level Technical Assistance Office to facilitate cooperation and contacts amongst UPPs.
2.3 URBAN I as a Community Initiative
The URBAN I CI was one of 14 CI that were implemented during the 1994-1999 period. In total the 14 CI accounted for 9% of the Structural Funds. Although each addressed different areas of concern (for example, the EMPLOYMENT CI tackled disadvantage in the labour market, and the LEADER II CI stimulated rural development), the CIs had a number of common features:
They adopted and encouraged innovative approaches to the issues addressed;
They promoted transnational learning and exchange of experience through networking; and
They aimed to mainstream new approaches and good practice into national policy and programmes (both EU funded and national and regional programmes).
2.4 The characteristics of the URBAN CI
In addition to the general characteristics that URBAN I shared with the other CI, URBAN I was also distinct in the approach it adopted to urban regeneration. In particular, URBAN aimed to promote:
A spatial concentration of resources, taking an area-based approach to delimit a neighbourhood and concentrate efforts on upgrading a particular area; and
The involvement of local communities, as far as possible, in the design, management and implementation of their programmes.
A total of 118 URBAN I programmes were supported. The total allocated EU funding was 900 million euros. Almost all programmes (113) involved both ERDF and ESF funding. The majority of the total EU support (83%) came from the ERDF, with the remaining 17% from the ESF. In practice, the total EU funding paid out to the Member

Ex Post Evaluation of URBAN Community Initiative 1994-1999 Final Report
9
States as of July 2003 was 721.4 million euros5. The total population living in the defined programme areas was nearly 3 million. The individual programme areas varied widely in scale from 130,000 in Vienna (Austria) to 1,500 in Córdoba (Spain). The average level of EU expenditure per programme area was 5.7 million euros, but the total investment averaged 11.8 million euros per programme. Expressed in per capita terms the average EU expenditure per resident was 192 euros and the average total investment was 400 euros per resident.
All member states implemented URBAN I programmes. Table 2.1 indicates the characteristics of the URBAN I programme areas in terms of the type of neighbourhood, the size of the town or city and the priority of the region in which they are located. Annex 1 provides a classification of each of the URBAN programmes. The characteristics are further elaborated in Section 3.
Table 2.1: URBAN I programme area characteristics Type of neighbourhood Number % Peripheral urban area: Those districts on the edge of urban areas, typically including social housing estates that date from the 1960s and 1970s.
45
38%
Inner city: The core of the city, typically characterised by abandoned industrial buildings, dilapidated housing and a neglected environment.
38
32%
Historic city centre: A city centre characterised by historic architecture and the potential to develop cultural heritage.
23
19%
Mixed: Areas that combine a variety of the above characteristics. 14 12%
Total 6 120 100%
Type of city Number %
Large city (>250,000 inhabitants) 52 43% Medium city (100,000-250,000) 51 43% Small city (<100,000) 17 14%
Total 120 100%
Overlap with Objective 1 or 2 Number %
Objective 1 68 57%
Objective 2 31 26% Other 21 17%
Total 120 100%
5 The actual level of expenditure in the report is 711.5 million euros. This is based on financial information made available to the evaluation by June 2003. Data were not available for all programmes. For further details on financial data, refer to Annex 3. 6 Although there were originally 118 URBAN programmes, the total number is 120 due to the split of the Dublin and Brussels programmes into two distinct programmes.

Ex Post Evaluation of URBAN Community Initiative 1994-1999 Final Report
10
Table 2.2 Indicates the allocation of expenditure under URBAN I in different domains. These domains were defined by the EC in relation to expenditure under URBAN II. A definition of the different categories can be found in Annex 4. Details of the finances are elaborated in Annex 3. It should be noted that the interventions do not include housing which is sometimes an important component of integrated area based approaches.
Table 2.2: Distribution of actual expenditure of the URBAN I programme by member state, using the domains of URBAN II7
2.5 Link with URBAN II
During the latter part of the 1994-1999 period, it was envisaged by the EC that the lessons of URBAN I CI would be incorporated into the CSF and OP of the SF. However, in the light of feedback from the cities and programme managers involved in URBAN I, and the views of members of the European Parliament, a further URBAN CI was established for the programming period 2000-2006 8. URBAN II concentrates its support on innovative strategies to regenerate cities and declining urban areas, and is financing programmes in 70 towns and cities across the EU. The total EU funding for the 2000-2006 period is 730 million euros. In comparison with URBAN I the current URBAN II CI gives greater emphasis to interventions concerning transport and provides for more structured transnational interaction between programme areas.
7 For details on financial data and definition of URBAN II categories, refer to Annex 3. 8 European Commission Communication COM (2000) 1100 of 28 April 2000 “Laying down guidelines for a Community Initiative concerning economic and social regeneration of cities and neighbourhoods in crisis in order to promote sustainable urban development”.
0%
10%
20%
30%
40%
50%
60%
70%
80%
90%
100%
BE DK DE GR ES FR IE IT LU NL AT PT FI SE UK EU15
Others
Technicalassistance
ICT
Transport
Social inclusion
Entrepreneurshipand employment
Physical andenvironmentalregeneration

Ex Post Evaluation of URBAN Community Initiative 1994-1999 Final Report
11
2.6 The national contexts, and nature of the urban problem
2.6.1 Nature of the urban problem in 1994
At the time of the introduction of URBAN I, the member states were facing a number of common challenges in certain neighbourhoods of their towns and cities. High unemployment rates were a major problem in most of the member states. This was coupled with the degradation of the built environment. The influx of immigrants, either from rural areas or in most cases from other countries, as well as ethnic segregation, were also major issues which were relevant to most member states. Social deprivation and lack of social cohesion were also major problems faced by deprived urban areas. Other particular issues included lack of affordable housing (Portugal) or an adequate housing supply (Greece), abandonment of inner cities (Spain, Belgium), and increased crime or perception of crime (the Netherlands). Equal opportunities was also cited in the UK as one of the key urban policy issues.
2.6.2 National context
Five of the 15 member states had a national area-based urban policy when the URBAN programme was introduced (Denmark, France, Ireland, the Netherlands and the United Kingdom). One member state (Germany) had an urban policy at the regional level. The other 9 countries did not have a specific national policy relating to urban areas (other than physical planning policies). Of these, some addressed urban issues using a sectoral approach (e.g. in Sweden), whereas others took a more integrated approach, focusing on both the physical and socio-economic aspects of urban regeneration (e.g. the Brussels Capital Region of Belgium). These were locally-initiated programmes. However, many of these policies targeted exclusively physical improvements and very few included economic development as part of the solution to urban problems.
The type of urban area affected by these problems varied from old historic centres to inner city and peripheral housing estates. Urban problems were occurring in smaller areas within prosperous cities as well as in generally depressed towns and cities. In several countries, all types of deprived urban areas existed and there does not appear to be a clear relationship between the problems experienced and the type of urban area.
2.7 The current and prospective challenges of deprived urban areas in the EU25
2.7.1 EU 15
The urban areas of the EU15 continue to face major challenges of the type addressed by the URBAN I CI. There are however, some positive trends affecting the contexts in which the programme areas, and the many other neighbourhoods with similar problems, are set. These include the following:
The populations of EU urban areas have tended to stabilise. In Northern Europe, following longstanding population decline, many cities’ populations are now stable or experiencing modest population growth. Whilst the shifts of population from central to suburban areas may not have been arrested there is evidence of reurbanisation and population growth in some inner and central areas of cities. In Southern Europe, the pattern has been slightly different, with the population of many urban areas experiencing growth until recently. However, this growth is now slowing down.
Ex Post Evaluation of URBAN Community Initiative 1994-1999 Final Report
12
Following a period in which some city centres experienced an erosion of their relative attributes such as accessibility compared with locations on the edges of urban areas (attributes that were hitherto reflected in premium rents and property prices) many city and town centres have experienced revitalisation. This has been driven by the needs of enterprises to benefit from proximity to professional services, a rediscovery of the urban milieu and the willingness of smaller, often young, households to live in or close to these areas. This trend has in particular provided a positive context for URBAN I programme areas located near to central areas.
There has been a growth in employment, and unemployment levels in urban areas have tended to be lower than those in the regional hinterlands. In effect, many cities have reasserted themselves as engines of regional growth. This process has been slower in Southern Europe than in Northern Europe, with urban areas in the southern member states only more recently providing the role of engines of growth.
As evidenced by the Urban Audit aspects of prosperity and quality of life have improved.9
Some countries have long standing social policies that whilst not necessarily targeting specific urban areas have apparently contributed to tempering the growth in disparities between social groups that are reflected in disparities between urban areas.
Whilst these positive contextual changes are likely to increase the probability of area based approaches such as those pursued under URBAN I succeeding, the needs that led to the design of URBAN I and the introduction of the CI remain and have in some respects intensified. Although the measurement of disparities within urban areas is problematic it is evident that there remain marked intra regional and intra city disparities between localities. There is evidence to suggest that these disparities exist in the more prosperous cities, that they are widening and that the constraints to their reduction are increasing.
In addition to the concentration of problems of high unemployment, low incomes and poor environmental conditions, there are also two compounding factors. A high proportion of the populations of some neighbourhoods within urban areas are excluded socially from participating fully in existing democratic structures. In addition, there are some neighbourhoods where social capital is in deficit, manifest by weak community networks and high crime rates. Decision makers are increasingly aware of the importance of networks and social capital for sustainable urban development, to promote empowerment within local neighbourhoods, and encourage sustainable communities.
2.7.2 Accession countries
The European Council in Copenhagen in December 2002 confirmed that 10 new member states would join the European Union on 1 May 2004. Enlargement presents many challenges to the EU’s cohesion policy because of the disparities in socio
9 The Urban Audit published in 2000 compared aspects of the quality of life across 58 European Cities. An Urban Audit II is underway that will generate comparative data on 189 EU cities and will hence, for the first time enable a systematic assessment of conditions affecting quality of life.

Ex Post Evaluation of URBAN Community Initiative 1994-1999 Final Report
13
economic conditions of the regions of the 25 member states. At the level of towns and cities, there are also new challenges that the enlarged Union will have to face.
Towns and cities in the accession countries are faced with challenges that are specific to their recent history and socio-economic development. The policies pursued in the pre-transition era have left their mark on the economic and social fabric of the countries, and the introduction of a market economy has brought with it new challenges. These include:
Industrial decline and restructuring: Many industries supported under the socialist regimes are no longer economically viable, and the accession countries are faced with a massive restructuring of their secondary sector, in order to modernise old industries, and introduce new activities. Traditionally, many industries were located in or near urban areas. Following the demise of many industrial sectors, urban areas have been left with a legacy of old, derelict and abandoned buildings, and brownfield sites that are in some cases contaminated.
A mismatch of housing demand and supply: High rise housing estates were built on the edges of many cities, often close to industry. Many are now in severe need of upgrading and renewal. There has also been a significant increase in demand for new housing units, prompting the uncontrolled spread of low-density development. There is also a risk of increased depopulation in some cities due to out-migration, as occurred in some East German cities following unification.
Environment: There are particular outstanding urban environmental issues in the accession countries. They include the cleaning up of brownfield sites for new uses and revitalising cities as centres of community life and historic character.
Transport: The issue of urban transport is also a pressing issue for some accession countries, where there has been a recent rapid increase in car ownership and use. Although well supported under the socialist era, public transport systems have suffered from a lack of investment since transition. Investment is needed in transport networks and the provision of adequate public transport services.
Area-based initiatives addressing urban deprivation are uncommon in the accession countries. The experience of URBAN I in the former GDR may however, be of relevance to the accession countries. It is elaborated in later sections of the report but the following comments are made here:
The former GDR includes examples of URBAN I ‘success stories’.
The political and institutional structures at the municipal level were under high pressure and without any consistent regeneration policies. In addition, there was of course no relevant experience of the SF nor existing links between the EC and this level of government. In these circumstances the detailed guidance on URBAN was welcomed and provided a blueprint that could be followed and which contributed to the legitimacy of this level of government.
A number of the URBAN programmes generated outputs in advance of demand. This was mainly due to the poor contextual economic circumstances and the general development pressure experienced by some areas after unification.

Ex Post Evaluation of URBAN Community Initiative 1994-1999 Final Report
14
Of course comparisons between the accession countries and the former GDR must be made with caution not least because of the massive declines in industrial employment that took place and because of the high level of public sector investment that has been made in the context of relatively low levels of economic growth.
2.8 Summary The URBAN I CI was launched in 1994 as a response to the challenges facing
Europe’s towns and cities: high unemployment, the risk of social exclusion, and a neglected physical environment.
As a CI, URBAN had a number of aims shared with other CIs: to adopt and encourage innovative approaches; to promote transnational networking and exchange of experience through networking; and to mainstream new approaches and good practice into national policy and programmes.
There were a total of 118 URBAN programmes. The total allocated EU funding was 900 million euros, 83% of which was from the ERDF, and 17% from the ESF. The actual level of EU expenditure was 721.4 millions euros (July 2003)10.
The average level of EU expenditure per programme area was 5.7 million euros, while the total investment averaged 11.8 million euros per programme. The average EU expenditure per resident was 192 euros and the average total investment was 400 euros per resident.
URBAN was implemented in a range of different national policy contexts. Five of the 15 member states had a national urban policy when URBAN was introduced (Denmark, France, Ireland, the Netherlands and the UK). One member state (Germany) had an urban policy at the regional level. The other nine countries did not have a specific national policy relating to urban areas (other than physical planning policies).
Europe’s towns and cities are currently facing a range of new circumstances, including population stabilisation and in some cases, modest population increases. Some cities are now establishing themselves as engines of regional growth. However, the persistence of unemployment and social exclusion, as well as pockets of deprivation, point to an increase in social segregation and polarisation, and are witness to the need for policies to continue to address these issues in the future.
The accession of 10 new member states to the European Union in May 2004 will also bring new challenges to urban policy issues at the European level. The particular issues facing these cities include: industrial decline and restructuring, a mismatch of housing demand and supply, a degraded urban environment particularly related to brownfield sites, an increase in car ownership and use, and the decline of previously well-funded public transport systems.
10 The actual level of expenditure in the report is 711.5 million euros. This is based on financial information made available to the evaluation by June 2003.

Ex Post Evaluation of URBAN Community Initiative 1994-1999 Final Report
15
3 THE SELECTION OF URBAN PROGRAMMES AND THEIR STRATEGIES
3.1 Commission guidelines for selecting cities and areas
According to the Notice to the Member States on URBAN (Ref: 94/C 180/02), areas selected for funding under the URBAN I CI were required to match the following eligibility criteria:
City population size: Target areas should be located within cities and urban agglomerations with a population of more than 100,000. In exceptional cases, urban areas in smaller cities were also taken into consideration.
Geographically identifiable: Target areas were required to be geographically identifiable, for example, an existing administrative unit such as a commune, or a smaller entity within a densely populated area.
Socio economic characteristics: Target areas were required to have the following characteristics:
- High level of unemployment
- Decayed urban fabric
- Bad housing conditions
- Lack of social amenities
Objective status: Priority was given to target areas in cities located in Objective 1 regions.
Wider urban strategies: Priority was given to programmes that formed part of long-term urban strategies within the cities concerned.
3.2 Selection processes within the Member States.
The selection process for the URBAN programme areas varied between member states. As there was no precedence for approving this type of initiative, there were no systematic procedures in place for agreeing programmes between the member states and the EC. As a result, the different roles of the member state and the EC were not clear, which brought difficulties in negotiation and delays in programme start-up. However, this was also a source of learning. In URBAN II, the procedures were more clearly defined from the beginning, and the process was smoother.
The variety of selection processes for URBAN I divide into three broad categories:
1. Open Call. In these cases, the national authority (or regional authority in the case of the Wallonia Region in Belgium), launched an open call for cities to put forward their proposals. The call was only restricted by the EC guidelines on a minimum population size of 100,000 for the bidding city. In all other respects, the call was open. Following submission of the bids, the national authorities then used a variety of means to judge which were most suitable for funding. The most common method was an indicator-based system, using the Commission guidelines to identify which target areas were the most ‘in need’.

Ex Post Evaluation of URBAN Community Initiative 1994-1999 Final Report
16
However, in some countries, other factors also played a role in the decision-making. The process of lobbying was important in some member states, with city leaders playing a role in promoting their city’s bid. In some cases, the final decision was influenced by a desire to choose cities reflecting a political balance.
The countries that fall under this “Open Call” category were: Austria, Belgium (in the region of Wallonia), Finland, Greece, Portugal and Spain.
2. Restricted Call with competition. This selection process was similar to the Open Call, but cities invited to submit bids were pre-selected by the national authorities, or in the case of Germany, the regional authorities. For example, in France, the national authority drew up a list of 15 potential cities, based on the Commission’s criteria, as well as on their own national priorities for urban interventions. These 15 cities were invited to submit proposals. Again these were generally evaluated according to how well they responded to the Commission’s guidelines, and the quality of the proposal.
However, there were also elements of negotiation, and lobbying of the decision-making body under this process. In France and Germany, there was active “marketing” of the proposals once they had been submitted, to support the bids and ensure that they were selected.
In the UK, the final selection also involved a qualitative assessment, based on factors such as recent social unrest, or whether the city was already accessing national funding for similar schemes. The countries that operated a restricted call were: Germany, Denmark, Belgium (the regions of Flanders and the Brussels Capital Region), France, Ireland, Italy and the UK.
3. Restricted Call without competition, following analysis at the member state level. The other member states did not operate a call for submissions that involved competition, but invited cities to submit their proposal, in the knowledge that there would be no ‘losers’. The countries where this is relevant tended to be the smaller member states, where there were few cities over the minimum population threshold: Luxembourg, the Netherlands and Sweden.
In the majority of cases, the decision-making body was located within central government. The responsible department varied according to the different national contexts, but in general, this involved the Ministry which was concerned with regional policy, environmental issues or planning. In Germany the initial decision on the distribution of programmes across the regions lay with the Ministry for Economic Affairs, but then it was the responsibility of the individual Regional Governments to launch the Call for Proposals and make the final decision. This regional focus was also adopted in Belgium, with each of the three regions taking the decision on which programmes to finance. In the case of Spain, the decision fell to the Ministry of Finance, as the competent authority that managed all SF programmes.
In two cases, the final decision was taken by the central government in consultation with an association of local authorities. In Austria, the Federation of Austrian Local Authorities gave their recommendations to central government, while in Finland, the final choice of programmes was made by a Selection Board made up of

Ex Post Evaluation of URBAN Community Initiative 1994-1999 Final Report
17
representatives from the Ministries of the Interior, Labour, Environment and the Finnish association of municipalities.
The assessment of the selection process from the perspective of the programme managers showed that the Commission criteria were in the main appropriate for selecting the most disadvantaged districts in a city. The socio-economic characteristics identified in the Commission guidance were sufficiently explicit to target the most deprived areas, given that they focused on the key issues of high unemployment, poor housing conditions and a lack of social amenities.
3.3 Selection of “programming mechanism”
There were two approaches to the URBAN programming mechanism. In some member states, an individual programme was approved for each area (as was the case in Austria, Belgium, Finland, France, Germany, the Netherlands, Sweden and the UK). In other member states, a single Operational Programme at the member state level was adopted for all areas (as was the case in Denmark, Ireland, Luxembourg, Greece, Spain, Italy and Portugal).
The latter system meant that all the programmes had to be approved at the same time, and had the potential to delay the adoption of the programme, as well as delay submission of reports and payment claims. However, during implementation, there was a link between the programmes within the member state, which had some useful outcomes in terms of information exchange.
(In this report, the term “programme” is used to describe the individual URBAN programmes, whether they were approved individually on an area-by-area basis, or as a package at the member state level).
3.4 The population and areas targeted by URBAN
A total of 118 URBAN I programmes were funded during the period 1994-1999. The programme targeted approximately 3 million people across the EU, with an average target population of around 25,000 people. The populations ranged considerably from 1,500 in Córdoba to 130,000 in Vienna.
The majority of target neighbourhoods (86%) are located within cities with over 100,000 people. In the remaining cases, cities were selected from countries such as Greece where there are few urban areas over 100,000 population. Nevertheless, in these cases, the towns and cities concerned still demonstrate similar problems of urban decline and social malaise. The URBAN II CI has recognised the importance of targeting smaller towns and cities as well as larger cities.
Most URBAN I programmes were located in either an Objective 1 area (57%) or an Objective 2 area (26%). The remaining 17% were located in areas that were not designated as a priority for the SF.
In the majority of cases (74%), programmes focused on one single neighbourhood, while in the remaining programmes, a group of different ‘districts’ were targeted within the one programme. Over a third of programmes (38%) targeted peripheral urban areas, while about a third (32%) were focused on inner city areas. Programmes in historic centres accounted for 19% of programmes, and the remaining 12% of programmes covered mixed areas. In terms of land use, URBAN programmes were

Ex Post Evaluation of URBAN Community Initiative 1994-1999 Final Report
18
predominantly implemented in industrial areas (63%), or mixed industrial and residential areas (31%). Only 6% of URBAN programmes were implemented in exclusively residential areas.
Characteristically, the target population suffered from a high degree of deprivation. Unemployment was particularly acute in the target areas. The average unemployment level in the programme areas was over 20%, significantly above the EU average, and in some districts, up to 40% of the target population was unemployed (for example in the southern Spanish cities). This serious concentration of unemployment is a key barrier to economic and social integration of the population, and measures to address this issue were integrated into all programmes. The programme areas also displayed high concentrations of immigrants and ethnic minority groups. In some areas, such as the programme in Brussels, over 70% of the target population were from ethnic minority backgrounds.
Other challenges facing the target areas included social aspects (high crime rates, drug abuse, vandalism, low education levels), environmental issues (lack of green space), physical components (neglected housing stock and a run-down physical environment), as well as a dislocation from the rest of the city, both physically and metaphorically.
3.5 What strategies were implemented?
From an assessment of the strategies adopted by the URBAN programmes to address these challenges, the approaches can be broadly categorised using the following typology:
1. A broad integrated approach. This approach closely followed the Commission’s Guidelines which stated that the programmes “should comprise a balanced and coherent set of economic development, social integration and environmental measures.” In many cases, this involved integrating physical infrastructure works with actions to support SMEs, training, social inclusion measures and environmental improvements. This is categorised as a ‘broad integrated approach’.
2. Within those programmes, some adopted a more explicit social focus, others put emphasis on economic aspects, while some focused on physical / environmental issues. However, in all these cases, this focus was supported by other measures that made up an integrated approach to urban regeneration. These programmes have been classified as ‘integrated approaches with a specific focus’.
3. A third category that emerged involved ‘flagship approach’ within an integrated approach. Programmes that adopted this strategy used a limited number of visible or flagship projects as a means of generating interest in the programme and creating an atmosphere of change and renewal. Aside from these focal points, the remaining programme budget was used to fund smaller scale, lower profile projects and initiatives, to support the overall integrated approach to regeneration.
4. The fourth category focused on local community involvement in the programme. Although many of the programmes involved local residents in

Ex Post Evaluation of URBAN Community Initiative 1994-1999 Final Report
19
aspects of the programme, URBAN programmes falling into this category had a strong focus on local community groups, aiming to integrate community groups, voluntary groups and residents’ associations into the design, management and implementation of the programme and its projects. Programmes adopting this ‘community focused approach’ were concerned with the involvement of local groups in the process of urban regeneration, as much as the content of the programme itself. However, the programmes were still anchored in an integrated approach to regeneration, combining a range of measures to address urban deprivation, but always with a community focus.
The tables below show the approaches that were adopted in each member state, and the overall proportion of programmes that adopted each strategy. In line with the Commission guidance, almost half of the programmes (45%) adopted a “broad integrated approach” and a further 26% also used an integrated approach with a specific thematic focus to achieve their objectives. Of the three specific aspects (economic, social and environmental), a social or economic focus was most common. A total of 10% of programmes adopted a strategy based around “flagships”, while a further 19% chose a “community focused” strategy to implement their programme.
Some strategies were adopted more readily in some member states rather than others. All the UK programmes adopted a “community focussed approach”, reflecting the strong partnership and inclusive approach to urban regeneration that was being rolled out at the time. Other countries, such as Germany, France and Spain took an integrated approach, either balanced or focussed. The actual strategy adopted by each programme can be found in Annex 4.
Table 3.1 Type of strategy adopted by all URBAN and 5 UPP programmes, aggregated by member state11
MEMBER STATE Type of Strategy
EU 15 BE DK DE GR ES FR IE IT LU NL AT PT FI SE UK
Broad integrated approach
56 0 0 6 2 30 9 2 2 0 2 1 1 0 1 0
Integrated approach with a specific focus
33 5 0 7 3 0 4 0 9 0 2 1 2 0 0 0
“Flagship” approach 13 0 1 0 2 0 0 0 4 1 0 0 3 1 1 0
Community focussed approach
23 0 0 0 0 0 0 1 1 0 0 0 0 2 0 19
Total 125 5 1 13 7 30 13 3 16 1 4 2 6 3 2 19

Ex Post Evaluation of URBAN Community Initiative 1994-1999 Final Report
20
Table 3.2: Type of strategy adopted by all URBAN and 5 UPP programmes mapped against type of area and size of the city of the programme12
TYPE OF AREA SIZE OF CITY (‘000) Type of Strategy
% of total
Peripheral area
Inner City
Historic City
Centre
Mixed <100 100-250
>250
Broad integrated approach 45% 21% 10% 11% 4% 7% 21% 18%
Integrated approach with a specific focus 26% 8% 11% 5% 2% 2% 13% 11%
“Flagship” approach 10% 3% 3% 1% 3% 3% 4% 3%
Community focussed approach 18% 6% 8% 2% 2% 2% 4% 11%
Total 100% 38% 33% 18% 11% 14% 42% 44%
The “balanced integrated approach” was used in a wide variety of contexts, in both centrally located URBAN programme areas, as well as those on the periphery of cities. It was also used in cities of all different sizes.
An assessment of the URBAN programmes shows that all strategies were deemed to address the stated programme objectives, either fully (95%) or partially (5%). Of the 5%, there were a variety of reasons for only partially addressing the stated objectives. These included:
The target area being too large and heterogenous to address fully all the objectives, and target the range of problems, in the relatively short time scale;
A lack of links envisaged with the surrounding area, to promote synergies, which meant that the objectives were not fully addressed
All strategies were also deemed to address the areas’ key characteristics and challenges, either fully (90%) or partially (10%). Reasons for only partially tackling the areas’ key challenges included:
The restrictions of the SF regulations, which did not allow EU co-financing in domains such as housing. This was often a major challenge in deprived areas, and the strategies of many programmes would have benefited from housing investment;
The risk of area up-grading bringing population displacement through rising housing costs. This potential was not taken into account in some strategies, and has been a risk in target areas that have undergone significant change in their socio-economic characteristics.
Around a third of programmes (45 programmes, or 36%) were subject to changes to their strategy over the programme’s lifetime. There were a variety of reasons cited, the most common being:
11 The classification of strategy type for each programme was based on the national evaluator’s assessment. 12 The classification of strategy type for each programme was based on the national evaluator’s assessment.

Ex Post Evaluation of URBAN Community Initiative 1994-1999 Final Report
21
Implementation issues (34 programmes). These were predominately due to the novel way of working introduced by URBAN. In many cases, adjustments had to be made to initial strategies and management arrangements, to ensure that the programme could be delivered;
Extraneous factors (8 programmes), including an additional financial allocation (Brussels), legal issues (Madrid); and the uncovering of archaeological remains (Volos-Nea Ionia); and
A new policy agenda (3 programmes).
3.6 Expenditure under URBAN
An assessment of spending by priority also reveals changes within financial allocations of the URBAN programme as a whole during its lifetime (see tables in Annex 3). Initial spending allocations at the EU level (classified by the categories of expenditure for the period 2000-2006) show that 44% of initial committed funds were allocated to “entrepreneurship and employment”, while around a quarter of allocations were foreseen for “physical and environmental regeneration” (29%). “Social inclusion” measures accounted for 21% of planned expenditure. ICT measures, technical assistance and “other measures” accounted for 6%.
In some cases, programmes underwent changes to their programming, which resulted in revised committed allocations. This redressed the balance between categories. “Entrepreneurship and employment” and “physical and environmental regeneration” both accounted for 35% of revised committed expenditure. A further 24% was allocated to “social inclusion” measures. Other categories accounted for 4%.
From data that are available, the actual expenditure tips the balance further towards “physical and environmental regeneration”, which accounted for 38% of actual expenditure, with less than a third going to “entrepreneurship and employment” (32%). Just under a quarter of actual expenditure (23%) went into “social inclusion” measures, while transport and ICT measures both accounted for 1%. The remaining 6% was accounted for by Technical Assistance and “other” measures.
However, these figures mask large variations between countries, with physical/environmental regeneration accounting for 62% of actual expenditure in Italy, as opposed to just 10% in Denmark. Expenditure on employment and entrepreneurship ranged from 52% in the Netherlands, to 18% in Italy. Social inclusion measures accounted for 46% of actual expenditure in Portugal, as opposed to just 12% in the Netherlands, Austria and Greece. Variations in the other categories were not as significant.
Table 3.1 in Annex 3 gives a breakdown of expenditure, showing the EU contribution (both ERDF and ESF), as well as other public and private expenditure. The EU contribution amounted to 721.4 million euros (July 2003), with 84% provided by the ERDF, and the remaining 16% from the ESF.13 Although the total planned (revised committed) expenditure was somewhat greater (at 900 million euros), the proportions from the different funds were roughly the same. Although the actual expenditure
13 The total expenditure reported in the evaluation (June 2003) is 711.5 million euros (48% of total cost), with 87% provided by the ERDF, and the remaining 13% from the ESF. Data for some programmes was not provided.

Ex Post Evaluation of URBAN Community Initiative 1994-1999 Final Report
22
figures do not currently include all programmes (financial data for some programmes have not been provided), the current figures suggest that the maximum underspend is 20% of the revised commitment. This underspend has hindered the success of some programmes. The factors hindering success are examined further in Section 4, in the context of the effectiveness of the programmes.
The figures for actual expenditure show that national public expenditure and private expenditure accounted for a slightly higher percentage of total funding than initially planned. National public expenditure accounted for 45.4% of the total cost of the programmes, compared to an initial allocation of 45.1%. Private expenditure accounted for 8% of the total cost of the programmes, compared to the initial allocation of 6.6%.
These percentages relate to direct investment. However, indirect leverage has also been significant in many cases, and is not accounted for in these figures. Private sector leverage has taken a variety of forms: the arrival of new SMEs into the area, improvements to the housing stock by private home-owners, and shop-keepers investing in their businesses. Indirect private sector leverage was, and is still, evident in some programme areas, through the volume of construction and restoration work that is being undertaken, in some cases by private developers.
Box 3.1: Examples of public and private sector leverage as a result of the programmes There were some examples of very significant leverage as a result of the programme.
In Rostock, there was significant indirect leverage, from both public and private sources. Further public investment beyond the remit of the URBAN programme took place in and around the programme area, including the renovation of a large building for re-use by the University. A study on indirect private leverage in the area has estimated that for every euro invested in housing renovation in the URBAN area, a further 3.9 euros has been generated.
In Graz, a survey on the indirect leverage effects of the programme has shown that investment in the area during implementation is estimated at 242.66 million euros, of which only 29.39 million euros were directly related to the URBAN budget as originally planned.
In these and other cases, URBAN has acted as a catalyst for regeneration, with leverage clearly going far beyond initial expectations.
3.7 Links foreseen between the URBAN strategies and other Structural Fund interventions in the city (Objectives 1, 2 and 3)
The majority of URBAN programme areas were set within Objective 1/6 (57%) or Objective 2 (26%). All programme areas outside of Objective 1 were eligible for Objective 3 funding. In many cases, it was anticipated that the URBAN programme area strategy would complement other SF programmes in the city, providing added value to mainstream interventions. Of the 99 programmes covered by Objectives 1 and 2, 75% of these foresaw in their programming documents that there would be a link in strategy.
Strategic links were mainly one-directional, with URBAN linking into the other mainstream strategies. The synergies between programmes contributed to the effectiveness of URBAN, as Section 4 illustrates. These links were often facilitated by a

Ex Post Evaluation of URBAN Community Initiative 1994-1999 Final Report
23
common management structure at the city level, which ensured coordination and complementarity between European programmes. This was the case, for example, in Glasgow North where the programme executive for the Western Scotland Objective 2 Programme was also responsible for the URBAN programme. This brought a high level of integration at both the policy and project level.
There were few links foreseen with the Objective 3 programmes, although many of the activities funded through URBAN were consistent with the aims of Objective 3.
Box 3.2: Examples of links between URBAN and other Structural Fund interventions
In the case of Magdeburg-Cracau, the URBAN programme added value to the Objective 1 strategy, by focusing on very small micro-enterprises. One of the measures funded under URBAN established a scheme for these micro-enterprises, which would not have been eligible for ERDF-funding under the normal regulations in the region.
In London (Hackney Tower), the URBAN programme built upon Objective 2 activities, addressing problems that were not covered by the East London Objective 2 programme, in particular focusing on the needs of socially excluded groups.
In Spain, around half of programmes were deemed to be linked in their strategies to the relevant Objective 1 and 2 programmes. There were also strategic links with other Community Initiative in six of the 29 Spanish cities (INTERREG II, HORIZON, LEADER II, INTEGRA, NOW, ADAPT and YOUTHSTART).
In all six Portuguese programmes, the URBAN programme strategies were set within the context of other Objective 1 interventions, mainly road, environment, and social infrastructure.
3.8 Summary The Commission’s notice to member states set out a number of eligibility
criteria:
- population size (located in cities of more than 100,000 people),
- the definition of the target area (geographically identifiable), and
- the socio-economic characteristics of the area (high unemployment, decayed urban fabric, poor housing conditions and a lack of social amenities).
Priority was given to cities located in Objective 1 regions, and to programmes that formed part of long-term strategies within the cities concerned.
In practice, there were 3 types of programme selection process:
- an open call (5 member states, as well as the Belgian region of Wallonia);
- a restricted call with competition (7 member states); and
- a restricted call without competition, following analysis at the national level (3 member states).

Ex Post Evaluation of URBAN Community Initiative 1994-1999 Final Report
24
In the majority of cases, the decision-making body was located within central government. In two cases (Austria and Finland), the decision was taken in partnership with an association of local authorities.
The respective roles and responsibilities of the national authorities and the EC in the selection process were not clearly defined. This led to some difficulties in negotiations and delays in launching the programmes. However, this was also a source of learning for URBAN II.
In all, the 118 URBAN programmes covered a population of nearly 3 million inhabitants. The size of programme varied widely from the smallest population in Córdoba (1,500) to the largest in Vienna (130,000). The majority of URBAN neighbourhoods (86%) were located within cities with a population of over 100,000.
URBAN I was targeted mainly in peripheral urban areas (38% of programmes) and inner city areas (32%). Historic city centres accounted for 19% of programmes. 12% were focused on neighbourhoods with “mixed” characteristics.
In general, the Commission’s criteria led to the selection of the most disadvantaged districts in the city. The average unemployment level in the programme areas was over 20%, and in some districts, up to 40%. The programme areas also displayed high concentrations of immigrants and ethnic minority groups, representing up to 70% of the target population in some programme areas.
The strategies adopted by the programmes can be divided into four broad types: a broad integrated approach (45% of programmes), an integrated approach with a particular focus – economic, social or environmental (26%); a community-focused strategy (19%); and a “flagship” strategy (10%).
All programme strategies were judged to have addressed the stated programme objectives, either fully (95%) or partially (5%). They were all deemed to have addressed the areas’ key characteristics and challenges, either fully (90%) or partially (10%).
A third of programmes were subject to changes to their strategy over the programme’s lifetime. This was due to a range of factors, including implementation issues, new policy agendas, and other occasional factors such as legal issues or the uncovering of archaeological remains.
In terms of types of expenditure, at the EU level 38% of actual expenditure went to physical and environmental regeneration, 32% supported activities in entrepreneurship and employment; 23% financed initiatives relating to social inclusion; 4% was spent on technical assistance, and 2% went into activities in ICT and transport. A further 2% went into “Other” types of initiative. However, there were significant variations in the type of expenditure by member state.
A total of 86% of programmes were located within Objective 1 or 2 areas. Of these, 75% foresaw in strategy in link between the mainstream SF programmes and URBAN. These links were often facilitated by a common management structure at the city level, which ensured coordination and complementarity between European programmes.

Ex Post Evaluation of URBAN Community Initiative 1994-1999 Final Report
25
4 THE EFFECTIVENESS OF THE URBAN PROGRAMMES
4.1 Introduction
This section aims to establish the processes and factors that have had an impact on the effectiveness of the URBAN programmes, based on an assessment of 56 URBAN programmes and 2 UPPs. In addition, this section also presents the types of networking activities undertaken by the various URBAN programmes and the factors that have impacted on their effectiveness.
Effectiveness was judged against a combination of the original objectives set out for URBAN by the European Commission, as well as nationally defined objectives that were specific to each member state. Across the URBAN programmes, this assessment of success can be broken down into three levels of achievement:
Outcome objectives – the delivery of tangible benefits to the target area and population;
Internal processes and approaches to urban regeneration – including the use of an integrated approach to deliver a wide range of measures; the focus of programmes on very specific and clearly defined areas; the combination of funding from both EU and non-EU sources; and the mobilisation of public and private funds in a concerted action;
Legacy of the URBAN programme – sustainable and lasting outcomes, and the continuation of the projects and approaches beyond the end of the EU funding period.
4.2 Overall assessment of the effectiveness and achievements of URBAN
4.2.1 Success criteria
The national evaluators’ assessment of effectiveness was mainly based on the original objectives of the URBAN CI as set out in 94/C 180/02. In addition, each of the national evaluators identified other conditions or factors that were also used as national success criteria for each of the programmes. It was important to recognize that because each of the member states began from different starting points in terms of their urban regeneration agenda and processes, that the expectations, nationally, from the programmes were also different. For example, Sweden and Denmark highlighted a focus on issues of sustainable development within their aims for URBAN, while in the case of Greece, the concern was more for the initiating the establishment of a coherent urban policy. These success criteria are elaborated in the Box below.

Ex Post Evaluation of URBAN Community Initiative 1994-1999 Final Report
26
Box 4.1: Definitions of success Objectives of the URBAN Community Initiative as set out in 94/C 180/02
• To address the levels of social exclusion in inner city and peripheral areas.
• To address issues faced by deprived urban areas through support of business creation; improvement of infrastructure and the physical environment; provision of customised training, and actions for equality of opportunities and social amenities.
• To act as a catalyst for lasting urban change through a broad based approach.
• To fund innovative projects that, where possible, form part of a long term urban integration strategy being implemented by the cities concerned.
Member state objectives Austria To promote institutional co-operation and stimulate strategic integrated
approaches - planning as well as implementation Belgium To promote an integrated approach to urban regeneration
Denmark To promote new urban development based on the principles of sustainability
Finland
To encourage positive development of social networks and long-lasting improvements in built and natural environment in programme areas
France
To enhance the “economic development and employment” theme of the "contrat de ville" and the "urban revival" plan, and to mobilise the private sector
Germany
To promote a truly comprehensive and integrated approach - especially through including economic objectives and activities in existing strategies
Greece To fill the gap existing in the area of urban policy in Greece Ireland
To promote community involvement and consultation; and strengthen the role and capacity of municipalities in running regeneration programmes
Italy
To increase deliverability; to promote horizontal integration within municipalities by overcoming a sectoral approach to urban problems; and to add a value layer of participation and partnership Delivering the first two objectives was seen as a successful outcome. Some cities also attempted to achieve the third objective as well.
Luxembourg
To promote the "regeneration zones" programme that the government was launching
Netherlands
To focus on tourism and cultural development, to increase the visibility of the programme
Portugal
To promote the implementation of more integrated policies through a broad approach to the urban problem in the Metropolitan Areas of Lisbon and Porto
Spain To increase community involvement in the management and implementation of URBAN; to promote cooperation between different levels of government, and between different departments within the municipality, to involve the private sector in urban regeneration
Sweden To establish active partnerships around environmental issues in a local/regional context
United Kingdom To increase community involvement in the management and implementation of urban regeneration projects

Ex Post Evaluation of URBAN Community Initiative 1994-1999 Final Report
27
4.2.2 Evaluators’ assessment of the effectiveness of the URBAN programmes
Each of the national evaluators was asked to assess the level of overall effectiveness of the sample of 56 URBAN programmes, on a scale of “very successful” (rated 1) to “not successful” (rated 5). The assessment was made against the success criteria described in 4.2.1, and based on the review of local evaluations and final reports, and discussions with respective programme managers. Overall, 72% of the selection of programmes were deemed to be successful (“very successful” (rated 1) and “mostly successful” (rated 2)) while only 3% of programmes were deemed to be “mostly unsuccessful” (rated 4). No programmes were judged to be “not successful” (rated 5). The remaining 25% were judged to be “equally successful and unsuccessful” (rated 3).
4.2.3 Levels of effectiveness
As outlined above, the success of the URBAN programmes can be analysed on three levels. Examples of programmes that have achieved success in these three areas are provided below:
Outcome objectives: Most visible of the achievements of URBAN were its outcomes achieved against set targets. These included physical and socio-economic outcomes such as jobs created, persons trained, community centres, sports facilities and business space. Some examples include:
Duisburg. Community centre, sports facility, 100 jobs
The Hague. 689 jobs, 240 people trained
Sheffield. Community centre, training centre, recreational area, 58 jobs, 118 temporary jobs
Roubaix-Tourcoing. Community centre, 5 business spaces, training centre, recreational space
Graz. Community centre, business space, recreational space, 75 jobs
Internal process and urban regeneration approach principles: The experience of URBAN introduced significant changes to processes and approaches to urban regeneration. In many member states, URBAN introduced the idea of cross-sectoral working, bringing together key stakeholders and involving the recipient community in the change process. For some, this change in approach proved to be even more significant than the tangible outcomes of the programme. This is further elaborated in Section 6 on the impacts of URBAN.
Legacy of the URBAN programme: Ultimately, the most lasting benefits of URBAN were seen in those programmes where the gains in terms of outcomes and process have been sustained beyond the life of the programme. In the medium term, a number of URBAN programmes saw their management approach adopted in other URBAN II programmes, whether it be in the same city or in a neighbouring one. Similarly, programme management structures that were set up for URBAN were sustained to run other regeneration initiatives. This legacy of URBAN is also elaborated further in Section 6.
Clearly from these examples, the URBAN programme is considered to have been a success on a number of fronts. The remaining part of this section will examine the characteristics of the successful and not so successful programmes, together with the

Ex Post Evaluation of URBAN Community Initiative 1994-1999 Final Report
28
factors that have been identified that supported or hindered the success of the programmes.
4.3 Effectiveness and the objective criteria and characteristics of the URBAN programmes
URBAN intervened in a range of neighbourhoods, as outlined in Section 2, in different types of area and Objective status region. The tables below show the classification of the type of area and Objective status, according to whether the programme was considered to be a success (by the national evaluators). Table 4.1 shows that programmes in inner city areas were marginally more successful than programmes in peripheral areas or historic city centres. Table 4.2 shows that programmes located in an Objective 1 or 2 area were marginally more successful according to the national evaluators than those programmes located in an area with no Objective status. However, this assessment does not suggest that there is a causal link between these factors and the level of success. The factors affecting the success of a programme are multiple and complex, and are discussed further in Section 4.4.
In terms of programme strategy, evidence from this evaluation suggests that a broad integrated approach can deliver very successful outcomes (Table 4.3). All “very successful” programmes adopted a broad integrated strategy. However, other programmes that also adopted this approach were considered less successful by the evaluators. Clearly the factors supporting or hindering success are varied and there are no “off the shelf” strategic solutions that would work in all cases.
Evidence from some countries suggests that a strong integrated approach may be most suitable in the “worst” areas of urban deprivation, where it is essential to have a holistic approach to the multi-dimensional issues faced by disadvantaged areas. In areas of potential, where there are “lost opportunities”, a strategy based on “flagship” projects has a good chance of securing sustainable regeneration. These projects can act as a catalyst for further regeneration, while other smaller scale, lower profile projects can help to build community involvement in the programme, and encourage ownership. Although a central location is the most obvious place for a strategy based on “flagships”, in order to maximise visibility, there is also a role for these strategies in peripheral locations, where they can act as a focus for local actors and community based organisations, which are essential partners in urban regeneration programmes. Other factors affecting the effectiveness of the programmes are further elaborated in the next section.

Ex Post Evaluation of URBAN Community Initiative 1994-1999 Final Report
29
Table 4.1: Type of area of the URBAN and 5 UPP programmes mapped against the level of success of the programme14
LEVEL OF SUCCESS Type of Area
No. of
cases EU 15
Very successful
Mostly successful
Equally successful
and unsuccessful
Mostly unsuccessful
Not successful
Total
Peripheral urban area 47 6% 63% 31% 0% 0% 100%
Inner city 41 17% 57% 22% 4% 0% 100%
Historic city centre 23 17% 58% 25% 0% 0% 100%
Mixed 14 13% 50% 25% 13% 0% 100%
Total 125 14% 58% 25% 3% 0% 100%
Table 4.2: Objective status of the URBAN and 5 UPP programmes mapped against the level of success of the programme 8
LEVEL OF SUCCESS
Objective status No. of
cases EU 15
Very successful
Mostly successful
Equally successful
and unsuccessful
Mostly unsuccessful
Not successful
Total
Objective 1/6 70 16% 56% 28% 0% 0% 100%
Objective 2 33 15% 60% 20% 5% 0% 100%
No objective status 22 7% 57% 29% 7% 0% 100%
Total 125 14% 58% 25% 3% 0% 100%
Table 4.3: Type of strategy of the URBAN and 5 UPP programmes mapped against the level of success of the programme8
LEVEL OF SUCCESS Type of Strategy
No. of
cases EU 15
Very successful
Mostly successful
Equally successful
and unsuccessful
Mostly unsuccessful
Not successful
Total
Broad integrated approach 56 28% 48% 21% 0% 0% 100%
Integrated approach with a specific focus 33 0% 64% 27% 9% 0% 100%
“Flagship” approach 13 0% 38% 50% 13% 0% 100%
Community focussed approach 23 0% 85% 18% 0% 0% 100%
Total 125 14% 58% 25% 3% 0% 100%
14 The classification of the type of strategy and the level of success for each programme was based on the national evaluator’s assessment.

Ex Post Evaluation of URBAN Community Initiative 1994-1999 Final Report
30
4.4 Factors that have supported and hindered the effectiveness of the URBAN programmes
Following the national evaluators’ assessment of the level of effectiveness of the 56 sampled URBAN programmes, they were then asked to select the five most important factors that supported and/or hindered the success of the URBAN programmes. Table 4.4 below summarises the more important supporting factor at an overall EU level, (ranked according to the number of citations), and also indicates the relative ranking of each factor to each member state. Table 4.5 summarises the most important factors that hindered the success of the programme, ranked according to the level of importance at the EU level, and also shows the relative ranking of each factor to each member state.
A number of points should be noted:
A list of all the factors that supported or hindered the success of the URBAN programmes was identified from an initial assessment of each programme evaluation.
In many cases, a factor that supported the success of an URBAN programme was also cited as hindering success, when this factor was absent. For example, private sector support was a factor that contributed to success. The lack of private sector support also hindered the success of a number of programmes.
However, there were also cases where the same factor was seen as contributing to success in some programmes, but hindering success in others. For example, a wide partnership was generally seen as positive, but also constrained the success of other programmes, through difficulties in achieving consensus, and the subsequent delays.
The first column of each table provides the number of citations for each factor for all programmes, ranked to show the most frequently cited. The member state figures show the ranked position of each factor that was cited as being influential in the URBAN programmes in that member state.
Underlining of the ranked positions denotes an equal ranking of factors. Equal ranking is more common in member states were there were fewer programmes, as fewer factors were selected more than once as being important.
A full list of factors supporting and hindering the sampled programmes is provided in Annex 5.

Ex Post Evaluation of URBAN Community Initiative 1994-1999 Final Report
31
Table 4.4 Factors supporting the success of the 56 URBAN and 2 UPP programmes, presented in rank order15 RANKING OF FACTORS BY MEMBER STATE Supporting factors for all programmes No. of
citations (EU15) BE DK DE ES GR FR IE IT LU NL AT PT FI SE UK
The combination of URBAN with existing regeneration programmes 30 1st 5th 1st 1st 1st 4th 4th 1st 1st 3rd
The selection and combination of projects 26 1st 1st 1st 1st 3rd 4th 2nd 6th
Active participation of the local community in aspects of the management and implementation of the programme 17 2nd 4th 5th 1st 4th 3rd
The establishment of an integrated approach with strong partnerships 16 2nd 2nd 5th 5th 4th 1st 3rd
Carrying out comprehensive programme preparation, including action planning and needs assessment 15 1st 4th 11th 1st 5th 1st 2nd 2nd 1st 10th
Strong private sector support and cooperation 15 1st 4th 5th 1st 3rd
Strong leadership in the day to day management and overall implementation of the programme. 13 1st 2nd 5th 2nd 2nd 2nd 1st 1st
Leveraging other existing regeneration programmes as a source for match funding 13 5th 1st 1st 2nd
Political support and cooperation 10 5th 11th 4th 5th 3rd 3rd 2nd
Receptiveness of the local community to the URBAN projects 10 5th 11th 4th 1st 8th 2nd 10th
Funding process and administration 8 5th 4th 5th 2nd 6th
The establishment of a local project office within the programme area 7 8th 9th 3rd 2nd 1st 10th
Timeliness of programme decision making and implementation 7 5th 1st
Marketing and promotion of the URBAN programme 6 8th 4th 8th 1st
The establishment of capacity building processes from the start of the programme 6 4th 5th 1st
Strong communication across various levels of management of URBAN programme 5 9th 8th 3rd 10th
Preparation of a transition strategy 4 11th 3rd 3rd
The understanding of European Commission documents and procedures by those involved in the programme 3 5th 6th
Establishment of community chest funds to motivate and encourage participation from small community groups 3 8th 1st 10th
Establishment of key funds to address the issue of securing match funding by small community organizations 2 6th
15 The identification of factors supporting the success of the programmes was based on the national evaluator’s assessment. Underlined ranking indicates equal ranking among several factors.
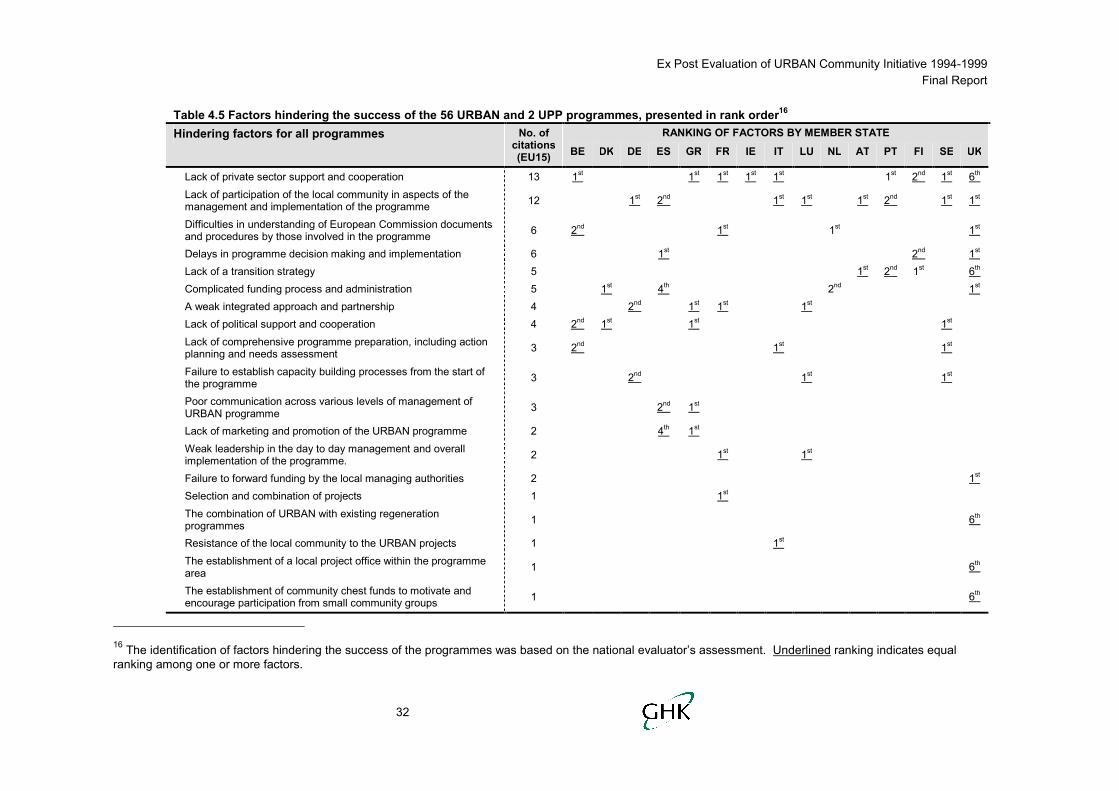
Ex Post Evaluation of URBAN Community Initiative 1994-1999 Final Report
32
Table 4.5 Factors hindering the success of the 56 URBAN and 2 UPP programmes, presented in rank order16 RANKING OF FACTORS BY MEMBER STATE Hindering factors for all programmes No. of
citations (EU15) BE DK DE ES GR FR IE IT LU NL AT PT FI SE UK
Lack of private sector support and cooperation 13 1st 1st 1st 1st 1st 1st 2nd 1st 6th Lack of participation of the local community in aspects of the management and implementation of the programme 12 1st 2nd 1st 1st 1st 2nd 1st 1st
Difficulties in understanding of European Commission documents and procedures by those involved in the programme 6 2nd 1st 1st 1st
Delays in programme decision making and implementation 6 1st 2nd 1st Lack of a transition strategy 5 1st 2nd 1st 6th Complicated funding process and administration 5 1st 4th 2nd 1st A weak integrated approach and partnership 4 2nd 1st 1st 1st Lack of political support and cooperation 4 2nd 1st 1st 1st Lack of comprehensive programme preparation, including action planning and needs assessment 3 2nd 1st 1st
Failure to establish capacity building processes from the start of the programme 3 2nd 1st 1st
Poor communication across various levels of management of URBAN programme 3 2nd 1st
Lack of marketing and promotion of the URBAN programme 2 4th 1st Weak leadership in the day to day management and overall implementation of the programme. 2 1st 1st
Failure to forward funding by the local managing authorities 2 1st Selection and combination of projects 1 1st The combination of URBAN with existing regeneration programmes 1 6th
Resistance of the local community to the URBAN projects 1 1st The establishment of a local project office within the programme area 1 6th
The establishment of community chest funds to motivate and encourage participation from small community groups 1 6th
16 The identification of factors hindering the success of the programmes was based on the national evaluator’s assessment. Underlined ranking indicates equal ranking among one or more factors.

Ex Post Evaluation of URBAN Community Initiative 1994-1999 Final Report
33
The tables above illustrate the importance of different factors in supporting or hindering the success of the programmes. Each of these is elaborated below, grouped into the following categories: strategic decisions, European and national level management, programme level partnership approach, and funding. Within each category, the factors are discussed according to the frequency with which they were cited as being important. Given that many of the factors both supported and hindered the success of the programmes, they are discussed together in each section.
4.4.1 Strategic decisions
Combining URBAN with existing regeneration programmes. The most commonly cited factor supporting the success of URBAN programmes was its combination with other existing regeneration efforts. In the case of a number of UK programmes, the simultaneous existence of URBAN and other large scale regeneration activities proved to be an important supporting factor. For example, in the case of Birmingham, the URBAN programme ran at the same time as the Single Regeneration Budget (SRB) programme. This allowed for synergies between the projects by the two programmes and the integration of the managing Urban Partnership Group (UPG) and the SRB board into a single body that helped to avoid the duplication of efforts. The link between URBAN and other regeneration programmes also existed in other cases, for example in Spain (Bandalona – Plan Estrategico 2000; León – Plan General de Ordenación Urbana) and Italy (i.e. Trieste – Revitalisation of Cittavecchia).
Synergies between the combination of selected projects within URBAN. The second most commonly cited factor for the success of an URBAN programme was the synergies between the combination of selected projects, as identified by the programmes in Rostock and Cork. It was pointed out in the Dutch cases that the combination of physical and soft measure projects allowed for useful synergies such as the housing of an education-based project in a building project. In terms of a strategy for selecting and combining projects, Graz found that an effective approach involved having a visible core of main projects which established an image of change, progress and trust, which were complemented by smaller sub-projects that allowed more people and organisations to be involved. Ultimately, a key success criterion involved offering something for everyone and every group in the area. In Les Mureaux, it was agreed that targeting the projects on a specific aspect of regeneration and development, in this case on commercial centres, was a factor for success as it focused the implementation process by using a specific methodology.
Yet, the combination and range of projects also had to be balanced with their overall number. The funding by some programmes of many, often small, projects covering a broad range of issues resulted in diluting the impact of the programme. For one programme manager, the decision to fund many small projects with similar objectives led to a proportionately higher administrative work load which ultimately affected the ability to be effective.
Investment of time in comprehensive action planning. The allocation of time during the early stages of the programme was important for setting out a clear action plan for the life of the programme. This was the experience of Sheffield where discussions on management structures, the objectives of the programme as well as a comprehensive needs analysis led to the development of an action plan that was both supported by and representative of the local community. In the case of most German programmes, preparatory planning activities were held to develop a draft strategy. This draft
Ex Post Evaluation of URBAN Community Initiative 1994-1999 Final Report
34
strategy was then used as a framework from which the URBAN programmes were developed.
In the case of Bremen, a survey carried out showed that there was a lack of sufficient analysis of target groups, especially in terms of their needs relating to participation. What this implied was that certain target groups such as the immigrant population were not fully engaged in the participation efforts and activities of the programme.
Marketing and promotion of the URBAN programme. Raising the profile and awareness among the community about the work of URBAN in an area was proactively carried out in the Austrian programmes. The programme felt that the “European label” of URBAN contributed to change in the political attention and image of regeneration work, which subsequently led to high levels of indirect private investment in the area. In Graz, the decision to design a communication strategy for the programme was made early on, through hiring a communications consultant. In Vienna, marketing was carried out through TV and radio coverage, and no less than 550 published articles.
Box 4.2: PR and Promotion of the URBAN programme and its work (Vienna) The project took the idea from Austria’s popular game DKT ("Das kaufmännische Talent") which teaches children and other players about enterprises and entrepreneurial skills. The version developed by the project used the URBAN area as a basis, selling fields of the game board to local firms and using information about firms in the area as content for the game. The result was an extremely popular local version of the national game which contributed both to the dissemination of the ideas and work of the URBAN programme and the increase in local people’s awareness about the services and products offered to them in their own neighbourhood.
Preparing a transition strategy. To help ensure that the benefits of URBAN were sustained beyond the life of the programme, the Graz programme prepared a transition strategy which set out plans and other helpful factors so that initiatives could be carried out without additional funding.
Location and size of the area for the programme. For several programmes, the location and/or size of the area for the programme have proved to be one of the factors for success. For Joensuu, the small size of the city allowed for better visibility of the programme and closer cooperation between city administration, labour administration and local companies. Similarly, for Graz, the designation of a small URBAN programme area enhanced the impact of the programme and helped to motivate private homeowners and others to invest more than anticipated in the original planning. The Rostock programme identified that the proximity of the designated URBAN area to the city centre and housing stock was of benefit.
Conversely, having a large area for the implementation of URBAN proved to be a hindering factor for some programmes where aid intensity was low. Spreading the resources over too large an area diluted the effects and impact of the programme. Moreover, in the case of one programme, this had implications for the ability of the programme to be sustained beyond the life of URBAN as there were no mainstream structures covering the large area to continue the work begun during the URBAN programme.

Ex Post Evaluation of URBAN Community Initiative 1994-1999 Final Report
35
4.4.2 National level management
Timeliness of programme decision making and implementation. For many programmes, timing delays were identified as the key barrier to the effectiveness of the programme. The shortage of time meant that programme implementation did not meet set target dates and the pressure to spend the allocated funding was great. The latter point had implications for the ways projects were then selected and funded. For London-Park Royal, this meant that, in order to meet the spending deadline of the programme, decisions were made to fund larger scale projects. In effect, it was more likely that projects run by the local authority would be funded over those run by small community organisations.
One of the main causes for delays related to the bureaucracy and administration of the programme, in being able to establish agreement between various levels of management. Equally, poor communication and the lack of clear guidance, as well as difficulties in obtaining match funding were also causes for delays. Furthermore, in the particular case of a number of the Italian programmes, the delays in implementation of infrastructure projects resulted from finding archaeological sites within the area and the bureaucratic procedures associated with dealing with them. In Lyon, delays in implementation were a result of the lack of a comprehensive assessment of suitable building sites. Only later did the subject of ownership and other protracted legal issues arise leading to delays in the progress of the programme.
Despite efforts to spend the budget within the given time frame, many programmes were subject to underspend. Delays both in starting the programmes and in implementing large projects contributed to programmes not meeting their spending targets.
Communication and understanding of the overall URBAN programme at various levels of management. Some programme managers felt that there was a lack of clear guidance on the aims, objectives and operational and action planning details of the URBAN programme. There was also some confusion about what was or was not an eligible expense. Furthermore, it became apparent to some programmes that the national managing authority, who were the programme managers’ direct contact to the EC were not fully conversant nor entirely clear on the intricacies of the programme. This led to delays in getting responses and agreements to questions and occasions where messages were conflicting and confused. In the case of Glasgow North, they felt that under URBAN there was an encouragement to take some risks in the funding of projects (i.e. funding small community groups without a track record for delivery), yet the audit arm of the EC still prescribed very strict reporting requirements which needed to be adhered to. Moreover, in the case of Sheffield, confusion on the issue of eligible spend resulted in claw back from some projects. This proved to be significant as it penalized community groups for whom the availability of funds is a particular issue.
Related to the previous point, it was felt that the initial establishment of the programme should have been more inclusive of local inputs. More than the process being top-down in approach, the results were operational and decisions were felt to be less than appropriate by the local programme managers. For example, in the case of Sheffield, the ESF employment targets were deemed to be unrealistic given the small geographic area and low number of possible beneficiaries. Similarly, for London-Park Royal, the programme outputs were agreed upon between the EC and the Government Office for London without input or consultation with the local stakeholders. Furthermore, as the

Ex Post Evaluation of URBAN Community Initiative 1994-1999 Final Report
36
responsibility for the overall programme was divided across the three local authorities covered by the area, the outcomes to be achieved were likewise divided equally across the three areas without consideration for the characteristics of the sub-areas. Specifically, this meant that the sub-area of South Kilburn, a predominantly residential area with little space designated for commercial use, had an unachievable target for “number of new business start-ups”. Compounding this arrangement was the fact that the funding allocation was not equally divided among the three areas.
4.4.3 Programme level partnership approach
Participation of the local community in aspects of the management and implementation of the programme. The third most important factor for success of the programmes was the participation of the local community in aspects of the management and implementation of the programme. This enabled the target beneficiaries of the programme to express their opinions and views. They were involved in the preparation of project proposals, the selection of projects, and in the actual implementation and management of projects. In the Santa Coloma de Grameret programme, residents and representative associations were involved in all aspects of the programme’s implementation, leading to improved cooperation between the municipal administration and target residents. For Glasgow North, the community was involved in the selection process and project development phase through membership of the appraisal groups and project management committee. In addition, funding applicants were required to consult with local communities as part of the project development process.
As local community participation was a stated objective of URBAN, programme managers recognized that their failure to involve them was a barrier to the success of the programme. In the case of the Irish programmes, a certain level of mistrust between the local authority and the community had to be overcome. In the case of Salerno and London-Park Royal, it was felt that the planning of the measures and objectives were top-down, with no involvement of the community resulting in both the setting of unattainable outputs and disillusionment from the community.
An integrated approach which brought together the wide range of interest groups involved in the regeneration agenda. The integrated approach to the management and implementation of the URBAN programme was the fourth most commonly cited factor in both supporting and hindering the success of the programme. Foremost, the integrated approach brought together the various interest groups involved in the urban regeneration agenda including: local, regional and national government departments; the private sector, non governmental organisations, community groups, and most especially, the beneficiaries of the regeneration programmes. For many, the experience of working in multidisciplinary groups, across differing lines of interests and perspectives was new and experimental. In the case of Falun UPP, new networks focusing on the connection between environmental issues and social development were built across public sector, private sector and NGO interests. In Magdeburg, the Chamber of Crafts and Chamber of Trade and Industry were members of the group making decisions on grants for SMEs. For Thessaloniki, the Organisation of the Master Plan and Environmental Protection of Thessaloniki played a key role in the coordination of the programme, while the municipality provided financial and other support.

Ex Post Evaluation of URBAN Community Initiative 1994-1999 Final Report
37
While the merits of partnership working have been highly lauded, it did not come without its share of difficulties. Falun UPP, Córdoba and Dublin were faced with difficulties of clashing cultures and interests between various local government departments, as there was at the time little experience of working in a multi-sectoral and integrated manner across different interest lines. Operationally, this also led to difficulties in the actual coordination of efforts and work across different agencies and departments, especially in those member states without previous experience of this type of integrated working.
The lack of clear communication and buy-in from the community similarly occasionally undermined the success of URBAN. For example in Salerno, there was a concern over the growth in the population of consumers as a result of efforts to regenerate the old city centre. This led to street protests which even required police restraint. In effect, the string of events demonstrated the inability of the programme to communicate clearly and gain genuine involvement and participation from the community. Similarly, the residents of Mulhouse were not entirely open to the increase in the level of commercial activity within their residential area.
In addition, a number of programmes considered that the nature of the integrated approach contributed to a high administrative burden which strained the capacity of programme staff members. In general, this meant that the programmes were under resourced and therefore staff were overworked. In a number of cases, this led to high staff turnover and losses to the programme in terms of experience, knowledge and time, due to the initial learning curve required to understand the intricacies of the programme. In retrospect, the importance of that learning curve was recognised, with those involved in managing the programme needing to have a certain level of project management skills and regeneration experience to ensure the success to the programme.
Private sector support and cooperation. Although strong private sector support was an important factor in supporting success, the effectiveness of certain programmes also suffered from the lack of support from the private sector. This was the most important hindering factor overall. In Thessaloniki, one main project failed to materialize because the initial commitment of support from a private company was withdrawn. For Magdeburg, support for the development of SMEs proved to be difficult as banks were less than willing to share in the risks of micro enterprises and business start-ups. In the case of Trieste, some businesses were less interested in setting up as the area was undergoing widespread reconstruction work.
Political support and coorperation. Another factor that contributed to the success of a number of programmes was political backing. For example, the strong participation of the residents and local community in Santa Coloma de Grameret was led by the Comité de Dirección which was headed by the mayor. In Lyon, the engagement of a motivated champion, a “sous-prefet”, was key to the engagement of partners and the timely execution of the programme.
On the other hand in a few cases aspects of leadership, changes of leadership at the municipal level and changes in management arrangements affected the programmes. For example, the perceived underperformance of the Dudelange-Differdange programme was a result of the lack of engagement of one of the communes, where no projects were successfully implemented. Although the Volos-Nea Ionia programme was broadly successful, the change in the leadership of the municipality after the 1998

Ex Post Evaluation of URBAN Community Initiative 1994-1999 Final Report
38
local elections did have an impact on the effectiveness of the programme. The Aalborg programme suffered similarly as government leadership changed half way through the programme. In the case of Salerno, the 1997 elections shifted the responsibilities for the URBAN programme from the municipal administration to the Department of Economy and Community Policies, resulting in a new management for the programme all together.
Establishing a local project resource office within the programme area. Having acknowledged the fact that the understanding and administration of the URBAN programme was relatively complicated and bureaucratic, especially for local community organisations, several programmes found that establishing a local project office within the designated URBAN area helped to mitigate outstanding operational issues. For Vienna, this meant setting up a decentralised office in the area to which the relevant public agencies delegated a member of staff, thereby providing the local community with a direct point of contact for all policy areas. In the case of Glasgow North and Sheffield, the local project office ensured that the community groups had the necessary support and facilities needed to manage their projects.
Establishing the capacity building process from the start of the programme. Ensuring effective participation and involvement from the local community necessitated commitment from the programme to build capacity from the outset. Local community groups and residents required the support and skills to manage a project, while at the same time adhering to and understanding the requirements for receiving funding from the programme. Although in many cases the capacity building process was more time and resource intensive than initially thought, it was generally agreed that the benefits of such a process outweighed those costs, as the skills gained would be valuable for involvement in future programmes.
Box 4.3: Capacity Building Plan The Bristol programme developed a capacity building plan that addressed the needs of the local community within the programme area. At the start of the programme, it was recognized that there were many small community groups, which needed support in putting together a successful project proposal. The key features of the business plan included information on:
Funding structures
Output targets
Milestones
Monitoring requirements
Framework for monitoring the capacity building process
Single Regeneration Budget (SRB) and other regeneration programmes in the area
The capacity building actions incorporated in the plan included: Information (News-sheet, Resources Book);
Training (Community Action, Community Enterprise, Funding, Mentoring);
Resources (Project Development Fund);
Advice and Project Support (Community Development Worker, Volunteer Support);
Targeted Support (Asian Women, Refugees, Bangladeshi and African Caribbean Women);
Local Ownership (Local Community Partnerships).

Ex Post Evaluation of URBAN Community Initiative 1994-1999 Final Report
39
While the plan was managed by the Community Development Unit of Bristol City Council, the training was carried out by locally based voluntary organisations.
In the case of Swansea, the amount of time necessary to mobilise and build up capacity in community and partner agencies was underestimated. Similarly, London-Park Royal recognised that more could have been done in terms of capacity building in order to increase the number and effectiveness of organisations involved in the programme. In Vienna, deficiencies in the level of capacity building prevented URBAN from having a more lasting contribution to process and policy making after the life of the programme.
Ensuring the understanding of European Commission documents and procedures by those involved in the programme. An important aspect of the capacity building process was ensuring understanding of European Commission documents and procedures. This proved to be a major obstacle for many of the programmes which faced difficulties in understanding procedures, not to mention the bureaucracy linked with them. Programme management teams recognised that this barrier needed to be addressed in order to prevent local community groups from becoming overwhelmed and disengaged, especially those for whom URBAN was their first experience with EU funding. While capacity building was one aspect of generating a common understanding among all those involved, other initiatives included holding community conferences, and translating EU documents into simple, understandable language.
Box 4.4: Project Management Guide (London-Hackney Tower Hamlets) In Hackney Tower Hamlets, the URBAN Development Unit needed to ensure that each of the 100 or so projects managed their budgets in the same way (record keeping, monitoring, claims) and complied with EC procedures. This was especially important for small organisations that generally did not have existing financial and monitoring systems. Their solution to this was the production of a “Guide to Successful Project Development and Management”. The document was clear and comprehensive, including topics such as:
Budgets and outputs – including the importance of accurate budgets, realistic outputs, proof of match funding
Project Management – record keeping requirements, accounting records, forward funding, staff recruitment, capital purchases, publicity
Project monitoring – monitoring forms, cash flow estimates, quarterly monitoring visits, audits and significant changes
Annexes – application process; “What makes a good project?”; eligible and non eligible project costs; in-kind match funding
The guide was used within other local regeneration programmes as a model for developing their own procedures.
4.4.4 Funding
Funding process and administration. Overall two main points pertaining to the funding mechanism set up for URBAN were identified as key hindrances to the effectiveness of the programme. Firstly, the complicated and differing administrative and programmatic requirements associated with ESF and ERDF funding proved difficult to manage and understand at the local management and community project

Ex Post Evaluation of URBAN Community Initiative 1994-1999 Final Report
40
level. This related not only to the funding eligibility of projects but also to the claims procedure following the spend. The second point related to the match funding requirement. This requirement was particularly difficult for small community organisations, therefore preventing them from obtaining funding. In the case of Vienna, complicated budget regulations, linking co-financing from various government departments, together with questions over whether or not activities needed to be co-financed from ESF or ERDF were obstacles towards efficient implementation especially during the early stages.
Levering other existing regeneration programmes as a source of match funding. As mentioned previously, the combination of URBAN with other regeneration initiatives allowed for synergies and minimised the duplication of efforts. In addition, the simultaneous running of these programmes allowed for obvious sources of match funding for the URBAN programme. For example, in a number of UK programmes, SRB served as a source for match funding for the URBAN projects.
The establishment of community chest funds to motivate and encourage participation from small community groups. The community chest funds were set up as a way of encouraging the local community to set up projects and get involved in the regeneration of their area. Compared to the traditional regulations placed upon URBAN funding, these community chest funds were designed for flexible use wherein the community group was given discretion over how to spend the money. While there was risk associated with the administration of these funds, it proved to be a good way to motivate grassroots participation, giving those who normally have no access to funding, the opportunity to gain experience and be involved with the development of their area. In Bremen, the neighbourhood fund, “We for Groepelingen” for the first time involved the local community in the selection and running of projects. In addition to being a flexible fund, the practice of using such funding mechanism became an element of the new regional policy, “Living in Neighbourhoods” and in the new German national urban policy, “Social City – Neighbourhoods with special development needs”. Similarly, the Liverpool programme set up a community chest fund that allowed groups to carry out pilots, feasibility studies and development work.
The establishment of key funds addressed the problems of securing match funding by small community organisations. In order to help small organisations with tight financial resources to work around the requirement for match funding, a system of key funds was established. Essentially, the requirement for match funding remained but the burden of securing it was lifted from community organisations as the match fund was provided through another designated budget. Furthermore, the use of key funds allowed for the application process to be simplified for these community groups, allowing them to gain a track record of delivery through small-scale projects. In some cases, this also provided a means to commit unspent funds. This practice was carried out in the Netherlands where the Ministry of the Interior had an additional budget, as well as in the UK.
Small community groups did not have the cash flow to forward fund their projects. The fact that URBAN funding was paid out to the programmes in arrears proved to be a problem for many small community organisations. Some of these cases were mitigated as the project funds were dispersed upfront by the local authority or the national managing authority as was the case of Liverpool Council in the Liverpool programme.

Ex Post Evaluation of URBAN Community Initiative 1994-1999 Final Report
41
Box 4.5: The Use of Key Funds (UK) In the UK, the national managing authority encouraged programmes to establish key funds, especially in light of the tight programme spending deadline. While the practice did not reduce the bureaucracy and administration, it did shift this burden from small community groups to the programme management team. Some of the key funds within the UK programme included:
Bristol Key Fund
Liverpool Community Chest Fund
London Borough of Brent Match Funding Bank
North Hammersmith Social Enterprise and Community Development Fund
Sheffield Futures Fund
4.5 Networking activities
An important aim of the URBAN Community Initiative I was to undertake networking activities. Networking activities refer to mutual cooperation and exchange of experience and best practice with URBAN programmes in other towns and countries, including non-URBAN towns. This section aims to shed light on the network activities undertaken across EU member states, the concrete outputs and success criteria.
4.5.1 Networking activities undertaken
In general, a small amount of funding was dedicated to networking activities across the EU and in some cases there was no allocation of networking funds. Expenditure for the activities undertaken ranged from 0.1%, to a maximum of 3% of the total budget. The lack of funding allocated to networking activities was due to a combination of factors, including the limited amount of money available in the technical assistance measure and the lack of human resources and administrative capabilities within the programmes. Indeed the lack of networking activities in about 10% of cases highlights a missed opportunity in terms of enriching human resources and sharing information and best practice.
During the implementation of the URBAN initiative, networks between participating cities were established both at the national and international level. This was mainly done in 3 distinct ways:
“Ad hoc” activities. These occurred when programme managers maintained contact with other URBAN programmes and participated in seminars and visits in other member states. These activities also included exchange of information between programme cities and monitoring committees. For example representatives of The Hague visited projects in Antwerp, London, Birmingham and Lyon.

Ex Post Evaluation of URBAN Community Initiative 1994-1999 Final Report
42
Formal events. This involved a programme taking on the responsibility of hosting a conference. These events were usually structured in a workshop or seminar format lasting 1-2 days. They gave project managers the opportunity to meet and exchange ideas with other project managers as well as identify partners. Examples included conferences in The Hague, Malmö, Vienna, Lisbon, Badajoz and Birmingham. Approximately 23% of the programmes attended these conferences at some point during the URBAN I period.
National Networks. These aimed to facilitate communication, exchange of experience and best practice between URBAN programmes in the same country or between those that share the same language. Examples include the German-Austrian URBAN Network, the Ireland Network of URBAN programmes and the URBAN UK Network.
Aalborg is an excellent example case of extensive networking activities encompassing a number of different levels of networking.
Box 4.6: Aalborg networking activities The implementation of the Aalborg URBAN programme was largely built on an extensive networking at two geographical/functional levels: The regional level: the URBAN programme was an active partner in a network of 27 municipalities in the wider region around the City of Aalborg (Nordjyllands Amt). The international level: network building and international ‘follow-up’ of the ‘The Aalborg Charter for Sustainable European Cities and Towns’ adopted one year before the URBAN programme started its activities in Aalborg. These activities resulted in the creation of a broad network of European cities called the ‘European Sustainable Cities & Towns Campaign’. Together with the City of Aalborg the URBAN programme also took an active part in a number of international urban conferences, including those in Lisbon (1996), Vienna (1998) and Rome (1999). There were also a number of bilateral contacts with other URBAN programme cities (e.g. Malmö).
4.5.2 Concrete outputs and impacts of networking
In line with URBAN’s aim to promote networking, activities were undertaken to promote co-operation between programmes. There have been a range of outputs and impacts of these activities:
National networking. In the UK and Ireland the national network was seen as being very valuable as it shared best practise and information across various URBAN Initiatives and other member states. This was also the case in the German - Austrian network which enabled partners to gain concrete knowledge of activities on the ground in all member cities of the network.
Transnational networking. Networking between member states was also an important element of the exchange of experience. The León URBAN I programme manager built contacts with the Leipzig UPP and Leipzig URBAN II, which have led to joint project proposals for other EU programmes. The programme managers stressed that the networking activity was helpful in identifying partners.
Building relationships. In the case of Londonderry, transnational visits provided the opportunity for protestant and catholic representatives to develop meaningful relationships outside their local context. In addition, building on the URBAN networking experience, a partnership was developed between Londonderry, Antwerp, Toledo and Châlon-sur-Sâone as part of INTERREG III.

Ex Post Evaluation of URBAN Community Initiative 1994-1999 Final Report
43
Coventry Hillfields is also a good example of transnational networking.
Box 4.7: Coventry Transnational Networking The Coventry Hillfields team established good links with other URBAN programmes across Europe and held a number of events to share best practice in the implementation of URBAN. The networking involved Coventry (UK), St Etienne (France), Kiel (Germany), Malmö (Sweden); Cork (Ireland); Oeiras (Portugal) and there were also close links with the Birmingham Sparkbrook (UK) programme. The 6 partners agreed that the relationship would focus on building and developing community links in regeneration and would be strategically based rather than focused on projects. Each partner city hosted an event that was thematically based. The process enabled representatives from each city to participate and allowed senior regeneration managers to contribute to strategic developments. The focus was also on exchanging ideas on regeneration, adopting best practice and establishing contacts that would last beyond URBAN.
Exchange of information regarding management structures. In many cases it was felt that networking was particularly useful for exchanging information on management structures and understanding rules which contributed towards helping the programme administration. Participation in the URBAN programme also consolidated relationships between municipal administration and the EU as well as enabling participants to learn more about EU funding opportunities. In Swansea, networking helped to develop experience on how to approach Objective 1 more effectively.
Internal capacity building. Networking activities also played an important role mobilising community groups who otherwise would not have been involved in networking. It proved to be an internal capacity building exercise helping to broaden participants’ knowledge of other EU cities and problems. In Sheffield for example community representatives participated in the 1998 Vienna Conference, which gave them a valuable insight into the workings of the programme at the EU level.
Nonetheless, networking and exchange of experience activities were not as successful as they might have been, as there was little tangible impact on the ground. The outcomes from national and international networking were limited to the exchange of experience. In some cases, the networks that were successful were built on pre-existing relationships rather than as a result of activity from URBAN, as exemplified in the London Hackney and Antwerp programmes. Whilst meetings and exchange of experience were valuable, URBAN programmes were contextually very different and learning and sharing was not always particularly effective. In Bremen for instance, although networking was important for the cities from the former GDR for whom URBAN was new, their challenges were of a very different nature and there was not always very much to be gained from exchange activities. Lastly, in many cases networking achievements were limited because of the administrative burden of the programme.
Although URBAN I did not have a significant impact through networking activities, URBACT aims to address this issue at the EU level during the period 2000-2006. At a national level learning and exchange is also taking place. For example, in Italy some URBAN I cities have been involved in developing capacity through exchange of experience with the new URBAN II cities.

Ex Post Evaluation of URBAN Community Initiative 1994-1999 Final Report
44
4.5.3 Success criteria for networking activities
Factors which contributed towards the success of networking in URBAN fall under four main categories.
Building on existing contacts. A key to success relates to building on existing contacts and ensuring continuity, as was the case in Antwerp. This can help save both time and resources and thus contribute towards more outcomes on the ground.
Common language and regional proximity. It can be advantageous to base networks on a common language for ease of communication or on regional proximity. The German-Austrian network is a prime example combining these two factors. Meetings of the German-Austrian network always took place in one of the member cities – with time to discuss general problems and seek advice and also time to deal with the local URBAN programme, visit projects, talk to partners and gain very concrete knowledge of the activities in other member states. However, the contextual differences between cities and countries must also be taken into account.
Dedicated time and resources. It is important to devote time and resources to participate in conferences and carry out visits to other programmes, as this offers an opportunity to learn about administrative aspects of the programme, to exchange information and best practice, and to enhance knowledge of other European cities’ problems and solutions. Aalborg was an excellent example of this through hosting and participating in conferences and developing bilateral networks with other URBAN programme cities.
Staff capabilities and motivation. It is important to ensure that the staff attending international conferences have not only the language and management skills but are also open to new experiences and ways of working. Because networking has a cost, it is vital that the advantages of networking activities are clearly understood by staff. It is only possible to motivate participants if the outcomes and benefits of networking are well understood. The value added of networking must be made clear at the outset.
4.6 Summary The criteria for the assessment of the effectiveness of each of the URBAN
programmes derived from both the original objectives of the CI established at the European level and member-state specific success criteria. The latter reflected the differing issues faced and various levels of expectation.
Of the sampled programmes, 72% were judged to have been very successful or mostly successful. There was a high level of success across the priority regions Objective 1 and Objective 2 and across the four types of urban area. The majorities of each of the three main types of strategy were judged to have been successful. Around a third of URBAN I areas that adopted ‘flagship’ strategies were considered successful.
As a result of the variety across member states, the factors that either supported or hindered the success of the programmes were many, ranging across the domains of strategy, European and national level management, Programme-level partnership approach and funding.
From the point of view of the national evaluators, the most commonly cited factor supporting success were:

Ex Post Evaluation of URBAN Community Initiative 1994-1999 Final Report
45
- The combination of URBAN with existing regeneration programmes
- The synergies between the combination of selected projects within URBAN.
- The active participation of the local community in aspects of the management and implementation of the programme
From the point of view of the national evaluators, the most commonly cited factors hindering success were:
- The lack of private sector support
- The lack of participation of the local community in the aspects of the management and implementation of the programme
- The difficulties in understanding EC documents and procedures by those involved in the programme
Although initially envisaged as an important part of the overall CI, international networking did not play a significant role in the URBAN programmes. In the cases where it was embraced, it helped to strengthen relationships, build capacity internally, and facilitated information exchange on management issues.

Ex Post Evaluation of URBAN Community Initiative 1994-1999 Final Report
46
5 THE IMPLEMENTATION OF THE URBAN PROGRAMMES
5.1 Introduction
This section assesses the programming cycle (after programme selection) and identifies the variations across URBAN programmes in the processes, structures and actors involved. The factors leading to good management and implementation practice are then examined, with examples from different member states. This assessment is based on a review of 35 URBAN programmes and 2 UPPs across the 15 member states.
5.2 The arrangements for planning, management, implementation and evaluation
5.2.1 Planning
Local and national government were the main actors in the planning process. However the extent to which NGOs and the local community played a major role in planning differed across the range of programmes, reflecting to a certain degree existing practices in each member state. In Bari, for example, the planning phase was performed by I.P.R.E.S. (Puglia Institute for Economic and Social Research), which essentially promoted the interventions, drew up the strategy and co-ordinated the different levels of decision making. In Sheffield, local community groups were involved in writing the URBAN Action Plan. Similarly in Badajoz local stakeholders were involved in programme design in addition to the municipality. In Greece (Volos-Nea Ionia and Keratsini-Drapetsona), projects were drafted by the municipalities with the assistance of the two local development agencies and the University of Thessalia.
Experience in the German programmes revealed that the availability of existing studies and planning documents was a key factor in the timely development of the planning process. In Córdoba URBAN interventions were based on previous experiences with projects integrating renovation and vocational training measures. The URBAN programme also benefited from previous experience with the design of integrated programmes such as a UPP proposal (which had not been approved).
5.2.2 Management and implementation
The types of arrangements for the planning, management and implementation of the URBAN CI differed across the programmes and member states. However the management structures that were set up can be broadly categorised into 3 groups.
1. Municipality (city/regional level) led management and implementation, with bodies composed of EC, regional and city government representatives responsible for management, selection and implementation of the programme. This arrangement tended to involve the use of the relevant municipality’s own resources. This type of structure possibly involved NGOs and local associations and businesses either through project submission or some degree of project implementation. In most cases, local residents and associations were consulted or informed about the programme at various stages of project preparation and implementation.

Ex Post Evaluation of URBAN Community Initiative 1994-1999 Final Report
47
Examples of this type of arrangement included:
The establishment of a Steering Group (with regional and city government, EC and government agency representatives) responsible for the assessment and selection of project proposals, and overseeing overall development of the implementation process.
A coordinating body for programme management composed of local authorities.
An implementation agency or secretariat, whose staff members were from key government organisations and were responsible for implementation and day-to-day management and coordination.
Box 5.1 Management and implementation arrangements in Salerno The Salerno Municipal Administration decided to use its own internal design and management resources. The individual departments and offices directly involved in the various measures were responsible for administering the programme. Co-ordination of that administration was the responsibility of the “Studies-Programming Resources and Community Policies Service” officially attached to the Mayor’s staff. Decisions regarding the implementation of the programme were taken in joint agreement with the departments concerned as the need arose. The Municipal Administration decided not to outsource the monitoring of the programme, as it felt that the Co-ordination Office was capable of acquiring and processing the requested information on schedule. An “URBAN Observatory” was set up. Its functions were to inform people in the district and in the city of the programme; to organise local partnerships; to act as a permanent interface between the district and the decision making power; and to provide processing and technical-administrative support to the programme.
This type of arrangement, although not based on the formal engagement of non-government partners, was nevertheless considered innovative in bringing together different government organisations. For example this was achieved through local authorities working together for the first time, separate levels in government hierarchy making decisions on an equal basis, or different departments within government organisations coming together and making decisions through an integrated process.
2. Committee arrangement with partnerships between regional and municipal government, institutions and local community organisations. In this type of arrangement, the overall programme management was carried out in most cases by the municipality or regional government, but there was a very clear involvement of local, non-governmental actors in project selection and implementation. For example in Valencia, the programme was managed by the city’s regional administration (“Generalitat Valenciana”). The sub-programme “Economic development” was implemented by means of a cooperation agreement with the local carpenter-artisans’ association (“Gremio de Maestros Artesanos Carpinteros”).
In other cases, both the monitoring and management/steering committees were composed of a range of government and non-government actors, without the overall leadership of municipal or town government. In some instances the municipality employed the services of a private consultancy for technical assistance. Another example of community participation under this type of arrangement was the establishment of a specific committee or partnership that included local stakeholder representation, the role of which was to ensure involvement of local actors and dialogue with local government.

Ex Post Evaluation of URBAN Community Initiative 1994-1999 Final Report
48
3. A body set up as a separate legal entity to manage and/or implement the programme. This body may have been composed of local government, national/regional government, regional institutions, NGOs, local community and private sector representatives. Examples of this type of arrangement were:
Strathclyde European Partnership Ltd (SEP Ltd) which is the Programme Management Executive who manage and administer European Structural Funds in Western Scotland. Other bodies were set up specifically for the Glasgow URBAN Programme and worked in coordination with SEP Ltd.
The “Groupement d’Interêt Public” (GIP) set up in Aulnay-sous-Bois. A GIP is an independent legal body which allows the association of public bodies, and organisations for a certain period in order to manage a project of general interest. This organisation provided a focus for the different social and urban policies in Aulnay and implemented and coordinated the projects defined as part of URBAN I and existing urban policy.
The Marxloh Development Company (a private company whose main shareholders were the local authorities) and the Neighbourhood Project (a decentralised section of the local authorities), which were both responsible for the management and implementation of the URBAN Programme.
An organisation created to manage the Porto URBAN programme, the Foundation for the Development of the Valley of Campanha. Members included local administration, technical institutions and local civil society representatives.
The bodies usually worked together with monitoring committees for the URBAN Programme. They were either led by the municipality, or held regular consultations with local authorities and regional/national government in order to garner support and obtain necessary political decisions at a higher level.
The nature of these types of arrangements and the extent of local community participation were linked to the existing administrative structures in the area. Local stakeholder engagement was practised to a greater degree in areas which were used to involving the community in project generation and implementation.
Where there was a tradition of strong political figures who had the motivation and power to carry out change, municipality-led management and implementation, as in the Type 1 management structure, was likely to be successful in delivering the URBAN programme, as was the case in Italy. Conversely, if there was less commitment, the programme risked being less successful.
In countries such as the UK and the Netherlands there is traditionally more experience of community involvement. This is one of the reasons that the programmes in these member states were managed mostly under Type 2. The structures which enabled the community to be involved in many aspects of decision-making and implementation were already in place, thus facilitating the process under the URBAN I Programme.
Experience was one of the key factors in setting up Type 3 management structures. Scotland has had many years’ experience in administrating SF programmes and has set up a special body to carry out this task. The organisations set up for the URBAN I programmes in France reflected that fact that there was an active national urban policy which was being implemented at the time.

Ex Post Evaluation of URBAN Community Initiative 1994-1999 Final Report
49
There is no evidence to suggest that any one of these 3 types of management structures has led to more successful URBAN programme management. Rather, the suitability of the management structures was dependent on how they reflected existing practices, tradition and experience: whether they be top-down government led; a separate body removed from formal government administration; or bottom-up with strong community engagement.
Management and Implementation Costs
Data on management and implementation costs were very difficult to obtain. Some of the reasons for this were: that management costs were internalised within the management organisation’s existing costs; and the difficulty in attributing the cost of staff working both on URBAN as well as on other programmes. In some cases technical assistance costs were given as proxy management costs. In other cases, the definition of the management costs varied from the number of additional staff employed, to the purchase of additional equipment. The data collected were not therefore strictly comparable.
Looking in detail at some of the programmes, however, provides an insight into what might be the typical management costs of an URBAN programme. In North Dublin, 4 staff were employed full time for the three years during which the programme was running. Similarly, on average 3.5 staff were employed in the London Hackney programme. In addition, the partnerships that were involved in administration of the programme within the North Dublin sub-areas also incurred administrative costs. In total, 5.6% of overall the programme costs were allocated to management and implementation.
Despite the lack of reliable data it is estimated that, on average, the URBAN programme management and implementation costs were around 6% of overall investment. Therefore, although the management of URBAN was complicated, there is little evidence to support the suggestion that an un-due volume of resources were spent on managing the URBAN I CI. Details of management and implementation costs are provided in Annex 9.
5.2.3 Role of the European Commission
At the time of the URBAN I CI there was no dedicated urban policy unit within the EC: it was integrated within other responsibilities within the EC. The desk officers had contact with the URBAN I programmes, although they were also responsible for other European funding programmes in the same region. These desk officers would usually represent the EC on the Steering and Monitoring Committees, where there was EC representation. The EC did set up a Technical Assistance Office for the Urban Pilot Projects which carried out an interim assessment of the URBAN I Programme in 1998.
There appears to have been very few direct linkages between the EC and local managing authorities. Most communication with the Commission was carried out at the national level. The direct involvement of the EC in the implementation of URBAN therefore appears to have been restricted to representation on the Monitoring (and sometimes Steering) Committees.
5.2.4 Project selection
Local community and associations were involved to a varying degree in the project selection process for URBAN I. In many cases, local government/municipalities

Ex Post Evaluation of URBAN Community Initiative 1994-1999 Final Report
50
submitted projects which were selected by a steering committee or governmental department, with no community involvement. This was the case for the programmes in Spain. In other cases, projects were submitted by NGOs and local stakeholders, who were assisted by the local project office which would pre-select projects. These would then be submitted to the decision-making steering or monitoring committee.
At the other end of the scale, for example in the UK and Ireland, local communities were involved at all stages from project selection to approval, with projects being assessed against criteria of community needs and acceptance. However, this had the potential to give rise to possible conflict of interest. For example in the Park Royal (London) URBAN, the local community representatives on the selection committees were in many instances also project proponents. Arrangements were made whereby these committee members were not involved in the selection of their particular projects.
Box 5.2 Sheffield: involvement of the local community in project selection An evaluation/appraisal sub-group of the Partnership Group (responsible for implementation) was set up to appraise project proposals, using a community-devised scoring system, relating to need, demand, justification, and fit with the Action Plan. Recommendations were then made to the Partnership Group. All projects were endorsed by the local community before they went for appraisal. This was a key part of the community’s involvement, and helped to build a sense of ownership.
5.2.5 Programme Evaluation
The extent to which the URBAN programmes were subject to an evaluation differed greatly. In Finland, a detailed mid-term evaluation was undertaken covering both the Helsinki-Vantaa and Joensuu programmes. For many programmes, however, no, or limited evaluation was carried out. For at least 21% of programmes ex-post evaluations were carried out by external evaluators, with the collection of survey data and indicators. In Santa Coloma de Grameret for example, the monitoring and evaluation focussed on the overall programme as well as on specific aspects such as the citizen participation model used in the URBAN Programme. Other programmes did carry out monitoring, with financial indicators being collected, and sometimes physical indicators, but no formal ex-post evaluation or collection of qualitative indicators to evaluate programme impacts or objectives.
At the time of URBAN’s introduction, the culture of monitoring and evaluation was not very strong, and some member states did not have well developed data collection systems. As a result, the indicators used to track the achievements of the programme were at times poorly defined, and in some cases, did not reflect the substance of the programme. Indeed many of URBAN’s achievements did not lend themselves to hard quantification [such as establishing partnerships, or strengthening social capital]. A lack of indicators often inhibited a proper evaluation from being carried out. Lack of resources was also quoted as a reason for insufficient monitoring and evaluation.
However, URBAN was also responsible for encouraging a culture of monitoring and assessment in some cities such as Bari, a practice which has continued and been strengthened beyond the life of the programme.
The UPPs examined in this section (Bilbao and Falun) both put in place strong evaluation and monitoring procedures involving ex-ante, mid-term and ex-post evaluations, and including studies on perceptions of change by key actors and beneficiaries. This process was facilitated by the UPP Technical Assistance Office.

Ex Post Evaluation of URBAN Community Initiative 1994-1999 Final Report
51
5.3 Key factors in management and implementation
The key factors contributing to and hindering the efficiency of management and implementation of the programmes are described below. The factors are discussed in descending order of importance, as ranked by the national evaluators, in relation to their contribution to programme management and implementation.
Participation of the local community in aspects of project selection, management and implementation. One of the key innovations of the URBAN I Programme was the requirement to involve local actors in the process, which has brought many benefits. The ranking of factors in Section 4 shows that this was considered one of the main factors for success of the URBAN CI. Conversely, lack of participation of the local community in aspects of management and implementation was found to be the second most important factor hindering success of the programmes.
The extent of involvement is influenced by the role of community representatives: either decision-making or advisory. The Cork programme found that cost savings could be achieved by devolving responsibility to local bodies. In addition, allowing beneficiary groups to manage projects meant that the programme was successful at tapping into social capital and empowerment.
In Rotterdam, the inclusion of local organisations that had a relatively strong involvement with immigrants was very effective in reaching this social group. The involvement of all stakeholders in the Córdoba programme resulted in broad support for URBAN interventions (despite the more advisory nature of their involvement). One of the strengths of the programme at Santa Coloma de Grameret was the strong participatory approach which led to strengthened local community associations interested in participating and contributing to the urban rehabilitation effort.
Despite the numerous advantages of devolving management and implementation to the local level, many programmes found that it was also a source of hindrance. For example, in Cork, it led to a lack of central, cohesive strategy to bind individual projects. Several programmes also found that local involvement delayed the decision-making process. For example Birmingham found that working with the community sector was an overly lengthy process and that in hindsight they would have preferred to have used dedicated staff to manage the process. However, the positive contribution of local actors in programme management and implementation is generally considered to outweigh the inconvenience caused by time lost through their involvement.
Many of the programme evaluations showed that there was insufficient involvement of the local community in programme implementation. The disadvantages of this were manifold, as the examples below indicate, including lack of ownership of the process, and therefore the project; and projects being developed which were not relevant to community needs.
For example the approach to project management and implementation in Salerno was very top-down, discouraging community participation. This led to a lack of understanding of the regeneration needs of businesses and residents in the affected areas. A perceived weakness in the León programme was the limited influence of the body responsible for involving the local community, the “Comité de participación”. It

Ex Post Evaluation of URBAN Community Initiative 1994-1999 Final Report
52
allowed information to be passed to the local community, but no real opportunity for making proposals for changes.
Integrated and simple approach to programme management and implementation. In conjunction with partnership working, the integrated approach advocated by URBAN I was seen as one of the key success factors. This was especially the case in the context of the URBAN programme implementation. Because of the integrated management structure employed in Joensuu, decision-making was efficient, fluent and fast. In the same way, the new integrated management structure adopted in Porto represented less bureaucracy than in the past. In Duisburg, the URBAN programme created a development company responsible for the management of all public resources, establishing an efficient and democratic system. The Hague URBAN programme found that a clear division of tasks assisted in its efficient implementation.
Strong partnerships and cooperation. Strong partnerships were an important component of success of the URBAN Programme. Building partnerships which were well coordinated and long-lasting were important to create an effective management structure, as exemplified by many of the case studies.
The main strength of the Aalborg URBAN management structure was the broad and unusual mix of decision makers and the quite independent operative level. In Helsinki-Vantaa, the Management Committee was shared by both cities, giving a good structure to the programme work and communication. The Mulhouse programme found that working in partnership between different council hierarchies meant that a common approach was adopted, working towards everyone’s objectives.
Working in partnership within different divisions in the same organisation and with other organisations did however add to the complexity of some programmes. This was the case in Aulnay-sous-Bois where the different levels of hierarchy slowed the decision process. Similarly in Lyon, all decisions had to be made collectively, which made the process lengthy and delayed project implementation. In Aalborg, one problem was the difficulty adapting to the ‘multi-sector’ approach of the URBAN projects within the traditionally ‘sector-oriented’ municipal bureaucracy. This created various co-ordination problems and delayed some of the URBAN interventions. For Malmö, the complex monitoring and operational structure required significant technical and economic resources. This created some problems and delays in the implementation of the programme, especially at the start of the intervention period.
In a slightly different slant on this theme the Vienna example illustrates how important it is to think carefully before putting in place the programme implementation structures. Although different players were brought together in one local office, they found it difficult to be responsible for the programme whilst being removed from the decision-making processes located more centrally.
Leadership in the day to day management and overall implementation of the programme. Although not considered as crucial as the factors above, streamlined structures and leadership qualities in the individuals involved in the programme implementation were nevertheless important factors in the effective management and implementation of projects.
The management of the Greek programmes (originally the Management Committee’s role) was taken over by a Managing Authority set up by a motivated and capable

Ex Post Evaluation of URBAN Community Initiative 1994-1999 Final Report
53
individual to the benefit of the implementation process. In Dublin, the establishment of a limited company and a board of directors provided a useful focus for the programme. The Salerno programme identified individuals with an entrepreneurial spirit for the management and implementation of projects. This encouraged better cooperation and ultimately successful initiatives. In Erfurt, the efficiency of a Planning Department employee responsible for implementation of the programme minimised initial implementation delays through comprehensive guidance and strict control of the process. In Lyon, hiring coordinators to link the public and private sector actors on the programme was considered good practice. The Marseille programme funded two project managers with the specific role of stimulating economic regeneration, which proved to be effective.
Capacity and experience. The lack of capacity to embrace the new structures and systems accompanying the URBAN I Programme was perceived in many cases as one of the problems facing good management of the process. Even those member states with previous experience of SF encountered some of these problems. The Brussels programme felt that there were weaknesses relating to the lack of experience of the project management structure and specific requirements of EU programmes.
In Helsinki, the existing management structure of the city did not support the management structure of the programme and organisations outside the cities were excluded from the management. The Bari programme experienced unease in giving the responsibility of managing all projects to an office of only three staff. The Hague found that the lack of experience of the financial and administrative procedures required of project managers was a barrier to the involvement of local organisations in the programme. The complex management structure in the Malmö programme meant that there was a lack of resources at the operative programme level especially at the start. In the Swansea programme, timing was initially slow and the programme took longer than expected to set up because of the capacity building time required amongst the community and amongst partner agencies.
5.4 Summary Local and national governments were the main actors in the planning process.
The extent to which the local community played a major role differed between the programmes.
Three types of management structures were identified:
- Municipality led management and implementation with some community level consultation;
- Committee arrangements with partnerships between regional and municipal government, institutions and the local community; and
- Management led by a body set up as a separate legal entity, either at the local, city or regional level, and including representatives from a variety of levels of governance and sectors.
The nature of these arrangements and the extent of local community participation were linked to the existing administrative structures in the area. The suitability of each type of management structure was dependent upon the existing practices, traditions and experiences in each area.
The management costs are estimated on average to be around 6% of the total budget.

Ex Post Evaluation of URBAN Community Initiative 1994-1999 Final Report
54
Local community and associations were involved to varying degrees in the project selection process for URBAN I. At least 21% of URBAN programmes carried out detailed evaluations using external evaluators.
Key factors affecting the success of implementation and management, in descending order of importance, were:
- Participation of the local community in aspects of project selection, management and implementation.
- An integrated and straightforward approach to programme management and implementation.
- Strong partnerships and cooperation. - Leadership in the day to day management and overall implementation of
the programme. - Capacity and experience.

Ex Post Evaluation of URBAN Community Initiative 1994-1999 Final Report
55
6 THE IMPACT OF URBAN
6.1 Introduction
The wide range of measures eligible under the URBAN CI, together with the variety of local urban contexts and challenges, have led to the impact of the CI being multi-fold and highly variable.
The national evaluators were asked to assess the impact of each URBAN programme within their member state. For each programme, the national evaluator was asked to indicate whether or not each described impact was applicable to the programme.
The potential impacts spread across all aspects of the urban policy arena: physical endowment, socio-economic conditions and quality of life, image, surrounding areas, institutional and governance structures, urban management approaches, and urban strategies at the local, regional and national levels.
The results of this assessment are provided in the summary table below. It shows the frequency with which each impact was identified at the overall EU level, ranked in order of the number citations. At the level of each member state, the chart provides the ranked order of the frequency of each impact. Each of these impacts is discussed with examples, in order of frequency. The impacts of each of the individual URBAN programmes are described in Annex 6.
The evaluation also assessed the impact of URBAN on the perception of residents and non-residents in the target area. The results of the perception survey are also reported in this section.
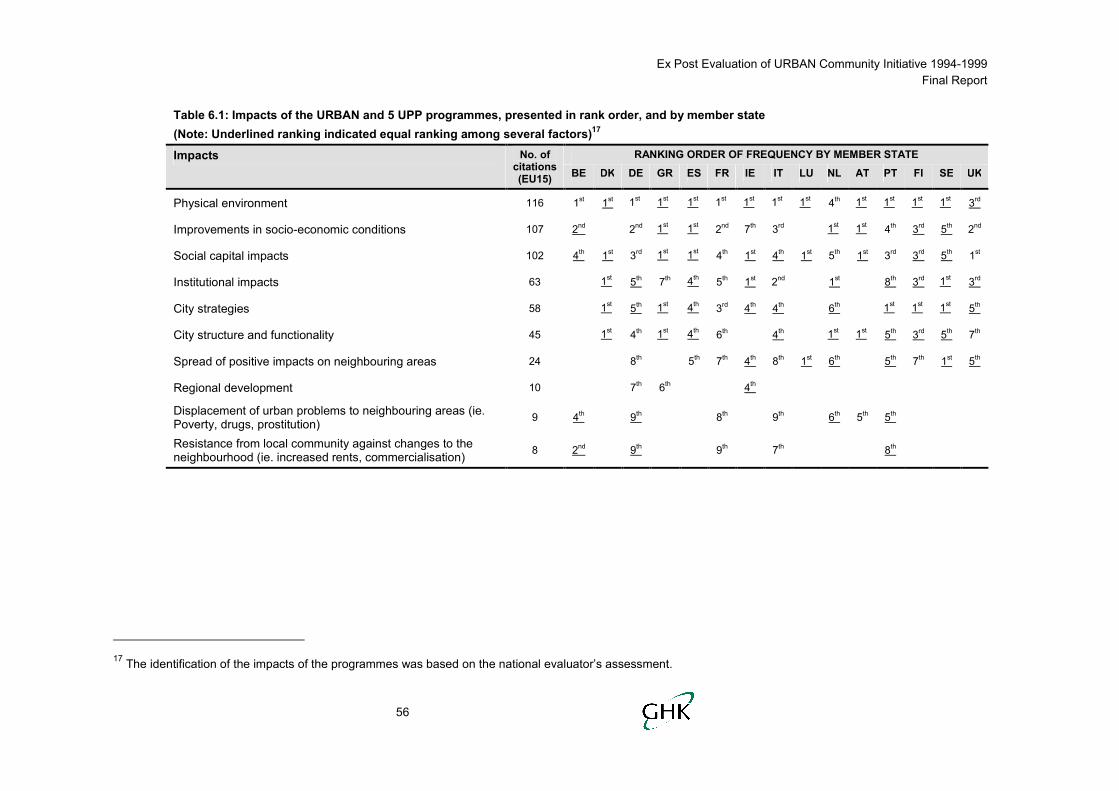
Ex Post Evaluation of URBAN Community Initiative 1994-1999 Final Report
56
Table 6.1: Impacts of the URBAN and 5 UPP programmes, presented in rank order, and by member state (Note: Underlined ranking indicated equal ranking among several factors)17
RANKING ORDER OF FREQUENCY BY MEMBER STATE Impacts No. of citations (EU15) BE DK DE GR ES FR IE IT LU NL AT PT FI SE UK
Physical environment 116 1st 1st 1st 1st 1st 1st 1st 1st 1st 4th 1st 1st 1st 1st 3rd
Improvements in socio-economic conditions 107 2nd 2nd 1st 1st 2nd 7th 3rd 1st 1st 4th 3rd 5th 2nd
Social capital impacts 102 4th 1st 3rd 1st 1st 4th 1st 4th 1st 5th 1st 3rd 3rd 5th 1st
Institutional impacts 63 1st 5th 7th 4th 5th 1st 2nd 1st 8th 3rd 1st 3rd
City strategies 58 1st 5th 1st 4th 3rd 4th 4th 6th 1st 1st 1st 5th
City structure and functionality 45 1st 4th 1st 4th 6th 4th 1st 1st 5th 3rd 5th 7th
Spread of positive impacts on neighbouring areas 24 8th 5th 7th 4th 8th 1st 6th 5th 7th 1st 5th
Regional development 10 7th 6th 4th
Displacement of urban problems to neighbouring areas (ie. Poverty, drugs, prostitution) 9 4th 9th 8th 9th 6th 5th 5th
Resistance from local community against changes to the neighbourhood (ie. increased rents, commercialisation) 8 2nd 9th 9th 7th 8th
17 The identification of the impacts of the programmes was based on the national evaluator’s assessment.

Ex Post Evaluation of URBAN Community Initiative 1994-1999 Final Report
6.2 Physical environment
In more than 90% of programmes, URBAN achieved improvements to the physical endowment of the designated URBAN area. The extent of this impact differed between member states, ranging from neighbourhood scale improvements to renovations and conversions of individual buildings or construction of new infrastructure. In some cases, the direct contribution of URBAN to changes in the physical environment encouraged residents of the area to also make improvements to their own property. More specifically, some of these impacts include:
León. The URBAN programme led to both infrastructure improvement (urbanisation in ‘Zona Antibiotcos’ and renovation of Calle Quevedo) and to construction of new infrastructure (a bridge – San Juan De Dios, road access – Ronda Interior Urbana, a business incubator – Vivero de Empresas León Oeste, and social facilities – Complejo Abello and Centro Civico León Oeste).
Siracusa. The Ortigia area had been an abandoned district for some time. Today, the process of rehabilitating this derelict neighbourhood has begun. URBAN provided a catalyst for this process that has slowly seen the return of residents to the area, due to improvements in the physical environment.
Vienna. Several physical interventions carried out in this programme focused on the conversion of existing infrastructure. Public space was integrated into an existing housing block and designed to serve the needs of elderly people. Similarly, the spaces underneath the arches of an overland tramline were configured for various purposes including shops, craftwork studios, and cultural spaces. Although such interventions were fundamentally important in renewing the functions of the urban space, the large size of the programme area did not allow these changes to create an impact on the regeneration of the area as a whole.
In addition to these neighbourhood scale impacts of URBAN to the physical environment, the programmes also led to the construction of facilities and community centres which served to support the social projects funded by the programme.
Bremen. ‘Lichthaus’ was a centre built to provide workspace for business start ups. It included 20 offices, together with conference facilities, exhibition spaces and a restaurant. In addition, a new cultural centre was constructed, offering various services and activities for the local community. Services for disadvantaged groups and families were provided through an integrated service centre.
Rotterdam. The Schiecentrale project saw the conversion of an old power plant into a media and ICT centre. The centre provided space to business start ups within the ICT and audio visual sectors, while indirectly contributing to the economic activity of the Delfshaven area.
6.3 Socio-economic conditions within the URBAN areas
Just as important as the improvements to the physical environment were the improvements to socio-economic conditions (cited in 89% of programmes). These included the creation of jobs, the provision of job training, supporting new businesses and increasing provision of social services to support and address the needs of the communities.

Ex Post Evaluation of URBAN Community Initiative 1994-1999 Final Report
58
Barakaldo. The programme provided new social facilities, through the Centro de Servicios Sociales and Centro de Día to address the needs of the target area’s population threatened by social exclusion including elderly people, mentally disabled people, women and young people. Through the projects carried out under the economic development measure, advisory services and facilities for new and existing businesses were set up. By the end of the programme, there had been a significant drop in the level of unemployment in the target area.
Lisbon-Casal Ventoso and Gondoma. Working in conjunction with other urban redevelopment programmes run by the municipality, the programme provided new houses for families living in slum conditions, as well as improving the commercial retail provision and local employment initiatives.
Yet, these improvements in the overall socio-economic conditions need to be considered against a number of other realities which have begun to set in as a result of URBAN, including the following:
Marseilles. A by-product of the improvements brought about by URBAN include an increase in rental prices and the level of taxes within the area.
Rostock. Similarly, the unregulated changes to the area brought about by the programme has led to a process of gentrification which has had a tendency to drive many socially disadvantaged people out of the area.
Salerno. While one of the objectives of URBAN was to start up new businesses in the area, the threat of over-commercialisation was a cause for residents’ concern as the volume of shoppers increased. This resulted in street protests, and demonstrated the potential negative consequences of a regeneration programme based on encouraging commercial facilities.
6.4 Social capital impacts
The sustained impact of the benefits described above has been an increase in social capital in the programme areas, as seen in 85% of programmes. While to a large extent intangible, the change in the image of the area, a build up in the confidence of residents, the improved feeling of safety, and increased sense of community were important benefits. Empowered residents and community organisations were more active in efforts to improve the area. Consequently, an improved area was then better able to attract business and economic activity. This is illustrated in the following examples:
Magdeburg. Owners of SMEs in the area joined together during the implementation of URBAN and, to date, have sustained their association and continue to be active in the economic development of their area. Likewise, a group of very committed and vocal residents were involved in the implementation of the URBAN programme for their area. Established as the Citizen’s Advisory Council, the group is currently active in community based work, well beyond the end of URBAN I.
Castellón. One of the measures under this programme focused on motivating parents, residents as well as local charities to participate in community and cultural activities in an effort to strengthen the feeling of belonging to the neighbourhood.

Ex Post Evaluation of URBAN Community Initiative 1994-1999 Final Report
59
6.5 Institutional impacts
One of the most wide-spread and lasting impacts of the URBAN CI was in the institutional structures and processes involved in tackling issues of regeneration (cited in 53% of programmes). This extended beyond the URBAN I programme period. For all member states, the experience of URBAN either introduced or further emphasized the paradigm shift in the approach to urban regeneration programmes: community-led rather than government-led; multidisciplinary (physical, economic, social, environmental) rather than singular focus; cooperative rather than exclusionary. Furthermore, there was a recognition that managing and implementing a successful regeneration effort requires a solid foundation of a data driven needs analysis and preparation, monitoring systems and an evaluation methodology. Some of the cases include:
Helsinki-Vantaa, Genova, Bristol. For these three cities, the experience of URBAN I directly fed into and informed the planning and delivery of URBAN II. In the case of Bristol, this also extended to influencing the delivery of Objective 2 funding.
Cork. URBAN’s biggest impact was that it set a precedent involving community groups in project implementation through the establishment of a company that also included local authority and other representatives.
Magdeburg. The partnership formed under URBAN I has been maintained and now operates on a regional level (Regional Management for the Region of Magdeburg). In addition, the membership of the Chamber of Crafts and the Chamber of Trade and Industry in the partnership was ground breaking.
Avilés. For the first time, URBAN allowed for a joint urban rehabilitation effort between Avilés and Corvera, setting an example for cross boundary cooperation.
6.6 City strategies
In general, URBAN I introduced a strategy to regeneration which assessed multiple aspects of the urban environment rather than the traditional one-dimension focus, usually on physical infrastructure (cited as an impact in 48% of programmes). For example:
Aalborg. Urban policy changed to combine environmental issues with land use planning, investment in the built environment and economic, social and participatory initiatives at the neighbourhood level.
Roubaix-Tourcoing. Economic development was better integrated into urban policy.
Valenciennes and Brussels. The socio-economic dimension was brought into urban policy.
Bremen. The ‘soft’ elements of regeneration were integrated with physical aspects.
On the other hand, URBAN had less impact on member states that had already established similar urban regeneration policies. Such was the case in the UK and in the Netherlands. In the UK, the URBAN model was very similar to other area based regeneration policies such as the Single Regeneration Budget.
Ex Post Evaluation of URBAN Community Initiative 1994-1999 Final Report
60
6.7 City Structure and Functionality
In the case of a number of programmes (38%), URBAN had an impact on the overall structure and function of the target programme area. This included the reuse of existing physical structures from original functions to new functions, fitting with the needs of the area. For example, in
Rostock. The physical appearance has completely changed particularly with the insertion of new economic activities such as pubs, cafés, restaurants and shops, in a previously predominantly residential area.
Cosenza. The programme was designed around the abandoned railway network. The tracks (a barrier between the city centre and residential areas) were turned into an avenue, to attract investment and integrate the targeted outlying area with the rest of the city. The former railway station was turned into a centre for telematics services. Shopkeepers and craftsmen were offered incentives to locate in the old city centre.
6.8 Neighbouring areas
Overall, the impact of the URBAN programmes on neighbourhoods surrounding the target programme areas was small. In around 20% of the programmes, interventions were seen to impact positively on neighbouring areas. For example, the following programmes generated positive impacts:
Malmö. The programme provided some benefit to neighbouring areas as the newly created businesses provided jobs to people from outside the area. The awareness of the issues of sustainability were also spread beyond the immediate programme area.
León. The programme had a considerable impact in overcoming the long-standing barrier between the target area and the rest of the city. Prior to URBAN, the residents from neighbouring areas would not visit the target area due to the poor image and the perception that the area had a lack of security and services and no places of interest.
Londonderry. URBAN sparked interest in neighbouring areas in the partnership approach, particularly with government. Also, neighbouring areas were able to use and benefit from the experience and good practice resulting from the implementation of URBAN in the target area.
Swansea. Swansea City Council, keen to replicate the success of URBAN, decided to introduce regeneration programmes in 10 other areas of the city, based directly on the community partnership approach.
Helsinki. While some of the services provided within the URBAN area have been accessed by neighbouring areas, the projects have raised a discussion between residential areas about the equity of funding allocation in one area over another.
However, in 7% of programmes, URBAN was seen to impact negatively on neighbouring areas, for example in the following programmes:

Ex Post Evaluation of URBAN Community Initiative 1994-1999 Final Report
61
Graz. There was some indication that the improvements made within the area led to the displacement of the activities of the ‘red light district’ to the adjacent neighbourhoods.
Rostock. As a result of the process of gentrification that has been brought about by URBAN, parts of the socially disadvantaged population have been pushed into neighbouring areas.
6.9 Regional Development
There were a limited number of cases (8%) where the work of URBAN had an impact at the wider regional level. In these examples, URBAN contributed to the overall development of the region, by bridging the gap between those urban areas that were lagging behind and the rest of the region’s development.
Amiens. The designated programme area was located adjacent to a new business zone, developed as a result of the regional development strategy. In order not to compromise the success of the new development, improvement and upgrading of the URBAN programme area was necessary.
Cadiz, Córdoba, Huelva, Malaga, Seville. These programmes in the southern Spanish region of Andalucia were an important part of the overall regional development plan, drawn up under Objective 1, and contributed (along with other EU interventions such as the Territorial Employment Pacts (TEP) and Leader) to the region’s economic development.
6.10 Perception of the URBAN areas
In order to investigate public perceptions of URBAN, street surveys were carried out in 35 programme areas. The aim of the surveys was to investigate whether residents and non-residents perceived that the URBAN target area had changed over the previous 10 years, to assess their awareness of the URBAN Community Initiative and whether the changes could be attributed to URBAN or other factors. The overall objective was to obtain insights into what people on the ground thought about their neighbourhood.
6.10.1 Changes in the perception/image of the URBAN area
Based on the analysis of both the results of the survey and individual programme assessments, the general impression is that the target areas have improved over the last 10 years. Across all member states 68% of respondents felt that the built environment had improved or greatly improved and 49% felt that the URABAN target area’s desirability as a place to live had increased over the past 10 years. Respondents in Ireland perceived the greatest improvements in the physical environment with 33% of respondents claiming that it had greatly improved over the past 10 years. The Greek and the French respondents indicated the highest levels of positive change across all categories. The Portuguese respondents, on the other hand expressed the strongest perception that things have become a little worse, in particular relating to employment opportunities, with 20% of respondents claiming it had become a lot worse.

Ex Post Evaluation of URBAN Community Initiative 1994-1999 Final Report
62
Table 6.2: Perception of whether URBAN target area has changed across categories in all member states
Greatly
improved Improved Same A little worse
A lot worse
Don’t know Total
# % # % # % # % # % # % # %
Built environment 258 24% 476 44% 218 20% 64 6% 39 4% 31 3% 1086 100%
Natural environment 129 12% 358 33% 411 38% 90 8% 47 4% 51 5% 1086 100%
Employment opportunities 50 5% 195 18% 339 31% 178 16% 84 8% 240 22% 1086 100%
Public services 84 8% 381 35% 375 35% 81 7% 24 2% 141 13% 1086 100%
Desirability as a place to live 140 13% 396 36% 310 29% 123 11% 33 3% 84 8% 1086 100%
Sense of community 63 6% 264 24% 356 33% 65 6% 24 2% 314 29% 1086 100%
6.10.2 Awareness of URBAN Programme in the area
In terms of awareness of URBAN across member states, some 35% of respondents were aware of URBAN. Overall, residents (62%) tended to be more aware of the programmes than non-residents (38%), as did those between the ages of 35-49 (39%). This is probably because residents are directly affected by any changes and would be more likely to notice them. Gender does not make a significant difference on residents’ awareness of URBAN.
In Vienna, the survey results indicated that in a large programme area it can be difficult to create awareness of a programme like URBAN. In places where significant and visible interventions took place respondents expressed positive responses. Those living further from the target area’s focal point were more ambivalent and knew less about URBAN.
Table 6.3: Awareness of URBAN
Respondents awareness of URBAN Respondents %
Aware 386 35% Unaware 700 65%
Total 1086 100%
6.10.3 Awareness in member states
Levels of awareness regarding URBAN in member states varied substantially, ranging from 10% in Belgium to 63% in Spain. Indeed only respondents in Italy and Spain display awareness levels of over 50%.
In Italy, a difference in levels of awareness was noted between projects located in the city centre and those in the periphery. In Rome, where the target area was located in the city fringe only 7 out of 40 respondents knew about the URBAN programme. In Bari’s historic centre target area, on the other hand there was a higher level of awareness with 22 out of 40 people claiming to know about URBAN. This could be attributed to how information was disseminated in different areas as well as levels of publicity and public involvement.

Ex Post Evaluation of URBAN Community Initiative 1994-1999 Final Report
63
6.10.4 Link between changes of perception and URBAN
According to the data, the changes taking place in the target areas have mostly been attributed to URBAN rather than other factors, where respondents had a view. For example, of those aware of URBAN 37% said changes to the built environment were due to URBAN (see Table 6.4). In Greece for instance, almost all improvements were attributed to URBAN, except in the case of the built environment where 40% of respondents attributed change to “URBAN and other factors”. The same is true for both Italy and Spain which demonstrated high levels of URBAN programme awareness. In Ireland on the other hand most respondents felt that other factors were responsible for the improvements in the targeted areas, in particular the “Celtic tiger” phenomenon.
However, evidence summarised in Table 6.4 suggests that, for those that expressed a view, it is difficult to give all credit for the enhanced image of the target areas to URBAN. Other factors responsible for improvements in the target areas were attributed to the local authority, the population itself, other community organisations and improvements in the economy. For example the City of Aalborg was very active in the areas of traffic planning and urban revitalisation, and the URBAN programme was therefore regarded as one amongst a number of other positive factors that enhanced the image of the target area during the programme period.
Table 6.4: Attribution of change across selected aspects of the URBAN programme area
URBAN Other factors Both URBAN
and other factors
Don’t know Total
# % # % # % # % # %
Built environment 142 37% 26 7% 38 10% 180 47% 386 100%
Green areas 128 33% 16 4% 27 7% 215 56% 386 100% Employment Opportunities 76 20% 29 8% 22 6% 259 67% 386 100%
Public services 93 24% 22 6% 28 7% 243 63% 386 100%
Desirability as a place to
live 103 27% 15 4% 41 11% 227 59% 386 100%
Sense of community 82 21% 20 5% 23 6% 261 68% 386 100%
6.11 Summary The URBAN programme had a variety of impacts at different spatial scales,
ranging from the local neighbourhood to the city level, and less commonly, at the regional level.
The three most commonly cited impacts of the URBAN programmes were:
- Impacts on the physical environmental
- Improvements in socio-economic conditions; and
- Social capital impacts.
These were all cited as being significant in over 80% of the URBAN programmes.
Other impacts that were also significant to a lesser degree included:

Ex Post Evaluation of URBAN Community Initiative 1994-1999 Final Report
64
- Changes to institutional and governance structures
- Influence on city strategies
- Impacts on city structure and functionality
Around 20% of programmes also had a positive impact on neighbouring areas. In addition, 7% of programmes had a negative impact on neighbouring areas, mostly due to the displacement of activities.
Minor impacts included influencing regional development, and the negative impact of sparking resistance from local communities to changes in their neighbourhood.
One of the most sustainable impacts from URBAN was the lasting change in the approach to urban regeneration. URBAN encouraged a move away from the usual practice of single sector working, to the integration of various stakeholders across different departments, including the community.
From the street survey, those interviewed perceived significant improvements in many aspects of the quality of life in their neighbourhood. This was particularly the true for improvements in the built environment.
35% of respondents overall were aware of the URBAN programme, although this percentage varied considerably between member states.
Of those respondents who were aware of URBAN, the majority who expressed a view, attributed neighbourhood change to the programme. Other factors were also cited, including the local authority, the population itself, community organisations, and improvements in the economy.

Ex Post Evaluation of URBAN Community Initiative 1994-1999 Final Report
65
7 THE COMMUNITY VALUE ADDED OF URBAN
7.1 Introduction
This section considers the extent to which implementing URBAN I at the Community level added value in comparison with implementation at the national and regional levels of interventions pursuing similar aims. The Terms of Reference identified a number of pertinent general and programme area related questions. The evaluation enabled the following questions to be addressed:
How did the URBAN programmes compare with existing national programmes and policies? In particular: Was URBAN relevant in different contexts? Was the URBAN concept original? Did the areas benefit from national programmes prior to and since URBAN I? What are the lessons for national policies?
Were additional private and public sector resources mobilised to the benefit of the programme areas?
Did URBAN I contribute to transnational cooperation and learning?
Did the initiative raise the consciousness of EU priorities such as economic and social cohesion and social inclusion?
Were the lessons of URBAN I taken on board in the development of programmes for the current (2000-2006) planning period?
The consideration of Community value added and the justification of interventions at the Community level is also guided by three principles: Subsidiarity (EC Treaty, article 5b), the proportionality of the Community resources employed in relation to the objectives and partnership. The application of each of these principles is also considered. Finally, the Community value added is compared with the transaction costs.
7.2 URBAN I and the existing national programmes and policies
7.2.1 The relevance of URBAN to different national and urban contexts
URBAN I aimed to reduce socio-economic disparities between sub city districts by in most instances targeting the ‘worst’ areas. Such disparities exist throughout the urban areas of the EU. The most disadvantaged sub city areas are located in many different urban contexts. In some cases, these ‘quartiers en crise’ are located on the periphery of urban areas (for example in many of the French cases), where concentrations of disadvantaged groups are found in run-down isolated neighbourhoods on the outskirts of cities. In other cases, the URBAN I programme areas were ‘inner city’ areas. In such areas, socially and economically excluded groups are concentrated in ageing and run-down housing and often in areas that had hitherto been relatively prosperous. The URBAN approach was however, adaptable and effective in these different contexts, not only in cities located in Objective 1 and 2 regions, but also in towns and cities in the more prosperous EU regions.
The specific target areas chosen for the URBAN programme interventions in each city were selected for the most part using procedures that took account of the level of ‘multiple deprivation’. These neighbourhoods were therefore already ‘known’ to national and local authorities as ‘areas of need’. In the vast majority of cases (over

Ex Post Evaluation of URBAN Community Initiative 1994-1999 Final Report
66
80%), national resources were already being targeted in the selected areas. However, these resources were generally being focused sectorally (on for example, isolated training courses, or building restoration), and were not part of an integrated approach as advocated by URBAN. Thus, even where the areas were already receiving priority at the national or regional level, URBAN was relevant.
Even though the bulk of the programmes and resources examined in this evaluation were deployed in Objective 1 regions ‘lagging behind’ it is not clear that the need for, or the Community value added of, the URBAN CI was greatest in these circumstances. However, the experience from in particular the former GDR where URBAN I enabled the involvement of municipal level government in the Structural Funds process and strengthened capacity at this level could be pertinent to the future Objective 1 or equivalent regions.
7.2.2 The originality of URBAN
In the majority of member states, the concept of URBAN (ie the targeting of an integrated set of interventions on relatively small neighbourhoods experiencing disadvantage) was original. The problems of disadvantaged urban areas and wider urban decline had in most national contexts traditionally been tackled in a sectoral way, with physical regeneration works being implemented in isolation from economic regeneration and actions to address social exclusion. For the first time in many member states, URBAN encouraged policy makers to take an integrated approach, targeting all the facets that contribute to ‘urban deprivation’ at the neighbourhood level.
This influence varied between countries and between levels of government. The influence was for example, strong at the national level in Italy where the government subsequently funded several national programmes in deprived urban areas, such as the “Contratti di quartiere” (Neighbourhood Contracts). The government has continued to fund programmes in the urban policy field, taking an integrated approach that was first introduced through URBAN. The influence was also strong at the municipal level particularly in Spain and Germany and to a lesser degree in Belgium, Portugal and Greece.
However, in several countries the advent of URBAN on the policy scene did not introduce a radical new approach to tackling urban issues. Both the UK and the Netherlands already had well established area-based neighbourhood renewal policies. For example, the community-focused Single Regeneration Budget (SRB) in the UK and the National Urban Policy in the Netherlands both mirrored URBAN in several respects. In France the Contrat de Ville addressed urban deprivation, while in Ireland, there was also already a strong tradition of partnership working in small area interventions.
Overall in 11 member states, URBAN I was original and influential, introducing for the first time: an integrated approach to urban renewal (for example in Austria); new policy instruments (as in the case of Denmark); and stimulating discussion about urban needs, targets for urban policy and the means of achieving a better balance between polarised neighbourhoods (for example, in Finland).
7.2.3 The implications for national urban policy
URBAN I was both relevant to and influential with respect to national urban policy. The experience points to the following conclusions:

Ex Post Evaluation of URBAN Community Initiative 1994-1999 Final Report
67
URBAN or equivalent approaches should be part of the tool kit of urban policy and the achievement of urban strategies. As a minimum the policy context needs to be ‘sympathetic’ at the national and urban levels. URBAN type approaches are more likely to be successful when part of wider urban strategies, where all relevant public agencies work in concert, and where the delivery of public services are oriented towards the needs of the priority areas.
Many of the challenges of disadvantaged urban areas are common to many EU urban areas. This provides a basis for structured exchange of experience and learning. However, the programmes designed for specific areas must be tailored to local needs, potential and circumstances.
Improvements in local social capital are both a product of and to some extent a pre requisite for, the success of the URBAN type area based integrated approach. This social capital includes social networks, a shared sense of place, organisational capacity and leadership. Key individuals, with a combination of drive and commitment, communication skills and knowledge of the substantive aspects of urban regeneration and procedures to secure funding, are a needed catalyst for improvements in social capital and successful programmes. Time and resources spent on creating and improving social capital are likely to improve the effectiveness and impact of the URBAN type interventions.
There are perhaps three circumstances where the URBAN approach may be particularly effective. Firstly, within regions and sub regions and areas experiencing structural economic change. Urban areas within such regions may be characterised by polarisation and the deterioration of specific neighbourhoods. (It is pertinent in this respect that the current Objective 2 Programme of North Rhine-Westphalia gives emphasis to applying the URBAN approach to many defined areas within the priority region). Secondly, urban areas within relatively prosperous regions where URBAN type interventions can be one component of urban policy and city strategies to improve urban areas. Thirdly, pockets of deprivation within relatively prosperous cities.
7.3 Additionality and leverage
Given that the URBAN concept was new in most national contexts and involved actors new to EU programmes, it is hence likely that URBAN was additional in most cases and hence more resources were targeted in an integrated manner on disadvantaged neighbourhoods as a result of the CI. The only possible exceptions were in those countries with a tradition of tackling neighbourhood disadvantage through past and concurrent programmes of area-based initiatives. Furthermore it is evident that URBAN both levered additional resources to be deployed towards similar ends in some countries and was instrumental in levering investment to the benefit of the programme areas. Direct private sector leverage was expected to be 5.4% of total expenditure, but actually represented 6.6% of total funding. In some programme areas, indirect private sector leverage was significant.
The concept of leverage is especially apposite in area based initiatives such as URBAN because success is often associated with bringing into use underused assets that have at some stage benefited from public investment. Examples include vacant and derelict sites and buildings located in areas that are well accessed and already connected to local services.

Ex Post Evaluation of URBAN Community Initiative 1994-1999 Final Report
68
7.4 The promotion of transnational cooperation and learning
As a CI, one of the aims of URBAN was the promotion of transnational learning and exchange of experience. Although some activities were undertaken to promote transnational co-operation between URBAN programme managers, the evidence suggests that this activity and its consequences were modest. National networking between URBAN programmes in certain member states was successful in helping programmes to address common issues, but at the transnational level, the time and resources that went into these activities were small and consequently they had little impact.
Several ‘interregional’ cooperation projects initially funded under Article 10 of the ERDF regulations during the early 1990s had addressed urban issues (for example, the “Quartiers en Crise” network, and the embryonic Eurocities) and had encouraged networking between cities. The UPPs funded concurrently with URBAN I had received financial and technical assistance support to enable exchange of experience. Although in the Commission’s Decision on URBAN I, it is stated that programmes were encouraged to back networks for mutual cooperation and exchange of information, there were no formal structures put in place at the Community level to facilitate this process. As a result, the activities organised were rather ‘ad hoc’, and were not undertaken in a coordinated way. In addition, the steep learning curve faced by many individual URBAN area programme managers meant that efforts were concentrated on delivering the programme, rather than exchanging lessons and experience. Although around half of programme managers were involved in at least one transnational event, URBAN I did not have a significant impact in developing transnational co-operation.
However, the recently launched URBACT Programme should help to address this issue, by bringing together cities that were involved in both the URBAN I and II CI, to ensure that the lessons learnt and experience gained from the two CI are disseminated to as wide an audience as possible.
7.5 The raising of consciousness of EU economic, cohesion and social inclusion policies
As stressed above the URBAN approach was relevant to many urban contexts throughout the EU. The CI was adopted enthusiastically particularly at the municipal, regional and national levels in national contexts without experience of analogous interventions. The interventions often had high visibility amongst citizens on the ground and provided a direct link between the EU and municipal/local levels. In these circumstances it is reasonable to conclude that the URBAN CI helped raise awareness of consciousness of the EU economic, cohesion and social inclusion policies. The influence was greatest at the local and municipal levels where key actors had hitherto less experience of the EU policies and funding instruments.
7.6 The lessons from URBAN I that informed the current programming period
The lessons from URBAN I were incorporated into the guidelines for URBAN II. In particular:
The procedures for the selection of programme areas were modified.
The arrangements for stimulating and coordinating transnational activity were strengthened.
The range of eligible interventions in programme areas was extended.

Ex Post Evaluation of URBAN Community Initiative 1994-1999 Final Report
69
The procedures were simplified through the URBAN II not drawing upon ESF resources.
There is also evidence that the URBAN concept of area based integrated intervention has been applied more generally within the framework of Structural Fund programmes (for example, in North Rhine-Westfalia) and within national programmes. URBAN I was an important and successful source of learning for the current planning period.
7.7 The application of the subsidiarity, proportionality and partnership principles
7.7.1 Subsidiarity
The subsidiarity principle advocates that decisions are taken at the lowest appropriate level. The adoption of URBAN as a CI recognised the importance of the widespread problem of urban neighbourhoods experiencing multiple problems and the threat they represent to the cohesion objective. Most member state representatives consulted recognised the legitimacy of this concern if not necessarily the qualifications of the EC to devise effective neighbourhood level interventions. Following the design of the CI the key decisions regarding the implementation of URBAN were however, made at the national, regional, municipal and local levels. The selection of the URBAN programme areas was made at national or regional levels. The preparation of the area strategies and programmes and the selection of projects were mainly made at municipal and local levels. Indeed URBAN I contributed to a significant devolution of decision making regarding the deployment of Structural Funds and in some national contexts to a devolution of control and increase in capacity for decision making at the municipal and local levels.
This generally positive application of the subsidiarity principle was however, offset by some of the administrative complexities of implementation that had the tendency to make the key actors ‘close to the ground’ feel anything but ‘in control’.
7.7.2 Proportionality
The proportionality principle implies that EU interventions should be commensurate with the issues being addressed. This is however in the case of URBAN, problematic for two reasons. Firstly, the programme areas represent a small proportion of all disadvantaged neighbourhoods in the EU. Indeed, although transnational and even national comparisons are difficult there are very large parts of EU urban areas that have markedly worse socio economic characteristics than some of those programme areas that benefited from URBAN I. Secondly, although as discussed above the URBAN I programmes were in the main effective in meeting their objectives, the resources involved and hence outputs achieved were modest when compared with the numbers of residents living within the URBAN programme areas. Furthermore the timescales for the programmes were short and the impacts were greatest in those areas where particular contextual conditions enabled relatively small scale interventions to generate disproportionate knock on effects. Many of the URBAN programme areas although successful in terms of the progress made, remain absolutely and relatively disadvantaged.
For these reasons it is probably less relevant to assess URBAN in this way but to consider the proportionality of URBAN as a CI in terms of the extent of improved

Ex Post Evaluation of URBAN Community Initiative 1994-1999 Final Report
70
capacity, learning and demonstration effects that have occurred. In these respects the returns on the resources deployed have been high.
7.7.3 Partnership
The partnership principle was included in the Structural Fund Regulations for the period 1989-1994, and has been applied to Structural Fund interventions ever since. The principle stresses both the closest possible vertical co-operation between the EC and the appropriate authorities at national, regional or local level, from the preparatory phase to implementation and also horizontal cooperation between stakeholders. The URBAN CI embodied this formal application of the partnership principle.
In additions through the URBAN I CI, many actors at the local level became directly involved for the first time in an EU funded programme. In all cases, city authorities were involved in drafting the URBAN I area programmes and in ensuring that the programme addressed the needs of their cities and the targeted neighbourhoods. The URBAN programmes themselves were then all implemented through local partnerships involving variously, local and regional authorities, community-based organisations and in some cases, the private sector.
Through these local partnerships, URBAN made a significant contribution to capacity-building at various levels: within municipalities, among local actors and stakeholders, and within local communities. This encouraged empowerment, and has contributed to raising consciousness among local partners about the benefits of taking part in decision-making processes. For the first time at the municipality level, cities were charged with implementing and delivering an EU programme. Similarly, for the first time in many cases, local communities were given a voice, and empowered to take an active part in decisions that would affect their neighbourhood.
Applying the partnership principle at the local level in URBAN I was not without its problems. These problems mainly concerned meeting the challenges of reaching consensus in decision-making when so many voices and opinions were taken into account. Mechanisms also had to be put in place to avoid potential conflicts of interest when those involved in strategic decision-making were also playing a part in implementation. However, overall, the local partnership approaches applied in URBAN proved to be very successful in helping to target local needs, and in building a sustainable structure for future working at the city and neighbourhood levels. Many of the local partnerships that were developed through URBAN I have been subsequently built on, and in many cases, now form the focus of urban interventions at a local level.
7.8 Community value added and transaction costs
As discussed above URBAN I contributed Community value added in several important respects:
The concept was novel and ‘additional’ to most member states.
The concept was straightforward to communicate having built on the successful practice in some member states.
The URBAN programmes successfully impacted on different types of urban area, and engaged the resources of partners.
URBAN I made a modest contribution to transnational learning

Ex Post Evaluation of URBAN Community Initiative 1994-1999 Final Report
71
URBAN I influenced National urban policies
There were however attendant management costs associated with URBAN. Firstly, any similar integrated area based national, regional or local level interventions could reasonably be expected to have high implementation costs compared with sectoral programmes or large single purpose projects. The planning, management, selection of projects for funding, and the monitoring and evaluation of area based initiatives tend be resource intensive. This is especially the case where the planning process closely involves community groups and local representatives. Furthermore, the implementation of URBAN and programmes like it can be constrained and complicated by institutional factors, (for example, land ownership etc). Secondly, the URBAN programmes involved both different levels of government and covered the territory of different government and municipal agencies. Thirdly, there were specific administrative aspects of the CI that caused difficulties such as the combination of both ERDF and ESF resources and the systems of financial control. The latter costs are likely to have been additional transaction costs stemming from the regulations and guidance of the CI.
From the programmes in the implementation sample, it is estimated that on average around 6% of the programme costs were spent on aspects of management and technical assistance. These costs are commensurate with the programme characteristics mentioned above. It is not possible to estimate what proportion of these costs were transaction costs. However, the latter are certainly offset by the Community value added that was generated by the CI.
7.9 Summary The URBAN approach was relevant in many different national and urban
contexts, both in areas designated as Objective 1 and 2, as well as in the more prosperous EU regions. National resources were already being targeted in over 80% of the URBAN areas, but these were generally being focused sectorally, and not as part of an area based integrated approach advocated by URBAN.
In the majority of member states (11), URBAN I was original and influential, introducing an integrated approach to urban renewal, new policy instruments, and stimulating discussion on how to address disparities within urban areas.
The value added of URBAN is greatest when it is applied as part of a tool kit of urban policy and strategies. URBAN-type approaches are likely to be most successful when part of a wider urban strategy. The policy contexts need to be sympathetic at the national and urban levels.
In most member states, URBAN levered additional resources into the programme areas, and encouraged further indirect investment, both from the public and private sectors, to the benefit of the programme areas.
Although national networking in some member states was successful, the time and resources that went into these activities at a transnational level were small, and consequently they had little impact.
The URBAN CI helped raise awareness of the EU economic, cohesion and social inclusion policies. The influence was greatest at the local and municipal levels where key actors had hitherto less experience of the EU policies and funding instruments.
Ex Post Evaluation of URBAN Community Initiative 1994-1999 Final Report
72
The lessons from URBAN I were incorporated into the guidelines for URBAN II. There is also evidence that the URBAN concept of area based integrated intervention has been applied more generally within the framework of Structural Fund programmes and within national programmes.
Many of the key decisions relating to URBAN (preparing the programme strategy and the selection of projects) were made at the municipality level, and in some cases with the involvement of the local community. This positive application of the subsidiarity principle was a key aspect of URBAN’s value added.
The application of the proportionality principle was most successful in terms of the improved capacity, learning and demonstration that have occurred.
The application of the partnership principle allowed stakeholders from different spheres and levels of government to be involved in decision-making. This process built capacity at the municipal level, as well as within local communities, bringing empowerment to those not usually involved in managing and implementing programmes.
It is estimated that on average around 6% of the programme costs were spent on aspects of management and technical assistance. These costs are commensurate with the programme characteristics mentioned above. It is not possible to estimate what proportion of these costs were transaction costs. However, the latter are certainly offset by the Community value added that was generated by the CI.

Ex Post Evaluation of URBAN Community Initiative 1994-1999 Final Report
73
8 CONCLUSIONS AND LESSONS
8.1 Introduction
This concluding section of the report begins by summarising the key strengths and weaknesses of URBAN I. It then considers the implications of the ex post evaluation for the mid term review of URBAN II. The debates surrounding the future of urban issues are rehearsed before suggestions are put forward for how future urban area based interventions should be part of wider strategies and how resources might be earmarked for more general urban interventions.
8.2 The URBAN Community Initiative: a success story
This evaluation has shown that the URBAN I was a success, both in terms of the substantive impact of the interventions and in terms of the delivery mechanisms adopted. It contributed to improving the quality of life in the target areas, and also had a lasting impact on structures at the local and city level, which have been sustained to deliver urban policy beyond the life of URBAN. The key strengths and weaknesses are reviewed below.
8.2.1 Key strengths of the URBAN I 1994-1999
The URBAN I CI had a number of key strengths:
URBAN I was a simple concept meeting real needs. As a CI, URBAN had the “right ingredients”. It was a simple idea that had widespread relevance throughout the EU. The concept was innovative in the majority of countries whilst there was a body of experience to draw upon in several member states. That experience included the lessons from the early UPPs that had ‘tested’ the integrated approach. The concept was rolled out as a CI, with a policy logic that complemented other Structural Fund interventions. The concept readily adapted to the different EU national and urban contexts.
URBAN I promoted an integrated approach. URBAN promoted a holistic approach to small area urban regeneration. It encouraged co-operation between different local government departments, a practice that in many cases had never been tried before. This holistic approach to the challenges of urban deprivation resulted in synergy between the policy areas of physical regeneration, economic development, socially focussed interventions and environmental improvements.
URBAN I made a difference to “quality of life”. The URBAN programmes were built around strategies to improve quality of life in the target areas. They made a significant contribution to physical improvements within the target neighbourhoods. The outcomes in terms of infrastructure work, community centres, training and environmental improvements all contributed to building confidence in the neighbourhood and making concrete changes to residents’ quality of life.
URBAN I involved decision-making in real partnership. In line with the partnership principle, the URBAN I programmes were designed and implemented with the strong involvement of different local actors. In particular, community based organisations played a part variously, in the initial design of the programme, the selection of projects, and the management and
Ex Post Evaluation of URBAN Community Initiative 1994-1999 Final Report
74
implementation of the programme. The organisations included not only residents’ groups, but also NGOs working on social issues in the neighbourhoods concerned. Such involvement was a key factor in promoting empowerment and ownership among local residents, and in building a truly inclusive programme that addressed real needs in the target URBAN programme areas. Other actors were also involved in local partnerships, including in some cases the private sector. This helped to focus the programmes on creating economic opportunities in the neighbourhoods.
URBAN I contributed to capacity building at the city level. The URBAN I programmes were specifically designed to involve municipalities in programme design and management. URBAN I gave cities the opportunity to take responsibility for innovative programmes, often by way of partnerships that were newly formed. These important capacity building activities have contributed to empowerment at the level of the city, by entrusting municipalities with overseeing the management of a complex programme, from its concept through to its completion.
URBAN I increased the visibility of EU interventions. The URBAN programmes often involved high-profile work in the public realm that contributed to the visibility of the CI, and by extension, to the visibility of the EU within the city. URBAN gave the EU a presence in cities through the programmes, and helped bring the EU closer to local communities.
URBAN I provided a direct link between cities and the EU. URBAN forged a direct link between the administrative level of the city and the EU. In line with the principle of subsidiarity, this contributed to the devolution of decision making to the lowest appropriate level.
URBAN I contributed to national urban policies. When URBAN was introduced, most member states were not implementing national urban policies. URBAN prompted policy makers to consider the URBAN approach as a viable means of addressing urban deprivation, and has subsequently served as a model for developing urban policy at the national level in a number of member states.
URBAN I targeted disadvantaged social groups. URBAN I programmes were often focused on areas including the most disadvantaged groups in the city: ethnic minorities, gypsies, drug-users and children and young people at risk of exclusion. In many member states, the challenges of social exclusion were traditionally addressed in isolation from other issues. One of strengths of URBAN I lay in including these social groups in solutions to urban deprivation. URBAN I recognized that an integrated approach must encompass disadvantaged groups, to ensure that they are not 'left behind' in urban development.
URBAN I built social capital. The URBAN I CI was instrumental in building social capital in the neighbourhoods concerned. This has been developed in two ways. Firstly, in terms of content, some projects developed a community focus for particular social groups, for example, interventions targeting disaffected youth, to draw them into the community, and get them involved in a particular activity. Secondly, in terms of process, social capital has been developed through efforts to build capacity at the local level, through including local people in decision-making structures, and developing a sense of community through the implementation of the programme. This has contributed to increased trust

Ex Post Evaluation of URBAN Community Initiative 1994-1999 Final Report
75
between local communities and city authorities. The existence of social capital is likely to be a prerequisite for successful small area urban regeneration.
8.2.2 Key weaknesses of the URBAN I Programme 1994-1999
To set alongside these strengths, URBAN I had a number of weaknesses:
URBAN I achieved only limited transnational learning. Although there were some opportunities for transnational learning through the URBAN I CI, the full potential for exchange of experience and learning through interaction with others was not realised. This weakness has been addressed through the recently launched URBACT Programme, which involves cities from both the URBAN I and II CI in dissemination and the exchange of experience. This involvement will ensure that the institutional learning and know-how that was acquired during URBAN I can be passed on to those who are currently undertaking URBAN II.
URBAN I was administratively complex. As a CI that involved many different partners in tackling the multi-faceted problem of urban deprivation, it was expected that the URBAN programmes would involve a certain level of complexity in its design, management and delivery. However, the Programme design was more complex than needed, and the bureaucracy and paperwork necessary made it difficult in some cases to sustain community and private sector involvement. The administrative bureaucracy and delays that this engendered were cited in many programmes as a factor that hindered their success.
This complexity was partly due to the integration of ERDF and ESF in the same Programme. (This issue has been addressed in URBAN II through the mono-fund approach). Problems related to the complexity of running the programmes were also compounded by a lack of clear guidance for managers, for whom in many cases, this was their first contact with EU Regulations and procedures. Delays in getting the programmes off the ground meant that towards the end of the programming period, the pressure to spend put at risk the strategic and integrated nature of some of the programmes, as larger projects with less of a community focus were approved, because they were ‘easier’ to implement.
URBAN I lacked systematic monitoring and evaluation structures. Most URBAN I programmes did not have systematic monitoring and evaluation structures and processes to measure the outputs, results and impacts of interventions. Although financial monitoring systems were put in place, the tracking of physical progress only took place on an ‘ad-hoc’ basis. Only around 20% of the programmes were subject to an independent final evaluation. However, as a result of URBAN I, some cities began to develop evaluation tools which are now used on a regular basis to evaluate progress (for example, Vienna), and URBAN I was responsible for producing a culture of monitoring and assessment at the city level in some cases (for example, Bari). The lack of monitoring and evaluation has been addressed in the current round of URBAN II programmes.
The URBAN I programmes were limited in their scope. The scope of interventions funded by the EU under URBAN was limited. Interventions in housing, land assembly, transport services and infrastructure, initial second level education, public employment services, health, crime prevention and other

Ex Post Evaluation of URBAN Community Initiative 1994-1999 Final Report
76
public services were uncommon or ineligible. Such interventions can however be useful components of an integrated approach.
8.3 Implications for Mid Term Review of URBAN II 2000-2006
In the light of the above strengths and weaknesses, and the evaluation findings, there are a number of implications for the mid term review of URBAN II. Some of the following recommendations are already highlighted in the Commission’s guidelines for URBAN II, but are emphasised here as they are factors that can significantly influence the effectiveness of URBAN II, and its overall impact.
Managing local partnerships effectively. For a truly inclusive URBAN programme, it is essential to involve civil society in all aspects of planning and implementation. For URBAN II, the design of the programmes is complete, but it is important for local residents and community representatives to be involved in the next stage, that of project appraisal and selection. This involvement helps to build ownership of the programmes, and capacity at the local level in programme management and delivery. However, in URBAN II, involvement of local communities in project selection in some countries such as the UK, has already introduced delays. Lessons can be transferred from those member states where this process has already taken place. In terms of delivering the programmes, an effective way of involving local groups involves establishing small scale funds for community groups that are not used to accessing resources.
The process of involving civil society is however, complex and may pose dangers. Some disadvantaged urban areas are characterised by concentrations of ethnic minorities and migrant groups. The implementation of URBAN II needs to avoid tendencies that might encourage ghettoisation and the reinforcement of cultural differences and traditional community structures that may be a barrier to the integration of the disadvantaged areas into the wider urban area and the opportunities it provides. A commitment to involving civil society in programmes may involve setting aside specific human resources dedicated to this aim.
Building local partnerships involves time and effort. It is important that URBAN II programmes enlist a wide membership in the local partnerships that will manage the programmes. Where possible, the management committee should include the public and private sectors, community based organisations and NGOs. Such a partnership takes time to build, to get all parties on board, and to generate a sense of ownership and genuine joint working. It is important that the partnership is inclusive, but similarly, a partnership that brings together disparate views can be less effective. However, the benefits of building a strong local partnership are significant and long lasting. Through building capacity at the community level and encouraging the private sector to become involved the sustainability of the programme effects will be improved. Delegating specific actions for it to manage can also strengthen the partnership. These findings are supported by the Thematic Evaluation of the Partnership Principle, that looked at URBAN I programmes in Belgium, Italy and the UK.
Transnational learning. The emphasis on transnational networking in URBAN II is greater than it was for URBAN I. Networking will be coordinated through URBACT.
URBAN II cities should participate actively in the work of URBACT, getting relevant partners involved in transnational exchanges. They should also use
Ex Post Evaluation of URBAN Community Initiative 1994-1999 Final Report
77
existing national networks between cities to exchange information and experience on urban issues. Where national networks do not currently exist, cities involved in URBAN II should establish them.
One of the lessons that came out of the evidence on networking during URBAN I was the value of involving where possible, all types of relevant partners in transnational exchanges. Real benefits can be gained from involving, in particular, community representatives in these activities, exposing them to the processes, people and policies of the CI at the EU level and in other national contexts. Local representatives can take this learning back to their communities, and convey the learning to others.
Effective monitoring and evaluation systems. It is essential to ensure that effective systems for monitoring and evaluation are in place. This includes gathering baseline data, agreeing indicators and setting targets for outputs, results and impacts that are feasible and realistic. The challenge for managing authorities is to develop a monitoring system with a limited number of indicators, nevertheless reflecting the strategic objectives of the programmes.
Although most URBAN II programmes will already have these systems in place, it is important to ensure that data collection takes place at regular intervals to monitor progress, and to highlight any issues as they emerge. The Urban Audit II will provide a resource for data at the city and sub-city levels, which will also be useful in providing data on various key indicators to characterise the wider context in which the programmes are working.
The potential exists for identifying and constructing ‘control’ areas and using survey panels and administrative data to track the progress of those living in the programme areas. There is also scope for the use of indicators relating to property transactions and values.
There would be benefit in similar approaches to evaluation being undertaken in different countries in order that stronger conclusions could be drawn on actual impacts and the relative effectiveness of different interventions.
Flexibility in timescales. It should be acknowledged that capacity building measures require substantial time and resources. In URBAN I, there was a lack of recognition of the time needed to build consensus in a local partnership, in order to build trust, so that all groups could ‘get on board’. Lessons should be learnt from this experience, and if necessary, programmes under URBAN II should be given longer to spend their budgets, particularly if delays have been incurred during the early part of the programming period due to the time taken to develop the local partnership. Programme managers should not be subject to undue pressure by the European Commission to spend, but should be allowed longer to deliver.
Planning for sustainability of the programme. There is a need for programme managers to consideration ‘transfer strategies’ towards the latter part of the programming period. To a large extent the long term impact of the programmes will depend on the improvements that have been made to local capacities.
Ex Post Evaluation of URBAN Community Initiative 1994-1999 Final Report
78
8.4 Implications for the Structural Funds post-2006
8.4.1 The policy debates
In May 2004, 10 new member states will join the EU. This will significantly change the “cohesion landscape” of the Union. A number of debates are taking place concerning the future allocations and focus of the Structural Funds. They include:
What should be the appropriate weight of emphasis given to regional competitiveness and social cohesion?
What are the merits of area based urban interventions compared with thematic approaches?
To what extent should the SF intervention resources that address urban issues be implemented by local authorities?
What should be the architecture and modalities of SF interventions concerning urban issues?
The evidence of this evaluation is pertinent to these questions.
Social cohesion and regional competitiveness
Both the social cohesion and competitiveness objectives are likely to figure in future of EU urban and regional policy. URBAN I contributed to cohesion at the sub regional level through addressing disparities between urban areas. This contribution was relevant to all regions including the more prosperous. Marked intra regional disparities have the potential to undermine regional competitiveness through adversely affecting the image of a region and perceptions of security and quality of life. URBAN I contributed to the reduction of such disparities. The economic and social changes brought about in some of the URBAN I programme areas also had the potential to contribute to the wider role of the town or city and hence its contribution to the development of clusters of economic activity and regional competitiveness.
Area-based and horizontal approaches to urban regeneration
URBAN I, and the first findings from URBAN II published by the Commission in July 200218, illustrate the value of the area-based approach to urban regeneration. However, this is not necessarily the optimum way of channelling resources in every context. In other situations, a horizontal approach may be more appropriate.
URBAN I was most successful in cities where there was a strong local partnership, led by the city authority which, through capacity building and local empowerment, built up ownership of the programme at the grass-roots level, and engaged local communities in its management and implementation.
The evidence of this evaluation suggests that an area-based urban regeneration programme is most likely to be effective, if the following characteristics are in place:
The programme should be designed and implemented by a partnership that involves the local authority and civic society.
18 Communication from the Commission to the Council, the European Parliament, the Economic and Social Committee and the Committee of the Regions: “The Programming of the Structural Funds 200-2006: an initial assessment of the Urban Initiative”, COM (2002) 308 final, 14.6.2002

Ex Post Evaluation of URBAN Community Initiative 1994-1999 Final Report
79
The target area should be small in geographical scale, with high aid intensity per head and per square kilometre, so that resources are not diluted and impacts can be visible and achieved within the time scale set.
The strategy should adopt an integrated approach, tackling all relevant aspects of urban deprivation, with the goal of sustainable urban development.
The programme should place an emphasis on building organisational capacity and social capital.
The programme should be implemented through simplified and transparent rules and regulations.
Target areas should be identified through indicators that describe the socio-economic situation at the neighbourhood level. Although ‘pockets of deprivation’ should normally be the focus, where resources and time are limited consideration should also be given to the benefits of focussing interventions in localities that have strong potential to improve and/or can benefit from improvements and developments that are otherwise taking place in contiguous or nearby areas. The importance of indicators in identifying target areas underlines the need for up-to-date and relevant data on the ‘quality of life’ in different parts of cities.
However, in circumstances where these characteristics do not exist, or cannot be envisaged, then it may be more appropriate to channel resources through horizontal programmes. Many of the issues facing urban areas (economic, social, environmental) can be addressed through non area based programmes, albeit in a broader fashion and without direct municipality or local community involvement.
The role of local authorities
Local authorities played an important role in the successful implementation of URBAN I. Their involvement helped ensure that the interventions met the needs of those in the areas and led to the realisation of the potential of the programme areas. At the same time the arrangements helped strengthen the links between the EU and local government levels and increased the visibility of the EU funding. Particularly where local authorities had little previous experience of the Structural Funds and area based interventions URBAN I contributed to learning and improving implementation capacity at the local level. This evidence suggests that local authorities should also be fully involved in future Structural Fund interventions related to urban issues.
The architecture and modalities of future Structural Fund interventions concerning urban issues
The URBAN I CI was a good exemplar of the organisational logic of the Structural Funds. Its origins can be traced to the successful implementation of the UPPs that were innovative measures funded directly by the EC. URBAN I was a good example of a CI in that it was relevant to urban areas throughout the EU and it generated lessons relevant to the Structural Funds more generally. During the latter part of the 1994-1999 programming there was consideration and debate over the merits of funding a further CI and/or at that stage mainstreaming the lessons within the Structural Funds more generally. In practice the new CI URBAN II was introduced and in some member states aspects of the URBAN I experience were mainstreamed. Whilst the future architecture of the Structural Funds remains a matter for debate the following general lessons emerge from the ex post evaluation:

Ex Post Evaluation of URBAN Community Initiative 1994-1999 Final Report
80
There is benefit in concentrating resources geographically. This promotes leverage and visibility. With the benefit of hindsight the average level of ‘aid intensity’ in URBAN programme areas was rather low compared with the needs and characteristic of many of the areas.
Local authorities and local actors can play an effective role in the management and implementation of the Structural Funds addressing urban issues.
The transnational learning aspects of a CI are important but require planning and coordination. The willingness of local authorities and other local actors to engage in this activity should be exploited.
The form of interventions needs to match the requirements and needs of the particular urban areas.
8.4.2 The case for an urban dimension to the Structural Funds
The future of the EU will depend heavily on the performance of cities and their regional hinterlands. Evidence of improvements over the last decade and changes in the way urban areas are functioning (such as the advent of clusters etc), suggest that they will continue to be poles of growth and creativity. URBAN I grew to some extent out of the ‘crisis’ facing urban areas that were experiencing population loss, very high unemployment and social tensions. Now the policy orientation has moved towards ‘renaissance’, both for regions and for urban areas. There is also a move to strengthen governance at the city level, which is relevant, as the involvement of cities in EU programmes is useful in ensuring that interventions are well targeted. Local level capacity is important and the specificities of URBAN have contributed to this.
However, URBAN type area based interventions are only one component of renaissance. One key to competitiveness is less direct local competition between cities and the need for city regions to be competitive in the context of globalisation.
An effective use of future Structural Fund resources might involve the specific earmarking of resources for urban interventions. In addition to URBAN type area based interventions these could be focussed on ‘Realising city visions’, achieving urban renaissance, incorporating notions of the ‘creative’ city, the ‘safer’ city, the ‘engaged’ city, and promoting sustainable urban development and cooperation between urban areas within regions. Preferably these interventions should be managed by municipal level authorities. The appropriateness of these possibilities will depend upon the size of the urban areas and their regional contexts.
At the same time the Structural Funds should contribute to the continuation of learning through networking and the exchange of experience. The development of the capacities of urban professionals and other key actors could build on the experience of URBAN I.
8.4.3 A framework for future area based urban interventions
The evidence of this evaluation suggests that area based interventions should form a component of any future urban dimension of the Structural Funds. However, they are likely to have the greatest impact when they form part of wider strategies. Whilst the need for strategies and their priorities will vary between regional contexts some combination of local, urban and regional strategy may be appropriate:

Ex Post Evaluation of URBAN Community Initiative 1994-1999 Final Report
81
Area-based initiatives can be part of a local strategy that includes financial support to other initiatives in the surrounding area. Issues of accessibility can be particularly pertinent to disadvantaged districts in cities, and this could be one domain where resources could be focused outside the programme area. It may be appropriate to consider allocating a set percentage (for example 30%) of the programme to activities in the area surrounding the target neighbourhood.
Area-based initiatives can also be integrated into a wider urban strategy for the city as a whole. Individual interventions would thus make up one part of a jigsaw of activity that together contribute to realising the vision for the wider city area. This strategy should be drawn up through partnership consultation, and might involve issues of land use and spatial planning, a number of major “flagship projects”, as well as activities to promote the city as an economic, social and distinctive cultural entity. Within the overall city strategy, URBAN-type interventions can contribute to addressing the local ‘pockets of concern’, that would not necessarily be reached by the other components of the strategies. The city strategies may require time horizons of 10 years or more. These strategies would be similar to the “Integrated Urban Development Plans” suggested by the Commission in their Framework for Action, to promote sustainable urban development19.
City strategies can in turn be embedded in a wider strategy for the region, which might encompass a number of different city strategies (in the case of urban clusters), as well as strategies for rural areas.
In addition, in order for area-based regeneration initiatives to be effective, the national policy context should be sympathetic to such interventions. Whether it be the integration of public services, or links with regional policy, area-based regeneration initiatives will only really make an impact where the national policy context facilitates such initiatives. Of increasing importance in this regard are policies that prioritise the targeting of ‘mainstream’ public services on disadvantaged areas including education, public employment services, training, crime prevention, health and environmental management.
The existence of such coherent strategies can encourage the development of strategic relationships between different levels of governance, at the sub-city, city and regional levels. A strong partnership between these levels can contribute to the effectiveness of the individual programmes, as well as to the whole.
8.4.4 New Member States
In the new member states, the objective conditions are different to those in the EU 15. Some of the disadvantages and challenges faced by the URBAN I programme areas are the consequence of market forces, the natural dynamic of sub cities improving or worsening and the processes of suburbanisation and counter urbanisation. In Accession Countries there is some evidence of urbanisation and pressures of growth and problems that are the legacy of central planning. Thus a priori the logic and concept of URBAN may be less relevant in the Accession Countries than elsewhere in the EU.
19 Commission Communication 28.10.98 “Urban Sustainable Development in the EU: A Framework for Action” (COM (98) 605 Final).

Ex Post Evaluation of URBAN Community Initiative 1994-1999 Final Report
82
However, the URBAN CI has developed an important body of knowledge, which should be made available to the Accession Countries. The countries themselves should be given the choice of whether they would like to design and implement URBAN style programmes. In cases where this route is not chosen, lessons in community-based regeneration schemes should be disseminated to city authorities, through the URBACT programme and conferences or workshops.
If URBAN type interventions are pursued in the new member states, it will be helpful if the Regulations that apply to the interventions are simplified. This is particularly important given the potential lack of capacity, both at the local community and at the programme management level. From the experience in east German Lander of URBAN I, a future URBAN could be a powerful driver of sub regional, municipal level involvement in the Structural Funds.
8.4.5 Recommendations for the period post 2006
The findings from this evaluation point to a number of recommendations and action points for the period post 2006:
Where appropriate Structural Fund resources should be earmarked for urban interventions within regions to be managed by local authorities. Some of these resources could be used for URBAN type interventions but the scope should be wider.
The programming of area based interventions should be flexible. In particular there may need to be a period during which capacity is built up and consensus achieved over priorities.
Area based interventions can usefully be implemented in the context of coherent strategies at the sub-city, city and regional levels. It might be appropriate for the existence of such strategies to play a role in the pre-selection of programmes.
Specific interventions to build capacity at the municipal and local community levels should be supported in order to ensure that there is sufficient knowledge to manage and deliver such programmes. This applies particularly to the Accession Countries, but is also pertinent to cities in the EU15.
Further support should be given to promoting learning from experience, the development of capacity and the transnational exchange of good practice.

Ex Post Evaluation of URBAN Community Initiative 1994-1999 Final Report
ANNEXES
ANNEX 1 – CHARACTERISTICS OF THE URBAN I AND SELECTED UPP PROGRAMMES
This annex presents the basic characteristics of all the URBAN and 5 selected UPP programmes.
SIZE OF CITY (‘000) TYPE OF AREA LAND USE OBJECTIVE STATUS MEMBER
STATE PROGRAMME <100 100-
250 >250 Peripheral urban area
Inner city
Historic city
centre Mixed Residential Industrial Mixed 1/6 2 None
BE Antwerp BE Brussels
BE Brussels-Anderlecht BE Charleroi
BE Mons -La Louviere
DK Aalborg
DE Berlin
DE Brandenburg
DE Bremen
DE Chemnitz
DE Duisburg-Marxloh
DE Erfurt-Ost
DE Halle
DE Kiel
DE Magdeburg-Cracau
DE Rostock
DE Saarbrucken
DE Leipzig-UPP
DE Zwickau
ES Albacete

Ex Post Evaluation of URBAN Community Initiative 1994-1999 Final Report
84
SIZE OF CITY (‘000) TYPE OF AREA LAND USE OBJECTIVE STATUS MEMBER
STATE PROGRAMME <100 100-
250 >250 Peripheral urban area
Inner city
Historic city
centre Mixed Residential Industrial Mixed 1/6 2 None
ES Aviles
ES Badajoz
ES Badalona
ES Baracaldo
ES Cadiz
ES Cartagena
ES Castellon
ES Córdoba
ES Huelva
ES La Coruna
ES Langreo
ES Leon
ES Madrid
ES Malaga
ES Murcia
ES Palma de Mallorca ES Pontevedra
ES Sabadell
ES Salamanca
ES Santa Coloma de Grameret
ES Santander
ES Sevilla
ES Telde
ES Toledo
ES Valencia
ES Valladolid
ES Vigo

Ex Post Evaluation of URBAN Community Initiative 1994-1999 Final Report
85
SIZE OF CITY (‘000) TYPE OF AREA LAND USE OBJECTIVE STATUS MEMBER
STATE PROGRAMME <100 100-
250 >250 Peripheral urban area
Inner city
Historic city
centre Mixed Residential Industrial Mixed 1/6 2 None
ES Zaragoza
ES Bilbao-UPP
GR Ermoupolis
GR Keratsini-Drapetsona
GR Patras
GR Peristeri
GR Thessaloniki
GR Volos-Nea Ionia
GR Alexandroupolis-UPP
FR Amiens
FR Aulnay-sous-Bois
FR Bastia
FR Charlon-sur-Saone
FR Clichy-sous-Bois FR Les Mureaux
FR Lyon FR Mantes-la-Jolie
FR Marseille
FR Mulhouse
FR Roubaix-Tourcoing
FR Saint-Etienne
FR Valenciennes
IE Cork
IE Dublin North
IE Dublin South
IT Bari
IT Cagliari

Ex Post Evaluation of URBAN Community Initiative 1994-1999 Final Report
86
SIZE OF CITY (‘000) TYPE OF AREA LAND USE OBJECTIVE STATUS MEMBER
STATE PROGRAMME <100 100-
250 >250 Peripheral urban area
Inner city
Historic city
centre Mixed Residential Industrial Mixed 1/6 2 None
IT Catania
IT Catanzaro
IT Cosenza
IT Foggia
IT Genova
IT Lecce
IT Napoli
IT Palermo
IT Reggio Calabria
IT Roma IT Salerno
IT Siracusa-Ortigia
IT Trieste
IT Venezia
LU Dudelange-Differdange
NL Amsterdam NL Rotterdam
NL The Hague
NL Utrecht AT Graz
AT Vienna PT Amadora
PT Gondomar PT Lisbon
PT Loures
PT Oeiras
PT Porto

Ex Post Evaluation of URBAN Community Initiative 1994-1999 Final Report
87
SIZE OF CITY (‘000) TYPE OF AREA LAND USE OBJECTIVE STATUS MEMBER
STATE PROGRAMME <100 100-
250 >250 Peripheral urban area
Inner city
Historic city
centre Mixed Residential Industrial Mixed 1/6 2 None
FI Helsinki FI Joensuu
FI Helsinki-UPP SE Malmo
SE Falun-UPP
UK Belfast
UK Birmingham
UK Brighton UK Bristol
UK Coventry
UK Glasgow North
UK Hackney Tower
UK Leasowe
UK Leeds
UK Liverpool Central
UK Londonderry
UK Manchester
UK Netherton
UK North Huyton
UK Nottingham
UK Paisley
UK Park Royal
UK Sheffield
UK Swansea
EU15 (Total) 18 52 55 47 41 23 14 7 79 39 70 33 22 EU15 (%) 14% 42% 44% 38% 33% 18% 11% 6% 63% 31% 56% 26% 18%

Ex Post Evaluation of URBAN Community Initiative 1994-1999 Final Report
ANNEX 2 - CRITERIA FOR THE SELECTION OF SAMPLE PROGRAMMES
Each task in the evaluation examined a selection of programmes. The selection for each sample was based on a number of criteria. These are listed below.
Sample 1 - 56 URBAN programmes and 2 UPPs to assess the effectiveness of the programmes. The criteria for selection were the following:
At least one programme in each Member State
A range of different sized cities
A range of different sized programmes (in terms of their population and budget)
A range of types of neighbourhoods and land use characteristics
At least some representation from both the first and second wave programmes
A selection which covered all the Objective status regions (1, 2, 6 and none)
At least one multiple target area.
A range of programmes that covered varied aspects of programme preparation, content, and management arrangements
A review of practical considerations, such as the availability of information and contacts etc.
Antwerp Brussels Aalborg Berlin Bremen Duisburg-Marxloh Erfurt-Ost Magdeburg-Cracau Rostock Badajoz Badalona Córdoba Leon Madrid Malaga Santa Coloma de Grameret Sevilla Vigo Zaragoza Bilbao-UPP
Keratsini-Drapetsona Thessaloniki Volos-Nea Ionia Aulnay-sous-Bois Les Mureaux Lyon Marseille Mulhouse Roubaix-Tourcoing Cork Dublin North Dublin South Bari Cosenza Genova Napoli Roma Salerno Trieste Dudelange-Differdange
Rotterdam Hague Graz Vienna Lisbon Porto Helsinki Joensuu Malmo Falun-UPP Birmingham Bristol Glasgow North Hackney Tower Liverpool Central Londonderry Park Royal Sheffield Swansea

Ex Post Evaluation of URBAN Community Initiative 1994-1999 Final Report
89
Sample 2 - 35 URBAN programmes and 2 UPPs to assess the management and implementation arrangements. The programmes in this sample were selected from Sample 1. The criteria for selection were the following:
A selection of programmes that reflected clear differences in management and implementation systems.
A range of partnership arrangements that reflected different decision-making responsibilities.
Antwerp Brussels Aalborg Berlin Duisburg-Marxloh Magdeburg-Cracau Badajoz Córdoba Leon Santa Coloma de Grameret Sevilla Bilbao-UPP Keratsini-Drapetsona
Volos-Nea Ionia Aulnay-sous-Bois Lyon Mulhouse Cork Dublin North Dublin South Bari Cosenza Roma Salerno Dudelange-Differdange Rotterdam
Hague Vienna Lisbon Porto Helsinki Joensuu Malmo Falun-UPP Birmingham Glasgow North Londonderry Swansea
Sample 3 - 20 URBAN programmes, to assess the selection process. The programmes were selected from Sample 2. The criteria for the selection were the following:
At least one programme in each Member State
A range of different sized cities
A range of different sized programmes (in terms of their population and budget)
A range of types of neighbourhoods and land use characteristics
At least some representation from both the first and second wave programmes
A selection which covered all the Objective status regions (1, 2, 6 and none)
At least one multiple target area.
Antwerp Aalborg Bremen Magdeburg-Cracau Córdoba Sevilla Volos-Nea Ionia
Lyon Marseille Dublin North Dublin South Cosenza Napoli Dudelange-Differdange
Rotterdam Vienna Porto Helsinki Malmo Birmingham Glasgow North

Ex Post Evaluation of URBAN Community Initiative 1994-1999 Final Report
90
ANNEX 3 – BUDGET AND EXPENDITURE OF URBAN I
The budget information presented in this annex was collated from the initial and revised decisions provided by the European Commission, and the various financial and final programme reports provided by the programme managers.
Table 3.1 shows figures for actual expenditure for the 102 programmes that had provided data by June 2003. This is broken down by member state and source of funding.
Table 3.2 shows the allocation of funds by URBAN II category, showing the distribution of committed funds (Table 3.2a), revised committed funds (Table 3.2b) and actual expenditure (Table 3.2c).
The definition of the URBAN II expenditure categories is provided at the end of the Annex.
Table 3.1 URBAN I and selected UPPs Expenditure – Total by member state20
TOTAL FUNDING – ACTUAL (million euros) Member
state No. of pro-grammes ERDF ESF TOTAL EU PUBLIC PRIVATE GRAND
TOTAL
BE 5 17.2 1.7 18.9 32 1.4 52.3 DK 1 1.2 0.3 1.5 1.5 0.2 3.2 DE 13 73 13.8 86.9 64.4 6.0 157.3 GR 7 36.6 8.9 45.5 14.3 2.1 61.9 ES 30 152.3 0 152.3 83 0 235.3 FR 13 66.3 13.1 79.4 108.1 14.3 201.8 IE 3 12.6 8.5 21.1 7 0 28.1 IT 16 89.7 12.4 102.1 146.9 10.6 259.6 LU 1 0.2 0.1 0.3 0.4 0 0.8 NL 4 17.9 0.3 18.2 59.5 33.5 111.2 AT 2 13 3.6 16.6 30.8 17.8 65.2 PT 6 40.7 5.9 46.6 18.2 0 64.8 FI 3 7.4 2.2 9.7 13.6 1.8 25.1 SE 2 5 1.8 6.8 9.3 0.5 16.6 UK 19 82.5 23.1 105.5 82.7 9.8 198
EU15 125 615.6 95.9 711.5 671.9 97.8 1481.1
20 The financial figures in this table include data from 102 out of 125 URBAN and selected UPP programmes. As of June 2003, data for the remaining programmes had not been provided.

Ex Post Evaluation of URBAN Community Initiative 1994-1999 Final Report
91
Table 3.2 Allocation of funds by URBAN II category * by member state
Table 3.2a Allocation of funds by URBAN II category (Committed Funds) Member
state Physical and
environmental regeneration
Entrepreneur-ship and
employment
Social inclusion
Transport ICT Technical assistance
Others
BE 45% 37% 15% 0% 1% 3% 1% DK 15% 23% 31% 1% 5% 5% 20% DE 13% 68% 14% 0% 0% 2% 3% GR 36% 43% 13% 2% 1% 3% 1% ES 38% 35% 25% 0% 0% 2% 0% FR 17% 53% 25% 0% 0% 4% 0% IE 28% 28% 28% 0% 0% 15% 0% IT 61% 16% 17% 0% 2% 1% 2% LU 45% 14% 41% 0% 0% 0% 0% NL 29% 58% 6% 0% 0% 2% 6% AT 41% 41% 14% 0% 0% 3% 0% PT 26% 26% 41% 0% 0% 8% 0% FI 45% 24% 18% 0% 7% 6% 0% SE 18% 33% 26% 0% 5% 5% 13% UK 18% 38% 38% 0% 1% 5% 1%
EU15 29% 44% 21% 0% 1% 3% 2%
Table 3.3b Allocation of funds by URBAN II category (Revised Committed Funds) Member
state Physical and
environmental regeneration
Entrepreneur-ship and
employment
Social inclusion
Transport ICT Technical assistance
Others
BE 44% 37% 15% 0% 1% 3% 0% DK 16% 25% 24% 2% 5% 5% 23% DE 21% 49% 22% 0% 0% 3% 5% GR 38% 45% 13% 3% 0% 1% 0% ES 38% 31% 29% 0% 0% 2% 0% FR 26% 42% 27% 0% 0% 4% 1% IE 37% 21% 28% 0% 0% 14% 0% IT 61% 19% 16% 0% 1% 1% 2% LU 45% 14% 41% 0% 0% 0% 0% NL 16% 57% 15% 0% 0% 2% 10% AT 50% 36% 12% 0% 0% 3% 0% PT 27% 19% 46% 0% 0% 8% 0% FI 45% 24% 19% 0% 6% 6% 0% SE 18% 33% 26% 0% 6% 6% 12% UK 16% 45% 33% 0% 0% 6% 0%
EU15 35% 35% 24% 0% 0% 3% 2%

Ex Post Evaluation of URBAN Community Initiative 1994-1999 Final Report
92
Table 3.3c Allocation of funds by URBAN II category (Actual expenditure) Member
state Physical and
environmental regeneration
Entrepreneur-ship and
employment
Social inclusion
Transport ICT Technical assistance
Others
BE 43% 40% 14% 0% 1% 3% 0% DK 10% 27% 21% 0% 5% 5% 32% DE 23% 49% 19% 0% 0% 4% 4% GR 40% 42% 12% 2% 1% 2% 1% ES 45% 23% 30% 0% 0% 3% 0% FR 14% 51% 29% 0% 0% 5% 1% IE 38% 41% 14% 0% 2% 5% 0% IT 62% 18% 14% 3% 2% 1% 2% LU 43% 30% 27% 0% 0% 0% 0% NL 27% 52% 12% 0% 0% 2% 7% AT 50% 36% 12% 0% 0% 3% 0% PT 27% 20% 46% 0% 0% 7% 0% FI 47% 22% 19% 0% 5% 6% 0% SE 18% 33% 26% 0% 6% 6% 11% UK 22% 31% 36% 1% 2% 7% 0%
EU15 38% 32% 23% 1% 1% 4% 2%
*Definition of URBAN II expenditure categories. The following list presents the classification of expenditure that has been used in this evaluation. It is also the classification that was used by the European Commission when assessing expenditure under URBAN II.
Physical and environmental regeneration. This covers redevelopment and rehabilitation of brown-field sites, open spaces, green infrastructure, sports and cultural centres, historical heritage, physical business infrastructure. The measure codes involved are :
151 Investment in physical capital for large business organisations 161 Investment in physical capital for SMEs and the craft sector 171 Investment in physical capital for tourism 33 Energy infrastructures (production, delivery) 331 Infrastructures on electricity, gas, petroleum products and solid fuel 332 Infrastructures on renewable sources of energy 333 Energy efficiency, co-generation, energy control 34 Environmental infrastructure 341 Air 342 Noise 343 Urban and industrial waste 344 Drinking water (collection, storage, treatment and distribution) 345 Sewerage and purification 35 Planning and rehabilitation 351 Upgrading and rehabilitation of industrial and military areas 352 Rehabilitation of urban areas 353 Protection, improvement and regeneration of the natural environment 354 Maintenance and restoration of the cultural heritage
Entrepreneurship and Employment. This covers sustained economic development, training for the unemployed, start ups and support for SMEs and crafts, business services. The measure codes are :
152 Environment-friendly technologies for large business organisations 153 Business organisation advisory service for large business organisations 155 Financial engineering for large business organisations 162 Environmentally-friendly technologies for SMEs and the craft sector 163 Enterprise advisory service for SMEs 164 Shared business services 165 Financial engineering for SMEs 167 SME and craft-specific vocational training 172 Non-physical investments 173 Shared services for the tourism industry 174 Tourism-specific vocational training 21 Labour market policy 23 Developing educational and vocational training 24 Workforce flexibility, entrepreneurial activity, innovation, information and communication
technologies (persons, firms)

Ex Post Evaluation of URBAN Community Initiative 1994-1999 Final Report
93
Social inclusion. This covers actions on minorities, refugees, immigrants, equal opportunities, youth inclusion, safety, public health, cultural integration, fight against crime and drugs. The measures codes are :
154 Services to stakeholders (health and safety, providing care for dependents) 166 Services in support of the social economy (care, health, safety and cultural activities) 22 Social inclusion 25 Positive labour market actions for women 36 Social and public health infrastructure
Transport. This includes actions on transport infrastructure, road restructuring, cycle paths, improving public transport and traffic safety. The measures codes are :
311 Transport infrastructure on rail 312 Transport infrastructure on roads 3121 Infrastructure on national roads 3122 Infrastructure on regional/local roads 3123 Bicycle lanes 313 Motorways 314 Airports 315 Ports 316 Waterways 317 Urban transport 318 Multimodal transport 319 Intelligent transport systems
ICT and R&D. This covers actions on telecommunications, the Information Society and research. The measures codes are :
18 Research, technological development and innovation (RTDI) 181 Research projects based in universities and research institutes 182 Innovation and technology transfers, establishment of networks and partnerships between
businesses and/or research institutes 183 RTDI Infrastructure 184 Training for researchers 32 Telecommunications infrastructure and the Information Society 321 Basic infrastructure 322 Information and Communication Technology (including security and safe transmission measures) 323 Services and applications for the citizen (health, administration, education) 324 Services and applications for SMEs (electronic commerce and transactions, education and
training, networking).
Technical assistance. The measures codes are :
411 Preparation, implementation, monitoring, publicity 412 Evaluation 413 Studies 414 Innovative actions 415 Information to the public

Ex Post Evaluation of URBAN Community Initiative 1994-1999 Final Report
94
ANNEX 4 – URBAN PROGRAMME STRATEGIES21
Member State Programme
Broad integrated approach
Integrated approach
with a specific focus
“Flagship approach”
Community focussed approach
BE Antwerp BE Brussels BE Brussels-Anderlecht BE Charleroi BE Mons-La Louvière DE Berlin DE Brandenburg DE Bremen DE Chemnitz DE Duisburg-Marxloh DE Erfurt-Ost DE Halle DE Kiel DE Magdeburg-Cracau DE Rostock DE Saarbrucken DE Zwickau DE Leipzig UPP DK Aalborg EL Ermoupolis EL Keratsini-Drapetsona EL Patras EL Peristeri EL Thessaloniki EL Volos-Nea Ionia EL Alexanderpolis UPP ES Albacete ES Aviles ES Badajoz ES Badalona ES Baracaldo ES Cadiz ES Cartagena ES Castellon
21 The classification of strategy type for each programme was based on the national evaluator’s assessment.

Ex Post Evaluation of URBAN Community Initiative 1994-1999 Final Report
95
Member State Programme
Broad integrated approach
Integrated approach
with a specific focus
“Flagship approach”
Community focussed approach
ES Córdoba ES Huelva ES La Coruna ES Langreo ES Leon ES Madrid ES Malaga ES Murcia ES Palma de Mallorca ES Pontevedra ES Sabadell ES Salamanca ES Santa Coloma de
Grameret
ES Santander ES Sevilla ES Telde ES Toledo ES Valencia ES Valladolid ES Vigo ES Zaragoza ES Bilbao UPP FR Amiens FR Aulnay-sous-Bois FR Bastia FR Chalon-sur-Saone FR Clichy-sous-Bois FR Les Mureaux FR Lyon FR Mantes-la-Jolie FR Marseille FR Mulhouse FR Roubaix-Tourcoing FR Saint-Etienne FR Valenciennes IE Cork IE Dublin North IE Dublin South IT Bari IT Cagliari

Ex Post Evaluation of URBAN Community Initiative 1994-1999 Final Report
96
Member State Programme
Broad integrated approach
Integrated approach
with a specific focus
“Flagship approach”
Community focussed approach
IT Catania IT Catanzaro IT Cosenza IT Foggia IT Genova IT Lecce IT Napoli IT Palermo IT Reggio Calabria IT Roma IT Salerno IT Siracusa IT Trieste IT Venezia LU Dudelange-Differdange NL Amsterdam NL Rotterdam NL The Hague NL Utrecht AT Graz AT Vienna PT Amadora PT Gondomar PT Lisbon PT Loures PT Oeiras PT Porto SE Malmo SE Falun UPP FI Helsinki-Vantaa FI Joensuu FI Helsinki-UPP UK Belfast UK Birmingham UK Brighton UK Bristol UK Coventry UK Glasgow North UK Hackney Tower UK Leasowe

Ex Post Evaluation of URBAN Community Initiative 1994-1999 Final Report
97
Member State Programme
Broad integrated approach
Integrated approach
with a specific focus
“Flagship approach”
Community focussed approach
UK Leeds UK Liverpool UK Londonderry UK Manchester UK Netherton UK North Huyton UK Nottingham UK Paisley UK Park Royal UK Sheffield UK Swansea
EU15 (Total) 56 33 13 23 EU15 (%) 45% 26% 10% 18%

Ex-post evaluation of the URBAN I Community Initiative, 1994-1999 Final Report
98
ANNEX 5 –FACTORS AFFECTING SUCCESS
Table 5.1: Factors supporting the success of the URBAN and selected UPP programmes22
Mem
ber s
tate
Prog
ram
me
Com
bini
ng U
RBA
N w
ith e
xist
ing
rege
nera
tion
prog
ram
mes
Sele
ctio
n an
d co
mbi
natio
n of
pr
ojec
ts
Activ
e pa
rtici
patio
n of
the
loca
l co
mm
unity
in a
spec
ts o
f the
m
anag
emen
t and
impl
emen
tatio
n of
th
e pr
ogra
mm
e
Esta
blis
hmen
t of a
n in
tegr
ated
ap
proa
ch w
ith s
trong
par
tner
ship
s
Car
ryin
g ou
t com
preh
ensi
ve
prog
ram
me
prep
arat
ion,
incl
udin
g ac
tion
plan
ning
and
nee
ds
asse
ssm
ent
Stro
ng p
rivat
e se
ctor
sup
port
and
coop
erat
ion
Stro
ng le
ader
ship
in th
e da
y to
day
m
anag
emen
t and
ove
rall
impl
emen
tatio
n of
the
prog
ram
me.
Leve
ragi
ng o
ther
exi
stin
g re
gene
ratio
n pr
ogra
mm
es a
s a
sour
ce fo
r mat
ch fu
ndin
g
Polit
ical
sup
port
and
coop
erat
ion
Rec
eptiv
enes
s of
the
loca
l co
mm
unity
to th
e U
RBA
N p
roje
cts
Fund
ing
proc
ess
and
adm
inis
tratio
n
The
esta
blis
hmen
t of a
loca
l pro
ject
of
fice
with
in th
e pr
ogra
mm
e ar
ea
Tim
elin
ess
of p
rogr
amm
e de
cisi
on
mak
ing
and
impl
emen
tatio
n
Mar
ketin
g an
d pr
omot
ion
of th
e U
RBA
N p
rogr
amm
e
The
esta
blis
hmen
t of c
apac
ity
build
ing
proc
ess
from
the
star
t of t
he
prog
ram
me
Stro
ng c
omm
unic
atio
n ac
ross
va
rious
leve
ls o
f man
agem
ent o
f U
RBA
N p
rogr
amm
e
Prep
arat
ion
of a
tran
sitio
n st
rate
gy
The
unde
rsta
ndin
g of
Eur
opea
n C
omm
issi
on d
ocum
ents
and
pr
oced
ures
by
thos
e in
volv
ed in
the
prog
ram
me
The
esta
blis
hmen
t of c
omm
unity
ch
est f
unds
to m
otiv
ate
and
enco
urag
e pa
rtici
patio
n fro
m s
mal
l co
mm
unity
gro
ups
The
esta
blis
hmen
t of k
ey fu
nds
to
addr
ess
the
issu
e of
sec
urin
g m
atch
fu
ndin
g by
sm
all c
omm
unity
or
gani
satio
ns
BE Antwerp BE Brussels DK Aalborg DE Berlin DE Bremen DE Duisburg-Marxloh DE Erfurt-Ost DE Magdeburg-Cracau DE Rostock GR Volos-Nea Ionia GR Keratsini-
Drapetsona GR Thessaloniki ES Badajoz ES Badalona ES Córdoba ES Leon
22 The identification of the factors supporting the success of the programmes was based on the national evaluator’s assessment.

Ex-post evaluation of the URBAN I Community Initiative, 1994-1999 Final Report
99
Mem
ber s
tate
Prog
ram
me
Com
bini
ng U
RBA
N w
ith e
xist
ing
rege
nera
tion
prog
ram
mes
Sele
ctio
n an
d co
mbi
natio
n of
pr
ojec
ts
Activ
e pa
rtici
patio
n of
the
loca
l co
mm
unity
in a
spec
ts o
f the
m
anag
emen
t and
impl
emen
tatio
n of
th
e pr
ogra
mm
e
Esta
blis
hmen
t of a
n in
tegr
ated
ap
proa
ch w
ith s
trong
par
tner
ship
s
Car
ryin
g ou
t com
preh
ensi
ve
prog
ram
me
prep
arat
ion,
incl
udin
g ac
tion
plan
ning
and
nee
ds
asse
ssm
ent
Stro
ng p
rivat
e se
ctor
sup
port
and
coop
erat
ion
Stro
ng le
ader
ship
in th
e da
y to
day
m
anag
emen
t and
ove
rall
impl
emen
tatio
n of
the
prog
ram
me.
Leve
ragi
ng o
ther
exi
stin
g re
gene
ratio
n pr
ogra
mm
es a
s a
sour
ce fo
r mat
ch fu
ndin
g
Polit
ical
sup
port
and
coop
erat
ion
Rec
eptiv
enes
s of
the
loca
l co
mm
unity
to th
e U
RBA
N p
roje
cts
Fund
ing
proc
ess
and
adm
inis
tratio
n
The
esta
blis
hmen
t of a
loca
l pro
ject
of
fice
with
in th
e pr
ogra
mm
e ar
ea
Tim
elin
ess
of p
rogr
amm
e de
cisi
on
mak
ing
and
impl
emen
tatio
n
Mar
ketin
g an
d pr
omot
ion
of th
e U
RBA
N p
rogr
amm
e
The
esta
blis
hmen
t of c
apac
ity
build
ing
proc
ess
from
the
star
t of t
he
prog
ram
me
Stro
ng c
omm
unic
atio
n ac
ross
va
rious
leve
ls o
f man
agem
ent o
f U
RBA
N p
rogr
amm
e
Prep
arat
ion
of a
tran
sitio
n st
rate
gy
The
unde
rsta
ndin
g of
Eur
opea
n C
omm
issi
on d
ocum
ents
and
pr
oced
ures
by
thos
e in
volv
ed in
the
prog
ram
me
The
esta
blis
hmen
t of c
omm
unity
ch
est f
unds
to m
otiv
ate
and
enco
urag
e pa
rtici
patio
n fro
m s
mal
l co
mm
unity
gro
ups
The
esta
blis
hmen
t of k
ey fu
nds
to
addr
ess
the
issu
e of
sec
urin
g m
atch
fu
ndin
g by
sm
all c
omm
unity
or
gani
satio
ns
ES Madrid ES Malaga ES Santa Coloma de
Grameret ES Sevilla ES Vigo ES Zaragoza FR Aulnay-sous-Bois FR Les Mureaux FR Lyon FR Marseille FR Mulhouse FR Roubaix-Tourcoing IE Cork IE Dublin North IE Dublin South IT Bari IT Cosenza IT Genova IT Napoli IT Roma IT Salerno IT Trieste

Ex-post evaluation of the URBAN I Community Initiative, 1994-1999 Final Report
100
Mem
ber s
tate
Prog
ram
me
Com
bini
ng U
RBA
N w
ith e
xist
ing
rege
nera
tion
prog
ram
mes
Sele
ctio
n an
d co
mbi
natio
n of
pr
ojec
ts
Activ
e pa
rtici
patio
n of
the
loca
l co
mm
unity
in a
spec
ts o
f the
m
anag
emen
t and
impl
emen
tatio
n of
th
e pr
ogra
mm
e
Esta
blis
hmen
t of a
n in
tegr
ated
ap
proa
ch w
ith s
trong
par
tner
ship
s
Car
ryin
g ou
t com
preh
ensi
ve
prog
ram
me
prep
arat
ion,
incl
udin
g ac
tion
plan
ning
and
nee
ds
asse
ssm
ent
Stro
ng p
rivat
e se
ctor
sup
port
and
coop
erat
ion
Stro
ng le
ader
ship
in th
e da
y to
day
m
anag
emen
t and
ove
rall
impl
emen
tatio
n of
the
prog
ram
me.
Leve
ragi
ng o
ther
exi
stin
g re
gene
ratio
n pr
ogra
mm
es a
s a
sour
ce fo
r mat
ch fu
ndin
g
Polit
ical
sup
port
and
coop
erat
ion
Rec
eptiv
enes
s of
the
loca
l co
mm
unity
to th
e U
RBA
N p
roje
cts
Fund
ing
proc
ess
and
adm
inis
tratio
n
The
esta
blis
hmen
t of a
loca
l pro
ject
of
fice
with
in th
e pr
ogra
mm
e ar
ea
Tim
elin
ess
of p
rogr
amm
e de
cisi
on
mak
ing
and
impl
emen
tatio
n
Mar
ketin
g an
d pr
omot
ion
of th
e U
RBA
N p
rogr
amm
e
The
esta
blis
hmen
t of c
apac
ity
build
ing
proc
ess
from
the
star
t of t
he
prog
ram
me
Stro
ng c
omm
unic
atio
n ac
ross
va
rious
leve
ls o
f man
agem
ent o
f U
RBA
N p
rogr
amm
e
Prep
arat
ion
of a
tran
sitio
n st
rate
gy
The
unde
rsta
ndin
g of
Eur
opea
n C
omm
issi
on d
ocum
ents
and
pr
oced
ures
by
thos
e in
volv
ed in
the
prog
ram
me
The
esta
blis
hmen
t of c
omm
unity
ch
est f
unds
to m
otiv
ate
and
enco
urag
e pa
rtici
patio
n fro
m s
mal
l co
mm
unity
gro
ups
The
esta
blis
hmen
t of k
ey fu
nds
to
addr
ess
the
issu
e of
sec
urin
g m
atch
fu
ndin
g by
sm
all c
omm
unity
or
gani
satio
ns
LU Dudelange-Differdange NL Rotterdam NL The Hague AT Graz AT Vienna PT Lisbon PT Porto FI Helsinki-Vantaa FI Joensuu SE Malmo SE Falun UPP UK Birmingham UK Bristol
UK Glasgow North UK Hackney Tower UK Liverpool
UK Londonderry UK Park Royal UK Sheffield UK Swansea
EU15 (Total) 30 26 17 16 15 15 13 13 10 10 8 7 7 6 6 5 4 3 3 2

Ex-post evaluation of the URBAN I Community Initiative, 1994-1999 Final Report
101
Table 5.2: Factors hindering the success of the URBAN and selected UPP programmes23 M
embe
r sta
te
Prog
ram
me
Lack
of p
rivat
e se
ctor
sup
port
and
coop
erat
ion
Lack
of p
artic
ipat
ion
of th
e lo
cal
com
mun
ity in
asp
ects
of t
he
man
agem
ent a
nd im
plem
enta
tion
of th
e pr
ogra
mm
e
Diff
icul
ties
in th
e un
ders
tand
ing
of
Euro
pean
Com
mis
sion
doc
umen
ts
and
proc
edur
es b
y th
ose
invo
lved
in
the
prog
ram
me
Del
ays
in p
rogr
amm
e de
cisi
on
mak
ing
and
impl
emen
tatio
n
Lack
of a
tran
sitio
n st
rate
gy
Com
plic
ated
fund
ing
proc
ess
and
adm
inis
tratio
n
Wea
k in
tegr
ated
app
roac
h an
d pa
rtner
ship
Lack
of p
oliti
cal s
uppo
rt an
d co
oper
atio
n
Lack
of c
ompr
ehen
sive
pr
ogra
mm
e pr
epar
atio
n, in
clud
ing
actio
n pl
anni
ng a
nd n
eeds
as
sess
men
t
Failu
re to
est
ablis
h a
capa
city
bu
ildin
g pr
oces
s fro
m th
e st
art o
f th
e pr
ogra
mm
e
Poor
com
mun
icat
ion
acro
ss
vario
us le
vels
of m
anag
emen
t of
UR
BAN
pro
gram
me
Lack
of m
arke
ting
and
prom
otio
n of
the
UR
BAN
pro
gram
me
Wea
k le
ader
ship
in th
e da
y to
day
m
anag
emen
t and
ove
rall
impl
emen
tatio
n of
the
prog
ram
me.
Failu
re to
forw
ard
fund
ing
by th
e lo
cal m
anag
ing
auth
oriti
es
Sele
ctio
n an
d co
mbi
natio
n of
pr
ojec
ts
Com
bini
ng U
RBA
N w
ith e
xist
ing
rege
nera
tion
prog
ram
mes
Res
ista
nce
of th
e lo
cal c
omm
unity
to
the
UR
BAN
pro
ject
s
The
esta
blis
hmen
t of a
loca
l pr
ojec
t offi
ce w
ithin
the
prog
ram
me
area
The
esta
blis
hmen
t of c
omm
unity
ch
est f
unds
to m
otiv
ate
and
enco
urag
e pa
rtici
patio
n fro
m s
mal
l co
mm
unity
gro
ups
BE Antwerp
BE Brussels
DK Aalborg
DE Berlin
DE Bremen
DE Duisburg-Marxloh
DE Erfurt-Ost
DE Magdeburg-Cracau
DE Rostock
GR Volos-Nea Ionia
GR Keratsini-Drapetsona
GR Thessaloniki
ES Badajoz
ES Badalona
ES Córdoba
ES Leon
ES Madrid
ES Malaga
ES Santa Coloma de Grameret
23 The identification of the factors hindering the success of the programmes was based on the national evaluator’s assessment.

Ex-post evaluation of the URBAN I Community Initiative, 1994-1999 Final Report
102
Mem
ber s
tate
Prog
ram
me
Lack
of p
rivat
e se
ctor
sup
port
and
coop
erat
ion
Lack
of p
artic
ipat
ion
of th
e lo
cal
com
mun
ity in
asp
ects
of t
he
man
agem
ent a
nd im
plem
enta
tion
of th
e pr
ogra
mm
e
Diff
icul
ties
in th
e un
ders
tand
ing
of
Euro
pean
Com
mis
sion
doc
umen
ts
and
proc
edur
es b
y th
ose
invo
lved
in
the
prog
ram
me
Del
ays
in p
rogr
amm
e de
cisi
on
mak
ing
and
impl
emen
tatio
n
Lack
of a
tran
sitio
n st
rate
gy
Com
plic
ated
fund
ing
proc
ess
and
adm
inis
tratio
n
Wea
k in
tegr
ated
app
roac
h an
d pa
rtner
ship
Lack
of p
oliti
cal s
uppo
rt an
d co
oper
atio
n
Lack
of c
ompr
ehen
sive
pr
ogra
mm
e pr
epar
atio
n, in
clud
ing
actio
n pl
anni
ng a
nd n
eeds
as
sess
men
t
Failu
re to
est
ablis
h a
capa
city
bu
ildin
g pr
oces
s fro
m th
e st
art o
f th
e pr
ogra
mm
e
Poor
com
mun
icat
ion
acro
ss
vario
us le
vels
of m
anag
emen
t of
UR
BAN
pro
gram
me
Lack
of m
arke
ting
and
prom
otio
n of
the
UR
BAN
pro
gram
me
Wea
k le
ader
ship
in th
e da
y to
day
m
anag
emen
t and
ove
rall
impl
emen
tatio
n of
the
prog
ram
me.
Failu
re to
forw
ard
fund
ing
by th
e lo
cal m
anag
ing
auth
oriti
es
Sele
ctio
n an
d co
mbi
natio
n of
pr
ojec
ts
Com
bini
ng U
RBA
N w
ith e
xist
ing
rege
nera
tion
prog
ram
mes
Res
ista
nce
of th
e lo
cal c
omm
unity
to
the
UR
BAN
pro
ject
s
The
esta
blis
hmen
t of a
loca
l pr
ojec
t offi
ce w
ithin
the
prog
ram
me
area
The
esta
blis
hmen
t of c
omm
unity
ch
est f
unds
to m
otiv
ate
and
enco
urag
e pa
rtici
patio
n fro
m s
mal
l co
mm
unity
gro
ups
ES Sevilla
ES Vigo
ES Zaragoza
FR Aulnay-sous-Bois
FR Les Mureaux
FR Lyon
FR Marseille
FR Mulhouse
FR Roubaix-Tourcoing
IE Cork
IE Dublin North
IE Dublin South
IT Bari
IT Cosenza
IT Genova
IT Napoli
IT Roma
IT Salerno
IT Trieste
LU Dudelange-Differdange
NL Rotterdam
NL The Hague AT Graz

Ex-post evaluation of the URBAN I Community Initiative, 1994-1999 Final Report
103
Mem
ber s
tate
Prog
ram
me
Lack
of p
rivat
e se
ctor
sup
port
and
coop
erat
ion
Lack
of p
artic
ipat
ion
of th
e lo
cal
com
mun
ity in
asp
ects
of t
he
man
agem
ent a
nd im
plem
enta
tion
of th
e pr
ogra
mm
e
Diff
icul
ties
in th
e un
ders
tand
ing
of
Euro
pean
Com
mis
sion
doc
umen
ts
and
proc
edur
es b
y th
ose
invo
lved
in
the
prog
ram
me
Del
ays
in p
rogr
amm
e de
cisi
on
mak
ing
and
impl
emen
tatio
n
Lack
of a
tran
sitio
n st
rate
gy
Com
plic
ated
fund
ing
proc
ess
and
adm
inis
tratio
n
Wea
k in
tegr
ated
app
roac
h an
d pa
rtner
ship
Lack
of p
oliti
cal s
uppo
rt an
d co
oper
atio
n
Lack
of c
ompr
ehen
sive
pr
ogra
mm
e pr
epar
atio
n, in
clud
ing
actio
n pl
anni
ng a
nd n
eeds
as
sess
men
t
Failu
re to
est
ablis
h a
capa
city
bu
ildin
g pr
oces
s fro
m th
e st
art o
f th
e pr
ogra
mm
e
Poor
com
mun
icat
ion
acro
ss
vario
us le
vels
of m
anag
emen
t of
UR
BAN
pro
gram
me
Lack
of m
arke
ting
and
prom
otio
n of
the
UR
BAN
pro
gram
me
Wea
k le
ader
ship
in th
e da
y to
day
m
anag
emen
t and
ove
rall
impl
emen
tatio
n of
the
prog
ram
me.
Failu
re to
forw
ard
fund
ing
by th
e lo
cal m
anag
ing
auth
oriti
es
Sele
ctio
n an
d co
mbi
natio
n of
pr
ojec
ts
Com
bini
ng U
RBA
N w
ith e
xist
ing
rege
nera
tion
prog
ram
mes
Res
ista
nce
of th
e lo
cal c
omm
unity
to
the
UR
BAN
pro
ject
s
The
esta
blis
hmen
t of a
loca
l pr
ojec
t offi
ce w
ithin
the
prog
ram
me
area
The
esta
blis
hmen
t of c
omm
unity
ch
est f
unds
to m
otiv
ate
and
enco
urag
e pa
rtici
patio
n fro
m s
mal
l co
mm
unity
gro
ups
AT Vienna PT Lisbon PT Porto FI Helsinki-Vantaa FI Joensuu SE Malmo SE Falun UPP UK Londonderry UK Birmingham UK Bristol UK Glasgow North UK Hackney Tower UK Liverpool UK Park Royal
UK Sheffield UK Swansea EU15 (Total) 13 12 6 6 5 5 4 4 3 3 3 2 2 2 1 1 1 1

Ex-post evaluation of the URBAN I Community Initiative, 1994-1999 Final Report
104
ANNEX 6 –IMPACTS OF THE URBAN PROGRAMMES24
Member State Programme
Physical environ-
ment
Socio economic impacts
Resistance from the
local community
Social capital
impacts
City structure
and functionality
Positive impacts on neighbour-ing areas
Negative impacts on neighbour-ing areas
Institutional impacts
City strategies
Regional develop-
ment
BE Antwerp
BE Brussels
BE Charleroi
BE Mons-La Louvière
DE Berlin
DE Brandenburg
DE Bremen
DE Chemnitz
DE Duisburg-Marxloh
DE Erfurt-Ost
DE Halle
DE Kiel
DE Magdeburg-Cracau
DE Rostock
DE Saarbrucken
DE Zwickau
DE Leipzig UPP
DK Aalborg
GR Ermoupolis
GR Keratsini-Drapetsona
GR Patras
GR Peristeri
24 The identification of the impacts of each programme was based on the national evaluator’s assessment.

Ex-post evaluation of the URBAN I Community Initiative, 1994-1999 Final Report
105
Member State Programme
Physical environ-
ment
Socio economic impacts
Resistance from the
local community
Social capital
impacts
City structure
and functionality
Positive impacts on neighbour-ing areas
Negative impacts on neighbour-ing areas
Institutional impacts
City strategies
Regional develop-
ment
GR Thessaloniki
GR Volos-Nea Ionia
GR Alexanderpolis UPP
ES Albacete
ES Aviles
ES Badajoz
ES Badalona
ES Baracaldo
ES Cadiz
ES Cartagena
ES Castellon
ES Córdoba
ES Huelva
ES La Coruna
ES Langreo
ES Leon
ES Madrid
ES Malaga
ES Murcia
ES Palma de Mallorca
ES Pontevedra
ES Sabadell
ES Salamanca
ES Santa Coloma de Grameret
ES Santander
ES Sevilla
ES Telde
ES Toledo

Ex-post evaluation of the URBAN I Community Initiative, 1994-1999 Final Report
106
Member State Programme
Physical environ-
ment
Socio economic impacts
Resistance from the
local community
Social capital
impacts
City structure
and functionality
Positive impacts on neighbour-ing areas
Negative impacts on neighbour-ing areas
Institutional impacts
City strategies
Regional develop-
ment
ES Valencia
ES Valladolid
ES Vigo
ES Zaragoza
ES Bilbao UPP
FR Amiens
FR Aulnay-sous-Bois
FR Bastia
FR Chalon-sur-Saone
FR Clichy-sous-Bois
FR Les Mureaux
FR Lyon
FR Mantes-la-Jolie
FR Marseille
FR Mulhouse
FR Roubaix-Tourcoing
FR Saint-Etienne
FR Valenciennes
IE Cork
IE Dublin North
IE Dublin South
IT Bari
IT Cagliari
IT Catania
IT Catanzaro
IT Cosenza
IT Foggia
IT Genova

Ex-post evaluation of the URBAN I Community Initiative, 1994-1999 Final Report
107
Member State Programme
Physical environ-
ment
Socio economic impacts
Resistance from the
local community
Social capital
impacts
City structure
and functionality
Positive impacts on neighbour-ing areas
Negative impacts on neighbour-ing areas
Institutional impacts
City strategies
Regional develop-
ment
IT Lecce
IT Napoli
IT Palermo
IT Reggio Calabria
IT Roma
IT Salerno
IT Siracusa
IT Trieste
IT Venezia
LU Dudelange-Differdange
NL Amsterdam
NL Rotterdam
NL The Hague
NL Utrecht
AT Graz
AT Vienna
PT Amadora
PT Gondomar
PT Lisbon
PT Loures
PT Oeiras
PT Porto
SE Malmo
SE Falun UPP
FI Helsinki-Vantaa
FI Joensuu
FI Helsinki-UPP
UK Belfast
UK Birmingham
UK Brighton

Ex-post evaluation of the URBAN I Community Initiative, 1994-1999 Final Report
108
Member State Programme
Physical environ-
ment
Socio economic impacts
Resistance from the
local community
Social capital
impacts
City structure
and functionality
Positive impacts on neighbour-ing areas
Negative impacts on neighbour-ing areas
Institutional impacts
City strategies
Regional develop-
ment
UK Bristol
UK Coventry
UK Glasgow North
UK Hackney Tower
UK Leasowe
UK Leeds
UK Liverpool
UK Londonderry
UK Manchester
UK Netherton
UK North Huyton
UK Nottingham
UK Paisley
UK Park Royal
UK Sheffield
UK Swansea
EU15 (Total) 116 107 102 63 58 45 24 10 9 8

Ex-post evaluation of the URBAN I Community Initiative, 1994-1999 Final Report
109
ANNEX 7 – RESULTS RELATING TO THE RESEARCH HYPOTHESES
A series of hypotheses to be tested during the evaluation was developed for each Task, following an initial review of literature, and documentation relating to the programmes. These were discussed with the European Commission and the Panel of Experts, and revised accordingly. The national evaluators were then asked to indicate, for their member state, the validity of each hypothesis in the light of specific evidence from their research into the programmes. The table below shows the results from this exercise, each cross representing the response of a member state.
Hypotheses tested: Strong
supporting evidence
Some supporting evidence
No evidence
to support or
contradict
Evidence to both support
and contradict
Some evidence
to contradict
Strong evidence
to contradict
No opinion
Areas selected and strategies adopted
1
The effectiveness of URBAN was greater when the programme was part of a city / sub-regional / metropolitan area strategy.
2a Levering private sector business resources into the programme areas improve: The credibility of the URBAN programme
2b The image of the area
2c The efficiency in the implementation phase
2d The possibility of reaching a critical mass in the financing
2e Prospects for further investment through a catalytic effect
3
The programme selection criteria, as outlined in the URBAN I Communication, led to the targeting of the most disadvantaged areas

Ex-post evaluation of the URBAN I Community Initiative, 1994-1999 Final Report
110
Hypotheses tested: Strong
supporting evidence
Some supporting evidence
No evidence
to support or
contradict
Evidence to both support
and contradict
Some evidence
to contradict
Strong evidence
to contradict
No opinion
4
The success of the URBAN programmes depended upon the pre-existence of a network of institutional, social and economic actors at the local level.
5 The success of the URBAN programme depended upon the creation of new networks
6
The best use of relatively small-scale resources is to target areas with ‘potential’, rather than the ‘worst’ places, where small-scale resources cannot make a difference.
Effectiveness
7
Promoting integration and synergies between policy fields and local government departments was a factor that contributed to the success of the URBAN programmes.
8
Where funding per targeted population was greater, the impact was proportionally larger than the increased resources. a. Less than 5000
9a The optimum population size of target area for a 5 year URBAN programme of 10 million euro is. Less than 5000
9b 5001-15,000
9c 15501-30,000
9d Above 30,000

Ex-post evaluation of the URBAN I Community Initiative, 1994-1999 Final Report
111
Hypotheses tested: Strong
supporting evidence
Some supporting evidence
No evidence
to support or
contradict
Evidence to both support
and contradict
Some evidence
to contradict
Strong evidence
to contradict
No opinion
10a The URBAN programme has led to changes in social mix in the target areas, as a consequence of: housing demolition led to out-migration of the original residents
10b area improvements increased land rents and effectively displaced original residents
11
Networking at the national level has brought significant benefits in improved practice to the URBAN programme and beyond.
12
Networking at the transnational level has brought significant benefits in improved practice to the URBAN programme and beyond.
13a Intersectoral “integration” took place during: the design of the programmes
13b the management of the programmes
13c as a result of the implementation of the programmes
14
The level of the resources meant that it was difficult to balance the need for physical regeneration activities, which are expensive, with socially orientated actions.
15a The deadlines for expenditure and restrictions on time reduced the innovative potential of the programme by: limiting the potential for local debate
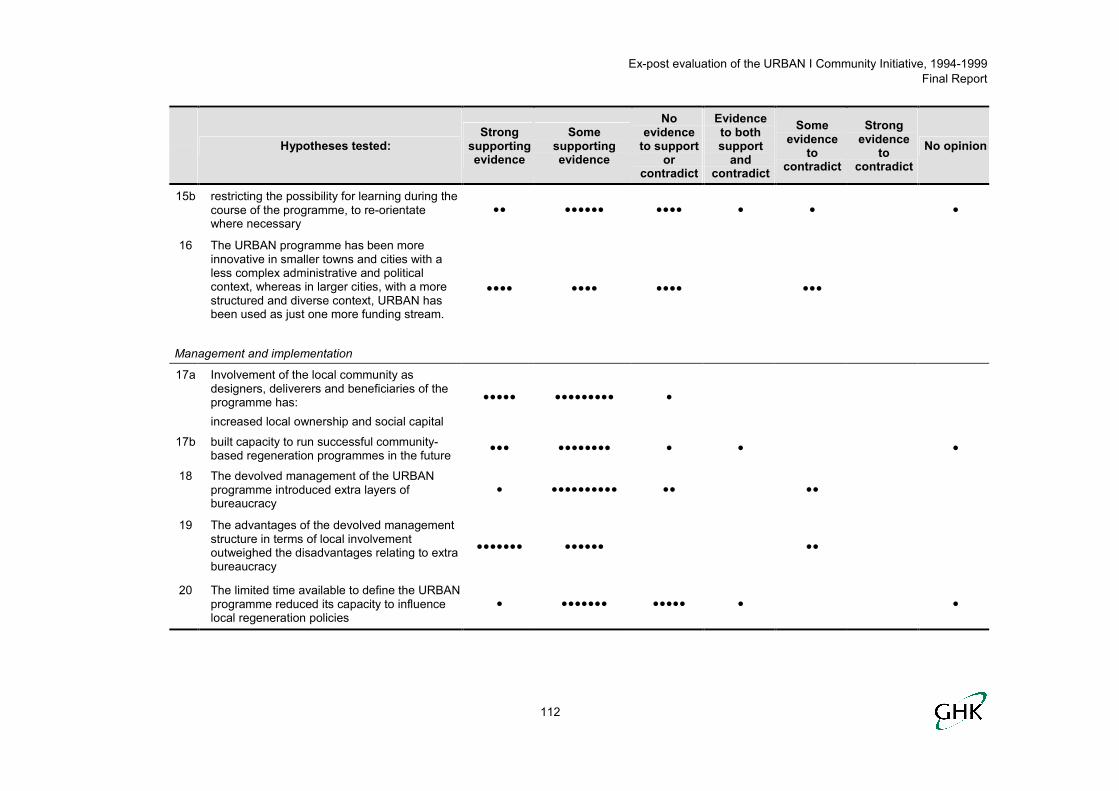
Ex-post evaluation of the URBAN I Community Initiative, 1994-1999 Final Report
112
Hypotheses tested: Strong
supporting evidence
Some supporting evidence
No evidence
to support or
contradict
Evidence to both support
and contradict
Some evidence
to contradict
Strong evidence
to contradict
No opinion
15b
restricting the possibility for learning during the course of the programme, to re-orientate where necessary
16
The URBAN programme has been more innovative in smaller towns and cities with a less complex administrative and political context, whereas in larger cities, with a more structured and diverse context, URBAN has been used as just one more funding stream.
Management and implementation
17a Involvement of the local community as designers, deliverers and beneficiaries of the programme has: increased local ownership and social capital
17b built capacity to run successful community-based regeneration programmes in the future
18
The devolved management of the URBAN programme introduced extra layers of bureaucracy
19
The advantages of the devolved management structure in terms of local involvement outweighed the disadvantages relating to extra bureaucracy
20
The limited time available to define the URBAN programme reduced its capacity to influence local regeneration policies

Ex-post evaluation of the URBAN I Community Initiative, 1994-1999 Final Report
113
Hypotheses tested: Strong
supporting evidence
Some supporting evidence
No evidence
to support or
contradict
Evidence to both support
and contradict
Some evidence
to contradict
Strong evidence
to contradict
No opinion
21
The limited time available to define the URBAN programme reduced the possibility of involving the local community and non institutional actors in the programme’s design
22
The lack of previous local experience reduced the possibility of involving the local community and non institutional actors in the programme’s design
23 Projects developed later in the programme period benefited from administrative learning.
Impact of the URBAN CI
24
The impact of the URBAN programme on the targeted neighbourhoods was greater than initial expectations
25a
The URBAN programmes have had an impact on the cities in which they were located, acting as: a catalyst for further regeneration
b a booster for the attractiveness of the city and its external image
26
a
The majority of those questioned during the ex-post evaluation perceive that the quality of life in the URBAN area improved significantly: Residents
b Non-residents
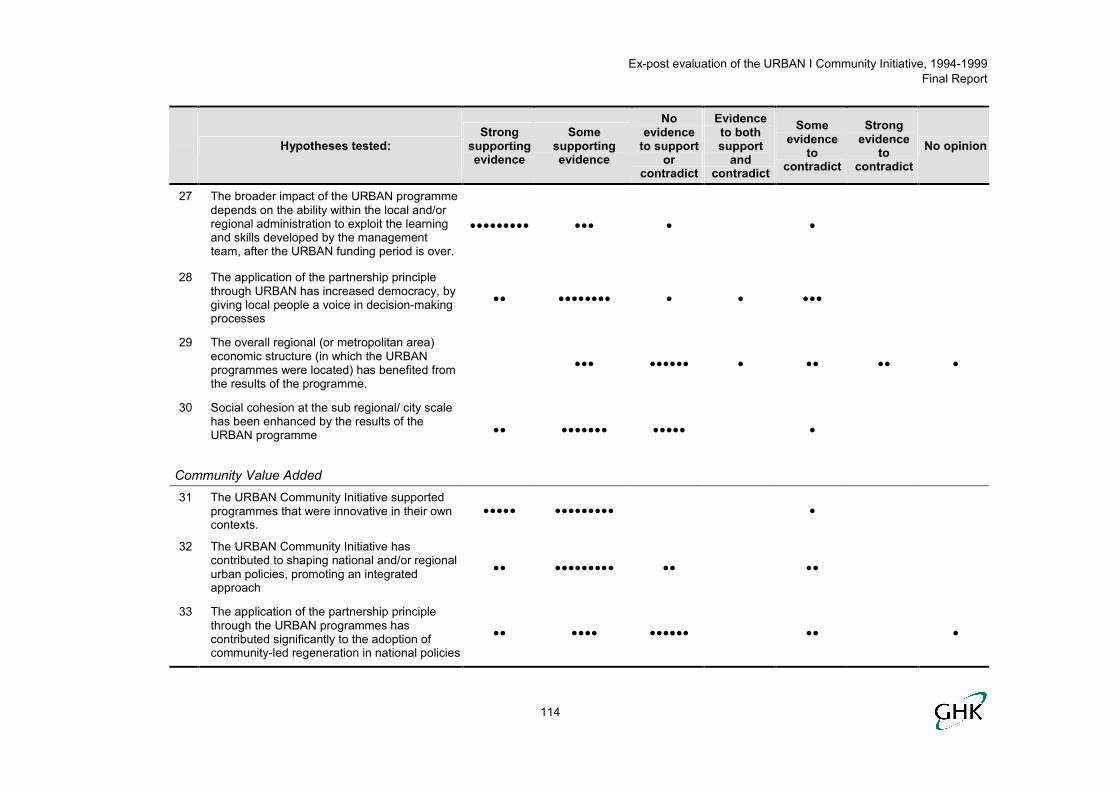
Ex-post evaluation of the URBAN I Community Initiative, 1994-1999 Final Report
114
Hypotheses tested: Strong
supporting evidence
Some supporting evidence
No evidence
to support or
contradict
Evidence to both support
and contradict
Some evidence
to contradict
Strong evidence
to contradict
No opinion
27
The broader impact of the URBAN programme depends on the ability within the local and/or regional administration to exploit the learning and skills developed by the management team, after the URBAN funding period is over.
28
The application of the partnership principle through URBAN has increased democracy, by giving local people a voice in decision-making processes
29
The overall regional (or metropolitan area) economic structure (in which the URBAN programmes were located) has benefited from the results of the programme.
30
Social cohesion at the sub regional/ city scale has been enhanced by the results of the URBAN programme
Community Value Added
31
The URBAN Community Initiative supported programmes that were innovative in their own contexts.
32
The URBAN Community Initiative has contributed to shaping national and/or regional urban policies, promoting an integrated approach
33
The application of the partnership principle through the URBAN programmes has contributed significantly to the adoption of community-led regeneration in national policies

Ex-post evaluation of the URBAN I Community Initiative, 1994-1999 Final Report
115
Hypotheses tested: Strong
supporting evidence
Some supporting evidence
No evidence
to support or
contradict
Evidence to both support
and contradict
Some evidence
to contradict
Strong evidence
to contradict
No opinion
34
The URBAN programme added value by promoting the dissemination of good practice and the transfer of knowledge.
35
The EU ‘label’ is in itself an added value in the programme area, as it gives legitimacy and creates greater commitment to the programme for all actors involved.
36
The EU ‘label’ has contributed to enhancing the image of ‘Europe’ amongst those affected by URBAN Programmes.

Ex-post evaluation of the URBAN I Community Initiative, 1994-1999 Final Report
116
ANNEX 8 – THE RESULTS OF THE PRIORITY EVALUATION EXERCISE
In order to inform the conclusions of the final report, the national evaluators were invited to express their priorities for a number of hypothetical cases and options, to answer the question: “What are the implications of the findings of ex post evaluation of URBAN I for the future of EU, national and regional policy?”.
The national evaluators were asked to put themselves in the position of a Minister in their country, in charge of a new (modified) URBAN-style programme, and to give their opinion on the most appropriate means of allocating resources in their national context. They were given a budget of 500 million euros to distribute (in units of 50 million euros) to the most appropriate options. In each case, a limited number of options was presented. Their opinions were based as far as possible on the findings of the national evaluation work.
The findings were used to inform the conclusions of the overall evaluation, and the extent to which specific lessons are applicable in different contexts.
The cases presented were as follows:
How should resources be best used to meet the objectives of URBAN? If 500 million euro were available for programmes pursuing similar objectives to URBAN in your country over the next 5 years, how should the resources be best distributed between types of interventions?
How should resources be allocated across various sizes of areas? If 500 million euro were available for a new URBAN CI with similar objectives and methods/guidelines in your country over the next 5 years, how should the resources be best distributed between interventions in different sized areas?
How should resources be allocated across various types of areas? If 500 million euro were available for a new URBAN CI with similar objectives and methods/guidelines in your country over the next 5 years, how should the resources be best distributed between interventions in different types of areas?
How should resources be allocated across various types of intervention domains? If 500 million euro were available for a new URBAN CI with similar objectives and methods/guidelines in your country over the next 5 years, how should the resources be best distributed between interventions?
Answers to these five questions are provided in Table 8.1 (Priority Evaluation Part 1). Responses are expressed as a percentage, by member state. The overall EU15 percentage has not been weighted by the scale of the member state.

Ex-post evaluation of the URBAN I Community Initiative, 1994-1999 Final Report
117
What priority should be placed on the factors influencing the allocation of resources? If resources were available for a new URBAN CI with similar objectives and methods/guidelines in your country over the next 5 years, what priority should be given to the following factors in allocating resources?
What is the priority focus of a new URBAN CI? If EU resources were available for a new Urban CI with similar objectives to URBAN what would your preference be for the emphasis, between: a replica URBAN Initiative; a CI but with a stronger emphasis on their role in city wide strategies; a CI to be used by countries/regions/cities to be used to develop urban policies.
What is the preferred institutional arrangements for implementation? If EU resources were available for a new Urban programme with similar objectives to URBAN, what would your preference be for the institutional arrangements for allocating resources?
Answers to these three questions are provided in Table 8.2 (Priority Evaluation Part 2). The responses provide a ranking of the different options by member state. The overall ranking at the EU level has not been weighted by the scale of the member state.

Ex-post evaluation of the URBAN I Community Initiative, 1994-1999 Final Report
118
Table 8.1: Priority evaluation for a future URBAN CI (Part 1) – All figures are in percentages
How should resources be best used to meet the objectives of URBAN?
How should resources be allocated across various sizes of areas?
How should resources be allocated across various types of areas?
How should resources be allocated across various types of intervention domains?
Mem
ber s
tate
A -In
terv
entio
ns fo
cuse
d on
the
mos
t dis
adva
ntag
ed a
reas
B - I
nter
vent
ions
focu
sed
on
area
s w
ith d
isad
vant
age,
but
not
ne
cess
arily
the
wor
st b
ut w
here
th
ere
are
evid
ent r
ealis
able
op
portu
nitie
s
C -
Inte
rven
tions
not
focu
sed
on
spec
ific
area
s bu
t tha
t ena
ble
reso
urce
s to
be
used
for a
var
iety
of
UR
BAN
pro
ject
s w
ithin
wid
er
city
leve
l stra
tegi
es
D -
Inte
rven
tions
invo
lvin
g th
e im
prov
emen
t of p
ublic
ser
vice
s to
th
e be
nefit
of t
hose
livi
ng in
di
sadv
anta
ged
area
s
E - O
ther
inte
rven
tions
that
wou
ld
mee
t UR
BAN
CI t
ype
obje
ctiv
es.
Plea
se s
peci
fy.
A- A
reas
with
less
than
500
0 po
pula
tion
B - 5
000-
1500
0
C -
1500
0-30
000
D -
Abov
e 30
000
A -T
own
and
city
cen
tres
or
near
by a
reas
(i.e
. the
com
mer
cial
ce
ntre
)
B - D
epriv
ed ‘i
nner
’ are
as c
lose
to
city
cen
tres
(i.e.
resi
dent
ial a
reas
)
C -
Urb
an fr
inge
are
as (i
.e.
depr
ived
per
iphe
ral r
esid
entia
l ar
eas)
D -
Area
s of
his
toric
or
cons
erva
tion
inte
rest
with
di
sadv
anta
ges
E - O
ther
type
s of
are
a, p
leas
e sp
ecify
A - m
ixed
use
and
en
viro
nmen
tally
frie
ndly
br
ownf
ield
dev
elop
men
t;
B - s
uppo
rt fo
r ent
repr
eneu
rshi
p an
d em
ploy
men
t
C- i
nteg
ratio
n of
exc
lude
d pe
rson
s
D -
inte
grat
ed p
ublic
tran
spor
t;
E - t
he a
pplic
atio
n of
info
rmat
ion
soci
ety
tech
nolo
gies
F- w
aste
min
imis
atio
n
G -
othe
r
BE 30 30 10 20 10 10 40 40 10 0 40 40 20 0 10 30 30 10 10 10 0
DK 30 40 20 10 0 0 20 60 20 20 50 30 0 0 20 30 50 0 0 0 0
DE 40 20 20 20 0 20 40 40 0 20 20 40 20 0 20 20 20 0 0 0 40
GR 20 30 10 10 30 0 20 80 0 20 20 20 40 0 20 0 20 30 0 30 0
ES 60 20 20 0 0 0 0 40 60 0 30 40 30 0 50 30 20 0 0 0 0
FR 70 30 0 0 0 0 50 50 0 0 0 70 30 0 10 50 30 0 10 0 0
IE 50 20 10 20 0 10 10 40 40 10 40 40 10 0 20 40 20 20 0 0 0
IT 70 0 0 0 30 20 30 30 20 0 50 50 0 0 10 20 30 30 10 0 0
LU 70 0 0 30 0 100 0 0 0 0 50 50 0 0 0 70 30 0 0 0 0
NL 30 30 10 20 10 0 5 15 80 10 40 10 30 10 20 50 20 0 0 0 10
AT 40 20 20 20 0 20 40 40 0 20 20 40 0 20 20 20 20 0 0 0 40
PT 50 30 0 20 0 0 20 30 50 0 20 50 30 0 30 20 20 10 20 0 0
FI 30 30 40 0 0 0 20 40 40 0 30 70 0 0 30 40 30 0 0 0 0
SE 30 50 20 0 0 0 30 70 0 0 30 70 0 0 20 30 50 0 0 0 0
UK 40 10 50 0 0 50 50 0 0 30 40 30 0 0 20 40 30 0 10 0 0
EU15 44 24 15 11 5 15 25 38 21 9 32 43 14 2 20 33 28 7 4 2 6

Ex-post evaluation of the URBAN I Community Initiative, 1994-1999 Final Report
119
Table 8.2: Priority evaluation for a future URBAN CI (Part 2)
What priority should be placed on the factors influencing the allocation of resources?
What is the priority focus of a new URBAN CI?
What is the preferred institutional arrangements for implementation?
Mem
ber s
tate
A- T
he q
ualit
y of
the
stra
tegi
es
B –
The
qual
ity o
f the
im
plem
enta
tion
arra
ngem
ents
C –
The
mos
t eas
t to
impl
emen
t
D –
Oth
er c
riter
ia
A –
A re
plic
a U
RBA
N C
I
B –
A C
I but
with
a s
trong
er
emph
asis
on
city
wid
e st
rate
gies
C –
A C
I to
be u
sed
by c
ount
ries/
re
gion
s/ c
ities
to d
evel
op u
rban
po
licie
s
A –
Allo
cate
d as
a C
I
B –
Allo
cate
d w
ithin
SF
Obj
ectiv
e 1
or 2
BE 2nd 1sr 3rd 4th 2nd 3rd 1st 1st -
DK 1st 2nd 3rd 4th - 1st - 1s -
DE 3rd 2nd 4th 1st 2nd 1st 3rd 1s -
GR 1st 2nd 4th 3rd - - 1st 1s -
ES 1st 3rd 4th 2nd 1st - - 1s -
FR 2nd 1st 3rd 4th 1st 3rd 2nd 1s -
IE 2nd 1st 4th 3rd 1st 2nd 3rd 1s -
IT 1st 2nd 3rd 4th 1st 3rd 2nd 1s -
LU 2nd 1st 4th 3rd 1st - - 1s -
NL 2nd 1st 4th 3rd 1st - - 1s -
AT 4th 2nd 1st 3rd 3rd 1st 2nd 1s -
PT 1st 2nd 3rd 4th - - 1st 1s -
FI 1st 2nd 3rd 4th 2nd 1st 3rd 1s -
SE 1st 2nd 3rd 4th - 1st - 1s -
UK 3rd 1st 4th 2nd 2nd 1st 3rd 1s -
EU15 2nd 1st 3rd 3rd 1st 1st 3rd 1st

Ex-post evaluation of the URBAN I Community Initiative, 1994-1999 Final Report
120
ANNEX 9 – MANAGEMENT AND IMPLEMENTATION COSTS
The two tables below provide an estimation of the management and implementation costs of the URBAN programme, the first by member state, the second by programme. The data presented are based either on cost estimates provided by the programme managers, or on technical assistance costs where estimates were not available. In the case of Luxembourg, no data were available.
Although obtaining information on management and implementation costs for the evaluation was a requirement for 35 of the URBAN programmes, specific data were very difficult to obtain. Some of the reasons for this were: management costs were internalised within the management organisation’s existing costs; and the difficulty in attributing the cost of staff working on URBAN as well as on other programmes.
Where the costs were estimated by the programme managers, the definition of the management costs varied from the number of additional staff employed to the purchase of additional equipment. In many cases technical assistance (TA) costs were given as proxy management costs. TA costs would normally include preparation, implementation, monitoring, publicity and evaluation but could also include innovative actions and information to the public. The data collected were not therefore strictly comparable. This is reflected in the large ranges within the data. It is possible that some of the very low figures do not accurately reflect all aspects of management.
There were also other costs associated with the management of the programme, at the national level through the managing authorities, as well as administrative costs at the EU level, which are not reflected in the tables below.
Table 9.1: Costs by Member State
Member State Source of information Management costs as % of total cost
Belgium TA cost 1.50% Denmark TA cost 5.00% Germany TA cost 4.60% Greece TA cost 0.30% Spain Estimate 5.87% France Estimate 4.80% Ireland TA cost 3.83% Italy Estimate 0.76% Luxembourg TA cost Not available Netherlands TA cost 1.96% Austria TA cost 1.25% Portugal Estimate 7.35% Finland TA cost 11.55% Sweden TA cost 5.00% UK TA cost 2.25%

Ex-post evaluation of the URBAN I Community Initiative, 1994-1999 Final Report
121
Table 9.2: Costs by sampled URBAN programmes
Programme Source of information Management costs as % of total cost
Belgium TA cost 1.50% Antwerp TA cost 1.99%
Brussels TA cost 1.00%
Denmark TA cost 5.00%
Aalborg TA cost 5.00%
Germany TA cost 4.60% Berlin TA cost 6.08%
Duisburg Estimate 5.40%
Magdeburg TA cost 2.30%
Greece TA cost 0.30% Keratsini TA cost 0.52%
Volos TA cost 0.05%
Spain Estimate 5.87% Badajoz TA cost 5.56%
Cordoba Estimate 4.83%
Leon Estimate 3.81%
Sta Colomma Estimate 4.33%
Sevilla TA cost 6.31%
Bilbao (UPP) Estimate 10.40%
France Estimate 4.80% Aulnay-sous-Bois
Estimate 3.80%
Lyon Estimate 6.60%
Marseille Estimate 4.00%
Ireland TA cost 3.83% Cork Estimate 3.50%
Dublin North TA cost 6.00%
Dublin South TA cost 2.00%
Italy Estimate 0.76% Cosenza Estimate 0.05%
Roma TA cost TBC
Salerno Estimate 1.47%
Luxembourg TA cost Not available Dudelange-Differdange
TA cost Not available
Netherlands TA cost 1.96% Rotterdam TA cost 2.70%
The Hague TA cost 1.22%
Austria TA cost 1.25% Vienna TA cost 1.25%

Ex-post evaluation of the URBAN I Community Initiative, 1994-1999 Final Report
122
Programme Source of information Management costs as % of total cost
Portugal Estimate 7.35% Lisbon Estimate 7.90%
Porto Estimate 6.80%
Finland TA cost 11.55% Helsinki TA cost 9.10%
Joensuu TA cost 14.00%
Sweden TA cost 5.00% Malmo TA cost 5.00%
Falun (UPP) TA cost 5.00%
UK TA cost 2.25% Birmingham TA cost 1.50%
Swansea TA cost Not available
Glasgow TA cost 3.00%