evolution of the russian political party system …the big bang of the russian political party...
TRANSCRIPT

Munich Personal RePEc Archive
Evolution of the Russian Political Party
System under the Influence of Social
Conformity: 1993-2011
Coleman, Stephen
Metropolitan State University
October 2014
Online at https://mpra.ub.uni-muenchen.de/59038/
MPRA Paper No. 59038, posted 02 Oct 2014 16:14 UTC
Evolution of the Russian Political Party System under the Influence
of Social Conformity: 1993-2011
Stephen Coleman*
Metropolitan State UniversitySt. Paul, Minnesota
October 2014
Abstract
The Russian political party system has developed through a tumultuous era, progressing from
extreme fragmentation to a smaller, more stable number of parties. Much of this change was
engineered by elites and especially by President Putin, leading to the question of whether the
result is a normal party system by traditional Western standards or just a tool of the government.
By means of a predictive mathematical model, the analysis shows that the party system indeed
has grown strong popular roots with a great impact on the overall distribution of votes among the
parties. This is caused by the pervasive but unconscious effect of social conformity on voters.
Keywords: Russia; political parties; voting; mathematical model; social conformity; unconsciousbehavior
*Correspondence to: [email protected]

Evolution of the Russian Political Party System under the Influence
of Social Conformity: 1993-2011
1. Introduction
The Big Bang of the Russian political party system was in 1993, the first parliamentary election.
It produced an explosion of parties, parties in name only, and independent candidates. From its
inception political scientists have seen this as an extraordinary opportunity to study the evolution
of a party system, a challenge that continues and likely will for many years. It is a chance to
reexamine familiar tenets: that it takes a long time for a stable party system to evolve (Converse,
1969), and that parties represent fundamental social or class cleavages in a society (Lipset and
Rokkan, 1967). But no one disputes that a successful party system is necessary for democratic
government. The outcome for Russia’s party system will have an impact far beyond academic
concerns.
Observers of Russia’s party system tend in one of two directions: Either the party system is
mainly a top-down business manipulated by and for elites (McFaul, 2001; Gelman, 2008; White,
Rose, and McAllister, 1997; Moser, 1999; Ishiyama and Kennedy, 2001; Reuter 2010), or there
truly are popular roots for the parties that will lead to a normal party system, perhaps sooner
rather than later (Brader and Tucker, 2001; Miller and Klobucar, 2000; Miller, Erb, Reisinger,
and Hesli, 2000). This analysis weighs in on the question with a new methodological perspective
that will illuminate the degree to which the party system has evolved toward normalcy from
1993 to 2011. The analysis shows that the cognitive process underlying social conformity can be
modeled mathematically to reveal the aggregate effect of conformity on people’s choices to vote
2
and, if voting, for which party. Remarkably, voters typically are not aware of the influence of
conformity on their voting decisions. And decisions made under the influence of conformity may
not follow the expected rules of rational choice.
2. The Russian Party System
The environment of the party system is complex and confusing because laws about the parties
and election rules have changed almost continually from the beginning, as if each election were a
new experiment to get things right. Parliamentary elections were held in 1993, 1995, 1999, 2003,
2007, and 2011. (Presidential elections took place in 1991, 1996, 2000, 2004, 2008 and 2012).
In the first election to the parliament (Duma) in 1993 half of the candidates were elected by
proportional representation from party lists and the other half from 225 single-member districts
without party designation on the ballot. Thirteen parties met the legal qualifications to compete;
eight got seats in the parliament (and there was an “against all” option, too). No party received a
majority, and parliamentary government was relatively unstable. The excessive fragmentation of
the party system has led over successive elections to more and more constraints on parties,
including minimum membership size, number of signatures to get on the ballot, minimum
regional support and organization, financial requirements, and a prohibition against party blocs.
And increasing shares of the vote were required to gain a seat in the parliament, now at seven
percent. The single-member districts were eliminated after the 2003 election.
Party consolidation accelerated when President Putin endorsed a new party, United Russia, in
2003, which itself was created through a merger of parties in 2001. Other parties also have
3

changed and consolidated over the last few elections. Owing to a term limit on the presidency, in
2007 President Putin headed up the United Russia party list, himself, becoming prime minister as
United Russia became the first party to have a clear majority in parliament. United Russia again
won a majority of seats in 2011 but with less strength from 2007, forestalling the possibility of a
return to a one-party-dominant state. Manipulation of the media by the government helped
United Russia achieve its win, while the elections were marred by frequent reports of voting
irregularities. Manipulation of electoral laws, the media, and the party system in the Putin era is
ample evidence of the heavy hand of elites. So the burden of proof is on demonstrating the
contrary view, namely, that the party system is evolving toward normalcy with a firm basis in
popular support.
A timeline of party change is shown in Figure 1. One can trace the number of parties on the
ballot, the number gaining seats in the parliament, and the “effective” number of parties (Laakso
and Taagepera, 1979). The effective number is the average across the regions. The overall
number on the ballot has decreased markedly along with the effective number, indicating the
decline in party system fragmentation, which was the goal of the electoral reforms.
4

Figure 1. Timeline of parliamentary elections with the number of parties on the party list
ballot, the “effective” number, and the number with seats in the Duma.
5
1990 1995 2000 2005 2010 2015
Year
0
5
10
15
20
In Duma"Effective"On Ballot

3. The Social Conformity Model
This analysis is based on a predictive mathematical model that captures the effect of social
conformity on people’s collective social choices (Coleman, 1975; 2004; 2007a; 2010; Borodin,
2005). The strength of the model in a given election indicates how much of voting turnout and
party choices may be attributed to the effect of conformity. The model is derived from several
principles of conformity in social psychology (Cialdini, 1990; 1993; Coleman, 2007a). First is
the fact that people often align their behavior with the behavior of others or act in accord with a
widely held social norm. This can depend, however, on whether people’s attention is brought to
bear on the specific norm or behavior involved, which is certainly the case in a national election.
Second, when more people are doing something, then others are increasingly likely to do the
same, although this process is self-limiting as not everyone will come into conformity. Third is
the principle that people are fairly consistent in their degree of collective conformity from one
situation to another. The closer the connection is between situations, the more likely people are
to act consistently. Conformity is greatly affected by nonconscious cognitive processes (Bargh et
al., 2012). This type of cognition involves the prefrontal cortex, a different brain system than is
used for conscious reasoning but related to Kahneman’s (2011) fast thinking System 1, which is
unconscious and automatic. People’s conformity with a social norm can occur without their
conscious awareness, and they may attribute their behavior to other reasons. Individuals may
correctly see that social conformity affects others’ behavior while holding the illusion that their
own behavior is not affected by social influence (Pronin, Berger, and Molouki, 2007). People
will conform in private situations as well as in public and change their attitudes and preferences
to conform to others. Research has demonstrated conformity effects at both individual and
6

aggregate levels of analysis.
Many political scientists and economists ignore the cognitive and psychological foundations of
conformity and try to explain it by rational choice models. But whether conformity can be
analyzed within the scope of rational choice is questionable. The rational choice assumption is
that if people conform to a social norm, it must be because they see a benefit for conforming or
by not conforming face possible loss or punishment. For example, Fehr and Gaechter (1998)
attribute conformity to the social norm of fairness as stemming from an expectation of
reciprocity. Along these same lines, Durlauf and Young (2001) offer a collection of models to
explain the aggregate effects of rational, individual decisions under social influence.
Bikhchandani, Hirshleifer, and Welch (1998) develop a conformity model to explain herding in
economic decisions, including consumer marketing and such effects as stock market bubbles or
crashes. Their model assumes that people’s decisions are conscious and rational but based on
observational information. They assert that when people are trying to decide which of several
alternatives is the best decision to take, and they use information about others’ choices as a guide
to what’s best, then a cascade of like decisions will result. Behavioral economists, by contrast,
have demonstrated that social influence and collective norms often dominate self-interest and
change the order of individual preferences, violating assumptions of rational choice models
(Heinrich, et. al., 2004). In his extensive analysis of whether conformity with social norms fits
the rational choice model, Elster (1989) concludes that social norms cannot be reduced to
rationality or any other optimizing individual decision.
Applied to voting behavior, the model of conformity makes the following argument. The social
7
norm that citizens should vote exerts a strong influence on behavior, and research indicates this
is the primary reason that people vote (Blais, 2000). The great attention given to a national
election heightens people’s awareness that they should vote and strengthens the effect of the
voting norm. People are influenced toward voting by how often they expect others to vote and
for whom (Gerber and Rogers, 2009). Prospective voters can get this information through
informal social channels, opinion polls (frequently reported in Russia), and by their knowledge
of how others voted in previous elections. The effect of conformity on the decision to vote then
spills over to a consistent degree among many people in their choice of political parties, affecting
the distribution of votes among the parties or candidates (for a single office). As more people
decide to vote out of a desire to conform, following the majority norm, they also are more likely
to vote for the political parties that most other people are voting for. These principles lead to a
mathematical model of the relationship between voter turnout and the distribution of votes
among parties when influenced by social conformity.
The applicability of the model becomes a test for the effect of conformity on voting behavior and
its degree of influence. Some voters may vote for reasons other than social conformity, as
predicted, for example, by rational choice voting models; the model does not apply to this group.
But if social conformity has a strong effect on a significant proportion of voters, it will have a
unique and predictable impact on the election result—it leaves a signature or fingerprint of its
effect that one can detect through quantitative analysis. It is this model that was demonstrated
previously for Russian elections (Coleman, 2004; 2007a; 2010; Borodin, 2005; Aleskerov, et al.,
2005) and which also holds strongly in national elections of many countries, including the
United States, Germany, Japan, India, and Ukraine, among others (Coleman, 1975; 2004; 2007a;
8
Cohen and Warwick, 1984).
The effect of social conformity on voting has received little attention in voting research, which
has been dominated by rational choice theory (Mueller, 1989). Following an economic analogy,
this theory assumes that people vote because the potential gain for themselves outweighs the
costs of voting; party choice follows the same self-serving logic. This theory has been sharply
criticized, however, for failing to explain voting participation (Green and Shapiro 1994). Other
explanations for voting behavior examine sociological aspects but not specifically conformity.
Nevertheless, it is well known from the earliest behavioral studies of voting that people often
vote the same as their families, friends, community, labor union, social class, or ethnic group.
Political scientists have not sorted out whether in these situations people vote like others because
of a desire to conform to them or because they share a common self-interest with others in their
affiliated group. Psychological research (Cohen, 2003), however, demonstrates that political
beliefs are dominated more strongly by the group influence of a person’s political party than by a
person’s ideology or objective analysis of policy issues. Supporting the conformity model more
directly is the well-known “bandwagon” effect, when voters shift their vote to the party most
likely to win (Mehrabian, 1998). Also, neighborhood effects that cause people to change their
vote to be in line with the majority in their neighborhood have been reported frequently in
Britain (MacAllister et al., 2001). Prior to this line of conformity research, there has been no
direct research on the question of a spillover of conformity from the voting participation choice
to the political party choice. But there is substantial evidence of a strong and consistent
relationship at the aggregate level between voting participation and conformity with other
important social norms that is indicative of a general spillover effect involving the voting norm
9

(Knack, 1992; Knack and Kropf, 1998).
4. Elaboration of the Conformity Model
The model builds on the principle of conformity that when deciding between several actions,
people often take into account the expected relative frequency or probability of others’ behavior.
This assumes that people have direct knowledge of others’ likely behavior or, at least, a naïve,
implicit statistical knowledge of it. Psychological research shows, in fact, that people acquire
such statistical knowledge automatically, without conscious awareness or intent (Hasher and
Zacks, 1984). Not having direct knowledge of what these individual probability estimates are,
one can use the results of the election to get a retrospective estimate of the probability of an
arbitrary citizen voting, or the probabilities of a randomly chosen voter voting for any party. If
voters are fairly accurate in their individual estimates, at least on average, then the retrospective
estimates should be sufficient to test the model. In fact, voters’ expectations of the winning party
or candidate can be more accurate than opinion polls in predicting the results of an election
(Murr, 2011; Miller et al., 2012; Rothschild and Wolfers, 2011). This also accounts, in part, for
the success of prediction markets for elections, such as the Iowa Electronic Market, which shows
that collectively people can accurately predict the outcome of an election and estimate
probabilities related to the outcomes for parties or candidates (Wolfers and Zitzewitz, 2004).
If people are using such statistical information when making voting decisions, one must have a
measure for conformity that captures this cognitive representation. There is no standard measure
of conformity at hand, however. If there are only two alternatives, it is easy to see which is
10
favored by the majority and by how much. But when more than two alternative choices are
involved, and the number can change, it is not obvious how to measure conformity. Although
one might imagine a variety of possible conformity measures based on probability information,
the Shannon entropy measure (Shannon and Weaver, 1969; Theil, 1967; Khinchin, 1957) of
statistical information theory (communication theory) is already well known and has clear links
to both predictability of events and cognitive decision making. In short, the model interprets
behavior as a form of communication in society and applies methods of communication theory to
its analysis. Entropy is a measure of unpredictability, and greater unpredictability in social
behavior equates with less social conformity. The human brain responds to changes in event
probability in relation to the entropy of the situation (Norwich, 1993) and has a cognitive limit of
about 3 (bits) on the entropy scale (Miller, 1956) when it has to discriminate between several
alternatives of different probabilities. The entropy measure incorporates the idea that more
unexpected events carry more information, but the relationship is a logarithmic function of event
probability. The fact that people perceive likelihood or sensation logarithmically represents an
optimizing cognitive process for statistical information (Varshney and Sun, 2013)
The entropy measure H(S) for a set S of k alternatives of probability pi where i = 1, 2, . . . k, and
pi = 1 is H(S) = - pi log2 pi with the logarithm to base 2; units are bits. As differences
between the probabilities increase, entropy decreases; when the probabilities tend toward
equality, entropy increases. H(S) is never less than zero and attains its maximum when all
alternatives are equally probable or pi = 1/k; the maximum is log k. (For k = 2, maximum H(S) =
1; for k = 3, maximum is 1.58; for k = 4, maximum is 2, etc.). H(S) = 0 at p = 0 or p = 1. One can
also interpret entropy as the average of perceived information about expected voting for each
11
party; that is, it is an average of terms - log pi, where each term represents statistical information
of probability pi.
Consider how one can apply entropy to voting as a measure of conformity.1 Let pi represent the
probability that a randomly chosen voter will vote for the i-th party. If voters shift their vote to
one or two large parties from smaller parties so that pi increase for the larger parties, entropy
decreases. Therefore if people are becoming more conformist, aligning themselves with larger
political party voting groups, the entropy of the collective voting decision is decreasing. In other
words, entropy is an inverse measure of conformity in voting or other collective social decisions.
Using the actual voting share pi received for each party in the election, one can calculate
retrospectively the entropy H(P) of the choice among political parties. Entropy is directly related
to party system fragmentation, because as the vote shares of small parties increase at expense of
larger parties, the party entropy increases.
One can also apply the entropy measure to the choice of whether to vote or not. For the two-
choice situation—to vote or abstain—entropy or nonconformity in the turnout choice is
identified as H(T). One can calculate this retrospectively using the fractional turnout rate t and
abstention rate 1 - t,
H(T) = - t log2 t – (1-t) log2 (1-t)
This is shown in Figure 1 where one sees a nearly parabolic relationship between H(T) and
1 For other examples of the application of entropy to voting, see Darcy and Aigner (1980), Cohen and Warwick (1983), and Gill (2004).
12

turnout, having a maximum H(T) = 1 at t = 0.50 when the probabilities of voting and abstaining
are equal. If the prevalent social norm is that people should vote, high conformity expresses itself
as high turnout above 50% and closer to 100%. If, however, the norm is to abstain from voting,
which sometimes happens, high conformity implies a very low turnout below 50%.
The principle that people are fairly consistent in their degree of conformity from one choice
situation to another implies a positive relationship between the two voting entropy measures in
an election, that is, between voter turnout and the distribution of votes across parties. Both
entropy measurements are mappings of the same underlying state of conformity. One can express
the idea of consistency mathematically and make a more definitive hypothesis as to an
isomorphic relationship between the two measures. Let us put both entropy measures on the
same scale by taking the number of choices into account for each measure. H(P)/log k and
H(T)/log 2 both have range [0,1]. So full consistency or agreement between the two measures
along the scale implies H(P)/log k = H(T)/log 2, which simplifies to H(P) = log k H(T). An
immediate prediction from this equation is that H(P) must have the same relationship to turnout
as the parabolic curve in Figure 2, but multiplied by log k. The maximum of the H(P) curve is
predicted to be at t = 0.50. Electoral units of analysis, whether measured over time or in cross-
section, should be approximately on such a curve when their party entropy is plotted against
turnout—a relationship that can be tested and estimated with regression analysis.
13

14
0 0.1 0.2 0.3 0.4 0.5 0.6 0.7 0.8 0.9 10
0.2
0.4
0.6
0.8
1
Turnout
Turn
out E
ntr
opy H
(T)
Figure 2. Turnout, Turnout Entropy, and Conformity
High Conformity
Low Conformity
Applicability of the model in an election is indicated by: (1) a nearly parabolic shape to the
relationship of H(P) to t, as in Figure 1, with approximately H(P) = 0 at t = 0 and t =1; (2) a
maximum of the parabolic fit near 50% turnout; (3) a ratio of H(P) to H(T) approximately equal
to log k, when voters perceive k parties competing; and (4) a strong fit of the model to election
data, indicating a strong consistency in voting conformity across the two voting choices. These
also test the ratio-scale measurement property of entropy. The predictions are a definitive test for
a strong presence of social conformity in voting because they follow directly and uniquely from
a conformity theory and are very unlikely to be true if other explanations of voting hold
(Coleman, 2007b). Neither rational choice theory nor any other voting theory has made such
specific predictions that would apply widely to elections. Note that unlike the rational choice
models, the conformity model does not try to explain the level of voter turnout, the number of
parties, or why a particular party has won the election—typical goals of voting research. Here the
assertion is only that given the turnout level, there will be a certain division of the vote among
parties at that turnout level, which can be predicted from a conformity model. The level of
turnout reflects the degree of compliance with the social norm that good citizens vote in
elections. Regional variability in the degree of turnout conformity in a country allows statistical
analysis of its relationship with party voting.
Although one can start with the assumption that k should equal the number of parties on the
ballot, it is often the situation that this number does not accurately reflect what voters perceive as
their choices. So the analysis estimates the number of parties rather than simply counting the
number on the ballot. Often voters are ignorant of minor parties on the ballot and, more
15
generally, not all party choices may register distinctly in voters’ cognitive decision making. Time
and information constraints on the voting decision also make it more likely that a voter’s
decision making will fall back on a simple heuristic such as the relative sizes of the expected
vote for the parties. The number that a person can consider is constrained by a person’s short-
term or working memory capacity, especially when there is little time to make the choice and
reflect on information about all the parties, as in a voting booth. And an excessive number of
parties will bump against a person’s cognitive entropy limit on information processing, causing
errors in classification. One might get an estimate of the psychological number of parties, for
example, by asking voters just after they voted to name quickly from memory the parties on the
ballot. Let us call k the “cognitive” number of parties, as an alternative to the “effective” number,
which is based on a mathematical calculation derived party vote percentages.
5. Testing and Estimating the Models
The analysis first tested an OLS regression model of the predicted relationship H(P) = log k
H(T), which gives an estimate of both the strength of the model and an estimate of k as
approximately the average number of parties that voters perceived as choices in the election—the
“cognitive” number of parties.2 Turnout is based on eligible (registered) voters, not voting-age
population, which would give a slightly lower turnout rate. This model has a potential
shortcoming, however, in that it offers little opportunity to examine alternative hypotheses. For
example, if the true relationship is not parabolic or the maximum is not at turnout 50%, the
analysis would not detect that directly. So to complement the first analysis, and provide a way to
2 Alternatively, one can estimate H(P) = log k [- t log2 t – (1-t) log2 (1-t)] with nonlinear regression.
16

check for alternatives, H(P) also was regressed on a parabolic (quadratic) model of turnout t, that
is, H(P) = a0 + a1 t + a2 t2. The location of the maximum of this model, if it fits, can be estimated
as tmax = -a1/(2 a2). For this model, a bootstrap procedure (Efron and Tibshirani, 1998) was used
to estimate a 95% confidence interval (CI) for the location of the maximum, which would be
very difficult calculate analytically. The regression model was re-estimated 1,000 times,
randomly choosing with replacement from the original data set. The 1,000 maxima were then
calculated and ranked from least to greatest; the 25th and 975th values define the confidence
interval. Analysis was done with Systat. Units of analysis varied across elections. Most elections
used the vote aggregation for the 89 regions, but in some years there was no data for Chechnya,
and voters in areas outside the Russian boundary were not included; also, the number of regions
changed in 2007 and 2011. In 1999 the units are the 225 electoral districts, subsequently
abolished. There is also a limited analysis at the smallest reporting level, the Territorial Election
Commission (TEC), which number over 2,700.3
3 Election data in Russian is available from the Central Election Commission of the Russian Federation,
http://www.cikrf.ru and http://www.vybory.izbirkom.ru. Also see Alexander Kireev’s Electoral Geography 2.0, at http://www.electoralgeography.com/new/en , and Adam Carr’s Election Archive http://psephos.adam-carr.net/.
17

6. Results
The first model tested, the theoretically derived model, (Table 1) fails to meet statistical
significance in the first two parliamentary elections but fits with increasing strength from 1999 to
2011. The degree of fit is very strong in 2007 (R2 = 0.86) and 2011 (R2 = 0.85). The estimate of
log k, with k an estimate of the average number of political parties perceived by the voters,
decreases from 2.78 in 2003 to 2.04 in 2007 to 1.45 in 2011. Since log 4 = 2 corresponds exactly
to a four-choice situation, one can infer that the 2007 election was to most voters, on average, a
four-party contest. In other words, the parliamentary election looks statistically more like a four-
party contest than the 11-party contest that one would have seen on the ballot. This corresponds
well to the actual results of the election wherein, because of the 7% threshold, only four parties
won seats and together amassed 92% of the total vote. For 2011, the estimate of log k = 1.45 is
below 1.58, the predicted value for three parties. One can convert this to a number of parties by
raising 2 to the 1.45 power; 21.45 = 2.7 suggesting the 2011 election was perceived on average as
about a three-choice contest by most voters. Again, only four parties won seats in 2011. See also
Figures 2 and 3.
Table 1. Regression coefficient for the equation H(P) = log k H(T).
Election N log k (std error) k parties R2
1993 88 ns ns1995 88 ns ns1999 224 2.73 (0.02) 6.6 0.292003 89 2.78 (0.03) 6.9 0.582007 85 2.04 (0.02) 4.1 0.862011 134 1.45 (0.01) 2.7 0.852011 TECs 2,734 2.15 (0.005) 4.4 0.79
18
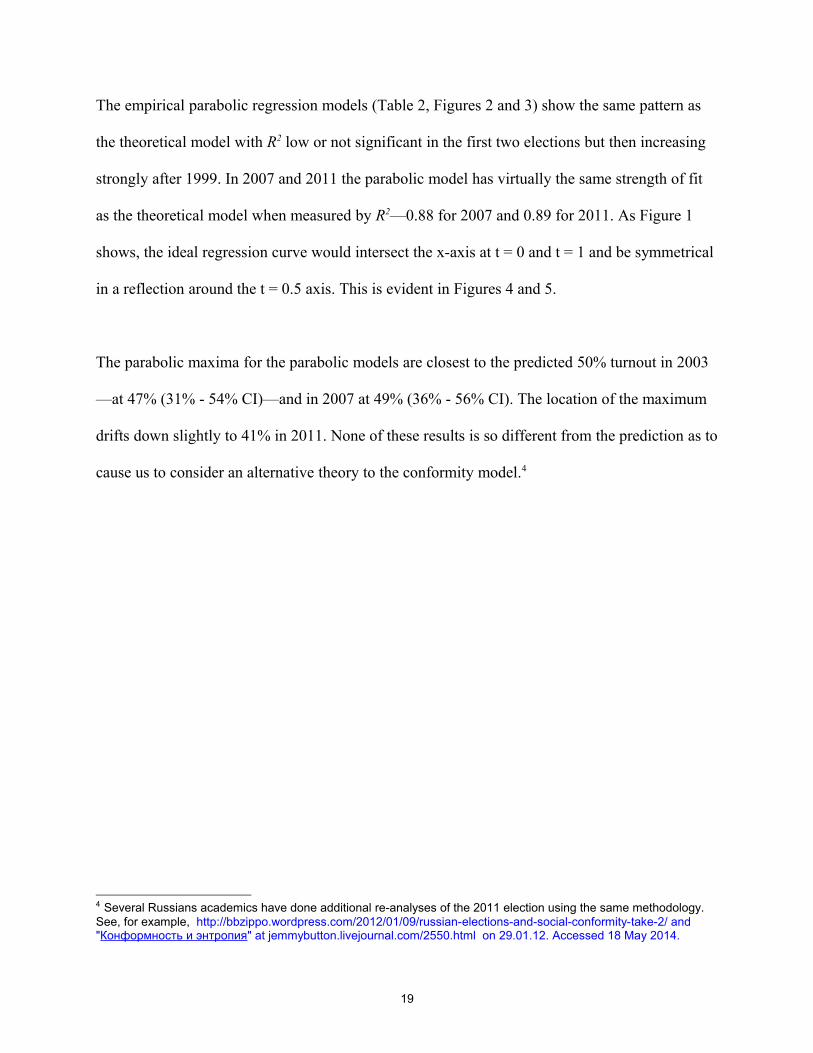
The empirical parabolic regression models (Table 2, Figures 2 and 3) show the same pattern as
the theoretical model with R2 low or not significant in the first two elections but then increasing
strongly after 1999. In 2007 and 2011 the parabolic model has virtually the same strength of fit
as the theoretical model when measured by R2—0.88 for 2007 and 0.89 for 2011. As Figure 1
shows, the ideal regression curve would intersect the x-axis at t = 0 and t = 1 and be symmetrical
in a reflection around the t = 0.5 axis. This is evident in Figures 4 and 5.
The parabolic maxima for the parabolic models are closest to the predicted 50% turnout in 2003
—at 47% (31% - 54% CI)—and in 2007 at 49% (36% - 56% CI). The location of the maximum
drifts down slightly to 41% in 2011. None of these results is so different from the prediction as to
cause us to consider an alternative theory to the conformity model.4
4 Several Russians academics have done additional re-analyses of the 2011 election using the same methodology.
See, for example, http://bbzippo.wordpress.com/2012/01/09/russian-elections-and-social-conformity-take-2/ and "Конформность и энтропия" at jemmybutton.livejournal.com/2550.html on 29.01.12. Accessed 18 May 2014.
19

Table 2. Regression coefficients for the model H(P) = a0 +a1 t + a2 t2
Election N a0
(std err)a1
(std err)a2
(std err)R2 parabolic
maximumbootstrap 95% confidence interval for parabolic maximum
1993 88 2.97 (0.34)
2.08 (1.33)
-2.90 (1.32)
0.13 0.36 0.22 0.52
1995 88 ns ns ns ns na1999 224 4.29
(0.17)-2.78 (0.28)
ns 0.31 na
2003 89 0.81 (0.91)
8.51 (2.92)
-8.98 (2.27)
0.59 0.47 0.31 0.54
2007 85 0.22(0.68)
7.64(1.85)
-7.77(1.20)
0.88 0.49 0.36 0.56
2011 134 0.85 (0.35)
3.41 (0.75)
-4.15 (0.54)
0.89 0.41 0.27 0.47
2011 TECs 2,734 1.45 (0.09)
5.06 (0.27)
-5.87 (0.19)
0.81 0.43 0.41 0.45
20

21
0.4 0.5 0.6 0.7 0.8 0.9 10
0.5
1
1.5
2
2.5
3
3.5
Turnout
Pa
rty E
ntr
opy H
(P)
Figure 3. Predicted vs Empirical Models: 1999
_____ 2.73*H(T)
- - - - - parabolic

22
0.4 0.5 0.6 0.7 0.8 0.9 10
0.5
1
1.5
2
2.5
3
3.5
Turnout
Po
litic
al P
art
y E
ntr
opy H
(P)
Figure 4. Predicted vs Empirical Models: 2003
____ 2.78 H(T)
------- parabolic fit
0.4 0.5 0.6 0.7 0.8 0.9 10
0.5
1
1.5
2
2.5
3
3.5
Turnout
Po
litic
al P
art
y E
ntr
opy H
(P)
Figure 4. Predicted vs Empirical Models: 2003
____ 2.78 H(T)
------- parabolic fit
23
0.5 0.6 0.7 0.8 0.9 10
0.5
1
1.5
2
2.5
Turnout
Pa
rty E
ntr
opy H
(P)
Figure 5. Predicted vs Empirical Models: 2007
_____ 2*H(T) plot
- - - - - parabolic fit

Borodin’s (2005) analysis is a retest of Coleman (2004) on the earlier elections but with the
TECs as the unit of analysis. Borodin reasoned that conformity would be most likely to show its
effect in smaller geographic units where people would more often know and observe one another
directly (personal communication). And, indeed, his analysis shows a stronger effect at the TEC
level in 1995 and 1999 than in the regional analysis done here and in Coleman (2004). He finds
parabolic models fit in 1995 with R2 = 0.30, maximum at 52% turnout; in 1999, R2=0.42,
maximum at 49% turnout; and in 2003, R2 = 0.55, maximum at 50% turnout. For these estimated
maxima, the predicted 50% turnout mark is within the bootstrap 95% confidence interval, indeed
almost exactly as predicted. Thus the effect of conformity showed up earlier in small geographic
areas than at the regional level.
A final piece of the puzzle is the connection between the effective number of parties, the party
entropy H(P), and the estimated cognitive number of parties. Both effective number and entropy
are measures of party fractionalization or fragmentation, so one can infer that there is generally a
positive correlation between entropy and the effective number. But Laakso and Taagepera (1979)
conclude that the effective measure is preferable to entropy because the latter is overly sensitive
to parties that get very small shares of the vote. Conversely, and unlike entropy, the weakness of
the effective number is that it is not tied to or predicted by any model of voting behavior. Figure
6 shows the relationships between turnout and both party entropy and the effective number, as
calculated for each region in 2011. Observe that entropy and effective number are clearly
correlated with each other, and both negatively correlated with turnout, but only the entropy
measure captures the predicted parabolic relationship between turnout and party system. One can
infer that the cognitive number estimated from the relation between turnout and party entropy
24

will be the more fundamental measure of party number as it derives directly from the underlying
voting theory that captures voters’ cognitive decision making process.
Figure 6. Relationships between turnout, effective number of parties (EN), and party
entropy H(P) in 2011.
25
0.4 0.5 0.6 0.7 0.8 0.9 1.0
Turnout
0
1
2
3
4
5
ENHP
After the 2007 election many observers questioned the election procedures in several regions that
had the highest turnouts and where the great majority voted for the same party, United Russia. In
fact, there are six regions that are outliers on the turnout scale having turnouts over 90%
(Dagestan, Kabardino-Balkaria, Ingushetia, Karachay-Cherkssia, Mordovia, and Chechnya.)
These same regions again had very high turnouts in 2011. One can characterize them as being on
the geographical fringes of Russia and having relatively large minority ethnic populations. To
check on the influence of these cases, which fit the predicted model well, the analysis for 2007
and 2011 was redone excluding these regions. The results were essentially the same as when all
units are included. In the model for 2011, for example, H(P) = 1.46 H(T) fits the data very well,
just as it did with those regions included. R2 is reduced to 76%, however, as must be anticipated
when the range of turnout is limited. The parabolic models also echo the previous results.
Although the highest turnout regions have an influence on the strength of fit of the regression
models, and are at the extreme of Russian voting participation, they are not exceptions to the
predicted relationship between turnout and party entropy nor do they significantly influence
model predictions.
Unexplained variation and prediction errors in the analysis can arise when some voters vote for
reasons unrelated to conformity. Another source of error in the models is when people who are
prone to conform mistakenly estimate the relative frequencies of other voters’ choices. Election
fraud, which has increased in recent elections, contributes to the unexplained variation, although
isolated local voting problems will have less impact on the results here that use regional data.
Errors in the calculation of voter turnout because of ballot miscounting, ballot stuffing, or an
26

inaccurate count of the number of eligible voters, will further bias the results and, specifically,
the estimate of the location of the parabolic maximum. Increasing fraud in 2011 may have led to
the shift in the estimated location of the parabolic maximum away from 50 percent.
7. Summary and Discussion
All the evidence points to the conclusion that recent Russian elections fit the theoretically
predicted relationship between party entropy and turnout that is diagnostic of the effect of social
conformity on voting. This elements of this methodology has now been tested and confirmed
independently by multiple researchers in several countries, including its applicability to Russian
parliamentary and presidential elections. In fact, voting in Russia is an especially good
demonstration of the power of conformity. Here the model is applied to study the evolution of a
party system. The conformity model is outwardly similar to that of Bikhchandani, Hirshleifer,
and Welch (1998), who also assume that people use observational information to make
decisions, but in their theory people use such information consciously and rationally. Their
model makes no general, testable, quantitative predictions, which should be a primary goal of
social science theory (Taagepera, 2009; Coleman, 2007b). Previous statistical research on
Russian elections, building on the assumption that voters make rational choices, has similar
shortcomings. Explanations of party vote share, for example, include such factors as regional
economic voting (Treisman, 2001), economic dissatisfaction (Richter, 2006), and voters’
judgment about President Putin (Schofield and Zakharov, 2010). These models are retrospective
explanations of the results of particular elections, however, and not predictive of voting or
Russian elections in general.
27

Because conformity has been well studied for decades at all levels of analysis from brain
function, to cognition, to small groups, to larger social aggregations, one might hope for a more
explicit link of conformity between individual perceptions and the aggregate model used here.
But each level of analysis seems to include irreducible emergent phenomena, and this model,
too, should be evaluated on it own merits. By that standard it is successful.
From the viewpoint of predictive modeling, there is no appreciable difference between the
empirical parabolic model and the more constrained, theoretically derived model H(P) = log k
H(T). Thus one can reject alternatives to the theoretical model that might involve a large shift in
location of the maximum of the curve or have a distinctly different shape. The correspondence of
the two models also attests to the strength of the observed relationship between party entropy and
turnout and, thus, the strength of conformity spillover from the turnout choice to the party
choice. The only parameter allowed to vary in the more constrained model for the Duma election
is the number of parties, which was estimated to be about four in 2007 and three in 2011 (or four
at the TEC level). Recall that four was the number of parties gaining seats in the Duma.
The effect of conformity is not limited to parliamentary elections but holds to a similar degree in
recent presidential elections (Coleman, 2007a; 2010). In 2012 the model H(P) = 1.78 H(T), for
example, has R2 = 0.85 and the parabolic model has R2 = 0.87 with its maximum at turnout equal
to 50.2%. This indicates the broad impact of social conformity on voting behavior, going beyond
party attachment.
The estimated number of parties, the cognitive number, agrees generally with the number people
28

would prefer, as reported in opinion polls, though not all voters prefer the same number of
choices. One can compare the estimated number of parties with surveys about how people think
of the party system. In 2007, for example, a large majority (68%) saw a need for only one to
three large parties; in 2011 it was 70 percent. This is from annual national surveys by Moscow’s
Levada Center (2013, Table 10.1). Clearly, Putin’s attempt to limit the party system is in line
with popular sentiment.
The party system began to have roots in the population as early as 1995, starting first at the local
level, according to Borodin’s analysis of TECs. The popular basis for the party system then
developed with increasing strength at the regional level in subsequent elections. The party
system now has evolved so that the fragmentation of the party system has substantially
decreased; the smallest parties now get smaller shares of the vote. This has led to a large
decrease in average party entropy from the 1990s. To see this, compare Figures 3 and 4 with
Figure 5. Observe that in 1999 and 2003 many regions had party entropy levels at or slightly
above the individual psychological limit of about 3 bits. That is, the complexity of the party
system was at a point where many people would not have been able to easily comprehend the
totality of parties or make a decision about them without greatly simplifying their cognitive
decision making process. In sum, the party system has become a more normal party system over
the last decade, with the number of major parties in closer agreement with voters’ preferences
and perceptions, and at a more normal party entropy level. These results, as seen through the lens
of conformity, are consistent with research from public opinion polls that show an increasing
attachment of voters to their party choices in the late 1990s (Brader and Tucker, 2001; Miller,
Erb and Hesli, 2000), and incipient differentiation of party alignment by voters’ class and their
issues of concern (Evans and Whitefield, 2006). This is exactly what one should expect as voters
29

coalesce along party lines for reasons of social conformity; namely, that their opinions and in-
group allegiance will follow along.
Although manipulation of the party system and electoral competition by the government has had
a limiting effect on the party system since 2003, this is not to say that it was out of sync with
popular interests in a smaller, less fragmented party system. By reducing the number of parties
on the ballot, Putin has made parliamentary government more feasible. And this has brought the
number of political parties to a level compatible with typical human decision making. Stability
and normalcy of the party system, however, is more dependent on the effect of conformity as it
consolidates voters along party lines. With a basis in social conformity, the Russian party system
is becoming more like party systems in other countries. This result is not something that a
government could engineer. No laws, government interference, or voting manipulation could
have produced the strong, collective effect of conformity on voting behavior seen in this
analysis. For, as cognitive psychology shows, neither elites nor ordinary voters are typically
aware of the effect of conformity on their personal voting decisions.
30

8. References
Aleskerov, Fuad., Alexander Borodin, Svyatoslav Kaspe, at al [Алескеров Ф.Т., Бородин А.Д.,
Каспэ С.И. и др]. Поляризованность электоральных предпочте-ний в России. Опыт
выборов в Государственную думу Российской Федерации в 1993—2003 гг.Препринт
WP7/2005/02. — М.: ГУ ВШЭ, 2005. — 28 с. [Analysis of polarization of electoral preferences
in Russia 1993–2003. Working paper WP7/2005/02. — Moscow: State University — Higher
School of Economics, 2005.]
Bargh, John A., Kay L. Schwader, Sarah E. Hailey, Rebecca L. Dyer, and Erica J. Boothby.
2012. Automaticity in Social Cognitive Processes. Trends in Cognitive Sciences 16:593-605.
Bikhchandani, Sushil, David Hirshleifer, and Ivo Welch.1998. Learning from the Behavior of
Others. Journal of Economic Perspectives 12:151-170.
Blais, Andre. 2000. To Vote or Not to Vote: The Merits and Limits of Rational Choice Theory.
Pittsburgh, PA: University of Pittsburgh Press.
Borodin, Alexander.D. [Бородин, А.Д. ] 2005. Согласованность коллективных действий в
поведении российских избирателей [The Effect of Social Conformity on the Behavior of
Russian Voters] ЭКОНОМИЧЕСКИЙ ЖУРНАЛ ВШЭ [Economic Journal HSE]. T. 3. № 1.
C. 74-81.
31

Brader, Ted, and Joshua A. Tucker. 2001. The Emergence of Mass Partisanship in Russia.
American Journal of Political Science 45:69-83.
Cialdini, Robert B. 1993. Influence: Science and Practice. 3rd Ed. New York: Harper Collins.
Cialdini, Robert B., Raymond R. Reno, and Carl A. Kallgren. 1990. A Focus Theory of
Normative Conduct: Recycling the Concept of Norms to Reduce Littering in Public Places.
Journal of Personality and Social Psychology 58:1015-1026.
Cohen, Geoffrey L. 2003. Party over Policy: The Dominating Impact of Group Influence on
Political Beliefs. Journal of Personality and Social Psychology 85: 808-822.
Cohen, Lenard J., and Paul Warwick. 1983. Political Cohesion in a Fragile Mosaic: The
Yugoslav Experience. Boulder, Colorado: Westview Press.
Coleman, Stephen. 1975. Measurement and Analysis of Political Systems: A Science of Social
Behavior. New York: Wiley-Interscience.
Coleman, Stephen. 2004. The Effect of Social Conformity on Collective Voting Behavior.
Political Analysis 12:76-96.
Coleman, Stephen. 2007a. Popular Delusions: How Social Conformity Molds Society and
Politics. Youngstown, New York: Cambria Press.
32
Coleman, Stephen. 2007b.Testing Theories with Qualitative and Quantitative Predictions.
European Political Science 6:124-133.
Coleman, Stephen. 2010. [Коулман, С.] Реформа российской избирательной системы и
влияние социальной конформности на голосование и партийную систему: 2007 и 2008
годы [Russian election reform and the effect of social conformity on voting and the party
system: 2007 and 2008.] Журнала Новой экономической ассоциации [Journal of the New
Economic Association (Moscow)] 5: 72-90.
Converse, Philip E. 1969. Of Time and Partisan Stability. Comparative Political Studies 2:139-
171.
Darcy, Robert, and Hans Aigner. 1980. The Uses of Entropy in the Multivariate Analysis of
Categorical Variables. American Journal of Political Science 24:155-174.
Durlauf, Steven N., and H. Peyton Young. 2001. Social Dynamics. Cambridge, MA: MIT Press.
Efron, Bradley, and Robert J. Tibshirani. 1998. An Introduction to the Bootstrap. Boca Raton,
FL: Chapman and Hall.
Elster, Jon. 1989. The Cement of Society: A Study of Social Order. New York: Cambridge
University Press.
33

Evans, Geoffrey, and Stephen Whitefield. (2006). Explaining the Emergence and Persistence of
Class Voting in Post-Soviet Russia, 1993-2001. Political Research Quarterly 59:23-34.
Fehr, Ernst, and Simon Gaechter. 1998. Reciprocity and Economics: The Economic Implications
of Homo Reciprocans. European Economic Review 42:845-859.
Gel’man, Vladimir. 2008. Out of the Frying Pan and into the Fire? Post-Soviet Regime Change
in Comparative Perspective. International Political Science Review 29:157-180.
Gerber, Alan S., and Todd Rogers. 2009. Descriptive Social Norms and Motivation to Vote:
Everybody’s Voting and so Should You. Journal of Politics 71:178-191.
Gill, Jeff. 2004. An Entropy Measure of the Uncertainty in Vote Choice. Electoral Studies 24:
371-392.
Green, Donald P., and Ian Shapiro. 1994. Pathologies of Rational Choice Theory: A Critique of
Applications in Political Science. New Haven, CT: Yale University Press.
Hasher, Lynn, and Rose T. Zacks. 1984. Automatic Processing of Fundamental Information: The
Case of Frequency of Occurrence. American Psychologist 39:1372-1388.
Heinrich, Joseph, Robert Boyd, Samuel Bowles, Colin Camerer, Ernst Fehr, and Herbert Gintis,
eds. 2004. Foundations of Human Sociality: Economic Experiments and Ethnographic Evidence
34
from Fifteen Small-Scale Societies. Oxford: Oxford University Press.
Ishiyama, John T., and Ryan Kennedy. 2001. Superpresidentialism and Political Party
Development in Russia, Ukraine, Armenia, and Kyrgystan. Europe-Asia Studies 53:1177-1191.
Kahneman, Daniel. 2011. Thinking, Fast and Slow. New York: Farrar, Strauss, and Giroux.
Khinchin, Alexander I. 1957. Mathematical Foundations of Information Theory. New York:
Dover.
Knack, Stephen. 1992. Civic Norms, Social Sanctions, and Voter Turnout. Rationality and
Society 4:133-156.
Knack, Stephen, and Martha Kropf. 1998. For Shame! The Effect of Community Cooperative
Context and the Probability of Voting. Political Psychology 19:585-599.
Laakso, Markku, and Rein Taagepera. 1979. Effective Number of Parties: A Measure with
Application to West Europe. Comparative Political Studies 12:3-27.
Levada Center. 2013. Russian Public Opinion 2012-2013. Moscow: Levada Center.
http://www.levada.ru/books/obshchestvennoe-mnenie-2012-eng. Accessed 30 June 2014.
Rokkan, Stein, and Seymour Martin Lipset, eds.1967. Party Systems and Voter Alignments:
35

Crossnational Perspectives. New York: Free Press.
MacAllister, Iain R, Ron Johnston, Charles Pattie, Helena Tunstall, Daniel F.L. Dorling, and
David Rossiter. 2001. Class Dealignment and the Neighborhood Effect: Miller Revisited. British
Journal of Political Science 31: 41-60.
McFaul, Michael. 2001. Explaining Party Formation and Nonformation in Russia: Actors,
Institutions and Chance. Comparative Political Studies 34:1159-1187.
Mehrabian, Albert. 1998. Effects of Poll Reports on Voters’ Preferences. Journal of Applied
Social Psychology 28:2119-2130.
Miller, Arthur H., Gwyn Erb, William M. Reisinger, and Vicky L. Hensley. 2000. Emerging
Party Systems in Post-Soviet Societies. Journal of Politics 62:455-490.
Miller, Arthur H. and Thomas F. Klobucar. 2000. The Development of Party Systems in Post-
Soviet Societies. American Journal of Political Science 44:667-686.
Miller, George. 1956. The Magical Number Seven, Plus or Minus Two: Some Limits on our
Capacity for Processing Information. Psychological Review 63:81-97.
36

Miller, Michael K., Guanchun Wang, Sanjeev R. Kulkarni, H. Vincent Poor, and Daniel N.
Osherson. (2012). Citizen Forecasts of the 2008 U.S. Presidential Election. Politics and Policy.
40: 1019-1052.
Moser, Robert G. 1999. Independents and Party Formation: Elite Partnership as an Intervening
Variable in Russian Politics. Comparative Politics 31:147-165.
Mueller, Dennis C. 1989. Public Choice II. Cambridge, UK: Cambridge University Press.
Murr, Andreas Erwin. 2011. Wisdom of Crowds? A Decentralized Election Forecasting Model
that Uses Citizens’ Local Expectations. Electoral Studies 30:771-783.
Norwich, Kenneth. 1993. Information, Sensation and Perception. San Diego, CA: Academic
Press.
Pronin, Emily, Jonah Berger, and Sarah Molouki. 2007. Alone in a Crowd of Sheep: Asymmetric
Perceptions of Conformity and Their Roots in an Introspection Illusion. Journal of Personality
and Social Psychology 92:585-595.
Richter, Kaspar. 2006. Wage Arrears and Economic Voting in Russia. American Political
Science Review 100:133-145.
37

Reuter, Ora John. 2010. The Politics of Dominant Party Formation: United Russia and Russia’s
Governors. Europe-Asia Studies 62:203-327.
Rothschild, David M. and Justin Wolfers. 2011. Forecasting Elections: Voter Intentions Versus
Expectations. http://papers.ssrn.com/sol3/papers.cfm?abstract_id=1884644. Accessed 18 May
2013.
Schofield, Norman, and Alexei Zakharov. 2010. A Stochastic Model of 2007 Russian Duma
Election. Public Choice 142:177-194.
Shannon Claude E., and Warren Weaver. 1969. The Mathematical Theory of Communication.
Urbana, IL: University of Illinois Press.
Taagepera, Rein. 2008. Making Social Sciences More Scientific: The Need for Predictive
Models. New York: Oxford.University Press.
Theil, Henri.1967. Economics and Information Theory. Amsterdam: North-Holland.
Treisman, Daniel S. 2001. After the Deluge: Regional Crises and Political Consolidation. Ann
Arbor, MI: University of Michigan Press.
Varshney, Lav R., and John Z. Sun. 2013. Why Do We Perceive Logarithmically? Significance
10(1): 28-31.
38

White, Stephen, Richard Rose, and Ian McAllister. 1997. How Russia Votes. Chatham, NJ:
Chatham House Publishers.
Wolfers, Justin, and Eric Zitzewitz. 2004. Prediction Markets. Journal of Economic Perspectives
18:107-126.
39