african political party development and …2576/datastream/obj/... · african political party...
TRANSCRIPT
AFRICAN POLITICAL PARTY DEVELOPMENT AND THE LIMITS OF
INSTITUTIONAL ENGINEERING
By
Gerard David Lavery
A DISSERTATION
Submitted to Michigan State University
in partial fulfillment of the requirements for the degree of
Political Science – Doctor of Philosophy
2014
ABSTRACT
AFRICAN POLITICAL PARTY DEVELOPMENT AND THE LIMITS OF INSTITUTIONAL ENGINEERING
By
Gerard David Lavery
Why do some African countries have nationally oriented political parties and stable party
systems while ethnic parties and volatility plague others? I address this puzzle by systematically
analyzing differences in levels of party nationalization and electoral volatility within and across
sub-Saharan African countries since 1990. To identify the factors that shape national parties and
the systems in which they operate, this dissertation investigates the following research questions:
Can political party laws encourage the development of national parties and stable party systems
in Africa? What motivates politicians to comply with (or not) party laws that seek to build
nationally oriented political parties over ethnic parties? Why do reforms to party laws work in
some countries (some of the time) and not in others? How can we improve international political
party assistance? Despite their theoretical and practical significance, scholars have largely
ignored these questions in Africa.
To address these questions, I employ mixed methods research to test a novel theoretical
framework that centers on the forces that influence party leaders’ decision to prioritize ethnic
balancing over ethnic polarization in building their parties. To systematically examine variation
in party development, the large-n component of this project uses data from the African Party
Law and Nationalization Database (APLND), an original database covering 78 elections from 27
countries from across the region since 1990. Statistical analysis confirms that higher levels of
party system nationalization are associated with lower levels of electoral volatility; the more
national the party system the more likely it is to be stable and enduring. As expected, the
analyses also confirm that ethnic fractionalization, leadership legacy, and economic conditions
are powerful predictors of African political party development. The main finding of the statistical
analyses is that centripetal party laws -- regulations that attempt to establish broad-based parties
that transcend ethno-regional cleavages -- are associated with both higher levels of party system
nationalization and lower levels of electoral volatility. This relationship remains significant even
after controlling for alternative explanations, which is important because it suggests that formal
institutions are gaining traction in some African countries.
The quantitative findings are complemented by in-depth examination of Kenya’s
multiparty elections since 1992 and comparative case study analysis of Benin, Zambia, and
Ghana. Historical analysis, focus group research, and key-informant interview data suggests
national parties and stable party systems are possible only when the forces that encourage
multiethnic cooperation (horizontal coordination pressure) are more powerful than the pressures
that compel party leaders to cater to their ethnic constituencies. In order for party laws to achieve
their intended results they must increase horizontal coordination pressure on politicians thereby
compelling them to invest in more organizationally robust and enduring national parties. Based
on the key findings of this study, I conclude the dissertation by providing actionable policy
recommendations designed to increase the development impact of international political party
assistance.
Copyright by GERARD DAVID LAVERY
2014

v
To my parents, Linda Dano and Jerry Lavery, for always believing in me and helping me believe in myself.
vi
ACKNOWLEDGEMENTS
I am forever indebted to the colleagues, friends, and family that made completing this
dissertation possible. First, I thank the members of my dissertation committee for their support
throughout my graduate school career. I am especially grateful to Michael Bratton, my
dissertation committee chair. He gave me the freedom to pursue the research questions that
interested me most, and he helped me to refine rough ideas into an implementable project. He
provided sage advice and constructive criticism that kept me focused and on-track. His
efficiency, intellect, and tireless dedication to deepening democracy in Africa are an inspiration.
Jeffrey Conroy-Krutz gave detailed feedback and asked challenging questions that undoubtedly
improved this project. Joshua Sapotichne courageously agreed to join my committee not
knowing much about Africa and his practical advice and expertize on policy reform processes
and mechanisms proved helpful. Jennifer Olson helped me to minimize (or at least reduce) the
political science jargon and generously shared her deep knowledge of the region. Eric Chang
provided instrumental guidance early on and always made himself available thereafter. Joel
Barkan and David Campbell were enthusiastic cheerleaders of this project and provided
encouragement and guidance right up to their untimely deaths. Both are sorely missed.
I received generous financial assistance that made my graduate studies and international
research possible. Being awarded a University Distinguished Fellowship (UDF) was central in
my decision to study at Michigan State University (MSU) and provided me more time to focus
on my research. A pre-dissertation travel award from MSU’s International Studies and Programs
helped me establish firm foundations for successful fieldwork in East Africa. I am grateful to
Carl LeVan and Todd Eisenstadt at American University and to the American Political Science
vii
Association (APSA) for selecting me to participate in the 2011 Africa Workshop in Nairobi. The
College of Social Sciences at MSU awarded me a dissertation completion fellowship that
allowed me to finish my research free of external teaching or research responsibilities. I enjoyed
working with Carolyn Logan on the Afrobarometer and learned a great deal from her over the
years. I appreciate all of the additional assistance I have received from The Department of
Political Science at MSU from providing me the funds necessary to improve my Kiswahili in
Arusha, Tanzania to enrolling me in the Institute for Qualitative and Multi-Method Research
(IQMR) at Syracuse, New York.
My fieldwork would not have been nearly as successful if not for my friends and
colleagues at the National Democratic Institute (NDI). I thank Shari Bryan for supporting my
decision to pursue my Ph.D. in the first place. Mary O’Hagan graciously allowed me to apply my
newly acquired research skills to help strengthen NDI’s programming in Kenya. This mzungu
deeply appreciates the friendship and ongoing support provided by Dickson Omondi, Bjarte
Tora, John Lovdal, Mahija Dodd, Phoebe Mungai, Roseline Idele, Dennis Omondi, Kelley Jones,
Aaron Erlich, Jean-Noe Landry, Felix Odhiambo, and countless others in Kenya. Ari Greenberg,
Rose Jackson, Kehinde Togun, Sef Ashiagbor, Brionne Dawson, and Michael Baldassaro made
me miss the good old days in DC. In addition, I am extremely grateful to Anika Moroff and
Matthias Basedau at the German Institute for Global and Area Studies (GIGA) for saving me
months of additional work by generously sharing their raw data on African political party laws.
Without the support of my friends at both MSU and the University of Michigan I would
never have successfully completed my Ph.D. Special thanks to my cohort for helping me survive
statistics and game theory. Nicholas Kerr, Boniface Dulani, and Helen Lee provided much-
needed encouragement and positivity. Masaaki Higashijima’s high-quality work served as
viii
motivation to improve my own research. Brian Kennedy was my go-to sounding board and
closest friend in East Lansing. My Ann Arbor crew including Tom and Erica Morrell, Matt Paul,
Geoff Wodtke, Ken Hayes, Bridget Lavelle, Patricia Chen, Elyse Jennings, and the Grizzly Peak
Brewing Company kept me (mostly) sane for the better part of the last five years.
Most importantly, I thank my family for the endless depths of their patience, love, and
encouragement. I deeply appreciate the many sacrifices made by my parents, Jerry Lavery and
Linda Dano, to ensure that I have had a top-quality education my whole life. I have enjoyed
watching my brother, Joe Lavery, become an avid traveller and adventurer. I have truly
wonderful in-laws and feel incredibly lucky to be part of such an amazing family. My wife
Rachael Pierotti is the very best copilot in life. Being married to me is not an easy job. Thank
you for putting up with me and for making me constantly strive to be a better human being.
Convincing you to marry me is my biggest accomplishment and the wisest decision I’ve ever
made. Finally, thank you to my son, Jesse, for constantly reminding me that there are more
important things in life than work and for providing the best incentive to finish graduate school.
ix
TABLE OF CONTENTS
LIST OF TABLES ........................................................................................................................ xii
LIST OF FIGURES ..................................................................................................................... xiv
KEY TO SYMBOLS AND ABBREVIATIONS ......................................................................... xv
CHAPTER 1: CONCEPTUAL FRAMEWORK ............................................................................ 1
1.1 INTRODUCTION ................................................................................................................ 1 1.1.1 The Puzzle of Party Development in Sub-Saharan Africa ............................................. 1 1.1.2 Why Does African Political Party Development Matter? .............................................. 3 1.1.3 Research questions ......................................................................................................... 6
1.2 DEFINITIONS ...................................................................................................................... 7 1.2.1 Political Parties and Nationalization .............................................................................. 7 1.2.2 Party Systems and Institutionalization ......................................................................... 10
1.3 PREVAILING EXPLANATIONS ..................................................................................... 11 1.3.1 Social Structural Determinants .................................................................................... 12 1.3.2 Historical Legacy ......................................................................................................... 14 1.3.3 Economic Conditions ................................................................................................... 15 1.3.4 Institutions .................................................................................................................... 16 1.3.4.1 Political Party Laws .................................................................................................. 18
1.4 THE ARGUMENT ............................................................................................................. 20 1.4.1 Agency: Vertical vs. Horizontal Coordination ............................................................ 21 1.4.2 Public Opinion ............................................................................................................. 25 1.4.3 Virtuous Circles and Vicious Cycles of Party Development ....................................... 28
1.5 OVERVIEW OF DISSERTATION ................................................................................... 30 1.5.1 Research Design and Chapter Summary ...................................................................... 31
CHAPTER 2: THE AFRICAN PARTY LAWS AND NATIONALIZATION (APLND) DATABASE ................................................................................................................................. 34
2.1 INTRODUCTION .............................................................................................................. 34 2.2 PARTY NATIONALIZATION AND ELECTORAL VOLATILITY ............................... 35
2.2.1 Measures and Variation of Party System Nationalization ........................................... 36 2.2.2 Measures and Variation of Electoral Volatility ........................................................... 40
2.3 POLITICAL PARTY LAWS (Independent Variables) ...................................................... 42 2.3.1 Centripetal vs. Consociational Party Laws .................................................................. 45 2.3.2 Summary measure – extent of centripetal regulation .................................................. 46 2.3.3 Distribution of Party Laws Overtime ........................................................................... 47
2.4 MEASURING FOR ALTERMNATIVE EXPLANATIONS (Control Variables) ............ 48
x
2.4.1 Institutional Variables .................................................................................................. 48 2.4.2 Demographic Variables ............................................................................................... 49 2.4.3 Historical Variables ..................................................................................................... 49 2.4.4 Economic Variables ..................................................................................................... 50
2.5 STRENGTHS AND LIMITATIONS OF THE APLND .................................................... 53
CHAPTER 3: EXPLAINING VARIATION IN PARTY NATIONALIZATION AND LEGISLATIVE ELECTORAL VOLATILITY IN AFRICA ....................................................... 54
3.1 INTRODUCTION .............................................................................................................. 54 3.2 CONCEPTS AND HYPOTHESES .................................................................................... 57
3.2.1 Objects of Explanation (Dependent Variables): .......................................................... 57 3.2.2 Political Party Laws (Explanatory Variables) .............................................................. 61 3.2.3 Alternative Explanations (Control Variables) ............................................................. 64
3.3 EXPLAINING VARIATION IN PARTY NATIONALIZATION .................................... 71 3.3.1 Party Laws and Party System Nationalization ............................................................. 71 3.3.2 Predictors of Party System Nationalization ................................................................. 75
3.4 EXPLAINING VARIATION IN LEGISLATIVE ELECTORAL VOLATILITY ............ 79 3.5 CONCLUSIONS ................................................................................................................. 81
CHAPTER 4: KENYA (1992-2007) - TWO DECADES OF DIVIDE AND RULE .................. 83
4.1 INTRODUCTION .............................................................................................................. 83 4.2 INCREASING PARTY FRAGMENTATION ................................................................... 86 4.3 THE MOI ELECTIONS 1992 AND 1997 .......................................................................... 89
4.3.1 Party Laws: Ambiguity and Favoritism Prevail ........................................................... 92 4.3.2 Demographics: The Kalenjin Seek to Maintain Control .............................................. 97 4.3.3 Historical Legacy: Ethnic Nationalists ...................................................................... 104 4.3.4 Economic Conditions: Loosening the Noose ............................................................. 106
4.4 THE KIBAKI ELECTIONS 2002 AND 2007 ................................................................. 107 4.4.1 Party Laws: Ambiguity and Favoritism Persist ......................................................... 109 4.4.2 Demographics: The Mount Kenya Mafia Strikes Back ............................................. 111 4.4.3 Historical Legacy: Nothing-Actually-Really-Changed ............................................. 114 4.4.4 Economic Conditions: Liberalization without Party Nationalization ........................ 119
4.5 CONCLUSIONS ............................................................................................................... 121
CHAPTER 5: KENYA’S 2013 ELECTIONS AND THE LIMITS OF INSTITUTIONAL ENGINEERING ......................................................................................................................... 124
5.1 INTRODUCTION ............................................................................................................ 124 5.2 THE TREND CONTINUES IN 2013 ............................................................................... 126 5.3 THEORY .......................................................................................................................... 134 5.4 EVIDENCE FROM KENYA’S 2013 ELECTIONS ........................................................ 138
5.4.1 Content and Commentary of the PPA 2011 ............................................................... 139 5.4.2 Enforcement of the PPA 2011 ................................................................................... 142 5.4.3 Demand for National Parties in 2013 ......................................................................... 147
5.5. CONCLUSIONS .............................................................................................................. 159
xi
CHAPTER 6: COMPARATIVE CASE STUDY ANALYSIS (VIRTUOUS CIRCLES AND VICIOUS CYCLES) ................................................................................................................... 161
6.1 INTRODUCTION ............................................................................................................ 161 6.2 BENIN .............................................................................................................................. 165
6.2.1 Ethnicity and Leadership ........................................................................................... 166 6.2.2 Content, Enforcement, and Demand .......................................................................... 171 6.2.3 Analysis of Benin’s Detailed Election Results .......................................................... 175 6.2.4 Benin’s Vicious Cycle ............................................................................................... 178
6.3 ZAMBIA ........................................................................................................................... 179 6.3.1 Ethnicity and Leadership ........................................................................................... 179 6.3.2 Content, Enforcement, and Demand .......................................................................... 183 6.3.3 Analysis of Zambia’s Detailed Election Results ....................................................... 185 6.3.4 Zambia’s Semi-Virtuous Circle ................................................................................. 188
6.4 GHANA ............................................................................................................................ 188 6.4.1 Ethnicity and Leadership ........................................................................................... 189 6.4.2 Content, Enforcement, and Demand .......................................................................... 193 6.4.3 Analysis of Ghana’s Detailed Election Results ......................................................... 197 6.4.3 Ghana’s Virtuous Circle ............................................................................................ 200
6.5 CONCLUSIONS ............................................................................................................... 200
CHAPTER 7: CONCLUSIONS, POLICY RECOMMENDATIONS, AND AVENUES FOR FUTURE RESEARCH ............................................................................................................... 202
7.1 INTRODUCTION ............................................................................................................ 202 7.2 KEY FINDINGS ............................................................................................................... 204
7.2.1 Party Laws, Nationalization, and Electoral Volatility ............................................... 204 7.2.2 Ethnicity, Leadership, and Party Development ......................................................... 205 7.2.3 High Demand for National Parties ............................................................................. 207 7.2.4 Sticky Trajectories and Nonlinearity ......................................................................... 208 7.2.5 Additional Findings ................................................................................................... 208
7.3 THEORETICAL IMPLICATIONS .................................................................................. 209 7.3.1 Political Party (System) Development ....................................................................... 209 7.3.2 Institutional Change and Policy Reform .................................................................... 213
7.4 POLICY RECOMMENDATIONS .................................................................................. 215 7.4.1 Lessons for African Policy Makers ............................................................................ 216 7.4.2 Improving International Party Assistance .................................................................. 218
7.5 FUTURE RESEARCH ..................................................................................................... 223 BIBLIOGRAPHY ....................................................................................................................... 225
xii
LIST OF TABLES
Table 1.1: Factors that Influence Vertical and Horizontal Coordination ...................................... 27
Table 2.1: Measures of Party Nationalization ............................................................................... 37
Table 2.2: Party Law Characteristics by Country ......................................................................... 44
Table 2.3: Descriptive Statistics ................................................................................................... 52
Table 3.1: Party Regulations and Party System Nationalization (Weighted) ............................... 72
Table 3.2: Predictors of Party System Nationalization – Bivariate Models ................................. 76
Table 3.3: Predictors of Party System Nationalization – Multivariate Models ............................ 78
Table 3.4: Predictors of Electoral Volatility ................................................................................. 80
Table 4.1: Measures of Party Nationalization and Volatility ....................................................... 86
Table 4.2: Fragmentation of Kenyan Parties in Parliament 1992-2007 ........................................ 88
Table 4.3: Ethnic Composition by Province in 1989 .................................................................... 99
Table 4.4: 1992 Parliamentary Elections .................................................................................... 102
Table 4.5: 1997 Parliamentary Elections .................................................................................... 103
Table 4.6: Ethnic Composition of Moi’s Cabinet ....................................................................... 105
Table 4.7: 2002 Parliamentary Elections .................................................................................... 112
Table 4.8: 2007 Parliamentary Elections .................................................................................... 117
Table 4.9: Ethnic Composition of Kibaki’s Cabinets ................................................................. 119
Table 5.1: Party System Level Indicators ................................................................................... 127
Table 5.2: Fragmentation of Parties in Parliament, Kenya 1992-2013 ....................................... 129
Table 5.3: 2013 Parliamentary Election Results by Former Province ........................................ 131
Table 5.4: Voter Turnout in Kenya’s Parliamentary Elections ................................................... 132
xiii
Table 5.5: Parliamentary Voter Turnout by Former Province .................................................... 133
Table 5.6: Citizen Demand for National vs. Ethnic Leaders (Kenya) ........................................ 149
Table 5.7: Trust in Others ........................................................................................................... 152
Table 6.1: Case Study Selection ................................................................................................. 162
Table 6.2: Citizen Demand for National vs. Ethnic Leaders (Benin) ......................................... 173
Table 6.3: Cross-National Support for Multiparty Democracy .................................................. 175
Table 6.4: Benin’s Party System Level Indicators ...................................................................... 176
Table 6.5: Benin’s Party Level Indicators .................................................................................. 177
Table 6.6: Zambia’s Party System Level Indicators ................................................................... 186
Table 6.7: Zambia’s Party Level Indicators 1992-2012 ............................................................. 187
Table 6.8: Cross-National Levels of Trust .................................................................................. 196
Table 6.9: Ghana’s Party System Level Indicators ..................................................................... 197
Table 6.10: Ghana’s Party Level Indicators 1992-2012 ............................................................. 199
xiv
LIST OF FIGURES
Figure 1.1: Coordination Pressures and Party Development ........................................................ 23
Figure 2.1: Distribution of Party System Nationalization Scores ................................................. 39
Figure 2.2: Distribution of Legislative Electoral Volatility Scores .............................................. 41
Figure 2.3: Distribution of Extent of Regulation Scores .............................................................. 47
Figure 2.4: Extent of Regulation over Time (with country labels) ............................................... 48
Figure 3.1: Electoral Volatility and Party Nationalization ........................................................... 60
Figure 3.2: Distribution of Extent of Regulation Scores .............................................................. 73
Figure 3.3: Extent of Regulation and Party System Nationalization ............................................ 74
Figure 4.1: Ethnic Composition in Kenya in 1989 ....................................................................... 98
Figure 6.1: Nationalization and Extent of Regulation in Case Studies ....................................... 163
Figure 6.2: Ethnic Composition in Benin (2002) ........................................................................ 166
Figure 6.3: Ethnic Composition of Zambia (2010) ..................................................................... 179
Figure 6.4: Ethnic Composition of Ghana (2010) ...................................................................... 189

xv
KEY TO SYMBOLS AND ABBREVIATIONS
AB Afrobarometer
AC2 Alliance Cauris 2 (Benin)
ADD Alliance for a Dynamic Democracy (Benin)
AG13B G13 Baobab Alliance (Benin)
APLND African Party Laws and Nationalization Database
CENA Autonomous National Election Commission (Benin)
CMD-Kenya Centre for Multiparty Democracy-Kenya (Kenya)
CPI Corruption Perception Index
CSO Civil Society Organization
DRC Democratic Republic of Congo
DP Democratic Party (Kenya)
New FORD-K New Forum for the Restoration of Democracy-Kenya (Kenya)
EA 2011 Elections Act, 2011
ECK Electoral Commission of Kenya (Kenya)
ECG Electoral Commission of Ghana (Ghana)
ECZ Electoral Commission of Zambia (Zambia)
EISA Electoral Institute of Southern Africa
ENP Effective Number of Parties
ENP-n Effective Number of Parties-National
ENP-d Effective Number of Parties-District
FARD Action Front for Renewal and Development (Benin)
xvi
FCBE Cauri Forces for an Emerging Benin (Benin)
FDD Forum for Democracy and Development (Zambia)
FORD Forum for the Restoration of Democracy (Kenya)
FORD-A Forum for the Restoration of Democracy-Asili (Kenya)
FORD-K Forum for the Restoration of Democracy-Kenya (Kenya)
FPTP First Past the Post
GIGA German Institute of Global Area Studies
HCP Horizontal Coordination Pressure
HP Heritage Party (Zambia)
IPPG Inter-Parties Parliamentary Group (Kenya)
IDEA International Institute for Democracy and Electoral Assistance
IIEC Interim Independent Electoral Commission
IEBC Independent Electoral and Boundaries Commission
IFES International Foundation for Electoral Systems
INGO International Non-governmental Organization
KANU Kenya Africa National Union (KANU)
LDP Liberal Democratic Party (Kenya)
LPK Labour Party of Kenya (Kenya)
LEV Legislative Electoral Volatility
MADEP African Movement for Democracy and Progress (Benin)
MMD Movement for Multiparty Democracy (Zambia)
MNDD National Movement for Democracy for Democracy and Development (BN)
MSUP Movement for Solidarity, Union, and Progress (MSUP)
xvii
NARC–Kenya National Alliance of Rainbow Coalition – Kenya
NDC National Democratic Congress (Ghana)
NCC Out Common Cause (Benin)
NDP National Development Party (Kenya)
NDI National Democratic Institute
NGO Non-governmental Organization
NIMD Netherlands Institute for Multiparty Democracy
NP National Party (NP)
NPP New Patriotic Party (NPP)
ODM Orange Democratic Movement (Kenya)
ODM-K Orange Democratic Movement-Kenya (Kenya)
ORPP Office of the Registrar of Political Parties (Kenya)
PCP People’s Convention Party (Ghana)
PNDD National Party for Democracy and Development (Benin)
PNS Party Nationalization Score
PNS-s Party Nationalization Score Standardized
PNS-w Party Nationalization Score Weighted
PNU Party of National Unity (Kenya)
PRD Democratic Renewal Party (Benin)
PSD Social Democratic Party (Benin)
PSNS Party System Nationalization Score
PSNS-s Party System Nationalization Score Standardized
PSNS-w Party system Nationalization Score Weighted
xviii
PPA 2011 Political Parties Act, 2011 (Kenya)
RB Renaissance Party of Benin (RB)
RDL-Vivoten Rally of Liberal Democrats for National Reconstruction-Vivoten (Benin)
RND National Rally for Democracy (Benin)
RPP Registrar of Political Parties (Kenya)
SDP Social Democratic Party (Kenya)
TNA The National Alliance (Kenya)
UBF Union for the Benin of the Future (Benin)
UDA United Democratic Alliance (Zambia)
UDRN Progress-Union for Democracy and National Reconstruction (Benin)
UDS Union for Democracy and National Solidarity (Benin)
UN Union Makes the Nation (Benin)
UNIP United National Independence Party (Zambia)
UNSP National Union for Solidarity and Progress (Benin)
UPND United Party for National Development (Zambia)
UTRD Union for the Triumph of Democratic Renewal (Benin)
URP United Republican Party (Kenya)
USAID United States Agency for International Development
VCP Vertical Coordination Pressure
ZDC Zambian Democratic Congress (Zambia)
ZDC Zambian Republican Party (Zambia)
1
CHAPTER 1: CONCEPTUAL FRAMEWORK
1.1 INTRODUCTION
1.1.1 The Puzzle of Party Development in Sub-Saharan Africa
Political party development in sub-Saharan Africa is not linear. The past twenty years
have proven there are no guarantees that African parties will evolve into sustainable and
accountable institutions that effectively aggregate citizen interests and provide policy
alternatives. The early optimism that accompanied the spread of multiparty politics during the
“Third Wave” of democracy (Huntington 1991) has waned as illiberal democracies (Zakaria
1997) and electoral authoritarian regimes have proven remarkably resilient (Diamond 2002;
Schedler 2006; Levitsky and Way 2010). Nevertheless, regular multi-party elections have
become the norm rather than the exception throughout Africa (Lindberg 2006, Bratton et al
2013). Moreover, opposition victories in Benin, Cape Verde, Ghana, Kenya, Senegal, and
Zambia suggest that parties are not uniformly weak (LeBas 2011: 21). Indeed, since the
reintroduction of multiparty politics in the 1990s, there has been remarkable variation in political
party development across Africa.
In some countries, the number of political parties has proliferated since the reintroduction
of multiparty politics, while in others, the same few political parties regularly compete in every
election. As of 2010, Senegal had more than 160 registered political parties - a count that had
tripled during the preceding decade (Hartman 2010); more than 250 parties were registered to
compete in the Democratic Republic of Congo’s (DRC) 2011 general elections;1 and more than
1As per DRC’s National Independent Electoral Commission and the Ministry of Foreign Affairs: http://www.ceni.gouv.cd/partipolitique.aspx
2
300 parties were registered for Kenya’s 2007 elections.2 In these countries and many others,
politicians regularly form new political parties to compete in each general election. These parties
rarely retain their competitiveness over multiple elections and some die out altogether shortly
after their creation. On the other end of the spectrum, in Ghana, Tanzania, Mozambique, Nigeria,
Uganda, and Zambia, there are far fewer parties and the same parties compete in multiple
elections. Yet, these patterns of proliferation or stability are not always fixed - fewer than 60
political parties registered to compete in Kenya’s 2013 elections, down from more than 300 in
2007 – which suggests a possible reversal of the trend of party proliferation there. Further
attention is needed to better understand why the number of weak political parties has proliferated
in some African countries (some of the time) while in others the same few enduring political
parties remain competitive over multiple elections.
Like the ability of parties to remain competitive over multiple elections, the nature of
these parties has also varied widely across the continent and within individual countries over
time. As is the case elsewhere in the developing world, there are numerous species of parties
throughout Africa stemming from differences in organization, programmatic orientation, and
strategic motivation (Gunther and Diamond 2003). As discussed in more detail later in this
chapter, this project focuses on variation in ethnic parties vs. multiethnic political parties. For
example, political elites in Tanzania, Ghana, Mozambique, South Africa, and Uganda have all
had varying degrees of success establishing multiethnic, more nationally oriented ruling parties.
In Benin, Cameroon, DRC, Sierra Leone, Ivory Coast, Kenya, and Zimbabwe, on the other hand,
politicians cultivate the political salience of ethnic or regional differences through party
2 See Bertelsmann Stiftung’s Transformation Index (BTI) Kenya Country Report (2012), pg. 16: http://www.bti-project.org/fileadmin/Inhalte/reports/2012/pdf/BTI%202012%20Kenya.pdf
3
machinery to retain or attain power. Countries including Botswana, Malawi, Nigeria, and Zambia
lie somewhere in the middle - while both the ruling parties and opposition parties generally
include leaders from numerous different groups and have had varying degrees of success
obtaining national vote shares, the political salience of ethnic, linguistic, or regional identities
remain powerful (Cheeseman and Ford 2007: 25). Within-country variation suggests that when
cross ethnic/regional coordination incentives change, the political salience of ethnicity varies
from one election to the next (Posner 2005). As discussed in more detail later, extant
explanations do not adequately account for the complex processes that lead to differences in the
nature of parties across and within countries.
The nature of parties and the degree to which these parties remain competitive over
multiple elections are important indicators of a larger and more complex puzzle in African party
development. Differences in electoral volatility and levels of party nationalization reflect
variation in the extent of party system “institutionalization” a – complex phenomenon defined in
detail later in this chapter. On the one hand, countries that share numerous similarities have
experienced widely divergent outcomes pertaining to the nature and number of parties. On the
other hand, countries with numerous differences experienced similar outcomes. This project
seeks to address this puzzle by identifying key factors that explain why some African countries
have multiethnic parties and stable party systems while others do not.
1.1.2 Why Does African Political Party Development Matter?
Gaining a deeper understanding of African political party development by identifying the
factors that encourage electoral stability and the formation of national parties in Africa has wide
theoretical and practical relevance. My dissertation project aims to address gaps in the literature
4
in order to better inform ongoing African reform efforts and to improve international political
party assistance.
At a theoretical level, little is known about political party development in Africa. While
there is a vast literature on political parties and party systems in established democracies
(Schattschneider 1960; Sartori 1976; Aldrich 1995), scholars have largely ignored party
development in Africa and too little is understood about these institutions. In established
democracies, political parties serve a multitude of functions. Parties aggregate citizen interests
(Lipset and Rokkan 1967), provide policy alternatives (Sartori 1976), regulate the number of
people seeking office (Aldrich 1995), and they coordinate voters, candidates, and donors
(Chhibber and Kollman 2004). Political parties are endogenous institutions (Aldrich 1995).
Politicians specifically design their parties to obtain elected office or to achieve policy outcomes
(ibid). In the developing world, parties strive to serve all these functions and more because they
also manage conflict, provide alternatives to military cliques, and “are often the most immediate
and potent symbols of democracy to voters” (Hicken 2009: 5). Compared to their counterparts in
established democracies, scholars have observed that African parties are organized around ethno-
linguistic cleavages (Horowitz 1985), are only active around elections (Widner 1997), are
dependent on individual leaders and informal processes (Bratton and van de Walle 1997;
Diamond and Gunther 2001), have little connection to popular constituencies (Manning 2005;
Erdmann 2007), and rarely differ ideologically or programmatically from one another (van de
Walle 2003, Conroy-Krutz and Lewis 2011, Bleck and van de Walle 2013). While these
scholarly observations may be true of some African parties some of the time, extant explanations
do not adequately account for the variation in party development on the continent. I discuss the
shortcomings in the current state of the literature in more detail later in this chapter.
5
On a practical level, undeveloped, weakly institutionalized, party systems and ethnic
political parties can lead to violence and instability. When parties are fleeting and personal
leaders are more powerful than party labels, it becomes difficult for citizens to hold politicians
accountable because voters are not able to identify who deserves blame (or credit) for political
outcomes (Powell 2000). Political parties and party systems in established democracies often had
hundreds of years to evolve and mature, yet their counterparts in sub-Saharan Africa have not
had the luxury of developing gradually. Without adequate time, resources, or motivations to
cultivate strong organizations, it is not surprising that elites in many African countries establish
their parties along pre-existing ethno-regional cleavages. It is impossible for voters to know
about the behavior (past or potential) of all candidates so parties serve as useful heuristic
shortcuts for voters in institutionalized party systems (Popkin 1994; Aldrich 1995; Rogowski
2013). Throughout much of Africa, however, the frequency by which candidates “hop” parties
and shift alliances dilutes party brands (Conroy-Krutz 2009; Young 2012; Harding 2013). Ethno-
regional identities are often more enduring than party brands and consequently the ethnicity (or
race) of the candidate serves as a logical heuristic shortcut for African voters (Ferree 2006,
2010). When elections in Africa prove little more than ethnic censuses (Horowitz 1985), the rule
of law can quickly break down as one group is pitted against another in a zero-sum game in
which the electoral winner takes all. Incidents of election violence in Africa’s ethnically divided
societies are all too common as evidenced in Angola in 1992, Ivory Coast 2010-11, Kenya in
1997-8 and 2007-8, Nigeria in 2007, Sierra Leone in 1996-7, Zanzibar in 1995 and 2005, and
Zimbabwe in 2008.
A deeper understanding of African party development would better equip policy makers
in their efforts to strengthen institutions that foster peace and stability. Over the past decade,
6
there have been numerous efforts across Africa to reform existing laws or draft new legislative
acts specifically designed to curtail the dangers of ethnic violence associated with party
competition. Reform efforts are currently ongoing in a number of countries including Benin,
Kenya, Tanzania, and Zambia. International democratic development assistance efforts to
improve the likelihood of success for such efforts often lack clear-cut concepts in practice
because the scholarship on parties and party systems offers limited actionable insights (Carothers
2006; Erdmann 2012). In addition to addressing gaps in the literature, this project aspires to
provide analysis and recommendations to African policy makers and international donors in their
efforts to build stable party systems and more nationally oriented political parties.
1.1.3 Research questions
Why do some African countries have stable party systems with enduring national parties
while evanescent ethnic parties plague others? This overarching question guides my project and
leads to a number of related questions addressed in this dissertation: What are the factors that
influence electoral volatility and the formation of national rather than ethnic political parties in
Africa? To that end, what motivates politicians to build nationally oriented political parties that
represent the country as a whole over particularistic parties that advantage one group (ethnic,
regional, etc.) over others? Do political party regulations, the formal institutions explicitly
designed to influence the behavior of politicians, affect party development in Africa? If so, what
precise aspects of the content of party laws, if any, influence party nationalization and electoral
stability? Why do reforms to party laws appear to work in some countries (some of the time) and
not in others? What are the unintended consequences of party regulations? How can international
assistance encourage the development of party systems that minimize the dangers of political
7
conflict in Africa’s deeply divided societies? Despite their theoretical and practical significance,
scholars of comparative politics have largely ignored these questions in Africa.
1.2 DEFINITIONS
The objects of explanation in this project, national political parties and electoral
volatility, are complex and multifaceted phenomena. I provide brief descriptions of these
concepts here and continue building on these definitions throughout the dissertation.
1.2.1 Political Parties and Nationalization
The central focus of my research is on political parties. At the most basic level, a political
party is any group of candidates that contests an election under a common label (Epstein 1967;
Cox 1999). For this project, I use Coleman and Rosberg’s (1964) definition of political parties as
“associations formally organized with the explicit and declared purpose of acquiring and/or
maintaining legal control, either singly or in coalition or electoral competition with other similar
associations, over the personnel and the policy of the government of an actual or prospective
sovereign state.”3 In democratic systems, politicians build political parties in order to attain
control of government positions by obtaining public support and winning votes (Aldrich 1995).
Politicians choose whether to confine their appeal to certain segments of the population or to
widen their bases of support to attract voters from multiple different groups. Politicians design
and build their parties to accommodate these fundamentally different strategies of obtaining
votes. Consequently, the nature of the parties they build differs accordingly. While extensive
3 Coleman, J and Rosberg, C (eds). 1964. Political Parties and National Integration in Africa, (CA: University of California Press). Pg. 2
8
work has been done on identifying different types of political parties,4 this project focuses on the
distinction between particularistic and national political parties. Politicians who choose to
confine their appeal to a specific segment of the electorate construct particularistic political
parties while politicians who seek to catch as many voters as possible seek to widen their bases
of support by building national parties.
Particularistic parties: Africa’s particularistic parties are generally defined along ethnic,
religious, and regional differences as opposed to class or ideological divides (Gunther and
Diamond 2003; Carbone 2007). These parties usually lack elaborate organizational structures,
seek to mobilize the votes of a specific identity group, and promote policies to channel benefits
toward their “particularistically defined electoral clientele” (Gunther and Diamond 2003: 183).
Ethnic parties are particularistic in that they overtly put the needs of their own group ahead of the
universal needs of the country as a whole. Ethnic entrepreneurs rise to power on the promise that
they will “take care of their own” by allocating the resources of the state to provide for their
group once elected. There is ongoing debate as to the extent and degree to which Africa’s
political parties should be considered ethnic parties (Cheeseman and Ford 2007; Norris and
Mattes 2003; Scarrit and Mozaffar 2005). Nevertheless, conventional wisdom portrays the
majority of African parties as primarily ethnic in nature. And, despite subtle differences in how
they characterize African parties, most scholars also agree that ethnicity remains a powerful
source of cleavage throughout the continent. As such, this project focuses on one type of
particularistic party prevalent throughout most of Africa, ethnic parties.
4 See Lipset and Rokkan’s (1967) seminal account of the cleavage structures that define Western Europe after the industrial revolution, Aldrich’s (1995) meticulous account of the transformation of political parties in America, and Gunther and Diamond’s (2003) attempt at creating a comprehensive typology of the different species of political party throughout the world.
9
National Parties and Party Nationalization: For the purpose of this study, national
parties are defined as multiethnic institutions that are capable of obtaining a high proportion of
the vote in multiple regions of a country. In the African context, national parties need not have
equal strength in every region, but they have members and influence throughout many regions of
a country that transcend singular particularistic identities. Importantly, this project differentiates
between national political parties and coalitions of ethnic parties. A number of individual ethnic
parties may temporarily join forces to form a “coalition of convenience” with the sole intent of
pooling enough seats to form a government (Horowitz 1985). National political parties, on the
other hand, are more liken to Horowitz’s “coalitions of commitment” (ibid, Elischer 2008) in that
they contribute to longer-term ethnic compromise. In this study, however, national parties are
singular organizations comprised of leaders and members from multiple ethnic or regional
groups that come together under one party banner. National parties compete for votes across the
country instead of focusing solely on a narrow identity group or region (Reilly 2001). For this
project, I adopt Hicken’s definition of party “nationalization” as “the extent to which parties
have broad, national constituencies as opposed to constituencies that are primarily regional,
local, or parochial in nature” (Hicken 2009: 6). Also, national parties prioritize national interests
(or at least multiethnic interests) over those of a particular region or group. They are generally
more deeply rooted in society than their particularistic counterparts and have strong connections
with civic organizations (trade and labor unions etc.). This project is most interested in the
multiethnic character of national parties and the terms multiethnic and national are used
interchangeably when discussing the nature of political parties.
10
1.2.2 Party Systems and Institutionalization
Party Systems: Individual political parties must be understood in the context of party
systems, “the set of patterned interactions in the competition among parties” (Mainwaring and
Scully 1995: 4). Party systems shape and constrain the parties that operate within them by
establishing an “enduring pattern of intra-party organization…and inter-electoral competition”
Chhibber and Kollman 2004:4). Stable and effective party systems have long been viewed as
cornerstones of well-functioning democracies (Schattschneider 1942; Duverger 1954; Downs
1957; Key 1964).
Party System Institutionalization: A party system can be considered “institutionalized”
when the patterned interactions in the competition among political parties become well
established, widely known, and universally accepted (Mainwaring and Scully 1992). As
Huntington puts it, “Institutionalization is the process by which organizations and procedures
acquire value and stability” (Huntington 1968: 12). In institutionalized party systems, politicians
and citizens develop expectations and behaviors based on the belief that the existing processes
that govern party competition will prevail into the future. Mainwaring and Scully (1995) provide
a useful conceptualization of party systems in Latin America as existing on a continuum with
institutionalized systems on one end and “inchoate” systems on the other end. Party systems at
the institutionalized end of the spectrum are stable and enduring whereas systems at the inchoate
end are fragmented and volatile. Regular patterns of party competition foster stability while party
systems are volatile if parties arise quickly before elections only to dissolve soon thereafter. In
institutionalized party systems, citizens are able to easily distinguish between one party and
another. Moreover, in institutionalized systems, political actors accord legitimacy to the electoral
process. Finally, political parties acquire an independent status that is not completely
11
subordinated to the interests of individual leaders. That means that parties do not exist solely as
vehicles for electoral competition for particular individuals and do not dissolve when those
leading individuals withdraw from the party. As discussed in more detail in Chapter 2, electoral
volatility, or the degree of change in support for parties over multiple elections (Pedersen 1979),
is the key measure of party system institutionalization utilized in this study. For the sake of
parsimony, future allusions to “African political party development” in this dissertation refer
specifically to levels of nationalization and electoral volatility.
1.3 PREVAILING EXPLANATIONS
While little work has focused specifically on the factors associated with the emergence of
national parties and institutionalized party systems in Africa, scholars have drawn from
numerous theoretical traditions to explain a host of other political outcomes on the continent.
Applying these rival theories to identify the factors that seem to lead to African party
development makes sense here because this project treats these endogenous institutions as
political outcomes created by politicians. I group leading explanations for political outcomes in
Africa into four broad categories described briefly below: social structural determinants,
historical legacy, economic conditions, and institutions. While these explanations provide
valuable insights for some cases some of the time, none adequately accounts for the wide
variation in the nature and number of parties across the continent or within individual countries
across time.
12
1.3.1 Social Structural Determinants
Social structural explanations assert that demographic characteristics of populations
within a country like ethnicity, residential location, age, and education level are powerful
determinants of political outcomes in Africa. In his seminal work Ethnic Groups in Conflict,
Horowitz argues that in developing countries with strong social cleavages along ethnic lines,
ethnicity is often the most powerful determinant of voting behavior (Horowitz 1985). In divided
societies, which are all too common in Africa, Horowitz claims that “we have seen that an
election can become an ethnic head count…the election is a census, and the census is an
election” (ibid: 196). In one of the first systematic cross-national analyses of African vote choice,
Norris and Mattes (2003) find supportive evidence that language and race are, in fact, predictive
of support for the governing party.
More recently, in one of the few recently published works on the topic, Elischer (2013)
provides a structural explanation based on the size of the ethnic group and the level of ethnic
fragmentation as the driving force of African party development (Elischer 2013). Indeed, nearly
30 years after its introduction, Horowitz’s theory of the centrality of ethnicity to voting behavior
in Africa remains the “conventional wisdom” and is regularly espoused by academics,
journalists, and policy makers today. In addition to determining vote choice, proponents of this
theory argue that demographic factors also shape institutional design. If elections are mere ethnic
censuses then, not surprisingly, political parties are ethnic in nature. At their core, primordialist
accounts maintain that an individual’s identity is defined by demographic determinants and
consequently, her political behavior and the institutions she creates, can be predicted largely
based on these characteristics. Ultimately, proponents of social structural theory seek to confirm

13
that the political behavior of Africans (including variation in the nature and number of parties) is
largely determined by immutable demographic factors.
While most agree that ethnicity has some influence over political outcomes in Africa,
recent scholarship suggests that ethnicity may not be as powerful a determinant as previously
believed. In stark contrast to Norris and Mattes (2003), for instance, Bratton, Mattes, and
Gyimah-Boadi (2005: 305) conclude that at the cross-national level, ethnicity is not a statistically
significant predictor of vote choice and that social structural determinants play only a minor role
in shaping vote choice in Africa. Posner questions the immutability of ethnicity and effectively
shows that voters continuously choose from a variety of political identities (Posner 2003; 2006;
Eifert, Miguel, and Posner 2010). More recent work provides additional evidence that ethnicity
alone cannot explain vote choice throughout the continent (Cheeseman and Ford 2007; Dunning
and Harrison 2010; Keefer 2010). These more recent works call into question the power of social
structural determinants to shape the nature of political parties. Moreover, social structural
accounts have difficulty explaining variation in the number and nature of political parties in
countries that are demographically similar. For instance, despite sharing the same languages,
being ethnically diverse, and having many other demographic similarities, Tanzania has far
fewer political parties and has a considerably more stable party system than neighboring Kenya.
Social structural determinants certainly play a role in African political party development, but, in
isolation from additional factors, they fail to account for the wide variation in the number and
nature of parties across Africa.
14
1.3.2 Historical Legacy
Another set of scholars asserts that understanding Africa’s contemporary institutions is
impossible without recognizing the historical events and structural legacies that continuously
shape the continent’s present and future. Decades after independence, many argue that Africa’s
colonial legacy continues to impact political outcomes throughout present-day Africa (Mamdani
1996, Mazrui 2002, Mathai 2009; Adebajo 2010). More methodologically rigorous arguments
focus on the interplay between historical institutions and political behavior (Bratton and van de
Walle 1997; Boone 2003; Miguel 2004; MacLean 2010). Policy outcomes trigger feedback loops
that reinforce the recurrence of a particular pattern – path dependence - into the future (Pierson
2000, Thelen 1999). Once a country has started down a path, the relative benefits of sticking on
the same path and the costs of deviating from that path increase gradually over time. Historical
institutionalists recognize that institutions are endogenous creations that unevenly distribute
power across social groups (Hall and Taylor 1996; Steinmo and Torbert 1998). Institutions
reflect the power asymmetries within society and privilege certain interest groups over others
(Pierson 1996; Thelen 2004). Since historical legacies perpetuate path dependence and powerful
interests groups have created institutions that protect their interests, significant policy change is
rare (though Mahoney and Thelen 2010 compellingly argue that there is some room for
innovation). In the context of African party development, proponents of this framework would
agree “historical perspective should stress that today’s policymakers operate in an environment
fundamentally shaped by policies inherited from the past” (Pierson 1996: 179).
Nevertheless, despite the “stickiness” of path dependence, countries with similar
historical legacies have experienced widely divergent trajectories of political party development.
For instance, despite all being former British colonies, Tanzania and Kenya, and Zambia and
15
Zimbabwe have experienced dramatically different degrees of party nationalization and party
system institutionalization over time. To be fair, more sophisticated historical institutionalist
analyses recognize that reforms are possible during “critical junctures” (Hall and Taylor 1996:
942) in history that modify existing power relations or alter macro-structural factors (Thelen
1999; 2004). The inherent challenge, however, is identifying which historical events should be
considered critical in the midst of the countless other possible historical events that may or may
not have contributed to change. Identifying the critical historical events that contribute to
variation in the number and nature of parties both cross-nationally and within individual over
time can shed light on the factors that influence party nationalization and party system
institutionalization.
1.3.3 Economic Conditions
A third set of scholars contends that economic conditions strongly affect political
outcomes. Scholars focusing on civil war in Africa, for instance, have consistently shown that
economic conditions are powerful predictors of instability (Fearon and Laitin 2003; Londregan
and Poole 1990; Miguel, Satyanath and Sergenti 2004). Collier and Hoffler (2000) argue that
conflict is more likely in states with greater levels of resource abundance while McGowan and
Johnson (1984) and Fearon and Laitin (2003) assert that countries with higher GDPs are less
likely to experience conflict because they have the resources to pay the military and put down
local insurgencies. Scholarship suggests that economic development facilitates democratization
(Downs 1957; Lipset 1959; Diamond 1992; Przeworksi, Alvarez, Chiebub, and Limongi 2000;
Acemoglu and Robinson 2012). In the context of political party development, scholars have long
believed that economic freedom enables the independent economic foundations for social
16
coalitions and is necessary for multi-party democracy (Moore 1966; Dahl 1971; Riker 1982;
Boix and Stokes 2003). In his meticulously researched study, Arriola (2013) compellingly argues
that business is central to the formation of opposition coalitions and that multiethnic coalitions
are only possible in Africa when financial liberalization has brought the dispersal of economic
power from the incumbent (Arriola 2013: 34-35). According to Arriola then, economic
conditions should predict variation in political party development.
While few deny that economic conditions can shape political outcomes, the relationship
is not always straightforward (Colaresi and Thompson 2003). For instance, while Arriola’s
(2013) argument that financial liberalization is the key to forming successful multiethnic
coalitions explains the coalition success in Kenya’s 2002 elections, his argument simply does not
hold up for Kenya’s 2007 election. Despite increased economic openness compared to 2002, the
multiethnic coalition failed to attain victory in 2007 and Kenya rapidly descended to the brink of
civil war as ethnically charged election violence ran rampant throughout the country. Additional
work is needed to gain a deeper understanding of the complex means by which economic
outcomes shape party development in Africa.
1.3.4 Institutions
Identifying the relative strength of formal vs. informal institutions in shaping political
outcomes in Africa remains hotly debated (Bratton 2007). In his pivotal and oft cited work,
Douglass C. North asserts that political institutions can be “any form of constraint that human
beings devise to shape human interaction” including “formal constraints-such as the rules that
human beings devise - and informal constraints - such as conventions and codes of behavior”
(North 1990: 4). Advocates of the “new institutionalism” (March and Olsen 1984) primarily
17
focus on formal institutions like constitutions and rule-of-law abiding agencies in Western
democracies. While wide agreement exists that formal institutions impact political behavior in
established democracies, scholarship on African politics overwhelmingly supports the
dominance of informal institutions on the continent. Bratton compellingly argues that:
“corruption, clientelism, and ‘Big Man’ Presidentialism - all dimensions of neopatrimonial rule -
tend to go together as a package” (Bratton 2007: 98). The rule of law is weak (or non-existent) in
many African countries and most scholars agree that since personal relationships trump formal
rules, laws do not shape the behavior of African leaders. Indeed, the belief that African politics is
“not beholden to formal procedures but to personal decisions” (Leonard and Straus 2003: 3) has
become conventional wisdom.
Recent evidence, however, suggests that formal institutional rules are coming to matter
much more than they used to in many African countries. For instance, Posner and Young argue
that formal institutional rules have displaced violence as the primary source of constraints on
executive behavior (Posner and Young 2007). From the 1960s through the 1980s “most African
rulers left office through a coup, assassination, or some other form of violent overthrow…Since
1990, however, the majority have left though institutionalized means – chiefly through voluntary
resignation at the end of a constitutionally denied term or by losing an election” (ibid: 127).
Nevertheless, African leaders still manipulate formal rules to remain in office, as evidenced by
Nujoma in Namibia in 1999 and Museveni in Uganda in 2005. Indeed, African Presidents
successfully extended their terms in 12 out of 15 cases (Dulani 2011). Yet, the three instances
where constitutional laws trumped the personal whims of ruling elites show promise that the rule
of law is growing stronger in some countries. The efforts of Presidents Chiluba of Zambia,
Muluzi of Malawi, and Obasanjo of Nigeria to seek third terms were rejected on legal grounds.
18
More recently, Joyce Banda’s succession to the Presidency of Malawi despite efforts by cabinet
ministers to undermine the constitution after the sudden death of sitting president Mutharika in
April 2012 is additional evidence that formal rules are gaining traction. These recent
developments begin to suggest that the potential efficacy of formal institutions to shape political
behavior in Africa should not be summarily dismissed. In the context of African party
development, a deeper understanding of how the complex interactions between formal and
informal institutions impact the nature and number of parties is needed.
1.3.4.1 Political Party Laws
This project focuses primarily on one formal institution, political party regulations. Party
laws are the formal institutions most explicitly designed to influence African party development.
For this project, I adopt Janda’s (2004) definition of “party law” as the “body of state-based
regulations that determines the legal status of political parties and that often specify what
constitutes party membership, how parties must be organized, how they should campaign, how
they must handle party funds, and so on” (Janda 2004: 4). State laws concerning political parties
generally determine what constitutes a political party, regulate the form of activity in which
parties may engage, and ensure appropriate forms of party organization and behavior (Katz 2004:
2). Since 1990, many African states adopted varying degrees of formal democratic practices and
most introduced legislation specifically designed to shape their party systems by changing how
parties form, organize, and compete (Reilly 2008).
African party laws are grouped into two broad categories in this dissertation: centripetal
or consociational. Centripetal party laws attempt to minimize the impact of identity-politics by
creating incentives for leaders to establish broad-based parties that transcend cleavage
19
boundaries. Laws in this category seek to “pull the parties towards moderate, compromising
policies and to discover and reinforce the centre of a deeply divided political spectrum” (Sisk
1995: 19). Centripetal laws tend to be quite prescriptive and may include bans on ethnic parties,
minimum membership thresholds, branch office requirements, and internal democracy
requirements including elections for party leaders. Consociational party laws, on the other hand,
seek to institutionalize societal cleavages (ethnic, religious, regional) and protect the rights of
specific groups by allowing for the representation and articulation of all major interests in society
(Lijphart 1984). These regulations seek to explicitly preserve and protect the preferences of
subnational constituencies including ethnic groups (Hicken 2009). Advocates of
consociationalism argue that party regulations must maximize the potential for elite cooperation
and accommodation across subnational identity groups to foster stability in deeply divided
societies (Lijphart 1977; Powell 2000). Differences in the internal content and degrees of
implementation of these regulations cross-nationally and over time provide a unique opportunity
to systematically examine their influence (if any) on party development.
At present, little is known about the influence (or lack thereof) of party regulations on
African political party development. Evidence from Southeast Asia (Hicken 2008; 2009), Central
and Southern Europe (Bieber 2008), and Latin America (Birnir 2008) indicate that party
regulations can indeed affect the degree of party nationalization and party system
institutionalization in those regions. In Africa, however, the conventional wisdom is that formal
institutions hold little sway on political behavior, and party laws have been largely ignored
(Elischer 2013). As discussed in more detail in chapter two, this project systematically analyses
the content of African party regulations in combination with other possible demographic,
20
historical, economic, and additional institutional determinants to assess their impact on party
development.
1.4 THE ARGUMENT
By themselves, none of the theoretical explanations described in Part 3 adequately
account for variation in African party development. In combination, however, many of the
potential determinants discussed above begin to shed light on the puzzle. An overriding
shortcoming of many arguments of institutional change is that they lack agency. By not
sufficiently accounting for the strategic incentives of the political actors that interact with the
institutions, extant explanations tend to convey one dimensional and static explanations of
institutional development. This project attempts to overcome this deficiency by recognizing that
parties are endogenous institutions created by politicians (Aldrich 1995). As such, politicians
specifically design their parties to help them attain/maintain power or to achieve other political
outcomes. Therefore, demographic, historical, economic, and institutional factors must be
considered within the context of how they influence the decision-making calculus of politicians
who build parties to suit their needs. In young democracies, political parties “provide a means for
balancing local concerns with national interests and long-term priorities with short-term political
demands” (Hicken 2009: 5-6). Politicians need strong incentives to prioritize national rather than
local concerns, otherwise the development of national parties and institutionalized party systems
remains unlikely. I provide the building blocks of my conceptual framework for explaining
variation in African party development below.
21
1.4.1 Agency: Vertical vs. Horizontal Coordination
Politicians are confronted with two powerful, and often opposing, motivations as they
compete in elections: one is for vertical coordination while the other is for horizontal
coordination. Scholars have rightly depicted elections as a series of coordination problems
because candidates compete over a limited number of elected seats, and there are more
politicians than available seats (Cox 1999; Hicken 2011). Political parties are the instruments
used by ambitious politicians to obtain an elected seat, so politicians build their parties to best
achieve their goal of winning elections (Aldrich 1995). Successful political parties solve
collective action problems by aggregating interests of party members in such a way as to
mobilize supporters and win more votes than their competitors. As interest aggregators, parties
are comprised of members of different interest groups (ibid). Not every member can be the party
leader or vie for elected seats. Compromises are made to appease members of the same interest
group to secure their support within the party. Vertical coordination depicts the movement up
and down the ladder of hierarchy within the individual interest groups within a party. At the
same time, however, party leaders must also prioritize the demands of one interest group over the
demands of others in order to make policy platforms that successfully attract voters. This cross-
interest group interaction is horizontal coordination. Successful politicians, those that build
parties that lead to electoral victory, manage to overcome vertical and horizontal coordination
problems (Chhibber and Kollman 1998, 2004; Cox 1999; Hicken 2011).
In the African context, I argue that if the incentives for vertical coordination are more
powerful than the incentives for horizontal coordination, then there is lower likelihood of
multiethnic parties or institutionalized party systems. As Allen Hicken rightly notes, much
attention has focused on the factors that shape intra-district coordination between politicians
22
(Duverger 1954; Taagepera and Shugart 1989; Lijphart 1994; Cox 1997), yet we still know
relatively little about the forces that shape cross-district coordination (Hicken 2011: 15). In
Africa, I argue that the forces of vertical coordination are generally more powerful within
districts whereas the forces of horizontal coordination are stronger at the cross-district level.
While I acknowledge the great degree of ethnic variation within and across Africa, there is
generally more homogeneity within individual districts. Politicians are more likely to be from the
same ethnic groups and there are fewer interest groups in the intra-district arena. If the
politician’s interest group can provide enough votes for him to achieve his goal of winning an
elected position, than he will concentrate on rising up the vertical ladder of his party within his
own district. Particularistic parties and unstable party systems are more likely to arise in
countries where there is little incentive to seek votes from other interest groups. If, however, the
politician needs additional support across interest groups to win his seat, than there is greater
incentive for horizontal coordination across districts. When the potential benefits of horizontal
coordination are more powerful than the perceived benefits of vertical coordination, then
national parties and institutionalized party systems are more likely.
Understanding the complex processes that impact politicians’ incentives for vertical and
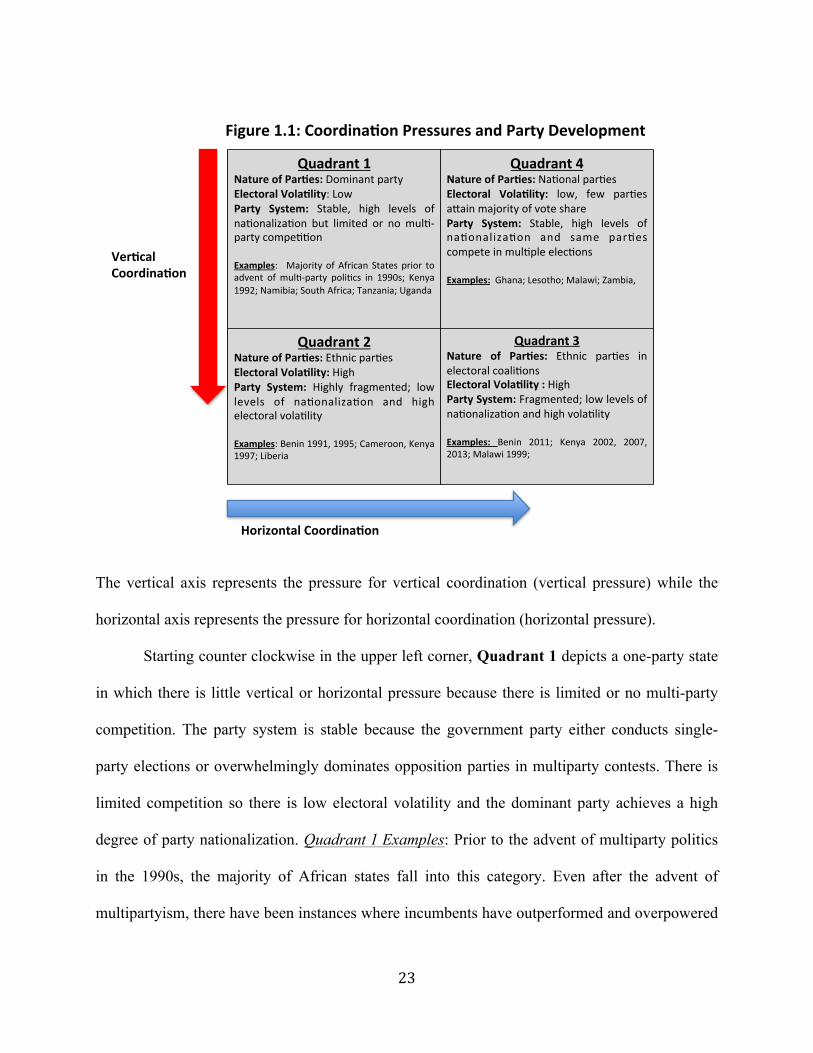
horizontal coordination holds the key to explaining variation in African party development.
Figure 1.1 presents a model that captures how the competing pressures of vertical and horizontal
coordination influence the strategic calculations of politicians, thereby shaping party
development:
23
The vertical axis represents the pressure for vertical coordination (vertical pressure) while the
horizontal axis represents the pressure for horizontal coordination (horizontal pressure).
Starting counter clockwise in the upper left corner, Quadrant 1 depicts a one-party state
in which there is little vertical or horizontal pressure because there is limited or no multi-party
competition. The party system is stable because the government party either conducts single-
party elections or overwhelmingly dominates opposition parties in multiparty contests. There is
limited competition so there is low electoral volatility and the dominant party achieves a high
degree of party nationalization. Quadrant 1 Examples: Prior to the advent of multiparty politics
in the 1990s, the majority of African states fall into this category. Even after the advent of
multipartyism, there have been instances where incumbents have outperformed and overpowered
Quadrant(1(Nature(of(Par/es:(Dominant(party++Electoral(Vola/lity:+Low++Party( System:( Stable,+ high+ levels+ of+na9onaliza9on+ but+ limited+ or+ no+mul9=party+compe99on+(Examples:+ (Majority+ of+African+ States+ prior+ to+advent+ of+mul9=party+ poli9cs+ in+ 1990s;+ Kenya+1992;+Namibia;+South+Africa;+Tanzania;+Uganda+(
+
Quadrant(4(Nature(of(Par/es:(Na9onal+par9es+Electoral( Vola/lity:( low,+ few+ par9es+aKain+majority+of+vote+share(Party( System:( Stable,+ high+ levels+ of+na9onaliza9on+ and+ same+ par9es+compete+in+mul9ple+elec9ons++Examples:+(Ghana;+Lesotho;+Malawi;+Zambia,++
+
Quadrant(2(Nature(of(Par/es:(Ethnic+par9es+Electoral(Vola/lity:(High(Party( System:( Highly( fragmented;+ low+levels+ of+ na9onaliza9on+ and+ high+electoral+vola9lity++Examples:+Benin+1991,+1995;+Cameroon,+Kenya+1997;+Liberia+(
Quadrant(3(Nature( of( Par/es:( Ethnic+ par9es+ in+electoral+coali9ons+Electoral(Vola/lity(:(High+(Party(System:(Fragmented;+low+levels+of+na9onaliza9on+and+high+vola9lity++Examples:( Benin+ 2011;+ Kenya+ 2002,+ 2007,+2013;+Malawi+1999;++
(
Horizontal(Coordina/on(
Figure(1.1:(Coordina/on(Pressures(and(Party(Development(
Ver/cal(Coordina/on(
24
their opposition to such an extent that the party system should still be classified as one-party
dominant. Kenya’s 1992 elections, for instance, should be classified as one-party dominant as
should all elections since 1990 in: Namibia, South Africa, Tanzania, and Uganda.
In Quadrant 2, the increase in vertical pressure without a corresponding increase in
horizontal pressure leads to a proliferation of ethnic parties. Politicians have little incentive to
form multiethnic national parties when the pressure for vertical coordination trumps pressure for
horizontal coordination. As discussed in more detail later in the dissertation, ethnic parties
generally have a lower likelihood of surviving over multiple election cycles than their national
counterparts. National parties require substantial investment from politicians because they
require robust organizational structures and strong dispute management and resolution systems
in order to accommodate the competing interests of their multiethnic coalitions under a single
party banner. Ethnic parties, on the other hand, require less investment as the leader only needs
to attain the support of his own ethnic bloc. Moreover, “party hopping” is rampant in systems
with many ethnic parties as politicians who do not secure nomination in their first party of choice
regularly jump to another party if they think they will stand a better chance of attaining (or
buying) nomination there. As a result, party systems in Quadrant 2 are fragmented and unstable
as they exhibit low levels of nationalization and experience high levels of electoral volatility
because parties rarely compete in multiple elections. Quadrant 2 Examples: Benin’s elections
from 1991 onwards; Kenya’s 1997 elections; Cameroon’s elections from 1992 onwards; and
Liberia’s 2005 and 2011 elections.
In Quadrant 3 in the lower right corner, as the horizontal pressure increases, there is
more pressure on politicians to reach out beyond their group to establish alliances with members
of other groups. Since vertical pressure is also high, however, politicians are more likely to build
25
ethnic parties and then form multiethnic electoral coalitions with other ethnic parties. Leaders of
multiple ethnic parties temporarily join forces and establish coalitions of convenience (Horowitz
1985) with the sole purpose of winning elections. While not as fragmented as in Quadrant 2,
electoral coalitions between ethnic parties are unlikely to survive more than one electoral cycle
so the party system remains unstable and exhibits low levels of nationalization. Quadrant 3
Examples: Benin’s 2011 elections; Kenya’s 2002 and 2013 elections; Malawi’s 1999 elections.
Finally, in Quadrant 4 in the upper right corner, the horizontal pressures are more
powerful than vertical pressures, creating an environment conducive to the formation of national
parties. High levels of horizontal pressures compel politicians to build strong, nationally oriented
parties that can effectively manage compromises across the various groups within the party.
These multiethnic nationally oriented parties are generally more organizationally robust than
their ethnic counterparts and tend to survive over multiple election cycles leading to stable party
systems. Quadrant 4 Examples: Ghana; Lesotho; Malawi; and Zambia. South Africa 1994, 1999,
2004, 2009; Tanzania 2010; Malawi 2009; Zambia 2011, etc.
This simple but effective model serves as the cornerstone of my theoretical argument. It
provides a viable framework for explaining variation in African party development across space
and time. While this chapter provides a brief overview, I continue to build on this framework
throughout the remainder of the dissertation.
1.4.2 Public Opinion
While widely ignored in explanations of African party development, I argue citizens’
attitudes and beliefs are increasingly gaining importance to African politicians, and consequently
public opinion influences the trajectory of African party development. Politicians need votes to
26
wins elections, but what factors influence how Africans vote? Like citizens elsewhere, Africans
rationally calculate the costs and benefits associated with voting (Bratton, Bhavnani and Chen
2012). Performance evaluations play a critical role in the rational calculus of Africans by
informing their assessment of the potential costs and benefits of their vote. Scholarship has found
that while demographic characteristics like ethnicity can impact vote choice, performance
evaluations are often much more powerful determinants (Bratton, Mattes, and Gyimah-Boadi
2005: 36, Norris and Mattes 2003, Lindberg and Morrison 2008; Bratton, Bhavnani and Chen
2012). Additional studies provide evidence that African voters act in a similar fashion to voters
in more mature democracies by employing either retrospective (rewarding or punishing the
incumbent on past accomplishments) or prospective (voting based on potential future
achievements) performance evaluations in their vote choice calculus (Wilkin, Haller, and
Norpoth 1997, Youde 2005). Applied to the context of political party development, when citizen
demand for national parties increases, then the horizontal pressures on politicians intensifies,
thereby increasing the likelihood of multiethnic, nationally oriented parties.
But do African voters prefer politicians that represent their nation as a whole (national
leaders) to politicians who help their home communities first (ethnic leaders)? The answer
depends on a multitude of factors that influence public opinion. Demographic, historical,
economic, and institutional factors shape the opinions and attitudes of African citizens.
Furthermore, African citizens don’t want to waste their votes. If there is no viable nationally
oriented candidate available, the African voter may be forced to choose the ethnic candidate she
deems has the best chance of victory and who is most likely to support her group while in public
office. Regardless of their voting preferences, however, the point here is that public opinion, in
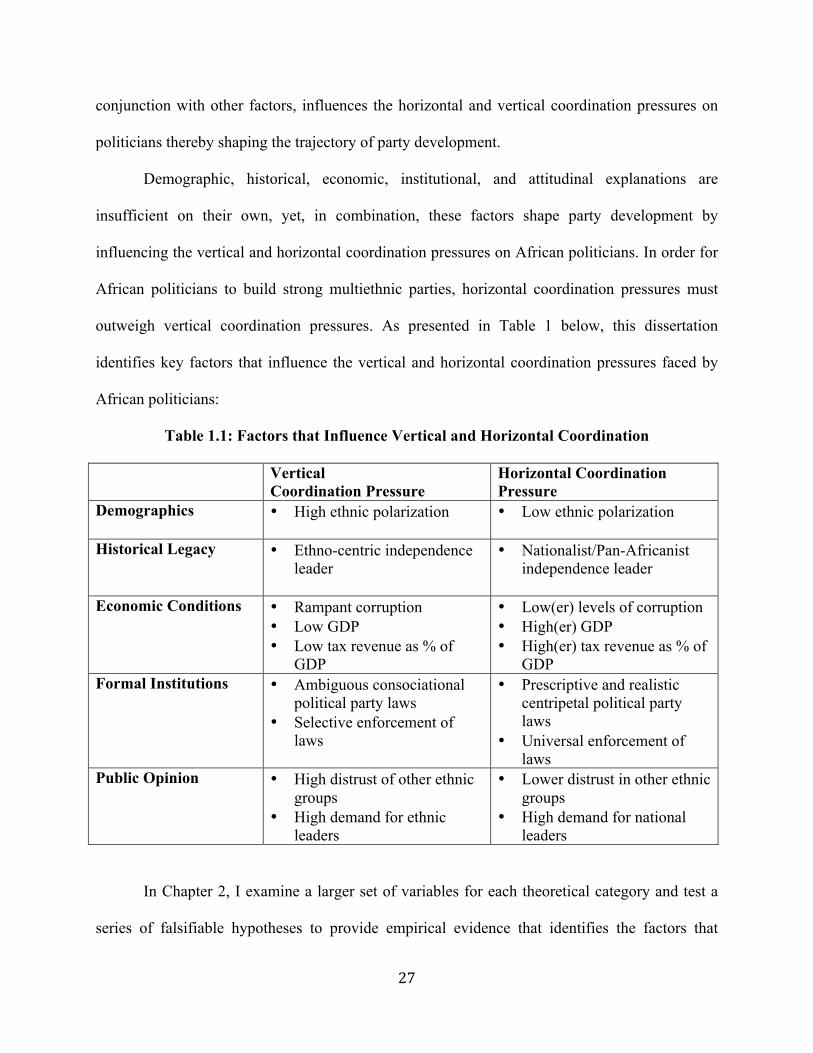
27
conjunction with other factors, influences the horizontal and vertical coordination pressures on
politicians thereby shaping the trajectory of party development.
Demographic, historical, economic, institutional, and attitudinal explanations are
insufficient on their own, yet, in combination, these factors shape party development by
influencing the vertical and horizontal coordination pressures on African politicians. In order for
African politicians to build strong multiethnic parties, horizontal coordination pressures must
outweigh vertical coordination pressures. As presented in Table 1 below, this dissertation
identifies key factors that influence the vertical and horizontal coordination pressures faced by
African politicians:
Table 1.1: Factors that Influence Vertical and Horizontal Coordination
Vertical Coordination Pressure
Horizontal Coordination Pressure
Demographics • High ethnic polarization
• Low ethnic polarization
Historical Legacy • Ethno-centric independence leader
• Nationalist/Pan-Africanist independence leader
Economic Conditions • Rampant corruption
• Low GDP • Low tax revenue as % of
GDP
• Low(er) levels of corruption • High(er) GDP • High(er) tax revenue as % of
GDP Formal Institutions • Ambiguous consociational
political party laws • Selective enforcement of
laws
• Prescriptive and realistic centripetal political party laws
• Universal enforcement of laws
Public Opinion • High distrust of other ethnic groups
• High demand for ethnic leaders
• Lower distrust in other ethnic groups
• High demand for national leaders
In Chapter 2, I examine a larger set of variables for each theoretical category and test a
series of falsifiable hypotheses to provide empirical evidence that identifies the factors that
28
contribute to electoral volatility and party system nationalization. Subsequent chapters use in-
depth analysis (drawn from elite interviews, focus group discussions, public opinion data,
participant observation, and comparative case study analysis) to identify the causal mechanisms
that influence how and why these factors influence the horizontal and vertical coordination
pressures that shape party development in Africa.
1.4.3 Virtuous Circles and Vicious Cycles of Party Development
The major finding of this dissertation is that the extent of centripetal regulation is
significantly correlated to lower levels of electoral volatility and higher levels of party system
nationalization. The institutional design and internal content of party regulations matters in
Africa. Some African countries have vague, poorly defined party laws while others set out
specific benchmarks (required number of party members in each region, branch offices, etc…)
and guidelines for parties to follow. Politicians choose to interpret party laws in ways that best
suit their goals (retaining power). Vague laws leave more room for politicians to interpret the
laws as they see fit and consequently have little effect on party development. Clearly designed
laws with specific requirements, on the other hand, leave less room for interpretation and are
more likely to shape party development.
Nevertheless, even the most well constructed laws mean little if no one abides by them so
it is not surprising that levels of enforcement of party laws shapes their ability to influence
political party development. Some countries strictly enforce their laws (as evidenced by the
number of parties that fail to gain registration or are otherwise disciplined) while others do not.
Politicians need to see that the government is serious about punishing politicians that disobey
party laws. As Mahoney and Thelen (2010) put it, “institutional rules are subject to varying
29
interpretations and levels of enforcement and therefore exhibit ambiguities that provide space for
interested agents in their effort to alter them” (Mahoney and Thelen 2010; xi). Institutional
change is most likely to occur in the space between the rules and their enforcement when the
rules impact existing power-distributional relationships (ibid: 14, Thelen 2009). An important
implication of their explanation of institutional change is that new laws can lead to unintended
consequences because outcomes may be the “ambiguous compromise” between elites with
different goals (Mahoney and Thelen 2010, Schickler 2001, and Palier 2005). I apply this logic
to my conceptual framework to provide insight into the conditions that shape whether or not
party laws successfully achieve their intended outcomes in Africa.
Identifying how party laws influence levels of horizontal coordination pressures holds the
key to explaining when and how African party laws are more likely to shape party development.
Not surprisingly, as noted earlier, when the horizontal coordination pressures are strong enough,
party leaders are more likely to build national rather ethnic parties. This project asserts that the
level of ethnic polarization, leadership legacy, content and enforcement of party laws, and citizen
demand for national parties are the crucial factors shaping party development. Politicians are
more likely to build strong and enduring national parties when: 1) there is low levels of ethnic
polarization, 2) the country’s independence leader prioritized building national cohesion over
enriching his own group, 3) there are centripetal party laws with realistic requirements, 4) the
laws are universally enforced, and 5) there is high citizen demand and support for national
parties. In unison, these forces work together to create a “virtuous circle” (Norris 2000,
Schlesinger and Heskett 1991) where a positive feedback loop reinforces strong horizontal
coordination pressures on politicians thereby encouraging national party development.
30
On the other hand, politicians are more likely to build ethnic parties if: 1) there is high
ethnic polarization, 2) there is a legacy of ethnically divisive leaders, 3) party laws are either too
vague or too ambitious, 4) the laws are selectively enforced, and 5) there is low citizen demand
and or support for national parties. These conditions create a “vicious cycle” where a negative
feedback loop reinforces low levels of horizontal coordination pressure on politicians thereby
perpetuating the development of ethnic rather than national parties. Importantly, even the most
well crafted party laws are unlikely to have any influence unless the other conditions are in place
to reinforce the virtuous circle of national party development.
1.5 OVERVIEW OF DISSERTATION
This project systematically examines variation in electoral volatility and levels of party
system nationalization across Africa since 1990. Political party development is a multifaceted
phenomenon. A complex interplay of demographic, historical, economic, and institutional factors
determine levels of electoral volatility and party nationalization throughout the continent. Under
the right conditions and if designed properly, this project provides evidence that suggests that
African party regulations can influence the development of national parties and stable party
systems.
Sub-Saharan Africa is an ideal setting for systematically examining the influence of party
regulations on the behavior of politicians and the development of party systems. First, there is
substantial variation in both the institutional design of party regulations and in their performance
across countries and over time (Basedau and Moroff 2011; Bogaards 2007)5. Second, there is a
5 Performance of party regulations defined here as the degree to which these formal institutions impact the behavior of politicians to shape party systems as intended by law.
31
range of authoritarian and competitive regimes (authoritarian, competitive authoritarian, electoral
democracies, and liberal democracies) on the continent (van de Walle 2002). Third, there are a
variety of different party systems (one-party, hegemonic, predominant, two-party, limited
pluralism, extreme pluralism) and numerous species of parties (ethnic, ethnic parties in electoral
coalitions, and multiethnic national parties) of political parties (Horowitz 1985; Gunther and
Diamond 2003; Elischer 2008, 2013). Finally, a majority of countries have conducted multiple
multiparty election, and many have changed party regulations between elections, which makes it
possible to track variation over time in some countries (including Kenya). I conclude this chapter
with a brief description of my research design and chapter summary below.
1.5.1 Research Design and Chapter Summary
This project employs a “nested analysis as a mixed-method strategy” (Lieberman 2005)
to gain a more comprehensive understanding of the factors that shape African party development
through both quantitative and qualitative evidence. The quantitative component of my project
consists of analysis of the African Party Laws and Nationalization Database (APLND), an
original database covering 78 elections from 27 sub-Saharan African countries. The APLND
contains detailed national assembly election results and extensive data on the party laws along
with other institutional, demographic, historical, and economic characteristics pertinent to this
project. I use country election year as the unit of analysis so that I can track changes in levels of
nationalization and electoral volatility over time. Chapter 2 describes the APLND in more detail
while Chapter 3 provides the large-N, cross-national analysis of this dissertation.
My in-depth analysis focuses on Kenya. Kenya is an interesting case study in that there
have been radical changes to its party laws and it has experienced fluctuations in levels of party
32
nationalization and electoral volatility. As per Figure 1 from earlier in this chapter, Kenya’s
elections fall into three of the four quadrants. Kenya’s 1992 elections are an example of a
dominant-party system (Quadrant 1), Kenya’s 1997 elections exemplify an increasingly
ethnicized party system (Quadrant 2), and Kenya’s 2002, 2007, and 2013 elections were
characterized by numerous ethnic parties in electoral coalitions (Quadrant 3). Few countries in
the APLND have experienced such variation since 1990. In Chapter 4, I draw from rich
secondary literature, elite interviews, and personal experience on Kenya’s 1992, 1997, 2002, and
2007 elections to assess and analyze trends in party development during this time period.
Chapter 5 focuses on Kenya’s 2013 general elections. In 2011, Kenyans made substantial
changes to the content of their existing political party laws in an attempt to prevent a recurrence
of the 2007-8 elections violence. From 2011-2013 I conducted more than a year of fieldwork in
Kenya leading up the March 2013 general elections. I revisited the country to conclude fieldwork
a year after the 2013 elections. While in Kenya I interviewed more than 50 political leaders from
across the political spectrum, met with numerous government officials including the Registrar of
Political Parties (RPP) and the Chairman of the Independent Electoral and Boundaries
Commission (IEBC), worked with democracy assistance providers,6 attended campaign rallies,
and participated in numerous political party related events and activities. In addition, I managed
two-dozen focus group discussions throughout the country and gained access to public opinion
data gauging attitudes pertaining to Kenyan political parties in the lead up to the 2013 elections.7
6 I served as an independent consultant for the National Democratic Institute for International Affairs and for the International Institute for Democracy and Electoral Assistance 7 By working as an independent consultant for the National Democratic Institute of International Affairs
33
I draw from this interview, focus group, and opinion data to identify the causal mechanisms of
conceptual framework and to inform my analysis of party development in Kenya.
In Chapter 6, I provide additional comparative case study analysis to further test my
theory and to gain a deeper understanding of the factors that influence African party
development. I used the APLND to identify Benin, Zambia, and Ghana as suitable comparative
cases studies to complement my large-N analysis and in-depth examination of Kenya. Benin is
an example of a country with a low level of centripetal party regulation and low levels of party
system nationalization and electoral stability (high electoral volatility). Zambia, on the other
hand, has relatively high levels of party nationalization and low levels of electoral volatility
despite the absence of any party laws. Finally, in Ghana, there is a high level of centripetal
regulation and some of the highest levels of party system nationalization and stability in the
APLND database. I draw from secondary literature on these countries to strengthen my
conclusions on the factors that shape party nationalization and electoral volatility there. I
conclude this project by summarizing the theoretical contributions of this project and by
providing detailed policy recommendations in Chapter 7.
34
CHAPTER 2: THE AFRICAN PARTY LAWS AND NATIONALIZATION (APLND) DATABASE
2.1 INTRODUCTION
As noted in Chapter 1, the goal of this dissertation project is to identify the factors that
contribute to variation in levels of party nationalization and electoral volatility across African
countries and within individual countries overtime. In order to identify these factors and to
systematically test alternative explanations, this study utilizes data from the African Party Law
and Nationalization Database (APLND), an original database constructed by the author
consisting of 78 elections from 27 countries from across sub-Saharan Africa since 1990.8 To the
best of the author’s knowledge, this is the most comprehensive database of its kind to date. The
APLND contains detailed national assembly election results and extensive data on the party laws
along with other institutional, demographic, historical, and economic characteristics pertinent to
this project. The APLND includes a minimum of two election years for most countries in the
database. As such, the unit of analysis of this study is country election year, which allows for
analysis over-time within individual countries as well as cross-national analysis. In addition, the
APLND contains a number of variables specifically included to test the hypotheses discussed in
8 The countries and elections in the database are: 1) Angola (1992,2008,2012), 2) Benin (1991,1995,2011), 3) Botswana (1994,1999,2004,2009), 4) Burkina Faso (1997,2012), 5) Cameroon (1997,2002), 6) Cape Verde (1995, 2001,2006,2011), 7) Gambia (1997,2007), 8) Ghana (1996, 2000,2004, 2008,2012), 9) Guinea-Bissau (1994, 2004), 10) Kenya (2007, 2013), 11) Lesotho (1993, 1998, 2002, 2007, 2012), 12) Liberia (2005, 2011), 13) Malawi (1999, 2004, 2009), 14) Mauritius (1991, 1995, 2000, 2005), 15) Mozambique (1999, 2004, 2009), 16) Namibia (1994, 1999, 2004), 17) Niger (1993), 18) Nigeria (2003, 2011), 19) Rwanda (2003, 2008), 20) Seychelles (2007, 2011), 21) Sierra Leone (2007, 2012); 22) South Africa (1994, 1999, 2004, 2009), 23) Tanzania (2005, 2010), 24) Togo (2007, 2013), 25) Uganda (2011), 26) Zambia (1991, 1996, 2001, 2006, 2011), 27) Zimbabwe (2005, 2008, 2013).
35
Section 2. These variables and the indicators used to empirically test the alternative explanations
of party nationalization and electoral volatility are discussed in detail in this chapter.
2.2 PARTY NATIONALIZATION AND ELECTORAL VOLATILITY
Party nationalization and electoral volatility are the objects of explanation of this study.
To calculate indicators of party nationalization and electoral volatility, detailed election results
that provide the territorial distribution of votes per party in elections are needed. As such, the
APLND includes official election results published by the respective electoral management
bodies in each country.9 In line with scholarship on party nationalization in other regions, only
detailed national assembly election results are included in the APLND (Jones and Mainwaring
2003; Morgenstern et al. 2009; Bochsler 2006; 2009). A number of the countries in the database
have parliamentary systems, so focusing on presidential election results would reduce the sample
size. Furthermore, it would prohibit comparison in levels of party nationalization or electoral
volatility between countries with parliamentary and presidential systems. The various measures
of party nationalization and electoral volatility included in the database are discussed briefly,
while the specific indicators used as the dependent variables in this study, party system
nationalization scores, weighted (PSNS-w) and legislative electoral volatility (LEV), are
described in detail below.
9 When official election results were not readily available on the websites or reports of the electoral management bodies of each country, detailed results were obtained from a variety of sources including: The African Elections Database (http://africanelections.tripod.com/); Elections in Africa: A Data Handbook (Nohlen et al., 1999); the Constituency Level Elections Archive (CLEA) http://www.electiondataarchive.org/; Election Passport (http://www.electionpassport.com/); and Adam Carr’s Election Archive (http://psephos.adam-carr.net/).
36
2.2.1 Measures and Variation of Party System Nationalization
As illustrated in Table 1 below, the APLND includes numerous widely used measures of
party nationalization. Central to most measures of party nationalization are the interconnected
concepts of aggregation and linkage. These terms are used interchangeably and refer to the
extent to which a party’s support at the district or regional level reflects that party’s support at
the national level (Chhibber and Kollman 2004). The more closely the support at the local level
mirrors the level of support at the national level, the more aggregated (or national) the party
system.
The party system measures in the APLND were calculated by inputting detailed national
assembly election results into Daniel Bochsler’s party nationalization calculator.10 A brief
description of the nationalization indicators follows. Cox inflation Score: measures the relative
difference in numbers of parties between the district and the national level (Cox 1999). Lower
scores indicate greater degree of party linkage. Chibber and Kollman (CK) Indicator of Party
Aggregation: subtracts the average of the effective number of parties at the district level from the
same number at the national level (Chibber and Kollman 1998). Lower scores indicate higher
degrees of aggregation and nationalization. Allik Indicator of Party Aggregation: is the
compliment of the inflation score. A score of 1 stands for high party aggregation and low values
signify low party aggregation (Allik 2006). Higher scores equal higher degree of party
aggregation. Effective Number of Parties - National: calculated by party vote share at the
national level (Laakso and Taagepera 1979). Effective Number of Parties - District: calculated
by average party vote share at the district level.
10 Bochsler’s party nationalization calculator is available at: http://www.bochsler.eu/pns/index_us.html
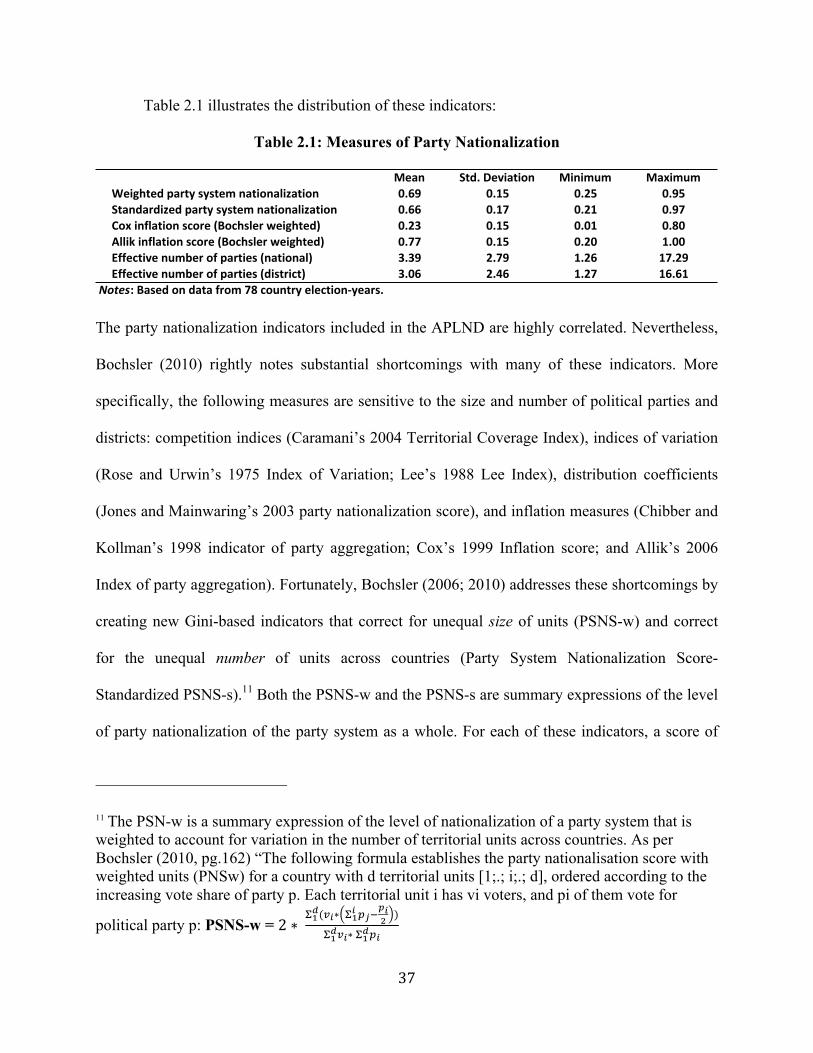
37
Table 2.1 illustrates the distribution of these indicators:
Table 2.1: Measures of Party Nationalization
The party nationalization indicators included in the APLND are highly correlated. Nevertheless,
Bochsler (2010) rightly notes substantial shortcomings with many of these indicators. More
specifically, the following measures are sensitive to the size and number of political parties and
districts: competition indices (Caramani’s 2004 Territorial Coverage Index), indices of variation
(Rose and Urwin’s 1975 Index of Variation; Lee’s 1988 Lee Index), distribution coefficients
(Jones and Mainwaring’s 2003 party nationalization score), and inflation measures (Chibber and
Kollman’s 1998 indicator of party aggregation; Cox’s 1999 Inflation score; and Allik’s 2006
Index of party aggregation). Fortunately, Bochsler (2006; 2010) addresses these shortcomings by
creating new Gini-based indicators that correct for unequal size of units (PSNS-w) and correct
for the unequal number of units across countries (Party System Nationalization Score-
Standardized PSNS-s).11 Both the PSNS-w and the PSNS-s are summary expressions of the level
of party nationalization of the party system as a whole. For each of these indicators, a score of
11 The PSN-w is a summary expression of the level of nationalization of a party system that is weighted to account for variation in the number of territorial units across countries. As per Bochsler (2010, pg.162) “The following formula establishes the party nationalisation score with weighted units (PNSw) for a country with d territorial units [1;.; i;.; d], ordered according to the increasing vote share of party p. Each territorial unit i has vi voters, and pi of them vote for
political party p: PSNS-w = 2 ∗ !!!(!!∗ !!! !!!
!!! )
!!!!!∗ !!!!!
Mean Std.)Deviation Minimum MaximumWeighted)party)system)nationalization 0.69 0.15 0.25 0.95Standardized)party)system)nationalization 0.66 0.17 0.21 0.97Cox)inflation)score)(Bochsler)weighted) 0.23 0.15 0.01 0.80Allik)inflation)score)(Bochsler)weighted) 0.77 0.15 0.20 1.00Effective)number)of)parties)(national) 3.39 2.79 1.26 17.29Effective)number)of)parties)(district) 3.06 2.46 1.27 16.61
Notes:)Based)on)data)from)78)country)electionPyears.
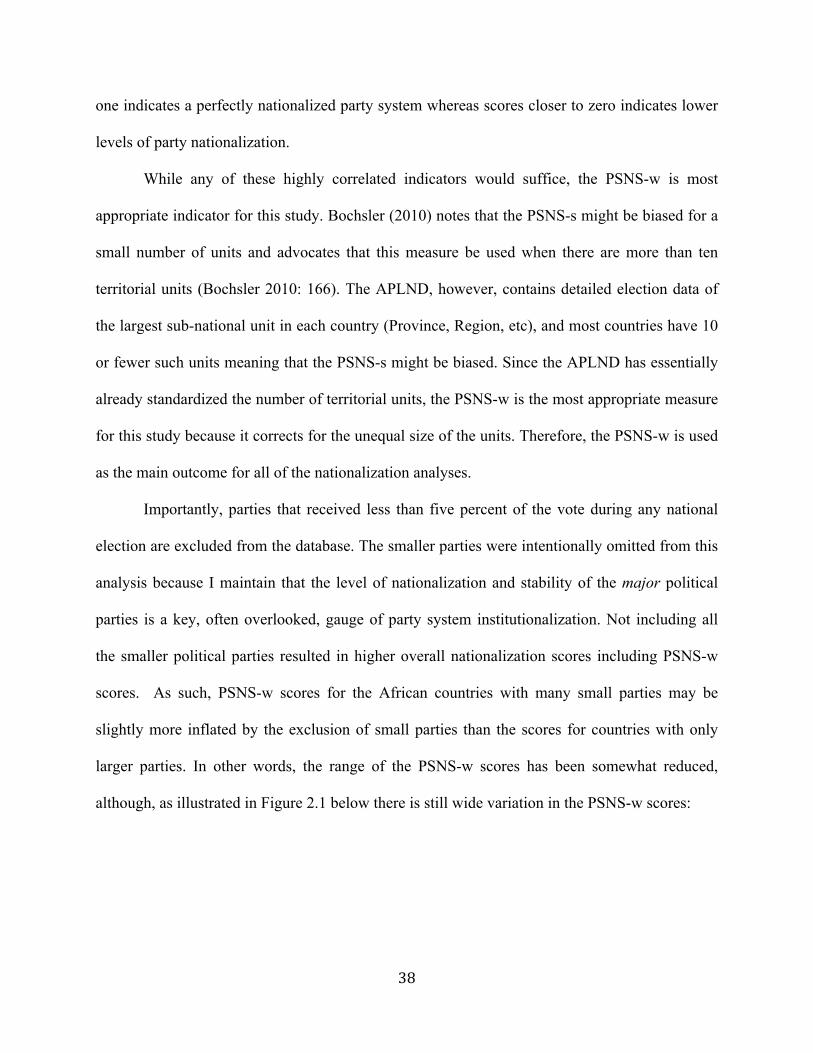
38
one indicates a perfectly nationalized party system whereas scores closer to zero indicates lower
levels of party nationalization.
While any of these highly correlated indicators would suffice, the PSNS-w is most
appropriate indicator for this study. Bochsler (2010) notes that the PSNS-s might be biased for a
small number of units and advocates that this measure be used when there are more than ten
territorial units (Bochsler 2010: 166). The APLND, however, contains detailed election data of
the largest sub-national unit in each country (Province, Region, etc), and most countries have 10
or fewer such units meaning that the PSNS-s might be biased. Since the APLND has essentially
already standardized the number of territorial units, the PSNS-w is the most appropriate measure
for this study because it corrects for the unequal size of the units. Therefore, the PSNS-w is used
as the main outcome for all of the nationalization analyses.
Importantly, parties that received less than five percent of the vote during any national
election are excluded from the database. The smaller parties were intentionally omitted from this
analysis because I maintain that the level of nationalization and stability of the major political
parties is a key, often overlooked, gauge of party system institutionalization. Not including all
the smaller political parties resulted in higher overall nationalization scores including PSNS-w
scores. As such, PSNS-w scores for the African countries with many small parties may be
slightly more inflated by the exclusion of small parties than the scores for countries with only
larger parties. In other words, the range of the PSNS-w scores has been somewhat reduced,
although, as illustrated in Figure 2.1 below there is still wide variation in the PSNS-w scores:
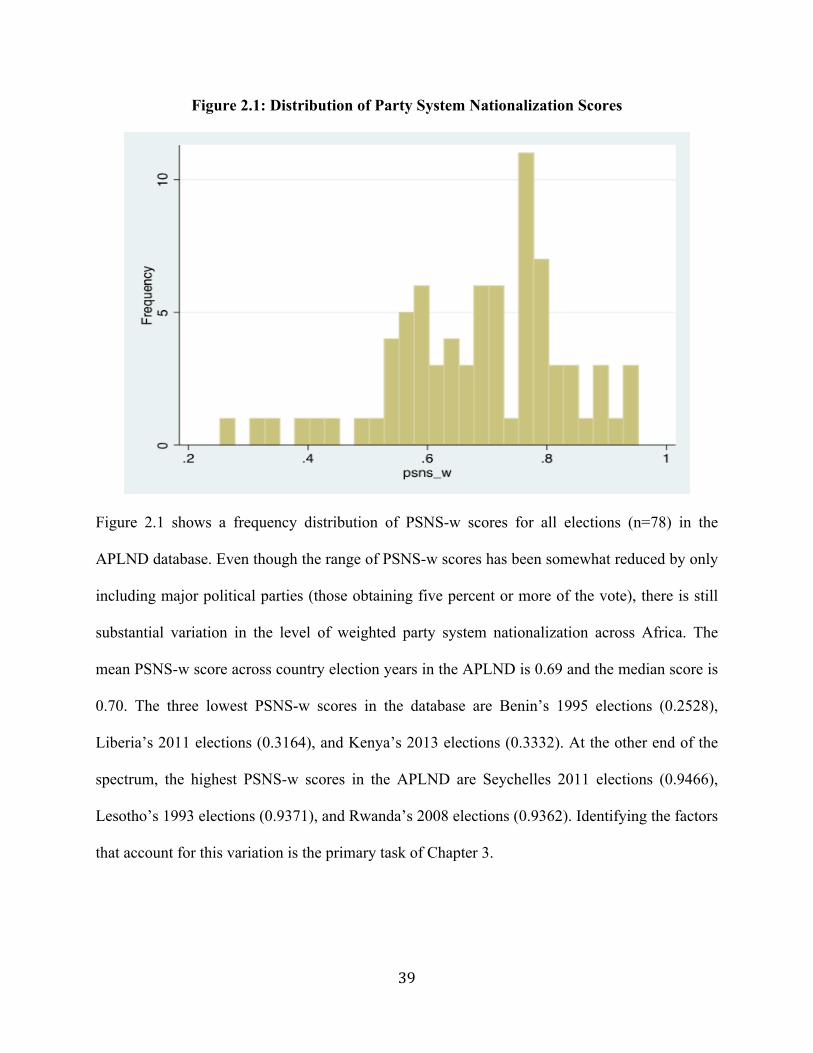
39
Figure 2.1: Distribution of Party System Nationalization Scores
Figure 2.1 shows a frequency distribution of PSNS-w scores for all elections (n=78) in the
APLND database. Even though the range of PSNS-w scores has been somewhat reduced by only
including major political parties (those obtaining five percent or more of the vote), there is still
substantial variation in the level of weighted party system nationalization across Africa. The
mean PSNS-w score across country election years in the APLND is 0.69 and the median score is
0.70. The three lowest PSNS-w scores in the database are Benin’s 1995 elections (0.2528),
Liberia’s 2011 elections (0.3164), and Kenya’s 2013 elections (0.3332). At the other end of the
spectrum, the highest PSNS-w scores in the APLND are Seychelles 2011 elections (0.9466),
Lesotho’s 1993 elections (0.9371), and Rwanda’s 2008 elections (0.9362). Identifying the factors
that account for this variation is the primary task of Chapter 3.
40
2.2.2 Measures and Variation of Electoral Volatility
In addition to the party nationalization indicators, the APLND includes widely used
measures of electoral volatility. In line with studies by both Mainwaring and Scully (1995) and
Kuenzi and Lambright (2001), this project uses Pedersen’s index of volatility to calculate
presidential and electoral volatility scores. Pedersen’s Index measure the net change in each
party’s seat or vote share from election to election by summing the net change in the percentage
of seats won or lost (or vote share) by all the parties (or presidential candidates) and dividing by
two (Pedersen 1979; Mainwaring and Scully 1995, Kuenzi and Lambright 2001). In addition, the
APLND also includes presidential/legislative difference scores that are calculated by taking the
difference between the percentages of votes captured by a party in a presidential election and the
percentage of lower chamber seats won by the same party in the corresponding legislative
election (Kuenzi and Lambright 2001: 444). Nevertheless, since the APLND includes detailed
national assembly results, this analysis focuses primarily on legislative electoral volatility scores
calculated from the net change in vote share for each party that ever obtained five percent or
more in any election in the database. The database includes legislative electoral volatility scores
from a total of 45 elections from 21 countries (n=45). Legislative electoral volatility scores were
calculated only for consecutive elections, which accounts for the fewer number of cases for
analysis than the PSNS-w scores.
Figure 2.2 shows the distribution of legislative electoral volatility (LEV) scores in the
APLND database (n=45):
41
Figure 2.2: Distribution of Legislative Electoral Volatility Scores
There is a wide range of volatility scores—representing elections in which the parties maintain a
large proportion of their vote share between elections, as well as elections in which completely
new parties win votes. The mean LEV score in the APLND is 0.25 while the median is 0.15. The
lowest LEV scores in the database are Cape Verde’s 2011 elections (0.010), Ghana’s 2012
elections (0.0146), and Ghana’s 2004 elections (0.02285). Meanwhile, at the other end of the
range with the highest LEV scores are Togo’s 2013 elections (0.7919), Mauritius’s 1995 and
2000 elections (0.6867 and 0.7316), and Kenya’s 2007 elections (0.677). Generally, factors that
encourage party system nationalization are expected to discourage electoral volatility. The
measures are negatively correlated (Pearson’s correlation coefficient = -0.41). Nevertheless, the
smaller number of cases (n=45) means that all results from the analyses of legislative electoral
volatility are provided as suggestive evidence and are not as statistically robust as those results
for PSNS-w scores (n=78). With this caveat, analyses of legislative electoral volatility are
included where appropriate in Chapter 3.
42
2.3 POLITICAL PARTY LAWS (Independent Variables)
The APLND includes detailed information on the political party registration laws and
finance regulations for all 27 of the countries in the database since 1990. As discussed in more
detail in Chapter 3, since party laws are the formal institutions specifically designed to influence
party development, they are the key explanatory variables of interest. This project adopts Janda’s
definition of “party law” as the “body of state-based regulations that determines the legal status
of political parties and that often specify what constitutes party membership, how parties must be
organized, how they should campaign, how they must handle party funds, and so on” (Janda
2005: 3-4, see also Katz 2004). The party registration laws were obtained from a number of
sources including the German Institute of Global and Area Studies (GIGA)12, Kenneth Janda’s
database of party laws at the National Democratic Institute for International Affairs
(https://www.ndi.org/db), country reports from the Electoral Institute for Sustainable Democracy
in Africa (EISA), and the electoral management bodies or other legal entities of each respective
country. Information on the party finance laws for each country not included in the above was
primarily sourced from the International Institute for Democracy and Electoral Assistance’s
(IDEA) Party Finance Database (http://www.idea.int/parties/finance/). Before inclusion into the
APLND, the laws were disaggregated into eight smaller components to allow for comparisons
cross-nationally and over time. For ease of comparison, the variables are all dichotomous –
coded “1” if the specific aspect of law is present in the country during that election and coded
“0” if not. The party law variables included in the APLND are as follows:
12 The author wishes to convey his sincere gratitude to Matthias Basedau and Anika Moroff of the German Institute of Global and Area Studies (GIGA) for sharing their collection of African party regulations (Basedau and Moroff 2011).
43
Party Registration Laws The APLND database includes six registration laws: 1) ban on
ethnic parties, 2) prohibitions on ethnic party names, 3) minimum membership threshold
requirements, 4) branch office requirements, 5) internal democracy requirements (mandates for
internal democratic elections to select party leaders), 6) detailed and explicit legal guidelines for
the formation of coalitions or party mergers.
Party Finance Laws The database includes two variables pertaining to party finance laws:
1) whether or not public funding is available to parties, and 2) whether there are provisions for
free or subsidized media. While thresholds for both funding and media access vary substantially
across countries and over time, further disaggregation of these variables would reduce the sample
size to the point where statistical analysis would be impossible. As a result, countries obtain a
score of “1” for these respective indicators if public finance or media access is available,
regardless of differences in minimum thresholds or other requirements.
Table 2.2 below shows the country election years included in the database. The Xs
indicate which party laws were in place for each country at any point during this time period.
Some party laws are more common than others and some countries have more party regulations
than others.
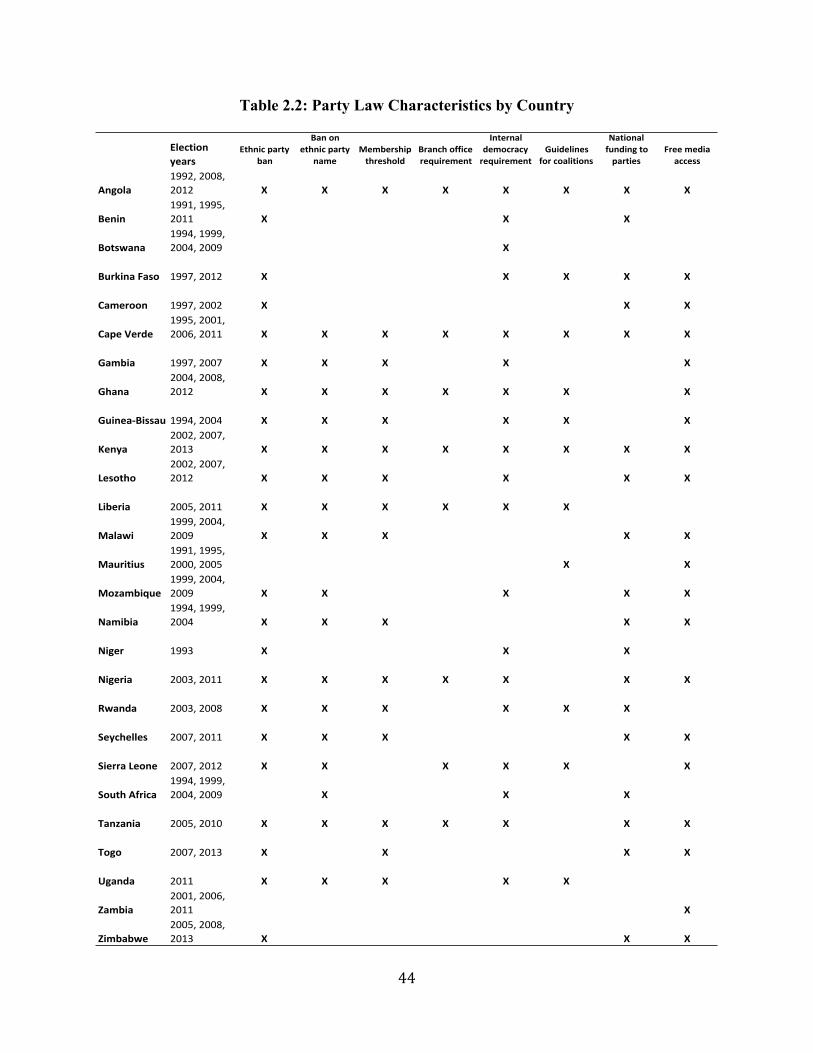
44
Table 2.2: Party Law Characteristics by Country
Election)years
Ethnic)party)ban
Ban)on)ethnic)party)
nameMembership)threshold
Branch)office)requirement
Internal)democracy)requirement
Guidelines)for)coalitions
National)funding)to)parties
Free)media)access
Angola1992,%2008,%2012 X X X X X X X X
Benin1991,%1995,%2011 X X X
Botswana1994,%1999,%2004,%2009 X
Burkina)Faso 1997,%2012 X X X X X
Cameroon 1997,%2002 X X X
Cape)Verde1995,%2001,%2006,%2011 X X X X X X X X
Gambia 1997,%2007 X X X X X
Ghana
1996,%2000,%2004,%2008,%2012 X X X X X X X
GuineaCBissau 1994,%2004 X X X X X X
Kenya
1992,%1997,%2002,%2007,%2013 X X X X X X X X
Lesotho
1993,%1998,%2002,%2007,%2012 X X X X X X
Liberia 2005,%2011 X X X X X X
Malawi1999,%2004,%2009 X X X X X
Mauritius1991,%1995,%2000,%2005 X X
Mozambique1999,%2004,%2009 X X X X X
Namibia1994,%1999,%2004 X X X X X
Niger 1993 X X X
Nigeria 2003,%2011 X X X X X X X
Rwanda 2003,%2008 X X X X X X
Seychelles 2007,%2011 X X X X X
Sierra)Leone 2007,%2012 X X X X X X
South)Africa1994,%1999,%2004,%2009 X X X
Tanzania 2005,%2010 X X X X X X X
Togo 2007,%2013 X X X X
Uganda 2011 X X X X X
Zambia
1991,%1996,%2001,%2006,%2011 X
Zimbabwe2005,%2008,%2013 X X X
45
2.3.1 Centripetal vs. Consociational Party Laws
The content and extent of implementation varies, yet African party laws can be further
grouped into two broad types:
Centripetal Party Laws: attempt to minimize the impact of identity-politics by creating
incentives for leaders to establish broad-based parties that transcend cleavage boundaries.
Centripetal party laws seek to “pull the parties towards moderate, compromising policies and to
discover and reinforce the centre of a deeply divided political spectrum” (Sisk 1995: 19).
Advocates of centripetal party laws argue that party laws must foster intercommunal moderation
by promoting multiethnic political parties that encourage inter-group accommodation (Horowitz
1985; 1991; Reilly 2001; 2006). Centripetal laws tend to be quite prescriptive and may include
bans on ethnic parties, minimum membership thresholds, branch office requirements, and
internal democracy requirements including elections for party leaders. Countries in this category
usually have majoritarian electoral systems and their party regulations attempt to give candidates
and voters incentives to look beyond their own ethnic groups.
Consociational Party Laws: seek to institutionalize societal cleavages (ethnic, religious,
regional) and protect the rights of each group by allowing for the representation and articulation
of all major interests in society (Lijphart 1984). Consociationalism is synonymous with power-
sharing and consociational party regulations tend to explicitly preserve and protect the
preferences of subnational constituencies including ethnic groups (Hicken 2009). Advocates of
consociationalism argue that party regulations must maximize the potential for elite cooperation
and accommodation across subnational identity groups to foster stability in deeply divided
societies (Lijphart 1977; Powell 2000). In stark contrast to the prescriptive nature of centripetal
party regulations, consociational party laws are generally less structured and more open to
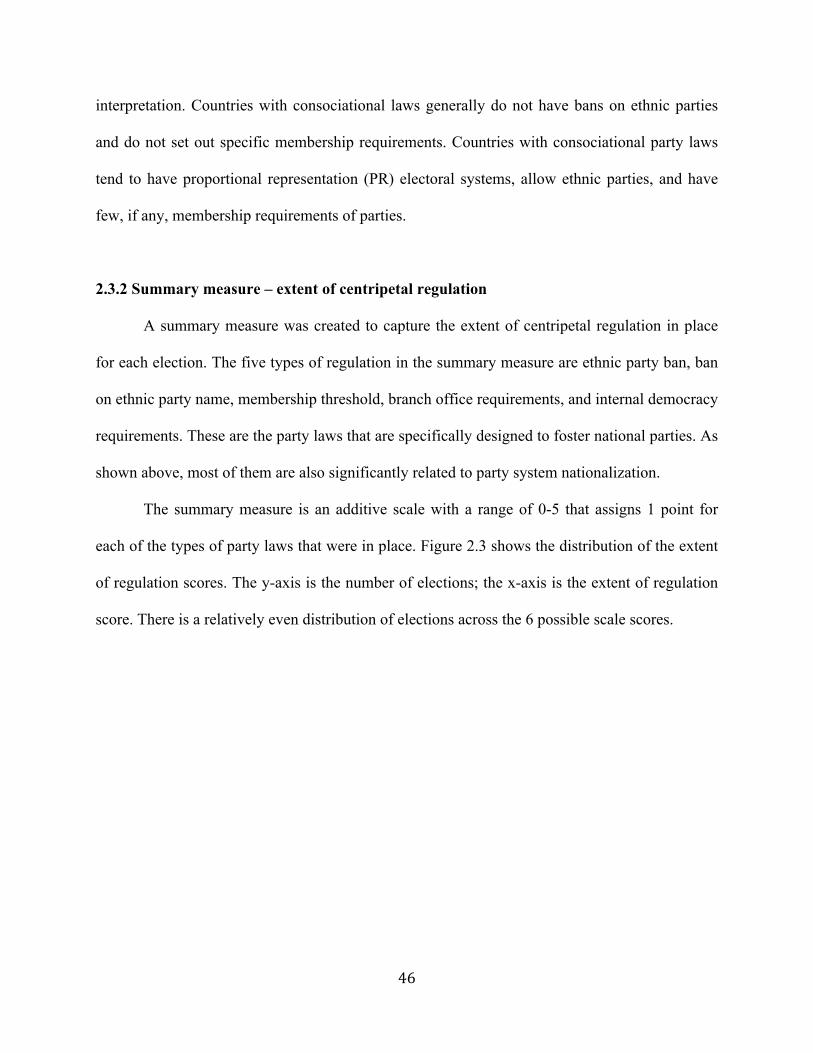
46
interpretation. Countries with consociational laws generally do not have bans on ethnic parties
and do not set out specific membership requirements. Countries with consociational party laws
tend to have proportional representation (PR) electoral systems, allow ethnic parties, and have
few, if any, membership requirements of parties.
2.3.2 Summary measure – extent of centripetal regulation
A summary measure was created to capture the extent of centripetal regulation in place
for each election. The five types of regulation in the summary measure are ethnic party ban, ban
on ethnic party name, membership threshold, branch office requirements, and internal democracy
requirements. These are the party laws that are specifically designed to foster national parties. As
shown above, most of them are also significantly related to party system nationalization.
The summary measure is an additive scale with a range of 0-5 that assigns 1 point for
each of the types of party laws that were in place. Figure 2.3 shows the distribution of the extent
of regulation scores. The y-axis is the number of elections; the x-axis is the extent of regulation
score. There is a relatively even distribution of elections across the 6 possible scale scores.
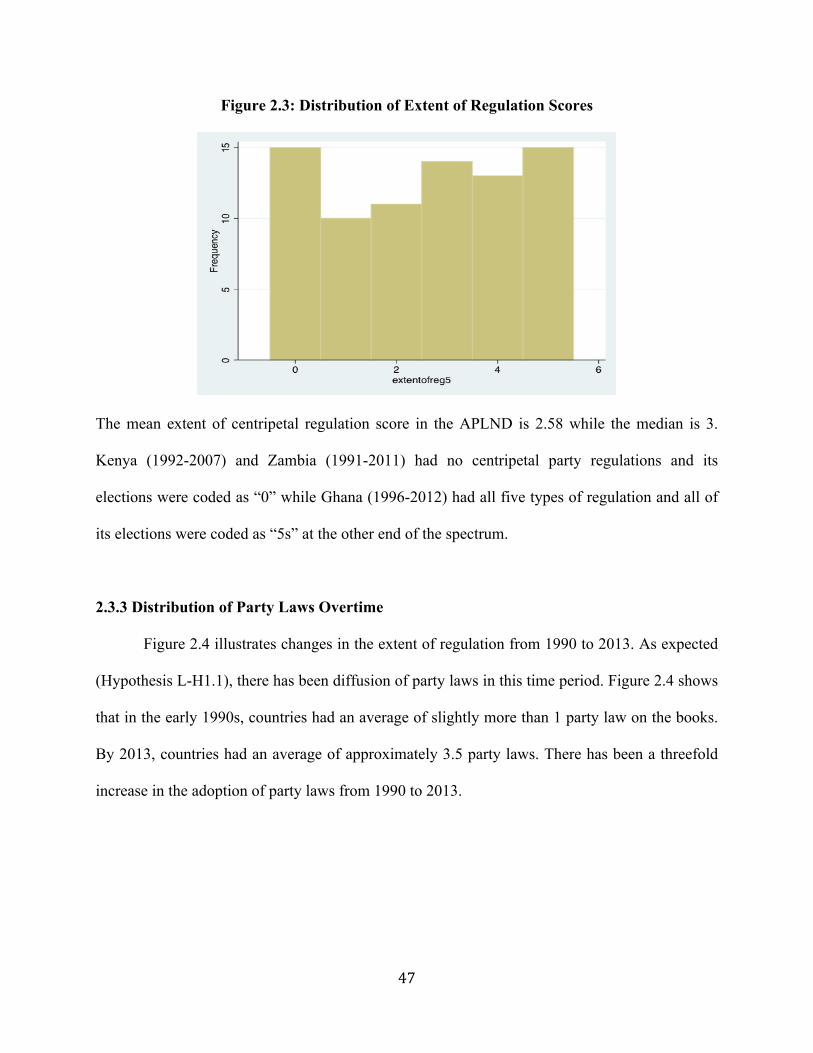
47
Figure 2.3: Distribution of Extent of Regulation Scores
The mean extent of centripetal regulation score in the APLND is 2.58 while the median is 3.
Kenya (1992-2007) and Zambia (1991-2011) had no centripetal party regulations and its
elections were coded as “0” while Ghana (1996-2012) had all five types of regulation and all of
its elections were coded as “5s” at the other end of the spectrum.
2.3.3 Distribution of Party Laws Overtime
Figure 2.4 illustrates changes in the extent of regulation from 1990 to 2013. As expected
(Hypothesis L-H1.1), there has been diffusion of party laws in this time period. Figure 2.4 shows
that in the early 1990s, countries had an average of slightly more than 1 party law on the books.
By 2013, countries had an average of approximately 3.5 party laws. There has been a threefold
increase in the adoption of party laws from 1990 to 2013.
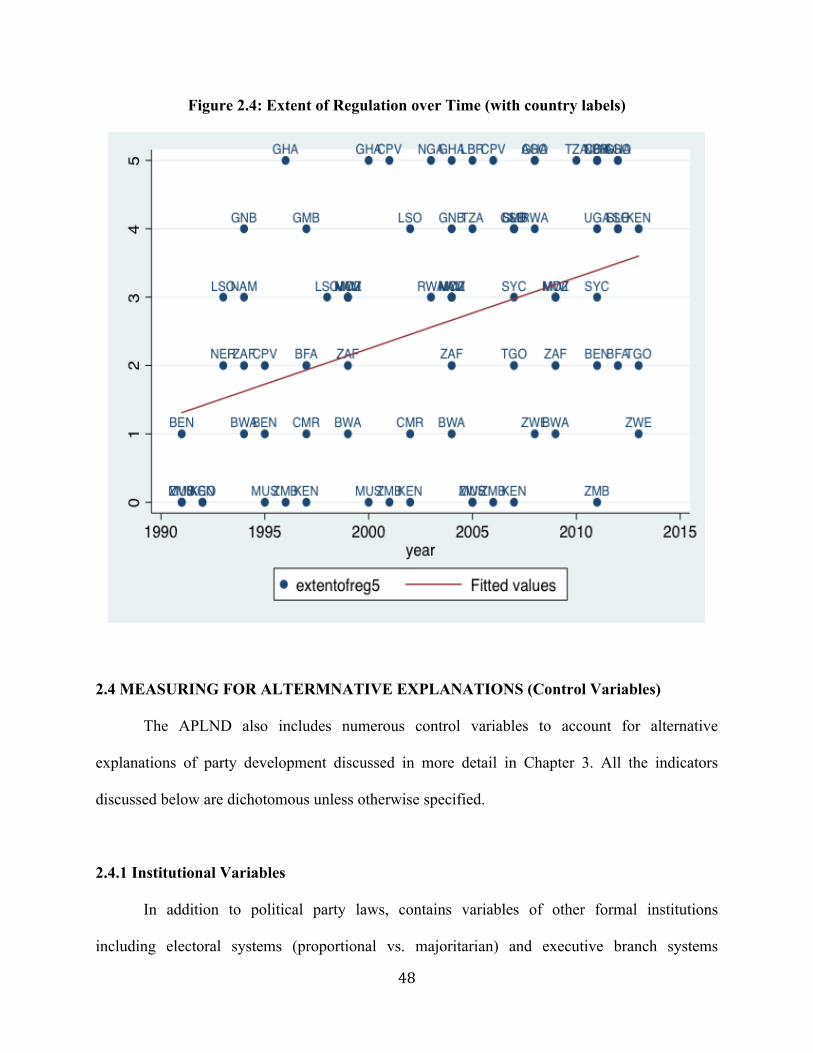
48
Figure 2.4: Extent of Regulation over Time (with country labels)
2.4 MEASURING FOR ALTERMNATIVE EXPLANATIONS (Control Variables)
The APLND also includes numerous control variables to account for alternative
explanations of party development discussed in more detail in Chapter 3. All the indicators
discussed below are dichotomous unless otherwise specified.
2.4.1 Institutional Variables
In addition to political party laws, contains variables of other formal institutions
including electoral systems (proportional vs. majoritarian) and executive branch systems
49
(parliamentary vs. presidential systems). This information used to calculate these variables was
sourced primarily from the African Elections Database (http://africanelections.tripod.com/).
2.4.2 Demographic Variables
The APLND includes Fearon’s 2003 ethnic fractionalization index score (range from 0
signifying no fractionalization to 1 signifying extreme fractionalization), and the proportion of
the population that resides in urban areas (as a percent of total population). These variables were
sourced from Fearon 2003 and World Bank Development Indicators
(http://data.worldbank.org/data-catalog/world-development-indicators).
2.4.3 Historical Variables
The database includes variables on countries that had a “nationalist” independence leader,
former colonial powers, and whether the country was a settler colony. We know from Miguel
(2004) that the legacy of independence leader’s nation building strategies can have a deep and
lasting influence contemporary policy outcomes (Miguel 2004). As such, I created the “National
Independence Leader” variable based on historical data and discussions with experts in African
politics to inform the coding of this variable. The intuition here is that contrary to ethnic leaders,
nationalist leaders championed strong national identities and promoted nationally oriented
policies that sought to increase regional cooperation within their countries. Strong nationalist
leaders strove to build more cohesive national identities in contrast to ethnic nationalists who
prioritized the enrichment of their own ethnic group over the wellbeing of their country. There is
a strong correlation between Pan-Africanist leaders and nationalist leaders. Not surprisingly,
many of the politicians that championed Pan-Africanist ideals often supported policies to
50
encourage more national cohesion within their own countries. The following were coded as
“nationalist” independence leaders in this study: 1) Seretse Khama (Botswana), 2) Thomas
Sankara (Burkina Faso), 3) Amiclar Cabral (Cape Verde), 4) Kwame Nkrumah (Ghana), 5)
Nelson Mandela (South Africa), 6) Julius Nyerere (Tanzania), and 7) Kenneth Kaunda (Zambia).
Information on former colonial powers was sourced from the CIA World Fact book).13 Any
country whose total population included 3% or more Europeans during the peak of its colonial
era onwards based on Robert Ian Moore’s (1981) The Hamlyn Historical Atlas and estimates
from the Joshua Project14 is coded as a settler colony.
2.4.4 Economic Variables
A number of economic variables including GDP per capita (in $US), tax revenue as a
percent of GDP (as total percent of GDP), ease of doing business score (rank of countries
globally where 0 = easiest to do business and 200 is extremely difficult to do business), and the
corruption perception index score (0-100 with 0 being most corrupt and 100 being less corrupt).
For ease of interpretation, the ease of doing business score for each country election year where
available was subtracted from 200 so that higher scores mean better business environments.
Similarly, the corruption index score for each country election year where available was
subtracted from 100 so that higher scores indicate higher levels of corruption. The corruption
13 https://www.cia.gov/library/publications/the-world-factbook/ 14 http://joshuaproject.net/people-profile.php
51
perception index score was sourced from Transparency International while all other economic
variables were sourced from the World Bank’s Development Indicators.15
The descriptive statistics for each variable are shown below in Table 2.3. The two
dependent variables (PSNS-w and LEV) have a possible range from 0 to 1. The mean PSNS-w
score of 0.69 represents a fairly well nationalized party system. As mentioned above, the
exclusion of parties that received less than five percent of the national vote share has somewhat
inflated this mean score. The legislative electoral volatility score has a mean of 0.25 and a
standard deviation of 0.24, indicating a wide distribution of levels of volatility. It is also
important to note that the legislative volatility score is available for only 45 elections.
The means for the party law variables indicate the proportion of elections held when that
type of party law was in place. Ethnic party bans are the most common law, occurring in nearly
70 percent of the elections. Only 23 percent of elections had laws in place requiring that parties
establish branch offices. The extent of regulation score is discussed further in the results section
below. The institutional control variables indicate that 37 percent of the elections occurred in PR
systems and 22 percent occurred in Parliamentary systems. The mean score of 0.67 indicates a
high level of ethnic fractionalization in the countries included in the database.
As expected, this variable has a wide range, from low levels of fractionalization in
Rwanda (0.18) to high levels in Tanzania (0.95). Across all elections in the database, 38 percent
of voters resided in urban areas. The historical indicators show that 23 percent of the elections in
the database occurred in countries that were settler colonies, and one-third occurred in countries
that had Pan-Africanist leaders. Four indicators capture economic conditions. There was a wide 15Transparency International’s Transparency Corruption Perception Index can be found at http://www.transparency.org/research/cpi/overview) and the World Bank’s Development Indicators are accessible at http://data.worldbank.org/data-catalog/world-development-indicators.
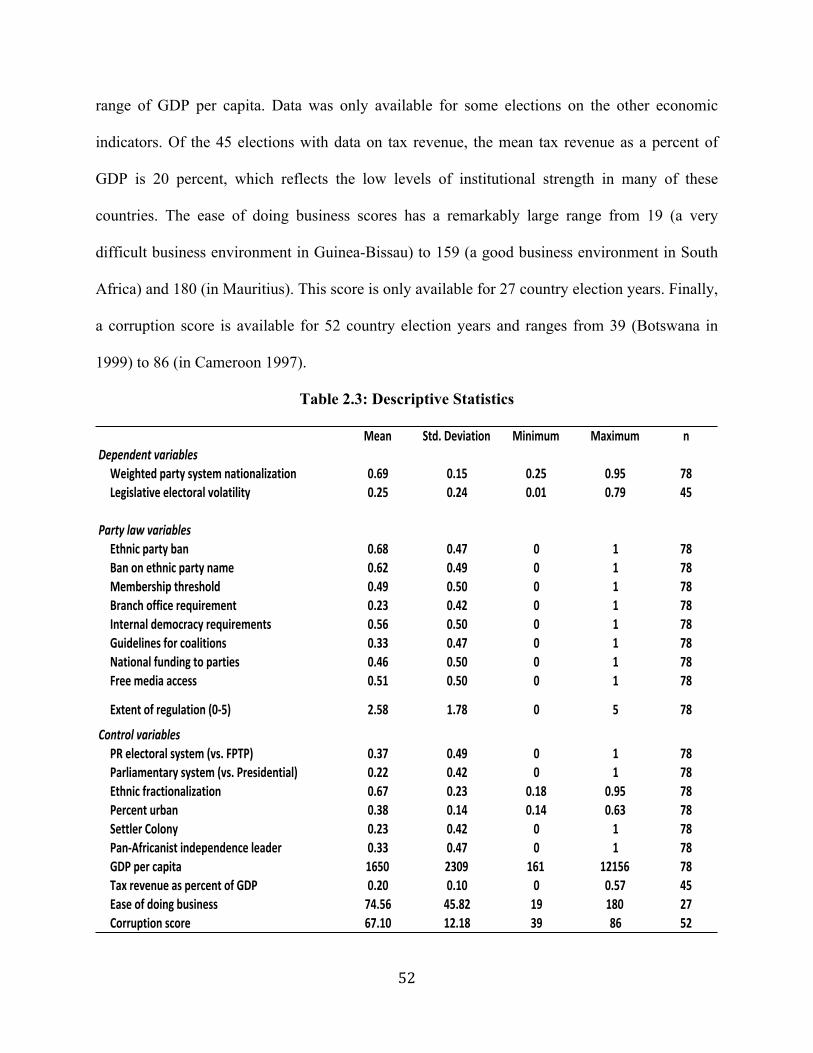
52
range of GDP per capita. Data was only available for some elections on the other economic
indicators. Of the 45 elections with data on tax revenue, the mean tax revenue as a percent of
GDP is 20 percent, which reflects the low levels of institutional strength in many of these
countries. The ease of doing business scores has a remarkably large range from 19 (a very
difficult business environment in Guinea-Bissau) to 159 (a good business environment in South
Africa) and 180 (in Mauritius). This score is only available for 27 country election years. Finally,
a corruption score is available for 52 country election years and ranges from 39 (Botswana in
1999) to 86 (in Cameroon 1997).
Table 2.3: Descriptive Statistics
Mean Std.)Deviation Minimum Maximum nDependent'variablesWeighted)party)system)nationalization 0.69 0.15 0.25 0.95 78Legislative)electoral)volatility 0.25 0.24 0.01 0.79 45
Party'law'variablesEthnic)party)ban 0.68 0.47 0 1 78Ban)on)ethnic)party)name 0.62 0.49 0 1 78Membership)threshold 0.49 0.50 0 1 78Branch)office)requirement 0.23 0.42 0 1 78Internal)democracy)requirements 0.56 0.50 0 1 78Guidelines)for)coalitions 0.33 0.47 0 1 78National)funding)to)parties 0.46 0.50 0 1 78Free)media)access 0.51 0.50 0 1 78
Extent)of)regulation)(0P5) 2.58 1.78 0 5 78
Control'variablesPR)electoral)system)(vs.)FPTP) 0.37 0.49 0 1 78Parliamentary)system)(vs.)Presidential) 0.22 0.42 0 1 78Ethnic)fractionalization 0.67 0.23 0.18 0.95 78Percent)urban 0.38 0.14 0.14 0.63 78Settler)Colony 0.23 0.42 0 1 78PanPAfricanist)independence)leader 0.33 0.47 0 1 78GDP)per)capita 1650 2309 161 12156 78Tax)revenue)as)percent)of)GDP 0.20 0.10 0 0.57 45Ease)of)doing)business 74.56 45.82 19 180 27Corruption)score 67.10 12.18 39 86 52
53
2.5 STRENGTHS AND LIMITATIONS OF THE APLND
While the APLND is the largest and most comprehensive database of its kind, it has
important limitations. First, it includes data from only 78 elections, which is approximately 39%
of the elections that occurred in Africa during this time period.16 The elections are from countries
in each region of the continent and countries with varying degrees of socioeconomic
development. That said, more developed countries contribute more data than the least developed
countries because of data availability. The data do not come from a random sample of elections,
nor do they represent the entire population of elections in Africa since 1990. For that reason,
statistical analyses (as presented in Chapter 3) should been taken as suggestive, but not
conclusive evidence of associations between institutional, demographic, historical, and economic
factors and party nationalization.
Second, because of the sample size limitations, it is not possible to use statistical methods
that attempt to address questions of causality. Statistical analyses cannot, therefore, be used to
rule out the possibility that the relationship between party laws and party system
institutionalization is endogenous. In-depth qualitative data presented in subsequent chapters
(Chapter 4-6) provides insight into the mechanisms underlying the relationships that are
examined using quantitative methods in this chapter.
16 Based on the author’s computation of 199 national legislative elections in Africa between 1990 and March of 2013.
54
CHAPTER 3: EXPLAINING VARIATION IN PARTY NATIONALIZATION AND LEGISLATIVE ELECTORAL VOLATILITY
IN AFRICA
3.1 INTRODUCTION
Why do some African countries have nationally oriented political parties and stable party
systems while ethnic parties and volatility plague others? The quantitative analysis in this
chapter seeks to address this puzzle by systematically examining variation in political party
development and electoral volatility across sub-Saharan African countries since 1990. The
analysis includes a variety of indicators designed to measure the complex interplay of
institutional, demographic, historical, and economic factors that likely shape party development,
yet this chapter focuses most explicitly on analyzing the influence that political party regulations
have had on shaping national parties and reducing electoral volatility. While political party
development is a multifaceted phenomenon molded by numerous factors, party laws are the
formal institutions most explicitly designed to influence the nature of parties and to shape the
systems in which they operate. Laws concerning political parties shape what constitutes a
political party, regulate the form of activity in which parties may engage, and ensure appropriate
forms of party organization and behavior (Katz 2004). Since 1990, many African states adopted
varying degrees of formal democratic practices and most introduced legislation specifically
designed to shape their party systems by changing how parties form, organize, and compete
(Reilly 2008). Evidence from other regions suggests that party laws affect party development
((Hicken 2008; 2009; Birnir 2008; Bieber 2008), but little is known about the influence of party
laws in Africa. In the few works that focus on African party laws, research has shown that ethnic
party bans have little influence in promoting peace (Basedau et al. 2007, Bogaards et al 2010;
55
Basedau and Moroff 2011; Moroff 2010). Party laws, in and of themselves, are not expected to
singlehandedly transform party systems over night, yet little is known as to whether they have
any influence at all on shaping national parties or stable party systems in Africa. This chapter
seeks to advance our knowledge by examining differences in the content of party laws across
African countries (and over time) to assess their influence on party development.
The key to explaining why party regulations work (or don’t) in Africa lies in gaining a
deeper understanding of whether or not party laws increase the horizontal coordination pressures
on politicians. As discussed in Chapter 1, this dissertation project asserts that African politicians
are confronted with two competing motivations as they contest elections: pressures for vertical
coordination and pressures for horizontal coordination. Elections are a series of coordination
problems because candidates compete for limited elected seats and there are more politicians
than available seats (Cox 1999; Hicken 2009). Successful political parties solve collective action
problems by aggregating interests of party members in such a way as to mobilize supporters and
win more votes than their competitors. As interest aggregators, parties are comprised of members
of different interest groups. In Africa, these interest groups are often divided along ethnic lines.
Not every party member can be the party leader or vie for elected seats. Compromises are made
to appease members of the same ethnic group to secure their support within the party. Vertical
coordination depicts the movement up and down the ladder of hierarchy between the various
factions within a party. At the same time, however, party leaders must also prioritize the
demands of one ethnic group over the demands of others in order to make policy platforms that
successfully attract voters. This cross-interest ethnic group interaction is horizontal coordination.
Successful politicians, those that build parties that lead to electoral victory, manage to overcome
both vertical and horizontal coordination problems.
56
In the African context, if the incentives for vertical coordination are more powerful than
the incentives for horizontal coordination, then there is lower likelihood of multiethnic parties or
stable party systems. This means that ethnic parties are more likely to arise in countries where
there is little incentive to actively seek votes from other groups. If, however, the politician needs
additional support to win his seat, then there is greater incentive for horizontal coordination
across interest groups. When the potential benefits of horizontal coordination are more powerful
than the perceived benefits of vertical coordination, then multiethnic parties are more likely.
Building multiethnic national parties requires substantially more investment from politicians than
building ethnic parties. In order to appease the varying interests of multiple groups, national
parties require robust organizations with strong internal conflict management and dispute
resolution systems. Ethnic parties, in contrast, do not necessarily require as much investment as a
politician can more easily secure the vote of his ethnic bloc. As such, I argue that national parties
are more enduring than ethnic parties and I test this hypothesis with data from the APLND later
in this chapter. While the quantitative analysis in this chapter cannot test causal mechanisms,
understanding the vertical and horizontal coordination pressures facing African politicians
provides the insight necessary to formulate empirically testable hypotheses.
To the best of the author’s knowledge, this is the most comprehensive study of party
nationalization and electoral volatility in sub-Saharan Africa to date. The chapter analyses data
from the APLND database. As discussed in detail in Chapter 2, the APLND is an original
database of political party laws and other pertinent institutional, demographic, historical, and
economic factors for 78 elections from 27 countries from across sub-Saharan Africa since 1990.
This chapter is divided into four additional sections. Section II describes the key concepts of the
project and introduces the empirically testable hypotheses. Section III presents the statistical
57
models and results pertaining to party nationalization, while Section IV provides the models and
results for legislative electoral volatility. Finally, section V provides the conclusions.
3.2 CONCEPTS AND HYPOTHESES
3.2.1 Objects of Explanation (Dependent Variables):
Political party nationalization and electoral volatility are the two fundamental
components of party system institutionalization that serve as the objects of explanation for this
project. As noted earlier, identifying the forces that affect vertical and horizontal coordination
pressures is a simple but effective heuristic device for determining the factors that shape African
party development. As such, the concepts of party nationalization and legislative electoral
volatility and the means by which horizontal and vertical coordination pressures influence these
phenomena are discussed below.
The primary purpose of this chapter is to identify the factors that contribute to variation
in levels of political party “nationalization” both across countries and over time in sub-Saharan
Africa. The concept of party “nationalization” refers to the degree to which a party receives
similar levels of electoral support throughout a country (Jones and Mainwaring 2003). By
focusing on voters’ orientations, Schattschneider (1960) defined party nationalization as the
extent to which sub-national units in the U.S. reflect national voting patterns. When support is
equally distributed for a party across sub-national territories then party nationalization is high. A
perfectly nationalized party would have an equal vote share in all territorial units of a country
(Bochsler 2010). Conversely, the more substantial the differences in party vote share across sub-
national units, the lower the level of party nationalization. While there are volumes of work on
party nationalization in the United States, scholars have largely ignored this concept in other
58
geographic locations until recently (Morgenstern et al. 2009). As detailed elections data have
become more readily available, scholars have recently begun studying party nationalization in
other regions of the world. Jones and Mainwaring (2003) investigate the nationalization of
parties and party systems in Latin America, Chhibber and Kollman (2004) compare levels of
party nationalization in India and Canada with the United States, Hicken (2009) assesses levels
of party nationalization in his investigation of party systems in Asia, and Bochsler (2006)
examines variation in party nationalization across Central and Eastern Europe. With few notable
exceptions17, however, the concept of party nationalization has been largely ignored in Africa.
Applying Schattschneider’s logic of party nationalization to the study of African political
party development has broad theoretical implications. In the American context, Schattschneider
hypothesized that when party nationalization is high then national factors may be more important
to voters and parties. When levels of party nationalization are low, on the other hand, then sub-
national factors may be more important to voters thereby trumping national interests. In the
African context, the key difference in the nature of African political parties is the degree to
which parties are ethnic versus nationally oriented. In Africa where ethnic cleavages often
coincide with sub-national units because ethnic groups tend to be geographically concentrated
(Bates 1974), it is reasonable to assume that parties would target their messages toward specific
ethnic groups. While these politicians and their respective parties may obtain high vote shares
from the specific group they are targeting, they are unlikely to gain high levels of electoral
beyond their local group. Therefore, when vertical coordination pressures are stronger than
horizontal coordination pressures, the party system is likely to be dominated by ethnic political
parties and lower levels of party nationalization. Conversely, when horizontal coordination
17 See for instance Bogaards, Elischer, and Moroff (2011) and Moroff (2010)

59
pressures are more powerful than vertical coordination pressures, we expect politicians to build
more nationally oriented parties that prioritize national policies. These parties are more likely to
attract a wider level of support from across different ethnic groups leading to a higher level of
party nationalization.
Nevertheless, while policymakers and scholars including Diamond (1988), Reynolds
(1999), and Stepan (2001) have all persuasively argued that the nationalization of political
parties in countries with pronounced ethnic cleavages is a key factor in preserving democracy,
little is known about what forces lead to the formation of ethnic versus national parties in Africa.
This project addresses this gap by systematically identifying the factors that influence the
vertical and horizontal coordination pressures that shape this variation in African party
development.
This project asserts that party nationalization and electoral volatility are related concepts
that should be studied in conjunction with one another. Generally speaking, national parties
should be more durable and enduring than their ethnic counterparts so the more national the
party system the less expected electoral volatility. Like party nationalization, the horizontal and
vertical coordination pressures facing African party leaders shape electoral volatility. When
pressures for vertical coordination are more powerful than the pressures of horizontal
coordination, then party leaders are apt to create ethnic parties that serve as little more than
vehicles for their own empowerment. These ethnic parties rarely remain competitive over an
election cycle or two leading to higher electoral volatility. Conversely, when horizontal pressures
overpower vertical pressures than politicians are more likely to cooperate with party leaders from
other groups to form more nationally oriented parties. These national parties are more likely to
endure over multiple election cycles leading to less electoral volatility. Therefore while this
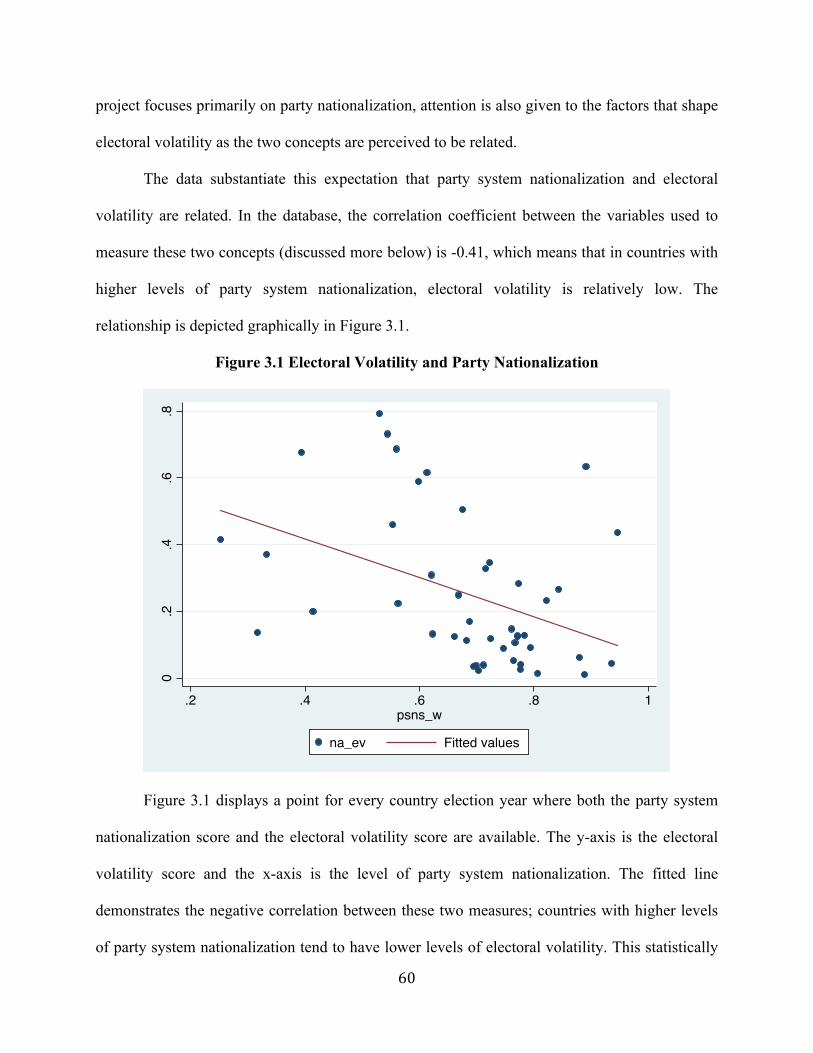
60
project focuses primarily on party nationalization, attention is also given to the factors that shape
electoral volatility as the two concepts are perceived to be related.
The data substantiate this expectation that party system nationalization and electoral
volatility are related. In the database, the correlation coefficient between the variables used to
measure these two concepts (discussed more below) is -0.41, which means that in countries with
higher levels of party system nationalization, electoral volatility is relatively low. The
relationship is depicted graphically in Figure 3.1.
Figure 3.1 Electoral Volatility and Party Nationalization
Figure 3.1 displays a point for every country election year where both the party system
nationalization score and the electoral volatility score are available. The y-axis is the electoral
volatility score and the x-axis is the level of party system nationalization. The fitted line
demonstrates the negative correlation between these two measures; countries with higher levels
of party system nationalization tend to have lower levels of electoral volatility. This statistically
0.2
.4.6
.8
.2 .4 .6 .8 1psns_w
na_ev Fitted values
61
significant relationship (at α=0.01 level), in the expected direction, validates the use of these two
measures of party system institutionalization.
3.2.2 Political Party Laws (Explanatory Variables)
Political party laws are the formal institutions specifically designed to influence party
development, and as such they are the key explanatory variable of interest in this analysis. Since
the 1990s, most African countries have made substantial changes to their party laws with the aim
of influencing party development in their respective countries. Evidence from Southeast Asia
(Hicken 2008; 2009), Central and Southern Europe (Bieber 2008), and Latin America (Birnir
2008) indicate that party regulations can indeed affect political behavior and have an impact on
the degree of party nationalization in those regions. In Africa, the few works that examine party
regulations tend to concentrate on bans on ethnic parties (Bogaards et al. 2007, Basedau and
Moroff 2011) and overlook the more nuanced differences in the content of party laws. As a
result, the influence (or lack thereof) of party laws on party nationalization and electoral
volatility remains under-explored in sub-Saharan Africa.
This project addresses this gap in our knowledge by assessing the influence (or lack
thereof) of party laws on party nationalization and electoral volatility. The APLND database
disaggregates party registration and finance into the smallest possible comparable components,
allowing for analysis to ascertain if the design of party laws influences party development. As
discussed in detail in Chapter 2, African party laws can be categorized as either centripetal or
consociational. One the one hand, centripetal party laws tend to be quite prescriptive and lay out
incentives to establish broad-based parties that transcend ethnic or regional cleavages. On the
other hand, consociational party laws seek to institutionalize societal cleavages by protecting the
62
rights of different groups by allowing for the representation and articulation of all major interests
in society. The distinction between centripetal versus consociational party laws is useful for
setting the foundations for building the following empirically testable hypotheses:
• Party Law Hypothesis 1.1 (PL-H1.1): Countries with centripetal party laws will have
higher levels of party nationalization and lower levels of electoral volatility than
countries with consociational laws or no party laws.
Countries with centripetal party laws have higher barriers to party registration than
countries that do not outlaw identity-based parties. The higher barriers to party registration
increase horizontal coordination pressures and compel politicians to work with party leaders
from other groups. This increased horizontal coordination makes it more difficult for ethnic
entrepreneurs to hijack parties for their own devices. These laws encourages stronger internal
development of political parties, increasing the chances they will compete in multiple elections
which leads to less electoral volatility. The more stringent the registration requirements the fewer
the number of ethnic parties that can compete in elections, and the higher the level of party
nationalization. Centripetal party laws should increase horizontal coordination pressures leading
to greater levels of party nationalization and lower levels of electoral volatility compared to
countries without centripetal party laws.
• Party Law Hypothesis 1.2 (PL-H1.2): Clearly defined and prescriptive party laws are
more likely to influence party nationalization and electoral volatility than ambiguous
and poorly defined laws.
63
As detailed later in this chapter, there is a great deal of variation pertaining to the design
and extent of party regulations across Africa. Some countries have ambiguous, poorly defined
party laws while others set out specific benchmarks (bans on ethnic party names for instance)
and guidelines for parties to follow. If the design of party laws matters, then countries with
clearly defined party laws that make it difficult for ambitious politicians to manipulate the rules
of the game should have higher levels of party nationalization and lower levels of electoral
volatility.
• Party Law Hypothesis 1.3 (PL-H1.3): Countries that provide public funding to parties
will have lower levels of party nationalization than countries that do not provide public
funding.
The availability of public funding can change the incentive structure of party leaders.
When the threshold to obtain funding is low then the availability of public funding encourages
the proliferation of parties as political entrepreneurs attempt to profit from forming parties.
Unless it is tied to stringent requirements for more nationally representative parties (via
minimum membership thresholds and regional representation requirements for instance), public
funding increases vertical coordination as politicians have greater incentive to create their own
parties and less incentive to cooperate across sub-national units. Since the APLND is not able to
further disaggregate party finance laws the availability of public funding is expected to
encourage party proliferation resulting in lower levels of nationalization.
64
3.2.3 Alternative Explanations (Control Variables)
Party laws, in and of themselves, are certainly not the only factors shaping national
parties and electoral volatility and consequently, it is prudent to include tests of alternative
explanations of these phenomena. The quantitative analysis in this chapter controls for four
alternative explanations: other institutions, social structural determinants (demographic),
historical legacy, and economic conditions. A brief description of each alternative explanation
precedes empirically testable hypotheses below. Detailed hypotheses and models testing these
explanations are provided for party nationalization, but not for electoral volatility because of
smaller sample size.
Institutional explanations argue that institutions shape political outcomes. Volumes of
scholarship have investigated the effects that different formal institutions (electoral systems,
presidential systems, etc.) have on outcomes such as regime stability and democratic
consolidation (Tsebelis 1995, 2002; Roberts and Wibbels 1999, Beck et al 2001). Applied to the
context of African party development, proponents would examine the influence of key
institutions on party nationalization. This project tests the following institutional hypotheses:
• Alternative Institutional Hypothesis 1 (A-IH.1): Countries with FPTP electoral systems
are more likely to have higher levels of party nationalization than countries with PR
electoral systems.
65
The “all or nothing” nature of FPTP electoral systems should increase horizontal
coordination pressure as politicians are compelled to work with elites from other groups in order
to secure electoral victory. Conversely, PR systems institutionalize ethnic and regional
differences leading to increased vertical coordination pressures on party leaders resulting in
lower levels of party nationalization.
• Alternative Institutional Hypothesis 2 (A-IH.2): Countries with Presidential systems
are more likely to have higher levels of party nationalization than countries with
parliamentary systems.
Presidential systems create more horizontal coordination by compelling party leaders to
work across ethnic lines to select a candidate that will attain votes at the national level.
Parliamentary systems create more vertical coordination pressure by institutionalizing alliances
of several political parties in coalitions. As a result, in the African context the expectation would
be that parliamentary systems are likely to have more ethnic political parties and lower levels of
party nationalization.
Social structural (demographic) explanations assert that demographic characteristics
within a country like ethnic composition, level of urbanization, age profiles, and levels of
education are the primary drivers of political party development in Africa. Indeed, the
conventional wisdom on African politics is that ethnicity is one of, if not the, most powerful
force shaping political behavior and institutional design on the continent. This project tests the
following social structural hypotheses:
66
• Alternative Demographic Hypothesis 1 (A-DH.1): Ethnic fractionalization/
heterogeneity is negatively correlated with party nationalization.
The conventional wisdom is that the behavior of Africans is largely determined by factors
that they are born into like their tribe, region, race, etc (Horowitz 1985). Following this logic, the
country’s ethnic composition should be a powerful predictor of political party nationalization.
Ethnic fractionalization leads to increased vertical pressure as party leaders are more inclined to
build ethnic parties. Therefore, higher levels of ethnic fractionalization should lead to lower
levels of party nationalization.
• Alternative Demographic Hypothesis 2 (A-DH.2): Urbanization is positively correlated
with party nationalization.
Africa’s urban centers are generally comprised of people from different ethnic groups
from many different parts of the country. Increased interaction with people from different ethnic
groups should increase the horizontal coordination pressure of politicians and compel them to
build multiethnic political parties. Following this logic, higher levels of urbanization should lead
to higher levels of party nationalization. Conversely, the lower the level of urbanization, the
lower the level of party nationalization.
Historical explanations maintain that understanding political party development in
Africa is impossible without recognizing the historical events and structural legacies that
67
continuously shape the continent’s present and future. Historical legacies are “sticky” and once a
country has journeyed down a particular path of party development it is exceedingly difficult to
break away from the bonds of path dependence. For proponents of historical explanations,
identifying the critical historical events that shape party nationalization and electoral volatility is
key to explaining variation in party development. This project tests the following hypotheses
pertaining to the influence of historical legacies:
• Alternative Historical Hypothesis 1 (A-HH.1): Countries with nationalist independence
leaders are more likely to have higher levels of party nationalization and lower levels of
electoral volatility.
In his study of how central government nation-building policies affect interethnic
cooperation in Kenya and Tanzania, Miguel (2004) argues that the personalities and philosophies
of each country’s first independence leader are greatly responsible for differences in national
identity in each country. Whereas Julius Nyerere downplayed the role of ethnic affiliation in
public life and emphasized national identity in Tanzania, Jomo Kenyatta and Daniel arap Moi
thrived on the politics of ethnic division (ibid: 337-338). Extending this logic throughout Africa,
it is plausible that national parties and institutionalized party systems are more likely in countries
whose independence leaders espoused nationalist policies and prioritized national identity over
ethnic identity. Contrary to ethnic nationalists, nationalist African leaders championed strong
national identities and generally promoted policies that sought to increase regional cooperation.
Therefore, countries with nationalist Africanist leaders who strove to build more cohesive
68
national identities have institutionalized increased horizontal coordination pressures on party
leaders that should lead to higher levels of party nationalization.
• Alternative Historical Hypothesis 2 (A-HH.2): Settler colonies are more likely to have
higher levels of party nationalization.
National liberation movements in countries with sizeable settler colonies needed to be
more cohesive and better organized in order to overcome their colonial aggressors. The
assumption here is that more cohesive liberation movements generally lead to the development
of more nationally oriented political parties. The intuition here is that this legacy has increased
horizontal coordination pressures on party leaders, which should lead to higher levels of party
nationalization.
Economic explanations contend that economic conditions drive variation in party
development. In the context of political party development, scholars have long believed that
economic freedom enables the independent economic foundations for social coalitions and is
necessary for multi-party democracy (Moore 1966; Dahl 1971; Riker 1982; Boix and Stokes
2003). In his meticulously researched study, Arriola (2013) compellingly argues that business is
central to the formation of opposition coalitions and that multiethnic coalitions are only possible
in Africa when financial liberalization has brought the dispersal of economic power from the
incumbent (Arriola 2013: 34-35). This project examines the following hypotheses to test the
impact of economic conditions:
69
• Alternative Economic Hypothesis 1 A-E.1 (A-EH.1): GDP (per capita) is positively
correlated with party nationalization – the higher the GDP the higher the level of party
nationalization.
GDP is one of the more widely used economic indicators and proponents of economic
explanations would undoubtedly test the influence of GDP on party nationalization. As GDP
wealth increases, the horizontal coordination pressure of parties also increases as citizen demand
for more stable, nationally representative parties increases.
• Alternative Economic Hypothesis 2 A-E.2 (A-EH.2): Tax revenue as a percent of GDP
is positively correlated with party nationalization – the higher the level proportion of
tax revenue as a percent of GDP, the higher the level of party nationalization.
Tax revenue as percent of GDP helps demonstrates the strength of formal state
institutions in a country. The higher the percent of tax revenue the stronger and more
institutionalized the formal state institutions. The stronger the formal institutions, the higher the
horizontal coordination pressure to create stable, nationally representative parties resulting in
high levels of party nationalization.
• Alternative Economic Hypothesis A-E.3 (A-EH.3): Corruption is negatively correlated
with party nationalization – the higher the level of corruption the lower the level of
party nationalization.
70
While tax revenue as percent of GDP demonstrates the strength of formal institutions,
levels of corruption illustrate the weaknesses of formal institutions in a country. The higher the
level of corruption, the weaker the formal institutions in a country. When corruption is rampant
then vertical coordination pressures trump horizontal coordination pressures because politicians
have are less likely to trust leaders from “other” groups resulting in low levels of party
nationalization.
• Alternative Economic Hypothesis A-E.4 (A-EH.4): Ease of doing business is positively
correlated with party nationalization – the easier it is to do business in a country the
higher the level of party nationalization.
This hypothesis aims to extend Arriola’s work by examining the impact of business
openness on party nationalization. If an open business environment is crucial to the formation of
multiethnic parties as Arriola contends, then the ease of doing business should also be correlated
to party nationalization. As it becomes easier to do business, then horizontal coordination
pressures on party leaders increase as it becomes less difficult to work with “other” groups,
which leads to higher levels of party nationalization.
71
3.3 EXPLAINING VARIATION IN PARTY NATIONALIZATION
Due to the limited sample size, much of the focus of the analyses is on descriptive
statistics and bivariate relationships. To examine competing explanations together, multivariate
OLS regressions are included. As described above, the analyses examine factors related to both
party system nationalization and legislative electoral volatility. Nevertheless because of the
larger sample size, the bulk of the analyses use party system nationalization as the outcome of
interest.
3.3.1 Party Laws and Party System Nationalization
The relationship between each type of party law and party system nationalization is
shown in Table 3.1 below. The first panel of the table shows the number of elections held when
each type of party law was on the books and the mean party system nationalization score
resulting from those elections. This is to be compared with the second panel, showing the
number of elections without the party law and the mean party nationalization score. The panel on
the far right shows the results of a test for significant differences in mean party nationalization
depending on whether the party law was in place or not.
Of the five centripetal registration laws, three are significantly related to the level of party
system nationalization. As expected, party nationalization is higher when there is a ban on ethnic
party names, where there are party membership requirements, and when there are internal
democracy requirements. Also, the relationship is in the expected direction for the ethnic party
bans. There is no statistical relationship between branch office requirements and party
nationalization. The database only includes 18 elections that were held in countries with branch
office requirements, however, so these results are far from conclusive. Overall, the results
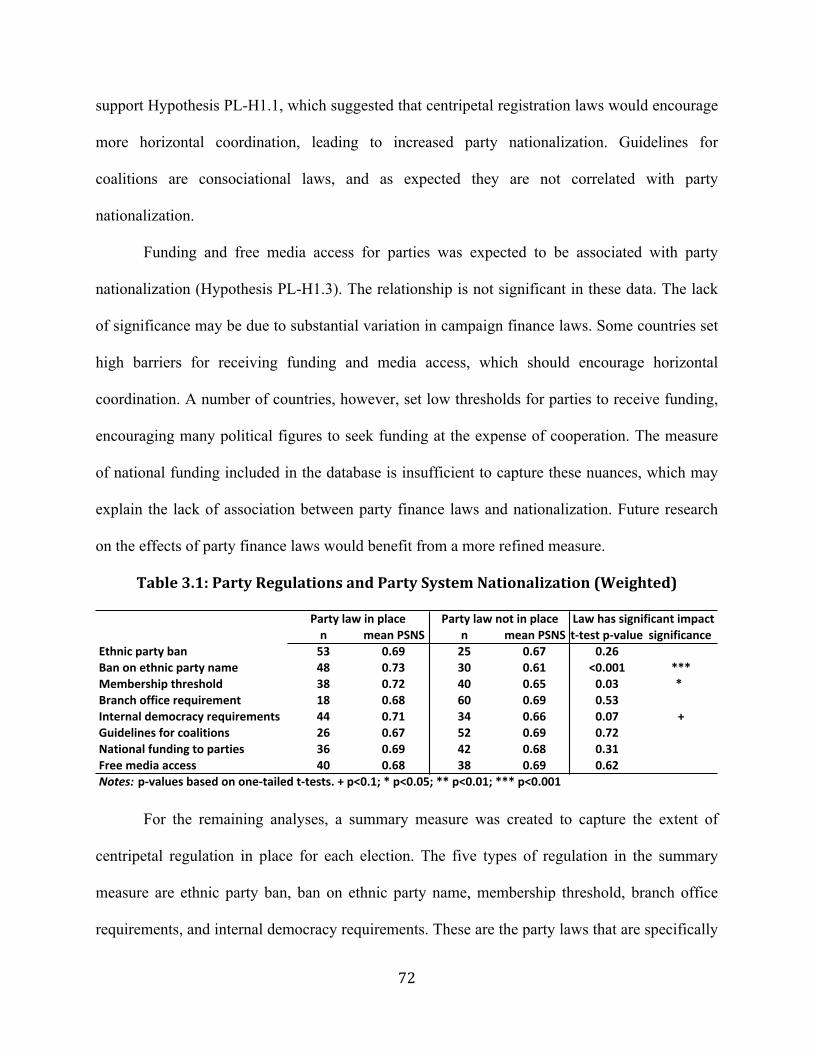
72
support Hypothesis PL-H1.1, which suggested that centripetal registration laws would encourage
more horizontal coordination, leading to increased party nationalization. Guidelines for
coalitions are consociational laws, and as expected they are not correlated with party
nationalization.
Funding and free media access for parties was expected to be associated with party
nationalization (Hypothesis PL-H1.3). The relationship is not significant in these data. The lack
of significance may be due to substantial variation in campaign finance laws. Some countries set
high barriers for receiving funding and media access, which should encourage horizontal
coordination. A number of countries, however, set low thresholds for parties to receive funding,
encouraging many political figures to seek funding at the expense of cooperation. The measure
of national funding included in the database is insufficient to capture these nuances, which may
explain the lack of association between party finance laws and nationalization. Future research
on the effects of party finance laws would benefit from a more refined measure.
Table 3.1: Party Regulations and Party System Nationalization (Weighted)
For the remaining analyses, a summary measure was created to capture the extent of
centripetal regulation in place for each election. The five types of regulation in the summary
measure are ethnic party ban, ban on ethnic party name, membership threshold, branch office
requirements, and internal democracy requirements. These are the party laws that are specifically
n mean%PSNS n mean%PSNS t*test%p*value significanceEthnic%party%ban 53 0.69 25 0.67 0.26Ban%on%ethnic%party%name 48 0.73 30 0.61 <0.001 ***Membership%threshold 38 0.72 40 0.65 0.03 *%Branch%office%requirement 18 0.68 60 0.69 0.53Internal%democracy%requirements 44 0.71 34 0.66 0.07 +Guidelines%for%coalitions 26 0.67 52 0.69 0.72National%funding%to%parties 36 0.69 42 0.68 0.31Free%media%access 40 0.68 38 0.69 0.62Notes: %p*values%based%on%one*tailed%t*tests.%+%p<0.1;%*%p<0.05;%**%p<0.01;%***%p<0.001
Party%law%in%place Party%law%not%in%place Law%has%significant%impact
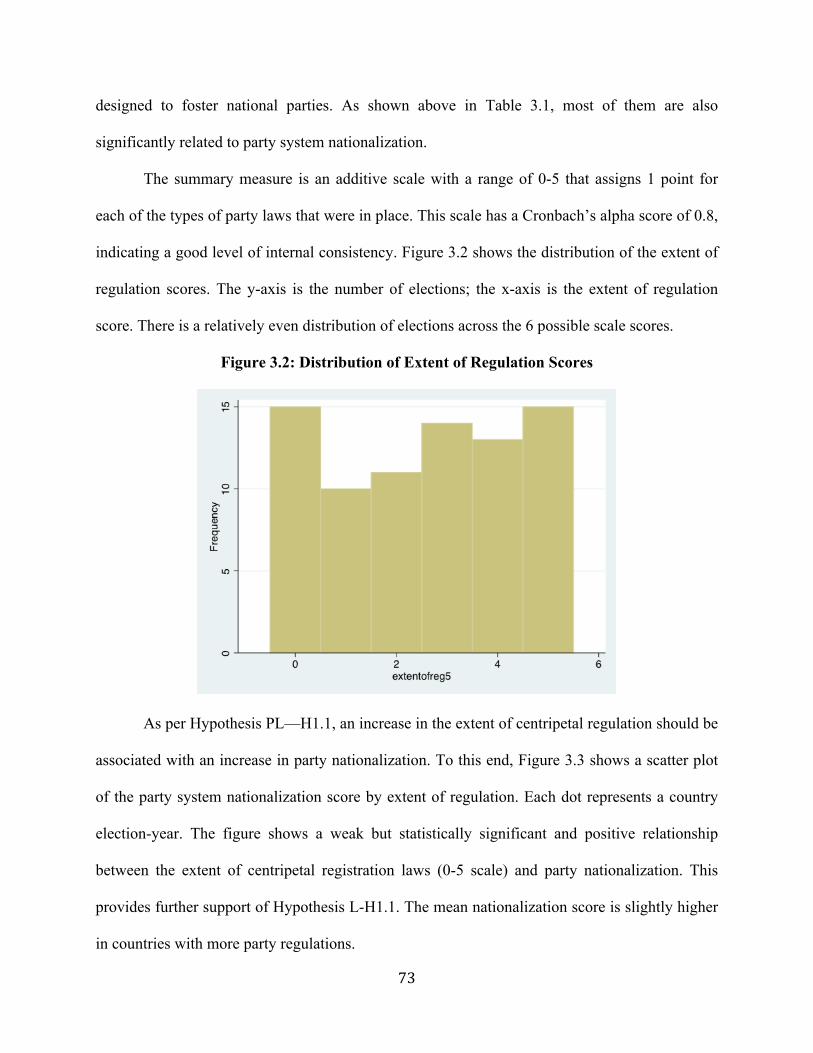
73
designed to foster national parties. As shown above in Table 3.1, most of them are also
significantly related to party system nationalization.
The summary measure is an additive scale with a range of 0-5 that assigns 1 point for
each of the types of party laws that were in place. This scale has a Cronbach’s alpha score of 0.8,
indicating a good level of internal consistency. Figure 3.2 shows the distribution of the extent of
regulation scores. The y-axis is the number of elections; the x-axis is the extent of regulation
score. There is a relatively even distribution of elections across the 6 possible scale scores.
Figure 3.2: Distribution of Extent of Regulation Scores
As per Hypothesis PL—H1.1, an increase in the extent of centripetal regulation should be
associated with an increase in party nationalization. To this end, Figure 3.3 shows a scatter plot
of the party system nationalization score by extent of regulation. Each dot represents a country
election-year. The figure shows a weak but statistically significant and positive relationship
between the extent of centripetal registration laws (0-5 scale) and party nationalization. This
provides further support of Hypothesis L-H1.1. The mean nationalization score is slightly higher
in countries with more party regulations.
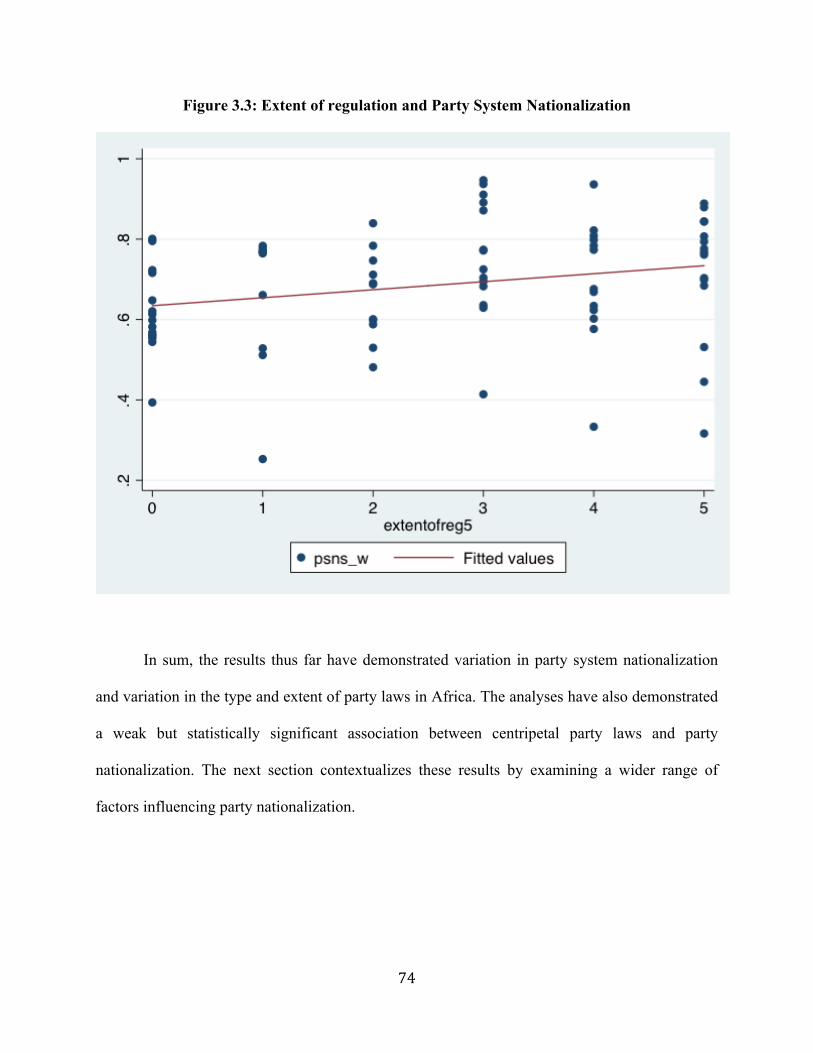
74
Figure 3.3: Extent of regulation and Party System Nationalization
In sum, the results thus far have demonstrated variation in party system nationalization
and variation in the type and extent of party laws in Africa. The analyses have also demonstrated
a weak but statistically significant association between centripetal party laws and party
nationalization. The next section contextualizes these results by examining a wider range of
factors influencing party nationalization.
75
3.3.2 Predictors of Party System Nationalization
This section begins with an examination of the bivariate relationships between each
predictor and party system nationalization. The results of bivariate OLS regressions are shown in
Table 3.2. Of the institutional factors, only the extent of regulation is significant. The more
centripetal laws in place, the greater the degree of party nationalization. The coefficient on
Model 1 means that for every additional party law on the books, we should expect an increase of
0.02 in the party system nationalization score, which is substantively small (the standard
deviation of the PSNS is 0.15), but non-trivial. This provides additional support of Hypothesis
PL-H1.2. Contrary to Hypotheses A-IH.1 and A-IH.2 there is no statistically significant
relationship between electoral system and party nationalization, or between the type of executive
system in a country and party nationalization.
As expected in Hypotheses A-DH.1, ethnic fractionalization is strongly negatively
associated with party nationalization. The coefficient indicates that countries with complete
ethnic fractionalization (a score of 1) will have an average PSNS-w score that is 32 percent lower
than countries with no ethnic fractionalization. The R-squared value in model 4 (0.25) is another
indication of the strength of this predictor of party nationalization. Ethnic fractionalization
explains approximately 25 percent of the variation in the party nationalization scores in the
database. Contrary to A-DH.2, however, there is no statistically significant relationship between
higher levels of urbanization and party nationalization.
While there is no statistically significant relationship between whether a country was a
settler colony (Hypothesis A-HH.2) and the level of party nationalization, those countries that
had nationalist Africanist leaders (Hypothesis A-HH.1) have higher mean party nationalization
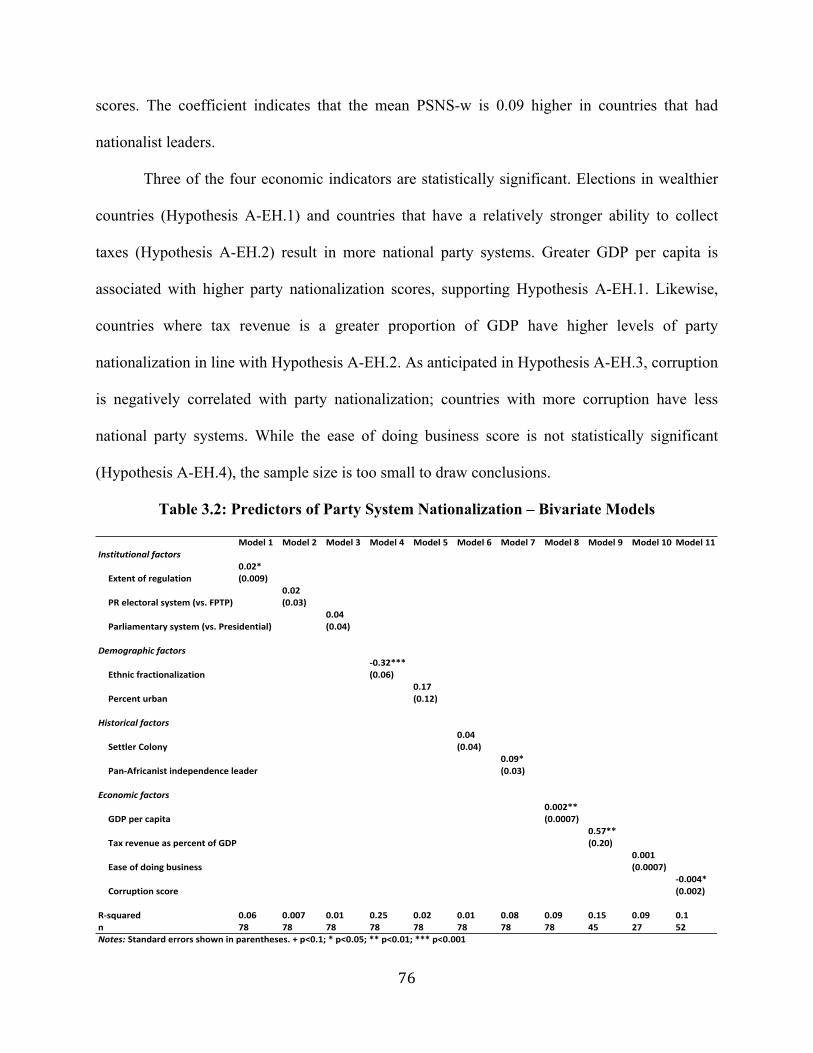
76
scores. The coefficient indicates that the mean PSNS-w is 0.09 higher in countries that had
nationalist leaders.
Three of the four economic indicators are statistically significant. Elections in wealthier
countries (Hypothesis A-EH.1) and countries that have a relatively stronger ability to collect
taxes (Hypothesis A-EH.2) result in more national party systems. Greater GDP per capita is
associated with higher party nationalization scores, supporting Hypothesis A-EH.1. Likewise,
countries where tax revenue is a greater proportion of GDP have higher levels of party
nationalization in line with Hypothesis A-EH.2. As anticipated in Hypothesis A-EH.3, corruption
is negatively correlated with party nationalization; countries with more corruption have less
national party systems. While the ease of doing business score is not statistically significant
(Hypothesis A-EH.4), the sample size is too small to draw conclusions.
Table 3.2: Predictors of Party System Nationalization – Bivariate Models
Model&1 Model&2 Model&3 Model&4 Model&5 Model&6 Model&7 Model&8 Model&9 Model&10 Model&11Institutional*factors
Extent&of®ulation0.02*(0.009)
PR&electoral&system&(vs.&FPTP)0.02(0.03)
Parliamentary&system&(vs.&Presidential)0.04(0.04)
Demographic*factors
Ethnic&fractionalizationJ0.32***(0.06)
Percent&urban0.17(0.12)
Historical*factors
Settler&Colony0.04(0.04)
PanJAfricanist&independence&leader0.09*(0.03)
Economic*factors
GDP&per&capita0.002**(0.0007)
Tax&revenue&as&percent&of&GDP0.57**(0.20)
Ease&of&doing&business0.001(0.0007)
Corruption&scoreJ0.004*(0.002)
RJsquared 0.06 0.007 0.01 0.25 0.02 0.01 0.08 0.09 0.15 0.09 0.1n 78 78 78 78 78 78 78 78 45 27 52Notes:*Standard&errors&shown&in&parentheses.&+&p<0.1;&*&p<0.05;&**&p<0.01;&***&p<0.001

77
Multivariate models were used to test the relative strength of these predictors of party
nationalization. A separate model was used to test each group of indicators (institutions,
demographics, historical factors, economic conditions). In addition, a model combining all
indicators tests the strength of each predictor while controlling for the other factors that influence
party nationalization. Because data were not available for all country election years for tax
revenue as a percent of GDP, the ease of doing business, and corruption, those variables have
been omitted from the multivariate models where it was important to have the largest possible
sample size.
Most pertinent to this analysis, in all of the models in Table 3.3 the extent of regulation
score remains a statistically significant predictor of party nationalization. This means that even
controlling for other institutional, demographic, historical, and economic factors, countries with
centripetal party laws have higher levels of party nationalization. These other factors do not
explain the observed relationship between centripetal party laws and party nationalization. In
Model 5, the coefficient on extent of regulation indicates that every additional centripetal party
law is associated with a mean increase of 0.03 in the party nationalization score. Holding other
factors constant, there is an average difference of 0.15 in the party nationalization score between
countries with no party laws and countries with all five centripetal party laws. This is the
equivalent of a one standard deviation difference, which is substantial.
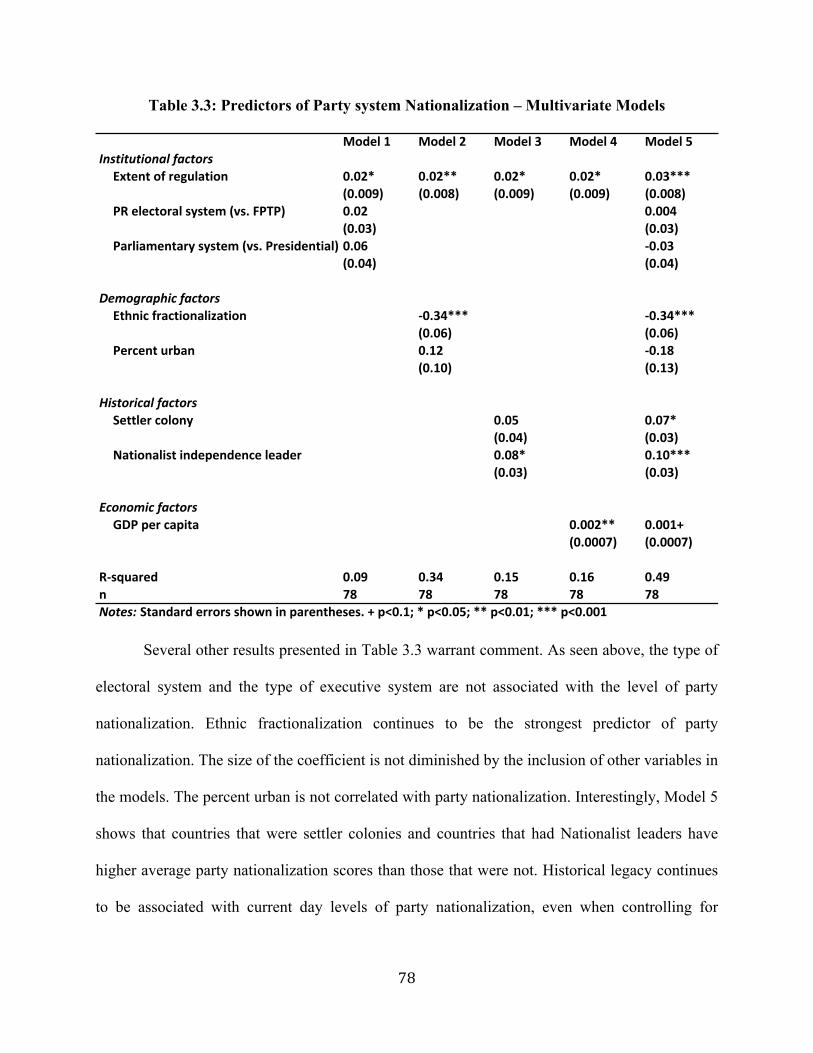
78
Table 3.3: Predictors of Party system Nationalization – Multivariate Models
Several other results presented in Table 3.3 warrant comment. As seen above, the type of
electoral system and the type of executive system are not associated with the level of party
nationalization. Ethnic fractionalization continues to be the strongest predictor of party
nationalization. The size of the coefficient is not diminished by the inclusion of other variables in
the models. The percent urban is not correlated with party nationalization. Interestingly, Model 5
shows that countries that were settler colonies and countries that had Nationalist leaders have
higher average party nationalization scores than those that were not. Historical legacy continues
to be associated with current day levels of party nationalization, even when controlling for
Model&1 Model&2 Model&3 Model&4 Model&5Institutional*factorsExtent&of®ulation 0.02*
(0.009)0.02**(0.008)
0.02*(0.009)
0.02*(0.009)
0.03***(0.008)
PR&electoral&system&(vs.&FPTP) 0.02(0.03)
0.004(0.03)
Parliamentary&system&(vs.&Presidential) 0.06(0.04)
G0.03(0.04)
Demographic*factorsEthnic&fractionalization G0.34***
(0.06)G0.34***(0.06)
Percent&urban 0.12(0.10)
G0.18(0.13)
Historical*factorsSettler&colony 0.05
(0.04)0.07*(0.03)
Nationalist&independence&leader 0.08*(0.03)
0.10***(0.03)
Economic*factorsGDP&per&capita 0.002**
(0.0007)0.001+(0.0007)
RGsquared 0.09 0.34 0.15 0.16 0.49n 78 78 78 78 78Notes:*Standard&errors&shown&in&parentheses.&+&p<0.1;&*&p<0.05;&**&p<0.01;&***&p<0.001
79
regulation, the extent of contemporary ethnic fractionalization, and current economic strength.
Finally, wealthier countries in the database generally have more national political parties.
Given the nature of the data, with country election year as the unit of analysis, country
fixed-effects models were tested. Unfortunately, there are not enough countries with substantial
changes in the extent of centripetal regulation to accurately estimate fixed-effects models. As
expected, a substantial portion of the variance in party system nationalization score is due to
between-country variation. This is consistent with the findings presented above showing that
ethnic fractionalization and historical legacy—both of which vary substantially between
countries and are time-invariant—are strong predictors of party system nationalization. As a
growing number of countries consider instituting new party regulations, future research should
re-examine country fixed effects models.
3.4 EXPLAINING VARIATION IN LEGISLATIVE ELECTORAL VOLATILITY
The final model examines predictors of legislative electoral volatility. Table 3.4 presents
a multivariate model. Interestingly, the extent of regulation is the only statistically significant
predictor of legislative electoral volatility. The coefficient indicates that every additional
centripetal party law is associated with a decrease of 0.06 in the legislative electoral volatility
score. Holding other factors constant, countries with all five centripetal party laws have an
average electoral volatility score that is 0.3 lower than countries with no centripetal party laws on
the books. Given the small sample size, this coefficient should be interpreted with caution.
Nonetheless, the magnitude and direction of the coefficient indicate that party laws are likely
associated with party nationalization.
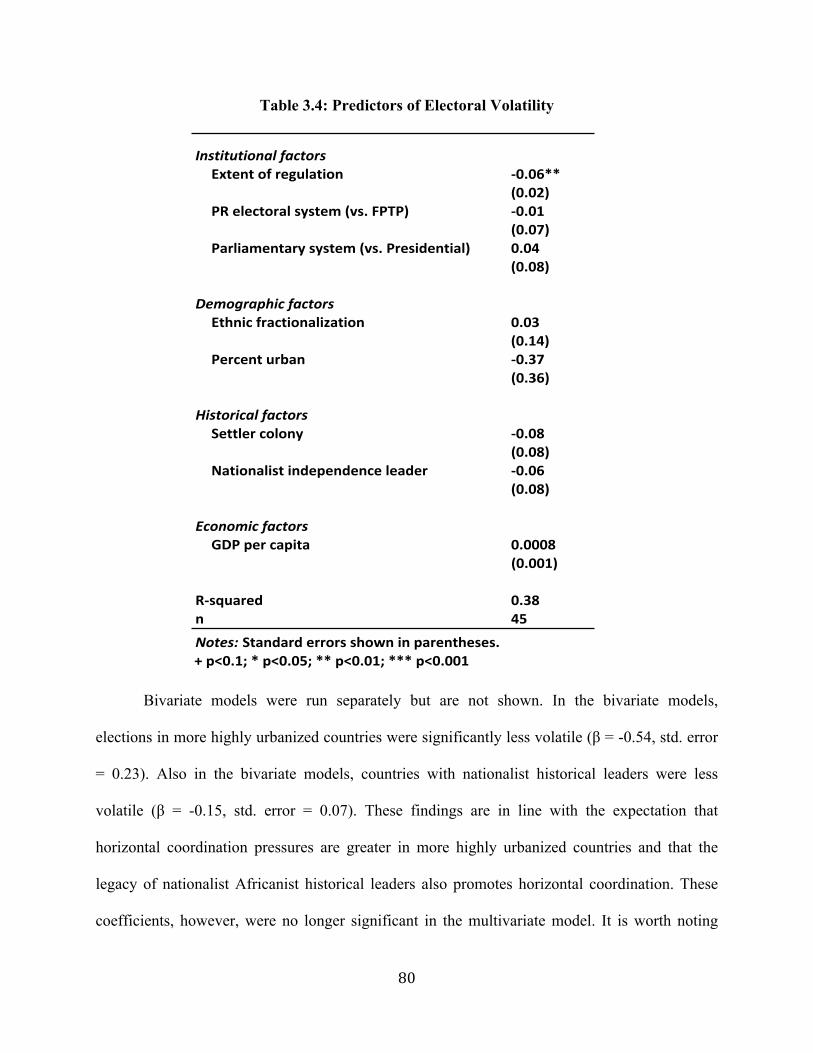
80
Table 3.4: Predictors of Electoral Volatility
Bivariate models were run separately but are not shown. In the bivariate models,
elections in more highly urbanized countries were significantly less volatile (β = -0.54, std. error
= 0.23). Also in the bivariate models, countries with nationalist historical leaders were less
volatile (β = -0.15, std. error = 0.07). These findings are in line with the expectation that
horizontal coordination pressures are greater in more highly urbanized countries and that the
legacy of nationalist Africanist historical leaders also promotes horizontal coordination. These
coefficients, however, were no longer significant in the multivariate model. It is worth noting
Institutional*factorsExtent&of®ulation /0.06**
(0.02)PR&electoral&system&(vs.&FPTP) /0.01
(0.07)Parliamentary&system&(vs.&Presidential) 0.04
(0.08)
Demographic*factorsEthnic&fractionalization 0.03
(0.14)Percent&urban /0.37
(0.36)
Historical*factorsSettler&colony /0.08
(0.08)Nationalist&independence&leader /0.06
(0.08)
Economic*factorsGDP&per&capita 0.0008
(0.001)
R/squared 0.38n 45Notes:*Standard&errors&shown&in&parentheses.&+&p<0.1;&*&p<0.05;&**&p<0.01;&***&p<0.001
81
that ethnic fractionalization is not significantly associated with legislative electoral volatility.
Whereas ethnic fractionalization was the strongest predictor of party nationalization, it appears to
have no relationship with the level of electoral volatility. The theoretical implications of this
difference are discussed further in the conclusion to this chapter.
3.5 CONCLUSIONS
The main finding of the analyses is that party laws are associated with both higher levels
of party nationalization and lower levels of electoral volatility. Even after controlling for
alternative explanations, the extent of centripetal regulation remains significantly associated with
both outcomes. Policy diffusion of party laws has taken place throughout the region since 1990
and centripetal laws are associated with both higher levels of party nationalization and lower
levels of electoral volatility. These finding suggest that centripetal party laws increase the
horizontal coordination pressure faced by party leaders leading to the formation of more national
and enduring political parties.
As expected, party laws are one of many other factors that shape political party
development in Africa. Ethnic fractionalization, the historical legacy created by nationalist
Africanist leaders, and economic conditions including the level of wealth of a country, the
amount of corruption, and the proportion of tax revenue as a percent of GDP are all statistically
significant predictors of party nationalization. Nevertheless, the models presented in this chapter
show that the extent of regulation remains a weak but significant predictor of party system
nationalization even after controlling for these alternative explanations. While they cannot
explain nearly as much of the variation in party system nationalization as ethnic fractionalization,
centripetal party laws do indeed matter to both party nationalization and electoral volatility.
82
Interestingly, while ethnic fractionalization is associated with party nationalization it does
not appear to influence electoral volatility in the same way. In contrast to its relationship to party
nationalization, ethnic fractionalization is not a statistically significant predictor of electoral
volatility in the models in this chapter. This difference suggests that while party nationalization
and electoral volatility are correlated, parties are volatile while ethnic groups are not. The
difference could also be attributed to the smaller sample size of cases in the analyses on electoral
volatility.
While the database is the largest and most comprehensive source of information on this
topic, the quantitative analysis is limited by the selectivity of the cases included and the small
sample size. The analyses above show associations between the outcome variables and
institutional, demographic, historical, and economic factors. These associations are relatively
robust, but they should be tested on a larger sample of African elections. Moreover, the
hypotheses presented above highlight causal mechanisms as explanations for the associations,
however, the data do not permit tests of causal relationships. In subsequent chapters, in-depth
qualitative analysis is used to identify some of the causal mechanisms that underlie the
associations described in this chapter.
83
CHAPTER 4: KENYA (1992-2007) - TWO DECADES OF DIVIDE AND RULE
4.1 INTRODUCTION
In order to help flush out the causal mechanisms of my theory of horizontal versus vertical
coordination pressures, this chapter provides an in-depth analysis of political party development
in Kenya from 1992 to 2007. Kenya is a suitable case study for multiple reasons. First, the
country conducted four multi-party elections during this period, allowing for over-time analysis.
Importantly, the opposition defeated the incumbent in 2002, which suggests that there was
enough political space to allow for genuine competition between and among parties during this
time period. Second, there is considerable variation in the level of party nationalization and
electoral volatility from election to election. As per Figure 1.1 in Chapter 1, Kenya’s elections fit
into three out of four party system quadrants from 1992 through 2007. Kenya’s 1992 elections
are categorized as a dominant party system (Quadrant 1), the 1997 elections are an example of a
highly fragmented ethnic party system (Quadrant 2), while the 2002 and 2007 elections were
examples of systems dominated by ethnic parties in electoral coalitions (Quadrant 3). Few
countries in the African Party Laws and Nationalization Database (APLND) have experienced
such variation, making Kenya an important case. Third, historical analysis provides evidence
into the causal mechanisms that shaped political party development during this time period.
Particular attention is focused on Kenya’s transition from a one-party to a multiparty system in
the lead up to the 1992 elections. As more political space opened up, historical analysis shows
that leaders ultimately retreated to their ethnic cocoons after being unable to sustain a multiethnic
opposition party. This failure to maintain a strong national opposition party under which leaders
84
of multiple ethnicities were able to compete under the same party banner had lasting
repercussions for arty development in Kenya. Fourth, the author complements his own primary
experiences in Kenya with rich secondary sources including historical studies, archival materials,
non-governmental organization (NGO) reports, and news articles. Finally, in-depth analysis
provides the context necessary to better understand party development in the lead up to Kenya’s
2013 elections as discussed in the next chapter.
Kenya is a country of contradictions. On one hand, “Kenya is the anchor of eastern Africa and
the region’s geopolitical and economic hub; conditions there determine the region’s stability,
security, and prosperity” (Barkan 2013a: 1). On the other hand, however, it is one of the most
corrupt countries in the world18 and it has experienced some of the highest levels of electoral
violence in all of sub-Saharan Africa. Like so many other African countries, Kenya is a
multiethnic society. Whereas other African countries have been able to establish multiethnic
political parties that foster greater national cohesion and stability, in Kenya, “political parties
form almost exclusively on the basis of ethnic constituencies” (ibid: pg. 3). As discussed in more
detail later in this chapter, even the much lauded opposition coalition of 2002 was really nothing
more than an umbrella of loosely connected ethnic parties that joined together to beat an
oppressive incumbent. Kenya’s rapid descent into political violence following the highly
controversial 2007 elections shocked the world, yet, in retrospect, the warning signs were
evident. Kenya’s 2007 elections, like the violent but less discussed 1992 and 1997 elections
before them, highlight the potential dangers of ethnic politics in Africa. Once considered the
18 In Transparency International’s Corruption Perception Index (CPI) where a score of 100 indicates no corruption and a score of 0 indicates the highest level of corruption, Kenya’s CPI scores during this time period range from a low of 19 in 2002 to a high of 25 in 1998. See http://www.transparency.org/research/cpi/overview.
85
bastion of stability in a volatile region, the ethnic character of party politics severely tested
national unity and political stability in Kenya.
This chapter shows how a confluence of institutional, demographic, historical, and
economic factors reduced horizontal coordination pressures on politicians leading to decreased
levels of party nationalization and increased electoral volatility from 1992 to 2007. As described
in detail in Chapter 1, political parties in Africa generally fit into three categories: ethnic parties,
multiethnic coalitions, and national parties. Ethnic parties are exclusive in nature in that they are
formed around a single ethnic constituency and prioritize the interests of that group over others
(Chandra 2004, 2011). Multiethnic coalitions are formed when the leaders of multiple ethnic
parties join forces in an electoral alliance to improve their odds of winning an election (Horowitz
1985; Elischer 2013, Arriola 2013). National parties are multiethnic and integrative in nature
(Horowitz 1985; Elischer 2008) and prioritize the national interest over ethnic or regional sub-
divisions. National parties are possible in Africa only when horizontal coordination pressures
that encourage multiethnic cooperation overpower vertical coordination pressures that compel
party leaders to cater solely to their ethnic constituencies. The historical evidence in this chapter
shows how vertical coordination pressures on politicians steadily increased between 1992 and
2007. Even with the opposition victory in 2002, party competition deepened ethnic divisions
during this time period instead of fostering greater national cohesion and stability.
The chapter is divided into four additional sections. Part 2 presents the party
nationalization and electoral volatility scores along with other pertinent party-system level
measures for each of the four election years (1992, 1997, 2002, and 2007). Part 3 analyzes key
factors that influenced party development during the Moi-period elections (focusing on the 1992
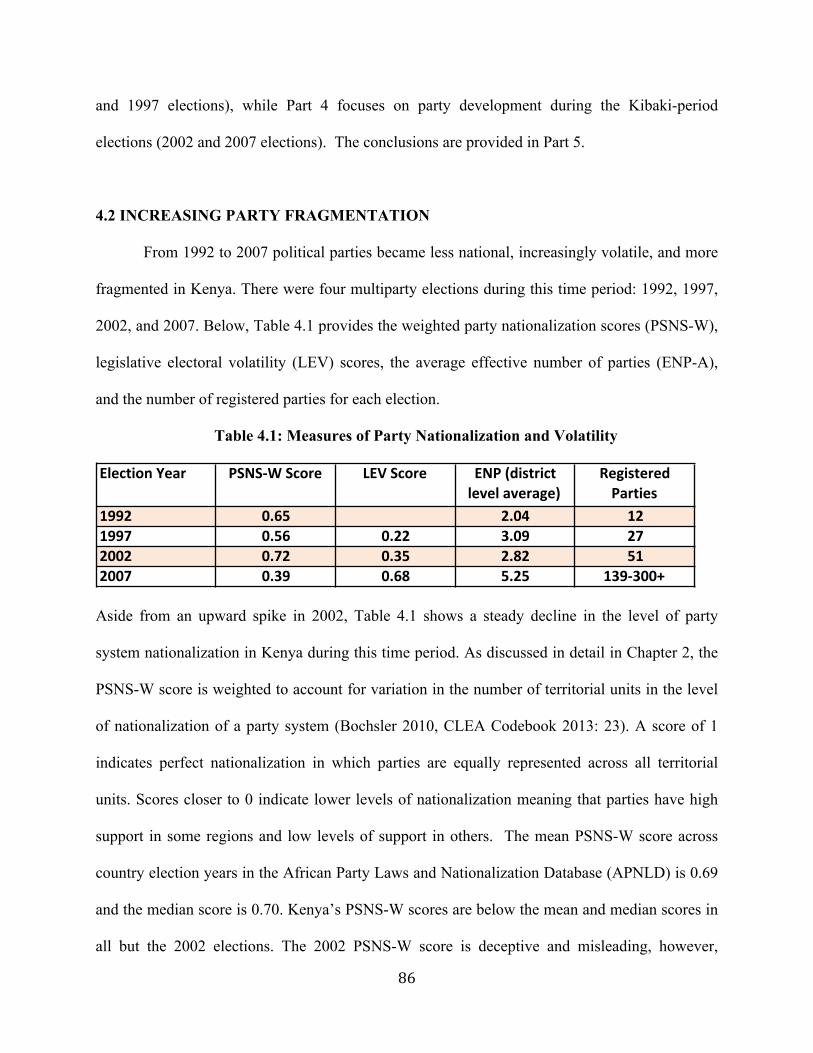
86
and 1997 elections), while Part 4 focuses on party development during the Kibaki-period
elections (2002 and 2007 elections). The conclusions are provided in Part 5.
4.2 INCREASING PARTY FRAGMENTATION
From 1992 to 2007 political parties became less national, increasingly volatile, and more
fragmented in Kenya. There were four multiparty elections during this time period: 1992, 1997,
2002, and 2007. Below, Table 4.1 provides the weighted party nationalization scores (PSNS-W),
legislative electoral volatility (LEV) scores, the average effective number of parties (ENP-A),
and the number of registered parties for each election.
Table 4.1: Measures of Party Nationalization and Volatility
Aside from an upward spike in 2002, Table 4.1 shows a steady decline in the level of party
system nationalization in Kenya during this time period. As discussed in detail in Chapter 2, the
PSNS-W score is weighted to account for variation in the number of territorial units in the level
of nationalization of a party system (Bochsler 2010, CLEA Codebook 2013: 23). A score of 1
indicates perfect nationalization in which parties are equally represented across all territorial
units. Scores closer to 0 indicate lower levels of nationalization meaning that parties have high
support in some regions and low levels of support in others. The mean PSNS-W score across
country election years in the African Party Laws and Nationalization Database (APNLD) is 0.69
and the median score is 0.70. Kenya’s PSNS-W scores are below the mean and median scores in
all but the 2002 elections. The 2002 PSNS-W score is deceptive and misleading, however,
Election)Year PSNS0W)Score LEV)Score ENP)(district)level)average)
Registered)Parties
1992 0.65 2.04 121997 0.56 0.22 3.09 272002 0.72 0.35 2.82 512007 0.39 0.68 5.25 1390300+
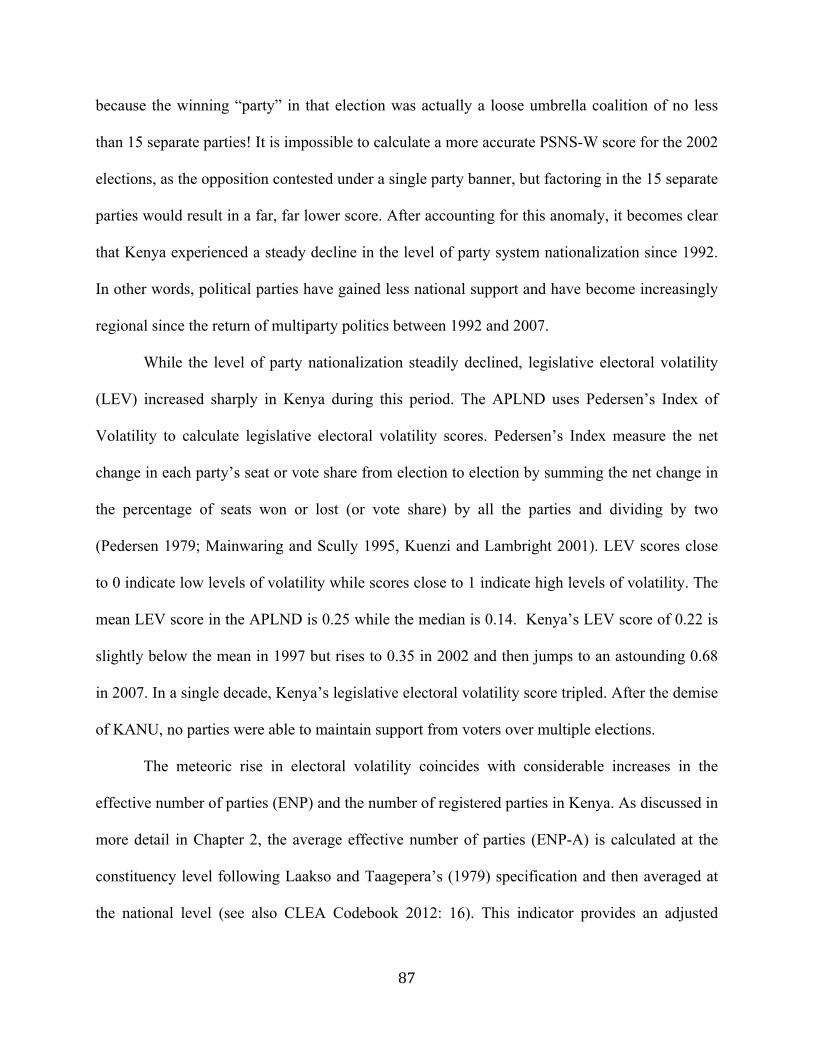
87
because the winning “party” in that election was actually a loose umbrella coalition of no less
than 15 separate parties! It is impossible to calculate a more accurate PSNS-W score for the 2002
elections, as the opposition contested under a single party banner, but factoring in the 15 separate
parties would result in a far, far lower score. After accounting for this anomaly, it becomes clear
that Kenya experienced a steady decline in the level of party system nationalization since 1992.
In other words, political parties have gained less national support and have become increasingly
regional since the return of multiparty politics between 1992 and 2007.
While the level of party nationalization steadily declined, legislative electoral volatility
(LEV) increased sharply in Kenya during this period. The APLND uses Pedersen’s Index of
Volatility to calculate legislative electoral volatility scores. Pedersen’s Index measure the net
change in each party’s seat or vote share from election to election by summing the net change in
the percentage of seats won or lost (or vote share) by all the parties and dividing by two
(Pedersen 1979; Mainwaring and Scully 1995, Kuenzi and Lambright 2001). LEV scores close
to 0 indicate low levels of volatility while scores close to 1 indicate high levels of volatility. The
mean LEV score in the APLND is 0.25 while the median is 0.14. Kenya’s LEV score of 0.22 is
slightly below the mean in 1997 but rises to 0.35 in 2002 and then jumps to an astounding 0.68
in 2007. In a single decade, Kenya’s legislative electoral volatility score tripled. After the demise
of KANU, no parties were able to maintain support from voters over multiple elections.
The meteoric rise in electoral volatility coincides with considerable increases in the
effective number of parties (ENP) and the number of registered parties in Kenya. As discussed in
more detail in Chapter 2, the average effective number of parties (ENP-A) is calculated at the
constituency level following Laakso and Taagepera’s (1979) specification and then averaged at
the national level (see also CLEA Codebook 2012: 16). This indicator provides an adjusted
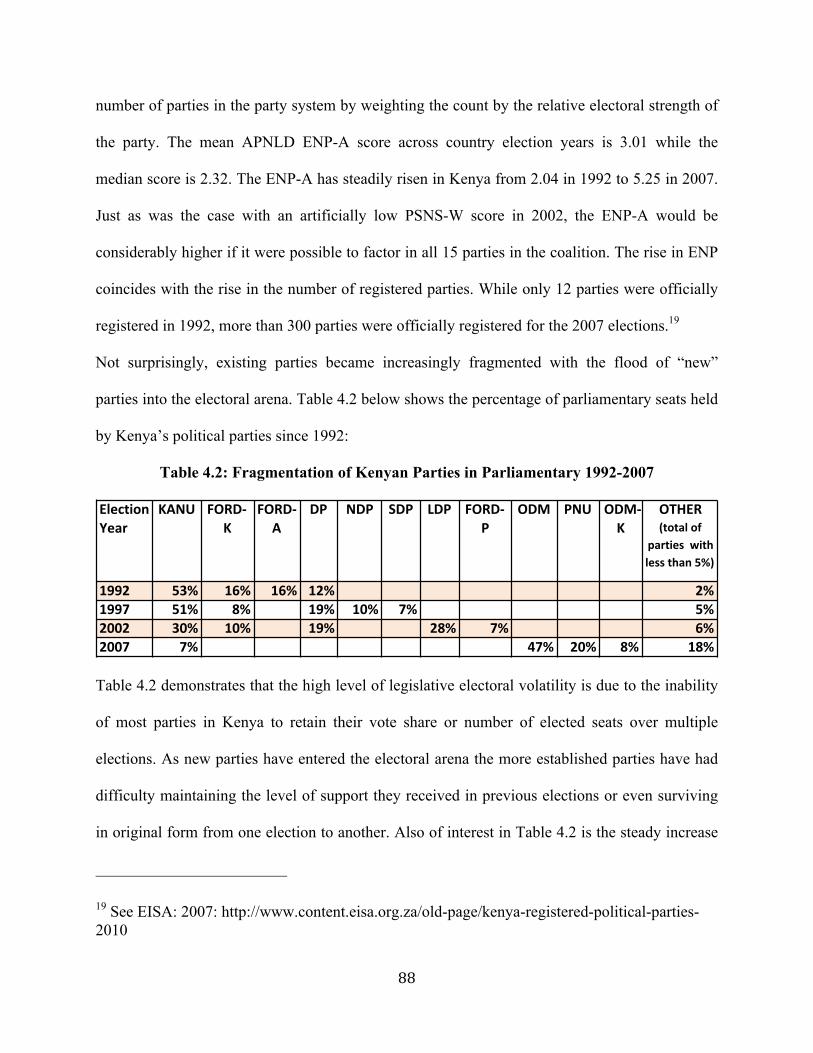
88
number of parties in the party system by weighting the count by the relative electoral strength of
the party. The mean APNLD ENP-A score across country election years is 3.01 while the
median score is 2.32. The ENP-A has steadily risen in Kenya from 2.04 in 1992 to 5.25 in 2007.
Just as was the case with an artificially low PSNS-W score in 2002, the ENP-A would be
considerably higher if it were possible to factor in all 15 parties in the coalition. The rise in ENP
coincides with the rise in the number of registered parties. While only 12 parties were officially
registered in 1992, more than 300 parties were officially registered for the 2007 elections.19
Not surprisingly, existing parties became increasingly fragmented with the flood of “new”
parties into the electoral arena. Table 4.2 below shows the percentage of parliamentary seats held
by Kenya’s political parties since 1992:
Table 4.2: Fragmentation of Kenyan Parties in Parliamentary 1992-2007
Table 4.2 demonstrates that the high level of legislative electoral volatility is due to the inability
of most parties in Kenya to retain their vote share or number of elected seats over multiple
elections. As new parties have entered the electoral arena the more established parties have had
difficulty maintaining the level of support they received in previous elections or even surviving
in original form from one election to another. Also of interest in Table 4.2 is the steady increase
19 See EISA: 2007: http://www.content.eisa.org.za/old-page/kenya-registered-political-parties-2010
Election)Year
KANU FORD5K
FORD5A
DP NDP SDP LDP FORD5P
ODM PNU ODM5K
OTHER)(total)of)
parties))with)less)than)5%))
1992 53% 16% 16% 12% ) ) 2%1997 51% 8% ) 19% 10% 7% 5%2002 30% 10% 19% 28% 7% 6%2007 7% 47% 20% 8% 18%
89
in the proportion of parties in parliament receiving less than 5% of parliamentary seats. In 1992
there were only 3 parties in parliament with fewer than 5% of parliamentary seats. In 2007, by
contrast, there were 19 parties in parliament with fewer than 5% of parliamentary seats.
Combined, the measures in Tables 4.1 and 4.2 provide overwhelming evidence of an
increasingly fragmented party system in Kenya.
But what accounts for the decreasing levels of party nationalization and the high levels of
electoral volatility in Kenya? Why have parties become less national and less enduring from
1992 to 2007? Furthermore, low levels of party system nationalization and high levels of
electoral volatility do not, in and of themselves, provide evidence of increased ethnicization of
party politics. To that end, what additional evidence demonstrates the increasingly ethnicized
nature of political parties in Kenya during this time period? The remainder of this chapter
addresses these questions through in-depth historical analysis. The evidence shows that a
complex interaction of institutional, demographic, historical, and economic factors shaped party
development by increasing the vertical coordination pressures on politicians. The political
environment in Kenya encouraged the creation of effervescent ethnic parties over more
organizationally robust multiethnic parties. Analysis of regional election results, ethnic
composition of party leadership, and the ethnic composition of cabinet ministers provide ample
evidence of the increased ethnicization of political parties since 1992.
4.3 THE MOI ELECTIONS 1992 AND 1997
Prior to 1991, Kenya had been a one-party state, with the Kenya African National Union
(KANU) as the only legal political party since 1969. During Jomo Kenyatta’s presidency, one-
party competition within KANU was vibrant, and MPs who did not deliver were regularly ousted
90
at the ballot box because voters could choose between multiple KANU candidates (Barkan 1976:
453-4; Barkan 1979). Kenyatta structured KANU as a flexible network of ethnic brokers where
party leaders operated with a great degree of autonomy as long as they continued to deliver
support and votes to KANU (LeBas 2011: 163). Kenyatta intentionally structured KANU as a
relatively weak party because he preferred to conduct political bargaining through a
decentralized electoral machine that granted provincial administrators great power (Widner
1992: 40). When Moi took over KANU in 1978, in contrast, he rebuilt the party into a vehicle for
political and social control (ibid: 40) by restructuring it into a centralized and intimidating
organization that reached into nearly every aspect of each citizen’s life. Under Moi’s leadership,
KANU became increasingly authoritarian, less tolerant of criticism, and less accountable to the
demands of citizens. By the 1990s, Kenya had become an authoritarian “party-state” (ibid: 5),
and KANU had become a far different organization under Moi than it had been under Kenyatta.
While KANU had become more organizationally robust under Moi, rampant corruption and
shrinking political space cultivated the seeds of discontent that would ultimately lead to both the
reintroduction of multi-partyism and to the party’s demise.
An interaction of internal and external factors led to the reintroduction of multiparty
politics in Kenya in December of 1991. Internally, the “regime’s blatant manipulation of the
1988 national and party elections” (Throup and Hornsby 1998: 54) and the unsolved murder of
Foreign Minister Dr. Robert Ouko on February 13 1990 increased domestic pressures for
political liberalization (ibid; Hornsby 2012). In contrast to many African countries where
structural adjustment and mass retrenchments led to widespread, economically motivated
protests (Bratton and Van de Walle 1992, 1997), the Kenyan government “never braved popular
discontent by implementing unpopular reforms like maize price deregulations” (Lebas 2011:
91
163). While domestic pressure was certainly growing (Bratton and van de Walle 1997: 104-6) it
had not yet reached a tipping point in Kenya by the early 1990s. In Kenya’s case, the external
pressures for political liberalization were likely greater than domestic pressures. In an
extraordinary interview with the BBC in January of 1992, President Moi lamented:
It (multiparty politics) is because of the Western media set against us, because of the economic setting today. The trend of the world economies are being controlled by developed countries, and I didn’t want my people to be hammered and bothered for a long time…Don’t you ever believe that in Africa with multi-partyism will produce stability in Africa. It will never (January 1992 BBC interview in Hornsby 2012 pg. 487)
The collapse of the Iron Curtain brought with it an increased assertiveness among
Western donors and growing demands for improved accountability and political pluralism of
their African allies (Hornsby 2012: 466). As such, the end of the Cold War and Western donors’
suspension of aid disbursements in November 1991 essentially forced the Moi regime to
formally reintroduce multiparty politics by the end of that year.
Despite the restoration of multiparty politics in Kenya after 22 years of single party rule,
Moi and KANU remained victorious in both the 1992 and 1997 elections. By early 1992 the
main opposition party, the Forum for the Restoration of Democracy (FORD), seemed poised for
victory (Throup and Hornsby 1998, Hornsby 2012). Nevertheless, as explained in more detail
below, KANU exploited divisions within the opposition and capitalized on the unlevel electoral
playing field it had created. According to the official 1992 results, Moi obtained nearly 37% of
the presidential votes in 1992 while KANU retained an outright majority in parliament, with 100
out of 188 elected seats (Nohlen et al 1999: 488-90). Moi and KANU remained victorious again
in 1997, but cracks in KANU began deepening throughout the 1990s. The official 1997 results
92
had Moi obtaining over 40% of the vote, with KANU winning 108 out of 210 national assembly
seats (ibid).
While levels of party nationalization remained relatively high and legislative electoral
volatility was comparatively low in these elections, Kenyan politics had become increasingly
more divisive and ethnicized in both the 1992 and 1997 elections. KANU won both elections, yet
the party’s support and the overall level of party nationalization decreased substantially during
this time period from 0.65 in 1992 to 0.56 in 1997.20 In addition, the number of registered
opposition parties more than doubled from 12 in 1992 to 27 in 1997, and electoral volatility
increased as KANU began losing its dominance and new parties entered the electoral arena. To
complement the party system level indicators presented in Part 2, individual party-level analysis
is provided below to show evidence of the increased ethnicization of party politics. More
specifically, analyzing detailed election results shows evidence of growing ethno-regional
support of parties. The following subsections demonstrate how key institutional, demographic,
historical, and economic factors amplified the vertical coordination pressures on politicians,
contributing to the increased ethnicization of party politics in Kenya during this time period.
4.3.1 Party Laws: Ambiguity and Favoritism Prevail
Since Kenya was a presidential system with a first-past-the-post electoral system (FPTP)
for all four elections during this period, this chapter focuses on political party laws as the key
institution of interest. While the repeal of Section 2 (A) of the Constitution in December of 1991
reintroduced multiparty politics in Kenya, all political parties continued to be regulated under the
20 For the remainder of this chapter, references to “party nationalization scores” refer to the weighted party system nationalization scores as presented in Table 1 as calculated in the APLND database.
93
Societies Act of 1952 (as amended in 1968). As Throup and Hornsby (1998) rightly note, “By
deciding to accede to international pressure for greater political pluralism before it was
inevitable, President Moi had seized the initiative back from FORD, enabling KANU to control
the legislative process which would legalize opposition parties and to prepare the multi-party
electoral process to KANU’s advantage” (Throup and Hornsby 1998:88). Despite multiple failed
attempts to amend the existing Act or to introduce new legislation, no political party-specific
laws were enacted in advance of either the 1992 or 1997 elections. By default, the Societies Act
set wide and ambiguous parameters under which political parties were to gain and retain
registration status. Officially, no party finance laws were enacted during this time, and political
parties did not legally receive public funds. In reality, and as discussed in more detail below,
KANU recklessly drained public coffers to fund its campaigns and other party activities
(Hornsby 2012; Branch 2011). Moi and his allies maintained control of the legislative and
administrative processes to ensure KANU’s supremacy at the ballot box in 1992 and 1997, for
example, by taking full advantage of existing provisions to regulate political parties and civil
society.
The Societies Act had never been specifically designed for political parties, and its vague
language granted sweeping discretionary power to the Moi government for regulating opposition
political parties. The law defined a “society” as “any club, company, partnership or other
association of ten or more persons, whatever its nature or object, established in Kenya or having
its headquarters or chief place of business in Kenya (Part 1:2(1)). The Act established the
Registrar of Societies as the sole body responsible for determining whether or not any “society”
was legal. The Registrar was appointed directly by President Moi without any input or oversight
from the opposition. The Act gave the Registrar wide scope in determining the legality of a
94
political party by stating that he can refuse to register any society if “he has reasonable cause to
believe that the society has among its objects, or is likely to pursue or to be used for, any
unlawful purpose or any purpose prejudicial to or incompatible with peace, welfare, or good
order in Kenya” (Part II: 11. (2) (a)). Between 1992 and 1996 the Registrar denied registration to
23 parties (Moroff 2010: 755), yet, as discussed below, the official reasons for granting some
parties registration while denying registration to others were, at best, opaque.
Moi effectively used the ambiguity of the Societies Act and the broad powers granted to
the Registrar to deepen divisions within the opposition. As Moroff (2010) aptly notes, “the
Registrar denied registration to various parties and functioned as a political instrument of the
regime by registering government-friendly parties and various splinter groups, which had names
and symbols similar to existing opposition parties, while delaying or even denying the
registration of opposition parties considered politically threatening” (Moroff 2010: 755). Indeed
between 1992 and 1996 the registrar flatly denied registration to 23 parties (ibid: 755). While
various official reasons were given, the Moi regime used the Act to derail opposition parties that
might threaten KANU’s dominance as a national party. For instance, the Registrar refused to
grant party registration to the Islamic Party of Kenya (IPK) on the grounds that it was illegal to
have “religious” parties, but there is no such provision in either the Constitution or the Act
(Moroff 2010: 755; Hornsby 2012: 489). Senior party leaders also feared that an Islamic party
could threaten KANU’s dominance in Coast Province (Throup and Hornsby 1998: 179).
Similarly, the Registrar repeatedly denied registration to the Safina party. In 1995, a number of
FORD-Kenya exiles joined forces with Richard Leakey, respected former head of the Kenya
Wildlife Service and a white Kenyan of British descent, to create Safina. The Swahili word
“Safina” means “ark.” The party chose its name to represent the multiethnic nature of its
95
leadership and its intention to be a “catch-all” party just as Noah’s ark carried all the different
animal species during the great flood (Hornsby 2012:588-589). The registrar denied the party
registration on the grounds that its name invoked religious symbolism and it was therefore a
religious party. While the Registrar regularly denied registration to parties that threatened
KANU’s dominance as a national party, splinter factions of opposition parties that opted to
create their own ethnic parties faced few issues in obtaining registration. For instance, as rifts in
FORD began to widen, the registrar expedited the registration of the splinter parties FORD-
Kenya and FORD-Asili, parties that were dominated by Luo leadership and Kikuyu leadership
respectively (Throup and Hornsby 1998: 158-160; Elischer 51-59). The inconsistent manner by
which the Registrar of Societies treated political parties became an effective tool for repressing
the opposition.
While no new party registration or party finance laws were enacted in 1992, the Moi
administration pushed forward additional legislation designed to give KANU an advantage.
More specifically, the Constitution of Kenya (Amendment) Bill of August 1992 mandated that a
presidential candidate must gain a minimum of 25% of the votes cast in at least 5 of the eight
provinces to avoid a runoff. As the only political party with a national infrastructure, this
provision clearly gave KANU the edge over the increasingly divided opposition. Indeed, in both
the 1992 and 1997 elections, Moi was the only presidential candidate able to meet this criterion
(Nohlen et al 1999: 488-90). Perhaps even more challenging to the opposition, the bill also
commanded that the president elect must form a government from members of his own party.
This provision made it virtually impossible for the opposition to form a coalition government
because parties could not “share” ministerial positions with members of other parties. Not
surprisingly, the Amendment sailed through the KANU-dominated parliament with only one
96
vote against it (Foeken and Dietz 2000: 130). After years of working to reform the restrictive
electoral laws, moderates from KANU and the lead opposition parties formed the Inter-Parties
Parliamentary Group (IPPG) in 1997 to craft a compromise. On November 8 1997, President
Moi signed into law the IPPG’s recommendations which, among other things, granted the
opposition more of a voice within the electoral commission of Kenya (ECK) and abolished the
provision requiring that the president elect could only fill appointments from his own party
(Hornsby 2012: 600-601; Foeken and Dietz 2000: 142). Allowing the president to appoint
members from other parties had finally opened the doors for coalition politics in Kenya.
Nevertheless, KANU maintained a stranglehold over the legislative and other governance
processes, however, and these limited legal reforms were simply not enough to turn the tide in
favor of the opposition in the 1997 elections.
As the only party with a national infrastructure, KANU took advantage of the ambiguous
language of the Societies Act and used the wide discretionary power of the Registrar of Societies
to fragment the opposition. Parties that were seen to threaten KANU’s dominance as a national
party faced more restrictive barriers to entry via delays or outright registration rejections. Ethnic
parties that would splinter multiethnic opposition parties, on the other hand, faced few issues in
obtaining registration. This lack of consistency in the application of the Societies Act from one
party to the next helped KANU maintain its dominance as a national party. As detailed in section
3.2 below, a number of the parties that faced few obstacles in gaining registration status were
ethno-regional parties that would divide the opposition vote. This deliberate strategy of denying
registration to more nationally oriented parties while registering ethnic parties increased the
vertical coordination pressures on politicians. The Moi regime manipulated the legislative
environment to make it more difficult for multiethnic parties to gain registration status. As a
97
result, opportunistic ethnic leaders seized the opportunity to create and easily register political
parties. Further evidence of the increased ethnicization of party politics during this time period is
presented below.
4.3.2 Demographics: The Kalenjin Seek to Maintain Control
While increased urbanization and population growth likely had some influence, ethnicity
was the key demographic influence on political party development for both the 1992 and 1997
elections. Like many African countries, the domestic pro-democracy movement in Kenya had its
roots with the urban elites (Throup and Hornsby 1998). The level of urbanization increased from
17% in 1992 to 19% in 1997 and the percent of the population under the age 15 hovered around
45%.21 While there was increased pressure from urban elites for more political pluralism (Ibid,
Hornsby 2012), the vast majority of the country remained agrarian, and KANU had been the
only political party most of the population had ever known. The increased ethnic tensions and
growing polarization characteristic of the 1992 and 1997 elections cannot be attributed to
changing demographics. Instead, Moi and party hardliners deliberately fueled ethnic conflict to
divide the opposition to ensure KANU’s dominance.
Moi’s divide-and-rule strategy successfully ensured KANU’s supremacy in the short-run,
yet it would ultimately doom the party and propel the country down a dangerous path of social
and institutional volatility. According to the Population Census of 1989, Kenya was comprised
of more than 21.4 million people from over 40 different tribes at that time.22 As per Figure 4.1
21 See World Bank Development Indicators: http://data.worldbank.org/data-catalog/world-development-indicators 22 Source: Kenyan Bureau of Statistics 1989 Census Report
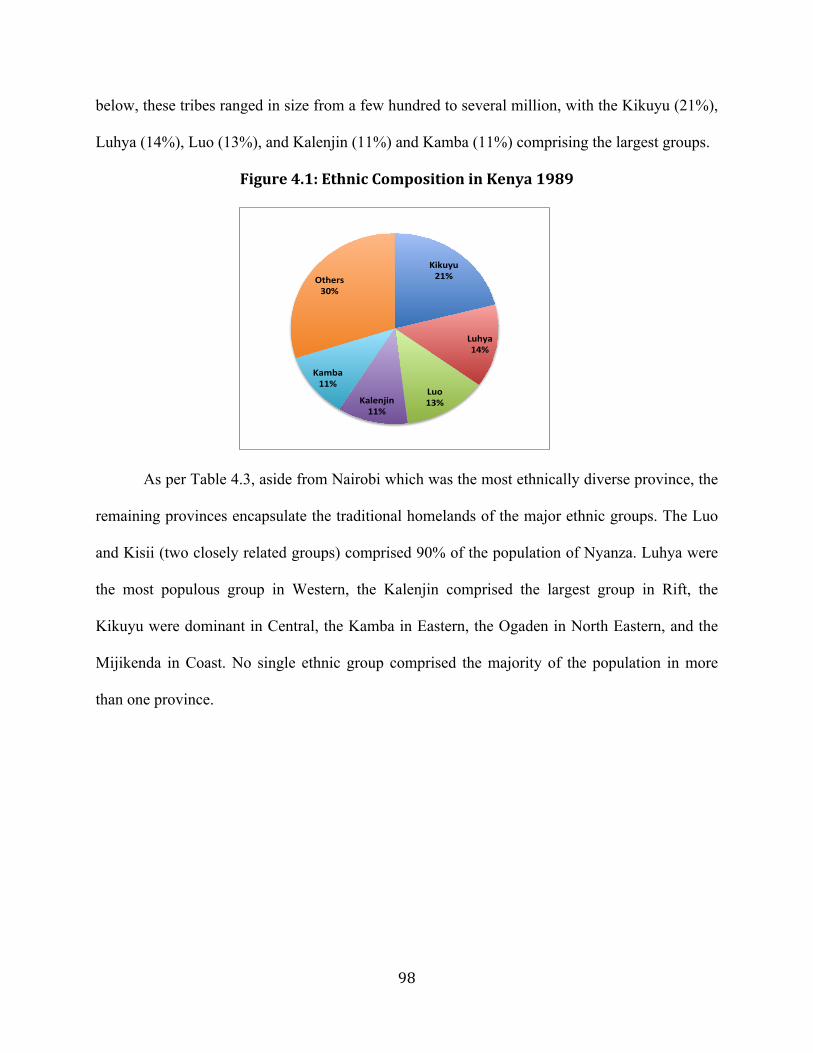
98
below, these tribes ranged in size from a few hundred to several million, with the Kikuyu (21%),
Luhya (14%), Luo (13%), and Kalenjin (11%) and Kamba (11%) comprising the largest groups.
Figure 4.1: Ethnic Composition in Kenya 1989
As per Table 4.3, aside from Nairobi which was the most ethnically diverse province, the
remaining provinces encapsulate the traditional homelands of the major ethnic groups. The Luo
and Kisii (two closely related groups) comprised 90% of the population of Nyanza. Luhya were
the most populous group in Western, the Kalenjin comprised the largest group in Rift, the
Kikuyu were dominant in Central, the Kamba in Eastern, the Ogaden in North Eastern, and the
Mijikenda in Coast. No single ethnic group comprised the majority of the population in more
than one province.
Kikuyu&21%&
Luhya&14%&
Luo&13%&Kalenjin&
11%&
Kamba&11%&
Others&30%&
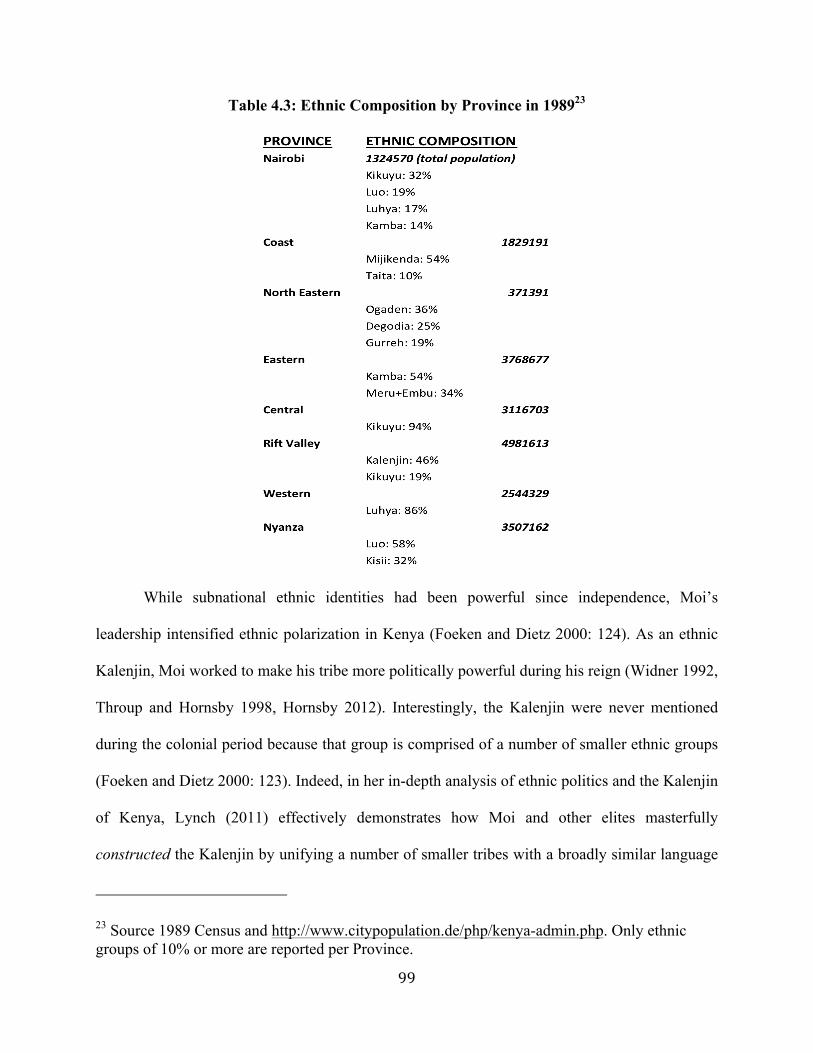
99
Table 4.3: Ethnic Composition by Province in 198923
While subnational ethnic identities had been powerful since independence, Moi’s
leadership intensified ethnic polarization in Kenya (Foeken and Dietz 2000: 124). As an ethnic
Kalenjin, Moi worked to make his tribe more politically powerful during his reign (Widner 1992,
Throup and Hornsby 1998, Hornsby 2012). Interestingly, the Kalenjin were never mentioned
during the colonial period because that group is comprised of a number of smaller ethnic groups
(Foeken and Dietz 2000: 123). Indeed, in her in-depth analysis of ethnic politics and the Kalenjin
of Kenya, Lynch (2011) effectively demonstrates how Moi and other elites masterfully
constructed the Kalenjin by unifying a number of smaller tribes with a broadly similar language
23 Source 1989 Census and http://www.citypopulation.de/php/kenya-admin.php. Only ethnic groups of 10% or more are reported per Province.
100
and culture (Lynch 2011). Moi cemented the smaller groups into one of Kenya’s largest tribes by
playing up fears that the Kalenjin would be “swallowed” (Throup and Hornsby: 341) by Kenya’s
other tribes if he were ever to lose control of the presidency or KANU were to lose at the polls.
Fueling these fears fostered greater cohesion among the smaller, loosely related groups
within the Kalenjin, and heightened animosity between the Kalenjin and Kenya’s other ethnic
groups throughout the 1990s. In a self-fulfilling prophecy, Moi predicted that the return to multi-
party politics would lead to ethnic violence. Yet, as noted in a 1993 Human Rights Watch
(HRW) Report on Kenya:
One of the most disturbing developments in Kenya over the last two years has been the eruption of violent clashes between different ethnic groups. However, far from being the spontaneous result of a return to political pluralism, there is clear evidence that the government was involved in provoking this ethnic violence for political purposes and has taken no adequate steps to prevent it from spiraling out of control. (1993 HRW: 1).
In both 1992 and 1997, ethnic violence erupted against between the Kalenjin and the
Kikuyu in Kenya’s Rift Valley, the Luo in Nyanza, and the Luhya in Western Provinces. The
HRW report aptly states: “although the violence is portrayed by the government as purely ethnic
or ‘tribal,’ its basis is clearly political. The Moi government and much of his Kalenjin
community have stood to benefit economically and politically from the violence (HRW 1993:
3).” In the campaign for the 1992 elections, state-sponsored violence left more than 1,500 people
dead and 300,000 displaced (ibid: 1). The displaced populations led to a growing trend of ethnic
homogenization that started during the 1980s and intensified throughout the 1990s. The state-
sponsored ethnic violence forced many out of Kalenjin strongholds back to their ethnic
“homelands.” As Foeken and Dietz (2000) rightly note, “during the 1980s – the first decade of
101
President Moi’s era – almost half of the Kenyan districts experienced an ethnic homogenization
trend…the ethnic cleansing during the beginning of the 1990s can thus be seen as the violent
continuation of a process that started at least a decade earlier” (Foeken and Diez 2000).
This ethnic homogenization strongly influenced voting patterns in Kenya, as citizens
overwhelmingly supported their co-ethnics by largely voting in ethnic blocks in their ethnic
homelands. In the 1992 presidential elections, Moi was the only candidate capable of attaining
more than 25% of the vote in five provinces and dominated with he nearly 70% of the vote in the
Kalenjin homeland of Rift Valley. Jaramogi Oginga Odinga (a Luo) of FORD-Kenya secured an
overwhelming 75% of the vote in the Luo homeland of Nyanza but did not obtain more than
20% of the vote in any other province. Kenneth Matiba (a Kikuyu) obtained a majority of the
vote only in the Kikuyu homeland of Central Province. Mwai Kibaki (a Kikuyu) of the
Democratic Party (DP) obtained a slim majority in Eastern Province due to strong support from
the closely related ethnic Meru and Embu ethnic groups. More than 96% of voters in Central
Province voted for either Matiba or Kibaki, meaning that less than 4% cast their votes for non-
Kikuyu presidential candidates. As per Table 4.4 below, the same pattern of ethnic voting was
also evident in the parliamentary elections.
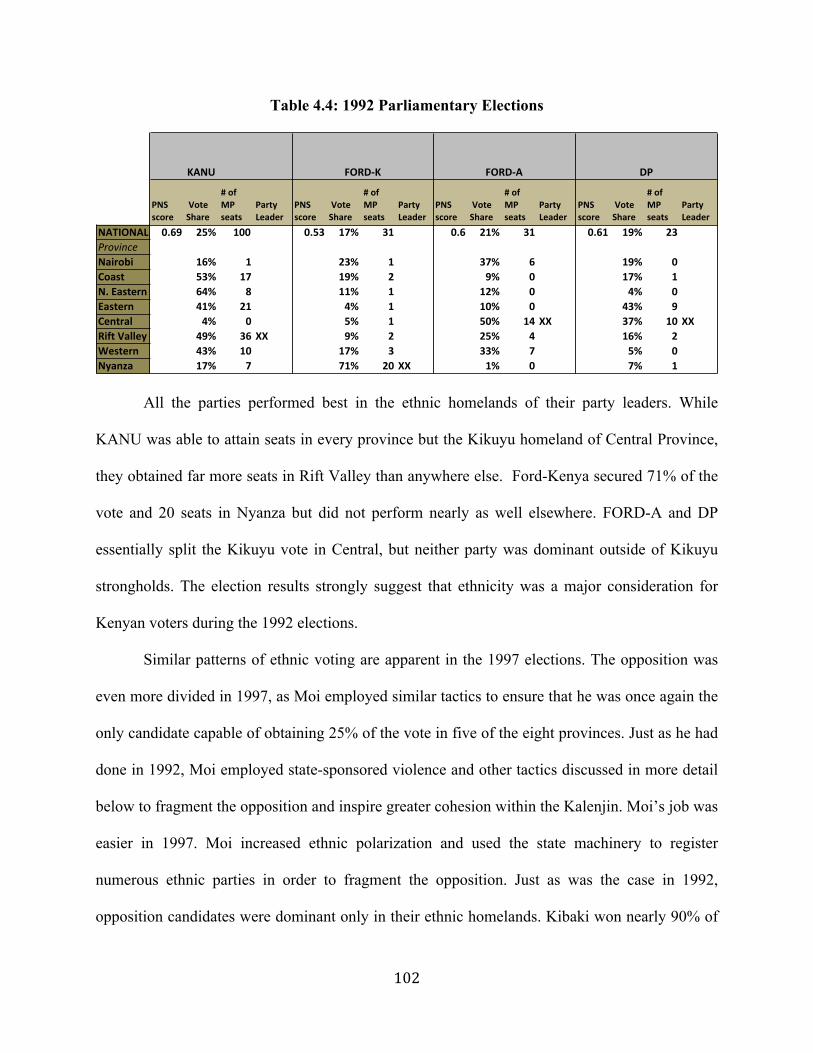
102
Table 4.4: 1992 Parliamentary Elections
All the parties performed best in the ethnic homelands of their party leaders. While
KANU was able to attain seats in every province but the Kikuyu homeland of Central Province,
they obtained far more seats in Rift Valley than anywhere else. Ford-Kenya secured 71% of the
vote and 20 seats in Nyanza but did not perform nearly as well elsewhere. FORD-A and DP
essentially split the Kikuyu vote in Central, but neither party was dominant outside of Kikuyu
strongholds. The election results strongly suggest that ethnicity was a major consideration for
Kenyan voters during the 1992 elections.
Similar patterns of ethnic voting are apparent in the 1997 elections. The opposition was
even more divided in 1997, as Moi employed similar tactics to ensure that he was once again the
only candidate capable of obtaining 25% of the vote in five of the eight provinces. Just as he had
done in 1992, Moi employed state-sponsored violence and other tactics discussed in more detail
below to fragment the opposition and inspire greater cohesion within the Kalenjin. Moi’s job was
easier in 1997. Moi increased ethnic polarization and used the state machinery to register
numerous ethnic parties in order to fragment the opposition. Just as was the case in 1992,
opposition candidates were dominant only in their ethnic homelands. Kibaki won nearly 90% of
!
PNS$score
$Vote$Share
#$of$MP$seats
Party$Leader
PNS$score
$Vote$Share
#$of$MP$seats
Party$Leader
PNS$score
$Vote$Share
#$of$MP$seats
Party$Leader
PNS$score
$Vote$Share
#$of$MP$seats
Party$Leader
NATIONAL 0.69 25% 100 0.53 17% 31 0.6 21% 31 0.61 19% 23ProvinceNairobi 16% 1 23% 1 37% 6 $ 19% 0Coast 53% 17 19% 2 9% 0 $ 17% 1N.$Eastern 64% 8 11% 1 12% 0 $ 4% 0Eastern 41% 21 4% 1 10% 0 $ 43% 9Central 4% 0 5% 1 50% 14 XX $ 37% 10 XXRift$Valley 49% 36 XX 9% 2 25% 4 $ 16% 2Western 43% 10 17% 3 33% 7 $ 5% 0Nyanza 17% 7 71% 20 XX 1% 0 $ 7% 1
FORDPK FORDPA DPKANU

103
the vote in Central, Raila Odinga (Jaramogi’s son) obtained 57% of the vote in Nyanza, and
Kijana Wamalwa (a Luhya) secured a plurality of votes in Western, but none were able to
compete with Moi outside their ethnic homelands. Table 4.5 below demonstrates that the
parliamentary results followed similar ethno-regional trends as the presidential vote.
Table 4.5: 1997 Parliamentary Elections
Similar to the 1992 elections, every party performed far better in the ethnic home regions
of their party leaders. While KANU’s party nationalization scores rose from 0.69 to 0.762, and
DP was able to maintain a score of around 0.60 from 1992 to 1997, none of the other opposition
parties were able to maintain a PNS score above 0.50. Moreover, DP was the only party able to
increase its percentage of parliamentary seats (from 12% to 19%) since 1992. All the other
parties, including KANU, experienced a decline in the proportion of parliamentary seats in the
1997 elections. In addition, the number of registered parties also more than doubled from 12 to
27 as party system nationalization dropped from 0.65 to 0.56 between elections. The party
system had not just become more fragmented, but the regional election results demonstrate the
increasingly ethnic nature of political parties. KANU remained dominant in 1997, yet increased
vertical coordination pressures contributed to a proliferation of ethnic parties that had already
begun reducing both the level of party nationalization and the endurance of older parties.
!
PNS$score
$Vote$Share
#$of$MP$seats
Party$Leader
PNS$score
$Vote$Share
#$of$MP$seats
Party$Leader
PNS$score
$Vote$Share
#$of$MP$seats
Party$Leader
PNS$score
$Vote$Share
#$of$MP$seats
Party$Leader
PNS$score
$Vote$Share
#$of$MP$seats
Party$Leader
NATIONAL 0.762 39% 107 0.6 22% 39 0.372 12% 21 0.489 8% 15 0.458 10% 17ProvinceNairobi 22% $ 33% 20% 12% 6%Coast 59% 17% 13% 7% 4%N.$Eastern 60% 5% 0% 0% 4%Eastern 40% 24% 2% 23% XX 10%Central 13% 50% XX 3% 11% 0%Rift$Valley 59% XX 23% 3% 1% 9%Western 47% 1% 3% 1% 42% XXNyanza 31% 4% 48% XX 4% 10%
FORDPKKANU SDPDP NDP
104
4.3.3 Historical Legacy: Ethnic Nationalists
While colonial legacy undoubtedly influenced the trajectory of party development, this
chapter focuses on the leadership styles and policies of Kenya’s presidents as the key historical
factor of interest. Both Kenyatta and Moi maintained a facade of national ethnic representation in
their governments, yet each president’s inner circle was comprised of co-ethnics that
disproportionately promoted the interests of their own tribes (Hornsby 2012, Throup and
Hornsby 1998). As a founding patron of the Gikuyu, Embu and Meru Association (GEMA),
Kenyatta was brazenly committed to promoting Kikuyu interests and keeping power in the hands
of the Kikuyu. Upon his death in 1978, Moi inherited and perpetuated Kenyatta’s legacy by
continuing his policies of “political patronage, political killings and detentions, and restrictions
on freedom of speech and association” (HRW 1993: 8). Just as Kenyatta had used the party to
ensure Kikuyu dominance, Kenyatta restructured KANU to promote and protect Kalenjin
interests (Hornsby 2012). As the leader of a smaller and less cohesive tribe than his predecessor,
Moi had even less tolerance of dissent than Kenyatta, and KANU had become increasingly more
authoritarian under his control (Widner 1992, Lynch 2011). Miguel notes: “Kenyatta and Daniel
arap Moi, are perceived within Kenya as ‘tribalists,” political opportunists who thrived on the
politics of ethnic division” (Miguel 2004: 337). Despite their empty lip service on the
importance of fostering ethnic inclusivity to build the nation, Kenyatta and Moi were ultimately
Kikuyu and Kalenjin, respectively, nationalists who placed the interests of their tribes before that
of their country as a whole.
As tribal political opportunists, both Kenyatta and Moi shaped the trajectory of party
development in Kenya by increasing vertical coordination pressures on politicians by
encouraging the politics of ethnic division. Following in Kenyatta’s example, Moi used KANU
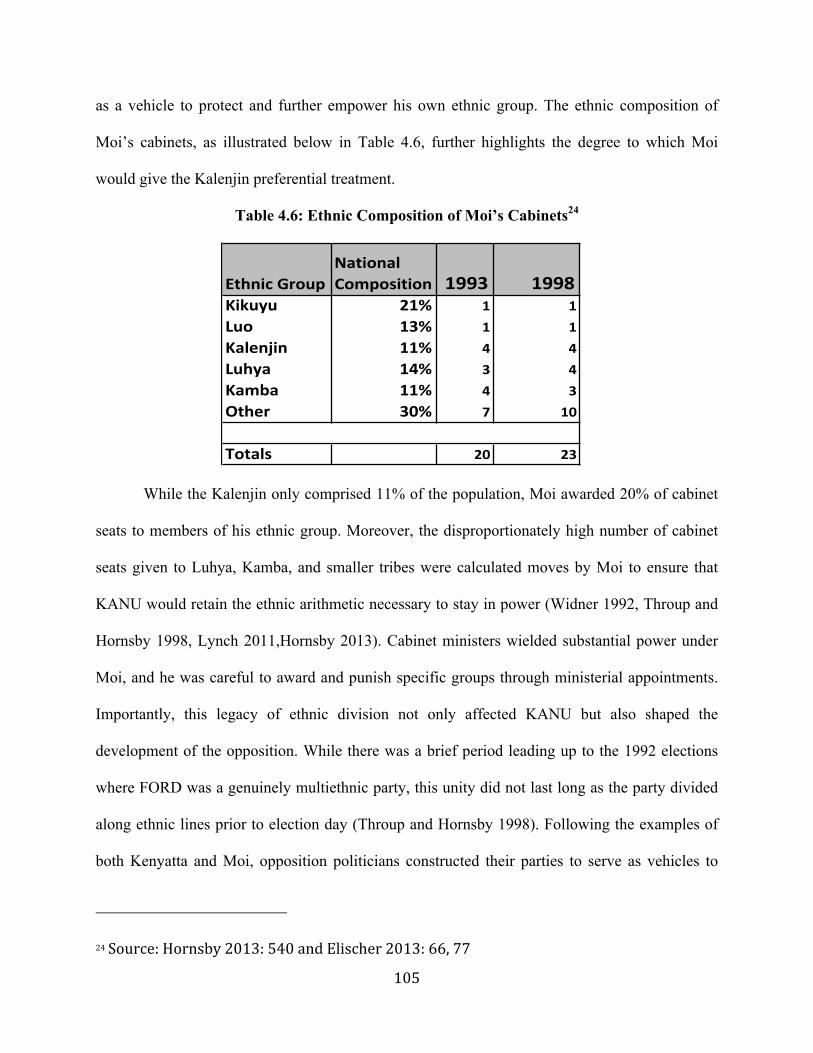
105
as a vehicle to protect and further empower his own ethnic group. The ethnic composition of
Moi’s cabinets, as illustrated below in Table 4.6, further highlights the degree to which Moi
would give the Kalenjin preferential treatment.
Table 4.6: Ethnic Composition of Moi’s Cabinets24
While the Kalenjin only comprised 11% of the population, Moi awarded 20% of cabinet
seats to members of his ethnic group. Moreover, the disproportionately high number of cabinet
seats given to Luhya, Kamba, and smaller tribes were calculated moves by Moi to ensure that
KANU would retain the ethnic arithmetic necessary to stay in power (Widner 1992, Throup and
Hornsby 1998, Lynch 2011,Hornsby 2013). Cabinet ministers wielded substantial power under
Moi, and he was careful to award and punish specific groups through ministerial appointments.
Importantly, this legacy of ethnic division not only affected KANU but also shaped the
development of the opposition. While there was a brief period leading up to the 1992 elections
where FORD was a genuinely multiethnic party, this unity did not last long as the party divided
along ethnic lines prior to election day (Throup and Hornsby 1998). Following the examples of
both Kenyatta and Moi, opposition politicians constructed their parties to serve as vehicles to
24 Source: Hornsby 2013: 540 and Elischer 2013: 66, 77
Ethnic'GroupNational'Composition 1993 1998
Kikuyu 21% 1 1Luo 13% 1 1Kalenjin 11% 4 4Luhya 14% 3 4Kamba' 11% 4 3Other 30% 7 10
Totals 20 23
106
empower their own ethnic groups. The number of opposition parties more than doubled from
1992 to 1997 as elites took advantage of lower barriers of entry to establish their own parties.
The declining party nationalization scores from 1992 to 1997 suggest that parties were becoming
increasingly ethnic in nature in Kenya throughout the 1990s Building on the lessons he had
learned from Kenyatta, Moi’s divide-and-rule strategy of ethnic politics strongly influenced the
trajectory of party development in Kenya during this time period.
4.3.4 Economic Conditions: Loosening the Noose
Throughout the 1990s, party politics were inextricably linked to Kenya’s economic
performance. Kenya’s path to political liberalization was somewhat different than that of many
African states during the 1990s. For most African countries during this time period, prolonged
financial crises and economic structural adjustment accelerated the move to multi-party politics
by fermenting public discontent with their incumbent regimes (Bratton and Van de Walle 1997).
Yet while shortages and mass retrenchments led to economically motivated protests throughout
most African countries, “the Kenyan government never braved popular discontent by
implementing unpopular reforms like maize price deregulations” (LeBas 2011: 163). Until the
early 1990s, Kenya, as the regional pro-Western darling of the donor community during the Cold
War, continued to receive substantial amounts of international assistance (over 10% of GDP)
without having to implement serious reforms (World Bank development indicators, year?). Only
after the end of the Cold War did donors suspend aid disbursements in November of 1991 out of
frustration for Kenya’s endemic corruption and shrinking political space (Hornsby….]. While
Moi agreed to reintroduce multiparty politics in large part to receive donor assistance, KANU
plundered public coffers to fund its campaign and other party activities. As a result, GDP growth
107
stagnated and inflation reached a record of 100% by August 199325. Failure to meet donor-
required governance commitments led the IMF and World Bank to stop providing assistance
again in 1997 (ibid).
The Moi administration was forced to implement economic reform measures designed to
liberalize and eventually stabilize the economy, yet Kenya’s economic performance was seen by
most as far below its potential throughout the 1990s. Of note, Kenya’s corruption perception
index score (with 0 being more corrupt and 100 being less corrupt) fell from an abysmal 25 in
1992 to an even worse score of 19 by 1997.26 Rampant corruption, growing inequality, and
soaring inflation all coincided with decreasing political party nationalization scores and
increased legislative electoral volatility in Kenya during the 1990s. Combined with ambiguous
party laws that gave the incumbent an unfair advantage, increasing ethnic polarization, and
presidential leadership that aggressively encouraged ethnic division, these economic conditions
contributed to the increased ethnicization of party politics in Kenya during this time period.
4.4 THE KIBAKI ELECTIONS 2002 AND 2007
While the opposition victory over KANU in 2002 is often viewed as a watershed moment
for the country, in many respects, party politics changed little in Kenya during this time period.
Learning from the mistakes of the 1992 and 1997 general elections, the opposition realized it
needed to remain united in order to beat KANU. In October of 2002, no fewer than 15 opposition
parties joined forces in a “Super Alliance” known as the National Alliance of Rainbow Coalition
(NARC). The major parties in the coalition included the DP, Ford-Kenya, and the United
25 See: http://globaledge.msu.edu/countries/kenya/economy 26 http://www.transparency.org/research/cpi/overview
108
Democratic Movement (UDM) who established the National Alliance of Kenya (NAK) and
eventually joined forces with the newly formed Liberal Democratic Party (LDP) to form
NARC.27 Mwai Kibaki, DP’s party leader and a career politician with decades of experience,
was chosen as NARC’s presidential candidate. Moi, on the other hand, selected Uhuru Kenyatta,
son of the founding president, Jomo Kenyatta, as KANU’s presidential flag bearer. To his credit,
President Moi agreed to step down after completing his term, but appointing Kenyatta as his
successor was a controversial choice that immediately sparked divisions within KANU from
which the party was never able to recover. On election day, Kibaki obtained twice as many
popular votes as Kenyatta (61% to 30%), and NARC obtained 125 out of 210 directly elected
seats in parliament compared to KANU’s 64 seats.28 While NARC trounced KANU at the polls,
its victory was due in large part to infighting within KANU that essentially crippled the once
dominant party (Hornsby 2012, Anderson 2003). Yet the glue that held NARC together would
not last. Defeating KANU proved easier than maintaining a multiethnic government, and by
2005 NARC had collapsed. As discussed in more detail below, the divisions within NARC
would set the stage for the highly controversial 2007 elections that pitted Kibaki, then the leader
of the Party for National Unity (PNU), against Raila Odinga and the Orange Democratic
Movement (ODM). The number of registered parties exploded from 51 in 2002 to more than 300
in 2007. Instead of fostering greater national cohesion in party development, the 2002 NARC
victory contributed to a proliferation of ethnic parties. NARC was the quintessential “coalition of
27 The main parties in NARC included the Democratic Party (DP), FORD-‐Kenya, UDM, and the Liberal Democratic Party (LDP). For a list of all 15 parties in the NARC coalition please see page 757 of the Political Handbook of the World 2012. 28 Official election results as recorded in the African Elections Database: http://africanelections.tripod.com/ke.html
109
convenience” (Horowitz 1985). As soon as they had won the election, party leaders retreated
back to their individual ethnic parties, leading to drastically reduced levels of party
nationalization and skyrocketing electoral volatility. Vertical coordination overwhelmed
horizontal pressures on political elites, and the politics of ethnic divisions persisted throughout
the 2000s. Key factors shaping party development in Kenya during this time period are discussed
and analyzed in more detail below.
4.4.1 Party Laws: Ambiguity and Favoritism Persist
Efforts to implement a new constitution and other legislative reforms failed and,
consequently, party registration and finance laws remained unchanged (and therefore virtually
nonexistent) for both the 2002 and 2007 elections. Like the 1992 and 1997 elections, the
Societies Act (Cap 108) mandated that parties were required to gain registration from the
Register of Societies before presenting candidates for elections. Since no new party specific laws
were enacted, Kibaki controlled the existing laws and the legislative process in much the same
way as his predecessor. A 2006 International IDEA assessment report concluded that:
The Register has the authority to regulate the parties’ activities but in practice he seldom acts, even when the activities of certain parties threaten national cohesion. For instance, some political leaders have openly declared that their parties were founded to facilitate the accession to power or their ethnic groups, or to defend their interest against other groups, but they have been allowed to remain active. There is no legislation governing the internal electoral processes…No legal measures seek to influence the representation of particular groups or regions within political parties. (IDEA 2006:pg. 6-7). Despite all of the reform-oriented lip service, once in power, President Kibaki controlled
party registration just as Moi had done before him. As was the case under Moi, President Kibaki
appointed the Registrar of Societies without needing consent or approval from the opposition.
Like Moi, Kibaki used the Register as a tool to protect his own party. For instance, in advance of
110
the 2007 elections, the Registrar expedited the registration of a splinter faction of KANU and
allowed the “new” party to continue to use KANU’s symbol and colors.29 Likewise, the Registrar
fast-tracked the registration of the Orange Democratic Movement (ODM) to an opportunistic
lawyer with no affiliation to the party at that time.30 Regime-friendly parties were granted
registration easily while those deemed a threat faced obstacles to entry. Moreover, while parties
did not officially receive funding from the state, “the ruling NARC coalition had the advantage
of incumbency. There were numerous cases of misuse and misappropriation of state resources or
public facilities by candidates for the ruling party, especially the presidential candidate and
cabinet ministers.31” Since no legal provisions regulated the source of party funding or set
limitations on the amount parties and candidates could spend on activities, the cost of election
campaigns skyrocketed in Kenya throughout the 2000s (ibid: 10). Despite discussions about
introducing party specific laws during Kibaki’s presidency, no new centripetal or majoritarian
legal measures were implemented for either the 2002 or 2007 elections. Just as KANU had done
before it, NARC and then PNU took advantage of incumbency by controlling the legislative
process, perpetuating the status quo pertaining to party laws, and misallocating state resources to
gain an advantage over the opposition.
29 See page 6: http://www.idea.int/parties/upload/Kenya%20laid%20out.pdf 30 "Orange team up in arms over party’s registration" The East African Standard, 29 December 2005 31 ibid: pg. 10
111
4.4.2 Demographics: The Mount Kenya Mafia Strikes Back
Ethnicity remained the key demographic factor influencing political party development
throughout the 2000s. Party politics continued to be highly ethnicized in both the 2002 and 2007
elections. While the Kenya 2002 elections have high party nationalization scores, this is
misleading as the winning NARC coalition contained numerous parties. Although officially
registered as a political party in order to participate in the 2002 elections, the 15 parties within
NARC retained their independence. Indeed, NARC’s very constitution mandated that the entity
was a coalition of parties and that, as such, only parties and not individuals could join (Hornsby
2012:719). This is important because while the opposition was able to come together and form a
multiethnic electoral coalition, NARC was still comprised of a loose conglomeration of ethnic
parties. Just as was the case in 1992 and 1997, party leaders acted as ethnic brokers in charge of
securing the votes of their co-ethnics. DP remained a Kikuyu party with Kibaki as its ethnic
champion, FORD-Kenya was a Luhya party with Michael Wamalwa at its head, LDP was a Luo
party with Raila Odinga as its leader, FORD-People had become a Kisii party with Simeon
Nyachae as its presidential candidate, and so on. While they were able to rally together and agree
on Kibaki as their presidential candidate, party leaders within NARC continued to openly
champion the interests of their own ethnic groups (Hornsby 2012; Branch 2011; IDEA 2005
report). The parliamentary election results detailed in Table 4.7 below further highlight the
ongoing ethnic nature of party politics in 2002:
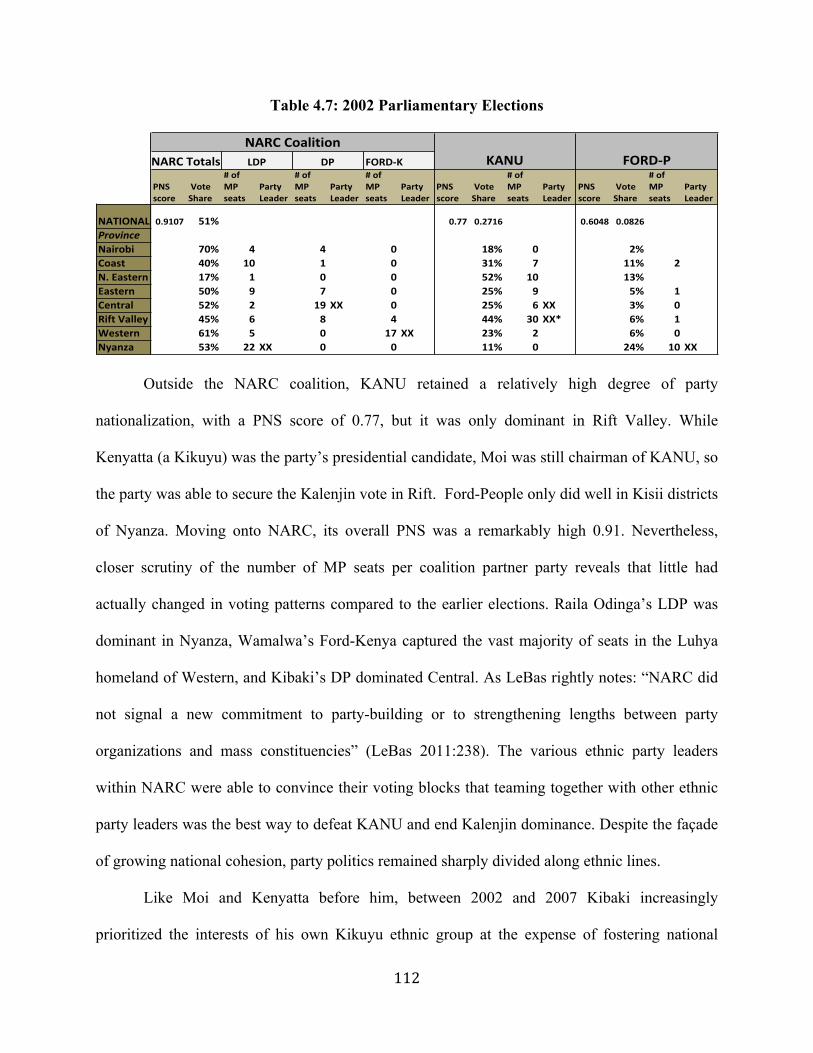
112
Table 4.7: 2002 Parliamentary Elections
Outside the NARC coalition, KANU retained a relatively high degree of party
nationalization, with a PNS score of 0.77, but it was only dominant in Rift Valley. While
Kenyatta (a Kikuyu) was the party’s presidential candidate, Moi was still chairman of KANU, so
the party was able to secure the Kalenjin vote in Rift. Ford-People only did well in Kisii districts
of Nyanza. Moving onto NARC, its overall PNS was a remarkably high 0.91. Nevertheless,
closer scrutiny of the number of MP seats per coalition partner party reveals that little had
actually changed in voting patterns compared to the earlier elections. Raila Odinga’s LDP was
dominant in Nyanza, Wamalwa’s Ford-Kenya captured the vast majority of seats in the Luhya
homeland of Western, and Kibaki’s DP dominated Central. As LeBas rightly notes: “NARC did
not signal a new commitment to party-building or to strengthening lengths between party
organizations and mass constituencies” (LeBas 2011:238). The various ethnic party leaders
within NARC were able to convince their voting blocks that teaming together with other ethnic
party leaders was the best way to defeat KANU and end Kalenjin dominance. Despite the façade
of growing national cohesion, party politics remained sharply divided along ethnic lines.
Like Moi and Kenyatta before him, between 2002 and 2007 Kibaki increasingly
prioritized the interests of his own Kikuyu ethnic group at the expense of fostering national
! FORD%K
PNS*score
*Vote*Share
#*of*MP*seats
Party*Leader
#*of*MP*seats
Party*Leader
#*of*MP*seats
Party*Leader
PNS*score
*Vote*Share
#*of*MP*seats
Party*Leader
PNS*score
*Vote*Share
#*of*MP*seats
Party*Leader
NATIONAL 0.9107 51% 0.77 0.2716 0.6048 0.0826ProvinceNairobi 70% 4 4 0 18% 0 2%Coast 40% 10 1 0 31% 7 11% 2N.*Eastern 17% 1 0 0 52% 10 13%Eastern 50% 9 7 0 25% 9 5% 1Central 52% 2 19 XX 0 25% 6 XX 3% 0Rift*Valley 45% 6 8 4 44% 30 XX* 6% 1Western 61% 5 0 17 XX 23% 2 6% 0Nyanza 53% 22 XX 0 0 11% 0 24% 10 XX
NARC*CoalitionKANU FORD%PNARC*Totals LDP DP
113
cohesion. Kibaki’s top advisors primarily hailed from the Gi-Kikuyu, Embu, and Meru (GEMA)
tribes of the Mount Kenya region of Central Province (Hornsby 2012: 711-714). This tight group
of GEMA advisors constantly surrounding Kibaki became known as the “Mount Kenya
Mafia.”32 These wealthy GEMA businessmen bankrolled Kibaki’s 2002 and 2007 campaigns and
gained a reputation for being arrogant and antagonistic of Kibaki’s coalition partners (ibid, BBC
2008, Hornsby 2012, Wrong 2009). The “mafia” became increasingly wealthy and powerful,
which contributed to growing mistrust between Kibaki and his coalition partners – most notably
Raila Odinga of LDP. As one Kenyan political analyst put it, “They [‘Mount Kenya Mafia’]
have realized good profits during his [Kibaki’s] rule and letting go to an individual they do not
trust sends chill down their spine.”33 Just as the Kalenjin had feared they would lose their
political power should a non-Kalenjin be elected president, the GEMA feared that reducing the
powers of the President by giving into the demands of the NARC coalition partners would
disenfranchise the Kikuyu. Even after shaking up his cabinet by firing some GEMA advisors in
the lead up to the 2007 elections, Kibaki preserved the culture of ethnic favoritism, and cronyism
and corruption remained rampant under his administration. Kibaki, like Moi and Kenyatta before
him, had perpetuated the “it is our turn to eat” mentality that mandated that the president’s tribe
be entitled to more privileges than others (Wrong 2009). As such, vertical coordination pressures
remained more powerful than horizontal pressures, and divisive ethnic party politics continued to
flourish during this time period.
32 See BBC News 04/14/2006 “Kibaki’s mafia on the run”. 33 Haroun Ndubi as quoted in the BBC’s January 21, 2008 article “Kenya’s ‘mafia’ feel the heat”
114
4.4.3 Historical Legacy: Nothing-Actually-Really-Changed
Frustrated and disappointed by the first two years of Kibaki’s presidency, a veteran
Kenyan reformer remarked “We now know what ‘NARC” means, Nothing-Actually-Really-
Changed!34 The quote succinctly captures the sentiment that party leadership continued as
“business as usual” under NARC. NARC had campaigned on the pledge of implementing a new
constitution within 100 days of obtaining power, yet this promise never came to fruition as deep
philosophical differences contributed to the coalition’s early demise. Rifts within NARC
widened immediately after its ascension to power and the early optimism surrounding the
multiethnic coalition quickly waned. While Kibaki did not create a cult of personality like Moi
and allowed for more political space (Hornsby 2012, Chege 2007), his leadership style and
policies failed to foster greater national cohesion. Instead of becoming stronger, more widely
representative institutions, most political parties became little more than empty shells for ethnic
leaders to use as bargaining chips for contesting elections. Kibaki helped set the trajectory of
party development between these elections by unceremoniously dropping NARC and
establishing the Party of National Unity (PNU) as a new coalition of parties for which to contest
the 2007 elections. All the while, the DP insisted that Kibaki was still a member.35 Politicians’
fluid, often simultaneous, relationships of convenience with multiple parties were increasingly
common throughout the 2000s. As discussed in more detail below, additional vertical
coordination pressures on politicians led to an explosion in the number of registered parties in
Kenya between 2002 and 2007, as alliances shifted and politics became increasingly volatile.
34 Timothy Njoya as quoted in Daniel Branch’s (2011), pg. 258 35 During interviews with the author, several members of DP insisted that Kibaki was still a member (and ultimately defacto leader) of the DP despite the President’s association with NARC and later PNU.
115
Kibaki proved less eager to implement constitutional reforms after becoming president,
and like Kenyatta and Moi before him, he protected the broad powers granted to the presidency
and worked to maintain the strong central authority of the state. The opposition had regularly
campaigned for reduced powers of the president and a more decentralized state that gave
additional authority to regional administrations instead of State House in Nairobi (Hornsby 2012,
Branch 2011). This form of federalism was often referred to as “Majimboism” in Kenya. Raila
Odinga of LDP fervently campaigned for these constitutional reforms in 2002. After NARC had
won the 2002 elections, it initially looked likely that Kenya would implement major reforms that
would reduce the power of the presidency and institute some level of devolution. Once in power,
however, Kibaki reneged on earlier agreements with Odinga and other coalition partners by
derailing efforts to establish the position of Prime Minister and balking on provisions to give
more authority to the provinces.36 In December 2003, Kibaki attempted to suppress the infighting
within NARC by calling for new party elections to transform the coalition into a single party.
LDP and FORD-Kenya boycotted these elections, however, and infighting within NARC
intensified in the lead up to the November 2005 constitutional referendum. Under Kibaki’s
leadership, the proposed new constitution did little to either curtail the level of power to the
president or to devolve power from the central government to the provinces. Odinga effectively
rallied support against the referendum, and a 58% majority of Kenyan voters rejected the 2005
constitution at the polls. Both leaders would eventually create new umbrella coalition parties to
serve as their electoral vehicles; thus, Odinga and Kibaki would eventually compete against one
another again for the presidency in 2007.
36 Branch 2012 and Political Handbook of the World 2012
116
Just five years after the most peaceful elections in Kenya’s multiparty history, the 2007
elections led to a political and humanitarian crisis that brought the country to the very brink of
civil war. Building on the momentum of the 2005 constitutional referendum and drawing lessons
from the 2002 opposition victory, a number of political leaders agreed to join forces to compete
against Kibaki. These political leaders from various ethnic groups included: Raila Odinga (Luo),
Uhuru Kenyatta (Kikuyu), Kalonzo Musyoka (Kamba), Musalia Mudavadi (Luhya), William
Ruto (Kalenjin), Joseph Nyagah (Kikuyu), and Najib Balala (Swahili). Factional infighting
erupted shortly after ODM’s inception. Employing Moi-like divide-and-conquer strategies,
Kibaki convinced Kenyatta and KANU to leave ODM. After a protracted struggle for control of
the coalition, Musyoka also left the “original” ODM and formed ODM-Kenya.37 Despite these
defections, ODM appeared poised to gain control of the government, as the remaining five
candidates became known as the “pentagon” and nominated Raila Odinga as the party’s
presidential candidate. Nevertheless, ODM’s institutional structure and party leadership
remained weak, as the coalition consisted more of a loose conglomeration of ethnic brokers than
disciplined and loyal party supporters.38 While ODM could hardly be considered a strong party,
Kibaki waited until September 16, just three months before the December elections, to announce
that he would seek reelection under the banner of the newly created Party of National Unity
(PNU). NARC was simply a vehicle to win the 2002 elections, and when Kibaki’s efforts to
transform the coalition into a single party failed, he simply disassociated himself from it and
formed an entirely new umbrella party to compete in the 2007 elections.
37 See BBC 2007/08/15: http://news.bbc.co.uk/go/pr/fr/-/2/hi/africa/6947576.stm 38 See Political Handbook of the World 2012: 757
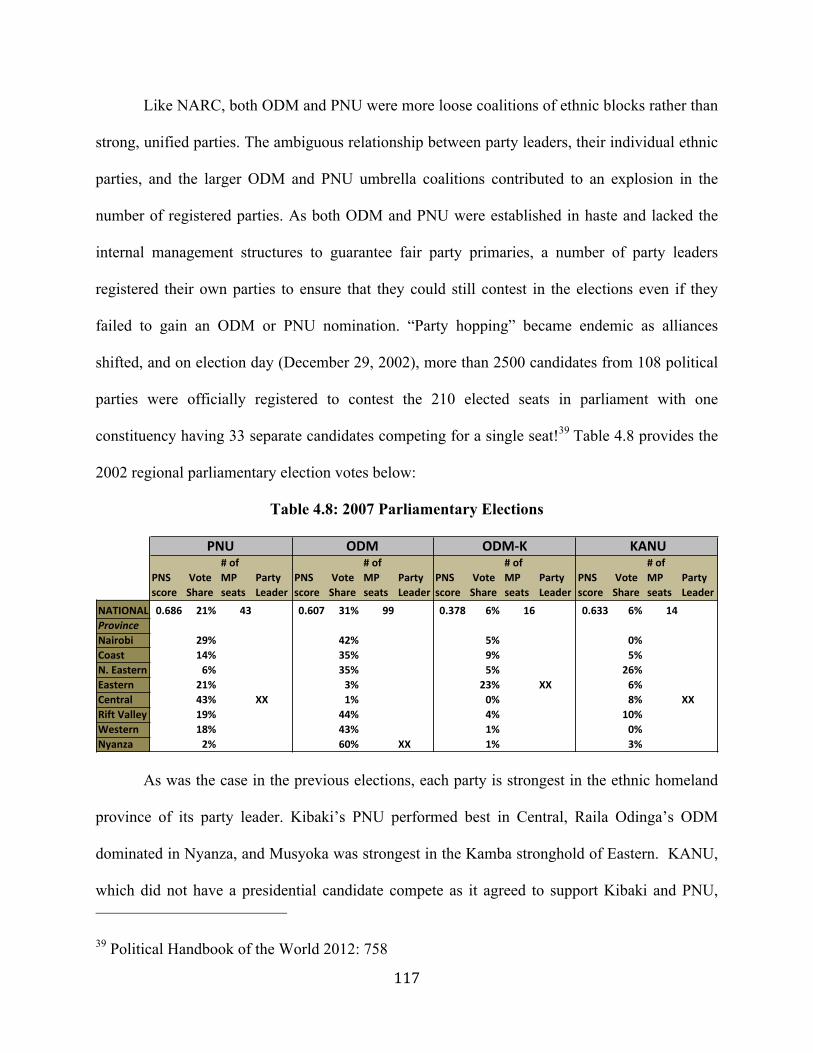
117
Like NARC, both ODM and PNU were more loose coalitions of ethnic blocks rather than
strong, unified parties. The ambiguous relationship between party leaders, their individual ethnic
parties, and the larger ODM and PNU umbrella coalitions contributed to an explosion in the
number of registered parties. As both ODM and PNU were established in haste and lacked the
internal management structures to guarantee fair party primaries, a number of party leaders
registered their own parties to ensure that they could still contest in the elections even if they
failed to gain an ODM or PNU nomination. “Party hopping” became endemic as alliances
shifted, and on election day (December 29, 2002), more than 2500 candidates from 108 political
parties were officially registered to contest the 210 elected seats in parliament with one
constituency having 33 separate candidates competing for a single seat!39 Table 4.8 provides the
2002 regional parliamentary election votes below:
Table 4.8: 2007 Parliamentary Elections
As was the case in the previous elections, each party is strongest in the ethnic homeland
province of its party leader. Kibaki’s PNU performed best in Central, Raila Odinga’s ODM
dominated in Nyanza, and Musyoka was strongest in the Kamba stronghold of Eastern. KANU,
which did not have a presidential candidate compete as it agreed to support Kibaki and PNU, 39 Political Handbook of the World 2012: 758
!
PNS!score
!Vote!Share
#!of!MP!seats
Party!Leader
PNS!score
!Vote!Share
#!of!MP!seats
Party!Leader
PNS!score
!Vote!Share
#!of!MP!seats
Party!Leader
PNS!score
!Vote!Share
#!of!MP!seats
Party!Leader
NATIONAL 0.686 21% 43 0.607 31% 99 0.378 6% 16 0.633 6% 14ProvinceNairobi 29% 42% 5% 0%Coast 14% 35% 9% 5%N.!Eastern 6% 35% 5% 26%Eastern 21% 3% 23% XX 6%Central 43% XX 1% 0% 8% XXRift!Valley 19% 44% 4% 10%Western 18% 43% 1% 0%Nyanza 2% 60% XX 1% 3%
PNU ODM ODMPK !KANU
118
failed to gain the highest proportion of votes in a single province. Neither Kibaki nor Odinga
chose to strengthen their individual parties as both opted to follow the NARC model by forming
loose umbrella coalitions of ethnic parties solely built to contest elections. Not surprisingly, this
strategy increased vertical coordination pressures on politicians by encouraging them to build
their own “briefcase” ethnic parties that are “formed not to compete for power but rather for
speculation purposes as disagreements and splits arise in the major parties” (Murunga and
Nasong’o 2007: 102).
Much has been written about Kenya’s post-2007 election violence (see: Waki report,
Barkan 2013a, Branch 2011, Hornsby 2012), but the main point here is that the nature of party
politics had not fundamentally changed, as politicians continued to form their parties on the basis
of ethnic constituencies (Barkan 2013b). While election day itself was overwhelmingly peaceful,
the country erupted into violence after the Electoral Commission of Kenya declared Kibaki the
winner. Odinga rejected the official results, accusing Kibaki of electoral manipulation after both
domestic and international observers declared the vote counting flawed.40 In the weeks that
followed, approximately 1500 were murdered and up to 600,000 were displaced (BBC 2008,
Barkan 2013). After intense international pressure and months of negotiation, The National
Accord and Reconciliation Act of 2008 ended the violence by establishing a government of
national unity. Table 4.9 below presents the ethnic compositions of Kibaki’s cabinets:
40 See European Union 2008, International republican Institute 2008, and Gibson and Long 2009
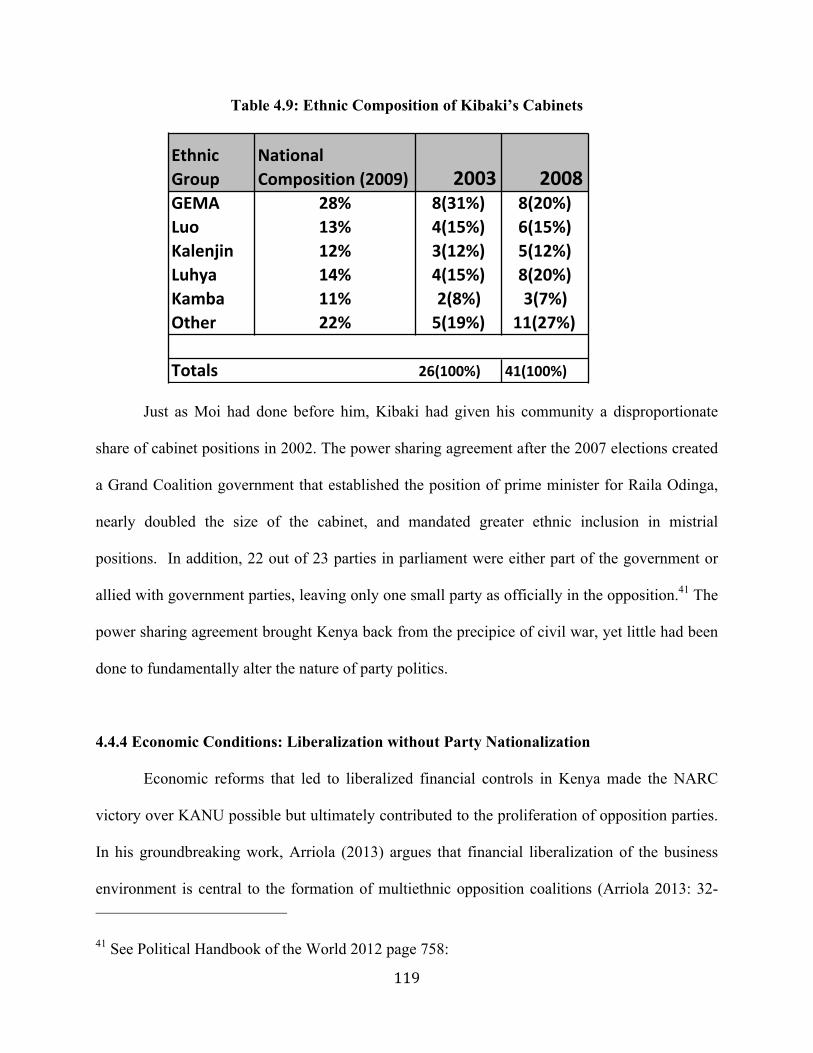
119
Table 4.9: Ethnic Composition of Kibaki’s Cabinets
Just as Moi had done before him, Kibaki had given his community a disproportionate
share of cabinet positions in 2002. The power sharing agreement after the 2007 elections created
a Grand Coalition government that established the position of prime minister for Raila Odinga,
nearly doubled the size of the cabinet, and mandated greater ethnic inclusion in mistrial
positions. In addition, 22 out of 23 parties in parliament were either part of the government or
allied with government parties, leaving only one small party as officially in the opposition.41 The
power sharing agreement brought Kenya back from the precipice of civil war, yet little had been
done to fundamentally alter the nature of party politics.
4.4.4 Economic Conditions: Liberalization without Party Nationalization
Economic reforms that led to liberalized financial controls in Kenya made the NARC
victory over KANU possible but ultimately contributed to the proliferation of opposition parties.
In his groundbreaking work, Arriola (2013) argues that financial liberalization of the business
environment is central to the formation of multiethnic opposition coalitions (Arriola 2013: 32- 41 See Political Handbook of the World 2012 page 758:
Ethnic'Group
National'Composition'(2009) 2003 2008
GEMA 28% 8(31%) 8(20%)Luo 13% 4(15%) 6(15%)Kalenjin 12% 3(12%) 5(12%)Luhya 14% 4(15%) 8(20%)Kamba' 11% 2(8%) 3(7%)Other 22% 5(19%) 11(27%)
Totals ' 26(100%) 41(100%)
120
38). Using both cross-national analyses and in-depth case studies of Kenya and Cameroon, he
shows that opposition politicians are more likely to build multiethnic coalitions after incumbents
have lost their ability to blackmail the business sector through financial reprisals. According to
Arriola, NARC’s 2002 victory would not have been possible had Moi been able to continue his
closed economic policies. Arriola is right in that the business community (particularly the
GEMA Mount Kenya mafia) provided the funding that made the NARC victory possible. After
complying with intense international pressure to liberalize the economy, KANU had lost its
monopoly and could no longer control the business class. Increased economic space enabled
political entrepreneurs more freedom and flexibility to finance opposition campaigns. Kibaki
continued implementing reforms after replacing Moi and economic performance improved
steadily, with real GDP rising from 2.8% in 2003 to 7.0% in 2007 and per capita GDP nearly
doubling from $398 in 2002 to $721 in 2007.42 Nevertheless, corruption remained rampant in
Kibaki’s administration (Wrong 2009), and Kenya stayed one of the most corrupt countries on
the planet.43 This booming economic growth in the face of blatant corruption highlights the
complexities of Kenya’s political economy.
Kenya’s liberalized financial reforms were a double-edged sword to party development
there in the 2000s. On the one hand, economic reforms made the NARC victory possible, yet
liberalized financial controls certainly did not guarantee long-term multiethnic cohesion, as the
coalition essentially imploded immediately after elections. Businessmen were more likely to
fund their co-ethnics, leading to the increased ethnic polarization of party politics. In addition,
42 http://globaledge.msu.edu/countries/kenya/economy and World Bank global development indicators 43 Kenya’s corruption perception index score barely moved from 19 in 2002 to 21 in 2007
121
with no regulations in place to impose ceilings on election campaigns or to regulate the sources
of funding, the cost of elections began skyrocketing in 2002. Not surprisingly, the number of
political parties also exploded during this time period, as opportunistic entrepreneurs took
advantage of every opportunity to exploit ambitious politicians or to control government. While
isolating the precise influence of economic conditions on party development is challenging, the
liberalized financial reforms in combination with the other institutional, demographic, and
historical factors discussed above contributed to the proliferation of ethnic parties during this
time period.
4.5 CONCLUSIONS
The party system in Kenya experienced a dangerous trend of plunging levels of party
nationalization and soaring electoral volatility between 1992 and 2007. A complex interaction of
institutional, demographic, historical, and economic factors gave rise to this mechanism of
increased the vertical coordination pressures on politicians. Both Moi and Kibaki took advantage
of incumbency to exploit the ambiguity of the Societies Act to deepen divisions within the
opposition. This legislative environment increased vertical coordination pressures because
multiethnic opposition parties were viewed as a threat and were regularly denied registration or
faced other barriers to entry. As is the case with so many African countries, Kenya is a
multiethnic society. Whereas some countries have been able to transcend ethnic differences,
however, the ethnic polarization of party politics increased sharply in Kenya, culminating in near
civil war after the 2007 elections. Like Moi and Kenyatta before him, Kibaki prioritized the
demands of his co-ethnics over the welfare of the country as a whole. By promoting ethnic
favoritism, both Moi and Kibaki increased vertical coordination by perpetuating a culture of
122
tribal cronyism in which politicians were expected to provide for their co-ethnics even at the
expense of national wellbeing. As such, the policies of tribal favoritism led to more corruption
and increased vertical coordination pressures on politicians by making it difficult to establish
multiethnic parties. Finally, while economic reforms had paved the way for opposition parties to
obtain funds from the business community, financial liberalization did nothing to guarantee
multiethnic cohesion. The distinction between coalitions of ethnic parties and multiethnic
national parties is an important one. While Arriola (2012) is right in that the liberalized economic
environment made it possible for a multiethnic coalition to finally beat KANU, NARC was a
collection of ethnic parties rather than a national political party. Not surprisingly, businessmen
were more likely to fund co-ethnic politicians, further increasing vertical coordination pressures
on politicians by making it more difficult to fund multiethnic parties. In conjunction, all of these
factors combined to increase ethnic polarization in party politics in Kenya during this time
period.
Ultimately, the increased vertical pressures overpowered horizontal coordination
pressures and discouraged politicians from investing in stronger, more organizationally robust
multiethnic parties. While the lauded 2002 opposition victory appeared to buck this trend, closer
examination reveals that the NARC was a loose umbrella coalition of several ethnic parties that
briefly came together with the common goal of defeating KANU. After the demise of KANU,
politicians used parties strictly as vehicles for electoral competition, and little effort or resources
were devoted to building strong, enduring parties. During this time period, politicians often
belonged to more than one party at the same time and rarely competed under the same party
ticket over multiple elections. While coalitions of ethnic parties became increasingly common,
multiethnic political parties had become an endangered species by 2007. In retrospect, it is not
123
surprising that Kenya descended into violence so quickly after the 2007 elections ,considering
the increasingly ethnicized and fragmented condition of Kenya’s party system by then.
Fortunately, Kenya was able to pull itself back from the brink of civil war, and
substantial reforms were implemented in advance of the 2013 elections. Kenyans enacted the
most ambitious and sweeping political party legislation in the country’s history on November 1,
2011. Just a few short years after the 2007-2008 post-election violence, the explicit goal of the
Political Parties Act 2011 (PPA 2011) was to eliminate ethnic-based political parties by
encouraging the development of more nationally representative parties. Would the new
legislation achieve its intended goals? What influence, if any, would the PPA 2011 have on
political party development? Would the 2013 elections be less ethnically polarized than previous
elections or would the level of party system nationalization continue to decrease as ethnic
volatility increases? These, and other, questions are addressed in Chapter 5.
124
CHAPTER 5: KENYA’S 2013 ELECTIONS AND THE LIMITS OF INSTITUTIONAL ENGINEERING
5.1 INTRODUCTION
On November 1, 2011 Kenyans enacted the most ambitious and sweeping political party
legislation in the country’s history. Desperate to avoid the widespread violence that brought the
country to the brink of civil war after the 2007 elections, the environment was ripe for reform in
the lead up to the 2013 elections. In stark contrast to the ambiguous laws of the past, the Political
Parties Act 2011 (PPA 2011) finally established detailed political party registration and finance
laws. Proponents of the PPA 2011, including Justice and Constitutional Affairs Minister Mutula
Kilonzo, argued that the new law “is the only way to eliminate tribalism, political party
mandarins who set up political parties based on tribe.” He asserted that, “…a lot of existing
political parties will die, but out of the ashes of their death other parties will arise that reflect all
the good things the nation has craved for.”44 Leaders of Kenya’s smaller parties45, on the other
hand, held a very different view of the PPA 2011. Koigi wa Wamwere, chairman of the small
Chama Cha Mwananchi party alleged "the drafters of this law wanted to have few political
parties competing for power. It is punitive to smaller parties and not accommodative within the
spirit for which we fought for pluralism."46 Regardless of the motivations behind the new
44 As quoted to Capital FM on November 2, 2011: http://www.capitalfm.co.ke/news/2011/11/30621/ 45 This project classifies “small” parties as those that garner less than 5% of the vote share in parliament and “large” parties as those that garner at least 5% of the vote share in parliament. 46 Daily Nation, October 29 2011: http://allafrica.com/stories/201110311047.html
125
regulations, the explicit goal of the PPA 2011 was to eliminate ethnic-based political parties by
encouraging the development of more nationally representative parties (Lansner 2012: 7).
Despite its intended goals, however, this attempt to engineer a more national party system failed
as party politics became even more ethnicized and fragmented in 2013. As such, Kenya’s 2013
elections is an important case study for exploring both the limitations of institutional engineering
and the influence of formal regulations on political party development.
Why did the PPA 2011 fail to establish a more national party system in Kenya in advance
of the 2013 elections? What factors contributed to the lower levels of party system
nationalization and deepening ethnicization of party politics in 2013? More broadly, under what
conditions are party laws likely to be effective? This chapter addresses these questions through
an in-depth analysis of political party development in advance of Kenya’s 2013 elections. From
2010 to 2013, I conducted more than a year of fieldwork in Kenya to contribute to this analysis. I
interviewed more than 50 party leaders, activists, academics, and international experts. I also
attended campaign rallies, participated in multi-party conferences and workshops, and observed
focus groups throughout the country. This primary data is complemented by evaluation of
detailed election results and secondary sources including public opinion data, historical studies,
archival materials, non-governmental organization (NGO) reports, and news articles.
The evidence presented in this chapter suggests that PPA 2011 failed because it did not
produce adequate horizontal coordination pressure on politicians to compel them to build
national rather than ethnic parties. While the highly prescriptive and specific content of the law
was sound, the very aspects of the law that were designed to build national parties were not
enforced. More importantly however, Kenyans’ fear of other ethnic communities overpowered
their demand for national parties. Party leaders exploited this fear by building ethnic parties that
126
highlighted both the rewards that co-ethnics would face if their party would win and the dangers
they would face if an “ethnic outsider” or “other” would win. Ultimately this tactic proved
effective in encouraging high voter turnout of co-ethnics and Kenyans voted primarily along
ethnic lines. Nevertheless, viewing Kenya’s 2013 elections as mere ethnic census would be a
mistake as the evidence in this chapter highlights the complexity of Kenyan party development.
The remainder of the chapter is divided into four additional sections. Part 2 analyzes
detailed election results to put the 2013 elections in their proper historical context. Numerous
party-system and party-level indicators that compare the most recent election to previous
elections show that there was no fundamental change in the nature of multiparty politics in 2013.
Part 3 introduces a broad theoretical framework for assessing whether party laws are likely to
encourage the development of national parties in Africa. Part 4 applies this framework to the
PPA 2011 by evaluating data from public opinion surveys, interviews, and focus group
discussions (FGDs) conducted during Kenya’s 2013 election campaign. Finally, the conclusions
are provided in Part 5.
5.2 THE TREND CONTINUES IN 2013
Despite the PPA 2011, Kenya’s party system experienced lower levels of nationalization
in 2013 as political parties continued to become even more ethnicized, increasingly volatile, and
fragmented. As discussed in Chapter 4, Kenya’s level of party system nationalization shrank as
multiparty politics became increasingly ethnicized between 1992 and 2007. The PPA 2011
attempted to reverse this trend by formally outlawing ethnic parties and erecting steeper barriers
of entry to parties through more stringent registration laws. Below, Table 5.1 provides key party
system level indicators from 1992 to 2013:
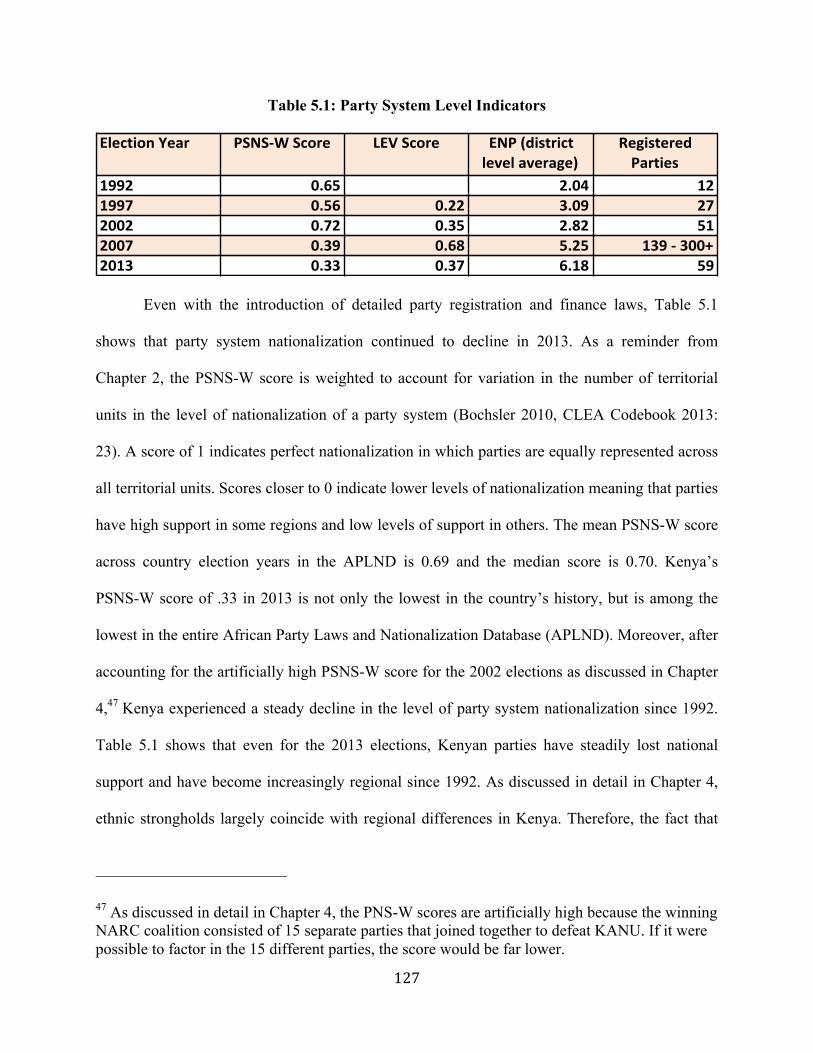
127
Table 5.1: Party System Level Indicators
Even with the introduction of detailed party registration and finance laws, Table 5.1
shows that party system nationalization continued to decline in 2013. As a reminder from
Chapter 2, the PSNS-W score is weighted to account for variation in the number of territorial
units in the level of nationalization of a party system (Bochsler 2010, CLEA Codebook 2013:
23). A score of 1 indicates perfect nationalization in which parties are equally represented across
all territorial units. Scores closer to 0 indicate lower levels of nationalization meaning that parties
have high support in some regions and low levels of support in others. The mean PSNS-W score
across country election years in the APLND is 0.69 and the median score is 0.70. Kenya’s
PSNS-W score of .33 in 2013 is not only the lowest in the country’s history, but is among the
lowest in the entire African Party Laws and Nationalization Database (APLND). Moreover, after
accounting for the artificially high PSNS-W score for the 2002 elections as discussed in Chapter
4,47 Kenya experienced a steady decline in the level of party system nationalization since 1992.
Table 5.1 shows that even for the 2013 elections, Kenyan parties have steadily lost national
support and have become increasingly regional since 1992. As discussed in detail in Chapter 4,
ethnic strongholds largely coincide with regional differences in Kenya. Therefore, the fact that
47 As discussed in detail in Chapter 4, the PNS-W scores are artificially high because the winning NARC coalition consisted of 15 separate parties that joined together to defeat KANU. If it were possible to factor in the 15 different parties, the score would be far lower.
Election)Year PSNS0W)Score LEV)Score ENP)(district)level)average)
Registered)Parties
1992 0.65 2.04 121997 0.56 0.22 3.09 272002 0.72 0.35 2.82 512007 0.39 0.68 5.25 139)0)300+2013 0.33 0.37 6.18 59
128
Kenyan parties have become increasingly regional suggests that support for ethnic rather than
national parties has also increase.
Increased legislative electoral volatility (LEV) accompanies the decreasing levels of party
system nationalization since 1992. As discussed in Chapter 2, the APLND uses Pedersen’s Index
of Volatility to calculate legislative electoral volatility scores. Pedersen’s Index measured the net
change in each party’s seat or vote share from election to election by summing the net change in
the percentage of seats won or lost (or vote share) by all the parties and dividing by two
(Pedersen 1979; Mainwaring and Scully 1995, Kuenzi and Lambright 2001). LEV scores close
to 0 indicate low levels of volatility while scores close to 1 indicate high levels of volatility. The
mean LEV score in the APLND is 0.25 while the median is 0.14. While lower than the
astronomical LEV score of 0.68 in 2007, Kenya’s 2013 LEV score of 0.37 is the country’s
second highest and far above the APLND mean and median scores across country election years.
The high LEV scores show that parties remained highly fragmented in 2013 as new parties
entered the electoral arena and established parties were unable to maintain support from voters
over multiple elections.
In addition, Kenya experienced dramatic increases in both the effective number of parties
(ENP) and the number of actual registered parties since 1992. As discussed in more detail in
Chapter 2, the average effective number of parties (ENP-A) is calculated at the constituency
level following Laakso and Taagepera’s (1979) specification and then averaged at the national
level. This indicator provides an adjusted number of parties in the party system by weighting the
count by the relative electoral strength of the party. The mean APNLD ENP-A score across
country election years is 3.01 while the median score is 2.32. The ENP-A has tripled in Kenya
from 2.04 in 1992 to 6.18 in 2013. The rise in ENP coincides with the increase in the number of
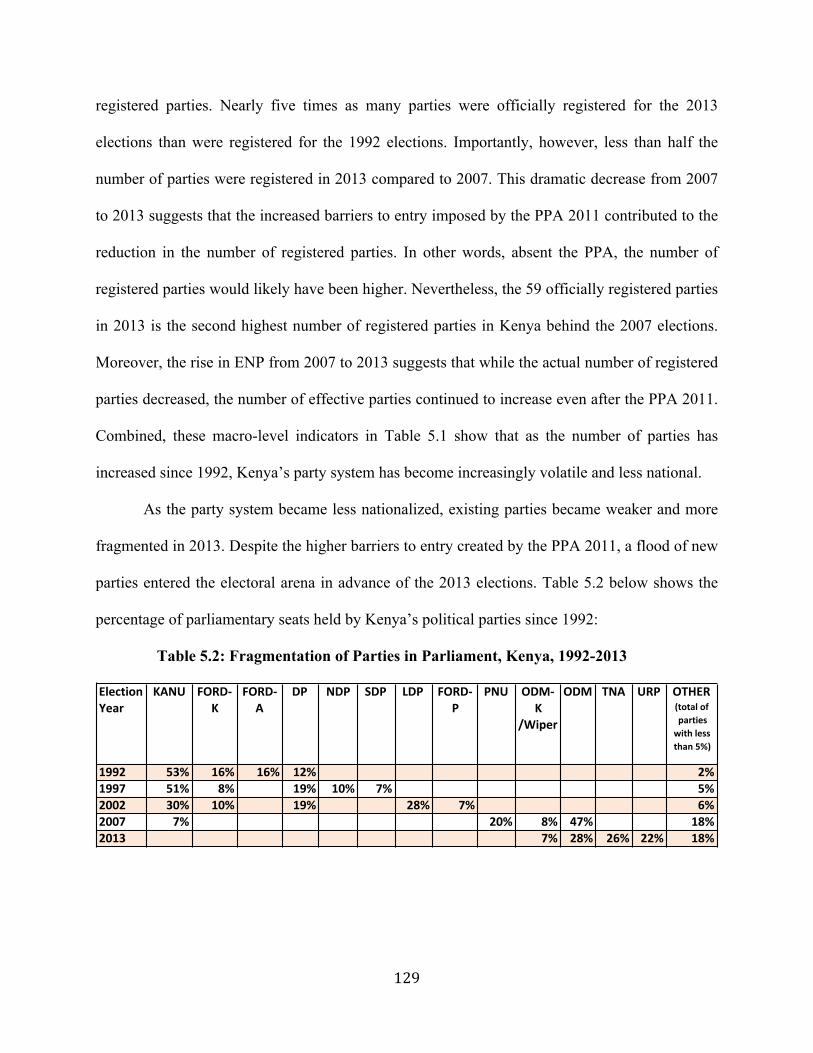
129
registered parties. Nearly five times as many parties were officially registered for the 2013
elections than were registered for the 1992 elections. Importantly, however, less than half the
number of parties were registered in 2013 compared to 2007. This dramatic decrease from 2007
to 2013 suggests that the increased barriers to entry imposed by the PPA 2011 contributed to the
reduction in the number of registered parties. In other words, absent the PPA, the number of
registered parties would likely have been higher. Nevertheless, the 59 officially registered parties
in 2013 is the second highest number of registered parties in Kenya behind the 2007 elections.
Moreover, the rise in ENP from 2007 to 2013 suggests that while the actual number of registered
parties decreased, the number of effective parties continued to increase even after the PPA 2011.
Combined, these macro-level indicators in Table 5.1 show that as the number of parties has
increased since 1992, Kenya’s party system has become increasingly volatile and less national.
As the party system became less nationalized, existing parties became weaker and more
fragmented in 2013. Despite the higher barriers to entry created by the PPA 2011, a flood of new
parties entered the electoral arena in advance of the 2013 elections. Table 5.2 below shows the
percentage of parliamentary seats held by Kenya’s political parties since 1992:
Table 5.2: Fragmentation of Parties in Parliament, Kenya, 1992-2013
Election)Year
KANU FORD5K
FORD5A
DP NDP SDP LDP FORD5P
PNU ODM5K)
/Wiper
ODM TNA URP OTHER)(total)of)parties))with)less)than)5%))
1992 53% 16% 16% 12% ) ) 2%1997 51% 8% ) 19% 10% 7% 5%2002 30% 10% 19% 28% 7% 6%2007 7% 20% 8% 47% ) ) 18%2013 ) 7% 28% 26% 22% 18%
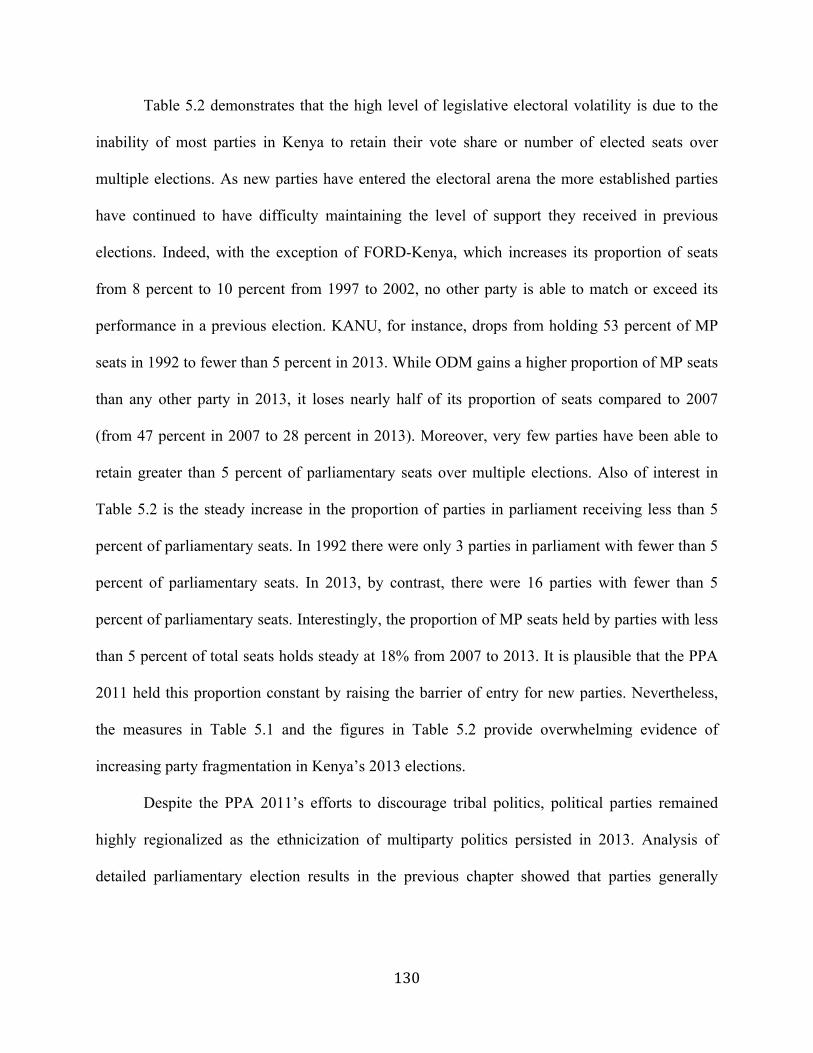
130
Table 5.2 demonstrates that the high level of legislative electoral volatility is due to the
inability of most parties in Kenya to retain their vote share or number of elected seats over
multiple elections. As new parties have entered the electoral arena the more established parties
have continued to have difficulty maintaining the level of support they received in previous
elections. Indeed, with the exception of FORD-Kenya, which increases its proportion of seats
from 8 percent to 10 percent from 1997 to 2002, no other party is able to match or exceed its
performance in a previous election. KANU, for instance, drops from holding 53 percent of MP
seats in 1992 to fewer than 5 percent in 2013. While ODM gains a higher proportion of MP seats
than any other party in 2013, it loses nearly half of its proportion of seats compared to 2007
(from 47 percent in 2007 to 28 percent in 2013). Moreover, very few parties have been able to
retain greater than 5 percent of parliamentary seats over multiple elections. Also of interest in
Table 5.2 is the steady increase in the proportion of parties in parliament receiving less than 5
percent of parliamentary seats. In 1992 there were only 3 parties in parliament with fewer than 5
percent of parliamentary seats. In 2013, by contrast, there were 16 parties with fewer than 5
percent of parliamentary seats. Interestingly, the proportion of MP seats held by parties with less
than 5 percent of total seats holds steady at 18% from 2007 to 2013. It is plausible that the PPA
2011 held this proportion constant by raising the barrier of entry for new parties. Nevertheless,
the measures in Table 5.1 and the figures in Table 5.2 provide overwhelming evidence of
increasing party fragmentation in Kenya’s 2013 elections.
Despite the PPA 2011’s efforts to discourage tribal politics, political parties remained
highly regionalized as the ethnicization of multiparty politics persisted in 2013. Analysis of
detailed parliamentary election results in the previous chapter showed that parties generally
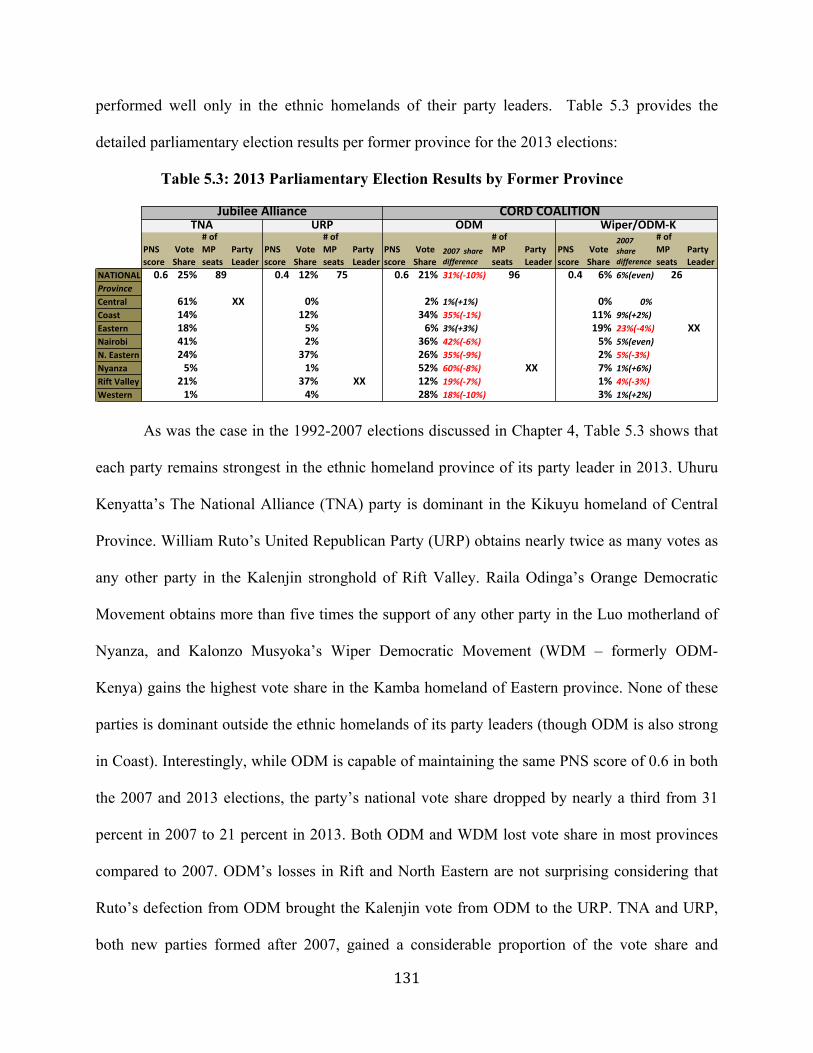
131
performed well only in the ethnic homelands of their party leaders. Table 5.3 provides the
detailed parliamentary election results per former province for the 2013 elections:
Table 5.3: 2013 Parliamentary Election Results by Former Province
As was the case in the 1992-2007 elections discussed in Chapter 4, Table 5.3 shows that
each party remains strongest in the ethnic homeland province of its party leader in 2013. Uhuru
Kenyatta’s The National Alliance (TNA) party is dominant in the Kikuyu homeland of Central
Province. William Ruto’s United Republican Party (URP) obtains nearly twice as many votes as
any other party in the Kalenjin stronghold of Rift Valley. Raila Odinga’s Orange Democratic
Movement obtains more than five times the support of any other party in the Luo motherland of
Nyanza, and Kalonzo Musyoka’s Wiper Democratic Movement (WDM – formerly ODM-
Kenya) gains the highest vote share in the Kamba homeland of Eastern province. None of these
parties is dominant outside the ethnic homelands of its party leaders (though ODM is also strong
in Coast). Interestingly, while ODM is capable of maintaining the same PNS score of 0.6 in both
the 2007 and 2013 elections, the party’s national vote share dropped by nearly a third from 31
percent in 2007 to 21 percent in 2013. Both ODM and WDM lost vote share in most provinces
compared to 2007. ODM’s losses in Rift and North Eastern are not surprising considering that
Ruto’s defection from ODM brought the Kalenjin vote from ODM to the URP. TNA and URP,
both new parties formed after 2007, gained a considerable proportion of the vote share and
!
PNS!score
!Vote!Share
#!of!MP!seats
Party!Leader
PNS!score
!Vote!Share
#!of!MP!seats
Party!Leader
PNS!score
!Vote!Share
2007$$share$difference
#!of!MP!seats
Party!Leader
PNS!score
!Vote!Share
2007$$share$difference
#!of!MP!seats
Party!Leader
NATIONAL 0.6 25% 89 0.4 12% 75 0.6 21% 31%(310%) 96 0.4 6% 6%(even) 26ProvinceCentral 61% XX 0% 2% 1%(+1%) 0% 0%Coast 14% 12% 34% 35%(31%) 11% 9%(+2%)Eastern 18% 5% 6% 3%(+3%) 19% 23%(34%) XXNairobi 41% 2% 36% 42%(36%) ! 5% 5%(even)N.!Eastern 24% ! 37% 26% 35%(39%) 2% 5%(33%) !Nyanza 5% 1% 52% 60%(38%) XX 7% 1%(+6%)Rift!Valley 21% 37% XX 12% 19%(37%) 1% 4%(33%)Western 1% 4% ! 28% 18%(310%) 3% 1%(+2%)
TNA URPJubilee!Alliance
ODM !Wiper/ODMTKCORD!COALITION
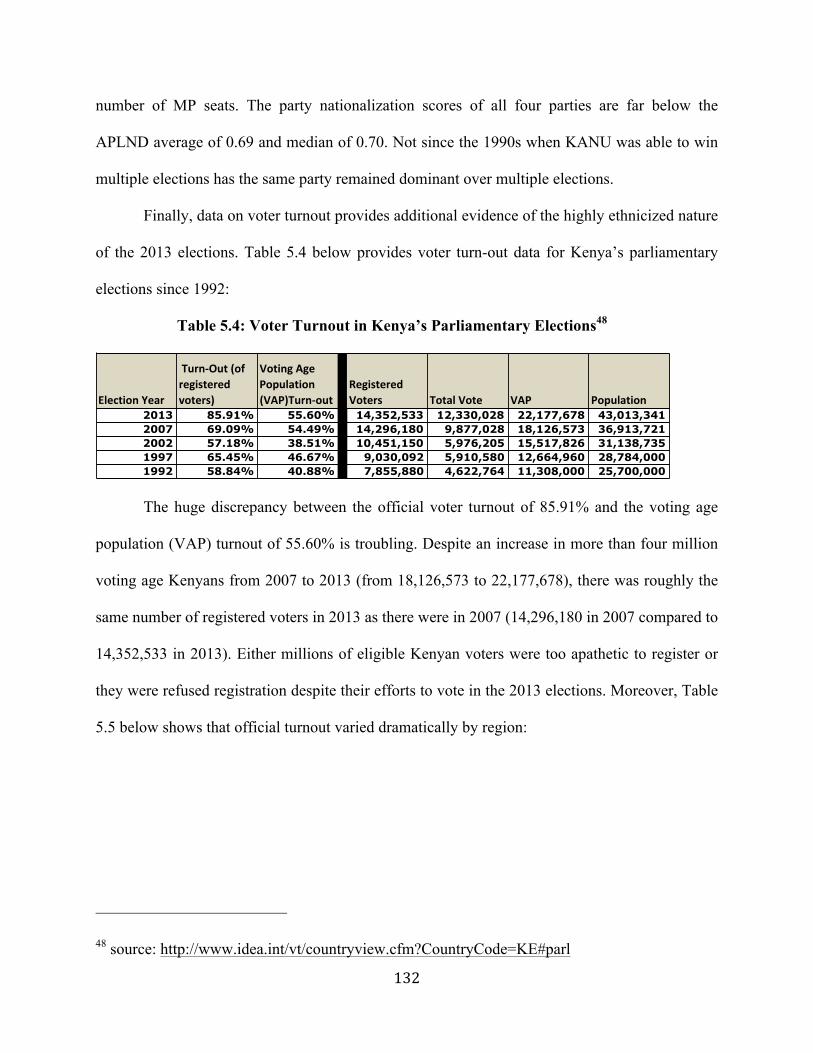
132
number of MP seats. The party nationalization scores of all four parties are far below the
APLND average of 0.69 and median of 0.70. Not since the 1990s when KANU was able to win
multiple elections has the same party remained dominant over multiple elections.
Finally, data on voter turnout provides additional evidence of the highly ethnicized nature
of the 2013 elections. Table 5.4 below provides voter turn-out data for Kenya’s parliamentary
elections since 1992:
Table 5.4: Voter Turnout in Kenya’s Parliamentary Elections48
The huge discrepancy between the official voter turnout of 85.91% and the voting age
population (VAP) turnout of 55.60% is troubling. Despite an increase in more than four million
voting age Kenyans from 2007 to 2013 (from 18,126,573 to 22,177,678), there was roughly the
same number of registered voters in 2013 as there were in 2007 (14,296,180 in 2007 compared to
14,352,533 in 2013). Either millions of eligible Kenyan voters were too apathetic to register or
they were refused registration despite their efforts to vote in the 2013 elections. Moreover, Table
5.5 below shows that official turnout varied dramatically by region:
48 source: http://www.idea.int/vt/countryview.cfm?CountryCode=KE#parl
Election)Year
)Turn/Out)(of)registered)voters)
Voting)Age)Population)(VAP)Turn/out
Registered)Voters Total)Vote VAP Population
2013 85.91% 55.60% 14,352,533 12,330,028 22,177,678 43,013,3412007 69.09% 54.49% 14,296,180 9,877,028 18,126,573 36,913,7212002 57.18% 38.51% 10,451,150 5,976,205 15,517,826 31,138,7351997 65.45% 46.67% 9,030,092 5,910,580 12,664,960 28,784,0001992 58.84% 40.88% 7,855,880 4,622,764 11,308,000 25,700,000
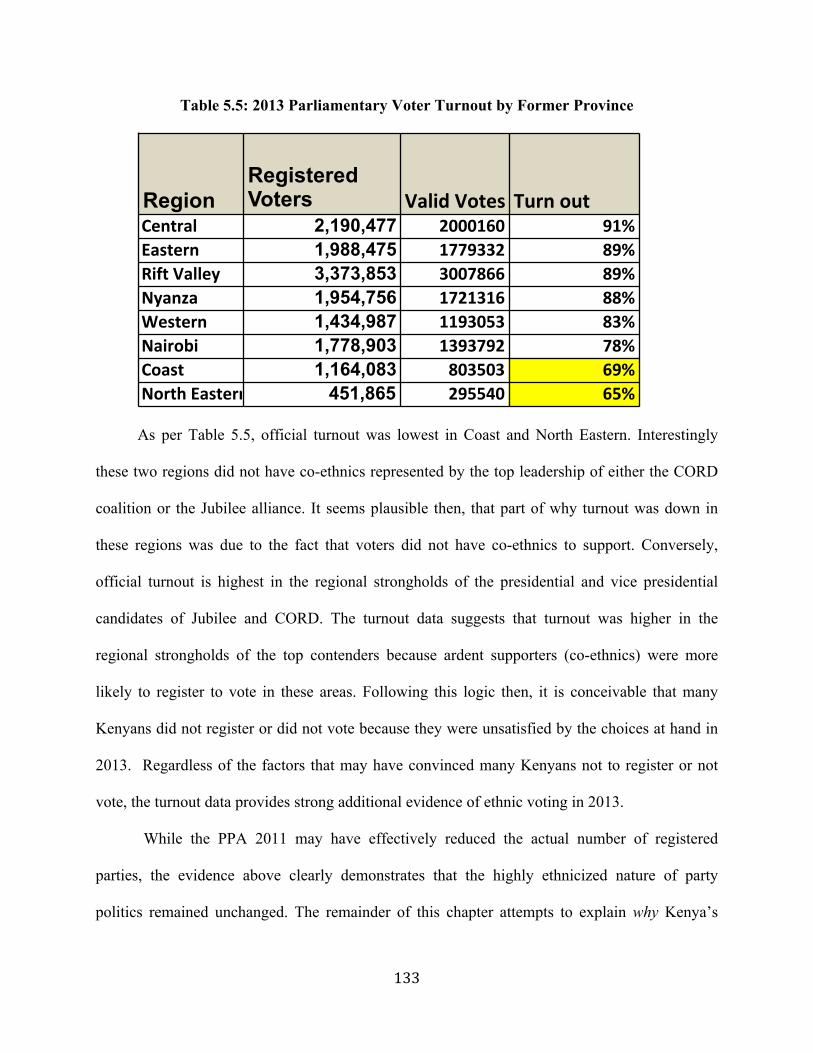
133
Table 5.5: 2013 Parliamentary Voter Turnout by Former Province
As per Table 5.5, official turnout was lowest in Coast and North Eastern. Interestingly
these two regions did not have co-ethnics represented by the top leadership of either the CORD
coalition or the Jubilee alliance. It seems plausible then, that part of why turnout was down in
these regions was due to the fact that voters did not have co-ethnics to support. Conversely,
official turnout is highest in the regional strongholds of the presidential and vice presidential
candidates of Jubilee and CORD. The turnout data suggests that turnout was higher in the
regional strongholds of the top contenders because ardent supporters (co-ethnics) were more
likely to register to vote in these areas. Following this logic then, it is conceivable that many
Kenyans did not register or did not vote because they were unsatisfied by the choices at hand in
2013. Regardless of the factors that may have convinced many Kenyans not to register or not
vote, the turnout data provides strong additional evidence of ethnic voting in 2013.
While the PPA 2011 may have effectively reduced the actual number of registered
parties, the evidence above clearly demonstrates that the highly ethnicized nature of party
politics remained unchanged. The remainder of this chapter attempts to explain why Kenya’s
RegionRegistered Voters Valid&Votes Turn&out
Central 2,190,477 2000160 91%Eastern 1,988,475 1779332 89%Rift&Valley 3,373,853 3007866 89%Nyanza 1,954,756 1721316 88%Western 1,434,987 1193053 83%Nairobi 1,778,903 1393792 78%Coast 1,164,083 803503 69%North&Eastern 451,865 295540 65%
134
party laws failed to have more of an influence on party development during Kenya’s 2013
elections.
5.3 THEORY
This dissertation asserts that there are three key factors that determine whether party laws
are likely to encourage the development of national parties in Africa: 1) the content of the party
laws themselves, 2) whether the laws are universally enforced, and 3) whether there is sufficient
citizen demand for national parties that transcend ethnic cleavages.
These three components provide insight into the factors that influence the motivations of
African party leaders and can help explain why party laws are effective in some countries (some
of the time) and not in others. Building on the theory of party development introduced in Chapter
1, party laws are unlikely to encourage the development of national parties unless they produce
enough horizontal coordination pressure to convince politicians to create national rather than
ethnic parties. As discussed in previous chapters, African politicians are confronted with two
competing motivations as they build parties to contest elections: pressure for vertical
coordination and pressure for horizontal coordination. Horizontal coordination pressure must be
more powerful than vertical coordination pressure in order for politicians to build multiethnic,
national parties. In other words, the perceived benefits of seeking broad support from across
different ethnic groups must outweigh the perceived benefits of targeting only the party leader’s
co-ethnics. In order for regulations to change the nature of party politics in Kenya or elsewhere,
they must influence the incentive structure of party leaders. In reality, political party
development is a complex phenomenon, and many factors influence the efficacy of party laws.
Nevertheless, this project maintains that the content of party laws, their enforcement, and citizen
135
demand are interrelated conditions that serve as an effective heuristic for predicting the
likelihood that laws will encourage the development of national parties. Each component and the
mechanisms behind how they influence the incentives of party leaders are discussed below.
Clearly defined, prescriptive laws that mandate that party leaders establish broad-based
political parties are more likely to encourage the development of national parties. As a reminder
from Chapter 2, this study groups political party laws into two categories: centripetal party laws
and consociational party laws. Centripetal party laws are more prescriptive and attempt to
minimize the impact of identity-politics by creating incentives for politicians to form multiethnic
parties. Consociational laws, on the other hand, seek to institutionalize societal cleavages by
explicitly protecting the rights of specific ethnic groups and are generally less structured and less
specific then centripetal laws. The main finding of the quantitative analysis in Chapter 3 is that
the extent of centripetal regulation is associated with both higher levels of party nationalization
and lower levels of electoral volatility – even after controlling for alternative explanations. In
other words, the written content of the laws matters and the higher the extent of centripetal
regulation the higher the likelihood of national, enduring parties. Whereas party leaders have
more flexibility to interpret (and ignore) consociational laws, the detailed requirements mandated
by centripetal party regulations leave less room for ambiguity. Moreover, specific regulations
pertaining to membership thresholds, maintenance of branch offices, and other organizational
requirements establish higher barriers to entry to would-be party leaders. The higher the barriers
to entry, the greater the level of investment required of political elites interested in creating or
maintaining political parties. Following this logic, party leaders are more likely to build stronger,
more organizationally robust parties when the barriers to entry are high. These organizationally
robust parties that require substantial investments from the party leaders are more likely to
136
survive over multiple elections, thereby reducing electoral volatility. Furthermore, the higher the
extent of centripetal regulation, the more likely that party leaders will be compelled to forge
multiethnic pacts with leaders of other groups in order to meet legal requirements mandating that
parties are comprised of a “national” (i.e. multiethnic) character. These are the mechanisms by
which centripetal party laws with clearly defined requirements increase the horizontal
coordination pressure of party leaders, which encourages them to build more national and
enduring parties.
Universally enforced political party laws are more likely to encourage the development of
enduring multiethnic parties than selectively enforced party laws. Not surprisingly, the level of
enforcement of party regulations shapes their ability to influence political party development.
Even the most perfectly crafted party regulations on paper have no influence if party leaders do
not follow them in reality. There is substantial variation in levels of rule of law across sub-
Saharan African countries. Party regulations are unlikely to encourage the development of
organizationally robust national parties in countries where incumbent regimes practice selective
enforcement and apply the laws solely at their discretion. As illustrated in Chapter 4, for
instance, Kenya’s incumbent regimes regularly used the existing legal framework to fractionalize
the opposition from 1992 through 2007. When authorities arbitrarily enforce regulations for
some parties and not others, party leaders have less incentive to abide by these formal rules and
party laws are less likely to encourage party development. If, on the other hand, the party laws
are universally enforced for all parties then party leaders have greater incentive to follow the
rules in order to remain in compliance. The greater the degree of independence of the
government institution responsible for monitoring parties’ compliance with existing regulations,
the higher the likelihood of universal rather than selective enforcement of party laws. In other
137
words, if the body responsible for regulating parties is insulated from the incumbent regime,
universal enforcement of party laws is more likely to occur. Universal enforcement of party laws
creates more horizontal coordination pressure by increasing party leader’s incentives to abide by
the laws and “play by the rules.” Therefore, when party laws are universally enforced they are
more likely to encourage the development of organizationally robust national parties because
they increase the horizontal coordination pressures on party leaders.
Finally, and most importantly, there must be citizen demand for strong multiethnic parties
in order for party leaders to build organizationally robust national parties that are likely to be
competitive over multiple elections. National parties are unlikely to form and persist without
support from strong interest groups advocating on their behalf. For instance, party leaders will
not build strong national parties if citizens prefer to vote for effervescent ethnic parties. Yet
public demand for multiethnic parties does not exist in a vacuum, and the actions of political
elites shape the desires of citizens, and vice versa. This complex interplay between public
opinion and elite motivations is influenced by both internal and external factors that ultimately
shape the demand for national parties. Citizen demand for multiethnic parties must be more
powerful than their fear of other ethnic groups in order to encourage party leaders to build
national rather than ethnic parties. Otherwise, politicians are likely to build ethnic parties that
manipulate the fear that voters have in other groups to consolidate their voting blocs. Similarly,
international assistance is only likely to encourage the development of national parties when it
increases the horizontal coordination pressure on politicians to compel them to build multiethnic
alliances. When these internal and external factors create more horizontal coordination pressure
then vertical coordination pressure then party leaders are more likely to build national parties.
138
Evaluation of the content of party laws, their enforcement, and public demand for
national parties creates a simplified but effective analytical framework for examining the
limitations of institutional engineering on African political party development. Understanding
how party regulations influence the horizontal and vertical coordination pressures on politicians
provides insights into explaining variation in why party laws work in some countries and not
others. The written content of legislation matters, yet unless party laws are universally enforced
and there is high citizen demand for national parties, then party leaders are unlikely to build
multiethnic parties. Centripetal party laws, universal enforcement, and high public demand for
multiethnic cooperation all increase the horizontal pressures on politicians making it more likely
that party leaders will build national parties. This framework is applied to Kenya’s 2013
elections in the next Section of this chapter.
5.4 EVIDENCE FROM KENYA’S 2013 ELECTIONS
Ultimately, the PPA 2011 did not change the nature of party politics in Kenya because it
failed to produce adequate horizontal coordination pressure on politicians to encourage them to
build national rather than ethnic parties. The fact that Kenyan parties were even more ethnicized
and decidedly less national suggests that vertical coordination pressure remained dominant for
the 2013 elections. Following this logic, the PPA 2011 did not encourage the development of
more national parties because it failed to produce enough horizontal coordination pressure to
overpower the deeply entrenched vertical coordination pressure on Kenya’s party leaders. Using
the theoretical framework introduced above, evidence pertaining to the PPA 2011’s failure to
fundamentally change the incentive structure of Kenya’s politicians is assessed below. First, the
internal content of the PPA 2011 is introduced and discussed. Second, the degree to which the
139
PPA 2011 was enforced is analyzed. Finally, the level of citizen demand for national parties is
evaluated. Data from elite interviews, participant observation, focus groups, and survey research
suggests that despite the detailed and prescriptive content of the PPA 2011, universally lax
enforcement and high levels of mistrust in “others” did not create enough horizontal coordination
pressure to fundamentally change party politics in Kenya. As a result, the PPA 2011 likely
accounts for the reduction in the actual number of registered parties but did little to reduce the
highly ethnicized nature of party politics.
5.4.1 Content and Commentary of the PPA 2011
As mentioned earlier, the PPA 2011 radically transformed the legal framework regulating
the organization, conduct, and actions of Kenya’s political parties. The PPA 2011 is nearly fifty
pages long and is among the most prescriptive laws in the entire African Party Law and
Nationalization Database (APLND) database.49 Whereas political parties were unceremoniously
lumped together with all other forms of organization for Kenya’s previous elections, the PPA
2011 establishes an independent Registrar of Political Parties (RPP) to “register, regulate,
monitor, investigate, and supervise political parties to ensure compliance with this Act” [Party
IV, 34. (a)]. The reader will recall from Chapter 2 that the APLND includes a summary measure
of the extent of centripetal regulation, which ranges from 0 to 5. A score of “0” indicates no
centripetal regulations, while a score of “5” indicates a high level of centripetal regulation. From
1992 to 2007 Kenya had a score of “0,” meaning there was no centripetal regulation, and
consequently Kenyan elections had some of the lowest levels of extent of regulation in the
49 For the complete PPA 2011 see: http://www.parliament.go.ke/plone/statutory-documents/political-parties-act-no-11-of-2011
140
APLND database. After the PPA 2011, however, Kenya scored a “4,” signifying a high level of
centripetal party regulation. More specifically, the PPA 2011 bans ethnic parties [Part 1I,
7(2)(b)], requires that each party registers a minimum of 1,000 members from more than half of
Kenya’s 47 counties [Part II, 7. (2)(a)], maintains regional branch offices in more than half of the
counties [Part II, 7 (2)(f)(iii))], and has a governing body whose composition “reflects regional
and ethnic diversity” [{art II, 7(2)(b)] and holds regular, democratic internal elections [Part II, 21
(1)(b)].50 The PPA 2011 does not include an explicit ban on ethnic party names, the only
component of the law not included in the summary measure resulting in the score of 4 out of 5.51
In addition to the more stringent registration laws, the PPA 2011 also establishes a Political
Parties Fund “not being less than zero point three percent of the revenue collected by the national
government” to be administered by the RPP to parties that won five percent of the votes at the
preceding election [Part III, 23-25]. As discussed later, an important provision of the funding
component of the PPA 2011 states that parties are not entitled to public funding if “(a) the party
does not secure at least five percent of the total number of votes at the preceding general
elections; or (b) more than two-thirds of its registered office bearers are of the same gender”
[Part III, 24(2)(a-b)]. In stark contrast to Kenya’s previous elections, the highly structured and
specific nature of the PPA 2011 places the extent of centripetal regulation for Kenya’s 2013
elections among the highest in the entire continent.
While debate persisted over the content and structure of the PPA 2011 during the run up
to the 2013 elections, most elites interviewed by the author agreed that the new laws were
50 See: 7 (2) (b) of PPA, 2011: http://kenyadebates.com/POLITICAL_PARTIES_BILL_2011.pdf 51 While the PPA 2011 does not explicitly ban ethnic party names, Chapter 8 gives the Registrar wide sweeping powers to refuse any application if the name or party symbol is deemed obscene or offensive.

141
created in an open, transparent, and consultative fashion. The PPA 2011 is considerably more
prescriptive and sets higher barriers to entry than the preceding Political Parties Act 2007 (PPA
2007). The PPA 2007 was actually enacted on July 2008 and was Kenya’s first attempt at
revising its antiquated Societies Act in an effort to increase regulation over parties in the
aftermath of Kenya’s most violent elections. Like the PPA 2011, the PPA 2007 banned ethnic
parties [Part IV, 14], set a membership requirement of at least 200 members in each Province
[Party IV, 23(1)(b)], mandated that parities carry periodic and democratic internal elections [Part
IV, 14], and created the framework for the provision of public funding to parties [Part V, 28-30].
Critics of the PPA 2007 argued the new law did not do enough to stamp out the politics of
“negative ethnicity” (Wamwere 2003) and warned of substantial loopholes in the law that could
be exploited by parties’ financiers and others (Wachira and Makan 2008), and work on revising
the law further continued in advance of the 2013 elections.
Over the next several years, numerous international and national non-governmental
organizations hosted multiple events that provided Kenyan party leaders, lawmakers, and civil
society leaders the opportunity to consult with international experts to further refine the PPA
2007 into what would ultimately become the PPA 2011.52 Interview participants explained that
leaders of the smaller parties would generally complain that the barriers to entry in the new
registration were set too high, while heads of the larger parties advocated most fervently for
more public funding, and civil society leaders argued for more restrictive registration
52 Multiple interview participants made reference to workshops, forums, and other events hosted by Transparency International (TI), the National Democratic Institute for International Affairs (NDI), the International Institute for Democracy and Electoral Assistance (IDEA), the United Nations Development Programme (UNDP), the Center for Multiparty Democracy (CMD), the Electoral Institute for Sustainable Democracy (EISA), and the Netherlands Institute for Multiparty Democracy among others.
142
requirements to reduce the number of evanescent “brief case” parties. After many rounds of
compromise, the PPA 2011 increased the membership threshold from 200 members in each
province to at least a minimum of a thousand registered voters from at least 24 of Kenya’s 47
counties. Moreover, the PPA 2011 mandates that parties establish and maintain branch offices in
more than half of the 47 counties. Leaders of smaller parties often complained to the author that
the higher barriers and more prescriptive nature of the PPA 2011 favored the larger parties. Some
shared concerns that the extremely prescriptive nature of the PPA 2011 gave the government too
much potential control over political parties. Some feared that unless the Registrar of Political
Parties was truly independent and insulated from the State House then enforcement of the PPA
2011 could be used to stymie the opposition. One legal observer, for instance, asserted that the
“Political Parties Law is much too comprehensively detailed as it stands, and, as such, entails
two serious risks: that it will tend to stifle the practice of democratic politics…and/or that it will
prove ineffective in what presumably is its purpose” (Harbeson 2011). Nevertheless, despite
concerns over the implementation and enforcement of the law, most interview participants from
across parties and civil society spoke favorably of the consultative nature by which the law was
constructed and generally approved of the internal content of the PPA 2011.
5.4.2 Enforcement of the PPA 2011
Despite generally positive sentiment over the content of the PPA 2011, a number of
interview participants highlighted issues pertaining to the enforcement of the new law. Of all the
components of the law discussed in part 4.1 above, the membership thresholds and the branch
office requirements are most clearly linked to party nationalization because they explicitly seek
to increase the national scope of Kenya’s parties. Not surprisingly due to the enormous resources
143
involved in recruiting members and maintaining branch offices, a vast majority of party officials
identified these two components as the most challenging aspects of the PPA 2011. For these
reasons, I focus primarily on elite attitudes towards the enforcement of these two specific
components of the PPA 2011 below.
During interviews conducted with party leaders shortly after the enactment of the law in
November and December 2011, executive directors and other senior officials expressed anxiety
about making sure their parties would remain in compliance with the PPA 2011. Even leaders of
the larger and more well established parties viewed meeting the more stringent registration
requirements of the laws as a challenge. For instance, a senior official from one of the large
parties noted that:
“We need and appreciate the help [technical assistance] understanding the legal requirements. If we fail to meet them, the party could be dissolved. The [party leader] realizes the importance of the activities on these compliance issues.”53
Many executive directors, from both small and large parties, shared this sentiment and feared
that if they were unable to meet the requirements of the PPA 2011 then their parties would not
gain registration and would be prohibited from participating in the elections. There was wide
consensus among these officials that securing a minimum of a thousand party members in at
least 24 counties and establishing and maintaining branch offices in at least half of the counties
were the most challenging components of the new law. Not since KANU’s glory days at the peak
of its power had any political party had the reach or scope now required of all of parties by law.
Full compliance with the law required serious investments in the infrastructures of all of Kenya’s
53 Interview with senior party official of a large party in Nairobi in November 2011
144
parties. Immediately after its enactment, officials of parties large and small began implementing
strategies to make certain their parties would reach compliance with the laws. While the efficacy
of strategic plans and ability and willingness to conform varied widely across parties, most party
leaders appeared to be taking the new law seriously.
Several months later, however, interview participants were decidedly less concerned
about their respective party’s prospects of being granted provisional registration status to
compete in the 2013 elections. Some parties did indeed launch large-scale membership drives
and implemented ambitious organizational programs to open branch offices throughout the
country. For instance, a number of technical assistance providers were impressed with The
National Alliance’s (TNA) commitment to gaining compliance with the law by making the
investments necessary to building a strong party infrastructure. Numerous interview respondents,
however, remarked that most parties were “cheating” to gain compliance with the laws. Party
officials spoke freely of how leaders of the “other” parties “cheated” to get around the PPA
2011. In order to meet the membership thresholds, for instance, unscrupulous party leaders
allegedly bought copies of hotel guest registries and fraudulently claimed these hotel guests were
members of their party. Similarly, receptionists reportedly sold the visitors logs of their office
buildings, and employees of Kenya’s many mobile phone companies allegedly sold the contact
information of their customers for the same purpose. Far from being isolated incidents
perpetrated by a few parties, the number of Kenyans fraudulently registered to parties without
their consent was widespread across parties (Okumu 2013, SM 2013). Interview data and other
evidence suggest that many (if not most) of Kenya’s political parties participated in some degree
of fraud to meet the minimum membership threshold requirement set by the PPA 2011
145
Similarly, the number of parties that actually opened branch offices in at least 24 counties
is dubious. Indeed, many of the party leaders I spoke with questioned whether any of the parties
(aside from their own, of course) actually met this criterion. Having personally visited a number
of “branch offices” across the country, most were little more than humble ad-hoc structures with
assorted party paraphernalia with minimal infrastructure. This seemed particularly true of those
offices outside of party strongholds. Perhaps co-ethnic supporters in the periphery were using
their “office space” (often kiosks selling daily staples appeared to be serving as “party offices”
too) to serve as their party’s branch office too? While most were ad-hoc structures, some of the
branch offices I visited appeared to be more serious operations complete with staff and
computer(s). The costs associated with opening and maintaining these more serious branch
offices in at least 24 counties are substantial and required serious and sustained investment from
the parties. Aside from the largest parties, it was exceedingly difficult to find branch offices
outside a party’s respective regional strongholds. Interview data and personal observations
suggest that it is unlikely that most parties managed to open and maintain the required number of
branch offices mandated by the new law.
Whereas Kenya’s ambiguous party laws of the past were enforced selectively to
advantage the incumbent, the most stringent components of the PPA 2011 were universally
overlooked. An overwhelming proportion of party officials, civil society leaders, and assistance
providers agreed that the RPP was not enforcing the PPA 2011 to the full extent of the law.
While most leaders from the smaller parties did not raise concerns over the lax enforcement of
the PPA 2011, some officials from the larger parties expressed frustration. For instance, a senior
party official from one of Kenya’s large parties remarked:
146
“The Registrar of Political Parties should follow through with the laws without fear of being criticized. We have party members that are chairmen in other parties! The Registrar is not implementing the law consistently or seriously. That office needs to set the example.”54
If the RPP had chosen to strictly enforce all components of the new law, a vast majority of
interview participants agreed that there would have been far fewer than the 59 provisionally
registered parties. Nevertheless, while the Kenyan government had deliberately used the old
legal framework and the Registrar of Societies to stymie opposition parties in the past, most
interview participants portrayed the RPP as treating the parties with a fair and level hand. While
most agreed that the Office of the RPP was noticeably more open and transparent than its
predecessors, obtaining definitive data (on the number of parties that were denied provisional
registration status for instance) proved impossible. Yet, most interviewees viewed the
lackadaisical enforcement of the PPA 2011 as primarily a product of lack of resources within the
RPP rather than politically motivated inaction. Indeed, in interviews with the author, the RPP
and members of her team conceded that they simply did not have the necessary staff or resources
to conduct thorough audits of all the parties seeking provisional registration. The shared
sentiment from most interview participants was that since the RPP was a new institution, the
office chose not to strictly enforce the PPA 2011 for the 2013 elections in order to gain the buy-
in and trust of the parties. Many interviewees argued the laws would be more strictly enforced
for the next general elections and consequently believed the PPA 2011 would have limited
influence on party development for the 2013 election. Despite the strict requirements established
by the law on paper, most of the parties that were ultimately granted provisional registration
54 Interview with senior party official of a large party in Nairobi in December 2011
147
status to compete in the 2013 elections most likely did not reach full compliance with the PPA
2011 in reality.
Despite the evidence that the new law was not strictly enforced, most interview
participants acknowledged that the PPA 2011 was likely responsible for the large reduction in
the number for registered parties in 2013 compared to 2007. While there was wide consensus,
even amongst party officials, that few (if any) parties had actually met all of the requirements of
the PPA 2011, most agreed that the higher barriers to entry made it more difficult for would be
party leaders to create “briefcase parties,” as was the case in previous elections. As such,
interview participants credited the PPA 2011 as “pruning”55 the actual number of registered
political parties compared to the 2007 elections. Interestingly, many interview participants
conceded that while the PPA 2011 would likely have little influence on the 2013 elections, they
expected that it would create major changes for the next general election. Between the
promulgation of the new constitution, the advent of devolution, and the new party laws, many
agreed that it would take years for the laws on paper to have force in reality. A number of the
architects of the PPA 2011 expressed optimism that the law would be enforced more stringently
for the 2017 elections and would likely have the intended influence on party development then.
5.4.3 Demand for National Parties in 2013
Evidence of citizen demand for national parties in Kenya for the 2013 elections is
somewhat mixed. On the one hand, civil society organizations, the media, donors, and
international assistance providers went to great lengths to highlight the dangers of ethnic politics
in the lead up to the elections. Most of these organizations equated ethnic politics with election
55 interview with a prominent Kenyan academic in Nairobi in July 2012
148
violence, and numerous civic education campaigns, editorials, and public service announcements
urging voters to remain peaceful by not succumbing to the dangers of “negative ethnicity”
flooded the media outlets in advance of the elections. On the other hand, however, most party
leaders continued to cater primarily to their co-ethnic constituencies, and as discussed in Part 2
of this chapter, Kenyan citizens still voted along ethno-regional lines. A number of interview
participants and focus group respondents remarked that the pending International Criminal
Court’s (ICC) cases served as an external shock that further deepened ethnic polarization,
discouraging any fundamental change to the nature of multiparty politics in 2013 compared to
previous elections. While a vast majority of Kenyans wanted peaceful elections, survey results,
focus group data, and election results suggest that neither Kenyan attitudes toward political
parties nor their ethnic voting patterns had fundamentally changed for the 2013 elections. In
other words, there is little evidence of any substantial increased demand for more national
parties. Ultimately, this low demand did not create enough horizontal coordination to produce
higher levels of party nationalization for the 2013 elections.
Public opinion survey data from before the 2013 elections suggests that while there was
relatively high demand for leaders who should represent the nation as a whole, there were also
high-levels of mistrust in other Kenyans. This project analyzes data from the Afrobarometer
(AB)56 survey data as one means of gauging citizen demand for national political parties.
Unfortunately, the AB survey does not ask a specific question about national vs. ethnic political
parties. It does, however, ask respondents to choose between Statement 1, which states “Once in
56 The Afrobarometer (AB) is an independent, nonpartisan research project that measures the social, political, and economic atmosphere in Africa. Additional information on the AB can be found here: http://www.afrobarometer.org/
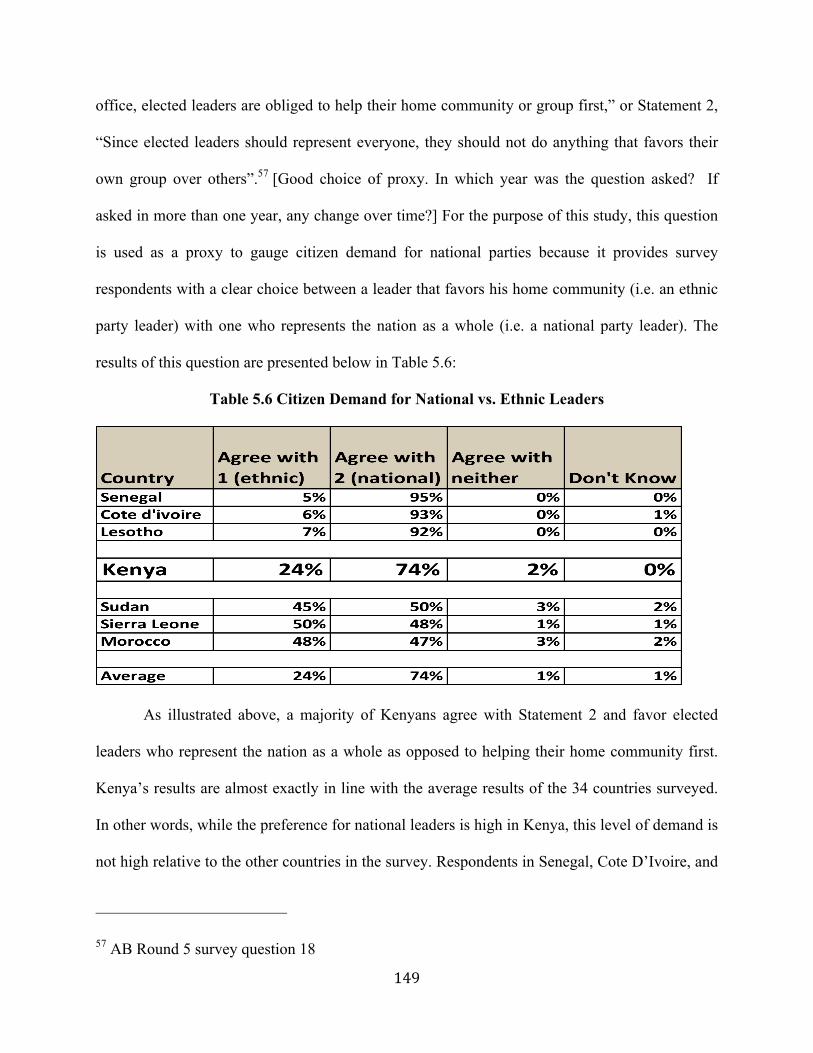
149
office, elected leaders are obliged to help their home community or group first,” or Statement 2,
“Since elected leaders should represent everyone, they should not do anything that favors their
own group over others”.57 [Good choice of proxy. In which year was the question asked? If
asked in more than one year, any change over time?] For the purpose of this study, this question
is used as a proxy to gauge citizen demand for national parties because it provides survey
respondents with a clear choice between a leader that favors his home community (i.e. an ethnic
party leader) with one who represents the nation as a whole (i.e. a national party leader). The
results of this question are presented below in Table 5.6:
Table 5.6 Citizen Demand for National vs. Ethnic Leaders
As illustrated above, a majority of Kenyans agree with Statement 2 and favor elected
leaders who represent the nation as a whole as opposed to helping their home community first.
Kenya’s results are almost exactly in line with the average results of the 34 countries surveyed.
In other words, while the preference for national leaders is high in Kenya, this level of demand is
not high relative to the other countries in the survey. Respondents in Senegal, Cote D’Ivoire, and
57 AB Round 5 survey question 18
150
Lesotho expressed substantially higher preferences for national party leaders than those in
Kenya, yet Kenyans expressed substantially higher preferences for national leaders than
respondents in Sudan, Sierra Leone, or Morocco. Nevertheless, an overwhelming majority (74%)
of Kenyans prefer elected leaders that represent everyone fairly, suggesting a high-level of
demand for national parties in Kenya.
Focus group discussion (FGD) data complements survey evidence by suggesting that
while many Kenyans understood the attributes of national parties on a theoretical level, they
often had difficulty explaining why their own parties should be considered national, and some
concluded that there were no national parties competing in the 2013 elections at all. One the one
hand, ordinary Kenyans from throughout the country correctly identified key characteristics of
national parties. For instance, a 20-year-old female student in Kisumu noted that “a national
political party should be able to preach peace and unity to unite people in Kenya.” Meanwhile, a
30-year-old barber in Mombasa argued that “policies should go to all the people,” while a 41-
year-old female street food vendor in Mombasa stated that “It [a national party] is a party that
has members from all tribes.” In Meru, a 39-year-old male mechanic stated “the leaders of that
party [a national party] should come from all areas of the country.”58
Nevertheless, while many could identify the key characteristics of national parties on a
theoretical level, “Kenyans’ definitions of national parties are often at odds with the parties they
identify as national, and they often have trouble designating why the specific parties they
identify should be considered ‘national’.”59 ODM, TNA, KANU, and NARC-Kenya were most
58 all quotes from participant observation of the National Democratic Institute’s focus group work conducted from September 9-21, 2012. 59 NDI presentation of results of focus group work of 26 groups in 10 locations with 282 participants conducted from September 9-21, 2012, slide 128.
151
often identified as national parties from across locations, but respondents also identified smaller
parties as “national” within their regional strongholds (particularly UDF in Western and URP in
Rift).60 Importantly, however, a sizeable minority of FGD respondents, across demographic
groups and geographic locations, concluded that there were no national parties in Kenya for the
2013 elections.61 Below are responses that typified the minority view that Kenya had no national
parties in 2013:
“I will say we don’t have a national party because each region has its own party. If you go to Rift Valley they have their own party, same with Central, Nyanza. So we don’t have a party which stands for the nation.”62
“National parties are more of an ideal rather than a reality.”63
Most respondents chose to view the party they supported as a “national” party, yet the comments
above are indicative of the sizeable minority who argued that all the competing parties remained
ethnic in nature. Despite their optimistic views of the parties they supported, many Kenyans
viewed national parties as an elusive ideal during the 2013 elections.
Additional survey evidence from the AB provides insights into why Kenyans
predominantly voted along ethnic lines despite their high demand for national parties. The AB
survey asks “Generally speaking, would you say that most people can be trusted or that you must
60 Ibid: slide 130 61 ibid, slide 130 62 Response from a 33-year-old Male, spare parts vendor in Eldoret during NDI focus group discussion in September, 2012. 63 Response from a 38-year-old female insurance manager in Kisumu during NDI focus group discussion in September, 2012.
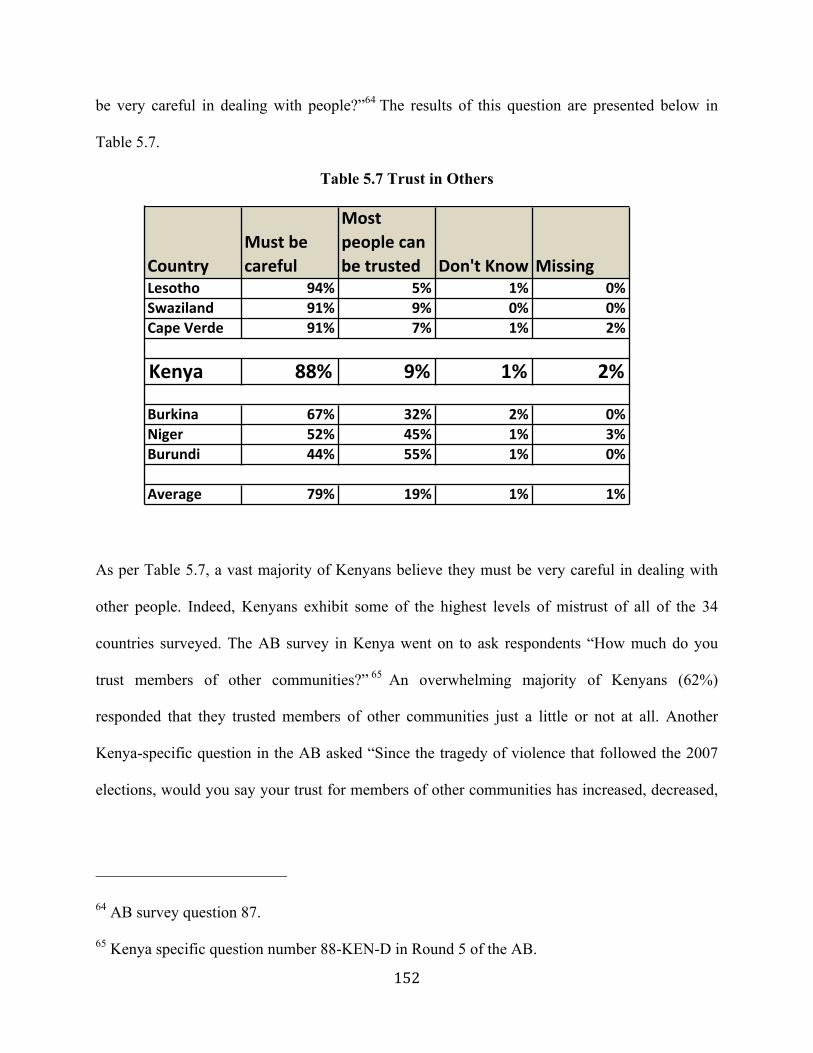
152
be very careful in dealing with people?”64 The results of this question are presented below in
Table 5.7.
Table 5.7 Trust in Others
As per Table 5.7, a vast majority of Kenyans believe they must be very careful in dealing with
other people. Indeed, Kenyans exhibit some of the highest levels of mistrust of all of the 34
countries surveyed. The AB survey in Kenya went on to ask respondents “How much do you
trust members of other communities?” 65 An overwhelming majority of Kenyans (62%)
responded that they trusted members of other communities just a little or not at all. Another
Kenya-specific question in the AB asked “Since the tragedy of violence that followed the 2007
elections, would you say your trust for members of other communities has increased, decreased,
64 AB survey question 87. 65 Kenya specific question number 88-KEN-D in Round 5 of the AB.
CountryMust*be*careful
Most*people*can*be*trusted Don't*Know Missing
Lesotho 94% 5% 1% 0%Swaziland 91% 9% 0% 0%Cape*Verde 91% 7% 1% 2%
Kenya 88% 9% 1% 2%
Burkina 67% 32% 2% 0%Niger 52% 45% 1% 3%Burundi 44% 55% 1% 0%
Average 79% 19% 1% 1%
153
or stayed the same?”66 A plurality of 45% of respondents stated that their level of trust in other
communities has either decreased or decreased a lot. In addition, 41% stated that their level of
trust remained about the same, but considering most Kenyans were already starting from a low
level of trust in members of other communities, this suggests astonishingly high levels of
mistrust in Kenyan citizens in advance of the 2013 elections. Section 2 of this chapter suggests
that Kenyans largely followed similar trends in 2013 by voting predominantly along ethnic lines.
Voting patterns in 2013 are similar to those in 2007 in which Kenyans voted defensively in
ethnic blocs at least in part due to mistrust in members of other communities (Bratton and
Kimenyi 2008). It seems plausible then that the high levels of mistrust in the lead up to the 2013
elections may have offset the horizontal coordination pressures produced by the relatively high
levels of citizen demand for national parties in Kenya. As discussed in more detail below, party
leaders predominantly chose to manipulate the high levels of fear by continuing to build ethnic
rather than national parties.
Interview and focus group evidence suggests that there was no supply of national
parties in the 2013 elections. The fundamental nature of multiparty politics did not change in
2013 as Kenyan party leaders continued to prioritize ethnic and regional concerns over national
interests. Both elites and ordinary Kenyans believed that little had changed compared to previous
elections. Many complained about the highly ethnicized nature of party politics in 2013:
“It [the direction of politics] is heading in the wrong direction because we are grouping ourselves in tribal lines. Most of the political parties are tribal.”67
66 Kenya specific question number 82-KEN-C in Round 5 of the AB. 67 37 year old female regional manager in Nyeri at an NDI FGD in September, 2012
154
“The parties are still ethnically and tribally based. Most of the parties have members from the same background.”68
“I think things are getting worse by the day. Tribalism is on the rise. Just look at these coalitions…one is from the Central province and another is from Western coalitions. When people vote in March they are going to vote for their tribe.”69
The quotes above are from Kenyans of different ethnicities, supporting different parties, from
across Kenya. An overwhelming number of interview participants and focus group participants
complained that the nature of multiparty politics remained highly ethnicized. This sentiment and
trend intensified closer to election day. Regardless of their party affiliation, many Kenyans
complained that despite all the new parties, the same politicians were running. For instance, one
respondent remarked: “There are no changes since the politicians are still the same politicians
that were there in 2007…it is just like changing the monkeys in the same forest.”70 While
comical, the quote captures the common sentiment that party leaders conducted the 2013
elections as “business as usual” and there was little, if any, difference in the nature of party
competition when compared to previous elections.
Another common theme from both elites and ordinary Kenyans was that the 2013
campaigns lacked ideological or programmatic substance. While most lauded the presidential
candidates for participating in Kenya’s first televised presidential debates, many complained that
the debates, like the campaigns themselves, were “plagued by half-answers and veiled attacks”
(Nicholson 2013). Despite all the lip service about focusing on policy priorities and ideological
68 49 year old female farmer in Eldoret at an NDI FGD in January, 2013 69 22 year old male student in Nairobi at an NDI FGD in January, 2013 70 25 year old unemployed male in Eldoret at an NDI FGD in January, 2013
155
differences, many Kenyans felt that their politicians avoided issues and continued to focus on
ethnic allegiances in 2013. Some of the most representative comments are posted below:
“The politicians are not talking about issues. Instead, they are just talking about their tribes and the money they will give them once they are elected.”71
“…from what we are seeing from the presidential aspirants…they are not just standing because of the political ideologies or there is something they want to do for Kenya, but I see them just standing to represent their region. This means every tribe wants their person to stand for the president to compete with other tribes.”72
“Most parties are tribal in my view and a lot of Kenyans don’t know why they are in political parties because they don’t even understand the manifestos of those parties. If you are Luo, you are in ODM. If you are Kikuyu, you are in PNU or TNA. If you are Kalenjin, you are in URP…”73
Despite the PPA 2011 and other efforts to encourage substantive, policy-related differences
between parties, politicians largely continued “politics as usual” by continuing to cater primarily
to their co-ethnics. In addition to complaints about the lack of cogent policies or ideological
differences between parties, many expressed frustration with the ongoing proliferation of parties
in 2013. As one respondent put it:
“These parties are confusing us. Every morning when we wake up there are new parties. People sleep and when they wake up they have their own party, there are
71 55 year old Male realtor at an NDI FGD in January, 2013 72 37 year old male field officer at an NDI FGD in Kisumu in September, 2012 73 44 year old male matatu owner at an NDI FGD in Kisumu in September, 2012
156
too many parties. When I was young there used to be one party and even though people complained about that, it had its advantages.”74
Like the respondent above, many had become so frustrated by multiparty politics that they
waxed nostalgically about the “good old days” of one-party rule under KANU. This sentiment
highlights the potential dangers wrought by Kenya’s highly fragmented and volatile party system
in which the same politicians use different political parties to compete in each election. While a
majority of Kenyans might still support multiparty politics, growing frustration with their parties
could eventually lead to democratic deficits and potentially even authoritarian reversal.
Finally, the influence that the ICC’s ongoing prosecution of Uhuru Kenyatta (leader of
TNA) and William Ruto (leader of URP) had on party development and the nature of party
politics during the 2013 elections should not be underestimated. In December 2010, the ICC
indicted six people, including Kenyatta and Ruto, for crimes against humanity due to their
alleged roles in the 2007 post-election violence (ICC Statement 2010). Importantly, Kenyatta
was accused of funding violence against the Kalenjin while Ruto was accused of master minding
attacks against the Kikuyu (ibid). Kenyatta and Ruto were on opposite sides of the political
spectrum in 2007, and there had been great animosity between the Kikuyu and Kalenjin after the
2007-08 post-election violence. As Ferree et al. rightly note, “Most observers assumed that
candidates would team with traditional allies, so the announcement of the Jubilee Alliance,
joining Uhuru Kenyatta and William Ruto on the same ticket, surprised many” (Ferree et al
2014; 156). As one respondent bluntly put it, “the Jubilee Alliance – the base for their alliance
74 40 year old female hotel employee at an NDI FGD in Mombasa in January, 2013
157
was to evade the ICC issue.”75 While they denied all charges, there had been such vitriol between
these two that it is unlikely they would have joined forces if not for the ICC (Ferree et al 2014,
Lynch 2014, Brown and Raddatz 2013). Nevertheless, fear of prosecution by the ICC forged an
unlikely alliance between Uhuru and Ruto, and the “Uhuruto” 76 coalition of convenience
would eventually go on to be victorious.
Few issues were as polarizing in the lead up to the 2013 elections than the ICC. Not
surprisingly, Odinga and his CORD coalition aggressively portrayed the pair as corrupt and
nefarious war criminals unfit to rule the country. As part of a well-executed campaign strategy,
Uhuruto changed the dialogue from one of responsibility over the 2007-8 election violence to a
discussion of how the ICC was an external ploy to interfere with Kenya’s internal politics
(Ferree et al 2014: 158, Lynch 2014). For instance, “Uhuruto” supporters remarked:
“I would not support anyone who thinks that Kenya is incapable of handling its own issues like the Hague issue, because I wouldn’t want us to be compared to countries like Somalia who are unable to govern themselves.”77
“…but at ICC we know that there are countries which are influencing the process like Britain.”78
Nevertheless, viewing the 2013 elections as a mere “ethnic census” (Horowitz 1985) is too
simplistic. Ironically, Uhuru and Kenyatta needed the ICC in order to bring their highly
antagonistic blocs together. Lynch rightly notes that “the Jubilee Alliance ran a well-funded and
75 38 year old male farmer in Bungoma at an NDI FGD in September, 2013 76 the combination of “Uhuru” and “Ruto”. “Uhuruto” was widely used by both supporters and opponents to describe the unlikely alliance of the two previous foes. 77 46 year old male grocery shop owner at an NDI FGD in Nakuru in March, 2011 78 33 year old male farmer at an NDI FGD in Eldoret in March 2011
158
coordinated campaign that used an array of strategies – both analytical and performative – to
effectively reframe overarching narratives, which drew upon, and helped shape local
understandings of justice, injustice, opportunity, and threat”(Lynch 2014: 94). Just as Moi had
effectively done throughout the 1990s (Lynch 2011), Kenyatta and Ruto “used existing and
emergent communal narratives of justice and competition to recast socio-economic and political
debates in a way that persuaded the majority of Kalenjin and Kikuyu to support Jubilee-and to
vote against Raila Odinga and the Coalition for Reform and Democracy (CORD) – as a way to
protect and further their individual and collective interests” (Lynch 2014: 93, also see Mueller
2014). The important point here is that Uhuruto took control of the ICC issue by reframing the
case against them as a foreign plot to interfere with the sovereignty of Kenya. Indeed, they
masterfully “claimed their coalition exemplified the reconciliation between two previously
antagonistic groups” and “ some observers asserted that far from hurting Kenyatta and Ruto the
ICC issue helped their campaign and subsequent voter turnout” (Ferree et al. 2014: 158).
Coupled with a series of diplomatic miscues by Western donors (Brown and Raddatz 2014),
Uhuruto ultimately used the ICC case to their advantage to consolidate their ethnic voting blocs.
While the ICC indictments provided an incentive for Kenyatta and Ruto to forge a temporary
coalition of convenience, both TNA and URP were predominantly ethnic parties serving the
Kikuyu and Kalenjin, respectively. Sadly, Kenya’s past coalitions of convenience (see the
detailed description of the 2002 NARC coalition in Chapter 4 for instance) hardly survived past
election day, which does not bode well for the longevity of the Jubilee Alliance. It is impossible
to ascertain how party politics would have been different, yet many believe the ICC court case
not only irreparably stalled the implementation of the PPA 2011 (and the new Constitution more
159
generally) but also ultimately proved to be the main factor shaping party development during the
2013 elections.79
5.5. CONCLUSIONS
Despite early optimism that the PPA 2011 would encourage party leaders to build more
nationally representative political parties, most believed the new law had little influence on the
nature of politics in Kenya. Even with the more stringent registration and finance laws, party
system nationalization continued to decline, making the latest elections Kenya’s least national
since 1992. In addition, voter turnout and co-ethnic support was highest in the regional
strongholds of the presidential candidates. Indeed, the analysis of detailed election results in this
chapter confirms that political parties became more ethnicized, increasingly volatile, and even
more fragmented in 2013 compared to previous elections.
Ultimately, the PPA 2011 failed to produce enough horizontal coordination pressure to
force Kenyan politicians to build multiethnic parties. Despite its highly prescriptive content, the
very aspects of the law that were meant to encourage the development of national parties were
not enforced. Furthermore, party leaders capitalized on deeply entrenched fears of members of
other communities to consolidate the support of their co-ethnics. Kenya’s party leaders chose to
tap into these fears and built ethnic parties and joined coalitions of convenience with other ethnic
party leaders instead of building strong national parties. The ICC case against Ruto and Kenyatta
was largely responsible for the unlikely alliance between the Kikuyu and Kalenjin, but most
agree that it ultimately increased ethnic polarization throughout the country and likely stalled the
79 this sentiment was particularly strong among international donors and technical assistance providers.
160
implementation of the new Constitution and the PPA 2011. While the elections were largely
peaceful, the nature of multiparty politics in the 2013 elections did not appear fundamentally
different than previous elections. Just as had been the case in previous elections, Kenyans
continued to vote primarily along ethnic lines in 2013.
Nevertheless, viewing Kenya’s 2013 elections as merely an ethnic census oversimplifies
the many complex factors that shaped party development during this pivotal time period in
Kenya. Party officials, civic leaders, and international experts widely praised the consultative
process by which the PPA 2011 was constructed. Most viewed the internal content of the law as
a huge improvement over the ambiguous regulations of the past. While many remarked that the
RPP did not enforce the laws strictly, most attribute the PPA 2011 as responsible for reducing
the number of registered parties. Both public opinion data and FGD evidence suggest that there
was high demand for elected leaders that would support the nation as a whole rather than leaders
that would support their home areas first. Yet, even higher levels of mistrust toward members of
other communities tempered this demand for national parties. Regardless of these challenges,
many believe that the PPA 2011 will likely encourage more nationally representative and
enduring parties for the next election. Perhaps if party leaders choose to build truly national
parties then Kenyans will not fear they are wasting their vote and would support them. Time will
tell.
161
CHAPTER 6: COMPARATIVE CASE STUDY ANALYSIS (VIRTUOUS CIRCLES AND VICIOUS CYCLES)
6.1 INTRODUCTION
This chapter provides a comparative case study analysis to give additional insights into
the factors that shape variation in political party development across African countries and
within individual countries over time. Chapter 2 shows that, on average, there is a relationship
between party laws and party system nationalization – the higher the extent of centripetal
regulation the higher the likelihood of enduring, national parties. Nevertheless, the previous
chapter of Kenya’s 2013 elections shows that the relationship between the extent of centripetal
regulation and party nationalization is not automatic. Despite a high extent of centripetal
regulation with the advent of detailed and prescriptive new party laws, politics became even
more ethnicized and fragmented in Kenya during the 2013 elections. The in-depth analysis of
Kenya’s 2013 elections provides an explanation of why the relationship between party laws and
nationalization is not automatic. As argued in Chapter 5, Kenya’s party laws did not create
enough horizontal coordination pressure to motivate party leaders to build national rather than
ethnic parties. High levels of ethnic polarization, divisive party leaders who deliberately
“activated” ethnicity during their campaigns, and overly ambitious regulations that were not
enforced created a vicious cycle that trumped high citizen demand for national political parties in
Kenya. This chapter tests the explanations provided to explain party development in Kenya by
applying the theoretical framework to additional cases.
Kenya’s 2013 election was an example of low nationalization despite high levels of party
regulation. The three additional cases analyzed in this chapter are Benin, Zambia, and Ghana.
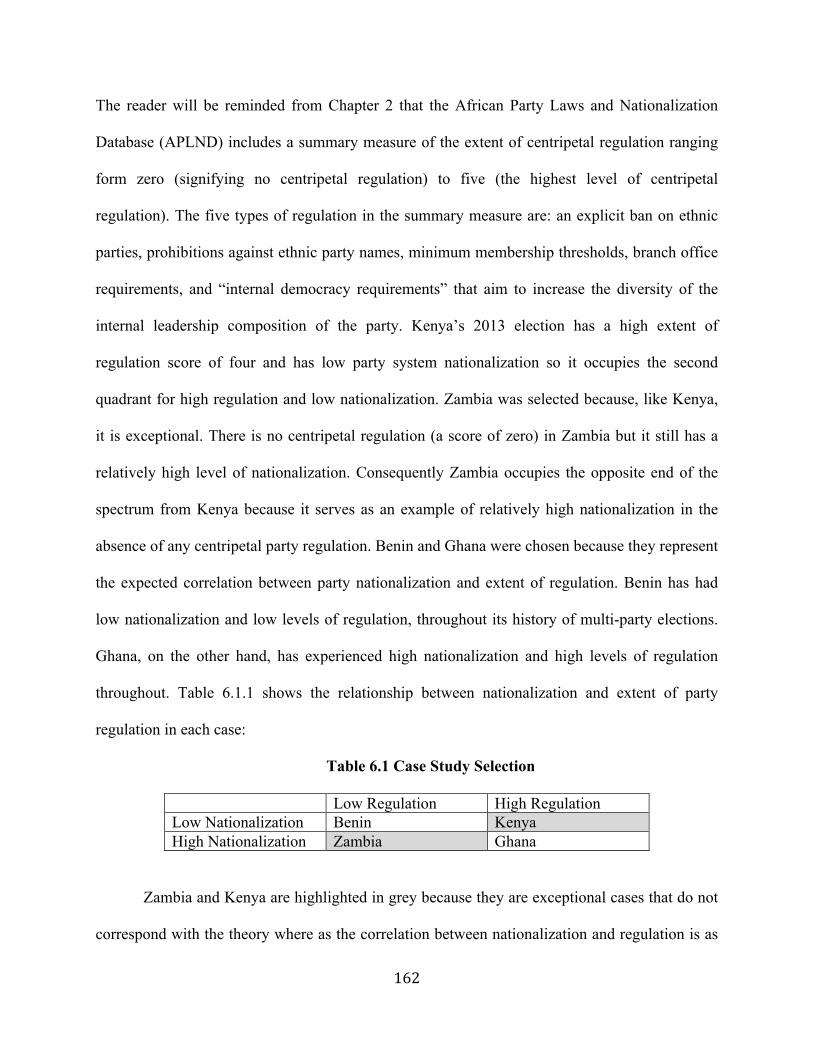
162
The reader will be reminded from Chapter 2 that the African Party Laws and Nationalization
Database (APLND) includes a summary measure of the extent of centripetal regulation ranging
form zero (signifying no centripetal regulation) to five (the highest level of centripetal
regulation). The five types of regulation in the summary measure are: an explicit ban on ethnic
parties, prohibitions against ethnic party names, minimum membership thresholds, branch office
requirements, and “internal democracy requirements” that aim to increase the diversity of the
internal leadership composition of the party. Kenya’s 2013 election has a high extent of
regulation score of four and has low party system nationalization so it occupies the second
quadrant for high regulation and low nationalization. Zambia was selected because, like Kenya,
it is exceptional. There is no centripetal regulation (a score of zero) in Zambia but it still has a
relatively high level of nationalization. Consequently Zambia occupies the opposite end of the
spectrum from Kenya because it serves as an example of relatively high nationalization in the
absence of any centripetal party regulation. Benin and Ghana were chosen because they represent
the expected correlation between party nationalization and extent of regulation. Benin has had
low nationalization and low levels of regulation, throughout its history of multi-party elections.
Ghana, on the other hand, has experienced high nationalization and high levels of regulation
throughout. Table 6.1.1 shows the relationship between nationalization and extent of party
regulation in each case:
Table 6.1 Case Study Selection
Low Regulation High Regulation Low Nationalization Benin Kenya High Nationalization Zambia Ghana
Zambia and Kenya are highlighted in grey because they are exceptional cases that do not
correspond with the theory where as the correlation between nationalization and regulation is as
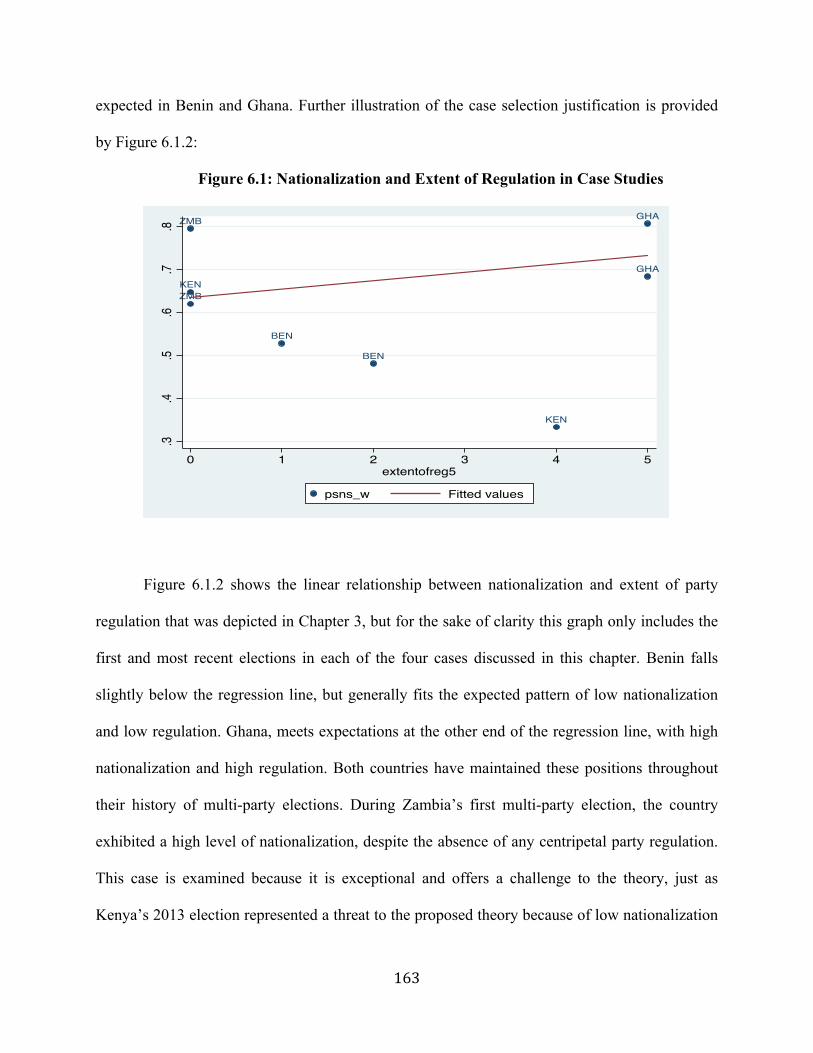
163
expected in Benin and Ghana. Further illustration of the case selection justification is provided
by Figure 6.1.2:
Figure 6.1: Nationalization and Extent of Regulation in Case Studies
Figure 6.1.2 shows the linear relationship between nationalization and extent of party
regulation that was depicted in Chapter 3, but for the sake of clarity this graph only includes the
first and most recent elections in each of the four cases discussed in this chapter. Benin falls
slightly below the regression line, but generally fits the expected pattern of low nationalization
and low regulation. Ghana, meets expectations at the other end of the regression line, with high
nationalization and high regulation. Both countries have maintained these positions throughout
their history of multi-party elections. During Zambia’s first multi-party election, the country
exhibited a high level of nationalization, despite the absence of any centripetal party regulation.
This case is examined because it is exceptional and offers a challenge to the theory, just as
Kenya’s 2013 election represented a threat to the proposed theory because of low nationalization
BEN
BEN
GHA
GHA
KEN
KEN
ZMB
ZMB
.3.4
.5.6
.7.8
0 1 2 3 4 5extentofreg5
psns_w Fitted values
164
despite high regulation. In sum, this chapter analyzes two cases that are representative of the
correlation between nationalization and regulation identified in Chapter 3, and examines two
exceptional cases that do not behave as expected.
In addition to using the extent of regulation and level of nationalization, there are other
reasons that make these countries suitable candidates for further analysis. For instance, these
countries cover every region of Africa (East, West, Southern), which provides broad geographic
scope. Each case study country has also experienced at least one peaceful transfer of power. This
is important because the results may not be generalizable in countries where dominant parties
(Tanzania, Cameroon, Rwanda) have not experienced electoral defeat. Finally, these countries
have all undergone varying measures of political liberalization that makes it possible to conduct
survey research on public opinion (Bratton, Mattes, and Gyimah-Boadi 2005:54). Combined
with their respective levels of nationalization and extent of regulation, all of these factors make
Benin, Zambia, and Ghana ideal candidates for comparative case study analysis.
While not appropriate to delve into the level of detail provided in the in-depth analysis of
Kenya, applying the theoretical framework introduced in Chapter 1 to Benin, Zambia, and Ghana
still provides valuable insight into the factors that shape African political party development.
This project asserts that horizontal coordination pressures hold the key to understanding variation
in African party development. When the horizontal coordination pressures are strong enough,
party leaders are more likely to build national rather ethnic parties. Despite sharing many
similarities, differences in certain critical factors help explain this variation. More specifically,
this project asserts that the level of ethnic polarization, leadership legacy, content and
enforcement of party laws, and citizen demand for national parties are the crucial factors shaping
party development. As described in detail in Chapter 1, politicians are more likely to build strong
165
and enduring national parties when: 1) there is low levels of ethnic polarization, 2) the country’s
independence leader prioritized building national cohesion over enriching his own group, 3)
there are centripetal party laws with realistic requirements, 4) the laws are universally enforced,
and 5) there is high citizen demand and support for national parties. In unison, these forces work
together to create a “virtuous circle” (Norris 2000, Schlesinger and Heskett 1991) where a
positive feedback loop reinforces strong horizontal coordination pressures on politicians thereby
encouraging national party development.
On the other hand, politicians are more likely to build ethnic parties if: 1) there is high
ethnic polarization, 2) there is a legacy of ethnically divisive leaders, 3) party laws are either too
vague or too ambitious, 4) the laws are selectively enforced, and 5) there is low citizen demand
and or support for ethnic parties. These conditions create a “vicious cycle” where a negative
feedback loop reinforces low levels of horizontal coordination pressure on politicians thereby
perpetuating the development of ethnic rather than national parties. This chapter proceeds by
analyzing the key factors in Benin, Zambia, and Ghana that contribute to the virtuous circle or
vicious cycle in each country to shed further light on the variation in African party development.
6.2 BENIN
Benin has a highly fragmented party system rife with weak ethnic parties. Indeed, the
country has the lowest party system nationalization-scores-weighted (PSNS-w) in the entire
APLND database. Before analyzing bloodless election results, however, this section aims to
breathe life into the story of party development in Benin. A such, I draw from a variety of
secondary sources to describe how the country’s inter and intra ethnic cleavages, leadership
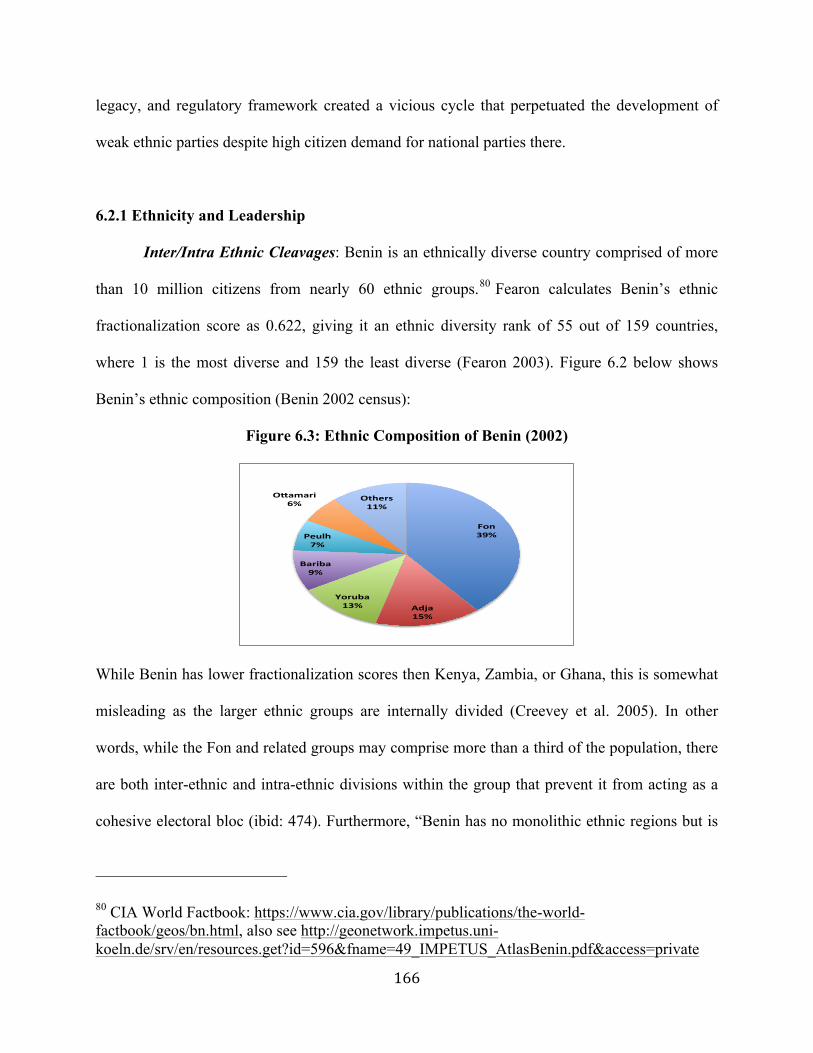
166
legacy, and regulatory framework created a vicious cycle that perpetuated the development of
weak ethnic parties despite high citizen demand for national parties there.
6.2.1 Ethnicity and Leadership
Inter/Intra Ethnic Cleavages: Benin is an ethnically diverse country comprised of more
than 10 million citizens from nearly 60 ethnic groups.80 Fearon calculates Benin’s ethnic
fractionalization score as 0.622, giving it an ethnic diversity rank of 55 out of 159 countries,
where 1 is the most diverse and 159 the least diverse (Fearon 2003). Figure 6.2 below shows
Benin’s ethnic composition (Benin 2002 census):
Figure 6.3: Ethnic Composition of Benin (2002)
While Benin has lower fractionalization scores then Kenya, Zambia, or Ghana, this is somewhat
misleading as the larger ethnic groups are internally divided (Creevey et al. 2005). In other
words, while the Fon and related groups may comprise more than a third of the population, there
are both inter-ethnic and intra-ethnic divisions within the group that prevent it from acting as a
cohesive electoral bloc (ibid: 474). Furthermore, “Benin has no monolithic ethnic regions but is
80 CIA World Factbook: https://www.cia.gov/library/publications/the-world-factbook/geos/bn.html, also see http://geonetwork.impetus.uni-koeln.de/srv/en/resources.get?id=596&fname=49_IMPETUS_AtlasBenin.pdf&access=private
Fon$39%$
Adja$15%$
Yoruba$13%$
Bariba$9%$
Peulh$7%$
O:amari$6%$
Others$11%$
167
rather a mosaic of heterogeneous local units”(Heldmann 2005). Indeed, Benin’s intra-ethnic
diversity has been highlighted in an effective critique of the limitations of ethnic fractionalization
measures (Posner 2004). The point for this study is that Benin is even more ethnically diverse
than its fractionalization score suggests. Posner (2004, 2005) shows that the size of ethnic groups
largely defines their political salience and is a powerful predictor of whether or not they will be
useful vehicles for political mobilization (Posner 2005). No single ethnic group in Benin is large
enough to win the majority of an election on its own. As a result:
“…the complex morphology and spatial distribution of ethnic groups, both of which preclude any single ethnic group from winning electoral majorities on its own, combine with the institutional designs of the electoral system to exert strong pressure for political parties to form electoral coalitions that cut across the characteristic inter-ethnic and intra-ethnic cleavages and the corresponding group and subgroup constituencies across electoral constituencies.” (Creevey et al. 2005)
The ethnic composition of Benin has undoubtedly influenced the trajectory of its party
development. The diversity and spatial distribution of groups within and across multiple electoral
constituencies has led to increased horizontal coordination pressures on party leaders to create
multiethnic coalitions in Benin. Since no single ethnic group can “go it alone,” leaders of one
group are compelled to work with leaders of other groups to secure electoral victory. As
discussed in more detail below, however, the nature of the multiethnic alliances is up to the party
leaders and has certainly not guaranteed the formation of national parties there.
Party Leadership: Instead of building strong multiethnic national parties, most party
leaders in Benin have generally chosen to stitch together weak electoral coalitions of ethnic
parties. After several decades of one-party rule by the Revolutionary Party of the People of
Benin (PRBP), Mathieu Kérékou finally bowed to mounting domestic and international pressures
168
to convene a national conference which eventually led to a new constitution and the re-
introduction of multi-party democracy in 1990 (Nwajiaku 1994, and Bratton and van de Walle
1997, Decalo 1997). During the national conference, Kérékou dramatically confessed and
begged forgiveness for the harm caused by his regime. Claffey (2007) describes the scene
appropriately: “In a remarkable piece of political theatre, at a crucial point in the conference, he
[Kérékou] metaphorically donned sackcloth and sat in the political ashes of the defunct regime to
ask forgiveness from the nation for the PRPB’s failures and abuses” (Claffey 2007: 100). Even
after nearly 20 years as head of PRPB, Kérékou was granted immunity from prosecution and ran
in the 1991 presidential elections as an independent candidate. Despite Kerekou’s efforts to
reinvent himself, Nicephore Soglo, of the Union for the Triumph of Democratic Renewal
(UTRD), beat Kerekou with a strong majority (67.73%) in the second round run-off elections of
1991.81 Nevertheless, while Soglo was able to beat Kérékou and UTRD attained the highest
share of the parliamentary vote in 1991, it secured less than 20% of the parliamentary vote and
only obtained 12 out of 64 National Assembly seats. Importantly, UTRD was actually a loose
coalition of three smaller parties82 and not a unified single party. Soglo did little to strengthen
UTRD after his victory and it broke up shortly after he became President. By 1994 Soglo took
the leadership of the Renaissance Party of Benin (RB), a new party established by his own wife!
The important point of for this project is that neither Soglo nor Kérékou invested in building
strong, multiethnic parties as their respective vehicles to the presidency. Perhaps each leader
presumed that voters were unwilling to tolerate a strong party after the increasingly autocratic
81 see African Elections Database: http://africanelections.tripod.com/bj.html 82 For more detail on UTRD and the other parties that participated in the elections see: http://www.ipu.org/parline-‐e/reports/arc/2033_91.htm
169
tendencies of the PRBP. Nevertheless, this strategic decision not to invest in enduring
multiethnic parties has created an enduring legacy of highly volatile and evanescent political
parties in Benin.
Benin’s subsequent elections have also been characterized by high numbers of weak
ethno-regional parties and fleeting alliances that rarely survive beyond a single election cycle.
Remarkably, Kérékou managed to regain the Presidency with 52% of the vote share in the
second round compared to Soglo’s 48%.83 Once again, Kerekou ran as an independent, but he
obtained the support of numerous smaller parties including the Party of Democratic Renewal
(PRD) and the Social Democratic Party (PSD) (Larson 2014: 142). While Kerekou was able to
win the Presidency, opposition parties enjoyed a 16-seat majority from the 1995 national
assembly elections limiting his ability to implement policy (ibid). In 1998, PRD quit the
government and joined forces with Soglo’s RB to obtain a one seat majority in the 1999 elections
(African Elections Database). In a highly controversial election in which Soglo refused to
participate in the second round, Kérékou “won” the presidency yet again in 2001 (Wrage 2007:
62; Seely: 155). Later, a loose coalition of parties that supported the president aptly named the
presidential movement (MP) were able to secure 52 out of 83 seats in the 2003 national
assembly elections. With both Soglo and Kerekou constitutionally unable to run again in the
2006 elections, Thomas Yayi Boni, former head of the West African Development Bank and a
relative newcomer to politics, beat PRD candidate Adrien Houngbedji in the second round with a
resounding 75% of the vote.84 Like Kerekou before him, Boni ran and won as an independent
candidate without any party affiliation. As one analyst observed:
83 see African Elections Database: http://africanelections.tripod.com/bj.html 84 see http://www.bbc.com/news/world-africa-13037578
170
“His [Boni’s] landslide victory was attributed in part to the fact that he was of mixed tribal descent, had been born in the country’s “middle belt,” and was a Christian from a predominantly Muslim family, which helped him bridge the ethnic, geographic, and religious divides so prevalent in previous elections.” (Larson 2014: 143)
Boni possessed the “right” mixed ethnic composition, regional roots, and religious ambiguity
necessary to attract a winning number of voters from across multiple cleavage structures (Lipset
and Rokkan 1967) to win the presidency in Benin. Party affiliation, however, played no part in
the calculus of Beninese voters. Indeed, Boni was able to gain even greater control of the
legislature than Kérékou because by this time many legislators were also independent. In 2011,
Boni won the presidency as an independent yet again. Meanwhile, new political parties flooded
the 2011 parliamentary elections contest (with the exception of FCBE which participated in the
2007 elections). The important point for this study is that the dominant politicians in Benin have
invested little to strengthen their political parties. Presidential (and parliamentary) candidates
regularly switch parties from election to election or run as independents. Indeed, Kérékou and
Boni viewed parties as liabilities and both successfully attained and retained the presidency as
independents. While Benin’s diverse ethnic composition increases horizontal coordination
pressures, party leaders have opted to establish loose and temporary electoral coalitions of ethnic
parties instead of investing in enduring national parties. This practice of utilizing parties as little
more than vehicles to win elections, if at all, contributed to the high fragmentation and volatility
of Benin’s party system.
171
6.2.2 Content, Enforcement, and Demand
Content: The laws governing the registration of political parties in Benin exhibit low
levels of centripetal regulation and create negligible barriers to entry for parties. The 1990 La
Charte ou la loi sur les partis politiques (henceforth CPP 1990) governed the registration of
political parties for the 1991 and 1995 elections while the LOI n2001-21 portant Charte des
partis politiques (henceforth CPP 2001) establishes the provision for party registration for
subsequent elections. The CPP 1990 does explicitly ban ethnic parties [CPP 1990: Article 4] but
the law does not include any of the other aforementioned types of centripetal regulation.
Therefore, the 1991 and 1995 elections have a score of 1 on the scale, signifying a low level of
centripetal regulation. While the CPP 2001 is more prescriptive, the only discernible change to
the extent of centripetal regulation comes from the law’s additional provisions for internal
democracy [CPP 2001: Articles 30-31]. As a result, the 2011 elections achieve a score of 2 –
though higher than in 1991 and 1995, even these elections exhibit a low level of centripetal
regulation compared to most elections in the APLND database. A number of observers have
specifically blamed the ambiguous content of party laws for contributing to the high level of
fragmentation in Benin (Engels, Stroh, Wantchekon 2008, Bierschenk 2009, Gazibo 2012).
Gazibo captures this sentiment by arguing that:
“Since the law for registering parties is so liberal, parties are created and dismantled frequently depending on the political issues at stake. Many have a legal existence but few organize regular political activities or participate in elections.” (Gazibo 2012: 17).
The ambiguous and “liberal” content of Benin’s party laws have little influence on horizontal
coordination pressures on the country’s leaders. The ease at which politicians can create and
172
abandon parties under the country’s party registration laws has done little to encourage
investment in organizationally strong, multiethnic national parties.
Enforcement: In addition to the low level of centripetal regulation, party regulations
have not been enforced to the full extent of the law in Benin. The Autonomous National
Electoral Commission (CENA) and other electoral management bodies (EMB) in Benin have
been widely lauded for (generally) equitable treatment of parties and candidates (Hounkpe 2011:
39). Nevertheless, while incumbent regimes have not selectively enforced aspects of the law to
fragment the opposition (as was the case in Kenya from 1992-200785), observers have noted that
existing registration laws have not been enforced (Engels, Stroh, Wantchekon 2008, Battle and
Seely 2007). Similar to Kenya, Benin experienced extreme party proliferation and by 2002 there
were more than 160 registered parties in the country (Larson 2012; Engles, Stroh, & Wantchekon
2008). More to the point, while ethnic parties are explicitly banned, they clearly still exist in
Benin and operate with impunity. Indeed, Battle and Seely (2007) highlight this phenomenon in
their study of vote choice in Benin, and implore that “future research could explore why some
individuals’ ethnic identities are activated by politicians, especially when it is outlawed in
Benin” (Battle and Seely 2007: 18). Whereas strict and universal enforcement might encourage
party leaders to form more enduring multiethnic parties, lax enforcement of the law does not
increase horizontal coordination pressures.
85 Please see Chapter 4 for an in-depth analysis of how the incumbent regimes in Kenya selectively enforced the laws to thwart opposition parties.
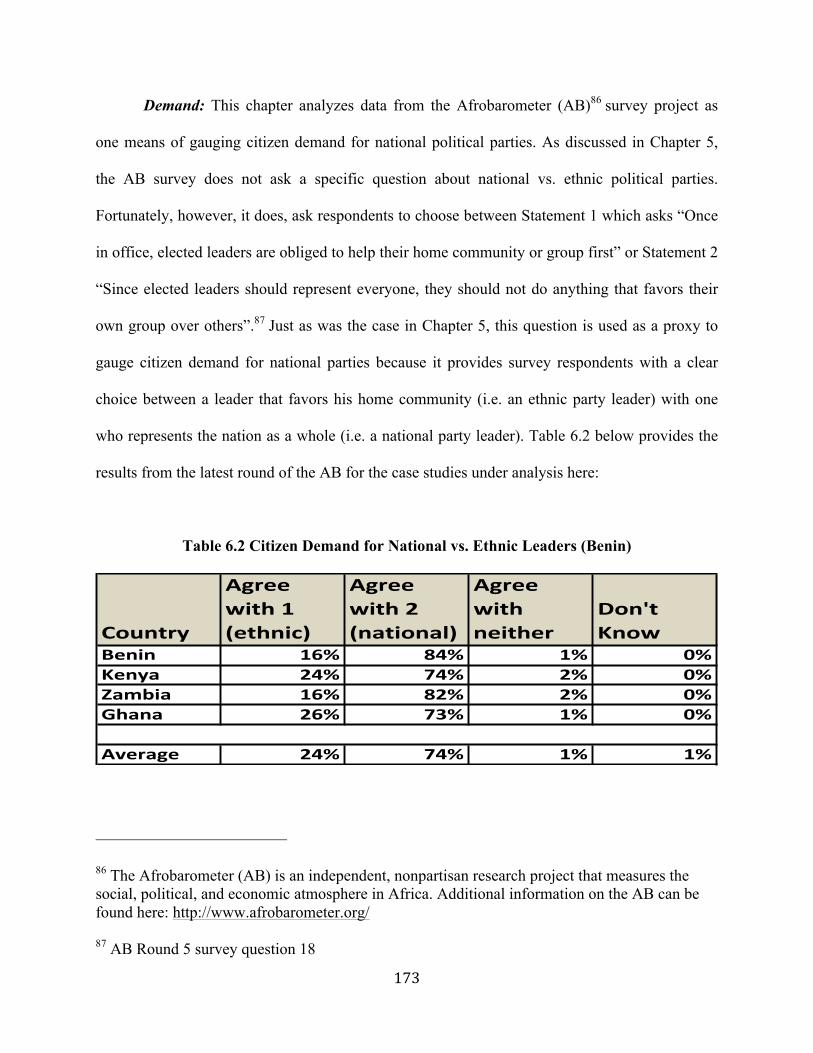
173
Demand: This chapter analyzes data from the Afrobarometer (AB)86 survey project as
one means of gauging citizen demand for national political parties. As discussed in Chapter 5,
the AB survey does not ask a specific question about national vs. ethnic political parties.
Fortunately, however, it does, ask respondents to choose between Statement 1 which asks “Once
in office, elected leaders are obliged to help their home community or group first” or Statement 2
“Since elected leaders should represent everyone, they should not do anything that favors their
own group over others”.87 Just as was the case in Chapter 5, this question is used as a proxy to
gauge citizen demand for national parties because it provides survey respondents with a clear
choice between a leader that favors his home community (i.e. an ethnic party leader) with one
who represents the nation as a whole (i.e. a national party leader). Table 6.2 below provides the
results from the latest round of the AB for the case studies under analysis here:
Table 6.2 Citizen Demand for National vs. Ethnic Leaders (Benin)
86 The Afrobarometer (AB) is an independent, nonpartisan research project that measures the social, political, and economic atmosphere in Africa. Additional information on the AB can be found here: http://www.afrobarometer.org/ 87 AB Round 5 survey question 18
Country
Agree+with+1+(ethnic)
Agree+with+2+(national)+
Agree+with+neither
Don't+Know
Benin 16% 84% 1% 0%Kenya 24% 74% 2% 0%Zambia 16% 82% 2% 0%Ghana 26% 73% 1% 0%
Average 24% 74% 1% 1%
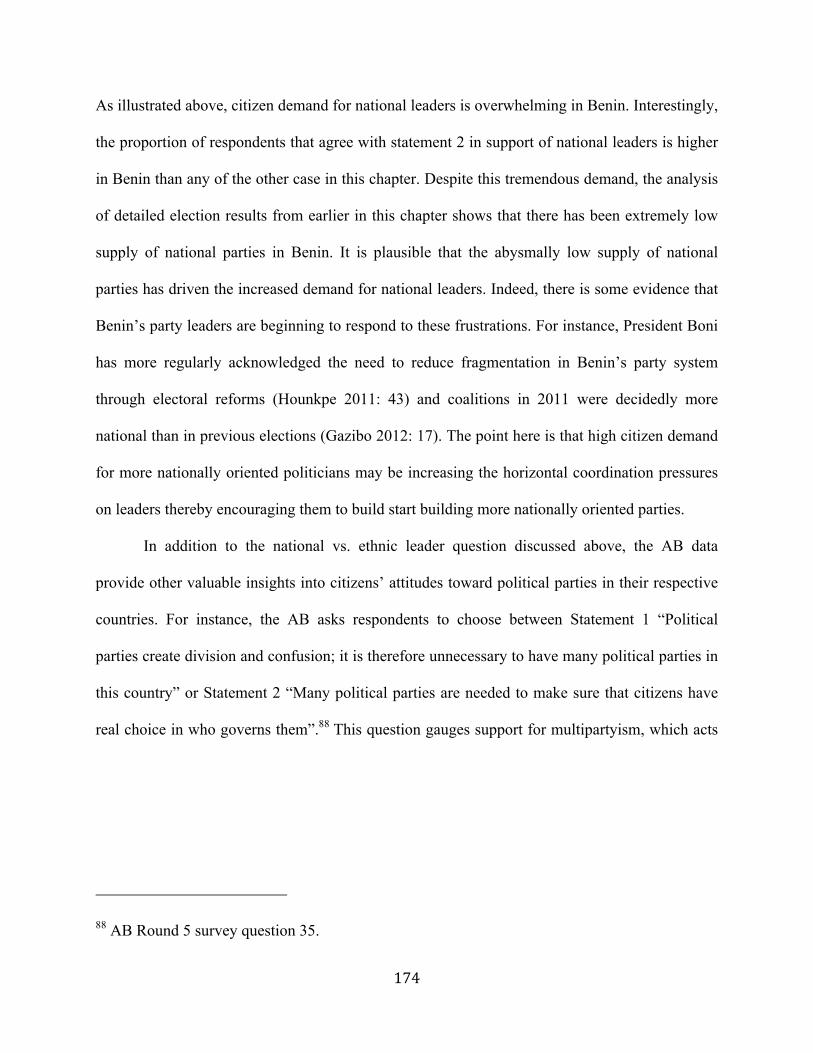
174
As illustrated above, citizen demand for national leaders is overwhelming in Benin. Interestingly,
the proportion of respondents that agree with statement 2 in support of national leaders is higher
in Benin than any of the other case in this chapter. Despite this tremendous demand, the analysis
of detailed election results from earlier in this chapter shows that there has been extremely low
supply of national parties in Benin. It is plausible that the abysmally low supply of national
parties has driven the increased demand for national leaders. Indeed, there is some evidence that
Benin’s party leaders are beginning to respond to these frustrations. For instance, President Boni
has more regularly acknowledged the need to reduce fragmentation in Benin’s party system
through electoral reforms (Hounkpe 2011: 43) and coalitions in 2011 were decidedly more
national than in previous elections (Gazibo 2012: 17). The point here is that high citizen demand
for more nationally oriented politicians may be increasing the horizontal coordination pressures
on leaders thereby encouraging them to build start building more nationally oriented parties.
In addition to the national vs. ethnic leader question discussed above, the AB data
provide other valuable insights into citizens’ attitudes toward political parties in their respective
countries. For instance, the AB asks respondents to choose between Statement 1 “Political
parties create division and confusion; it is therefore unnecessary to have many political parties in
this country” or Statement 2 “Many political parties are needed to make sure that citizens have
real choice in who governs them”.88 This question gauges support for multipartyism, which acts
88 AB Round 5 survey question 35.
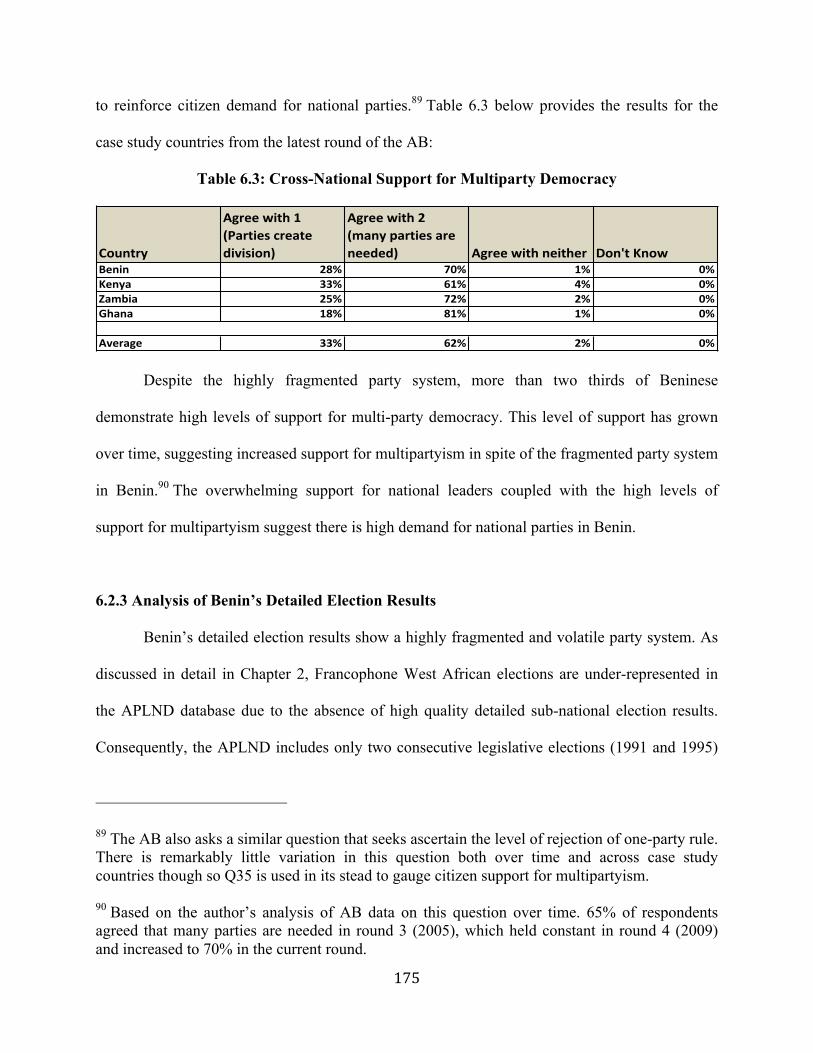
175
to reinforce citizen demand for national parties.89 Table 6.3 below provides the results for the
case study countries from the latest round of the AB:
Table 6.3: Cross-National Support for Multiparty Democracy
Despite the highly fragmented party system, more than two thirds of Beninese
demonstrate high levels of support for multi-party democracy. This level of support has grown
over time, suggesting increased support for multipartyism in spite of the fragmented party system
in Benin.90 The overwhelming support for national leaders coupled with the high levels of
support for multipartyism suggest there is high demand for national parties in Benin.
6.2.3 Analysis of Benin’s Detailed Election Results
Benin’s detailed election results show a highly fragmented and volatile party system. As
discussed in detail in Chapter 2, Francophone West African elections are under-represented in
the APLND database due to the absence of high quality detailed sub-national election results.
Consequently, the APLND includes only two consecutive legislative elections (1991 and 1995)
89 The AB also asks a similar question that seeks ascertain the level of rejection of one-party rule. There is remarkably little variation in this question both over time and across case study countries though so Q35 is used in its stead to gauge citizen support for multipartyism. 90 Based on the author’s analysis of AB data on this question over time. 65% of respondents agreed that many parties are needed in round 3 (2005), which held constant in round 4 (2009) and increased to 70% in the current round.
Country
Agree+with+1+(Parties+create+division)
Agree+with+2+(many+parties+are+needed)+ Agree+with+neither Don't+Know
Benin 28% 70% 1% 0%Kenya 33% 61% 4% 0%Zambia 25% 72% 2% 0%Ghana 18% 81% 1% 0%
Average 33% 62% 2% 0%
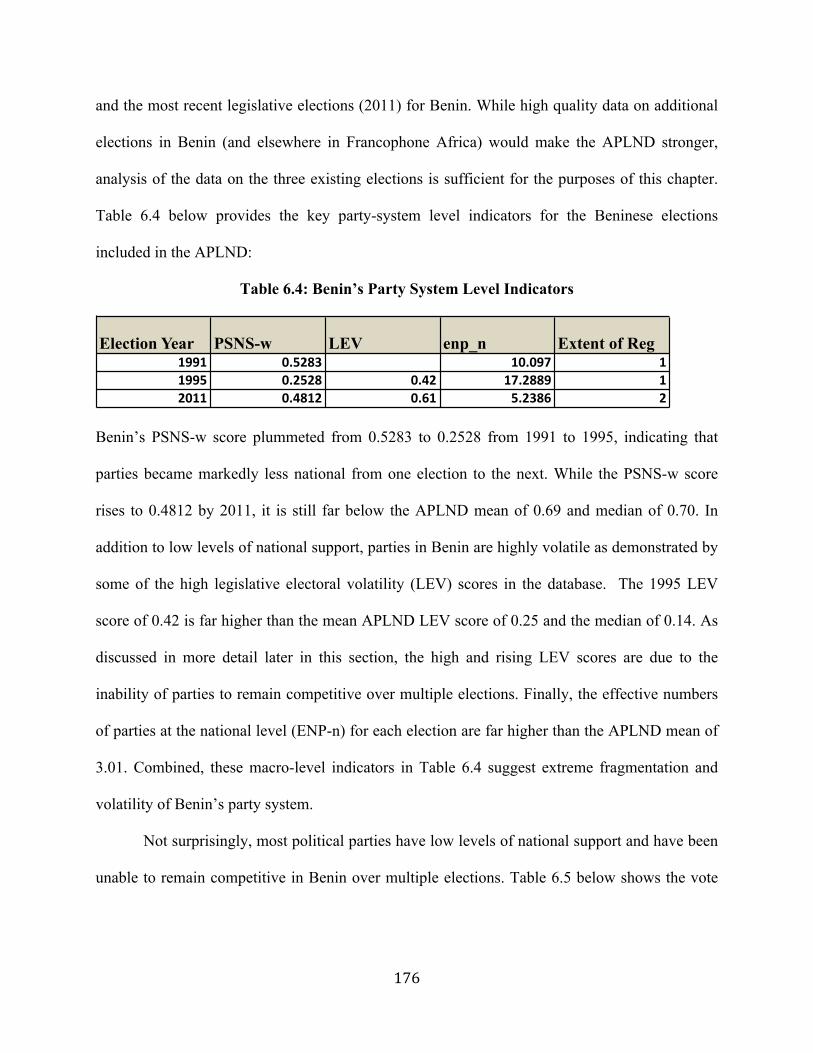
176
and the most recent legislative elections (2011) for Benin. While high quality data on additional
elections in Benin (and elsewhere in Francophone Africa) would make the APLND stronger,
analysis of the data on the three existing elections is sufficient for the purposes of this chapter.
Table 6.4 below provides the key party-system level indicators for the Beninese elections
included in the APLND:
Table 6.4: Benin’s Party System Level Indicators
Benin’s PSNS-w score plummeted from 0.5283 to 0.2528 from 1991 to 1995, indicating that
parties became markedly less national from one election to the next. While the PSNS-w score
rises to 0.4812 by 2011, it is still far below the APLND mean of 0.69 and median of 0.70. In
addition to low levels of national support, parties in Benin are highly volatile as demonstrated by
some of the high legislative electoral volatility (LEV) scores in the database. The 1995 LEV
score of 0.42 is far higher than the mean APLND LEV score of 0.25 and the median of 0.14. As
discussed in more detail later in this section, the high and rising LEV scores are due to the
inability of parties to remain competitive over multiple elections. Finally, the effective numbers
of parties at the national level (ENP-n) for each election are far higher than the APLND mean of
3.01. Combined, these macro-level indicators in Table 6.4 suggest extreme fragmentation and
volatility of Benin’s party system.
Not surprisingly, most political parties have low levels of national support and have been
unable to remain competitive in Benin over multiple elections. Table 6.5 below shows the vote
Election Year PSNS-w LEV enp_n Extent of Reg1991 0.5283 ) 10.097 11995 0.2528 0.42 17.2889 12011 0.4812 0.61 5.2386 2
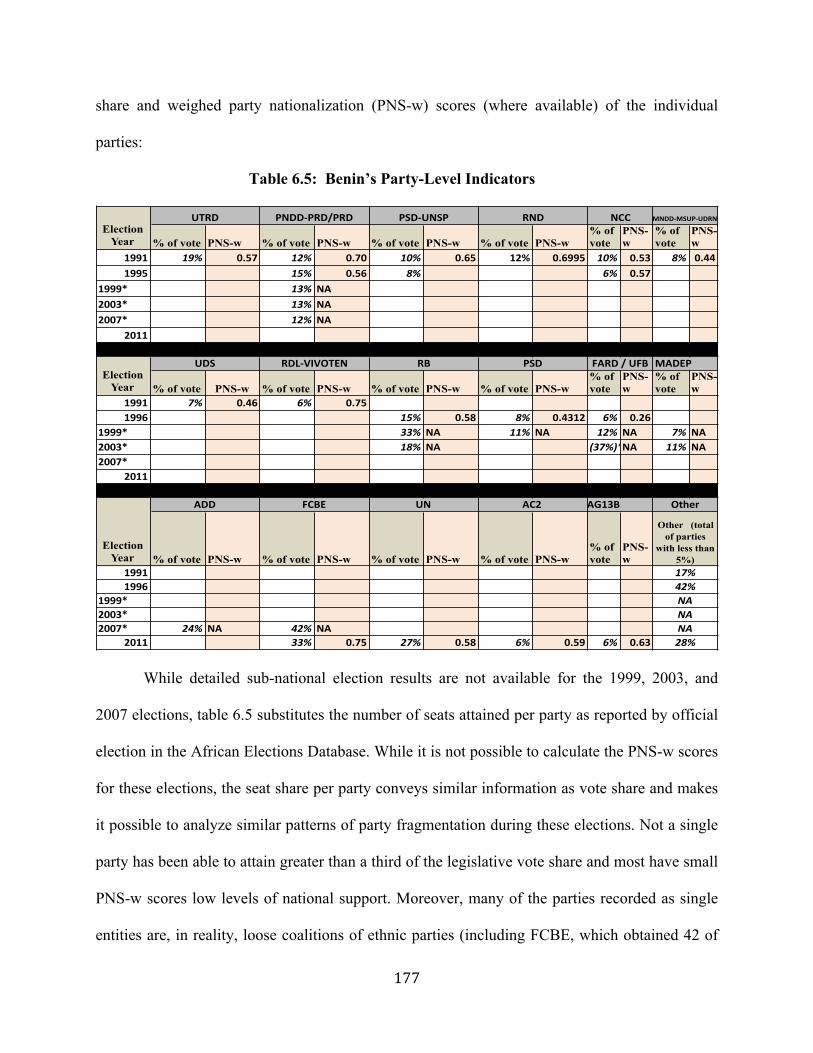
177
share and weighed party nationalization (PNS-w) scores (where available) of the individual
parties:
Table 6.5: Benin’s Party-Level Indicators
While detailed sub-national election results are not available for the 1999, 2003, and
2007 elections, table 6.5 substitutes the number of seats attained per party as reported by official
election in the African Elections Database. While it is not possible to calculate the PNS-w scores
for these elections, the seat share per party conveys similar information as vote share and makes
it possible to analyze similar patterns of party fragmentation during these elections. Not a single
party has been able to attain greater than a third of the legislative vote share and most have small
PNS-w scores low levels of national support. Moreover, many of the parties recorded as single
entities are, in reality, loose coalitions of ethnic parties (including FCBE, which obtained 42 of
% of vote PNS-w % of vote PNS-w % of vote PNS-w % of vote PNS-w% of vote
PNS-w
% of vote
PNS-w
1991 19% 0.57 12% 0.70 10% 0.65 12% 0.6995 10% 0.53 8% 0.441995 15% 0.56 8% 6% 0.57
1999* 13% NA2003* 13% NA2007* 12% NA
2011
MADEP
% of vote PNS-w % of vote PNS-w % of vote PNS-w % of vote PNS-w% of vote
PNS-w
% of vote
PNS-w
1991 7% 0.46 6% 0.751996 15% 0.58 8% 0.4312 6% 0.26 + 4
1999* 33% NA 11% NA 12% NA 7% NA2003* 18% NA (37%)**NA 11% NA2007*
2011
AG13B
% of vote PNS-w % of vote PNS-w % of vote PNS-w % of vote PNS-w% of vote
PNS-w
19911996
1999*2003*2007* 24% NA 42% NA
2011 + 4 33% 0.75 27% 0.58 6% 0.59 6% 0.63
FARD4/4UFB
Other
Other (total of parties
with less than 5%)17%42%NA
28%
NA
Election Year
ADD FCBE UN AC24
NA
MNDDAMSUPAUDRN
Election Year
UDS RDLAVIVOTEN RB PSD
Election Year
UTRD PNDDAPRD/PRD PSDAUNSP RND NCC
178
the vote share across multiple parties in 2007). In other words, if it were possible to ascertain the
vote share of the individual parties within the coalitions, the PNS-w scores would be even lower.
Like Kenya, parties in Benin have been unable to retain their vote share beyond a single election.
In addition, the reader will note the high total vote share of “other” parties that failed to attain
more than five percent of the vote. While the national vote share of parties and their PNS-w
scores are higher in 2011, these figures are still far below the mean and median scores of the
APLND. Combined, the measures in Tables 6.4 and 6.5 provide overwhelming evidence of
extreme party fragmentation and volatility in Benin.
6.2.4 Benin’s Vicious Cycle
The diversity and spatial distribution of ethnic groups within and across multiple electoral
constituencies could have created greater horizontal coordination pressures on politicians to
build strong multiethnic parties in Benin. Instead, the deliberate strategy of prominent politicians
to stitch together weak electoral coalitions of ethnic parties, or abandon parties altogether and
run as independents, dampened these pressures. Furthermore, the ambiguous and poorly
enforced party laws have had negligible influence on the horizontal coordination pressures on
politicians, and they have continued to create and abandon their parties at will. Combined, these
factors have created a vicious cycle in Benin that has over powered high levels of citizen demand
for national parties. Fortunately, however, there is some indication that party leaders may be
heeding to the will of the people by building more nationally oriented coalitions as evidenced in
the latest elections.
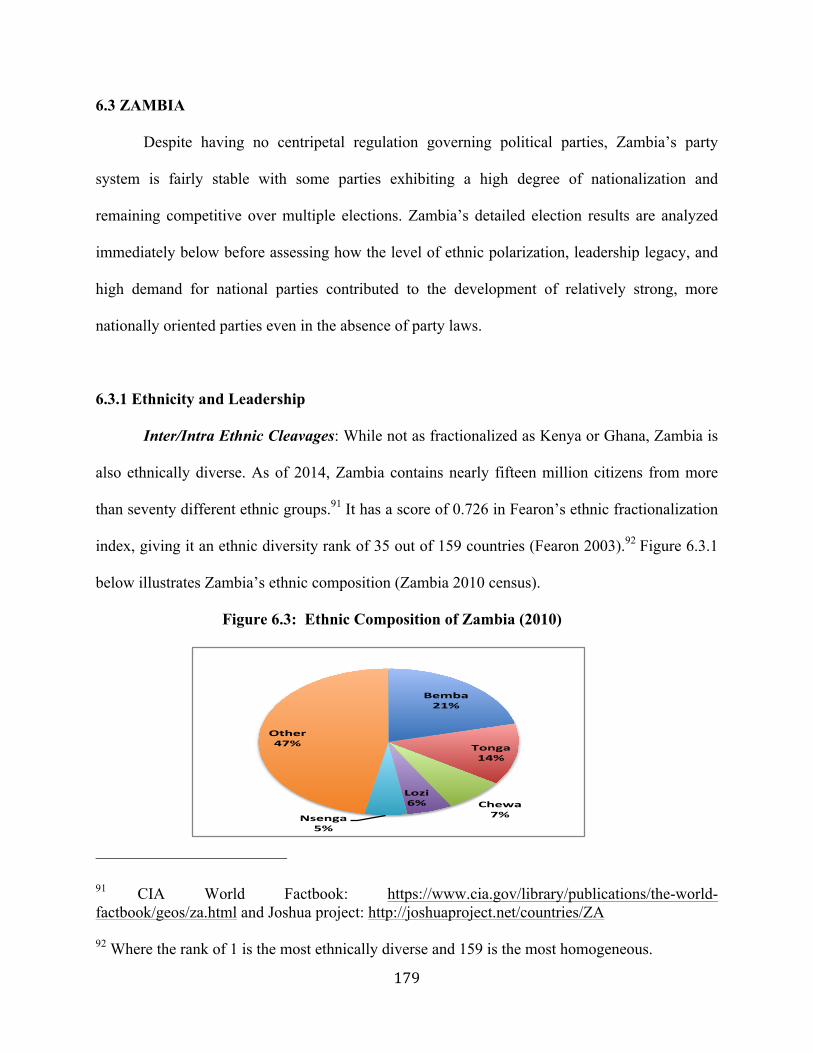
179
6.3 ZAMBIA
Despite having no centripetal regulation governing political parties, Zambia’s party
system is fairly stable with some parties exhibiting a high degree of nationalization and
remaining competitive over multiple elections. Zambia’s detailed election results are analyzed
immediately below before assessing how the level of ethnic polarization, leadership legacy, and
high demand for national parties contributed to the development of relatively strong, more
nationally oriented parties even in the absence of party laws.
6.3.1 Ethnicity and Leadership
Inter/Intra Ethnic Cleavages: While not as fractionalized as Kenya or Ghana, Zambia is
also ethnically diverse. As of 2014, Zambia contains nearly fifteen million citizens from more
than seventy different ethnic groups.91 It has a score of 0.726 in Fearon’s ethnic fractionalization
index, giving it an ethnic diversity rank of 35 out of 159 countries (Fearon 2003).92 Figure 6.3.1
below illustrates Zambia’s ethnic composition (Zambia 2010 census).
Figure 6.3: Ethnic Composition of Zambia (2010)
91 CIA World Factbook: https://www.cia.gov/library/publications/the-world-factbook/geos/za.html and Joshua project: http://joshuaproject.net/countries/ZA 92 Where the rank of 1 is the most ethnically diverse and 159 is the most homogeneous.
Bemba&21%&
Tonga&14%&
Chewa&7%&
Lozi&6%&
Nsenga&5%&
Other&47%&
180
Like Kenya, no single ethnic group comprises more than a quarter of the total population of
Zambia. Yet, whereas ethnic polarization has been a key driver of party development in Kenya,
the influence of ethnicity in Zambia’s multiparty system is somewhat more complex. In his path-
breaking account of the politics of ethnic identity in Zambia, Posner persuasively argues that
Zambians either identify themselves as members of one of their seventy tribes or members of
one of the country’ four main language groups depending on whether the country is operating
under single-party or multi-party rule (Posner 2005). Posner’s evidence shows that during one-
party rule Zambians were more likely to identify with their localized tribal affiliations whereas in
multiparty competition both politicians and voters favored their larger language identities.
Applying my theoretical framework to Posner’s findings, horizontal coordination pressures are
greater during multiparty competition when leaders of Zambia’s smaller tribes need to forge
multiethnic coalitions in order to be more competitive at the polls. As Posner (2005) rightly
notes, the institutional context influences when and how leaders activate ethnicity and to which
identities citizens identify. Nevertheless, Burnell rightly notes that while “ethnicity plays a part
in Zambian politics and in the allocation of jobs and favours in the public service, its significance
is not straightforward and should not be exaggerated” (Burnell 2001: 250). In contrast to Kenya
and Benin where ethnicity has been a primary driver of party development, the influence of
ethnicity on Zambian politics is not as obvious or clear-cut. As discussed in more details below,
successful leaders effectively engage in ethnic balancing in Zambia, yet the ethnic cleavages are
not generally as deep or divisive as they are elsewhere on the continent.
Party Leadership: Part of the explanation as to why ethnic polarization is not as high in
Zambia as in Kenya (or elsewhere in Africa) stems from the different party building strategies
181
employed by leaders in each country. Generally speaking, leaders of the most prominent parties
in Zambia have appealed to national interests and enjoy broad national support instead of
catering primarily to their own ethnic groups. Kenneth Kaunda, Zambia’s first President, made a
concerted effort to foster a sense of Zambian nationalism during his rule from 1964 to 1991. As
Burnell rightly notes, “Kaunda, with his strong sense of purpose to build ‘one Zambia, one
nation,’ feared the ‘tribal’ conflicts could pull UNIP apart” (Burnell 2001: 249). Critics blame
Kaunda for disproportionately favoring his Bemba community towards the end of his tenure
(Elischer 2013: 211), yet it was ultimately his increasingly autocratic ways that contributed to
UNIP’s collapse and subsequent loss to MMD in the 1991 elections (LeBas 2011, Baylies and
Szeftel 1999). Upon ascending to the presidency with the MMD victory in 1991, Chiluba made a
concerted effort to include all major ethnic communities in his cabinets through the end of his
tenure in 2002 (Elischer 2013). Both of Chiluba’s successors--Levy Mwanawasa and Rupiah
Banda--continued this practice by appointing ministers from all the major ethnic groups (ibid:
211,Lusaka Times November 18, 2008). Table 6.3.1 above demonstrates the high PNS scores of
the MMD from 1992 through 2011, indicating broad national support.
While the PF hasn’t achieved the level of national support of MMD, its base grew more
diverse from 2006 to 2011 (Cheeseman and Larmer 2013). In 2011 Michael Sata and the
Patriotic Front (PF) won the presidency. Yet, as noted earlier, while the PF obtained a higher
percentage of parliamentary votes (38%) than the MMD (34%), the PF had a far lower PNS-w
score than MMD (0.69 compared to 0.83). In 2006, PF obtained more votes than any other party
in Sata’s ethnic Bemba homeland of Copperbelt (45%) and in Lusaka (40%), but the party did
182
not receive a majority of votes in any single province.93 In 2011, the PF was dominant and
achieved a majority of parliamentary votes in the Bemba strongholds of Copperbelt (62%),
Luapula (62%), and Northern (54%), and also in ethnically diverse Lusaka (55%).94 After
reviewing party manifestos and campaign rhetoric over multiple election cycles, Elischer
concludes that while PF’s rhetoric started off as heavily pro-Bemba in 2001, Sata has “changed
tune to pursue a pro-poor and anti-Chinese agenda. His main intention was to gain support of the
urban poor from all ethnic communities” (Elischer 2013: 214). After winning the presidency,
Sata has continued with the pro-poor nationalist rhetoric and has openly criticized his opponents
of trying to increase ethnic polarization in party politics.95 Even though PF remains most
successful in Bemba strongholds, Sata has successfully expanded the party’s base by appealing
to broader popular interests.
Even some of the smaller parties in Zambia (ZDC in 1996, FDD in 2001, ZRP in 2001)
have high PNS-w scores, demonstrating widespread support across the whole country. Whereas
party leaders in Kenya and Benin have actively exploited ethnic differences to increase ethnic
polarization to consolidate their voting blocs, Zambian party leaders have generally employed
strategies that use ethnic balancing to reinforce national unity. In his oft-cited Zambia-Malawi
comparison, Posner (2004) demonstrates that the relative size of the ethnic blocs determines the
level of fragmentation and political salience of ethnicity. Both the ethnic composition (the
relative size of ethnic blocs) of the county and the campaign strategies of party leaders have
93 As calculated by the author from official parliamentary election results 94 As calculated by the author from official parliamentary election results 95 For instance, see: http://zwd.cums.in/sata-accuses-rb-and-cronies-of-trying-to-divide-zambia-on-ethinic-lines/comment-page-4/
183
created higher levels of horizontal coordination in Zambia compared to Kenya or Benin. The
absence of a single dominant tribe in Zambia encourages multiethnic alliances in order for
parties to obtain electoral victory. Likewise, the decision by party leaders to focus on national
rather than ethno-regional interests has led them to build parties with broader support.
6.3.2 Content, Enforcement, and Demand
Content: Like Kenya prior to the 2013 elections, Zambia does not have any political
party specific regulations. Just as was the case in Kenya from 1992 through 2007, the Registrar
of Societies, as mandated by the Societies Act (Cap 119), is the body responsible for overseeing
political party registration in Zambia (Momba 2005).96 Like all other organizations covered
under the Act, a political party must apply for registration within 28 days of its founding
[Societies Act, 6(1), 7(3)]. The Registrar can deny registration if: the party’s goals are illegal
[Societies Act, 8], the party’s constitution violates Zambia law [Societies Act, 9(a)], the
application fails to comply with the Societies Act [Societies Act, 9(b)], the party does not exist
[Societies Act, 9(c)], or the party’s name is identical or too nearly resembles an existing society,
or is “repugnant to or inconsistent with the provisions of any law for the time being in force in
Zambia” [Societies Act, 9(d)]. The Societies Act does not: ban ethnic parties, ban ethnic party
names, establish a membership threshold, set branch office requirements, or mandate any
internal democracy requirements. As such, Zambian law achieves a score of “0,” the lowest
possible score, on the APLND’s extent of centripetal regulation. The low extent of regulation
establishes minimal legal barriers of entry, making it easy for leaders to establish parties in
Zambia. The ambiguous content of the Act, in and of itself, has no provisions to encourage
96 For a complete copy of the Societies Act in full, please see: http://www.zambialii.org/zm/legislation/consolidated-act/119
184
multiethnic cooperation and therefore should have no influence on the extent of horizontal
coordination pressures on politicians.
Enforcement: While the content of Zambia’s party law is similar to that of Kenya’s prior
to 2011, the means by which the laws were enforced in each country are drastically different. As
detailed in Chapter 4, the incumbent regimes in Kenya used the ambiguity of the Societies Act to
selectively enforce the law in order to fragment or otherwise thwart their opposition (also see
Moroff 2010). In Zambia, however, the “ruling party did not take advantage of its incumbency to
subvert election results” (Lebas 2011:218). For instance, prior to the 1991 elections, Bratton
notes that Zambia’s head of civil service issued orders to limit public officials’ involvement in
UNIP campaigns (Bratton 1992: 90). Unlike Kenya, efforts were made to delink the parties from
government institutions (Lebas 2011, Andreassen et al. 1992). As a result, the Registrar of
Societies and the Electoral commission were able to maintain autonomy and established a
reputation of administering (comparatively) free and fair elections (Kerr 2013, Momba 2005,
Rakner + Svasland 2003).97 Despite the vague and ambiguous content of the law, the fair and
universal enforcement of regulations increased horizontal coordination pressures by creating a
more level electoral paying ground.
Demand: Citizen demand for national parties and support of multipartyism is high in
Zambia. Figure 6.2.3 shows that 82% of Zambians say they favor national leaders over ethnic
leaders (which is the socially acceptable response). This is higher than the levels of support for
national leaders in both Kenya, Zambia, and Ghana and just below Benin. Burnell captures this
high citizen demand for national parties when he states:
97 This sentiment is corroborated by joint NDI and Carter Center observation reports of 1992 elections, EISA’s reports of subsequent elections, and the author’s interviews with election observation experts.
185
Claims that a party or candidate is tribally-based are often negative allegations that are made about political opponents, especially in contests occurring outside their region, in order to question the legitimacy of their campaign and harm their chances, rather than being a positive strategy of mobilization that politicians use to win support. (Burnell 2001: 250
The quote above from Burnell is anecdotal, yet it accurately captures the sentiment that most
Zambians strongly prefer national rather than ethnic party leaders. Not surprisingly, there is also
a high support for multipartyism in Zambia. Table 6.2.4 shows that nearly three quarters of
survey respondents (72%) agree that many parties are needed. Of the comparative case studies in
this chapter, this score is second only to Ghana. Also of interest, this level of multiparty support
has steadily risen from 52% in 2003 to 63% in 2005 to 70% in 2009 to 72% in 2012.98 While the
supply of national parties is not as high as elsewhere in sub-Saharan Africa, this analysis of AB
data suggests that the demand for national parties and support for multipartyism is strong and
growing in Zambia.
6.3.3 Analysis of Zambia’s Detailed Election Results
Detailed election results from Zambia demonstrate that while its party system is more
stable and less fragmented than Benin’s or Kenya’s, the level of nationalization has dropped
precipitously since the 1990s. Below, Table 6.6 provides the key macro-level party-system level
indicators from 1991 to 2011:
98 Based on the author’s calculations of Afrobarometer data on this question from rounds 2 – 5.
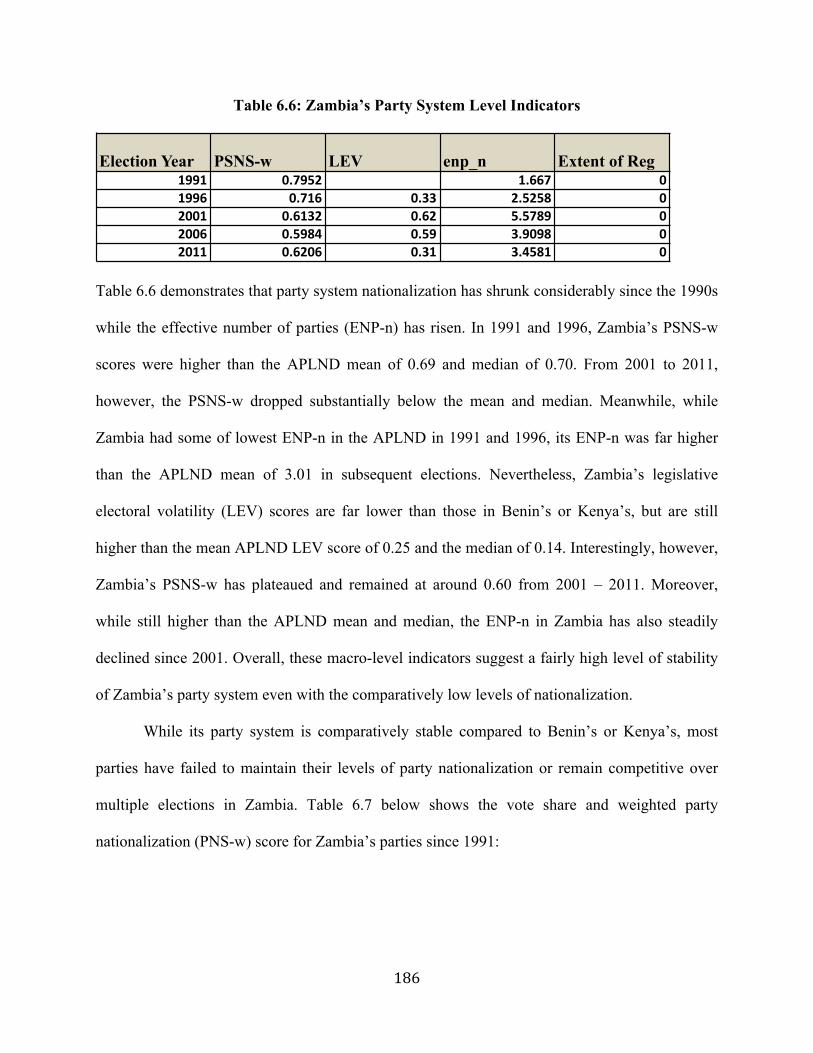
186
Table 6.6: Zambia’s Party System Level Indicators
Table 6.6 demonstrates that party system nationalization has shrunk considerably since the 1990s
while the effective number of parties (ENP-n) has risen. In 1991 and 1996, Zambia’s PSNS-w
scores were higher than the APLND mean of 0.69 and median of 0.70. From 2001 to 2011,
however, the PSNS-w dropped substantially below the mean and median. Meanwhile, while
Zambia had some of lowest ENP-n in the APLND in 1991 and 1996, its ENP-n was far higher
than the APLND mean of 3.01 in subsequent elections. Nevertheless, Zambia’s legislative
electoral volatility (LEV) scores are far lower than those in Benin’s or Kenya’s, but are still
higher than the mean APLND LEV score of 0.25 and the median of 0.14. Interestingly, however,
Zambia’s PSNS-w has plateaued and remained at around 0.60 from 2001 – 2011. Moreover,
while still higher than the APLND mean and median, the ENP-n in Zambia has also steadily
declined since 2001. Overall, these macro-level indicators suggest a fairly high level of stability
of Zambia’s party system even with the comparatively low levels of nationalization.
While its party system is comparatively stable compared to Benin’s or Kenya’s, most
parties have failed to maintain their levels of party nationalization or remain competitive over
multiple elections in Zambia. Table 6.7 below shows the vote share and weighted party
nationalization (PNS-w) score for Zambia’s parties since 1991:
Election Year PSNS-w LEV enp_n Extent of Reg1991 0.7952 ( 1.667 01996 0.716 0.33 2.5258 02001 0.6132 0.62 5.5789 02006 0.5984 0.59 3.9098 02011 0.6206 0.31 3.4581 0
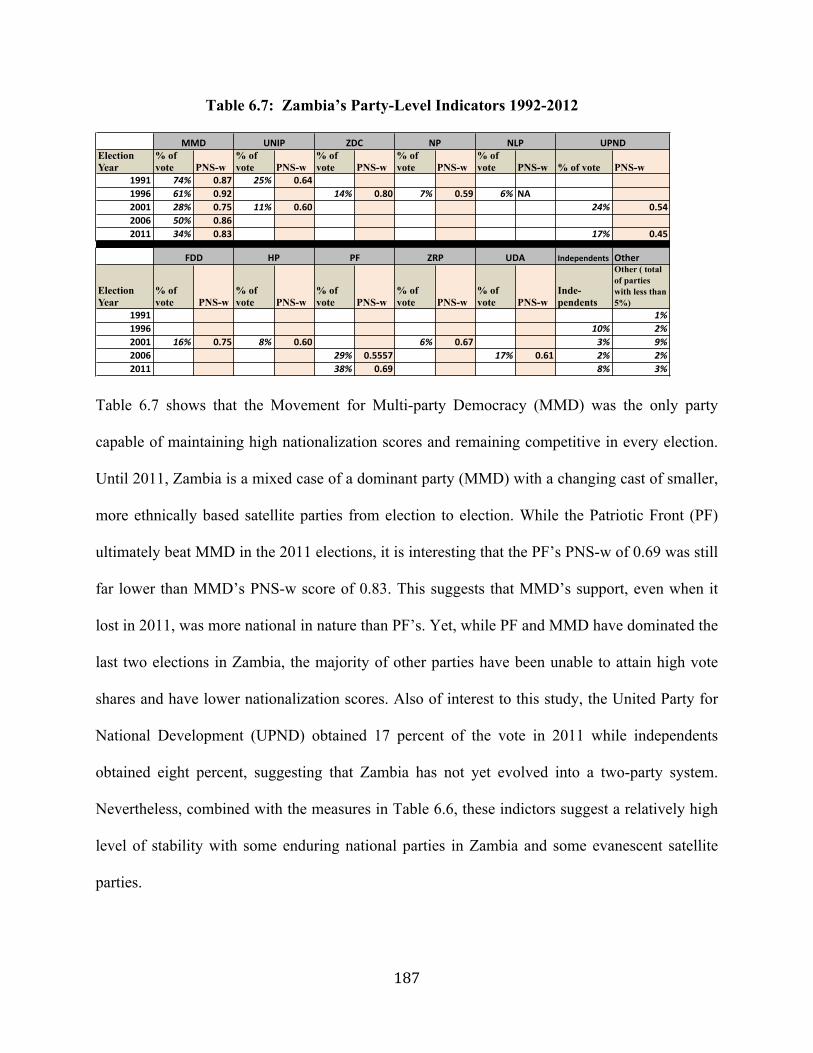
187
Table 6.7: Zambia’s Party-Level Indicators 1992-2012
Table 6.7 shows that the Movement for Multi-party Democracy (MMD) was the only party
capable of maintaining high nationalization scores and remaining competitive in every election.
Until 2011, Zambia is a mixed case of a dominant party (MMD) with a changing cast of smaller,
more ethnically based satellite parties from election to election. While the Patriotic Front (PF)
ultimately beat MMD in the 2011 elections, it is interesting that the PF’s PNS-w of 0.69 was still
far lower than MMD’s PNS-w score of 0.83. This suggests that MMD’s support, even when it
lost in 2011, was more national in nature than PF’s. Yet, while PF and MMD have dominated the
last two elections in Zambia, the majority of other parties have been unable to attain high vote
shares and have lower nationalization scores. Also of interest to this study, the United Party for
National Development (UPND) obtained 17 percent of the vote in 2011 while independents
obtained eight percent, suggesting that Zambia has not yet evolved into a two-party system.
Nevertheless, combined with the measures in Table 6.6, these indictors suggest a relatively high
level of stability with some enduring national parties in Zambia and some evanescent satellite
parties.
Election Year
% of vote PNS-w
% of vote PNS-w
% of vote PNS-w
% of vote PNS-w
% of vote PNS-w % of vote PNS-w
1991 74% 0.87 25% 0.641996 61% 0.92 14% 0.80 7% 0.59 6% NA2001 28% 0.75 11% 0.60 24% 0.542006 50% 0.862011 34% 0.83 17% 0.45
Independents Other
Election Year
% of vote PNS-w
% of vote PNS-w
% of vote PNS-w
% of vote PNS-w
% of vote PNS-w
Inde-pendents
Other ( total of parties with less than 5%)
1991 1%1996 10% 2%2001 16% 0.75 8% 0.60 6% 0.67 3% 9%2006 29% 0.5557 17% 0.61 2% 2%2011 38% 0.69 8% 3%
UNIPMMD
UDA
NLP UPNDNPZDC
FDD HP PF ZRP
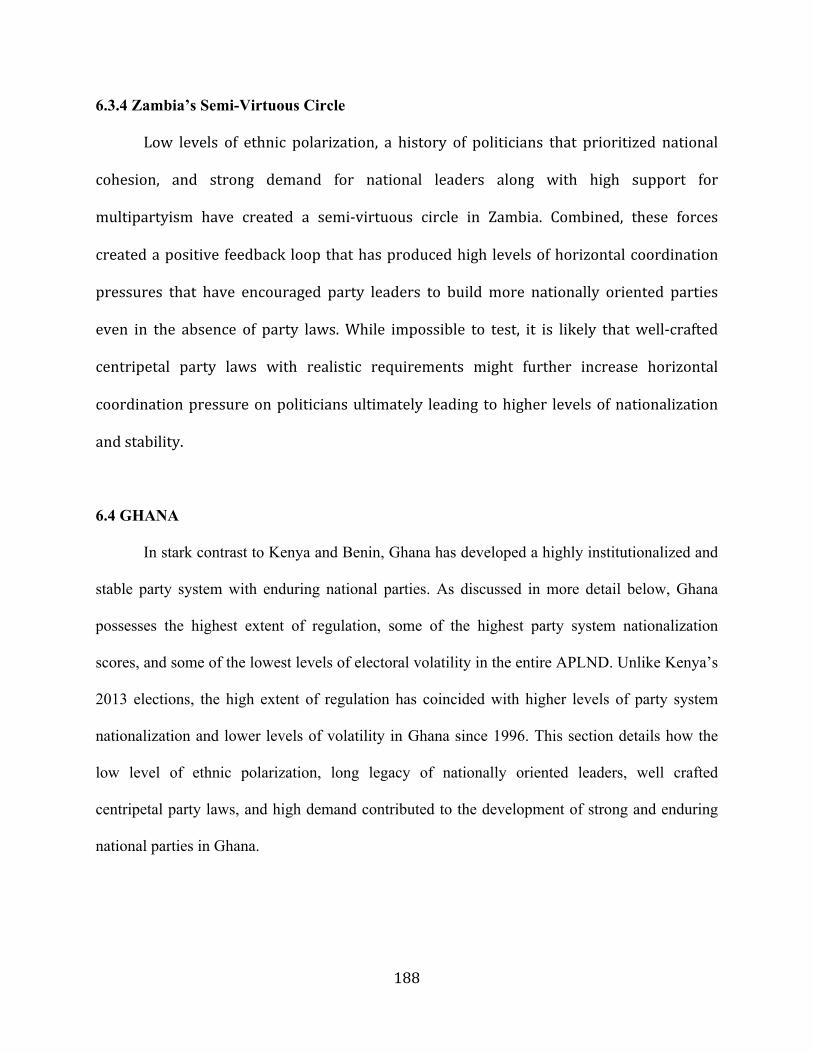
188
6.3.4 Zambia’s Semi-Virtuous Circle
Low levels of ethnic polarization, a history of politicians that prioritized national
cohesion, and strong demand for national leaders along with high support for
multipartyism have created a semi-‐virtuous circle in Zambia. Combined, these forces
created a positive feedback loop that has produced high levels of horizontal coordination
pressures that have encouraged party leaders to build more nationally oriented parties
even in the absence of party laws. While impossible to test, it is likely that well-‐crafted
centripetal party laws with realistic requirements might further increase horizontal
coordination pressure on politicians ultimately leading to higher levels of nationalization
and stability.
6.4 GHANA
In stark contrast to Kenya and Benin, Ghana has developed a highly institutionalized and
stable party system with enduring national parties. As discussed in more detail below, Ghana
possesses the highest extent of regulation, some of the highest party system nationalization
scores, and some of the lowest levels of electoral volatility in the entire APLND. Unlike Kenya’s
2013 elections, the high extent of regulation has coincided with higher levels of party system
nationalization and lower levels of volatility in Ghana since 1996. This section details how the
low level of ethnic polarization, long legacy of nationally oriented leaders, well crafted
centripetal party laws, and high demand contributed to the development of strong and enduring
national parties in Ghana.
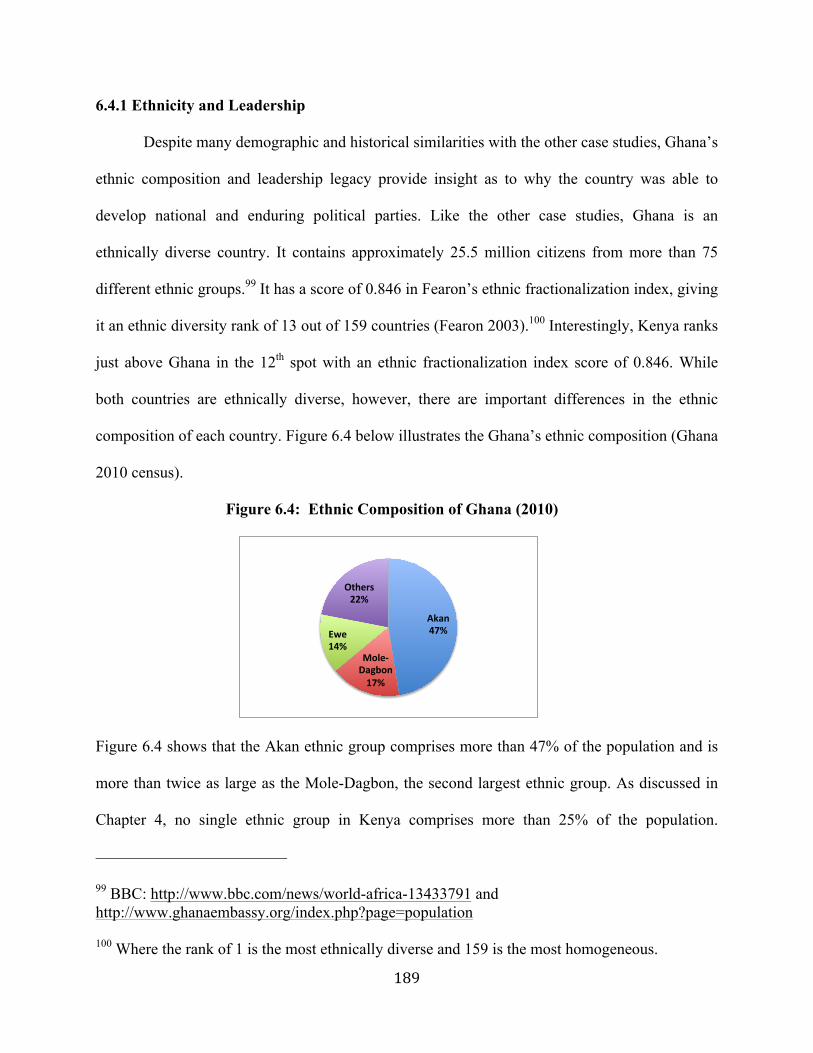
189
6.4.1 Ethnicity and Leadership
Despite many demographic and historical similarities with the other case studies, Ghana’s
ethnic composition and leadership legacy provide insight as to why the country was able to
develop national and enduring political parties. Like the other case studies, Ghana is an
ethnically diverse country. It contains approximately 25.5 million citizens from more than 75
different ethnic groups.99 It has a score of 0.846 in Fearon’s ethnic fractionalization index, giving
it an ethnic diversity rank of 13 out of 159 countries (Fearon 2003).100 Interestingly, Kenya ranks
just above Ghana in the 12th spot with an ethnic fractionalization index score of 0.846. While
both countries are ethnically diverse, however, there are important differences in the ethnic
composition of each country. Figure 6.4 below illustrates the Ghana’s ethnic composition (Ghana
2010 census).
Figure 6.4: Ethnic Composition of Ghana (2010)
Figure 6.4 shows that the Akan ethnic group comprises more than 47% of the population and is
more than twice as large as the Mole-Dagbon, the second largest ethnic group. As discussed in
Chapter 4, no single ethnic group in Kenya comprises more than 25% of the population.
99 BBC: http://www.bbc.com/news/world-africa-13433791 and http://www.ghanaembassy.org/index.php?page=population 100 Where the rank of 1 is the most ethnically diverse and 159 is the most homogeneous.
Akan%47%%
Mole-Dagbon%17%%
Ewe%14%%
Others%22%%
190
Elsewhere on the continent, scholars have shown that the size of ethnic groups largely defines
their political salience and is a powerful predictor of whether or not they will be useful vehicles
for political mobilization (Posner 2004). Considering its size compared to the other ethnic groups
in the country, it is not surprising then that the Akan have dominated Ghana’s political arena
before and after independence. Asante and Gyimah-Boadi aptly note: “Even though no part of
Ghana is ethnically homogeneous, an overriding feature of the country’s ethnic polarization is
the north-south divide and the dominance of the southern half of Ghana in general, and in
particular by the Akan group” (Asante and Gyimah-Boadi 2004: 2). Like Benin and Kenya, deep
ethnic tensions exist in Ghana (ibid, Yalae 2006). Yet, the large size of the Akan, compared to
the other ethnic groups in Ghana and relative to differences in ethnic composition elsewhere in
Africa, could help explain national party development in Ghana. While the Akan have a sizeable
plurality, they don’t have a majority, meaning that cross-ethnic coalitions with other groups are
necessary for electoral victory. In order to be successful, parties need not only Akan support, but
also the support of other ethnic groups. Ghana’s ethnic composition may have influenced party
leaders’ decision to invest in strong multiethnic parties instead of weak coalitions of convenience
of ethnic parties. Ultimately, the Akan’s sizeable plurality increases horizontal coordination
pressures on party leaders by forcing them to build internal alliances with leaders of other ethnic
groups in order to achieve the necessary electoral majority.
In stark contrast to the other cases, leaders from both the NDC and NPP played an
important role in encouraging the development of enduring national parties in Ghana. Before
discussing the role that leaders of the NDC and NPP played in shaping the trajectory of party
development during the multiparty era, it is necessary to acknowledge the enduring legacy of
Kwame Nkrumah and Joseph Boakye Danquah, Nkrumah was Ghana’s first President. He saw
191
himself as an African Lenin (Mazrui 1963) and was a leading advocate of Pan-Africanism and a
founding member of the Organisation of African Unity (OAU). Danquah was the primary
opposition leader to Nkrumah, and a committed pan-Africanist, scholar, and statesman in his
own right (Okoampa-Ahoofe 2005). Danquah cofounded the United Gold Coast Convention
(UGCC) party in 1947 and, like Nkrumah, was a vocal critic of British colonial rule who
demanded constitutional reform and self-rule (ibid). Initially a member of UGCC, Nkrumah went
on to form the more radical and revolutionary Convention People’s Party (CPP) in 1949
(Birmingham 1998). Later, in the 1960 presidential elections, Nkrumah handily defeated
Danquah at the polls and obtained nearly 90% of the vote. As an opposition leader, Danquah
spoke out against Nkrumah’s policies and growing intolerance and was repeatedly imprisoned
until his death in 1964 (Okoampa-Ahoofe 2005). Despite their differences, Danquah and
Nkrumah shared a common vision of a unified and independent Ghanaian state. Nkrumah’s
presidency was marred by increasingly authoritarian tendencies, yet he successfully unified the
four territories of the Gold Coast and is widely viewed as the “father of African nationalism”
(Birmingham 1998). Unlike Jomo Kenyatta who blatantly prioritized the interests of his own
ethnic group in Kenya (Miguel 2004), both Nkrumah and Danquah are credited with fostering a
stronger sense of national cohesion and nationhood within Ghana (Birmingham 1998; Okoampa-
Ahoofe 2005).
Several decades later, party leaders of both the NDC and NPP have preserved Nkrumah’s
and Danquah’s legacy of fostering national cohesion within Ghana. As Riedl notes, both the
NDC and NPP:
“…are deeply connected to their constituencies, they organize across the national territory to compete in every constituency, they mobilize participation during and beyond elections, and they aggregate coalitions of diverse citizens and interests.” (Riedl 2014: 1)
192
Despite deep ethnic tensions, party leaders of both the NDC and NPP aggressively pursued
strategies to bolster their respective party’s national character. Whereas the NDC saw itself as
following in the footsteps of Nkrumah, the NPP looks more to the legacy of Danquah. While led
by J.J. Rawlings (an ethnic Ewe) from 1992 to 2000, some perceived the NDC as being the
political party of the Ewe and the North (Nugent 2001). But as Elischer aptly notes, “…despite a
bias in favour of the Volta and Northern regions in terms of Cabinet appointments, the NDC
leadership has been cross-cutting along ethnic lines before and after being in power” (Elischer
2008: 188). Rawlings’ decision to choose John Atta Mills, an Akan, as his successor as the
NDC’s presidential candidate is evidence of the multiethnic nature of the party. Akan leaders, on
the other hand, have traditionally dominated NPP, yet “it consistently managed to bridge the
country’s dominant cleavage lines between Akan and Ewe as well as North and South” (ibid; see
also Elischer 2013, and Danso-Boafo 1996). Unlike Moi’s cabinet in Kenya that
disproportionately favored the Kalenjin and related groups (see Chapter 4), the NPP’s cabinet
(after winning the 2000 elections) exhibited ethnic balance (Ayensu and Darkwa 1999: 101-105,
Elischer 2008). While deep ethnic tensions exist in Ghana as they do in Kenya and Benin, party
leaders of both the NDC and NPP deliberately chose to build strong, national parties that
encouraged national cohesion instead of using their parties as vehicles to increase ethnic
polarization before elections. From Nkrumah onwards this legacy of leaders who promoted
national cohesion likely increased the horizontal coordination pressures on successive party
leaders to build multiethnic parties.
193
6.4.2 Content, Enforcement, and Demand
Content: The main legal document responsible for governing political parties in Ghana is
the Political Parties Law of 1992-PNDCL 281 (PPL 1992) as amended in 2000–Act 574 (PPL
2000) (Nordlund 2004, Ninsin 2006). While the PPL 2000 includes important changes pertaining
to alliances and mergers (Part II, 19-20), the language in the components of the law pertaining to
party registration requirements remains virtually unchanged between the PPL 1992 and the PPL
2000. As such, each law achieves a score of 5, the highest possible, on the APLND’s extent of
centripetal regulation. More specifically, the PPL 2000: 1) explicitly bans ethnic parties [Part I,
3], 2) prohibits ethnic party names and symbols [Part 1, 9 (e)], 3) mandates that “the party has
branches in all regions and is, in addition organized in not less than two-thirds of the districts in
each region” [Part I, 9 (c)], 4) dictates that “the party has on its national executive committee one
member from each region [Part I, 9 (b)] with at least “one founding member of the party who is
ordinarily resident in the district or is a registered voter in the district”, and 5) the internal
organization of the party “conforms with democratic principles” (Part 1, 9 (a)]. Ghana’s party
laws aren’t nearly as long, detailed, or prescriptive as Kenya’s PPA 2011. Whereas Kenya’s PPL
2011 sets high thresholds of 1000 members in more than half of the country’s 47 districts,
Ghana’s PPL 2000 simply requires that each party’s National Executive Committee (NEC)
contain members from each region and that parties need at least one founding member in each
district (Ghana had 170 districts in 1992 which rose to 216 in 2012101). Nevertheless, the PPL
2000 contains some of the strongest language of its intent to regulate the national character of
parties of any law in the APLND. For instance, after introducing its ban on particularistic parties,
the PPL 2000 goes on to state:
101 For a full list of Ghana’s districts see: http://www.statoids.com/ygh.html
194
“For the purpose of subsection (1), a political party is formed on ethnic, gender, religious, regional, professional or other sectional divisions if its membership or leadership is restricted to members of any particular community, region, ethnic group, gender, religious faith or profession, or if its structure and mode of operation are not national in character.” [PPL 2000, Part 1, 3(2)]
The article above grants the Electoral Commission of Ghana (ECG), the institutional body in
charge of overseeing party registration, wide license to regulate the national character of Ghana’s
political parties. The high extent of centripetal regulation and the unambiguous language make it
clear that the intent of Ghana’s party laws is to foster development of national political parties.
Enforcement: The Electoral Commission of Ghana has universally enforced the
country’s political party laws and is widely lauded as one of the most credible, competent, and
fair electoral management bodies (EMB) in all of Sub-Saharan Africa (Kerr 2013 and 2014;
Debrah 2011). While many elections in Africa have been marred by serious irregularities (for
instance Kenya’s 2007 elections), the ECG has successfully managed five general elections with
only minor errors (IDEA report 2012). As Debrah (2011) rightly notes, “The EC insulated itself
from executive controls by demonstrating that it could make its own electoral rules to govern the
conduct of the elections even if the governments of the NDC and NPP were determined to
manipulate aspects of the electoral process” (Debrah 2011: 32). Importantly, the Constitution of
Ghana safeguards the autonomy of members of the EC by dictating that members can only be
dismissed on the grounds of health reasons (Constitution of Kenya 1992) and presidential
appointees are “thoroughly scrutinized by the appointment committee of Parliament” (Debrah
2011: 31). This high level of autonomy gave the ECG the ability to create a more level electoral
playing field. Pertaining to the implementation of party laws the ECG “created new regions and
constituencies, merged existing ones, and outlined the modalities for political party registration
195
in line with its constitutional mandate” (ibid: 32). While the number of political parties (if any)
denied registration by the ECG since 1992 is unclear, the ECG has not dissolved any parties due
to lack of compliance with Ghana’s party laws (Moroff 2010). Nevertheless, in contrast to the
lax enforcement of party laws in Kenya’s 2013 elections, the ECG has rigorously enforced
Ghana’s party registration laws from 1992 onwards. Moreover, the ECG has universally
enforced these laws to all parties. As a result, party leaders take the laws seriously in Ghana and
make serious efforts to make certain their parties remain in compliance.102 The high barriers to
entry imposed on parties by the laws and institutional framework (Riedl 2014) likely contributed
to the comparatively low numbers of parties in Ghana compared to the other countries in the
APLND. Since the content of Ghana’s party regulations explicitly aims to develop national
parties, the ECG’s universal enforcement of these laws increased horizontal coordination
pressures on party leaders by strongly encouraging multiethnic coalitions.
Demand: As expected, citizen demand for national parties and support of multipartyism
is high in Ghana. Table 6.2.3, shows that nearly three quarters of the population favor national
leaders over ethnic leaders. Interestingly, however, there are lower levels of support in Ghana
compared to the other case studies, but an overwhelming majority of Ghanaians still prefer
national leaders rather than ethnic leaders. More in-line with expectations, Ghanaians express the
highest level of support for multipartyism (81%) compared to respondents in the other case
studies. Just as was the case in Zambia, this level of multiparty support has steadily risen over
102 In interviews with the author, two separate Ghanaian political analysts noted that even though the ECG hasn’t deregistered any parties, leaders from across the parties take the institution seriously and make concerted efforts to remain in compliance.
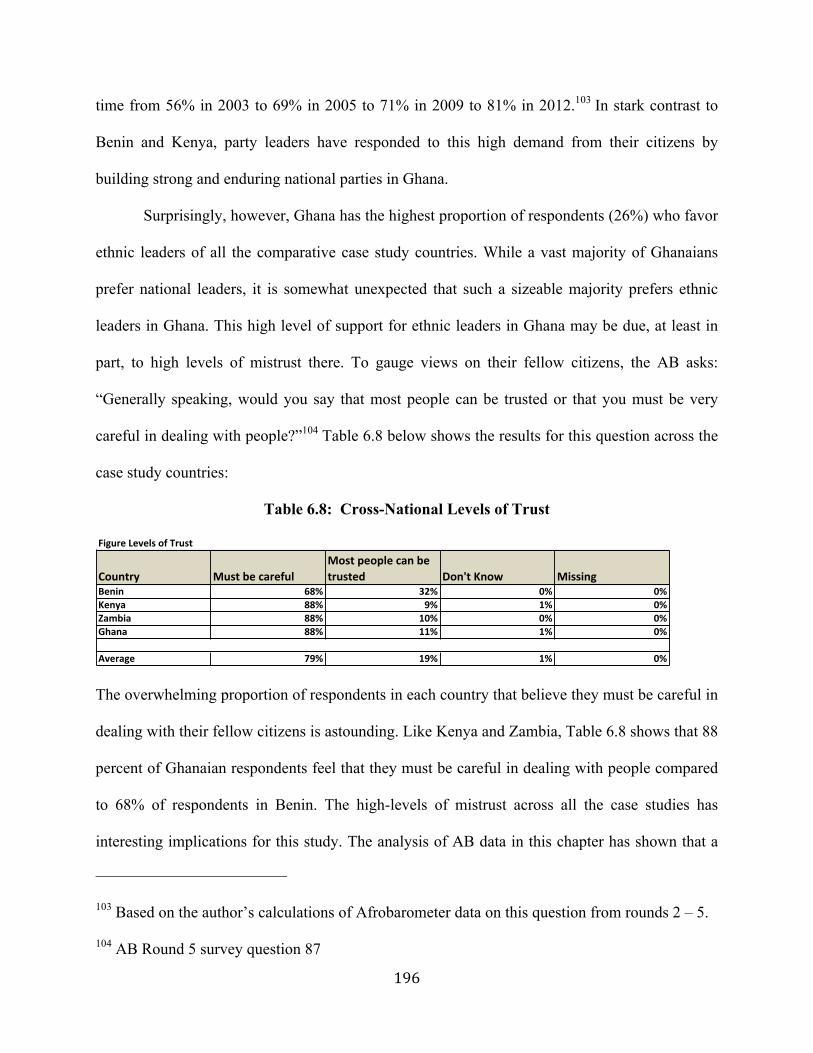
196
time from 56% in 2003 to 69% in 2005 to 71% in 2009 to 81% in 2012.103 In stark contrast to
Benin and Kenya, party leaders have responded to this high demand from their citizens by
building strong and enduring national parties in Ghana.
Surprisingly, however, Ghana has the highest proportion of respondents (26%) who favor
ethnic leaders of all the comparative case study countries. While a vast majority of Ghanaians
prefer national leaders, it is somewhat unexpected that such a sizeable majority prefers ethnic
leaders in Ghana. This high level of support for ethnic leaders in Ghana may be due, at least in
part, to high levels of mistrust there. To gauge views on their fellow citizens, the AB asks:
“Generally speaking, would you say that most people can be trusted or that you must be very
careful in dealing with people?”104 Table 6.8 below shows the results for this question across the
case study countries:
Table 6.8: Cross-National Levels of Trust
The overwhelming proportion of respondents in each country that believe they must be careful in
dealing with their fellow citizens is astounding. Like Kenya and Zambia, Table 6.8 shows that 88
percent of Ghanaian respondents feel that they must be careful in dealing with people compared
to 68% of respondents in Benin. The high-levels of mistrust across all the case studies has
interesting implications for this study. The analysis of AB data in this chapter has shown that a
103 Based on the author’s calculations of Afrobarometer data on this question from rounds 2 – 5. 104 AB Round 5 survey question 87
Figure'Levels'of'Trust
Country Must'be'carefulMost'people'can'be'trusted Don't'Know Missing
Benin 68% 32% 0% 0%Kenya 88% 9% 1% 0%Zambia 88% 10% 0% 0%Ghana 88% 11% 1% 0%
Average 79% 19% 1% 0%
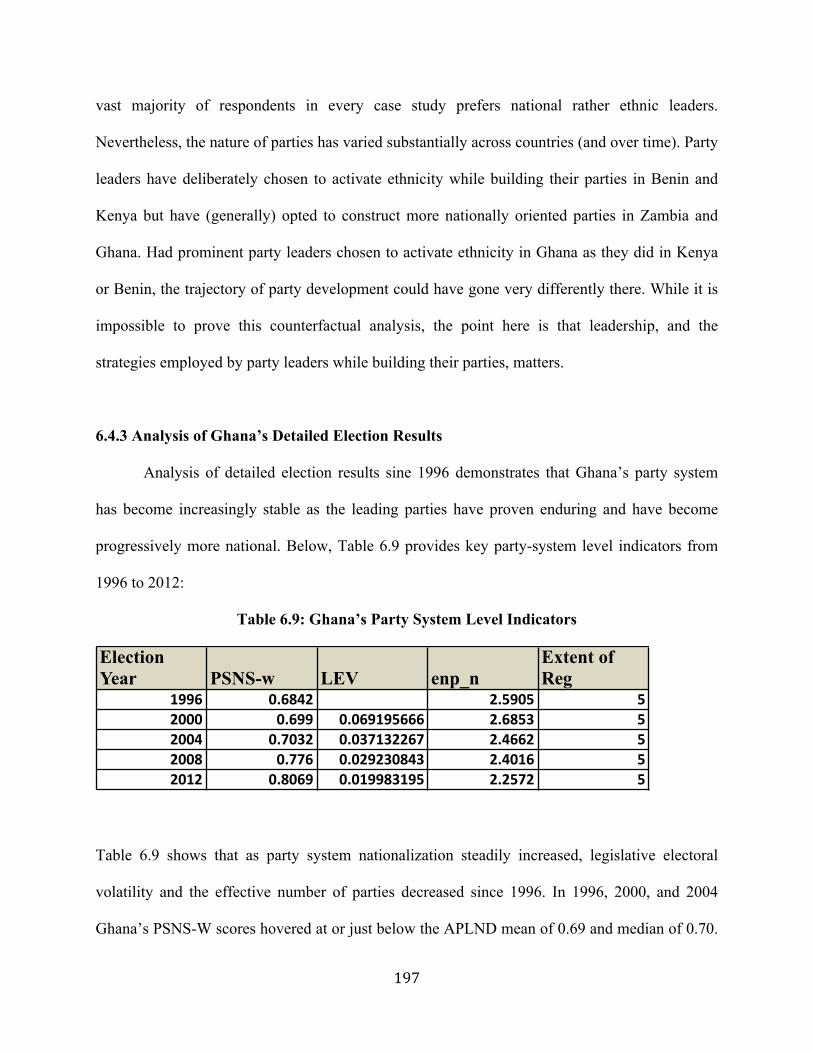
197
vast majority of respondents in every case study prefers national rather ethnic leaders.
Nevertheless, the nature of parties has varied substantially across countries (and over time). Party
leaders have deliberately chosen to activate ethnicity while building their parties in Benin and
Kenya but have (generally) opted to construct more nationally oriented parties in Zambia and
Ghana. Had prominent party leaders chosen to activate ethnicity in Ghana as they did in Kenya
or Benin, the trajectory of party development could have gone very differently there. While it is
impossible to prove this counterfactual analysis, the point here is that leadership, and the
strategies employed by party leaders while building their parties, matters.
6.4.3 Analysis of Ghana’s Detailed Election Results
Analysis of detailed election results sine 1996 demonstrates that Ghana’s party system
has become increasingly stable as the leading parties have proven enduring and have become
progressively more national. Below, Table 6.9 provides key party-system level indicators from
1996 to 2012:
Table 6.9: Ghana’s Party System Level Indicators
Table 6.9 shows that as party system nationalization steadily increased, legislative electoral
volatility and the effective number of parties decreased since 1996. In 1996, 2000, and 2004
Ghana’s PSNS-W scores hovered at or just below the APLND mean of 0.69 and median of 0.70.
Election Year PSNS-w LEV enp_n
Extent of Reg
1996 0.6842 ) 2.5905 52000 0.699 0.069195666 2.6853 52004 0.7032 0.037132267 2.4662 52008 0.776 0.029230843 2.4016 52012 0.8069 0.019983195 2.2572 5
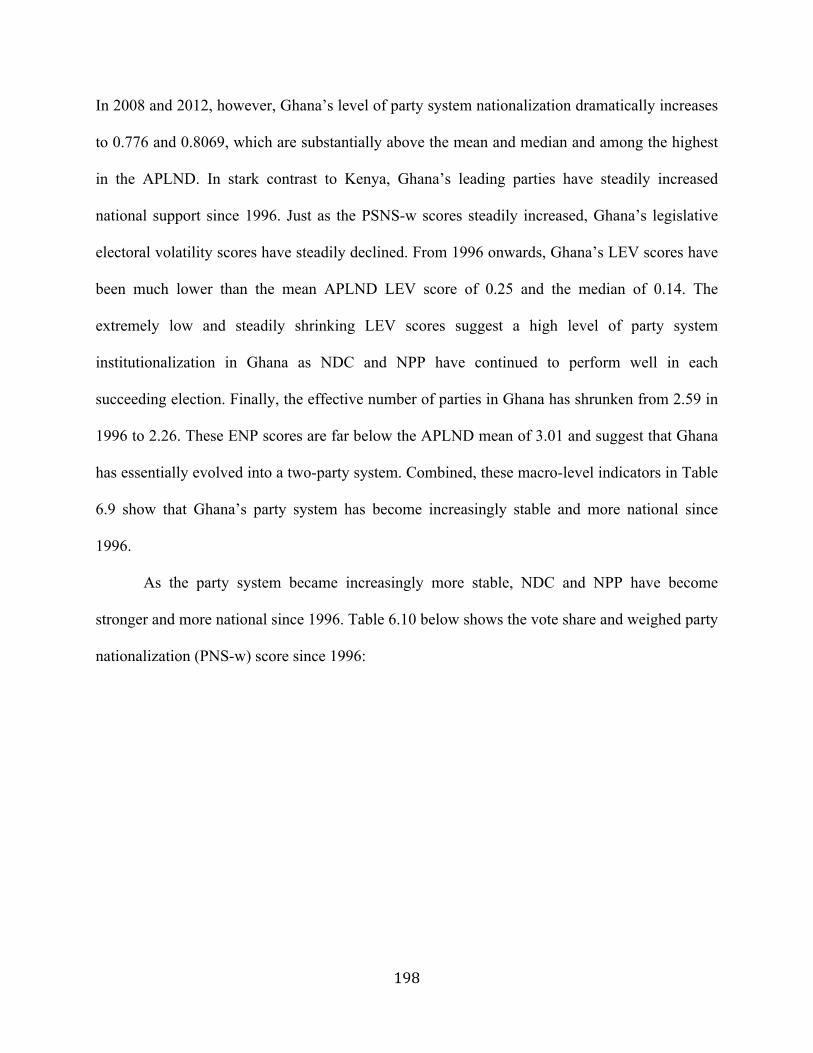
198
In 2008 and 2012, however, Ghana’s level of party system nationalization dramatically increases
to 0.776 and 0.8069, which are substantially above the mean and median and among the highest
in the APLND. In stark contrast to Kenya, Ghana’s leading parties have steadily increased
national support since 1996. Just as the PSNS-w scores steadily increased, Ghana’s legislative
electoral volatility scores have steadily declined. From 1996 onwards, Ghana’s LEV scores have
been much lower than the mean APLND LEV score of 0.25 and the median of 0.14. The
extremely low and steadily shrinking LEV scores suggest a high level of party system
institutionalization in Ghana as NDC and NPP have continued to perform well in each
succeeding election. Finally, the effective number of parties in Ghana has shrunken from 2.59 in
1996 to 2.26. These ENP scores are far below the APLND mean of 3.01 and suggest that Ghana
has essentially evolved into a two-party system. Combined, these macro-level indicators in Table
6.9 show that Ghana’s party system has become increasingly stable and more national since
1996.
As the party system became increasingly more stable, NDC and NPP have become
stronger and more national since 1996. Table 6.10 below shows the vote share and weighed party
nationalization (PNS-w) score since 1996:
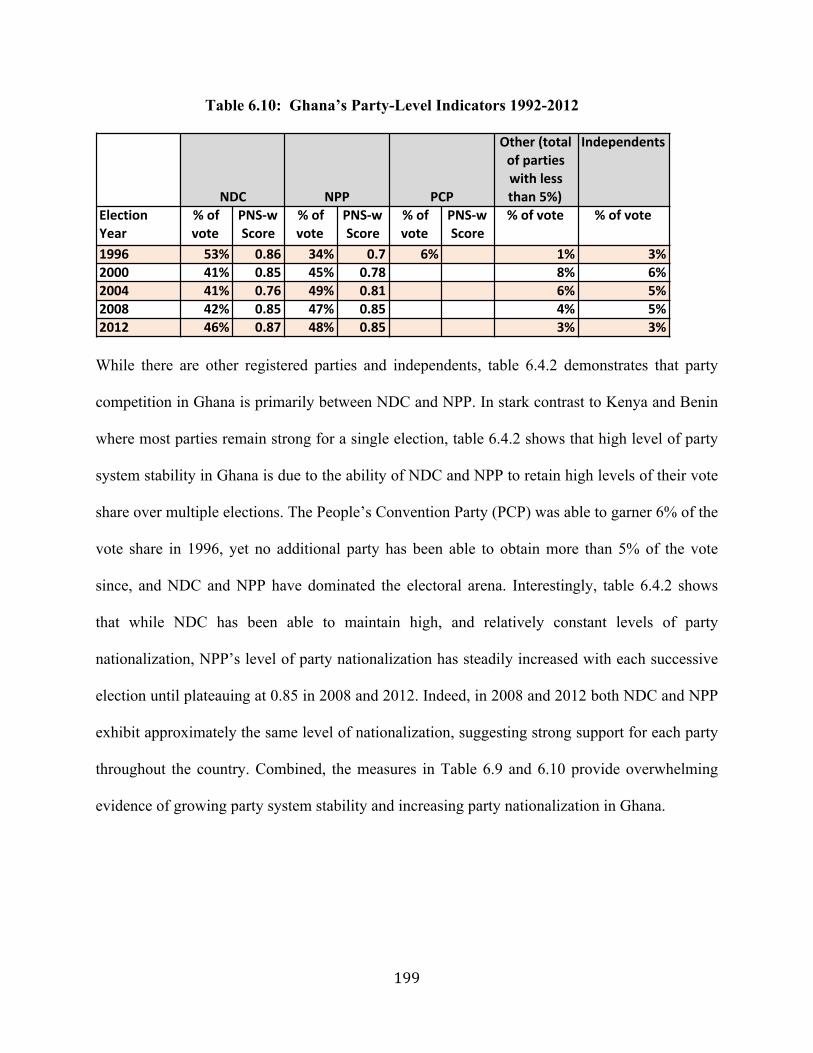
199
Table 6.10: Ghana’s Party-Level Indicators 1992-2012
While there are other registered parties and independents, table 6.4.2 demonstrates that party
competition in Ghana is primarily between NDC and NPP. In stark contrast to Kenya and Benin
where most parties remain strong for a single election, table 6.4.2 shows that high level of party
system stability in Ghana is due to the ability of NDC and NPP to retain high levels of their vote
share over multiple elections. The People’s Convention Party (PCP) was able to garner 6% of the
vote share in 1996, yet no additional party has been able to obtain more than 5% of the vote
since, and NDC and NPP have dominated the electoral arena. Interestingly, table 6.4.2 shows
that while NDC has been able to maintain high, and relatively constant levels of party
nationalization, NPP’s level of party nationalization has steadily increased with each successive
election until plateauing at 0.85 in 2008 and 2012. Indeed, in 2008 and 2012 both NDC and NPP
exhibit approximately the same level of nationalization, suggesting strong support for each party
throughout the country. Combined, the measures in Table 6.9 and 6.10 provide overwhelming
evidence of growing party system stability and increasing party nationalization in Ghana.
Other&(total&of&parties&with&less&than&5%)
Independents
Election&Year
%&of&vote
PNS=w&Score
%&of&vote
PNS=w&Score
%&of&vote
PNS=w&Score
%&of&vote %&of&vote
1996 53% 0.86 34% 0.7 6% 1% 3%2000 41% 0.85 45% 0.78 & 8% 6%2004 41% 0.76 49% 0.81 6% 5%2008 42% 0.85 47% 0.85 4% 5%2012 46% 0.87 48% 0.85 3% 3%
NDC NPP PCP
200
6.4.3 Ghana’s Virtuous Circle
While Ghana is also an ethnically diverse country, from Nkrumah onwards the country’s
most prominent politicians prioritized national cohesion. Considering that these leaders oversaw
the creation of its legislative framework, the content of Ghana’s party laws are highly centripetal
in nature. In stark contrast to Kenya’s laws for the 2013 elections, however, Ghana’s law
establishes realistic registration requirements for its parties. Unlike Kenya (from 1992-2007), the
laws have been universally enforced and largely observed by Ghanaian parties. These factors
have created a powerful virtuous circle that places extremely high levels of horizontal
coordination pressures on Ghanaian party leaders that strongly encourages them to build or join
national parties.
6.5 CONCLUSIONS
Despite many similarities across the case studies, the analysis in this chapter has focused
on the key differences that likely help explain variation in party development. All of the cases
are ethnically diverse, yet the levels of ethnic polarization are far different across countries.
Ethnicity matters to party development in Africa because party leadership strategies matter. The
most prominent politicians in Ghana and Zambia generally promoted party building strategies
that encouraged national cohesion while their counterparts in Benin and Kenya activated ethnic
differences that encouraged division and increased ethnic polarization. Moreover, party laws are
the products of the leadership of each respective country. As such, it is not surprising that
Ghana’s laws further increase horizontal coordination pressures on politicians through their
highly centripetal content, realistic registration requirements, and universal enforcement. In
Benin, by contrast, the vague content and low extent of centripetal regulation do little to
201
encourage the development of national parties. The fact that Zambia has relatively high levels of
party nationalization in the absence of any party laws suggests that the semi-virtuous circle there
has produced a high enough degree of horizontal coordination pressure to offset the ambiguous
legislative framework.
Encouragingly for further democratic consolidation, both citizen demand for national
leaders and support of multipartyism is high in each of the four cases. Nevertheless, Kenya’s
2013 elections illustrate how difficult it can be to break the momentum of a deeply entrenched
vicious cycle. For better or worse, the virtuous circles and vicious cycles are resilient. Positive or
negative feedback loops sustain the trajectory of party development in Africa.
It is important to remind the reader that the results in this chapter are preliminary and
suggestive and are not generalizable elsewhere. Nevertheless, the extremely high level of
mistrust in fellow citizens, across all the case study countries, has important implications for the
findings of this study. While a majority of the citizens in these countries may desire national
parties, mistrust in fellow citizens is even higher. The high level of mistrust further highlights the
important role that leaders and institutions play in developing strong and inclusive national
parties. This chapter has shown that the deliberate strategies of leaders to promote national
cohesion or encourage ethnic division matters deeply to the trajectory of party development.
Those same leaders are often involved in crafting political party laws that either promote
nationalization or entrench ethnic divisions. The evidence in this chapter shows that the content
and enforcement of party laws can increase horizontal coordination pressures on party leaders
under the right conditions. The high level of mistrust throughout the region, however, means that
strong institutions remain important for party nationalization in the future. The next and final
chapter discusses some of the policy implications of these findings.
202
CHAPTER 7: CONCLUSIONS, POLICY RECOMMENDATIONS, AND AVENUES FOR FUTURE RESEARCH
7.1 INTRODUCTION
This dissertation provides insight into why some countries in Africa have stable and
enduring multiethnic parties while others are plagued with evanescent ethnic parties. I employ
mixed methods research to test a novel theoretical framework that centers on the forces that
influence party leaders’ decision to prioritize ethnic balancing over ethnic polarization in
building their political parties (Chapter 1). To systematically examine variation in party
development, the large-n component of this project uses data from the African Party Law and
Nationalization Database (APLND), an original database covering 78 elections from 27 countries
from across the region. The statistical models in Chapter 3 show that party registration laws are
one of many factors that shape political party development in Africa. The quantitative findings
are complemented by in-depth examination of Kenya’s multiparty elections since 1992 (Chapters
4-5) and comparative case study analyses of Benin, Zambia, and Ghana (Chapter 6).
Historical analysis, focus group research, and key-informant interview data suggests
national parties are possible in Africa only when the forces that encourage multiethnic
cooperation (horizontal coordination pressure) are more powerful than the pressures that compel
party leaders to cater to their ethnic constituencies. Building multiethnic national parties requires
substantial investment from party leaders. National parties are more organizationally robust than
their ethnic counterparts because strong management systems and dispute resolution mechanisms
must be established to accommodate the various interests of different groups under the same
party banner. Ethnic parties are so prevalent in Africa in part because they generally do not
203
require substantial investment from politicians because party leaders need only secure support
from their own ethnic bloc. Not surprisingly, if party leaders can attain power without needing
votes from multiple ethnic groups than there is little incentive to build national parties. In order
for politicians to build national parties, the perceived benefits of seeking broad support from
across different ethnic groups must outweigh the perceived benefits of targeting only the party
leader’s co-ethnics. To this point, party regulations are only likely to work when there are low
levels of ethnic polarization, the country’s independence leader prioritized national cohesion,
there are centripetal party laws with realistic requirements that are universally enforced, and
there is high citizen demand and support for national parties. In unison, these forces work
together to create a virtuous circle of horizontal coordination pressure that compels politicians to
invest in building strong multiethnic national and enduring parties.
In conclusion then, what are the theoretical and practical implications of the key findings
of this dissertation? In what areas is there need for future research? This, the final chapter of the
dissertation, addresses these questions. The remainder of the chapter is divided into four
additional sections. Section II provides a brief summary of the key findings from the
quantitative, in-depth, and comparative case study analyses of the previous chapters. Section III
discusses the theoretical implications of these findings to comparative politics and the study of
policy reform. Section IV provides specific, actionable policy recommendations designed to
better inform African policy makers and to agencies engaged in international democracy
assistance efforts. Finally, Section V highlights areas for future research.

204
7.2 KEY FINDINGS
While this study produced a number of interesting results, this chapter focuses on the four
most important findings. The main findings are: 1) the correlation between centripetal party laws
and party nationalization, 2) the positive and negative influence of ethnicity and leadership
legacy on party development, 3) high levels of public demand for national parties, and 4) the
“sticky” nature of party development trajectories. In addition, a brief discussion of additional
findings is included at the end of this sub-section.
7.2.1 Party Laws, Nationalization, and Electoral Volatility
The main finding of the statistical analyses is that centripetal party laws -- regulations
that attempt to establish broad-based parties that transcend ethno-regional cleavages -- are
associated with both higher levels of party system nationalization and lower levels of electoral
volatility. The higher the extent of centripetal regulation in a country, the more likely that
country is to have more nationally oriented and stable political parties. The extent of centripetal
regulation remains significantly associated with both outcomes even after controlling for
alternative explanations (ethnic fractionalization, historical legacy, and economic conditions).
While the models in Chapter 3 show that there is a statistically significant correlation
between the extent of centripetal regulation, and party nationalization and electoral volatility, the
statistical analysis cannot provide insight into the direction of causality. It is entirely plausible
that the countries that are predisposed to have national and stable parties are inclined to have
centripetal laws that encourage enduring multiethnic parties. Indeed, this project has underscored
that party laws are not created in a vacuum but rather by living, breathing, human lawmakers in
each country who have their own policy biases and preferences. This project attempts to address
205
these concerns of endogeneity by complementing the large-n qualitative component with both in-
depth and comparative case study analyses designed to highlight the causal mechanisms at play.
The in-depth analyses show that centripetal laws are more likely to exist in countries with
greater pre-disposition toward national political parties and electoral stability. For instance, it is
not surprising that Ghana has a high extent of centripetal regulation considering the legacy of its
leaders like Nkrumah and Danquah who went to great lengths to encourage national cohesion in
their country. In addition, laws alone are unlikely to change the course of national politics. The
in-depth analysis of Kenya’s 2013 elections drives this point home as low levels of party
nationalization and high electoral volatility persisted despite the introduction of new, highly
centripetal party laws. Nonetheless, the case studies show that the laws are not devoid of causal
significance. In particular, they can contribute to a virtuous circle. In Ghana for instance the high
level of centripetal regulation likely contributed to increasing levels of nationalization and
electoral stability. In Zambia, on the other hand, the country started with a high level of
nationalization that has shrunk and stabilized over multiple elections in the absence of centripetal
regulation. In Benin, low levels of centripetal regulation contributed to a vicious cycle that
reinforced low levels of party nationalization and high electoral volatility. Future Kenyan
elections will show whether the change in party laws and associated changes in political
structures will be enough to move the country toward more national parties.
7.2.2 Ethnicity, Leadership, and Party Development
The quantitative analyses confirm that both ethnic composition and leadership are
powerful predictors of party nationalization. Ethnic fractionalization is negatively correlated to
party nationalization meaning that higher levels of ethnic fractionalization are significantly
206
related to lower levels of party nationalization. Conventional wisdom and volumes of literature
emphasize the powerful influence of ethnicity in African politics and this finding conforms to
expectations. This project attempts to improve on previous studies; however, by focusing on the
role that prominent independence party leaders have played in “activating” ethnicity in their
respective countries. The APLND includes a variable on “nationalist” African leaders in an
attempt to quantify and measure the influence of leadership legacy on the trajectory of party
system development. In some African countries, “nationalist” independence party leaders
implemented ethnic balancing strategies that promoted multiethnic cohesion through policies
designed to foster national unity. In other African countries, independence party leaders
deliberately increased polarization to consolidate their ethnic voting blocs. Even years after
independence, countries that had had a nationalist leader have significantly higher party
nationalization scores than those that did not.
Interestingly, while ethnic fractionalization and nationalist independence leaders are
significantly associated with party nationalization they do not appear to influence electoral
volatility in the same way. In contrast to its relationship to party nationalization, for instance,
ethnic fractionalization is not a statistically significant predictor of electoral volatility in the
models presented in Chapter 3. This difference suggests that while party nationalization and
electoral volatility are correlated, parties are volatile while ethnic groups are not. This point
escapes many structural accounts of the salience of ethnicity including Elischer’s recent 2013
account of ethnicity and party formation in Africa (Elischer 2013). The difference could also be
attributed to the smaller sample size of cases in the analyses on electoral volatility
207
7.2.3 High Demand for National Parties
A majority of citizens from across Africa say that they prefer leaders that represent their
nation as a whole rather than leaders that provide favors to their own group. This study uses data
from the Afrobarometer (AB) survey project as one means of gauging citizen demand for
national political parties. While the AB survey does not ask a specific question about national vs.
ethnic political parties, it does, ask respondents to choose between Statement 1 which asks “Once
in office, elected leaders are obliged to help their home community or group first” or Statement 2
“Since elected leaders should represent everyone, they should not do anything that favors their
own group over others”.105 This project uses this question as a proxy to gauge citizen demand for
national parties because it provides survey respondents with a clear choice between a leader that
favors his home community (i.e. an ethnic party leader) with one who represents the nation as a
whole (i.e. a national party leader). As per Annex 6-A, of the 24 APLND countries represented
in the latest round of the AB, a majority of citizens in all countries but Sierra Leone say that they
prefer national over ethno-regional leaders. Of the 24 countries surveyed, an average of 74% of
respondents favors the national leader compared with 24% who favor the ethno-regional leader.
Lesotho (92%), Malawi (83%), and Benin (84%) have the highest proportion of respondents who
say they favor national leaders while Sierra Leone (50%), Liberia (38%), and Nigeria (34%)
have the highest proportion of respondents who prefer ethno-regional leaders. These results
suggest high citizen demand for national parties throughout Africa. Despite high demand,
however, the analysis of detailed elections results throughout this project demonstrates that the
supply of national parties is low in most countries and, nonetheless, many Africans vote for
ethnic parties.
105 AB Round 5 survey question 18
208
7.2.4 Sticky Trajectories and Nonlinearity
Once a path has been set, it is difficult for countries to change their respective trajectories
of political party development. Countries that entered the era of multipartyism with highly
fragmented party systems flooded by numerous evanescent political parties are more likely to be
besmirched by low levels of nationalization and high electoral volatility in subsequent elections.
Conversely, countries that began the multiparty era with one or more national political party tend
to exhibit higher levels of nationalization and electoral stability in subsequent elections.
Moreover, the evidence in this dissertation strongly suggests that political party development is
not linear. After twenty years of multiparty competition, it is unclear that highly fragmented
party systems rife with ethnic parties may gradually evolve into stable systems with national
parties. On the other hand, while stable party systems with national parties are more likely to
continue along the same path, there is no guarantee that strong and enduring multiethnic national
parties will automatically endure indefinitely.
7.2.5 Additional Findings
This project focuses on the influence of party laws, ethnic composition, and leadership
legacy on party nationalization and electoral volatility, but it is important to acknowledge that
analyses of the APLND confirm that economic factors also shape party development. More
specifically, the level of wealth of a country, the amount of corruption, and the proportion of tax
revenue as a percent of GDP are all statistically significant. Elections in wealthier countries (as
measured by GDP per capita) and countries that have a stronger capacity to collect taxes result in
more national party systems. The intuition here is that as GDP wealth increases, the horizontal
coordination pressure of parties also increases as citizen demand for more stable, nationally
209
representative parties increases. Meanwhile, tax revenue as percent of GDP helps demonstrates
the strength of formal state institutions in a country. The higher the percent of tax revenue the
stronger and more institutionalized the formal state institutions. The stronger the formal
institutions, the higher the horizontal coordination pressure to create stable, nationally
representative parties resulting in high levels of party nationalization. On the other hand,
corruption is negatively correlated with party nationalization; countries with more corruption
have less national party systems. While tax revenue as percent of GDP demonstrates the strength
of formal institutions, levels of corruption illustrate the weaknesses of formal institutions in a
country. The higher the level of corruption, the weaker the formal institutions in a country. When
corruption is rampant then vertical coordination pressures trump horizontal coordination
pressures because politicians have are less likely to trust leaders from “other” groups resulting in
low levels of party nationalization. Nevertheless, the sample size is too small to draw definitive
conclusions on the influence of these economic indicators on political party development.
7.3 THEORETICAL IMPLICATIONS
This study builds on our knowledge of African politics, party system development,
institutional change, policy reform, path dependence, and institutional engineering. As such it
contributes to the comparative politics and public policy scholarship.
7.3.1 Political Party (System) Development
Formal African Institutions (Can) Matter: That centripetal party laws are positively
correlated to both party nationalization and electoral volatility is important to the study of
African institutions. As discussed in detail in Chapter 1, the conventional wisdom is that
210
informal associations trump formal rules and regulations in Africa. All too often, African leaders
blatantly ignore laws and choose to navigate parallel backchannels instead of operating within
formal institutions. Clientelism and “Big Man” Presidentialism (Bratton 2007, van de Walle
2003, 2007) remain the rule rather than the exception throughout most of the continent.
Nevertheless, recent studies suggest that formal institutional rules are coming to matter more
than they used to in many African countries. For instance, Posner and Young (2007) show that
most African rulers have left office voluntarily since 1990, Dulani (2011) underscores how
constitutional laws successfully curtailed the efforts of Chiluba, Muluzi, and Obasanjo to extend
their term limits, and Kerr (2013) examines the factors that have led some African countries to
establish autonomous, competent, and powerful electoral management bodies (EMBs). By
showing that centripetal party laws are positively associated with higher levels of party
nationalization and electoral stability, this study provides additional evidence that formal
institutions may be gaining traction in Africa. The author readily concedes that many other
factors, including informal institutions, likely have a greater influence on party development than
formal regulations. To that end, this study provides evidence illustrating that ethnic
fractionalization and leadership legacy are far more powerful predictors of nationalization than
regulations. Nevertheless, the evidence in this study implies that party laws are shaping the
behavior of African leaders thereby providing additional evidence that scholars should not
summarily dismiss the influence of formal African institutions.
Leadership is Important: This project attempts to improve on scholarship of party
systems and institutional change by highlighting the influence that politicians themselves have in
shaping the trajectory of development in their countries. Most existing accounts fail to consider
this form of agency. A focus on macro-level indicators without gaining insight from African
211
politicians, government officials, civic leaders, and citizens yields limited explanations of
institutional development and change. This project attempts to address this deficiency by
advancing a novel theoretical framework that focuses on the forces that influence party leaders’
decision to prioritize fostering ethnic balancing over enflaming ethnic polarization. As such, this
study contends that identifying the factors that influence the horizontal coordination pressures on
leaders holds the key to explaining variation in political party development across countries and
within countries over time. National parties are possible in Africa only when horizontal
coordination pressures that encourage multiethnic cooperation are more powerful than the
vertical coordination pressures that compel party leaders to cater to their ethnic constituencies.
Politicians need votes to attain or maintain elected office. Not surprisingly, leaders are more apt
to build national parties when they need the support of multiple ethnic groups to secure elected
office. Gaining broad support from across different ethnic groups must be more important to
party leaders than solely targeting their co-ethnics. Therefore, this study advances our knowledge
of party development by complementing the quantitative findings with in-depth and comparative
case study analyses that provide insight into how and why demographic, historical, economic,
and institutional factors influence the decision-making calculus of the African politicians who
build their parties.
Democratic Consolidation: In addition, the findings of this study have important
implications to the study of the consolidation of democracy. The correlation between the extent
of centripetal regulation and higher levels of party nationalization and lower levels of electoral
volatility suggests that elites are increasingly adhering to laws supporting and surrounding
elections. As such, this is evidence of the institutionalization of the rule of law, which is seen by
many scholars as an essential component to the consolidation of democracy (Linz and Stepan
212
1996, Weingast 1997, Schedler 1998, Bratton and Chang 2006, Linz et al. 2011, O’Donnell and
Schmitter 2013). Nevertheless, while regular multi-party elections have become the norm, rather
than the exception in Africa (Lindberg 2006), elections alone do not guarantee democratic
consolidation (Greenberg and Mattes 2013; Bratton 2013). Scholars widely agree that strong,
representative political parties are necessary for democratic consolidation (Huntington 1968;
Panebianco 1988; Diamond and Gunther 2001; Lebas 2011; Elischer 2013). While deeply
entrenched, strong ethnic parties certainly exist, this project provides evidence that parties with
higher nationalization scores tend to be more enduring than their ethnic counterparts. In other
words, multiethnic national parties are generally stronger than their ethnic parties in Africa.
While ethnic parties still plague many African party systems, this study has shown that enduring
national parties do exist in Africa too.
Finally, much has been written about how citizens need to possess democratic values and
attitudes in order to sustain participatory democratic institutions (Almond and Verba 1963;
Putnam 1994, Fukuyama 1995, Linz and Stepan 2011). African citizens share many of the same
democratic values as their counterparts in other regions of the developing and industrial world
(Bratton, Mattes, and Gyimah-Boadi 2005; Bratton 2013). The overwhelming demand for
national versus ethnic leaders and for multi-partyism over one-party rule highlighted in this study
provides additional evidence of African citizens’ democratic values. While particularistic parties
and clientelism remain prevalent, this study provides ample evidence that democratic
consolidation may be within reach in some parts of Africa as well.
213
7.3.2 Institutional Change and Policy Reform
Historical Institutionalism: This project applies a historical institutionalist framework
that provides strong evidence of feed back mechanisms that propel countries to remain on their
established paths of political party development. As discussed in more detail in Chapter 1,
historical institutionalism offers a broad framework for analysis instead of providing a specific
theory. Scholars use historical institutionalist frameworks to focus on the concepts of path
dependence, power asymmetries, and critical junctures to explain the complex interplay between
institutions and political behavior over time (Hall and Taylor 1996). In established democracies,
scholars have demonstrated that policy outcomes trigger feedback loops (either positive or
negative) that reinforce the recurrence of a particular pattern – path dependence - into the future
(Pierson 2000, Thelen 1999). More recently, scholars have effectively applied historical
institutionalism to explain various accounts of institutional variation in Africa (see Bratton and
van de Walle 1997; Boone 2003; Miguel 2004; MacLean 2010; Riedl 2013). These studies show
that once a country has started down a particular path, the relative benefits of sticking on the
same path and the costs of deviating from that path increase over time.
This study contributes to the literature on historical institutionalism and path dependence
in several ways. First, the large-n quantitative component includes historical indicators and
shows that the legacy of independence party leaders influences subsequent levels of party
nationalization. Second, the in-depth analysis of Kenya identifies critical junctures that increased
the ethnicization of Kenyan politics and ultimately made it exceedingly difficult to change the
trajectory of its party system development. Finally, the comparative case studies in Chapter 6
showed how multiple factors worked together to reinforce the existing party building strategies
of politicians in Benin, Zambia, and Ghana thereby perpetuating established patterns of party
214
development. Consistent with analyses of path dependence elsewhere, the evidence in this study
shows that the trajectory of party development triggers feedback loops (either positive or
negative) that reinforce the recurrence of that pattern into the future.
Institutional Engineering: Building on the discussion of path dependence above, the
evidence in this study highlights both the opportunities and limitations of institutional
engineering. On the one hand, the correlation between the extent of centripetal regulation and
higher levels of nationalization and electoral stability bodes well for the prospects of institutional
engineering. The explicit goal of these centripetal regulations is to design stronger, more
nationally representative parties. In order for political engineering to be considered successful,
the paper decrees (laws) must lead to the intended design of political institutions (Cass 2001,
Norris 2004). Even after controlling for alternative explanations, a weak but significant
correlation between centripetal party laws and higher levels of nationalization and electoral
stability exists. This is evidence of successful institutional engineering. Even though other
factors are far more powerful predictors, the relationship between the extent of centripetal
regulation and the level of party nationalization suggests that the party laws are effective. While
the relationship is weak, these findings provide evidence that the design of formal political
institutions matters in Africa and political engineering can (sometimes) achieve the desired
effect.
On the other hand, however, the evidence in this dissertation also highlights the
limitations of institutional engineering in Africa. As the in-depth analysis of Kenya’s 2013
elections clearly illustrates, increasing the extent of centripetal regulation alone does not
automatically lead to higher levels of nationalization and stability. There are many complex
factors that influence whether or not reforms to party laws in Africa have intended effects. This
215
study advanced an original framework for assessing the likelihood that party laws would lead to
increased nationalization and electoral stability. Evidence from the in-depth investigation of
Kenya and the comparative case studies suggest that laws are more likely to compel politicians
to invest in building more national and enduring parties when there is low levels of ethnic
polarization, the country’s independence leader prioritized national cohesion, there are
centripetal party laws with realistic requirements that are universally enforced, and there is high
citizen demand and support for national parties. These factors work together to create a virtuous
circle of positive feedback that maintains high levels of horizontal coordination pressure on
politicians, ultimately compelling them to build more organizationally robust multiethnic parties.
The same is true in reverse. Politicians are more likely to ignore party laws and create evanescent
ethnic parties when there is high ethnic polarization, a legacy of ethnically divisive leaders, party
laws are too vague or too ambitious and selectively enforced, and there is low citizen demand or
support for national parties. These conditions create a “vicious cycle” where a negative feedback
loop reinforces low levels of horizontal coordination pressure on politicians thereby perpetuating
the development of ethnic rather than national parties. Changes to the content of party laws alone
are unlikely to have much or any influence the trajectory of party development. In order for
policy reforms to lead to higher levels of nationalization and stability they must complement
other factors that reinforce high levels of horizontal coordination pressure on politicians to
motivate them to build national rather than ethnic parties.
7.4 POLICY RECOMMENDATIONS
In addition to the academic and theoretical contributions described above, this
dissertation has practical implications for African policy makers, foreign donors, and
216
international democracy assistance providers. Specific, actionable policy recommendations based
on the findings of this study are provided below.
7.4.1 Lessons for African Policy Makers
Content: The centripetal content of party laws matters, yet the findings suggest that laws that are
either too ambiguous or too ambitious are less likely to be effective. Even though at opposite
extremes, neither vague nor overly ambitious laws produce the increased horizontal coordination
pressure necessary to encourage leaders to build strong national parties over short-lived ethnic
ones. African politicians have proven adept at maneuvering around vague registration
requirements while many incumbent regimes have used the ambiguity of regulations to their
advantage by selectively enforcing laws to subjugate their opposition (Moroff 2010; Mahoney
and Thelen 2010). At the other end of the spectrum, laws that are overly prescriptive and set
unrealistically high expectations are also unlikely to work. In Kenya, for instance, one party
leader exclaimed that the Political Parties Act 2011 (PPA 2011) had “forced parties to go from 0
to 100 (kmh)…none of them (parties) could make it”.106 Politicians are likely to ignore laws that
set registration thresholds too high because they believe that none of the other parties will obey
the laws either. African policy makers should strive to find a suitable middle ground for setting
demanding but achievable registration requirements. “One-size fits all” party laws do not exist.
In order to create party laws that best suit the specific needs of their country, African lawmakers
should work with legal experts, civic leaders, and party officials to identify country appropriate
registration requirements.
106 Author interview with party leader in Kenya May 13, 2014.
217
Enforcement: Not surprisingly, enforcement of party laws influences whether or not
politicians abide by them. As discussed in both the in-depth examination of Kenya and the
comparative case studies, laws that are universally enforced are more likely to increase
horizontal coordination pressure and lead to higher levels of nationalization than laws that are
selectively enforced. Politicians are more likely to abide by the laws when they believe that other
party leaders are also following the law. There is little incentive to follow regulations without
real and serious repercussions for breaking the law. As such, government institutions responsible
for overseeing party registration must be capable of adequately monitoring and enforcing party
laws. These government institutions need staff and systems that promote the effective and
efficient auditing of parties to ensure they remain in compliance. The perceived authority and
autonomy of these regulating bodies is also important. Only truly autonomous and independent
regulating bodies are capable of enforcing the laws to all parties, including the incumbent.
Moreover, without adequate authority to fulfill their mandate and enforce laws, party leaders are
unlikely to take party regulations, or the institutions that enforce them, seriously.
Advocacy: Strong and powerful proponents of party regulations must champion and
protect party laws in order for them to be effective. In Kenya, government officials, civic leaders,
and party elites complained that politicians had “diluted” the PPA 2011 immediately in advance
of the 2013 elections to make it easier for them to conduct “business as usual”.107 While there are
many supporters of the PPA 2011 within government, across the parties, and from civil society,
legislators faced little to no opposition amending these laws in advance of the elections. In
Kenya, and elsewhere throughout Africa, proponents of policy reform could more effectively
stave off attempts to diminish the power of newly passed laws by coming together to cultivate a
107 Based on multiple interviews conducted by the author in Nairobi May 12-19, 2014.
218
“lobby” of champions to protect the original intent of party laws. Creating new legislation or
radically amending existing legislation is an important step in the reform process. Nevertheless,
interest groups dedicated to implementing these reforms must come together to overpower the
“old guard” that favors the status quo in order for these laws to have any influence in the real
world.
7.4.2 Improving International Party Assistance
A more strategic, multi-pronged approach would increase the development impact of
political party assistance, which international donors in Africa have usually subcontracted to
European or American party foundations.108 In 2006, Carothers noted “The standard method of
party aid is problematic not just because of its reliance on the stale techniques of institutional
modeling. It grows out of what could be described as a mythic model of parties in established
democracies” (Carothers 2006: 216). A decade later, much international assistance in Africa
continues to chase this mythic model (Erdmann 2010; Elischer 2013). The characteristics that
party assistance providers seek to promote in developing democracies hardly exist (if at all) in
the mature political parties in their own established democracies. The last 20 years have proven
that there are no guarantees that African parties will evolve into sustainable and accountable
institutions that effectively aggregate citizen interests and provide policy alternatives. Therefore
striving to transform even the smallest party partners into imaginary European models is
unrealistic and unhelpful. Having said that, however, effectively designed party assistance is
108 American democracy assistance providers most prevalent in Africa are: The National Democratic Institute for International Affairs (NDI), the International Foundation for Electoral Systems (IFES), and the International Republican Institute (IRI). European assistance providers include: International Institute for Democracy and Electoral Assistance (IDEA), the Netherlands Institute for Multiparty Democracy (NIMD), and the Konrad-Adenauer-Stiftung.
219
more important now than ever. Recommendations for enhancing the development impact of
party assistance are provided below.
A Holistic Approach: A holistic approach to international assistance that builds the
capacity of pertinent government officials and improves coordination between donors, civic
leaders, and implementers creates an environment most conducive to effective party assistance.
International democracy assistance focuses primarily on elections, yet strengthening the
institutions essential to fostering democratic consolidation is a long-term multi-faceted endeavor.
As such, party assistance does not just involve party leaders, but should also engage a number of
other relevant stakeholders. For instance, African lawmakers would benefit from comparative
examples and international best practices as they continue to draft, revise implement, and enforce
their party laws. Government officials often need help educating party officials and the general
public on new party laws, establishing a viable management structure, and creating appropriate
auditing tools to more effectively monitor whether parties are in compliance with the law.
Meanwhile, civil society plays a critical role in ensuring that parties remain accountable to their
citizens so assistance that improves the “watch-dog” capabilities of local civic organizations can
also influence party development. Finally, excellent coordination between donors is essential to
both help identify urgent areas of assistance and to prevent overlap of project activities by
implementers.
Multiparty Activities: There is higher demand from party leaders for support than there is
supply of technical aid from democracy assistance providers. It is impossible for assistance
providers to satisfy the demand from every party leader and consequently, they must be more
strategic about which parties receive higher levels of assistance. One way to placate the demands
of the smaller parties is to include them in joint multiparty activities. To that end, educating party
220
leaders on how new or revised party laws will affect their parties is a good opportunity for a
multiparty activity in which leaders from across parties can participate in the same activity at the
same time, reducing program costs. As discussed in more detail below, it is important to make
sure that the incumbent or party (or parties) in government participates in these activities to
avoid perceptions that this programming is strictly to support the opposition. Arousing suspicion
from the incumbent parties can prove disastrous for future assistance programming. Moreover,
inviting the government officials responsible for overseeing party registration and pertinent civic
leaders to these activities would improve communications between these individuals and party
leaders.
Empower Youth Party Leaders: More efforts are needed to identify and empower
promising young party leaders. Rich old men have dominated African politics over the past two
decades. Many African politicians seem to change their parties as frequently as some ordinary
citizens change their clothes, yet it is often the same old politicians competing against each other
from election to election. All too often party youth leagues are co-opted by politicians to serve as
foot soldiers during election time. Nevertheless, youth are often more tolerant and accepting than
their elders. Moreover, the youth leaders of today are likely to be senior party leaders of
tomorrow. Additional assistance is needed to target youth leaders that are likely to be agents of
positive change by being more open to the prospect of building strong multiethnic coalitions
within their parties that prioritize nationally oriented policies. Once identified, assistance
providers can help build a network of likeminded youth leaders from across parties. Technical
assistance activities designed to strengthen the management and leadership skills of these young
leaders would help them have more influence within their own parties.
221
Single-Party Activities: Assistance providers need to be more selective about which
parties receive targeted additional assistance. As noted earlier, the demand from party leaders far
outweighs the level of support that democracy assistance providers can deliver. In countries like
Benin and Kenya where there are dozens of registered political parties, it is impossible to deliver
quality technical assistance to everyone. One of the most straightforward means of selecting
which partners receive additional assistance is to set a threshold for minimum seats or vote share
attained in the previous election. For instance, only parties that gain more than 5% of the
parliamentary vote share would receive additional assistance. Following this logic, assistance
providers could chose to reward more nationally oriented parties with higher levels of support.
Parties with a higher party nationalization score deserve more help because they have a broader
support base than their ethnic-regional counterparts. Setting these thresholds makes it possible
for assistance providers to deliver higher quality support to the parties that matter the most. In
addition, setting minimum requirements could increase horizontal coordination pressure on
politicians by encouraging them to join together with other leaders to meet the threshold to
receive additional help. The point here is that assistance providers should “reward” only those
parties that are most deserving with additional support.
It is impossible to prescribe specific program activities because the context differs from
country to country and from election to election. There are no “one size fits all” party assistance
activities because no two parties or elections are exactly alike. Broadly speaking, however, it
makes sense to prioritize activities that assist African parties do a better job of coordinating
voters, candidates, and donors to aggregate citizen interests. Many African parties have weak
management and communications systems that do not effectively link senior party leaders at
headquarters with local branch officers and elected officials. In addition, most African parties
222
would benefit from more inclusive and systematic policy development strategies that do a better
job of incorporating public opinion and citizen input. While it is not possible for them to morph
into the “mythic” model of the Western European mass party, targeted assistance in the areas
discussed above could help many African parties become more national and enduring.
Institutional Memory: Increased coordination and cooperation between international
democracy assistance providers and academic researchers could improve institutional memory.
Carothers rightly highlighted poor institutional memory as one of the most pressing
shortcomings of international democracy assistance (Carothers 2004; 2006). Despite wide
acknowledgement of this issue (Committee on Evaluation of USAID Democracy Assistance
Programs 2008), poor institutional memory of assistance providers is still a major problem a
decade later. Programmatic failures and challenges are all too often forgotten while successes
and accomplishments could be captured more effectively. In their defense, implementers are
often too busy carrying out their current projects and seeking funding for additional programs to
prioritize lessons learned from past projects. The United States Agency for International
Development (USAID) has acknowledged building democracy assistance knowledge as a
priority in its new 2013 Strategy on Democracy Human Rights and Research (DRG strategy).109
Yet, while donors acknowledge the need for improved monitoring and reporting to improve
institutional memory, funding for robust program evaluation work is rarely made available.
Collaboration between democratization researchers and implementers could help improve
institutional memory and build DRG knowledge in a cost effective. While there are challenges
109 The USAID 2013 DRG Strategy can be found here: http://www.usaid.gov/sites/default/files/documents/1866/USAID%20DRG_%20final%20final%206-24%203%20(1).pdf
223
pertaining to how to best incorporate evaluation into ongoing programming, implementers need
to do a better job of taking advantage of researchers’ skills.
7.5 FUTURE RESEARCH
This study builds on our knowledge of political party development and policy reform in
Africa, yet additional research is needed to further deepen our understanding. The APLND is the
most comprehensive database of its kind, but the quantitative analysis remains limited by the
selectivity of the cases included and the small sample size. The analyses in this study show
significant and robust association between the outcome variables (party nationalization and
electoral volatility) and institutional, demographic, historical, and economic factors.
Nevertheless as more detailed data become available, these associations should be tested on a
larger sample of African elections. To that end, expanding the research to cover other areas of
the world would provide insight into similarities and differences of party development in Africa
compared to other regions. Expanding the sample size would also allow for the use of more
sophisticated statistical tools to further test the robustness of the findings in this study. Therefore,
the APLND and associated large-n analyses in this study should be viewed as an important work
in progress rather than a complete and definitive authority on African party laws, nationalization,
and electoral volatility.
Additional in-depth and comparative case study analyses are needed to challenge or
confirm the causal mechanisms identified in this project. Evidence from Kenya, Benin, Zambia,
and Ghana suggests that high levels of party nationalization and electoral stability are likely
when the horizontal coordination pressure is high enough to compel politicians to invest in
organizationally robust multiethnic parties. Importantly, Kenya’s 2013 elections show that the
224
relationship between centripetal party laws and higher levels of nationalization and stability is
not automatic. The qualitative data in this study suggest that centripetal party laws contribute to
higher levels of nationalization and stability when they increase horizontal coordination
pressures on politicians through realistic registration thresholds and universal enforcement. Party
laws only work when they are part of a virtuous circle of horizontal coordination pressure
reinforced by high citizen demand for national leaders, low levels of ethnic polarization, and a
historical legacy of national party building. As Tanzania, Zambia, Benin and other African
countries implement new party laws in the coming years, additional fieldwork is needed to see if
the mechanisms identified in this study are also at play in these countries.
In conclusion, this study provides room for both hope and fear for democratic
consolidation in Africa. On the one hand, the findings suggest that formal institutions are gaining
traction as politicians in some African countries appear to be paying more attention to party laws
and these laws are having their intended effect. A vast majority of Africans say they prefer
national over ethnic leaders, want multiparty competition, and reject one-party rule. On the other
hand, however, high levels of interpersonal mistrust and low levels of trust in political parties
(especially opposition parties) across the continent further highlight the important role that
leaders and institutions play in developing strong and inclusive national parties. The deliberate
strategies of leaders to promote national cohesion or encourage ethnic division matters deeply to
the trajectory of party development. These same leaders draft political party laws that either
promote nationalization or entrench ethnic divisions. The high level of mistrust throughout the
region means that strong institutions remain important for party nationalization in the future.
Building enduring multiethnic parties that effectively aggregate citizen interests and foster
stability is more important in Africa now than ever.

225
BIBLIOGRAPHY
226
BIBLIOGRAPHY
Acemoglu, Daron and James Robinson (2012): Why Nations Fail: The Origins of Power, Prosperity, and Poverty. New York: Crown Publishers.
Aldrich, John. 1995. Why Parties? The Origin and Transformation of Party Politics in America. Chicago: University of Chicago Press.
Allik, M., 2006. Parteisu ̈ steemid Fo ̈ deraalriikides. Master thesis, University of Tartu.
Almond, Gabriel and Sidney Verba. 1963. The Civic Culture: Political Attitudes and Democracy in Five Nations. Sage Publications.
Andreassen, Bard-Anders, Gisela Geisler, and Arne Tostensen. 1992. “Setting a standard for Africa? Lessons from the 1991 Zambian Elections.” CMI Report 1992 No.5, Bergen, Norway: Chr. Michelsen Institute.
Apter, David. 1955. The Gold Coast in Transition. Princeton, NL: Princeton University Press.
Asante, Richard and E.Gyimah-Boadi. 2004. “Ethnic Structure, Inequality, and Governance of the Public Sector in Ghana.” UNRISD report
Arriola, Leonardo. 2012. Multiethnic Coalitions in Africa: Business Financing of Opposition Election Campaigns. Cambridge: Cambridge Studies in Comparative Politics. Cambridge University Press.
Ayensu, K.B and Samuel Ntim Darkwa. 1999. The Evolution of Parliament in Ghana. Sub-Saharan Publishers, Accra.
Barkan, Joel. 2013a. “What to Read on Kenyan Politics,” Foreign Affairs. July 16, 2013. http://www.foreignaffairs.com/features/readinglists/what-to-read-on-kenyan-politics
Barkan, Joel. 2013b. Electoral Violence in Kenya: Contingency Planning Memorandum No. 17. Washington: Council on Foreign Relations.
Barkan, Joel.1976. “Further Reassessment of ‘Conventional Wisdom’: Political Knowledge and Voting Behavior on Rural Kenya.” American Political Science Review 70:2, 452-5.
Barkan, Joel. 1979. “Legislators, Elections and Political Linkage.” In Joel Barkan and John Okumu, Eds. Politics and Public Policy in Kenya and Tanzania. Praeger: New York.
Battle, Martin and Jennifer C. Seely. 2007. “It’s all relative: competing models of vote choice in Benin.” Working Paper No. 78. Afrobarometer Working Papers.
227
BBC 1992. Moi in BBC Interview, Kenya Television Network (KTN), 16 January, Summary of the World Broadcasts, 18 January 1992.
BBC. 2007. “Opposition in Kenya splits in two.” Published by BBC 2007/08/15. http://news.bbc.co.uk/go/pr/fr/?/2/hi/africa/6947576.stm
Basedau, Matthias, Matthijs Bogaards, Christoff Hartmann, and Peter Niesen. 2007. “Ethnic Party Bans in Africa: A Research Agenda.” German Law Journal 6 (1): 617-634.
Basedau, Matthias and Anika Moroff (2011) “Parties in chains: Do ethnic party bans in Africa promote peace?” Party Politics 17 (2) 205-222.
Bates, Robert. 1974. "Ethnic Competition and Modernization in Contemporary Africa." Comparative Political Studies (Jan. 1974):457-84.
Baylies, Carolyn and Morris Szeftel. 1999. “Democratisation and the 1991 Elections in Zambia.” In John Daniel, roger Southall, and Morris Szeftel, eds. Voting for Democracy: Watershed Elections in Contemporary Anglophone Africa. Brookfield, VT.: Ashgate.
Beck, T., Clarke, G., Groff, A., Keefer, P., & Walsh, P. (2001). New tools in comparative political economy: The Database of Political Institutions. The World Bank Economic Review, 15(1), 165-176.
Bieber, Florian. 2008. ‘Regulating minority parties in Central and South-Eastern Europe’, in Ben Reilly and Peter Nordlund (eds) Political Parties in Conflict-Prone Societies, pp. 95–125. Tokyo and New York: United Nations University Press.
Biershenk, Thomas. “Democratization without Development: Benin 1989-2009”. Working Papers # 100, The Working Papers are edited by Institut für Ethnologie und Afrikastudien, Johannes Gutenberg-Universität, Forum 6, D-55099 Mainz, Germany.
Birnir, Johanna Kristin. 2007. Ethnicity and Electoral Politics (New York: Cambridge University Press,
Birnir, Johanna Kristin (2008) ‘Party Regulation in Central and Eastern Europe and Latin America: the Effect on Minority Representation and the Propensity for Conflict’, in Ben Reilly and Peter Nordlund (eds) Political Parties in Conflict-Prone Societies: Regulation, Engineering and Democratic Development, pp. 158–81. Tokyo and New York: United Nations University Press.
Birmingham, David. Kwame Nkrumah: The Father of African Nationalism (revised edition), Ohio University Press, 1998.
Bleck, Jamie and Nicholas van de Walle. 2013. “Valence Issues in African Elections: Navigating Uncertainty and the Weight of the Past.” Comparative Political Studies, 46 (11) 1394-1421.
228
Bochsler, Daniel. 2006. "Ethnic diversity, electoral system constraints and the nationalisation of political parties. A triangle model, applied on the Central and Eastern European countries." CEU Political Science Journal 1 (4): 6-37.
Bochsler, Daniel. 2010. "Measuring party nationalisation: A new Gini-based indicator that corrects for the number of units." Electoral Studies 29 (1): 155-68.
Bogaards, Matthijs, Basedau, Matthias and Christof Hartmann (2010) Ethnic Party Bans in Africa, Special Issue of Democratization 17(4).
Bogaards, Matthijs. 2000 'Crafting Competitive Party Systems: Electoral Laws and the Opposition in Africa', Democratization, 7 (4) 163-90.
Bogaards, Matthijs. 2007. ‘Electoral Systems, Party Systems, and Ethnicity in Africa’. In Votes, Money and Violence: Political Parties and Elections in Sub-Saharan Africa, ed. Matthias Basedau, Gero Erdmann, and Andreas Mehler, 168–93. Stockholm & Scottsville, South Africa: Nordiska Afrikainstitutet & University of KwaZulu-Natal Press.
Boix, Carles and Susan Stokes. 2003. ―Endogenous Democratization,ǁ‖ World Politics 55, 4: 517-549.
Boone, Catherine. 2003. Political Topographies of the African State: Territorial Authority and Institutional Choice. Cambridge: Cambridge University Press.
Brambor, Thomas et al. 2006. “Are African Party Systems Different?” Electoral Studies 26 (2): 315-23.
Branch, Daniel. 2011. Kenya: Between Hope and Despair, 1963-2011. Yale University Press.
Bratton, Michael and Nicholas Van de Walle. 1992. “Popular Protest and Political Reform in Africa.” Comparative Politics 24:4, 419-42.
Bratton, Michael, and Nicolas van de Walle. 1997. Democratic experiments in Africa: regime transitions in comparative perspective, Cambridge studies in comparative politics. Cambridge, U.K. New York: Cambridge University Press.
Bratton, Michael, Robert Mattes, and E. Gyimah-Boadi. 2005. Public Opinion, Democracy and Market Reform in Africa. New York: Cambridge University Press.
Bratton, Michael and Eric Chang. 2006. “State Building and Democratization in Africa: Forwards, Backwards or Together?” Comparative Political Studies, 39, 9, 1059-1083
Bratton, Michael. 2007. Formal Versus Informal Institutions in Africa. Journal of Democracy 18 (3).
Bratton, Michael, and Mwangi S. Kimenyi. 2008. Voting in Kenya: Putting Ethnicity in Perspective. Journal of East African Studies 2 (2): 272-289.
229
Bratton, Michael, Bhavnani R., and Chen, T. 2012. “Voting Intentions in Africa: Ethnic, Economic, or Partisan?” Commonwealth and Comparative Politics 50:1 (February):27-52.
Bratton, Michael (eds). 2013. Voting and Democratic Citizenship in Africa. Boulder: Lynne Rienner Publishers.
Bratton, Michael. 2013. “Do Free elections foster Capable Governments?” in Voting and Democratic Citizenship in Africa eds. Michael Bratton. Lynne Rienner, Boulder CO. 253-276.
Brown, Stephen and Raddatz, Rosalind. 2014. “Dire consequences or empty threats? Western pressure for peace, justice and democracy in Kenya, Journal of Eastern African Studies”, 8:1, 43-62.
Burnell, Peter. 2004. Building Better Democracies: Why Political Parties Matter. London: Westminster Foundation for Democracy.
Caramani, Daniele. 2004. The Nationalization of Politics. Cam- bridge: Cambridge University Press.
Carothers, Thomas. 2006. Confronting the Weakest Link: Aiding Political Parties in New Democracies, (Washington DC: Carnegie Endowment for International Peace).
Chabal, Patrick and Jean-Pascal Daloz. 1999. Africa Works: Disorder as Political Instrument. Bloomington: Indiana University Press.
Chandra, Kanchan (2004) Why Ethnic Parties Succeed: Patronage and Ethnic Head Count in India. Cambridge: Cambridge University Press.
Cheeseman Nic & Miles Larmer (2013): Ethnopopulism in Africa: opposition mobilization in diverse and unequal societies, Democratization, DOI:10.1080/13510347.2013.809065
Chege, Michael. 2007. “Weighed Down by Old Ethnic Baggage, Kenya Races to Another Historic Election.” Center for Strategic and International Studies: https://csis.org/story/weighed-down-old-ethnic-baggage-kenya-races-another-historic-election
Chibber, Pradeep and Ken Kollman. 1998. “Party Aggregation and the number of parties in the United States and India.” American Political Science Review 92:329-42.
Chhibber, Pradeep and Kollman, Ken. 2004. The Formation of National Party Systems: Federalism and Party Competition in Canada, Great Britain, India, and the United States. Princeton: Princeton University Press.
Cheeseman, Nic and Robert Ford. 2007. “Ethnicity as a Political Cleavage.” Afrobarometer Working Paper No. 83. East Lansing MI.
Claffey, Patrick, "Kérékou the Chameleon, Master of Myth", in Staging Politics: Power and
230
Performance in Asia and Africa (2007), ed. Julia C. Strauss and Donald Cruise O'Brien, pages 98–101.
Colaresi, Michael and William R. Thompson. 2003. “The Democracy-Economic Development Nexus: Does the Outside World Matter?”. Comparative Political Studies 36(4): 381-403.
Coleman, James. 1954. “Nationalism in Tropical Africa.” American Political Science Review 48:2.
Coleman, J and Rosberg, C (eds). 1964. Political Parties and National Integration in Africa, (CA: University of California Press).
Collier, Paul and Hoffler, Anke. 2000. “Greed and Grievance in Civil War.” Policy Research Working Paper 2355. The World Bank. May 2000, 1-44.
Committee on Evaluation of USAID Democracy Assistance Programs. 2008. Improving Democracy Assistance; Building Knowledge Through Evaluation and Research. The National Academies Press. Washington D.C.
Conroy-Krutz, Jeffrey. 2009. “African Cities and Incumbent Hostility: Explaining Opposition Success in Urban Areas.” manuscript.
Conroy-Krutz, Jeffrey and Dominique Lewis. 2011 “Mapping Ideologies in African Landscapes” Afrobarometer Working Paper 129. http://www.afrobarometer.org/files/documents/working_papers/AfropaperNo129.pdf
Cox, Gary W. and Mathew D. McCubbins. 1993. Legislative Leviathan. Berkeley: UC Press.
Cox, W. Gary, and Matthew S. Shugart. 1996. Strategic Voting Under Proportional Representation. Journal of Law, Economics and Organization 12 (2): 299-324.
Cox, W. Gary. 1997. Making Votes Count: Strategic Coordination in the World's Electoral Systems. New York: Cambridge University Press.
Cox, Gary. 1999. Electoral Rules and Electoral Coordination Annual Review of Political Science 2: 145-161.
Creevey, Lucy, Ngomo, Paul and Vengroff, Richard. 2005. “Party Politics and Different Paths to Democratic Transitions: A Comparison of Benin and Senegal.” Party Politics 11:471
Dahl, R. 1971. Polyarchy. New Haven: Yale University Press.
Danso-Boafo, Kawaku. 1996. The Political Biography of Dr. Kofi Abrefa Buisa. Accra: Ghana Universities Press.
Debrah, E. 2011. "Measuring Governance Institutions' Success in Ghana: The Case of the Electoral Commission, 1993-2008." African Studies 70: 25-45.
231
Decalo, Samuel (1997). "Benin: First of the new democracies". In John F. Clark & David E. Gardinier. Political Reform in Francophone Africa. Boulder, CO: Westview Press. pp. 43–61
Diamond, Larry and Richard Gunther (eds). 2001. Political Parties and Democracy. Baltimore: Johns Hopkins University Press, 2001.
Diamond, Larry. 1988. Class, Ethnicity, and Democracy in Nigeria: The Failure of the First Republic. Syracuse: Syracuse University Press.
Diamond, Larry. 2002. “Thinking About Hybrid Regimes” Journal of Democracy. 13 (2): 21-35.
Dix, Robert H. 1989. ‘Cleavage structures and party systems in Latin America.’ Comparative Politics (October): 23–37.
Doherty, Ivan (2001) 'Democracy out of Balance. Civil Society Can't Replace Political Parties', Policy Review, April/May, 25-35.
Dowd, Robert A., and Michael Driessen. ‘Ethnically Dominated Party Systems and the Quality of Democracy: Evidence from Sub-Saharan Africa’. Afrobarometer Working Paper No. 92, 2008.
Downs, Anthony. 1957. An Economic Theory of Democracy. New York: Harper and Row.
Duverger, Maurice. 1954. Political Parties, Their Organization and Activity in the Modern State. New York: Wiley.
Dulani, Boniface. 2011. Personal Rule and Presidential Term Limits in Africa. PhD dissertation, Michigan State University.
Elischer, Sebastian. 2008. “Do African parties contribute to democracy? Some findings from Kenya, Ghana, and Nigeria.” African Spectrum 43 2:175-201.
Elischer, Sebastian. 2013. Political Parties in Africa: Ethnicity and Part Formation. Cambridge University Press
Engels, Jan Niklas, Alexander Stroh and Leonard Wantchekon. 2008. Le fonctionnement des partis politiques au Benin. Friedrich Ebert Stiftung (FES, Benin).
Epstein, Leon. 1967. Political Parties in Western Democracies. New York: Praeger.
Erdmann, Gero. 2007. “Party Research: Western European Bias and the ‘African Labyrinth’.” In Mathias Basedau, Gero Erdmann, and Andreas Mehler, Eds. Votes, Money, and Violence: Political Parties and Elections in Sub-Saharan Africa. Uppsala: Nordiska Afrikainstiutet.
Erdmann, Gero. 2010. “Political Party Assistance and Political Party Research: towards a Closer Encounter?” Democratization 17 (6): 1275-1296.
232
Erdmann, Gero. (2012) “Political party assistance and political party research: towards a closer encounter?” in Peter Burnell and Andre W.M. Gerrits (eds) Promoting Party Politics in Democracies, pp. 211-232. New York: Routledge.
Fearon, J. D., & Laitin, D. D. (2003). Ethnicity, insurgency, and civil war. American Political Science Review, 97(1), 75-90.
Ferree, Karen. 2006. “Explaining South Africa’s Racial Census.” The Journal of Politics, 68 (4), 2006, 803-815.
Ferree, Karen E. 2010. “The Social Origins of Electoral Volatility in Africa.” British Journal of Political Science 40 (4): 759-779.
Ferree, Karen and Jeremy Horowitz. 2010. “Ties that bind? The rise and decline of ethno-regional partisanship in Malawi, 1994-2009.” Democratization 17:534–563.
Ferree, E. Karen, Gibson, Clark C. & James D. Long. 2014 Voting behavior and electoral irregularities in Kenya's 2013 Election, Journal of Eastern African Studies, 8:1, 153-172,
Foeken, D. and T. Dietz. 2000. “Of Ethnicity, Manipulation and Observation: The 1992 and 1997 Elections in Kenya.” In Jon Abbink and Gerti Hesseling, Eds. Electoral Observation and Democratization in Africa. New York: Palgrave and Macmillan.
Gandhi, Jennifer. 2008. Political Institutions Under Dictatorship. New York: Cambridge University Press.
Gandhi, Jennifer, and Ellen Lust-Okar. 2009. Elections Under Authoritarianism. Annual Review of Political Science 12: 403-422.
Gazibo, Mamoudou. 2012. “Beyond Electoral Democracy: Foreign Aid and the Challenge of Deepening Democracy in Benin.” United Nations University –UNU-WIDER
Gerber, ER, and JE Jackson. 1993. "Endogenous preferences and the study of institutions." American Political Science Review 87 (3):639-56.
Geddes, Barbara and Frantz, Erica ‘‘The Effect of Dictatorships on Party Systems in Latin America’’, unpublished manuscript, UCLA, 2007.
Greenberg, Ari and Robert Mattes. 2013. “Does the Quality of Elections Affect the Consolidation of Democracy?” in Voting and Democratic Citizenship in Africa eds. Michael Bratton. Lynne Rienner, Boulder CO. 239-252
Gunther, Richard and Diamond, Larry (2003), 'Species of Political Parties: A New Typology', Party Politics, 9,167-99.
Gyimah-Boadi, E. 1999. "Institutionalizing Credible Elections in Ghana." In The Self-
233
Restraining State : Power and Accountability in New Democracies, eds. Andreas Schedler, Larry Jay Diamond and Marc F. Plattner: Lynne Rienner Publishers.
Gyimah-Boadi, E. 2009. "Another Step Forward for Ghana." Journal of Democracy 20: 138-52.
Harbeson, John. 2011. “Zeal To Restore Party Morals Hurts Democracy,” Nairobi Law Monthly, October 1, 2011. http://www.nairobilawmonthly.com/modules/frontpage/php/fullview_content.php?mode=0&multi=0&type=0&pos=0&limit=0&id=115&
Habyarimana, James, Macartan Humphreys, Daniel Posner, and Jeremy M. Weinstein. 2009. Coethnicity: Diversity and the Dilemmas of Collective Action. New York: Russell Sage Foundation
Haggard, Stephan and Kaufman, Robert. 1995. The Political Economy of Democratic Transitions, Princeton NJ: Princeton University Press.
Hartman, Christof. Senegal's party system: the limits of formal regulation. Democratization. 2010, Pages 769 – 786.
Harding, Robin. 2013. “Explaining Party Attachments Across Africa.” Working paper: https://files.nyu.edu/rfh227/public/Harding_PartisanshipDraft_Feb2013.pdf
Hall, Peter A., and Rosemary C. R. Taylor. 1996. Political Science and the Three New Institutionalisms. Political Studies 44: 936-957.
Hicken, Alan. 2008. ‘Political engineering and party regulation in Southeast Asia’, in Ben Reilly and Peter Nordlund (eds) Political Parties in Conflict-Prone Societies, pp. 69–94. Tokyo and New York: United Nations University Press.
Hicken, Alan. 2009. Building Party Systems in Developing Democracies. Cambridge: Cambridge University Press.
Heclo, Hugh. 1974. Modern Social Policies in Britain and Sweden (New Haven: Yale University Press.
Heldmann, Moritz. 2009. “Ethnic Groups in Benin.” Impetus Atlas Benin: https://www.google.com/search?q=Heldmann+benin&oq=Heldmann+benin&aqs=chrome..69i57.2311j0j7&sourceid=chrome&es_sm=91&ie=UTF-8
Herbst, Jeffrey. States and Power in Africa: Comparative Lessons in Authority and Control. Princeton: Princeton University Press.
Hicken, Alan. 2009. Building Party Systems in Developing Democracies. Cambridge: Cambridge University Press.
Hornsby, Charles. 2013. Kenya: A History Since Independence. New York: I.B. TAURIS
234
Horowitz, Donald L. 1985. Ethnic Groups in Conflict, Berkeley CA: University of California Press.
Horowitz, Donald L.1991. A Democratic South Africa? Constitutional Engineering in a Divided Society, Berkeley CA: University of California Press.
Hounkpe, Mathias. 2011. “Chapter 2: Benin” in Election Management Bodies in West Africa A review by AFRIMAP and the Open Society Initiative for West Africa.
Hulterstrom, Karolina. 2004. In Pursuit of Ethnic Politics: Voters, Parties, and Policies in Kenya and Zambia. Uppsala: Uppsala University Press.
Human Rights Watch, Africa Watch. 1993. Divide and Rule: State Sponsored Ethnic Violence in Kenya. New York.
Huntington, Samuel. 1968. Political Order in Changing Societies. New Haven Yale University Press.
Huntington, Samuel 1991-1992. How Countries Democratize. Political Science Quarterly 106 (4): 569-616.
Huntington, Samuel. 1991. The Third Wave: Democratization in the Late Twentieth Century. Norman: University of Oklahoma Press.
International Institute for Democracy and Electoral Assistance (IDEA). 2006. Kenya: Country Report based on Research and Dialogue with Political Parties. Stockholm http://www.idea.int/parties/upload/Kenya%20laid%20out.pdf
Janda, Kenneth. 2004. ‘‘Adopting Party Law’’, working paper series on Political Parties and Democracy in Theoretical and Practical Perspectives, Washington DC: National Democratic Institute for International Affairs.
Janda, Kenneth. 2005. Political Parties and Democracy in Theoretical and Practical Perspectives: Adopting Party Law. Washington: National Democratic Institute for International Affairs.
Jockers, H., D. Kohnert, and P. Nugent. 2009. "The Successful Ghana Election of 2008: A Convenient Myth?". The Journal of Modern African Studies 48: 95-115.
Jones, Mark P. and Mainwaring, Scott. 2003. "The Nationalization of Parties and Party Systems: An Empirical Measure and an Application to the Americas," Party Politics, 9, 139-166.
Katz, Richard S. 2004. “Democracy and the Legal Regulation of Political Parties”. Prepared for USAID's conference on "Change in Political Parties," Washington, D.C.
Key, V. O., Jr. 1964. Politics, Parties, and Pressure Groups, 5th ed. New York: Crowell.
Kelly, Catherine Lena. 2012. “Senegal: What Will Turnover Bring?” Journal of Democracy 23(3): 121-131.
235
Kerr, Nicholas. 2013. "Popular Evaluations of Election Quality in Africa: Evidence from Nigeria." Electoral Studies 32: 19
Kasfir, Nelson. 1974. “Departicipation and Political Development in Black African Politics.” Studies in Comparative International Development 9:3, 3-25.
Katz, Richard S. 2004. “Democracy and the Legal Regulation of Political Parties”. Prepared for USAID's conference on "Change in Political Parties," Washington, D.C., 1.
Kollman, K., Hicken, A., Caramani, D., & Backer, D. (2013). Constituency-level elections archive [data file and codebook]. Ann Arbor, MI: Center for Political Studies, University of Michigan [producer and distributor].
Kuenzi, Michelle and Lambright, Gina. 2001. ‘Party Institutionalization in 30 African Countries’, Party Politics, 7: 4, pp. 438–68;
Laakso, Markku and Rein Taagepera. 1979. “Effective Number of Parties: A Measure with Application to West Europe.” Comparative Political Studies 12 (1) (April): 3–27.
Lansford, Tom (editor). 2012. Political Handbook of the World, 2012. CQ Press.
Lansner, Thomas. R. 2012. “Report: Countries at the Crossroads 2012: Kenya.” Freedom House, September 5, 2012: http://www.freedomhouse.org/sites/default/files/Kenya%20-%20FINAL.pdf
Lebas, Adrienne. 2010. “Party Organization and the Evolution of Party Systems in Africa.” Paper presented at the Princeton Workshop on Political Parties in the Developing World. April 30-May 1, Princeton, NJ.
LeBas, Adrienne. 2011. From Protest to Parties: Party Building & Democratization in Africa. Oxford: University of Oxford Press.
Leonard, David and Strauss, Scott. 2003. Africa’s Stalled Development: International Causes and Cures Boulder, Colo.: Lynne Rienner, pg. 3.
Levitsky, Steven and Way, Lucan A. 2010. Competitive Authoritarianism: Hybrid Regimes After the Cold War New York: Cambridge University Press.
Lieberman, E. S. 2005." Nested analysis as a mixed-method strategy for comparative research". American Political Science Review 99 (3): 435-452.
Lindberg, Staffan. 2006. Democracy and Elections in Africa. Baltimore: Johns Hopkins University Press.
Lindberg, Staffan. 2007. “Institutionalization of Partysystems? Stability and Fluidity among Legislative Parties in Africa’s Democracies.” Government and opposition 42 (2) pp. 212-241.
236
Lindberg, Staffan I., and Minion K. C. Morrison. 2008. ‘‘Are African Voters Really Ethnic or Clientelistic? Survey Evidence from Ghana.’’ Political Science Quarterly 123 (1): 95-122.
Linz, Juan J. and Alfred Stepan. 1996. Problems of Democratic Transition and Consolidation: Southern Europe, South America, and Post-Communist Europe. Johns Hopkins University Press.
Lijphart, Arend (1977) Democracy in Plural Societies. New Haven, CT: Yale University Press.
Lijphart, Arend. 1984. Democracies: Patterns of Majoritarian & Consensus Government in Twenty-one Countries. New Haven, CT: Yale University Press.
Lipset, Seymour Martin and Rokkan, Stein. 1967. 'Cleavage Structures, Party Systems and Voter Alignments: An Introduction', in Seymour Martin Lipset and Stein Rokkan (eds) Party Systems and Voter Alignments. Cross-National Perspectives, (New York: The Free Press).
Lipset, Seymour Martin. 2000. ‘‘The Indispensability of Political Parties’’, Journal of Democracy, 11(1), 2000: 48–55.
Londregan, John B. and Keith Poole. 1990. “Poverty, The Coup Trap, and the Seizure of Executive Power.” World Politics, 42( 2 Jan.): 151-183.
Lupu, Noam and Stokes, Susan, ‘‘Democracy Interrupted: Regime Change and Partisan Stability in Twentieth Century Argentina’’, unpublished manuscript, Yale University, 2007.
Lynch, Gabrielle. 2011. I Say to You: Ethnic Politics and the Kalenjin in Kenya. Chicago: University of Chicago Press.
Lynch, Gabrielle. 2014. Electing the ‘alliance of the accused’: the success of the Jubilee Alliance in Kenya's Rift Valley, Journal of Eastern African Studies, 8:1, 93-114.
March, James and John Olsen. 1984. “The New Institutionalism: Organizational Factors in Political Life,” American Political Science Review 78, 734-749.
Mair, Peter. 1997. Party System Change. Oxford: Oxford University Press.
Mainwaring, Scott and Timothy Scully. 1992. Party Systems in Latin America. Paper for the 1992 Latin American Studies Association meeting, Los Angeles, September 24-27, 1992.
Mainwaring, Scott and Timothy Scully. 1995. Building Democratic Institutions: Party Systems in Latin America. Stanford, CA: Stanford University Press.
Mainwaring, S., and Torcal, M. (2006): “Party System Institutionalization and Party System Theory after the Third Wave of Democratization”, in Richard S. Katz and William J. Crotty (eds.), Handbook of Party Politics, London: Thousand Oaks.
Mahoney, James and Thelen, Kathleen. 2010. Explaining Institutional Change: Ambiguity, Agency, and Power. Cambridge, UK: Cambridge University Press.
237
MacLean, Lauren. 2002. “Constructing a Social Safety Net in Africa: An Institutionalist Analysis of Colonial Rule and State Social Policies in Ghana and Cote d’Ivoire.” Studies in Comparative International Development.
MacLean, Lauren. 2010 Informal Institutions and Citizenship in Rural Africa: Risks and reciprocity in Ghana and Cote d’Ivoire. Cambridge university Press.
Manning, Carrie. 2005. “Assessing African Party Systems after the Third Wave.” Party Politics 11:6, 707-27.
Mazrui, Ali. 1966. “Nkrumah: The Leninist Czar.” Transition (26): 8-17
McGowan, P. J., & Johnson, T. H. (1984). African military coups d’etat and underdevelopment: A quantitative historical analysis. Journal of Modern African Studies, 22(4), 633-666.
Miguel, Edward. 2004. Tribe or Nation? Nation-Building and Public Goods in Kenya versus Tanzania. World Politics 56 (2): 327-362.
Miguel, Edward, Satyanath, Shanker, and Sergenti, Ernest. 2004. “Economic Shocks and Civil Conflict: An Instrumental Variable Approach”. The Journal of Political Economy 112(4)” pg. 725-753.
Miles, William F. S. 1994. Hausaland Divided: colonialism and Independence in Nigeria and Niger. Cornell: Cornell University Press.
Momba, Jotham. 2005. Political Parties and the Quest for Democratic Consolidation in Zambia. EISA Research Report No 17. Johannesburg, South Africa.
Montalvo, Jose G., and Marta Reynal-Querol. 2005. "Ethnic diversity and economic development." Journal of Development Economics 76 (2):293-323.
Moore, Robert Ian 1981. The Hamlyn Historical Atlas. Ann Arbor, MU: The University of Michigan Press.
Morgenstern, Scott, Stephen M. Swindle, and Andrea Castagnola. 2009. “Party Nationalization and Institutions.” Journal of Politics 71(4): 1322-1341.
Morrison, Minion and Jae Woo Hong. 2006. “Ghana’s political parties: how ethno/regional variations sustain the national two-party system.” Journal of Modern African Studies 44(4), pp623-647.
Moroff, Anika. 2010. Comparing ethnic party regulation in East Africa, Democratization, 17:4, 750-768
Moroff, Anika. 2010. “Party Bans in Africa: An Empirical Overview’, Democratization, 17(4): 618–41.
238
Moroff, Anika and Matthias Basedau (2010) ‘An Effective Measure of Institutional Engineering? Ethnic Party Bans in Africa’, Democratization 17(4): 666–86.
Mozaffar, Shaheen, James R. Scarritt, and Glen Galaich. 2003. “Electoral Institutions, Ethnopolitical Cleavages and Party Systems in Africa’s Emerging Democracies.” American Political Science Review 97: 379–90.
Murunga, Godwin and Shadrack Nasong’o. 2007. Kenya: The struggle for Democracy (Africa in the New Millennium Series). Zed books.
Mueller, Susanne D. 2014. “Kenya and the International Criminal Court (ICC): politics, the election and the law”, Journal of Eastern African Studies, 8:1, 25-42,
Nicholson, Greg. 2013. “Kenya’s presidential debates plagued by half-answers and veiled attacks. Theguardian.com, February 26, 2013: http://www.theguardian.com/world/2013/feb/26/kenya-election-debate-failed
Ninsin, Kwame. 2006. “Political Parties and Political Participation in Ghana.” A Study on behalf of the Konrad Adenauer Foundation.
Nohlen, Dieter et al. 1999. Elections in Africa: A Data Handbook. Oxford: Oxford University Press.
Norris, Pippa. 2004. Building Political Parties. A report commissioned by International IDEA.
Nordlund, P. (2004). “Ghana: Country Report based on Research and Dialogue with Political Parties.” IDEA and CDD-Ghana country report.
Nwajiaku, Kathryn. 1994. “The National Conferences in Benin and Togo Revisited.” The Journal of Modern African Studies 32 (3): 429-447.
Okumu, Eugene. 2013. “Kenya” Political Parties in Registration Fraud Saga.” The Star. January 3, 2013.
Okoampa-Ahoofe, Kwame. 2005. Dr. J.B. Danquah: Architect of Modern Ghana. Iuniverse, Lincoln, NE.
Olson, Mancur. 1965. The Logic of Collective Action; Public Goods and the Theory of Groups. Cambridge, Mass.,: Harvard University Press.
Panebianco, Angelo. 1988. Political Parties: Organization and Power. Cambridge: Cambridge University Press.
Pedersen, Mogens. 1979. The Dynamics of European Party Systems: Changing Patterns of Electoral Volatility', European Journal of Political Research, 7/1, 1-26
Pierson, Paul. 2000. “Increasing Returns, Path Dependence, and the Study of Politics.” The American Political Science Review.

239
Pierson, Paul. Politics in Time: History, Institutions, and Social Analysis. Princeton: Princeton University Press, 2004.
Pippa Norris. 2000 A Virtuous Circle? Political Communications in Post-Industrial Democracies. Cambridge: Cambridge University Press. Pp. 398
Popkin, Samuel L. 1994. The Reasoning Voter: Communication and Persuasion in Presidential Campaigns. University of Chicago Press.
Posner, Daniel. 2004. "The political salience of cultural difference: Why Chewas and Tumbukas are allies in Zambia and adversaries in Malawi." American Political Science Review 98 (04):529-45.
Posner, Daniel. 2004. “Measuring Ethnic Fractionalization in Africa.” American Journal of Political Science, 46: 849-863
Posner, Daniel N, and Daniel J. Young. 2007. “The Institutionalization of Political Power in Africa.” Journal of Democracy 18 (3), 126-140
Posner, Daniel N. 2005. Institutions and Ethnic Politics in Africa. New York: Cambridge University Press.
Powell, Jr. G. Bingham. 2000. Elections as Instruments of Democracy. New Haven, CT: Yale University Press.
Przeworski, A., Alvarez, M. E., Cheibub, J. A., & Limongi, F. (2000). Democracy and development: Political institutions and well-being in the world, 1950–1990. Cambridge, UK: Cambridge University Press.
Rakner, Lise and Lars Svasand. 2003. “Uncertainty as a Strategy: Electoral Processes in Zambia 1991-2001”. Chr. Michelsen Institute (CMI), Norway.
Randall, Vicky and Svåsand, Lars. 2002. 'Party Institutionalization in New Democracies', Party Politics, 8 (1), 5-29.
Riedl, Rachel Beatty. 2014. Authoritarian Origins of Democratic Party Systems in Africa. Cambridge University Press.
Rogowski, Jon C. Forthcoming. “Electoral Choice, Ideological ConWict, and Political Participation. “American Journal of Political Science.
Randall, Vicky and Svåsand, Lars. 2002. 'Party Institutionalization in New Democracies', Party Politics, 8 (1), 5-29.
Riker, William. 1982. "The Two-Party System and Duverger's Law. “American Political Science Review 76(December):753-66.
240
Reilly, Ben and Andrew Reynolds (1999) Electoral Systems and Conflict in Divided Societies. Washington, DC: National Academy Press.
Reilly, Benjamin. 2001. Democracy in Divided Societies: Electoral Engineering for Conflict Management Cambridge: Cambridge University Press.
Reilly, Ben (2006) ‘Political Engineering and Party Politics in Conflict-Prone Societies’, Democratization 13: 811–27.
Reilly, Ben and Peter Nordlund (eds) (2008) Political Parties in Conflict-Prone Societies: Regulation, Engineering and Democratic Development. Tokyo and New York: United Nations University Press.
Reynolds, Andrew. 1999. Electoral Systems and Democratization in Southern Africa. Oxford: Oxford University Press.
Roberts, K. M., & Wibbels, E. (1999). Party systems and electoral volatility in Latin America: a test of economic, institutional, and structural explanations. American Political Science Review, 575-590.
Robinson, Amanda Lee. 2009. "National Versus Ethnic Identity in Africa: State, Group and Individual Level Correlates of National Identification." In Afrobarometer Paper.
Rose, R. and D. Urwin (1975), Regional Differentiation and Political Unity in Western Nations. London: Sage
Sartori, Giovanni (1976) Parties and Party Systems. A Framework for Analysis. Cambridge: Cambridge University Press.
Sartori, Giovanni. 1997. Comparative Constitutional Engineering, 2nd Ed. 1997.
Schattschneider, Elmer E. 1942. Party Government, New York, Farrar and Rinehart, 1942.
Schattschneider, E.E. 1960. The Semi-Sovereign People: A Realist’s View of Democracy in America. New York: Holt, Rinehart, and Winston.
Schedler, Andreas. 1998. “What is Democratic Consolidation?” Journal of Democracy 9 (2) 91-107.
Schedler, Andreas. 2002. ‘The Menu of Manipulation’, Journal of Democracy 13: 36–50.
Schedler, Andreas. 2006. Electoral Authoritarianism: The Dynamics of Unfree Competition. Boulder and London: Lynne Rienner Publishers.
Schickler, Eric. 2001. Disjointed Pluralism: Institutional Innovation in the U.S. Congress. Princeton, NJ: Princeton University Press.
241
Schlesinger, L. and Heskett, J. (1991) Breaking the cycle of failure in services, Sloan Management Review, vol. 31, spring 1991, pp. 17 – 28.
Schumpeter, Joseph. 1950. Capitalism, Socialism and Democracy (New York: Harper and Row.
Seely, Jennifer C. 2009. The Legacies of Transition Governments in Africa: The Cases of Benin and Togo.
Simmons, Beth A and Elkins, Zachary. 2004. “The globalization of Liberalization: Policy Diffusion in the International Political Economy.” American Political Science Review 98 (1), 171-189.
Sisk, Timothy D. 1996. Power Sharing and International Mediation in Ethnic Conflicts (Washington, DC: United States Institute of Peace Press)
Standard Media. 2005. “Kenya: Orange Team Up in Arms Over Party’s Registration”. December 29, 2005. http://allafrica.com/stories/200512290288.html
Standard Media. 2013. “Political Parties in members registration fraud”. January 4, 2013. https://www.standardmedia.co.ke/?articleID=2000074199&story_title=Kenya-Political-parties-in-members-registration-fraud
Steinmo, Sven and Caroline Tolbert. 1998. “Do Institutions Really Matter? Taxation in Industrialized Democracies. Comparative Political Studies.
Stepan, Alfred C. 2001. ‘Toward a New Comparative Politics of Federalism, (Multi)Nationalism, and Democracy: Beyond Rikerian Federalism’, in Alfred Stepan, Arguing Comparative Politics, Oxford: Oxford University Press.
Stepan, Alfred. Juan J. Linz, and Yogendra Yadav. 2011. Crafting State-Nations: India and other Multinational Democracies. Johns Hopkins University Press.
Tsebelis, G. (1995). Decision making in political systems: Veto players in presidentialism, parliamentarism, multicameralism and multipartyism. British journal of political science, 25(3), 289-325.
Tsebelis, G. (2002). Veto players: How political institutions work. Princeton University Press.
True, Jacqui and Mintrom, Michael. 2001. “Transnational Networks and Policy diffusion: The Case of Gender Mainstreaming.” International Studies Quarterly 45 (1), pp. 27-57.
Thelen, Kathleen, and Sven Steinmo. 1995. "Historical Institutionalism in Comparative Politics." In Structuring Politics: Historical Institutionalism in Comparative Analysis, ed. S. Steinmo, K. Thelen and F. Longstreth. New York: Cambridge University Press.
Thelen, Kathleen. 1999. "Historical Institutionalism in Comparative Politics." Annual Review of Political Science 2: 369-404.
242
Thelen, Kathleen. 2004. How Institutions Evolve: The Political Economy of Skills in Germany, Britain, the United States and Japan, New York: Cambridge University Press.
Throup, David and Charles Hornsby. 1988. Multi-party Politics in Kenya: The Kenyatta and Moi States and the Triumph of the System in the 1992 Elections. Athens, OH: Ohio University Press.
Van de Walle, Nicolas and Smiddy Butler. 1999. “Political Parties and Party Systems in Africa’s Illiberal Democracies.” Cambridge Review of International Affairs 13:1, 14-28.
Van de Walle, Nicolas. 2002. “Africa’s Range of Regimes.” Journal of Democracy 13:2, 66-80.
Van de Walle. 2003." Presidentialism and Clientelism in Africa's emerging party system". Journal of Modern African Studies 41 (2): 25.
Varshney, Ashutosh. 2003. "Nationalism, Ethnic Conflict, and Rationality." Perspectives on Politics 1 (1):85-99.
Wachira, Muchemi and Makan, Jami. 2008. “New Political Parties Law Faulty, Says TI,” Daily Nation, July 31, 2008, http://www.nation.co.ke/News/-/1056/445324/-/tj28qg/-/index.html.
Wamwere, Koigi Wa. 2003. Negative Ethnicity: From Bias to Genocide. London. Seven Stories Press. http://allafrica.com/stories/201301040654.html
Warigi, Gitau. 2006. “Kibaki’s ‘mafia’ on the run.” BBC Focus on Africa Magazine. April 14, 2006. http://news.bbc.co.uk/2/hi/africa/4875562.stm
Weingast, Barry R. 1997. “The Political Foundations of Democracy and The Rule of Law.” American Political Science Review 91 (2) 245-263.
Widner, Jennifer. 1992. The Rise of the Party-State in Kenya: From Nyayo to Harambee. Berkeley, CA: University of California Press.
Widner, Jennifer. 1997. “Political Parties and Civil Societies in sub-Saharan Africa.” In Marina Ottaway, ed., Democracy in Africa: The Hard Road Ahead. Boulder, CO: Lynne Rienner.
Wilkin, Sam, Haller, Brandon, Haller, and Norpoth, Helmut. 1997. “From Argentina to Zambia: a Worldwide Test of Economic Voting”. Electoral Studies 16 (3): pp: 301-316.
Weyland, Kurt. 2007. Bounded Rationality and Policy Diffusion: Social Sector Reform in Latin America. Princeton University Press.
Wrong, Michela. 2009. It’s our Turn to Eat: The Story of a Kenyan Whistle-blower. London: Harper Perennial.
Yalae, Papa. 2006. “Tension in Ghana: the Solution is…” Ghanaweb, article 97142. http://www.ghanaweb.com/GhanaHomePage/NewsArchive/artikel.php?ID=97142
243
Youde, Jeremy. 2005. ‘‘Economics and Government Popularity in Ghana.’’ Electoral Studies 24, no. 1: 1-16.
Young, Daniel J. 2012. “An Initial Look into party switching in Africa: Evidence from Malawi” Party Politics, 1-11.
Zakaria, Fareed. 1997. The Rise of Illiberal Democracy. Foreign Affairs 76 (6): 22-43.
Zolberg, Aristide. 1966. Creating Political Order: The Party-States of West Africa. Chicago: University of Chicago Press.