evidence that the spectral dependence of light absorption ... · evidence that the spectral...
TRANSCRIPT
Evidence that the spectral dependence of light absorption
by aerosols is affected by organic carbon
Thomas W. Kirchstetter and T. NovakovEnvironmental Energy Technologies Division, Lawrence Berkeley National Laboratory, Berkeley, California, USA
Peter V. HobbsAtmospheric Sciences Department, University of Washington, Seattle, Washington, USA
Received 10 May 2004; revised 2 August 2004; accepted 19 August 2004; published 12 November 2004.
[1] The wavelength dependence of light absorption by aerosols collected on filters isinvestigated throughout the near-ultraviolet to near-infrared spectral region. Measurementswere made using an optical transmission method. Aerosols produced by biomasscombustion, including wood and savanna burning, and by motor vehicles, including dieseltrucks, are included in the analysis. These aerosol types were distinguished by differentwavelength (l) dependences in light absorption. Light absorption by the motor vehicleaerosols exhibited relatively weak wavelength dependence; absorption variedapproximately as l�1, indicating that black carbon (BC) was the dominant absorbingaerosol component. By contrast, the biomass smoke aerosols had much strongerwavelength dependence, approximately l�2. The stronger spectral dependence was theresult of enhanced light absorption at wavelengths shorter than 600 nm and was largelyreduced when much of the sample organic carbon (OC) was extracted by dissolution inacetone. This indicates that OC in addition to BC in the biomass smoke aerosolscontributed significantly to measured light absorption in the ultraviolet and visible spectralregions and that OC in biomass burning aerosols may appreciably absorb solar radiation.Estimated absorption efficiencies and imaginary refractive indices are presented for theOC extracted from biomass burning samples and the BC in motor vehicle-dominatedaerosol samples. The uncertainty of these constants is discussed. Overall, results of thisinvestigation show that low-temperature, incomplete combustion processes, includingbiomass burning, can produce light-absorbing aerosols that exhibit much stronger spectraldependence than high-temperature combustion processes, such as dieselcombustion. INDEX TERMS: 0305 Atmospheric Composition and Structure: Aerosols and particles
(0345, 4801); 0360 Atmospheric Composition and Structure: Transmission and scattering of radiation; 1610
Global Change: Atmosphere (0315, 0325); KEYWORDS: aerosol light absorption, biomass burning, organic
carbon
Citation: Kirchstetter, T. W., T. Novakov, and P. V. Hobbs (2004), Evidence that the spectral dependence of light absorption by
aerosols is affected by organic carbon, J. Geophys. Res., 109, D21208, doi:10.1029/2004JD004999.
1. Introduction
[2] Atmospheric aerosol particles directly modify theearth’s radiation balance by absorbing and scattering solarradiation. Recent modeling and field studies indicate thataerosol light absorption is an important component ofclimate forcing. For instance, the direct radiative forcingof light-absorbing aerosols may be greater than that ofmethane and equal to about one third of that of carbondioxide [Jacobson, 2001]. Observations from an experimentin the Indian Ocean showed that aerosol-induced changes inregional radiative fluxes can be an order of magnitude largerthan the global mean forcing by aerosols or greenhousegases [Krishnan and Ramanathan, 2002, and referencestherein]. Changes in regional stability caused by atmospheric
heating of light-absorbing aerosols may alter large-scalecirculations and the hydrological cycle, enough so, appar-ently, to account for observed temperature and precipitationchanges in China and India [Menon et al., 2002]. Thesefindings underscore the need to understand the role ofaerosol light absorption in climate change, which requiresinclusion of realistic representations of aerosols and theirradiative forcings. However, recent assessments of climatechange point out the need for better measurements of aerosolatmospheric mass concentrations and optical properties inorder to reduce uncertainties in climate models [Houghtonet al., 2001; V. Ramanathan et al., A National ResearchImperative White Paper, National Aerosol-Climate Interac-tions Program, 2002, available at http://www-nacip.ucsd.edu/NACIPWhitePaperMay2102.pdf].[3] Black carbon (BC), a major component of soot, is
the most efficient light-absorbing aerosol species in the
JOURNAL OF GEOPHYSICAL RESEARCH, VOL. 109, D21208, doi:10.1029/2004JD004999, 2004
Copyright 2004 by the American Geophysical Union.0148-0227/04/2004JD004999$09.00
D21208 1 of 12
visible spectrum. Climate models typically treat BC as theonly light-absorbing aerosol component. Light absorptionby BC is generally considered to vary weakly withwavelength [e.g., Bergstrom et al., 2002]. Other aerosolcomponents, exhibiting stronger absorption spectral de-pendence, contribute to absorption at shorter light wave-lengths. Laboratory [Lindberg et al., 1993] and remotesensing [Dubovik et al., 2002] measurements have shownthat aerosols over desert regions appreciably absorb lightof blue and shorter wavelengths (i.e., wavelengths lessthan 500 nm). Certain organic compounds also absorb inthe blue and ultraviolet spectral regions [Jacobson, 1998,1999]. Pyrogenic aerosols may absorb because of coloredorganic compounds [Mukai and Ambe, 1986], referred toas ‘‘brown carbon’’’ by Formenti et al. [2003]. It hasbeen shown that smoldering combustion of pine needlesproduces soluble particles (i.e., not BC) that exhibit astrong absorption spectral dependence [Patterson andMcMahon, 1984]. Similarly, low-temperature coal com-bustion has been shown to produce particles with strongabsorption wavelength dependence [Bond, 2001; Bond etal., 1999a].[4] The role of organic carbon (OC) in light absorption has
not been thoroughly investigated. Aerosol light absorption iscommonly measured at a single wavelength where BC isexpected to be the primary absorber of light, for example, at570 nm using the particle soot absorption photometer (PSAP)[Bond et al., 1999b] or at 880 nm using the aethalometer[Hansen et al., 1984]. To the extent that OC absorbs visiblelight, it may be a nonnegligible contributor to direct aerosolradiative forcing. If the light absorption spectral dependenceof aerosols is underestimated in models, the aerosol positiveradiative forcing will be understated [Bond, 2001]. Further-more, aerosol extinction of ultraviolet sunlight may reducetropospheric ozone concentrations via reduced photolysisrates [Jacobson, 1999; Vuilleumier et al., 2001; Martin etal., 2003]. Since the global mean radiative forcing of tropo-spheric ozone is comparable to that of BC [Houghton et al.,2001], aerosol extinction in the ultraviolet spectral regionmay affect climate change in addition to atmospheric photo-chemistry and air quality.[5] In this study, we measured the spectral dependence of,
and the role of OC in, aerosol light absorption. Experimentsincluded two aerosol sources that contribute significantly toatmospheric mass concentrations: motor vehicles, includingdiesel trucks and buses; and biomass combustion, includingburning savanna and wood. Results discussed herein indicatethat these aerosol types exhibited distinct light absorptioncharacteristics related to their composition. Results are pre-sented along with a review of related findings from previousstudies and discussions of uncertainty.
2. Experiments
2.1. Measurement Methods
[6] We used a light transmission method to characterizethe spectral light absorption by aerosol samples collected onquartz fiber filters. Measurements were made using threesimilar instruments. The first two were optical spectrome-ters: Perkin Elmer model Lambda 2, which operatedthroughout the near-ultraviolet to the near-infrared spectralregion at 10 nm resolution with a Tungsten lamp, and Ocean
Optics model S2000, which operated in the visible and near-infrared spectral regions at sub nanometer resolution witha Tungsten Halogen light source. A sample holder wasconstructed to accommodate the measurement of lighttransmission through quartz filter samples in the spectrom-eter. The third instrument was a multiple wavelength lighttransmission instrument (MULTI) that was built atLawrence Berkeley National Laboratory (LBNL). Thisinstrument is similar to that of the laser transmission method(LTM) described by Rosen and Novakov [1983], which isthe predecessor of the widely used aethalometer. TheMULTI was equipped with an array of light emitting diodes(LEDs) to which aerosol samples were sequentially exposed.The intensities of light transmitted through aerosol sampleswere measured with a silicon photodiode (Hamamatsu,model S1226-44BQ) that had a spectral response range of190 to 1000 nm. Initially, six discrete LEDs centered at 370,400, 470, 570, 660, and 850 nm were used; later measure-ments were made with ten LEDs centered at 375, 400, 470,525, 590, 616, 660, 780, 880, and 940 nm. The opticalemission spectra of the LEDs were measured and confirmedwith a spectrometer. Some of the samples included in thisstudy were analyzed using more than one of the opticalinstruments and the results were the same in each case. Thisis indicated in Table 1.[7] Light attenuation (ATN) was calculated from mea-
sured sample light transmission (T): ATN = 100 � ln(1/T).In this study, T was defined as (Is/Is,o) � (Ir,o/Ir), where Isand Is,o are the measured intensities of light transmittedthrough a quartz filter sample prior to and after removal ofcarbonaceous material by heating to 800�C in oxygen, andIr and Ir,o are the intensities of light transmitted through areference quartz filter measured at the same time Is andIs,o, respectively, are measured. Measurements of Is andIs,o were made using the same quartz filter rather thanusing another blank quartz filter to measure Io because(1) light transmission through quartz filters may vary and(2) we wanted to measure aerosol ATN due to carbona-ceous material, but not mineral dust. Light-absorbingmineral dust does not evaporate, decompose, or combustat temperatures <800�C, as does BC and OC, and wasthus not removed during sample heating. The referencefilter was used to correct for possible instrumental vari-ability, such as changes in the brightness of the lightsource or detector response, during the interval of timebetween measurements of Is and Is,o.[8] In the optical transmission method employed here, the
aerosol particles were collected using highly reflectivequartz fiber filters, as is the case in the aethalometer. Usingthis method, it was shown that light attenuation is primarilydue to particle light absorption [Rosen and Novakov, 1983].We note, however, that several caveats accompany deter-mination of the magnitude of aerosol light absorption (e.g.,the absorption coefficient) using transmission methods.First, filter-based transmission measurements exaggerateatmospheric aerosol light absorption because light scatteringby the filter fibers provides the embedded particles multipleopportunities to absorb light. For the aethalometer, whichuses quartz filters, and the particle soot absorption photom-eter (PSAP), which uses glass fiber filters, the magnitude ofthe enhancement reportedly ranges from about 1.8–2.2[Weingartner et al., 2003; Bond et al., 1999b; Bodhaine,
D21208 KIRCHSTETTER ET AL.: SPECTRAL LIGHT ABSORPTION BY AEROSOLS
2 of 12
D21208
1995]. Second, it is often assumed that ATN is proportionalto the light-absorbing aerosol mass collected on the filter.The aethalometer calibration is based on empirical data thatindicated that light attenuation is proportional to BC loading[Gundel et al., 1984], while the PSAP calibration accountsfor a diminishing instrumental response to absorption coef-ficient with increased particle loading [Bond et al., 1999b].Weingartner et al. [2003] reported that the aethalometercalibration should also incorporate this nonlinear loadingeffect when used to measure absorption coefficient. Third,studies have indicated significant instrumental response toparticle light scattering and thus the overestimation ofabsorption coefficient when the magnitude of the absorptionto extinction ratio or the aerosol BC mass fraction is lessthan 10–20% [Lindberg et al., 1999]. This has been shownusing the integrating plate method [Horvath, 1997; Horvathet al., 1997], the PSAP [Bond et al., 1999b], and LTM[Petzold et al., 1997]. In contrast to these results, however,Weingartner et al. [2003] reported no additional enhance-ment, beyond the factor 2 already attributed to light scat-tering by the filter fibers, when measuring the absorptioncoefficient of external mixtures of light-absorbing andscattering aerosols with an aethalometer. For internal mix-tures generated by condensation of organic vapors onto sootparticles, Weingartner et al. reported increased attenuationsignificantly greater than the factor of 2, but did not attributethe enhancement to light scattering by the collected par-
ticles. Rather, the enhancement was attributed to lightscattering by organic vapors that condensed onto the filterfibers. Additional discussion on the use of light transmis-sion techniques to measure aerosol absorption coefficienthas been presented previously [e.g., Foot and Kilsby, 1989;Japar, 1990; Campbell et al., 1995; Clarke et al., 1996].[9] While the abovementioned studies suggest caution
when using the optical transmission method to measure themagnitude of aerosol absorption, there is evidence that thismethod provides an accurate measure of the variation inaerosol absorption with wavelength. Bond [2001] reportedthat the scattering artifact had only a minor impact on themeasured spectral dependence of aerosol light absorption.Weingartner et al. [2003] reported that the aethalometer, theoptical transmission method most similar to that used in thisstudy, accurately measured the wavelength dependence ofaerosol light absorption. Horvath [1997] and Horvath et al.[1997] did not indicate the need for a spectrally dependentcorrection factor for optical transmission measurements.Accordingly, Bergstrom et al. [2002] inferred spectrallydependent aerosol optical properties based on measure-ments made with a light transmission method. In this study,we are mainly concerned with the spectral dependence ofaerosol light absorption, although we also estimate absorp-tion coefficients. The reader may wish to keep in mind theabovementioned caveats where absorption coefficients arepresented below.
Table 1. Calculated Absorption Angstrom Exponents for Various Fine Mode Aerosol Samplesa
Date
AnalyzerbSampleNumber Sample Descriptionc
Absorption Angstrom Exponent, ad
Collected Analyzed Untreatede Extractedf Spectral Region, nm
March 2001 March 2002 Perkin Elmer Spectrometer 1 smoldering redwood needle smoke 2.9 330–1000August 2003 August 2003 MULTI 6l 2 firewood smokeg 2.2 1.1 370–850August 2003 March 2004 MULTI 10l 2 firewood smokeg 2.2 1.3 375–940September 2000 April 2002 Perkin Elmer spectrometer 3 SAFARI 57 (savanna fire) 2.2 1.3 330–1000August 2000 February 2002 Perkin Elmer spectrometer 4 SAFARI 15 (savanna fire) 1.8h 1.2h 330–1100September 2000 September 2002 Ocean Optics spectrometer 5 SAFARI 37 (savanna fire) 1.8 1.3 450–700September 2000 September 2002 Ocean Optics spectrometer 6 SAFARI 43 (haze, 3170 m) 1.3 1.2 450–950September 2000 April 2002 Perkin Elmer spectrometer 7 SAFARI 45 (haze, 2370 m) 1.2 1.0 330–1000June 2001 February 2002 Perkin Elmer spectrometer 8 LBNL, Berkeley, California 1.2 1.1 390–1000July 2003 July 2003 MULTI 6l 9 LBNL, Berkeley, California 1.1 370–850June 2003 July 2003 MULTI 6l 10 LBNL, Berkeley, California 1.0 370–850June 1999 April 2002 Perkin Elmer spectrometer 11 LBNL, Berkeley, California 0.9 0.9 330–1000May 2001 September 2002 Ocean Optics spectrometer 12 LBNL, Berkeley, Californiai,j 0.9 0.9 450–950May 2001 February 2002 Perkin Elmer spectrometer 13 LBNL, Berkeley, Californiaj 0.9h 0.8h 330–1000May 2001 January 2004 MULTI 10l 14 LBNL, Berkeley, California 0.9 375–940June 2003 July 2003 MULTI 6l 15 LBNL, Berkeley, California 0.8 370–850July 2003 August 2003 MULTI 6l 16 LBNL, Berkeley, California 0.8 370–850October 2003 October 2003 MULTI 6l 17 Adjacent to roadwayg 0.9 370–850October 2003 February 2004 MULTI 10l 17 Adjacent to roadwayg 0.9 375–940February 1983 February 2002 Perkin Elmer spectrometer 18 Caldecott tunnel 0.9h 0.7h 370–1000February 1983 April 2002 Perkin Elmer spectrometer 19 Caldecott tunnelk 0.8 0.6 390–1000February 1983 September 2002 Ocean Optics spectrometer 19 Caldecott tunnelk 0.9 0.7 450–950February 1983 August 2003 MULTI 6l 19 Caldecott tunnelk 0.8 370–850February 1983 February 2002 Perkin Elmer Spectrometer 20 Caldecott tunnel 0.6h 0.7h 390–1000
aSamples were of fine mode (i.e., d < 2 mm) aerosols except for the smoldering redwood needle sample, for which there was no size cut.bSee text for a description of the analyzers. MULTI is multiple wavelength light transmission instrument.cSampling locations are described in the text. SAFARI is Southern African Regional Science Initiative; LBNL is Lawrence Berkeley National
Laboratory.dAbsorption Angstrom exponents were calculated by linear regression of ln(ATN) versus ln(l) over the specified wavelength region.eSamples were not extracted with acetone.fSamples were extracted with acetone.gSamples 2 and 17 were analyzed using both the six and ten wavelength version of the MULTI.hSamples were preheated to 110�C in air prior to analysis to remove organic vapors that typically adsorb to quartz filters during sample collection.iSample was collected downstream of a diffusion denuder that scrubbed the sample air of organic vapors.jThese two urban air samples (samples 12 and 13) were concurrently collected via the same sampling stack.kSample 19 was analyzed using both spectrometers and the MULTI.
D21208 KIRCHSTETTER ET AL.: SPECTRAL LIGHT ABSORPTION BY AEROSOLS
3 of 12
D21208
[10] To determine the role of OC on measurements ofabsorption spectral dependence, two portions of each quartzfilter sample were analyzed: one portion was analyzedwithout any alteration of the collected particles, whereasthe second portion was analyzed after it was treated withacetone to extract soluble OC from the particles. Theextraction was performed by soaking the sample in 50 mLof acetone for 30 min. Care was taken not to disturb thesample to minimize mechanical removal of the insolubleparticles. Following acetone treatment, filter samples weredried under a lamp to promote the evaporation of theacetone from the filters. The mass of carbon extracted froma sample was determined by comparing the carbon contentsof the untreated and treated portions of the sample. Thecarbon content of samples was measured using the evolvedgas analysis (EGA) method [Novakov, 1981], which hasbeen described recently by Kirchstetter et al. [2001]. InEGA, the filter sample is heated at 40�C min�1 from roomtemperature to 800�C, and the carbonaceous material thatevolves from the sample is fully oxidized to carbon dioxidein pure oxygen over magnesium dioxide powder maintainedat 800�C. The mole fraction of carbon dioxide is measuredwith a nondispersive infrared analyzer. A plot of evolvedcarbon versus temperature, called the carbon thermogram,illustrates carbonaceous materials of different thermal prop-erties. The thermogram is integrated to determine the massof carbon (mg C) that was in the sample. The carbon massloading of a sample (mg C cm�2) is determined by dividingthe measured carbon mass by the area (cm2) of the filtersample analyzed. In this study, filter samples of 1.12 and0.58 cm2 in area were prepared using circular filter cutters,the areas of which were measured with an uncertainty ofabout ±1% using stainless steel calipers.
2.2. Sample Description
[11] Here we present data for several recent andarchived samples collected in different environments:(1) immediately adjacent to a steeply graded roadway,in Berkeley, California, carrying light-duty gasoline andheavy-duty diesel vehicles traveling up and downhill; (2) atLBNL, downwind of Berkeley, at a height of approxi-mately 10 m above ground, about 25 m from the roadwaymentioned above; (3) in the Caldecott roadway tunnel,located in the San Francisco Bay Area, which carries light-duty gasoline and heavy-duty diesel vehicles; (4) aloft insouthern Africa during SAFARI 2000; (5) in the plume ofsmoke from outdoor burning of firewood; and (6) inundiluted smoke from redwood needles smoldered on aheating element. Dates of sample collection and analysisare shown in Table 1.[12] Aerosol sampling adjacent to the roadway was con-
ducted between 0800 to 1800 h local time when dieselshuttle buses passed by regularly. We expected that samplescollected at LBNL, downwind of Berkeley, were stronglyinfluenced by the nearby roadway vehicles, but they mayalso have been influenced by other emission sources in thecity because they were collected at 10 m above ground andfor long periods of time (e.g., 12 to 24 hours) includingevening and early morning hours. Samples collected in theroadway tunnel were dominated by motor vehicle emis-sions. Further, a recent apportionment of pollutants emittedfrom vehicles in the Caldecott tunnel indicated that heavy-
duty diesel vehicles dominate BC and other particulatematter emissions, even when these vehicles comprise only5% of total vehicles [Kirchstetter et al., 1999]. Thus wesurmise that samples collected in the tunnel, adjacent to theroadway, and to a large extent at LBNL were influencedprimarily by motor vehicles, and, in particular, by dieselvehicles.[13] SAFARI 2000 samples were collected aboard the
University of Washington’s Convair-580 research aircraftduring the dry, biomass burning season in southern Africa[Sinha et al., 2003; Kirchstetter et al., 2003]. SAFARIsamples collected in plumes of savanna fires and in layersof haze aloft are included in this study. Firewood burningincluded smoldering and flaming conditions, whereas red-wood needle combustion was characterized by smolderingexclusively.
3. Results
3.1. Spectral Dependence
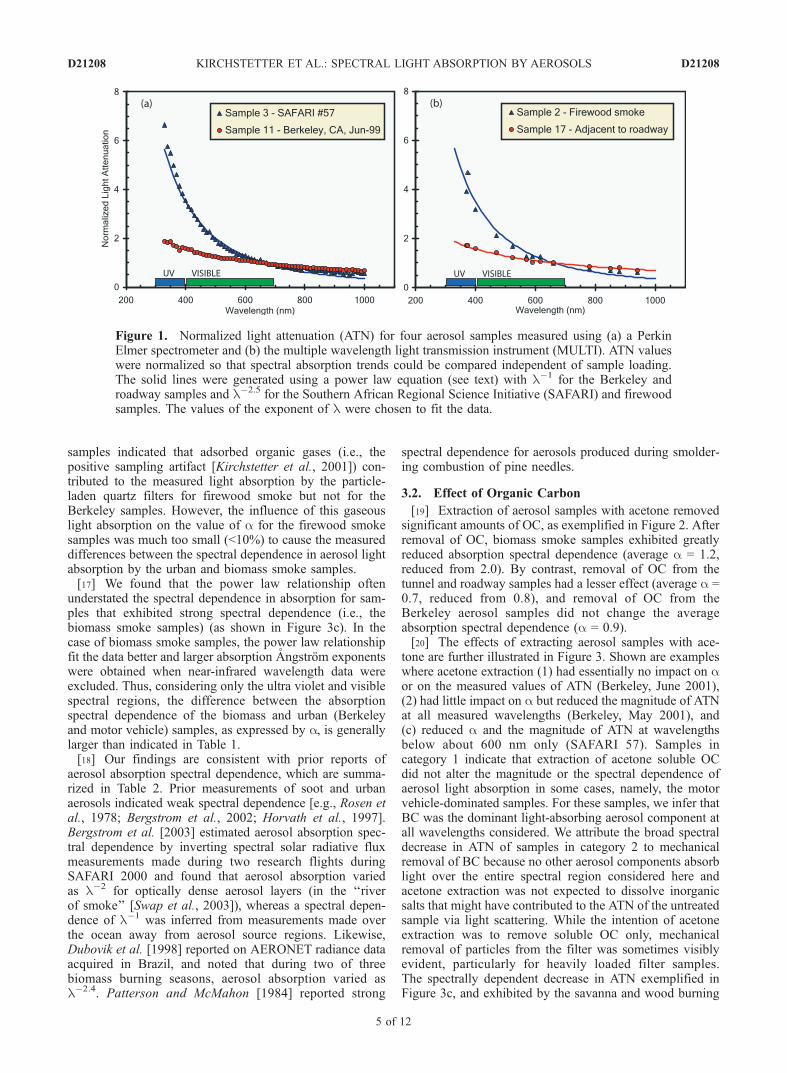
[14] The variation of aerosol light absorption with wave-length extending from the near-ultraviolet to the near-infrared is compared for several samples in Figure 1. Lightabsorption by aerosols collected in biomass burningsmoke (savanna and wood) varied more strongly withwavelength than aerosols dominated by motor vehicleemissions (Berkeley and roadway). The stronger spectraldependence was the result of enhanced light absorption atwavelengths shorter than 600 nm. Following the approachof previous investigators, the dependence of aerosol lightabsorption on wavelength was parameterized using a powerlaw relationship: s = K � l�a, where s is the spectrallydependent mass absorption efficiency, K a constant, l thelight wavelength, and a the absorption Angstrom exponent.(Note that ATN is proportional to s.) Thus the value of ais a measure of the strength of the spectral variation inaerosol light absorption. We show in Figure 1 that a = 2.5approximates the strong spectral dependence of the biomassburning aerosols and a = 1.0 describes well the weakspectral dependence of the motor vehicle aerosols.[15] The spectral dependence of light absorption for all
samples was determined by performing a regression ofln(ATN) against ln(l). Resulting values of a are given inTable 1. On average, a = 2 for biomass smoke aerosolsamples, excluding the sample of smoldering redwoodneedles which exhibited much stronger absorption spectraldependence. The samples produced from smoldering red-wood needles exhibited the strongest spectral dependence,even after acetone extraction. Burning savanna samples hadstronger spectral dependence (average a = 1.9) than hazesamples aloft (average a = 1.2) collected during SAFARI2000. In contrast to the biomass smoke samples, a averaged0.9 and 0.8 for the Berkeley and motor vehicle (roadwayand tunnel) samples, respectively. As illustrated for thesamples included in Figure 1, these absorption Angstromexponents indicate that light absorption by biomass smokeaerosols is characterized by significantly stronger wave-length dependence than urban aerosols influenced by motorvehicles.[16] Many of the samples included in this study were
collected with two quartz filters in series. Analysis ofbackup quartz filters of the firewood smoke and Berkeley
D21208 KIRCHSTETTER ET AL.: SPECTRAL LIGHT ABSORPTION BY AEROSOLS
4 of 12
D21208
samples indicated that adsorbed organic gases (i.e., thepositive sampling artifact [Kirchstetter et al., 2001]) con-tributed to the measured light absorption by the particle-laden quartz filters for firewood smoke but not for theBerkeley samples. However, the influence of this gaseouslight absorption on the value of a for the firewood smokesamples was much too small (<10%) to cause the measureddifferences between the spectral dependence in aerosol lightabsorption by the urban and biomass smoke samples.[17] We found that the power law relationship often
understated the spectral dependence in absorption for sam-ples that exhibited strong spectral dependence (i.e., thebiomass smoke samples) (as shown in Figure 3c). In thecase of biomass smoke samples, the power law relationshipfit the data better and larger absorption Angstrom exponentswere obtained when near-infrared wavelength data wereexcluded. Thus, considering only the ultra violet and visiblespectral regions, the difference between the absorptionspectral dependence of the biomass and urban (Berkeleyand motor vehicle) samples, as expressed by a, is generallylarger than indicated in Table 1.[18] Our findings are consistent with prior reports of
aerosol absorption spectral dependence, which are summa-rized in Table 2. Prior measurements of soot and urbanaerosols indicated weak spectral dependence [e.g., Rosen etal., 1978; Bergstrom et al., 2002; Horvath et al., 1997].Bergstrom et al. [2003] estimated aerosol absorption spec-tral dependence by inverting spectral solar radiative fluxmeasurements made during two research flights duringSAFARI 2000 and found that aerosol absorption variedas l�2 for optically dense aerosol layers (in the ‘‘riverof smoke’’ [Swap et al., 2003]), whereas a spectral depen-dence of l�1 was inferred from measurements made overthe ocean away from aerosol source regions. Likewise,Dubovik et al. [1998] reported on AERONET radiance dataacquired in Brazil, and noted that during two of threebiomass burning seasons, aerosol absorption varied asl�2.4. Patterson and McMahon [1984] reported strong
spectral dependence for aerosols produced during smolder-ing combustion of pine needles.
3.2. Effect of Organic Carbon
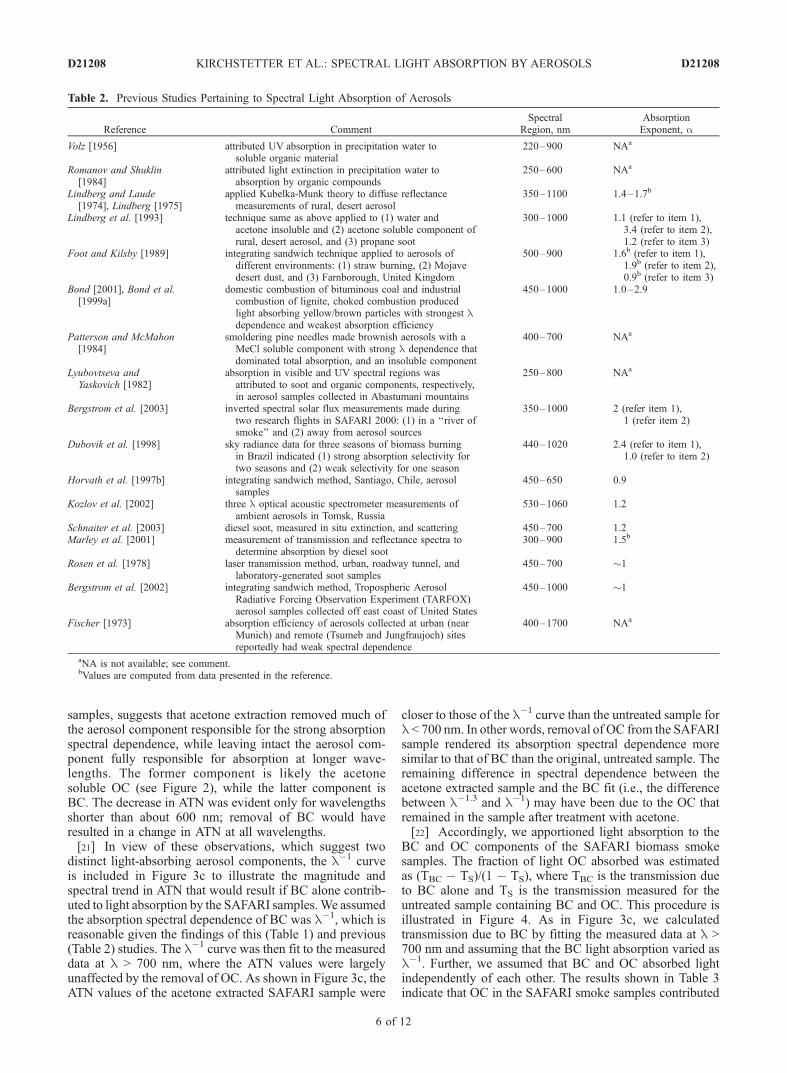
[19] Extraction of aerosol samples with acetone removedsignificant amounts of OC, as exemplified in Figure 2. Afterremoval of OC, biomass smoke samples exhibited greatlyreduced absorption spectral dependence (average a = 1.2,reduced from 2.0). By contrast, removal of OC from thetunnel and roadway samples had a lesser effect (average a =0.7, reduced from 0.8), and removal of OC from theBerkeley aerosol samples did not change the averageabsorption spectral dependence (a = 0.9).[20] The effects of extracting aerosol samples with ace-
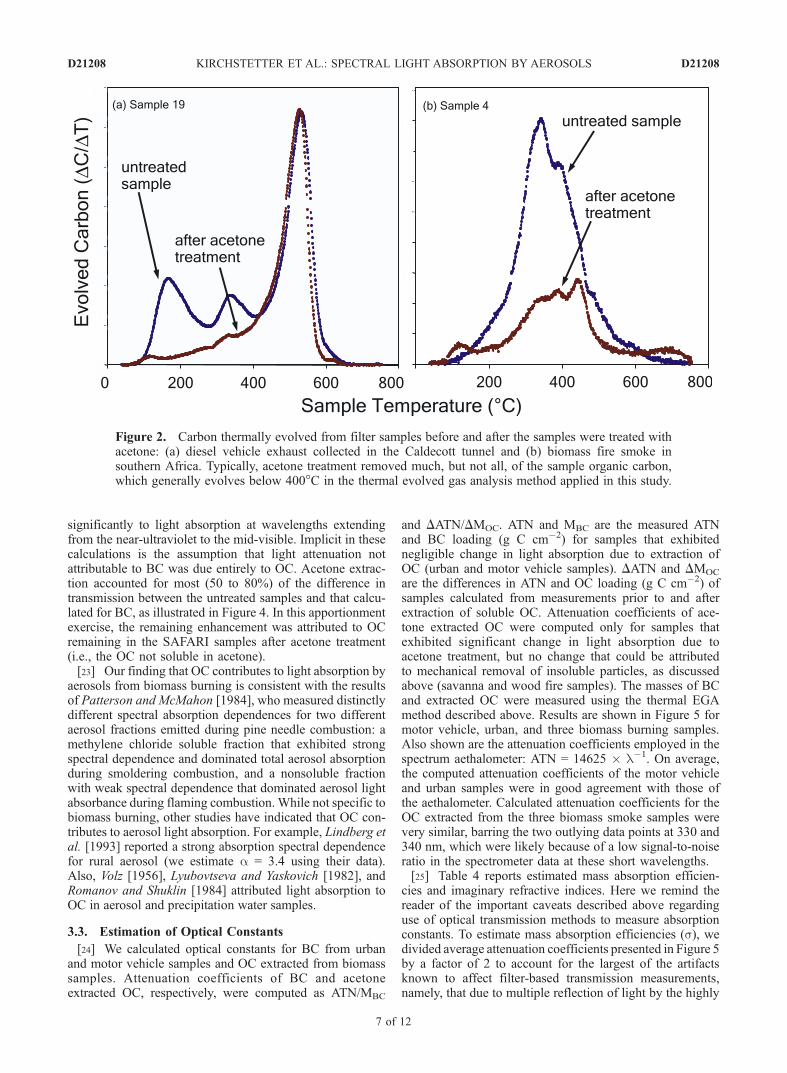
tone are further illustrated in Figure 3. Shown are exampleswhere acetone extraction (1) had essentially no impact on aor on the measured values of ATN (Berkeley, June 2001),(2) had little impact on a but reduced the magnitude of ATNat all measured wavelengths (Berkeley, May 2001), and(c) reduced a and the magnitude of ATN at wavelengthsbelow about 600 nm only (SAFARI 57). Samples incategory 1 indicate that extraction of acetone soluble OCdid not alter the magnitude or the spectral dependence ofaerosol light absorption in some cases, namely, the motorvehicle-dominated samples. For these samples, we infer thatBC was the dominant light-absorbing aerosol component atall wavelengths considered. We attribute the broad spectraldecrease in ATN of samples in category 2 to mechanicalremoval of BC because no other aerosol components absorblight over the entire spectral region considered here andacetone extraction was not expected to dissolve inorganicsalts that might have contributed to the ATN of the untreatedsample via light scattering. While the intention of acetoneextraction was to remove soluble OC only, mechanicalremoval of particles from the filter was sometimes visiblyevident, particularly for heavily loaded filter samples.The spectrally dependent decrease in ATN exemplified inFigure 3c, and exhibited by the savanna and wood burning
Figure 1. Normalized light attenuation (ATN) for four aerosol samples measured using (a) a PerkinElmer spectrometer and (b) the multiple wavelength light transmission instrument (MULTI). ATN valueswere normalized so that spectral absorption trends could be compared independent of sample loading.The solid lines were generated using a power law equation (see text) with l�1 for the Berkeley androadway samples and l�2.5 for the Southern African Regional Science Initiative (SAFARI) and firewoodsamples. The values of the exponent of l were chosen to fit the data.
D21208 KIRCHSTETTER ET AL.: SPECTRAL LIGHT ABSORPTION BY AEROSOLS
5 of 12
D21208
samples, suggests that acetone extraction removed much ofthe aerosol component responsible for the strong absorptionspectral dependence, while leaving intact the aerosol com-ponent fully responsible for absorption at longer wave-lengths. The former component is likely the acetonesoluble OC (see Figure 2), while the latter component isBC. The decrease in ATN was evident only for wavelengthsshorter than about 600 nm; removal of BC would haveresulted in a change in ATN at all wavelengths.[21] In view of these observations, which suggest two
distinct light-absorbing aerosol components, the l�1 curveis included in Figure 3c to illustrate the magnitude andspectral trend in ATN that would result if BC alone contrib-uted to light absorption by the SAFARI samples.We assumedthe absorption spectral dependence of BC was l�1, which isreasonable given the findings of this (Table 1) and previous(Table 2) studies. The l�1 curve was then fit to the measureddata at l > 700 nm, where the ATN values were largelyunaffected by the removal of OC. As shown in Figure 3c, theATN values of the acetone extracted SAFARI sample were
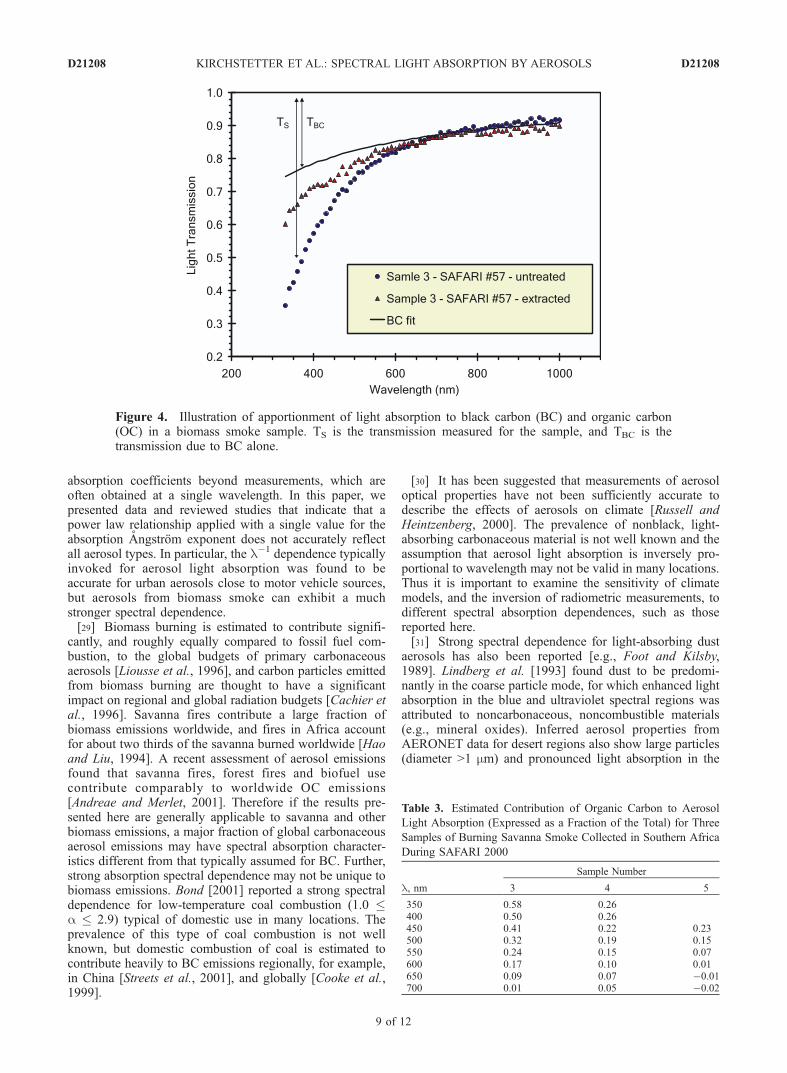
closer to those of the l�1 curve than the untreated sample forl < 700 nm. In other words, removal of OC from the SAFARIsample rendered its absorption spectral dependence moresimilar to that of BC than the original, untreated sample. Theremaining difference in spectral dependence between theacetone extracted sample and the BC fit (i.e., the differencebetween l�1.3 and l�1) may have been due to the OC thatremained in the sample after treatment with acetone.[22] Accordingly, we apportioned light absorption to the
BC and OC components of the SAFARI biomass smokesamples. The fraction of light OC absorbed was estimatedas (TBC � TS)/(1 � TS), where TBC is the transmission dueto BC alone and TS is the transmission measured for theuntreated sample containing BC and OC. This procedure isillustrated in Figure 4. As in Figure 3c, we calculatedtransmission due to BC by fitting the measured data at l >700 nm and assuming that the BC light absorption varied asl�1. Further, we assumed that BC and OC absorbed lightindependently of each other. The results shown in Table 3indicate that OC in the SAFARI smoke samples contributed
Table 2. Previous Studies Pertaining to Spectral Light Absorption of Aerosols
Reference CommentSpectral
Region, nmAbsorptionExponent, a
Volz [1956] attributed UV absorption in precipitation water tosoluble organic material
220–900 NAa
Romanov and Shuklin[1984]
attributed light extinction in precipitation water toabsorption by organic compounds
250–600 NAa
Lindberg and Laude[1974], Lindberg [1975]
applied Kubelka-Munk theory to diffuse reflectancemeasurements of rural, desert aerosol
350–1100 1.4–1.7b
Lindberg et al. [1993] technique same as above applied to (1) water andacetone insoluble and (2) acetone soluble component ofrural, desert aerosol, and (3) propane soot
300–1000 1.1 (refer to item 1),3.4 (refer to item 2),1.2 (refer to item 3)
Foot and Kilsby [1989] integrating sandwich technique applied to aerosols ofdifferent environments: (1) straw burning, (2) Mojavedesert dust, and (3) Farnborough, United Kingdom
500–900 1.6b (refer to item 1),1.9b (refer to item 2),0.9b (refer to item 3)
Bond [2001], Bond et al.[1999a]
domestic combustion of bituminous coal and industrialcombustion of lignite, choked combustion producedlight absorbing yellow/brown particles with strongest ldependence and weakest absorption efficiency
450–1000 1.0–2.9
Patterson and McMahon[1984]
smoldering pine needles made brownish aerosols with aMeCl soluble component with strong l dependence thatdominated total absorption, and an insoluble component
400–700 NAa
Lyubovtseva andYaskovich [1982]
absorption in visible and UV spectral regions wasattributed to soot and organic components, respectively,in aerosol samples collected in Abastumani mountains
250–800 NAa
Bergstrom et al. [2003] inverted spectral solar flux measurements made duringtwo research flights in SAFARI 2000: (1) in a ‘‘river ofsmoke’’ and (2) away from aerosol sources
350–1000 2 (refer item 1),1 (refer item 2)
Dubovik et al. [1998] sky radiance data for three seasons of biomass burningin Brazil indicated (1) strong absorption selectivity fortwo seasons and (2) weak selectivity for one season
440–1020 2.4 (refer to item 1),1.0 (refer to item 2)
Horvath et al. [1997b] integrating sandwich method, Santiago, Chile, aerosolsamples
450–650 0.9
Kozlov et al. [2002] three l optical acoustic spectrometer measurements ofambient aerosols in Tomsk, Russia
530–1060 1.2
Schnaiter et al. [2003] diesel soot, measured in situ extinction, and scattering 450–700 1.2Marley et al. [2001] measurement of transmission and reflectance spectra to
determine absorption by diesel soot300–900 1.5b
Rosen et al. [1978] laser transmission method, urban, roadway tunnel, andlaboratory-generated soot samples
450–700 �1
Bergstrom et al. [2002] integrating sandwich method, Tropospheric AerosolRadiative Forcing Observation Experiment (TARFOX)aerosol samples collected off east coast of United States
450–1000 �1
Fischer [1973] absorption efficiency of aerosols collected at urban (nearMunich) and remote (Tsumeb and Jungfraujoch) sitesreportedly had weak spectral dependence
400–1700 NAa
aNA is not available; see comment.bValues are computed from data presented in the reference.
D21208 KIRCHSTETTER ET AL.: SPECTRAL LIGHT ABSORPTION BY AEROSOLS
6 of 12
D21208
significantly to light absorption at wavelengths extendingfrom the near-ultraviolet to the mid-visible. Implicit in thesecalculations is the assumption that light attenuation notattributable to BC was due entirely to OC. Acetone extrac-tion accounted for most (50 to 80%) of the difference intransmission between the untreated samples and that calcu-lated for BC, as illustrated in Figure 4. In this apportionmentexercise, the remaining enhancement was attributed to OCremaining in the SAFARI samples after acetone treatment(i.e., the OC not soluble in acetone).[23] Our finding that OC contributes to light absorption by
aerosols from biomass burning is consistent with the resultsof Patterson and McMahon [1984], who measured distinctlydifferent spectral absorption dependences for two differentaerosol fractions emitted during pine needle combustion: amethylene chloride soluble fraction that exhibited strongspectral dependence and dominated total aerosol absorptionduring smoldering combustion, and a nonsoluble fractionwith weak spectral dependence that dominated aerosol lightabsorbance during flaming combustion. While not specific tobiomass burning, other studies have indicated that OC con-tributes to aerosol light absorption. For example, Lindberg etal. [1993] reported a strong absorption spectral dependencefor rural aerosol (we estimate a = 3.4 using their data).Also, Volz [1956], Lyubovtseva and Yaskovich [1982], andRomanov and Shuklin [1984] attributed light absorption toOC in aerosol and precipitation water samples.
3.3. Estimation of Optical Constants
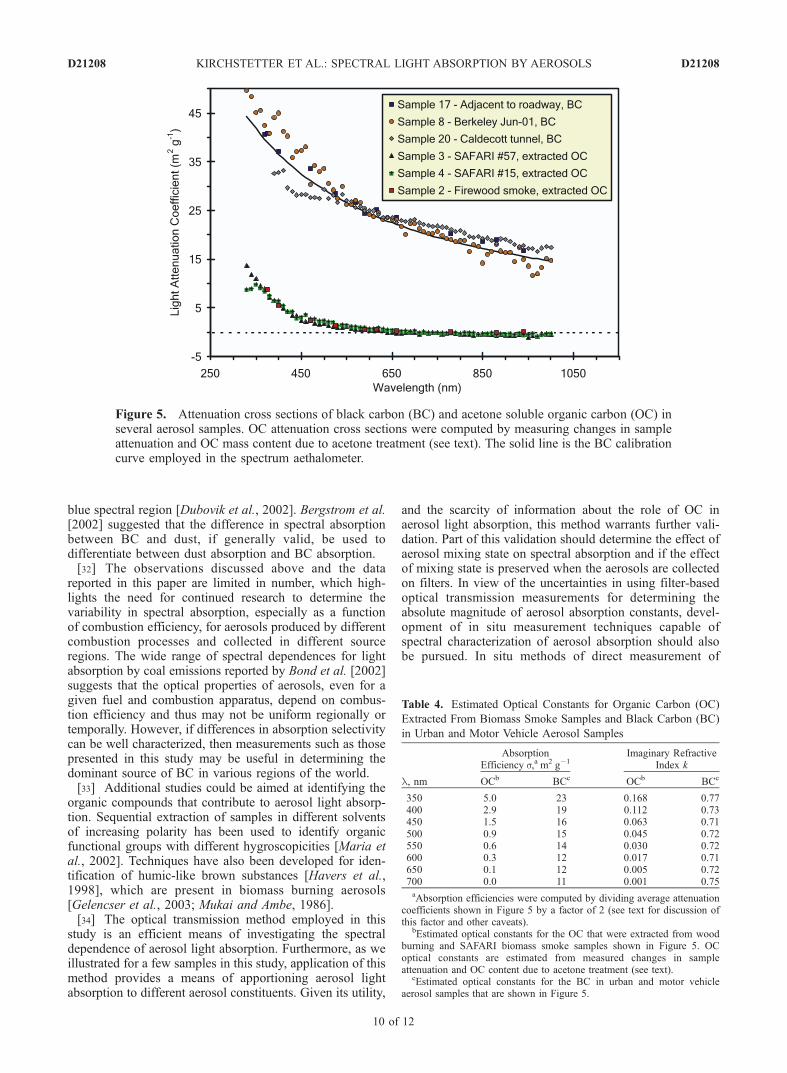
[24] We calculated optical constants for BC from urbanand motor vehicle samples and OC extracted from biomasssamples. Attenuation coefficients of BC and acetoneextracted OC, respectively, were computed as ATN/MBC
and DATN/DMOC. ATN and MBC are the measured ATNand BC loading (g C cm�2) for samples that exhibitednegligible change in light absorption due to extraction ofOC (urban and motor vehicle samples). DATN and DMOC
are the differences in ATN and OC loading (g C cm�2) ofsamples calculated from measurements prior to and afterextraction of soluble OC. Attenuation coefficients of ace-tone extracted OC were computed only for samples thatexhibited significant change in light absorption due toacetone treatment, but no change that could be attributedto mechanical removal of insoluble particles, as discussedabove (savanna and wood fire samples). The masses of BCand extracted OC were measured using the thermal EGAmethod described above. Results are shown in Figure 5 formotor vehicle, urban, and three biomass burning samples.Also shown are the attenuation coefficients employed in thespectrum aethalometer: ATN = 14625 � l�1. On average,the computed attenuation coefficients of the motor vehicleand urban samples were in good agreement with those ofthe aethalometer. Calculated attenuation coefficients for theOC extracted from the three biomass smoke samples werevery similar, barring the two outlying data points at 330 and340 nm, which were likely because of a low signal-to-noiseratio in the spectrometer data at these short wavelengths.[25] Table 4 reports estimated mass absorption efficien-
cies and imaginary refractive indices. Here we remind thereader of the important caveats described above regardinguse of optical transmission methods to measure absorptionconstants. To estimate mass absorption efficiencies (s), wedivided average attenuation coefficients presented in Figure 5by a factor of 2 to account for the largest of the artifactsknown to affect filter-based transmission measurements,namely, that due to multiple reflection of light by the highly
Figure 2. Carbon thermally evolved from filter samples before and after the samples were treated withacetone: (a) diesel vehicle exhaust collected in the Caldecott tunnel and (b) biomass fire smoke insouthern Africa. Typically, acetone treatment removed much, but not all, of the sample organic carbon,which generally evolves below 400�C in the thermal evolved gas analysis method applied in this study.
D21208 KIRCHSTETTER ET AL.: SPECTRAL LIGHT ABSORPTION BY AEROSOLS
7 of 12
D21208
reflective quartz substrate. Imaginary indices of refraction(k) were calculated from rsl/4p, where r is the particledensity. Application of this equation has been discussedelsewhere [Gosse et al., 1997; Bohren and Huffman, 1998;Jennings et al., 1979]. We apply it here since indices ofrefraction for OC are very scarce, if not nonexistent. Wechoose r = 1.2 g cm�3 for both OC and BC, consistent withreported values [Lohmann et al., 1999; Turpin and Lim,2001]. The ratio sOC/sBC decreased from 22% at 350 nm, to9% at 450 nm, to 1% at 650 nm. Estimated values of kBCwere largely insensitive to wavelength over the spectralregion considered here, while kOC increased with decreasingwavelength. Whereas the calculated absorption constantsfor OC are substantially smaller than those for BC, we notethat OC may contribute significantly to light absorption byaerosols characterized by a low BC/OC ratio, such as thebiomass smoke samples considered here (10 to 20%) and inbiomass smoke in general [Andreae and Merlet, 2001].[26] It has been shown that the spectral mass absorption
efficiency for small particles is approximately inverselyproportional to the light wavelength (i.e., a � 1) providedthe refractive index is approximately wavelength indepen-dent [Bohren and Huffman, 1998; Dalzell and Sarofim,1969; van de Hulst, 1957]. Several authors have explainedstrong absorption selectivity by the presence of a spectrallydependent imaginary part of the refractive index [e.g.,Dubovik et al., 1998; Bond, 2001]. Our findings suggestthat the spectrally dependent aerosol imaginary refractiveindex is explained by a relatively constant imaginaryrefractive index for BC and a spectrally dependent imagi-nary refractive index for OC. Likewise, Bond et al. [1999a]suggested that light-absorbing material other than graphiticcarbon is present in lignite burning emissions, and that therefractive index of this component has a wavelength depen-dence stronger than that of BC.[27] Optical constants reported in Table 4 for BC are
within the range of values previously reported, although wenote that previously reported values exhibit wide variabilitythat has been attributed to combustion source and aerosolaging processes [see, e.g., Marley et al., 2001, Table 4].Possible errors in the absorption constants presented inTable 4 due to light scattering by particles could not bedirectly assessed because this study made use of archivedsamples and measurements of scattering coefficient werenot available. B. Magi (personal communication, 2004)found that correcting PSAP measurements for the particlescattering artifact reduced absorption coefficients measuredaloft during SAFARI 2000 by 6 to 14%. In the absence oflight scattering measurements, Bond et al. [1999a] estimatedthat absorption coefficients of aerosols from coal burning,measured with two light transmission instruments, werebiased to high values by about 1% for particles collectedon glass fiber filters and 4% for measurements with Nucle-pore filters. We note that the optical constants reported inTable 4 may have similar biases.
4. Discussion
[28] Knowledge of the spectral dependence of aerosollight absorption is important for accurate representation ofaerosols in radiative transfer models. The spectral depen-dence is required for interpolation and extrapolation of
Figure 3. The effects of acetone treatment on samplelight attenuation (ATN): (a) sample 8, Berkeley, June 2001,(b) sample 13, Berkeley, May 2001, and (c) sample 3,SAFARI 57. Circles (blue) indicate untreated samples andtriangles (red) indicate acetone treated samples. Solid linesand indicated Angstrom exponents were determined bystatistical regression to fit the data with a power lawequation. In the bottom panel of the figure, a l�1 trend lineis also shown (see text).
D21208 KIRCHSTETTER ET AL.: SPECTRAL LIGHT ABSORPTION BY AEROSOLS
8 of 12
D21208
absorption coefficients beyond measurements, which areoften obtained at a single wavelength. In this paper, wepresented data and reviewed studies that indicate that apower law relationship applied with a single value for theabsorption Angstrom exponent does not accurately reflectall aerosol types. In particular, the l�1 dependence typicallyinvoked for aerosol light absorption was found to beaccurate for urban aerosols close to motor vehicle sources,but aerosols from biomass smoke can exhibit a muchstronger spectral dependence.[29] Biomass burning is estimated to contribute signifi-
cantly, and roughly equally compared to fossil fuel com-bustion, to the global budgets of primary carbonaceousaerosols [Liousse et al., 1996], and carbon particles emittedfrom biomass burning are thought to have a significantimpact on regional and global radiation budgets [Cachier etal., 1996]. Savanna fires contribute a large fraction ofbiomass emissions worldwide, and fires in Africa accountfor about two thirds of the savanna burned worldwide [Haoand Liu, 1994]. A recent assessment of aerosol emissionsfound that savanna fires, forest fires and biofuel usecontribute comparably to worldwide OC emissions[Andreae and Merlet, 2001]. Therefore if the results pre-sented here are generally applicable to savanna and otherbiomass emissions, a major fraction of global carbonaceousaerosol emissions may have spectral absorption character-istics different from that typically assumed for BC. Further,strong absorption spectral dependence may not be unique tobiomass emissions. Bond [2001] reported a strong spectraldependence for low-temperature coal combustion (1.0 �a � 2.9) typical of domestic use in many locations. Theprevalence of this type of coal combustion is not wellknown, but domestic combustion of coal is estimated tocontribute heavily to BC emissions regionally, for example,in China [Streets et al., 2001], and globally [Cooke et al.,1999].
[30] It has been suggested that measurements of aerosoloptical properties have not been sufficiently accurate todescribe the effects of aerosols on climate [Russell andHeintzenberg, 2000]. The prevalence of nonblack, light-absorbing carbonaceous material is not well known and theassumption that aerosol light absorption is inversely pro-portional to wavelength may not be valid in many locations.Thus it is important to examine the sensitivity of climatemodels, and the inversion of radiometric measurements, todifferent spectral absorption dependences, such as thosereported here.[31] Strong spectral dependence for light-absorbing dust
aerosols has also been reported [e.g., Foot and Kilsby,1989]. Lindberg et al. [1993] found dust to be predomi-nantly in the coarse particle mode, for which enhanced lightabsorption in the blue and ultraviolet spectral regions wasattributed to noncarbonaceous, noncombustible materials(e.g., mineral oxides). Inferred aerosol properties fromAERONET data for desert regions also show large particles(diameter >1 mm) and pronounced light absorption in the
Figure 4. Illustration of apportionment of light absorption to black carbon (BC) and organic carbon(OC) in a biomass smoke sample. TS is the transmission measured for the sample, and TBC is thetransmission due to BC alone.
Table 3. Estimated Contribution of Organic Carbon to Aerosol
Light Absorption (Expressed as a Fraction of the Total) for Three
Samples of Burning Savanna Smoke Collected in Southern Africa
During SAFARI 2000
l, nm
Sample Number
3 4 5
350 0.58 0.26400 0.50 0.26450 0.41 0.22 0.23500 0.32 0.19 0.15550 0.24 0.15 0.07600 0.17 0.10 0.01650 0.09 0.07 �0.01700 0.01 0.05 �0.02
D21208 KIRCHSTETTER ET AL.: SPECTRAL LIGHT ABSORPTION BY AEROSOLS
9 of 12
D21208
blue spectral region [Dubovik et al., 2002]. Bergstrom et al.[2002] suggested that the difference in spectral absorptionbetween BC and dust, if generally valid, be used todifferentiate between dust absorption and BC absorption.[32] The observations discussed above and the data
reported in this paper are limited in number, which high-lights the need for continued research to determine thevariability in spectral absorption, especially as a functionof combustion efficiency, for aerosols produced by differentcombustion processes and collected in different sourceregions. The wide range of spectral dependences for lightabsorption by coal emissions reported by Bond et al. [2002]suggests that the optical properties of aerosols, even for agiven fuel and combustion apparatus, depend on combus-tion efficiency and thus may not be uniform regionally ortemporally. However, if differences in absorption selectivitycan be well characterized, then measurements such as thosepresented in this study may be useful in determining thedominant source of BC in various regions of the world.[33] Additional studies could be aimed at identifying the
organic compounds that contribute to aerosol light absorp-tion. Sequential extraction of samples in different solventsof increasing polarity has been used to identify organicfunctional groups with different hygroscopicities [Maria etal., 2002]. Techniques have also been developed for iden-tification of humic-like brown substances [Havers et al.,1998], which are present in biomass burning aerosols[Gelencser et al., 2003; Mukai and Ambe, 1986].[34] The optical transmission method employed in this
study is an efficient means of investigating the spectraldependence of aerosol light absorption. Furthermore, as weillustrated for a few samples in this study, application of thismethod provides a means of apportioning aerosol lightabsorption to different aerosol constituents. Given its utility,
and the scarcity of information about the role of OC inaerosol light absorption, this method warrants further vali-dation. Part of this validation should determine the effect ofaerosol mixing state on spectral absorption and if the effectof mixing state is preserved when the aerosols are collectedon filters. In view of the uncertainties in using filter-basedoptical transmission measurements for determining theabsolute magnitude of aerosol absorption constants, devel-opment of in situ measurement techniques capable ofspectral characterization of aerosol absorption should alsobe pursued. In situ methods of direct measurement of
Figure 5. Attenuation cross sections of black carbon (BC) and acetone soluble organic carbon (OC) inseveral aerosol samples. OC attenuation cross sections were computed by measuring changes in sampleattenuation and OC mass content due to acetone treatment (see text). The solid line is the BC calibrationcurve employed in the spectrum aethalometer.
Table 4. Estimated Optical Constants for Organic Carbon (OC)
Extracted From Biomass Smoke Samples and Black Carbon (BC)
in Urban and Motor Vehicle Aerosol Samples
l, nm
AbsorptionEfficiency s,a m2 g�1
Imaginary RefractiveIndex k
OCb BCc OCb BCc
350 5.0 23 0.168 0.77400 2.9 19 0.112 0.73450 1.5 16 0.063 0.71500 0.9 15 0.045 0.72550 0.6 14 0.030 0.72600 0.3 12 0.017 0.71650 0.1 12 0.005 0.72700 0.0 11 0.001 0.75aAbsorption efficiencies were computed by dividing average attenuation
coefficients shown in Figure 5 by a factor of 2 (see text for discussion ofthis factor and other caveats).
bEstimated optical constants for the OC that were extracted from woodburning and SAFARI biomass smoke samples shown in Figure 5. OCoptical constants are estimated from measured changes in sampleattenuation and OC content due to acetone treatment (see text).
cEstimated optical constants for the BC in urban and motor vehicleaerosol samples that are shown in Figure 5.
D21208 KIRCHSTETTER ET AL.: SPECTRAL LIGHT ABSORPTION BY AEROSOLS
10 of 12
D21208
aerosol light absorption (e.g., photoacoustic methods), orindirect measurement by difference of extinction and scat-tering (e.g., cavity ring down techniques), may hold promisein this regard.
5. Conclusions
[35] The results of this investigation show that low-temperature combustion processes, including biomass burn-ing, produce light-absorbing aerosols that exhibit muchstronger spectral dependence than do high-temperaturecombustion processes, such as diesel combustion. Diver-gence from a l�1 spectral dependence indicates the pres-ence of aerosol species other than BC that absorb in the blueand ultraviolet spectral regions. In this study, we found thatorganic carbon in biomass smoke aerosols contributed tolight absorption in the ultraviolet and blue spectral regions.
[36] Acknowledgments. This work was supported by the Director,Office of Science, Office of Biological and Environmental Research, of theU.S. Department of Energy under CONTRACT DE-AC03-76SF00098, bythe Laboratory and Directed Research and Development program atLawrence Berkeley National Laboratory, and by NASA and NSF grantsNNG04GD64G and ATM-03144J3, respectively, to the University ofWashington. We thank Meinrat Andreae for inspiring comments and hisreview of the manuscript. We also thank Sophia Zhang, Paul Berdahl, andRonnen Levinson for useful comments.
ReferencesAndreae, M. O., and P. Merlet (2001), Emission of trace gases and aerosolsfrom biomass burning, Global Biogeochem. Cycles, 15, 955–966.
Bergstrom, R. W., P. B. Russell, and P. Hignett (2002), Wavelength depen-dence of the absorption of black carbon particles: Predictions and resultsfrom the TARFOX experiment and implications for the aerosol singlescattering albedo, J. Atmos. Sci., 59, 567–577.
Bergstrom, R. W., P. Pilewskie, B. Schmid, and P. B. Russell (2003),Estimates of the spectral aerosol single scattering albedo and aerosolradiative effects during SAFARI 2000, J. Geophys. Res., 108(D13),8474, doi:10.1029/2002JD002435.
Bodhaine, B. A. (1995), Aerosol absorption measurements at Barrow,Mauna Loa and the South Pole, J. Geophys. Res., 100, 8967–8975.
Bohren, C. F., and D. R. Huffman (1998), Absorption and Scattering ofLight by Small Particles, Wiley-Interscience, New York.
Bond, T. C. (2001), Spectral dependence of visible light absorption bycarbonaceous particles emitted from coal combustion, Geophys. Res.Lett., 28, 4075–4078.
Bond, T. C., M. Bussmer, B. Wehner, S. Keller, R. J. Charlson, andJ. Heintzenberg (1999a), Light absorption by primary particle emissionsfrom a lignite burning plant, Environ. Sci. Technol., 33, 3887–3891.
Bond, T. C., T. L. Anderson, and D. Campbell (1999b), Calibration andintercomparison of filter-based measurements of visible light absorptionby aerosols, Aerosol Sci. Technol., 30, 582–600.
Bond, T. C., D. S. Covert, J. C. Kramlich, T. V. Larson, and R. J. Charlson(2002), Primary particle emissions from residential coal burning: Opticalproperties and size distributions, J. Geophys. Res., 107(D21), 8347,doi:10.1029/2001JD000571.
Cachier, H., C. Liousse, M. Pertuisot, A. Gaudichet, F. Echalar, andJ. Lacaux (1996), African fire particulate emissions and atmosphericinfluence, in Biomass Burning and Global Change, vol. 1, edited byJ. S. Levine, pp. 428–440, MIT Press, Cambridge, Mass.
Campbell, D., S. Copeland, and T. Cahill (1995), Measurement of aerosolabsorption coefficient from Teflon filters using integrating plate and in-tegrating sphere techniques, Aerosol Sci. Technol., 22, 287–292.
Clarke, A., J. Ogren, and R. Charlson (1996), Measurement of aerosolabsorption coefficient from Teflon filters using integrating plate and in-tegrating sphere techniques–Comment, Aerosol Sci. Technol., 24, 221–224.
Cooke, W. F., C. Liousse, H. Cachier, and J. Feichter (1999), Constructionof a 1� � 1� fossil fuel emission data set for carbonaceous aerosol andimplementation in the ECHAM4 model, J. Geophys. Res., 104, 22,137–22,162.
Dalzell, W. H., and A. F. Sarofim (1969), Optical constants of soot and theirapplication to heat-flux calculations, J. Heat Transfer, 91, 100–104.
Dubovik, O., B. N. Holben, Y. J. Kaufman, M. Yamasoe, A. Smirnov,D. Tanre, and I. Slutsker (1998), Single-scattering albedo of smokeretrieved from the sky radiance and solar transmittance measured fromground, J. Geophys. Res., 103, 31,903–31,923.
Dubovik, O., B. Holben, T. F. Eck, A. Smirnov, Y. J. Kaufman, M. D. King,D. Tanre, and I. Slutsker (2002), Variability of absorption and opticalproperties of key aerosol types observed in worldwide locations,J. Atmos. Sci., 59, 590–608.
Fischer, K. (1973), Mass absorption coefficient of natural aerosol particlesin the 0.4–2.4 mm wavelength interval, Contrib. Atmos. Phys., 46, 89–100.
Foot, J. S., and C. G. Kilsby (1989), Absorption of light by aerosol parti-cles: An intercomparison of techniques and spectral observations, Atmos.Environ., 23, 489–495.
Formenti, P., W. Elbert, W. Maenhaut, J. Haywood, S. Osborne, and M. O.Andreae (2003), Inorganic and carbonaceous aerosols during the South-ern African Regional Science Initiative (SAFARI 2000) experiment:Chemical characteristics, physical properties, and emission data forsmoke from African biomass burning, J. Geophys. Res., 108(D13),8488, doi:10.1029/2002JD002408.
Gelencser, A., A. Hoffer, G. Kiss, E. Tombacz, R. Kurdi, and L. Bencze(2003), In-situ formation of light-absorbing organic matter in cloud water,J. Atmos. Chem., 45, 25–33.
Gosse, S. F., M. Wang, D. Labrie, and P. Chylek (1997), Imaginary part ofthe refractive index of sulfates and nitrates in the 0.7–2.6 mm spectralregion, Appl. Opt., 36, 3622–3634.
Gundel, L. A., R. L. Dod, H. Rosen, and T. Novakov (1984), Therelationship between optical attenuation and black carbon concentra-tions for ambient and source particles, Sci. Total Environ., 36, 197–202.
Hansen, A. D. A., H. Rosen, and T. Novakov (1984), The aethalometer–Aninstrument for the real– time measurement of optical absorption by aero-sol particles, Sci. Total Environ., 36, 191–196.
Hao, W. M., and M. H. Liu (1994), Spatial and temporal distribution oftropical biomass burning, Global Biochem. Cycles, 8, 495–503.
Havers, N., P. Burba, D. Klockow, and A. Klockow-Beck (1998), Charac-terization of humic-like substances in airborne particulate matter by cap-illary electrophoresis, Chromatographia, 47, 619–624.
Horvath, H. (1997), Experimental calibration for aerosol light absorptionmeasurements using the integrating plate method-Summary of the data,J. Aerosol Sci., 28, 1149–1161.
Horvath, H., L. Catalan, and A. Trier (1997), A study of the aerosol ofSantiago de Chile III: Light absorption measurements, Atmos. Environ.,31, 3737–3744.
Houghton, J. T., Y. Ding, D. J. Griggs, M. Noguer, P. J. van der Linden, andS. Xiaosu (2001), Climate Change 2001: The Scientific Basis, CambridgeUniv. Press, New York.
Jacobson, M. Z. (1998), Studying the effects of aerosols on vertical photol-ysis rate coefficient and temperature profiles over an urban airshed,J. Geophys. Res., 103, 10,593–10,604.
Jacobson, M. Z. (1999), Isolating nitrated and aromatic aerosols and ni-trated aromatic gases as sources of ultraviolet light absorption, J. Geo-phys. Res., 104, 3527–3542.
Jacobson, M. Z. (2001), Strong radiative heating due to the mixing state ofblack carbon in atmospheric aerosols, Nature, 409, 695–697.
Japar, S. M. (1990), Discussion of ‘‘Absorption of light by aerosol particles:An intercomparison of techniques and spectral observations’’ by Foot, JSand Kilsby, CG, Atmos. Environ., Part A, 24, 979–981.
Jennings, S. G., R. G. Pinnick, and J. B. Gillespie (1979), Relation betweenabsorption coefficient and imaginary index of atmospheric aerosol con-stituents, Appl. Opt., 18, 1368–1371.
Kirchstetter, T. W., R. A. Harley, S. V. Hering, M. R. Stolzenburg, andN. M. Kreisberg (1999), On-road measurement of fine particle and nitro-gen oxide emissions from light- and heavy-duty motor vehicles, Atmos.Environ., 33, 2955–2968.
Kirchstetter, T. W., C. E. Corrigan, and T. Novakov (2001), Laboratory andfield investigation of the adsorption of gaseous organic compounds ontoquartz filters, Atmos. Environ., 35, 1663–1671.
Kirchstetter, T. W., T. Novakov, P. V. Hobbs, and B. Magi (2003), Airbornemeasurements of carbonaceous aerosols in southern Africa during thedry, biomass burning season, J. Geophys. Res., 108, 8476, doi:10.1029/2002JD002171.
Kozlov, V. S., M. V. Panchenko, A. B. Tikhomirov, and B. A. Tikhomirov(2002), Investigations of the absorption properties of near-ground aerosolby the methods of optoacoustic spectrometry and diffuse extinction,paper presented at ARM Science Team Meeting, U.S. Dep. of Energy,St. Petersburg, Fla.
Krishnan, R., and V. Ramanathan (2002), Evidence of surface cooling fromabsorbing aerosols, Geophys. Res. Lett., 29(9), 1340, doi:10.1029/2002GL014687.
D21208 KIRCHSTETTER ET AL.: SPECTRAL LIGHT ABSORPTION BY AEROSOLS
11 of 12
D21208
Lindberg, J. D. (1975), Absorption coefficient of atmospheric dust andother strongly absorbing powders: An improvement of the method ofmeasurement, Appl. Opt., 14, 2813–2815.
Lindberg, J. D., and L. S. Laude (1974), Measurement of the absorptioncoefficient of atmospheric dust, Appl. Opt., 13, 1923–1927.
Lindberg, J. D., R. E. Douglass, and D. M. Garvey (1993), Carbon and theoptical properties of atmospheric dust, Appl. Opt., 32, 6077–6081.
Lindberg, J. D., R. E. Douglass, and D. M. Garvey (1999), Atmosphericparticulate absorption and black carbon measurement, Appl. Opt., 38,2369–2376.
Liousse, C., J. E. Penner, J. J. Walton, H. Eddleman, C. Chuang, andH. Cachier (1996), Modeling biomass burning aerosols, in BiomassBurning and Global Change, vol. 1, edited by J. S. Levine, pp. 492–508, MIT Press, Cambridge, Mass.
Lohmann, U., J. Feichter, C. C. Chuang, and J. E. Penner (1999), Predictionof the number of cloud droplets in the ECHAM GCM, J. Geophys. Res.,104, 9169–9198.
Lyubovtseva, Y. S., and L. G. Yaskovich (1982), Aerosol absorption in the0.25–0.8 mm region of the spectrum, Izv. Atmos. Oceanic Phys., 18,713–720.
Maria, S. F., L. M. Russell, B. J. Turpin, and R. J. Porcja (2002), FTIRmeasurements of functional groups and organic mass in aerosol samplesover the Caribbean, Atmos. Environ., 36, 5185–5196.
Marley, N. A., J. S. Gaffney, J. C. Baird, C. A. Blazer, P. J. Drayton, andJ. E. Frederick (2001), An empirical method for the determination of thecomplex refractive index of size-fractionated atmospheric aerosols forradiative transfer calculations, Aerosol Sci. Technol., 34, 535–549.
Martin, R. V., D. J. Jacob, R. M. Yantosca, M. Chin, and P. Ginoux (2003),Global and regional decreases in tropospheric oxidants from photochem-ical effects of aerosols, J. Geophys. Res., 108(D3), 4097, doi:10.1029/2002JD002622.
Menon, S., J. Hansen, L. Nazarenko, and Y. F. Luo (2002), Climate effectsof black carbon aerosols in China and India, Science, 297, 2250–2253.
Mukai, H., and Y. Ambe (1986), Characterization of a humic acid-likebrown substance in airborne particulate matter and tentative identificationof its origin, Atmos. Environ., 20, 813–819.
Novakov, T. (1981), Microchemical characterization of aerosols, in Nature,Aim and Methods of Microchemistry, edited by H. Malissa, M. Grass-erbaure, and R. Belcher, pp. 141–165, Springer-Verlag, New York.
Patterson, E. M., and C. K. McMahon (1984), Absorption characteristics offorest fire particulate matter, Atmos. Environ., 18, 2541–2551.
Petzold, A., C. Kopp, and R. Neissner (1997), The dependence of thespecific attenuation cross-section on black carbon mass fraction and par-ticle size, Atmos. Environ., 31, 661–672.
Romanov, M. P., and S. Shuklin (1984), Extinction coefficients of precipi-tation water in the range 200–1100 nm, Izv. Atmos. Oceanic Phys., 20,206–209.
Rosen, H., and T. Novakov (1983), Optical-transmission through aerosoldeposits on diffusely reflective filters—A method for measuring the ab-sorbing component of aerosol-particles, Appl. Opt., 22, 1265–1267.
Rosen, H., A. D. A. Hansen, L. Gundel, and T. Novakov (1978), Identifica-tion of the optically absorbing component in urban aerosols, Appl. Opt.,17, 3859–3861.
Russell, P. B., and J. Heintzenberg (2000), An overview of the ACE-2 clearsky column closure experiment (CLEARCOLUMN), Tellus, Ser. B, 52,463–483.
Schnaiter, M., H. Horvath, O. Mohler, K. H. Naumann, H. Saathoff, andO. W. Schock (2003), UV-VIS-NIR spectral optical properties of soot andsoot-containing aerosols, J. Aerosol Sci., 34, 1421–1444.
Sinha, P., P. V. Hobbs, R. J. Yokelson, D. R. Blake, S. Gao, and T. W.Kirchstetter (2003), Emissions of trace gases and particles from savannafires in southern Africa, J. Geophys. Res., 108(D13), 8487, doi:10.1029/2002JD002325.
Streets, D. G., S. Gupta, S. T. Waldhoff, M. Q. Wang, T. C. Bond, andY. Bo (2001), Black carbon emissions in China, Atmos. Environ., 35,4281–4296.
Swap, R. J., H. J. Annegarn, J. T. Suttles, M. D. King, S. Platnick, J. L.Privette, and R. J. Scholes (2003), Africa burning: A thematic analysisof the Southern African Regional Science Initiative (SAFARI 2000),J. Geophys. Res., 108(D13), 8465, doi:10.1029/2003JD003747.
Turpin, B. J., and H. J. Lim (2001), Species contributions to PM2.5 massconcentrations: Revisiting common assumptions for estimating organicmass, Aerosol. Sci. Technol., 35, 602–610.
van de Hulst, H. C. (1957), Light Scattering by Small Particles, John Wiley,New York.
Volz, F. (1956), Ultraviolett-absorption, totaler salzgehalt und wasserloslichekohlenwasserstoffe in atmospharischen niederschlagen und ondensiertenverbrennungs-abgasen, Meteorol. Rundsch., 9, 169–171.
Vuilleumier, L., R. A. Harley, N. J. Brown, J. R. Slusser, D. Kolinski, andD. S. Bigelow (2001), Variability in ultraviolet total optical depth duringthe Southern California Ozone Study (SCOS97), Atmos. Environ., 35,1111–1122.
Weingartner, E., H. Saathoff, M. Schnaiter, N. Streit, B. Bitnar, andU. Baltensperger (2003), Absorption of light by soot particles: Determi-nation of the absorption coefficient by means of aethalometers, J. AerosolSci., 34, 1445–1463.
�����������������������P. V. Hobbs, Atmospheric Sciences Department, University of Washing-
ton, Box 351640, Seattle, WA 98195, USA.T. W. Kirchstetter and T. Novakov, Environmental Energy Technologies
Division, Lawrence Berkeley National Laboratory, MS70-108B, Berkeley,CA 94720, USA. ([email protected])
D21208 KIRCHSTETTER ET AL.: SPECTRAL LIGHT ABSORPTION BY AEROSOLS
12 of 12
D21208