dependence of spectral characteristics on parameters
TRANSCRIPT
Dependence of spectral characteristics on parameters describing CO2 exchange between crop species and the atmosphere**
Bogna Uździcka*, Marcin Stróżecki, Marek Urbaniak, and Radosław Juszczak
Department of Meteorology, Faculty of Environmental Engineering and Spatial Planning, Poznań University of Life Sciences, Piątkowska 94, 60-649 Poznań, Poland
Received September 30, 2016; accepted May 16, 2017
Int. Agrophys., 2017, 31, 419-432doi: 10.1515/intag-2016-0059
*Corresponding author e-mail: [email protected]**Funding was provided by the project of the Polish Ministry of Science (No. 752/N-COST/2010/0) ‘Assessment of a seasonal and spatial variation of plant biophysical and spectral indices in the context of CO2, CH4, H2O gas exchange between wetland, for-est and arable ecosystems and the atmosphere’, 2010-2013.
A b s t r a c t. The aim of this paper is to demonstrate that spec-tral vegetation indices are good indicators of parameters describing the intensity of CO2 exchange between crops and the atmosphere. Measurements were conducted over 2011-2013 on plots of an experimental arable station on winter wheat, winter rye, spring barley, and potatoes. CO2 fluxes were measured using the dyna- mic closed chamber system, while spectral vegetation indices were determined using SKYE multispectral sensors. Based on spectral data collected in 2011 and 2013, various models to esti-mate net ecosystem productivity and gross ecosystem productivity were developed. These models were then verified based on data collected in 2012. The R2 for the best model based on spectral data ranged from 0.71 to 0.83 and from 0.78 to 0.92, for net ecosystem productivity and gross ecosystem productivity, respectively. Such high R2 values indicate the utility of spectral vegetation indices in estimating CO2 fluxes of crops. The effects of the soil background turned out to be an important factor decreasing the accuracy of the tested models.
K e y w o r d s: spectral vegetation indices, net ecosystem productivity, gross ecosystem productivity, crops, dynamic cham-bers, multispectral sensors
INTRODUCTION
Net ecosystem productivity (NEP) is a parameter that describes the balance of all processes of carbon dioxide (CO2) exchange between the ecosystem and the atmosphere – the difference between the amount of CO2 assimilated by plants within the photosynthesis and respiration of the eco-system (Kirschbaum et al., 2001; Law et al., 2002). NEP values are given from the point of view of carbon dioxide gains or losses by the ecosystem: they are positive when
photosynthesis (expressed as gross ecosystem productivi-ty, GEP) exceeds the respiration process at the ecosystem scale (ecosystem respiration, Reco). In turn, negative values of this parameter indicate excess respiration over photosyn-thesis, and thus carbon losses by the ecosystem.
In the vast majority of studies on measurements of CO2 fluxes, eddy covariance (EC) systems were applied (Cheng et al., 2009; Middleton et al., 2009; Rossini et al., 2010; Sakowska et al., 2014; Urbaniak et al., 2016). Measurements of gas fluxes conducted using this technique, despite many advantages (Goulden et al., 1996; Moncrieff et al., 1996; Verma, 1990), have also some limitations. For instance, the application of the EC technique is limited to relatively large (the flux ‘footprint’ varies from tens of meters to se- veral kilometres), flat, and homogeneous surfaces (Urbaniak et al., 2016). Apart from the EC technique, gas fluxes exchanged between the ecosystem and the atmosphere are also measured using e.g. the chamber technique, applied in this paper (Juszczak, 2013; Urbaniak et al., 2016). It is a method based on point measurements and, therefore, is very well adapted to heterogeneous surfaces, in which EC systems may not be applied. A significant limitation of the chamber method is connected with the high labour and time intensity of the performed measurements.
Due to the considerable limitations of both the EC and the chamber methods, the focus in recent years has increa- singly been placed on the need to estimate parameters describing CO2 exchange between vegetation and the atmos- phere based on remote sensing data. In the vast majority of studies, which are conducted at present at the ground level, spectral characteristics are measured using various types of automatic systems (Ide et al., 2010; Meroni et al., 2011;
© 2017 Institute of Agrophysics, Polish Academy of Sciences
B. UŹDZICKA et al.420
Nakaji et al., 2007, 2008; Sakowska et al., 2015, 2016). In order to facilitate the presentation of optical measurements within more than one spectral range, spectral vegetation indices (VIs) were introduced as algebraic dependencies of reflectance (ρ) at various wavelengths (λ). Thanks to these procedures, VIs may be presented in the form of one dimen-sionless value, sensitive to a specific characteristic of the analysed surface. These indices are extensively used to esti-mate various parameters of soil surfaces and the vegetation cover (Liang, 2004).
The normalised difference vegetation index (NDVI) is one of the most commonly applied VIs (Rouse et al., 1973). It is calculated based on spectral reflectance measurements acquired in the visible (RED) and near-infrared (NIR) regions. NDVI is a spectral indicator of the greenness of the vegetation cover, i.e. a complex of such parameters as the canopy cover and structure, leaf area index, leaf chlo-rophyll content, as well as the physiological status of the vegetation (Liang, 2004; Zarco-Tejada et al., 2005; Zhang et al., 2005). Numerous studies have been conducted on the dependence of NDVI on different parameters of the vege-tation cover, including CO2 fluxes exchanged between the vegetation cover and the atmosphere. Emphasis has been particularly placed on its relationship with GEP (Rossini et al., 2012; Sakowska et al., 2014; Skinner et al., 2011; Wang et al., 2004) and NEP (Hassan et al., 2006; Propastin and Kappas, 2009; Veroustraete et al., 1996). The season-al variation of CO2 fluxes exchanged between different ecosystems and the atmosphere was successfully assessed based on different VIs including NDVI (Rossini et al., 2012; Wang et al., 2004; Zhang et al., 2005). Relationships based on NDVI work best when the analysed vegetation cover is neither too dense nor too sparse. At high densities of the vegetation cover, the effect of saturation of NDVI values at a certain level and a lack of its further growth with an increase in the parameters estimated by this index can be observed (Carlson and Ripley, 1997; Uździcka et al., 2012). As a consequence of the saturation effect, the application of NDVI to estimate CO2 fluxes may result in a considerable underestimation of these fluxes (Zarco-Tejada et al., 2005). Different modifications of NDVI aiming at the minimisation of the saturation effect have been pro-posed e.g. simple ratio (SR), modified simple ratio (MSR), and wide dynamic range vegetation index (WDRVI). The SR index does not provide linear relationships with the ve- getation biophysical parameters, since although it is high-ly sensitive to their changes at high plant densities, at the same time it has low sensitivity when the density of the vegetation cover is low (Jackson and Huete, 1991). The SR index was modified to MSR in order to obtain more lin-ear relationship between spectral data and biomass (Chen, 1996). WDRVI was developed by Gitelson (2004) to obtain the same effect, although at a much better adaptation of the calculation methodology to the specific crop character.
In the conditions of sparse vegetation cover, the main issue with estimating various parameters based on spectral data is connected to the contribution of the soil background to the measured signal (Baret and Guyot, 1991; Huete, 1988; Rondeaux et al., 1996). In order to minimise this effect, Huete (1988) introduced a modification of NDVI and proposed the soil adjusted vegetation index (SAVI). SAVI works relatively well for plant cover with visible soil interspaces. A certain limitation in its application results from the fact that the parameter L used for calculation is a coefficient that in theory should be variable, depending on the density of the vegetation cover. For very dense veg-etation cover, L should be 0, while for low vegetation cover density, it is ~1. Since the value of vegetation cover density is rarely ever known, optimisation of this parameter is high-ly approximate. However, the results of analyses made by Huete (1988) indicated that although optimal L values were different for different amounts of biomass in a given area, L of 0.5 was optimal for a very wide spectrum of conditions. Thus, the adoption of such a value of this parameter results in a reduction of soil disturbances in various types of vege-tation cover (Panda et al., 2010).
After Huete (1988), soil effects were considered in many other studies and a considerable number of VIs, which correct for the influence of soil brightness when vegetative cover is low, was developed. These include the transformed soil adjusted vegetation index (TSAVI: Baret and Guyot 1991), modified soil adjusted vegetation index (MSAVI: Qi et al., 1994), and optimised soil adjusted ve- getation index (OSAVI: Rondeaux et al., 1996). All of these VIs are based on various modifications of parameter L in SAVI. According to the results of studies conducted to date (Rondeaux et al., 1996) on homogeneous meadows and arable fields in temperate latitudes, the best results among indices of this group are provided by OSAVI. This index was used e.g. by Daughtry et al. (2000), Flowers et al. (2001), Haboudane et al. (2002) and Zarco-Tejada et al. (2005).
The photochemical reflectance index (PRI) is a spectral index that is sensitive to changes in carotenoid pigments in live foliage and is used as an indicator of the light use efficiency in the process of photosynthesis (Gamon et al., 1992). Its relationship with biophysical parameters of the vegetation cover has also been confirmed by many studies (Coops et al., 2010, Garbulsky et al., 2011, Goerner et al., 2011; Middleton et al., 2009). Seasonal changes in PRI illustrate seasonal changes in the concentration of carot-enoid pigments in plants (Stylinski et al., 2002). Short-term changes in PRI reflect short-term changes in the photosyn-thesis light use efficiency (at constant carotenoid contents in plants: Goerner et al., 2011) as a result of various stress factors (Gamon et al., 1992, 1997).
The availability of simultaneous acquisition of near-sur-face spectral observations and CO2 flux measurements obtained with the eddy covariance technique has increased

CO2 EXCHANGE BETWEEN CROPS AND ATMOSPHERE 421
in recent years. One of the most widely applied approaches to modelling GPP based on spectral data is the light-use effi-ciency (LUE) model proposed by Monteith (1972, 1977), in which GPP is modelled as a function of the fraction of photosynthetically active radiation absorbed by vegetation (fAPAR), the incident photosynthetically active radiation (PAR), and the conversion efficiency of absorbed energy to fixed carbon (light-use efficiency) (Rossini et al., 2012). Another approach to estimate GPP is based on a simplified version of Monteith model. In this approach, there is no need to estimate fAPAR and light use efficiency with the use of spectral vegetation indices. Based on the assumption that chlorophyll is related to the presence of photosynthetic biomass, recent studies (Gitelson et al.,, 2008; Harris and Dash, 2010) suggest that GPP can be estimated through direct correlation with chlorophyll-related indexes (Rossini et al., 2012) or sun induced fluorescence (Migliavacca et al., 2017; Rossini et al., 2010).
Studies on the relationships of the spectral characteris-tics of the vegetation cover with CO2 fluxes measured using the chamber technique have been conducted relatively rare-ly till now (Boelman et al., 2003; Dagg and Lafleur, 2010; Perez-Priego et al., 2015). However, considering that both chamber and spectral measurements can be performed at a small scale of crop fields where the EC technique can-not be applied, our aim was to demonstrate how these two methods can be successfully combined to develop simple empirical models which allow estimation of the GEP and NEP of different crops with remote sensing.
MATERIALS AND METHODS
Measurements of the biophysical and spectral charac- teristics of the vegetation cover were taken in the Experimental Teaching Station in Brody (52o26’18’’ N, 16o17’40’’ E) on fields of a multi-year experiment conduct-ed by the Department of Agronomy, Poznań University of Life Sciences. The cultivation experiment was established as early as 1957 and covers plots grown in monoculture and in crop rotation (with four blocks in each). In both crop-ping systems, seven crop species are grown, differing in the levels of mineral or organic fertilisation (11 fertiliser combinations).
The measurements presented here were recorded in 2011-2013, solely in plots of one selected fertiliser combi-nation (Nmin, K2O, P2O5 – 90, 120 and 90 kg ha-1, respecitvely as well as Ca) grown in the seven-year crop rotation system (potato plants – Vineta, spring barley – Nadek, winter tri- ticale –Witon, 1 and 2-year alfalfa – Alba, winter wheat Turkis, winter rye – Dańkowskie Złote). Analyses were conducted on four crop species: winter wheat, winter rye, spring barley, and potato plants.
The 40 year period mean annual air temperature at a height of 2 m above the ground in the experimental area is 7.9oC, while the mean annual precipitation is 571 mm
(based on measurements recorded over 1959-1999 at the weather station of the Brody Experimental Station). The dominant soils in the analysed area are lessive soils, with the grain size composition of light and heavy loamy sands, of medium depth, lying over light loams. According to the FAO classification, they are classified as Albic Luvisoils (Blecharczyk, 2002). The length of the vegetation period is between 216 to 228 days.
CO2 fluxes were measured with a dynamic chamber system, composed of a non-transparent chamber facilitat-ing measurements of ecosystem respiration (Reco) as well as a transparent chamber to measure NEP fluxes. Measurements of Reco and NEP were used to calculate GEP. The dark chamber was made from white PVC, while the transparent chamber was made from PLEXIGLAS (Evonik Industries, Darmstadt, Germany). Each chamber had walls of 3 mm thickness and was 78 x 78 x 50 cm in size. Both cham-bers were equipped with two fans of 1.4 W each (to ensure effective air mixing inside the chambers), a pressure equili-bration system, and a temperature sensor (T-107, Campbell Scientific, USA) installed inside the chamber (in a radia-tion protection shield at a height of 30 cm from the lower edge). In order to measure CO2 concentrations changing in the course of measurements, a home-made measure-ment system with a Li-820 analyser (LICOR, USA) was used. Air circulated between the chamber and the analyser within a closed loop. The measurement system comprised a CR1000 data logger (Campbell Scientific, USA) record-ing data on CO2 concentration every 5 s (Chojnicki et al., 2010; Juszczak, 2013; Juszczak et al., 2012, 2013). Additionally, a SKP215 sensor (Skye Instruments Ltd. UK) installed in the chamber was also used to measure the intensity of incoming photosynthetically active radiation (PARi) during the NEP measurements, while a set of T-107 thermistors (Campbell Scientific, Utah, USA) was used to measure soil temperature at 2 and 5 cm depths.
The chambers were placed on PVC soil frames (75 x 75 cm) inserted to a depth of ~15 cm. In each experi-mental plot, two frames were installed (at a distance of 1 m). Due to the plant height changing during the grow-ing season, extensions were used in order to increase the height of the whole chamber set (to a maximum of 1.5 m). Chamber measurements were performed every 3-4 weeks, on cloudless days, during daytime hours from sunrise to late afternoon. Measurements of NEP and Reco were taken one directly after another to facilitate GEP calculations (as a sum of NEP and Reco). Due to the high air temperatures in the summer and the potential overheating of the transparent chamber, the temperature in that chamber was stabilised using cooling pads installed on the frame inside the cham-ber headspace (Drösler, 2005). The duration of chamber closure ranged from 120 to 180 s in the transparent and non-transparent chamber, respectively.

B. UŹDZICKA et al.422
A total of 37 measurement campaigns were conducted over 2011-2013 (12 in 2011, 17 in 2012, and 8 in 2013). CO2 fluxes (µmol CO2 m-2 s-1) were calculated based on the gas concentration change over the closure time using the linear approach (Juszczak et al., 2012, 2013). For each measurement campaign, relationships between mea-sured Reco and air and soil temperatures were found (Lloyd and Taylor, 1994) as well as between GEP and PARi (Michaelis-Menten, 1913). The protocols of data analy-sis and flux modelling applied were identical to those in Eickenscheidt et al. (2015). The obtained relationships were used together with model CO2 fluxes in the periods between the measurement campaigns. Modelling was con-ducted with a 30-minute step, using air or soil temperature (to calculate Reco) and PARi (to estimate GEP) measured at an automatic weather station located 50 m from the plots. Based on the values of modelled fluxes, cumulative seaso- nal Reco, GEP, and NEP (NEP=GEP-Reco) were calculated.
Radiometric measurements were taken using two four-channel SKR1850 sensors (SKYE Instruments Ltd., Llandrindod Wells, UK) installed at the zenith-nadir posi-tion on a portable SKL908 device (Spectrosense2+, SKYE Instruments Ltd., Llandrindod Wells, UK). Multispectral measurements were conducted for radiation incident and reflected from the vegetation cover, at four wavelengths λ (530, 570, 670, and 850 with 10 nm bandwidth). On this basis, it was possible to calculate six spectral VIs – NDVI, SR, MSR, SAVI, OSAVI, WDRVI, and PRI (Table 1).
In the years 2011-2013, a total of 36 spectral measure-ment campaigns were conducted. Measurements were taken in the same plots and for crop species, in which chamber measurements of gas exchange were recorded. The mea-surements were organised in most cases on the same days as the chamber measurements; however, under unfavour-able conditions (e.g. due to clouds), these measurements were taken on the first sunny and cloudless days following the chamber measurements. Spectral measurements were recorded solely from 10:00 to 14:00 local time.
During the multispectral measurements performed with the Spectrosense2+ device, the sensor directed downwards measured the spectral radiance of the investigated area with a 25o field of view. The measurement results were record-ed in nanoamperes (nA). The size of the area from which the collected signal originates, depends on the height of the installed sensor. For measurements conducted within this study (at a sensor mounted at a constant height of 1.80 m above the ground), it was a circular area with a radius of 0.4 m and surface area of 0.5 m2. A sensor directed upwards is equipped with a cosine diffuser, which expands its field of view to 180o. This diffuser facilitates the application of Lambert cosine law to calculate spectral hemispheric irra-diance and to express radiation fluxes in µmol m-2 s-1. Both sensors take measurements at exactly the same moment, thus preventing any errors resulting from variability in the weather conditions.
T a b l e 1. Spectral vegetation indices calculated for this study (ρ – spectral reflectance at a given wavelength λ, L – parameter characterizing the density of the vegetation cover; in this study, in calculations of SAVI its optimal value (Huete 1988) was set to 0.5)
Spectral vegetation index Formulation Reference
Normalized difference vegetation index (NDVI)670850
670850
ρρρρ
+−=NDVI
(1) Rouse et al. (1973)
Simple ratio (SR)
670
850
ρρ=RS
(2) Jordan (1969)
Modified simple ratio (MSR)1
15.0 +−=
RSRSRSM
(3) Chen (1996)
Soil adjusted vegetation index (SAVI))1(
670850
670850 LL
SAVI +++
−=
ρρρρ
(4) Huete (1988)
Optimised soil adjusted vegetation index (OSAVI)61.0670850
670850
++−=ρρ
ρρOSAVI (5) Rondeaux et al. (1996)
Wide dynamic range vegetation index (WDRVI)
670850
670850
2.02.0
ρρρρ
+−=WDRVI
(6) Gitelson (2004)
Photochemical reflectance index (PRI)
531570
531570
ρρρρ
+−=PRI
(7) Gamon et al. (1992)
CO2 EXCHANGE BETWEEN CROPS AND ATMOSPHERE 423
Measurements were taken on each plot in three repli-cations located at a distance of 30 cm from one another. The value of the spectral vegetation index characterising a given plot was the arithmetic mean of three measure-ments. Spectral data filtering included rejecting the data acquired when the diffusion index (calculated as the ratio between diffuse and total PARi) exceeded 50%.
Since not all measurement campaigns for CO2 exchange and spectral measurements were performed on the same days and because the number of chamber measurements for each day and crop was different, we decided to use mod-elled values of CO2 fluxes to determine the relationship between NEP and GEP fluxes and vegetation indices. Daily sums of modelled NEP (NEPd) and GEP (GEPd) were used to develop relationships with spectral indices for days when optical measurements were taken. The results obtained for the training dataset (2011 and 2013) were used to deve- lop the best models to estimate NEPd and GEPd based on spectral vegetation indices. For each index, four regression types were analysed: linear, logarithmic, exponential, and power. For all analysed plant species, the best models were selected for the estimation of CO2 fluxes based on individ-ual indices. When evaluating the models, the following statistical parameters were considered: coefficient of determination (R2) and normalised root mean square error (NRMSE). The models characterised by the highest R2 and lowest NRMSE were selected as the best.
Data collected during 2012 were used as an indepen-dent dataset to validate the developed models. Each model was fitted against training dataset consisting of data collect-ed in 2011 and 2013 and the resulting parameterization was used to estimate CO2 fluxes of 2012.
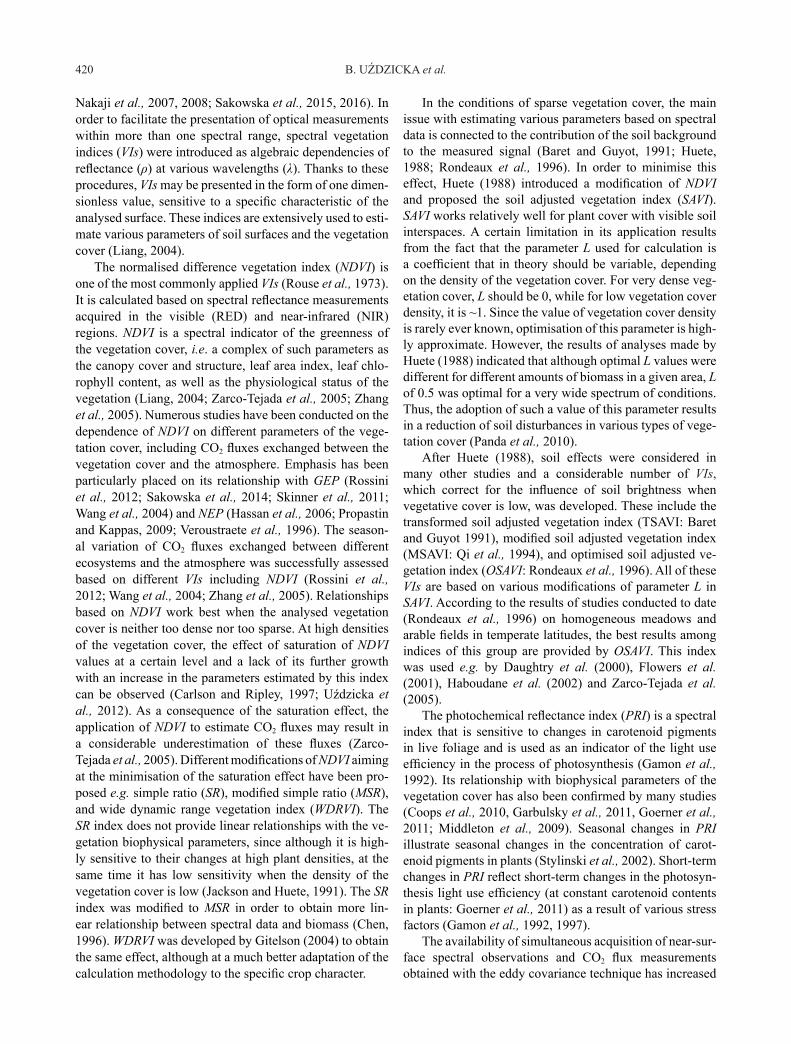
In the final step, the best models were used to estimate CO2 fluxes based on spectral vegetation indices interpo- lated linearly between the conducted measurement cam-paigns for 2012. The developed seasonal courses of CO2 fluxes were then compared to seasonal courses of NEPd and GEPd derived from chamber CO2 modelling. These analyses were conducted for the same period between the middle of April (when the first spectral measurements were taken in all years) to the middle of August (the last spectral measurements taken). The scheme for our data analysis is given in Fig. 1.
RESULTS
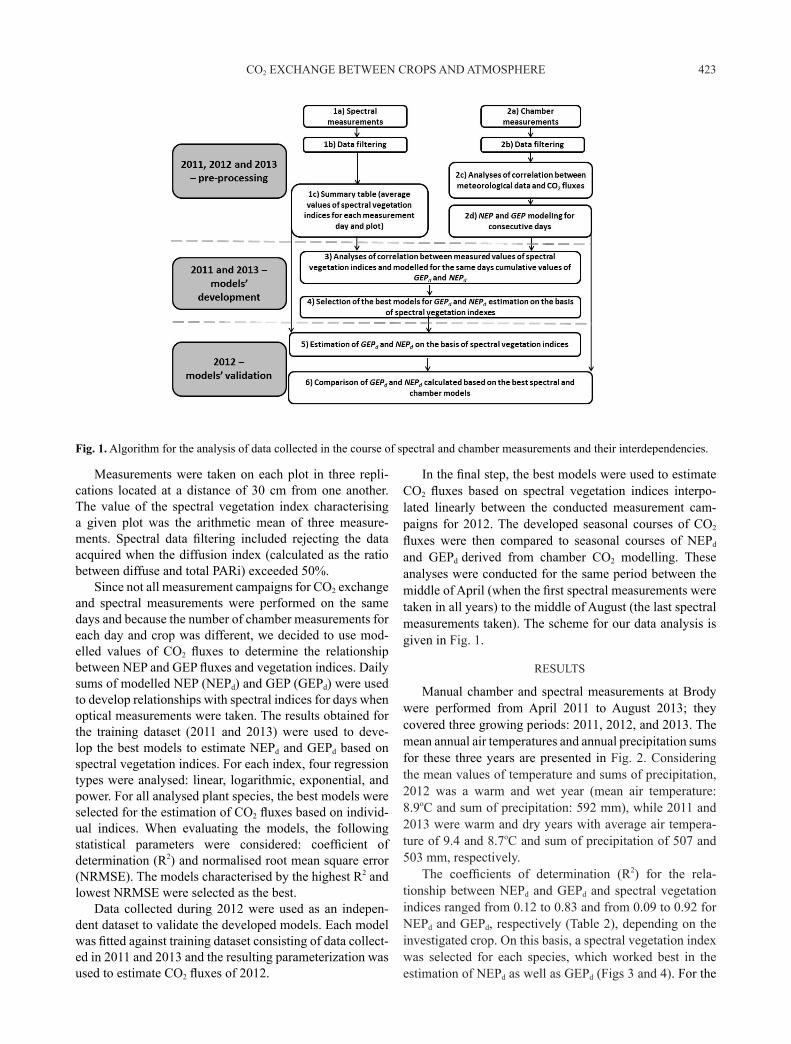
Manual chamber and spectral measurements at Brody were performed from April 2011 to August 2013; they covered three growing periods: 2011, 2012, and 2013. The mean annual air temperatures and annual precipitation sums for these three years are presented in Fig. 2. Considering the mean values of temperature and sums of precipitation, 2012 was a warm and wet year (mean air temperature: 8.9oC and sum of precipitation: 592 mm), while 2011 and 2013 were warm and dry years with average air tempera-ture of 9.4 and 8.7oC and sum of precipitation of 507 and 503 mm, respectively.
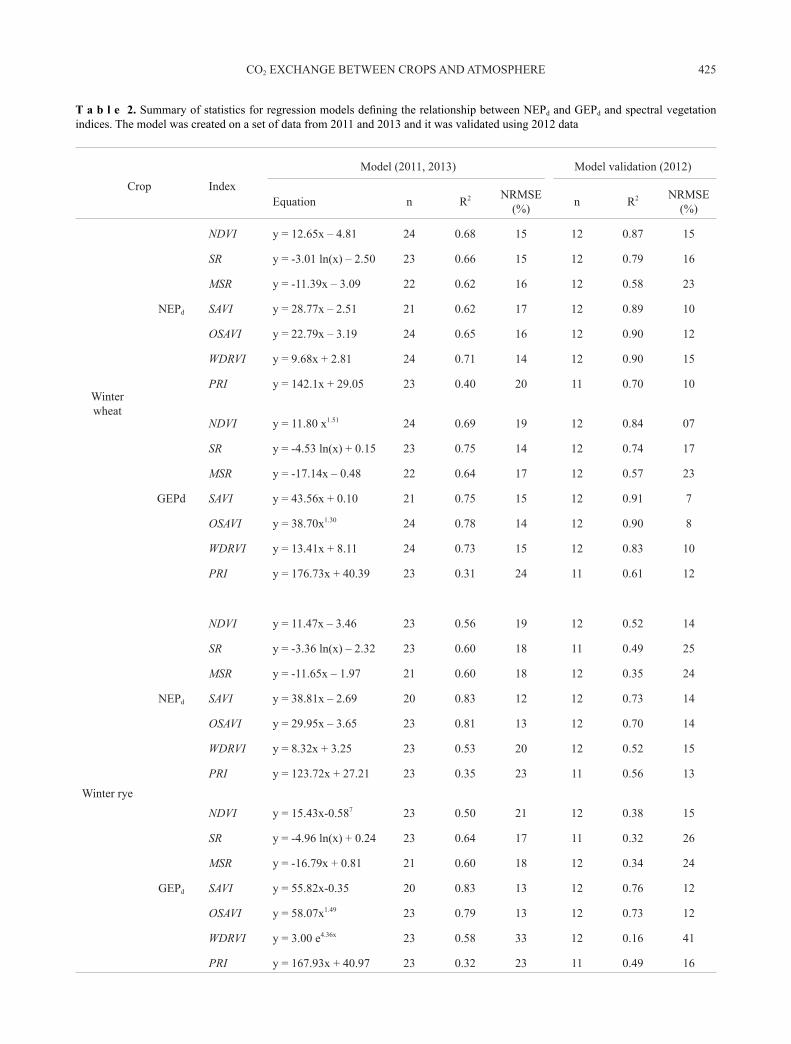
The coefficients of determination (R2) for the rela-tionship between NEPd and GEPd and spectral vegetation indices ranged from 0.12 to 0.83 and from 0.09 to 0.92 for NEPd and GEPd, respectively (Table 2), depending on the investigated crop. On this basis, a spectral vegetation index was selected for each species, which worked best in the estimation of NEPd as well as GEPd (Figs 3 and 4). For the
Fig. 1. Algorithm for the analysis of data collected in the course of spectral and chamber measurements and their interdependencies.
B. UŹDZICKA et al.424
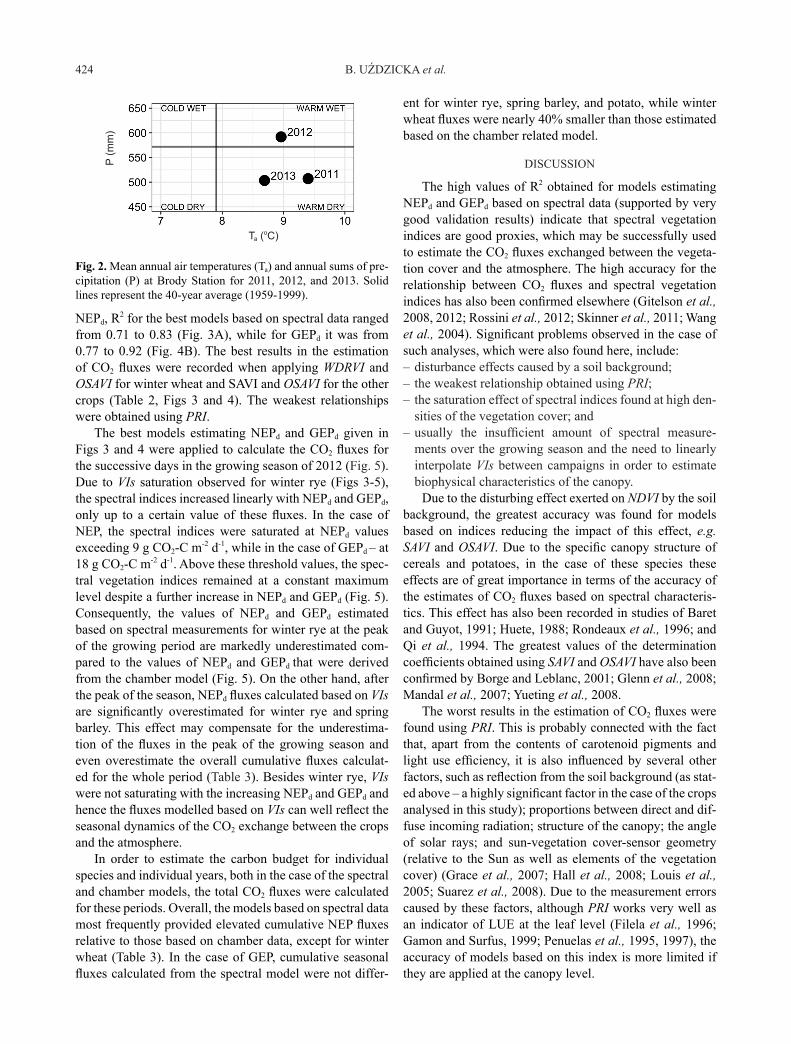
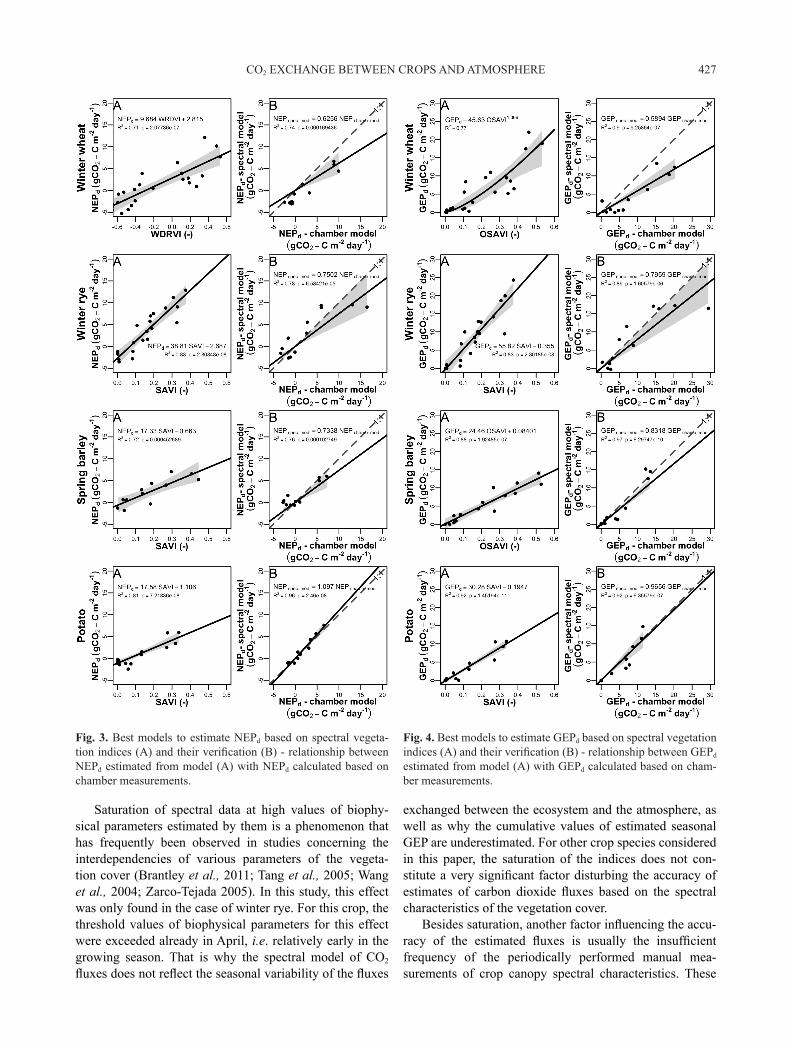
NEPd, R2 for the best models based on spectral data ranged from 0.71 to 0.83 (Fig. 3A), while for GEPd it was from 0.77 to 0.92 (Fig. 4B). The best results in the estimation of CO2 fluxes were recorded when applying WDRVI and OSAVI for winter wheat and SAVI and OSAVI for the other crops (Table 2, Figs 3 and 4). The weakest relationships were obtained using PRI.
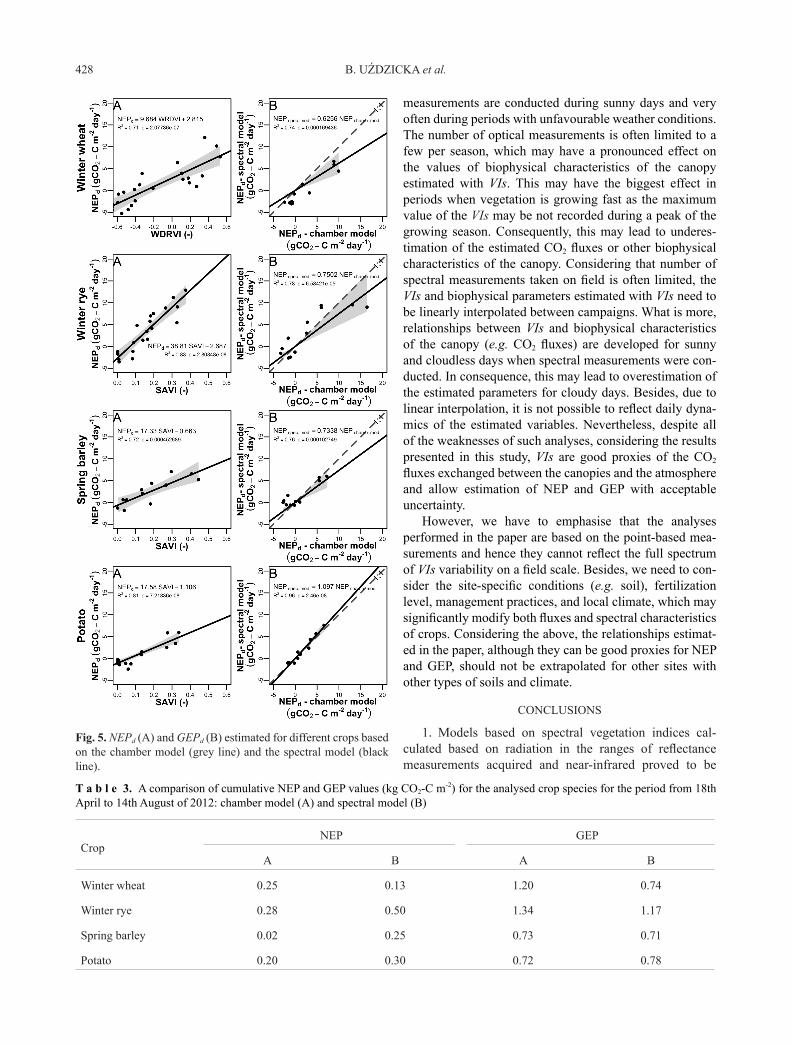
The best models estimating NEPd and GEPd given in Figs 3 and 4 were applied to calculate the CO2 fluxes for the successive days in the growing season of 2012 (Fig. 5). Due to VIs saturation observed for winter rye (Figs 3-5), the spectral indices increased linearly with NEPd and GEPd, only up to a certain value of these fluxes. In the case of NEP, the spectral indices were saturated at NEPd values exceeding 9 g CO2-C m-2 d-1, while in the case of GEPd – at 18 g CO2-C m-2 d-1. Above these threshold values, the spec-tral vegetation indices remained at a constant maximum level despite a further increase in NEPd and GEPd (Fig. 5). Consequently, the values of NEPd and GEPd estimated based on spectral measurements for winter rye at the peak of the growing period are markedly underestimated com-pared to the values of NEPd and GEPd that were derived from the chamber model (Fig. 5). On the other hand, after the peak of the season, NEPd fluxes calculated based on VIs are significantly overestimated for winter rye and spring barley. This effect may compensate for the underestima-tion of the fluxes in the peak of the growing season and even overestimate the overall cumulative fluxes calculat-ed for the whole period (Table 3). Besides winter rye, VIs were not saturating with the increasing NEPd and GEPd and hence the fluxes modelled based on VIs can well reflect the seasonal dynamics of the CO2 exchange between the crops and the atmosphere.
In order to estimate the carbon budget for individual species and individual years, both in the case of the spectral and chamber models, the total CO2 fluxes were calculated for these periods. Overall, the models based on spectral data most frequently provided elevated cumulative NEP fluxes relative to those based on chamber data, except for winter wheat (Table 3). In the case of GEP, cumulative seasonal fluxes calculated from the spectral model were not differ-
ent for winter rye, spring barley, and potato, while winter wheat fluxes were nearly 40% smaller than those estimated based on the chamber related model.
DISCUSSION
The high values of R2 obtained for models estimating NEPd and GEPd based on spectral data (supported by very good validation results) indicate that spectral vegetation indices are good proxies, which may be successfully used to estimate the CO2 fluxes exchanged between the vegeta-tion cover and the atmosphere. The high accuracy for the relationship between CO2 fluxes and spectral vegetation indices has also been confirmed elsewhere (Gitelson et al., 2008, 2012; Rossini et al., 2012; Skinner et al., 2011; Wang et al., 2004). Significant problems observed in the case of such analyses, which were also found here, include: – disturbance effects caused by a soil background; – the weakest relationship obtained using PRI; – the saturation effect of spectral indices found at high den-sities of the vegetation cover; and
– usually the insufficient amount of spectral measure-ments over the growing season and the need to linearly interpolate VIs between campaigns in order to estimate biophysical characteristics of the canopy.
Due to the disturbing effect exerted on NDVI by the soil background, the greatest accuracy was found for models based on indices reducing the impact of this effect, e.g. SAVI and OSAVI. Due to the specific canopy structure of cereals and potatoes, in the case of these species these effects are of great importance in terms of the accuracy of the estimates of CO2 fluxes based on spectral characteris-tics. This effect has also been recorded in studies of Baret and Guyot, 1991; Huete, 1988; Rondeaux et al., 1996; and Qi et al., 1994. The greatest values of the determination coefficients obtained using SAVI and OSAVI have also been confirmed by Borge and Leblanc, 2001; Glenn et al., 2008; Mandal et al., 2007; Yueting et al., 2008.
The worst results in the estimation of CO2 fluxes were found using PRI. This is probably connected with the fact that, apart from the contents of carotenoid pigments and light use efficiency, it is also influenced by several other factors, such as reflection from the soil background (as stat-ed above – a highly significant factor in the case of the crops analysed in this study); proportions between direct and dif-fuse incoming radiation; structure of the canopy; the angle of solar rays; and sun-vegetation cover-sensor geometry (relative to the Sun as well as elements of the vegetation cover) (Grace et al., 2007; Hall et al., 2008; Louis et al., 2005; Suarez et al., 2008). Due to the measurement errors caused by these factors, although PRI works very well as an indicator of LUE at the leaf level (Filela et al., 1996; Gamon and Surfus, 1999; Penuelas et al., 1995, 1997), the accuracy of models based on this index is more limited if they are applied at the canopy level.
Fig. 2. Mean annual air temperatures (Ta) and annual sums of pre-cipitation (P) at Brody Station for 2011, 2012, and 2013. Solid lines represent the 40-year average (1959-1999).
P (m
m)
Ta (oC)
CO2 EXCHANGE BETWEEN CROPS AND ATMOSPHERE 425
T a b l e 2. Summary of statistics for regression models defining the relationship between NEPd and GEPd and spectral vegetation indices. The model was created on a set of data from 2011 and 2013 and it was validated using 2012 data
Crop Index
Model (2011, 2013) Model validation (2012)
Equation n R2 NRMSE (%) n R2 NRMSE
(%)
Winter wheat
NEPd
NDVI y = 12.65x – 4.81 24 0.68 15 12 0.87 15
SR y = -3.01 ln(x) – 2.50 23 0.66 15 12 0.79 16
MSR y = -11.39x – 3.09 22 0.62 16 12 0.58 23
SAVI y = 28.77x – 2.51 21 0.62 17 12 0.89 10
OSAVI y = 22.79x – 3.19 24 0.65 16 12 0.90 12
WDRVI y = 9.68x + 2.81 24 0.71 14 12 0.90 15
PRI y = 142.1x + 29.05 23 0.40 20 11 0.70 10
GEPd
NDVI y = 11.80 x1.51 24 0.69 19 12 0.84 07
SR y = -4.53 ln(x) + 0.15 23 0.75 14 12 0.74 17
MSR y = -17.14x – 0.48 22 0.64 17 12 0.57 23
SAVI y = 43.56x + 0.10 21 0.75 15 12 0.91 7
OSAVI y = 38.70x1.30 24 0.78 14 12 0.90 8
WDRVI y = 13.41x + 8.11 24 0.73 15 12 0.83 10
PRI y = 176.73x + 40.39 23 0.31 24 11 0.61 12
Winter rye
NEPd
NDVI y = 11.47x – 3.46 23 0.56 19 12 0.52 14
SR y = -3.36 ln(x) – 2.32 23 0.60 18 11 0.49 25
MSR y = -11.65x – 1.97 21 0.60 18 12 0.35 24
SAVI y = 38.81x – 2.69 20 0.83 12 12 0.73 14
OSAVI y = 29.95x – 3.65 23 0.81 13 12 0.70 14
WDRVI y = 8.32x + 3.25 23 0.53 20 12 0.52 15
PRI y = 123.72x + 27.21 23 0.35 23 11 0.56 13
GEPd
NDVI y = 15.43x-0.587 23 0.50 21 12 0.38 15
SR y = -4.96 ln(x) + 0.24 23 0.64 17 11 0.32 26
MSR y = -16.79x + 0.81 21 0.60 18 12 0.34 24
SAVI y = 55.82x-0.35 20 0.83 13 12 0.76 12
OSAVI y = 58.07x1.49 23 0.79 13 12 0.73 12
WDRVI y = 3.00 e4.36x 23 0.58 33 12 0.16 41
PRI y = 167.93x + 40.97 23 0.32 23 11 0.49 16

B. UŹDZICKA et al.426
T a b l e 2. Continuation
Crop Index
Model (2011, 2013) Model validation (2012)
Equation n R2 NRMSE (%) n R2 NRMSE
(%)
Springbarley
NEPd
NDVI y = 7.54x – 1.91 15 0.54 23 12 0.71 12
SR y = -1.52 ln(x) – 0.60 15 0.33 28 12 0.65 19
MSR y = -5.81x – 0.89 15 0.30 28 12 0.43 21
SAVI y = 17.33x – 0.66 12 0.72 16 12 0.81 14
OSAVI y = 14.55x – 1.69 15 0.63 21 12 0.79 12
WDRVI y = 5.67x + 2.56 15 0.54 23 12 0.80 10
PRI y = 85.99x + 18.64 15 0.31 28 11 0.10 12
GEPd
NDVI y = 13.15x – 0.51 15 0.83 13 12 0.95 6
SR y = -3.18 ln(x) + 1.04 15 0.73 17 12 0.77 23
MSR y = -12.10x + 0.45 15 0.66 19 12 0.58 29
SAVI y = 28.70x+1.024 12 0.84 19 12 0.93 12
OSAVI y = 24.46x + 0.08 15 0.88 11 12 0.95 7
WDRVI y = 9.93x + 7.31 15 0.82 14 12 0.93 8
PRI y = 71.69x + 19.78 15 0.11 30 11 0.01 24
Potato
NEPd
NDVI y = 7.25x – 1.30 23 0.73 14 12 0.83 12
SR y = -2.09 ln(x) – 0.53 18 0.68 15 11 0.90 25
MSR y = -4.88x – 0.51 21 0.49 19 12 0.77 18
SAVI y = 17.58x – 1.11 20 0.81 12 12 0.91 10
OSAVI y = 11.97x – 1.21 23 0.61 17 12 0.91 8
WDRVI y = 6.92x + 3.52 23 0.76 13 12 0.87 13
PRI y = 59.21x + 12.13 22 0.12 25 11 0.01 8
GEPd
NDVI y = 12.50x – 0.37 23 0.86 13 12 0.99 5
SR y = -3.48 ln(x) + 0.69 18 0.80 14 11 0.95 22
MSR y = -8.93x + 0.74 21 0.69 18 12 0.71 23
SAVI y = 30.28x – 0.19 20 0.92 09 12 0.88 16
OSAVI y = 21.42x - 0.32 23 0.77 17 12 0.93 10
WDRVI y = 11.50x + 7.73 23 0.83 14 12 0.93 12
PRI y = 80.7x + 18.43 22 0.09 31 11 0.04 15
CO2 EXCHANGE BETWEEN CROPS AND ATMOSPHERE 427
Saturation of spectral data at high values of biophy- sical parameters estimated by them is a phenomenon that has frequently been observed in studies concerning the interdependencies of various parameters of the vegeta-tion cover (Brantley et al., 2011; Tang et al., 2005; Wang et al., 2004; Zarco-Tejada 2005). In this study, this effect was only found in the case of winter rye. For this crop, the threshold values of biophysical parameters for this effect were exceeded already in April, i.e. relatively early in the growing season. That is why the spectral model of CO2 fluxes does not reflect the seasonal variability of the fluxes
exchanged between the ecosystem and the atmosphere, as well as why the cumulative values of estimated seasonal GEP are underestimated. For other crop species considered in this paper, the saturation of the indices does not con-stitute a very significant factor disturbing the accuracy of estimates of carbon dioxide fluxes based on the spectral characteristics of the vegetation cover.
Besides saturation, another factor influencing the accu-racy of the estimated fluxes is usually the insufficient frequency of the periodically performed manual mea-surements of crop canopy spectral characteristics. These
Fig. 3. Best models to estimate NEPd based on spectral vegeta-tion indices (A) and their verification (B) - relationship between NEPd estimated from model (A) with NEPd calculated based on chamber measurements.
Fig. 4. Best models to estimate GEPd based on spectral vegetation indices (A) and their verification (B) - relationship between GEPd estimated from model (A) with GEPd calculated based on cham-ber measurements.
B. UŹDZICKA et al.428
measurements are conducted during sunny days and very often during periods with unfavourable weather conditions. The number of optical measurements is often limited to a few per season, which may have a pronounced effect on the values of biophysical characteristics of the canopy estimated with VIs. This may have the biggest effect in periods when vegetation is growing fast as the maximum value of the VIs may be not recorded during a peak of the growing season. Consequently, this may lead to underes-timation of the estimated CO2 fluxes or other biophysical characteristics of the canopy. Considering that number of spectral measurements taken on field is often limited, the VIs and biophysical parameters estimated with VIs need to be linearly interpolated between campaigns. What is more, relationships between VIs and biophysical characteristics of the canopy (e.g. CO2 fluxes) are developed for sunny and cloudless days when spectral measurements were con-ducted. In consequence, this may lead to overestimation of the estimated parameters for cloudy days. Besides, due to linear interpolation, it is not possible to reflect daily dyna- mics of the estimated variables. Nevertheless, despite all of the weaknesses of such analyses, considering the results presented in this study, VIs are good proxies of the CO2
fluxes exchanged between the canopies and the atmosphere and allow estimation of NEP and GEP with acceptable uncertainty.
However, we have to emphasise that the analyses performed in the paper are based on the point-based mea-surements and hence they cannot reflect the full spectrum of VIs variability on a field scale. Besides, we need to con-sider the site-specific conditions (e.g. soil), fertilization level, management practices, and local climate, which may significantly modify both fluxes and spectral characteristics of crops. Considering the above, the relationships estimat-ed in the paper, although they can be good proxies for NEP and GEP, should not be extrapolated for other sites with other types of soils and climate.
CONCLUSIONS
1. Models based on spectral vegetation indices cal-culated based on radiation in the ranges of reflectance measurements acquired and near-infrared proved to be
Fig. 5. NEPd (A) and GEPd (B) estimated for different crops based on the chamber model (grey line) and the spectral model (black line).
T a b l e 3. A comparison of cumulative NEP and GEP values (kg CO2-C m-2) for the analysed crop species for the period from 18th April to 14th August of 2012: chamber model (A) and spectral model (B)
CropNEP GEP
A B A B
Winter wheat 0.25 0.13 1.20 0.74
Winter rye 0.28 0.50 1.34 1.17
Spring barley 0.02 0.25 0.73 0.71
Potato 0.20 0.30 0.72 0.78

CO2 EXCHANGE BETWEEN CROPS AND ATMOSPHERE 429
highly suitable for the estimation of seasonal fluctuations of daily sums of net and gross ecosystems productivity for crop species. Photochemical reflectance index turned out to be a much less suitable index for the estimation of these characteristics.
2. The effect of the soil background turned out to be an important factor disturbing the accuracy of models based on spectral vegetation indices. These effects are partly eliminated thanks to the application of soil adjusted vege-tation index and optimised soil adjusted vegetation index, which were the best at the estimation of carbon dioxide fluxes exchanged between crops and the atmosphere for the crops analysed in this study.
3. The accuracy of models based on spectral indices was also affected by the effect of the vegetation indices saturation at high densities of vegetation canopy. For the crops analysed in this study, the reduced accuracy of the models caused by the saturation effect is still lower than its reduction as a result of the disturbing effects of the soil background. The boundary values of daily sums of net and gross ecosystems productivity, which when exceeded resulted in the spectral data saturation effect, were reached solely in the case of winter rye.
4. Overall, models based on values of spectral vegeta-tion indices provide elevated values of daily sum of net ecosystem productivity while differences in daily sum of gross ecosystem productivity estimated based on vege-tation indices and chamber model were not significant (besides winter wheat). Hence, we proved that for the crops considered in this study spectral vegetation indices are good proxies of daily sum of gross ecosystem produc- tivity, and daily sum of net ecosystem productivity, although in the latter case fluxes are estimated with higher uncertainty.
ACKNOWLEDGMENT
We would like to acknowledge the support of Karolina Sakowska who conducted the chamber measurements of CO2 fluxes and organized chamber campaigns in 2011-2012.
Conflict of interest: The Authors do not declare con-flict of interest.
REFERENCES
Baret F. and Guyot G., 1991. Potentials and limits of vegetation indices for LAI and APAR assessment. Remote Sensing Environ., 35, 161-173.
Blecharczyk A., 2002. Response of winter rye and spring barley to cropping system and fertilization in long-term experi-ment (in Polish). In: Roczniki Akademii Rolniczej w Poznaniu (Eds Z. Adamski, A. Bereszyński, Z. Fiedorow, M. Klimko, A. Kosturkiewicz, K. Magnuski, A. Mocek, W. Prądzyński, W. Uchman, W. Wielicki). University of Agriculture August Cieszkowski Press, Poznań, Poland.
Boelman N., Stieglitz M., Rueth H.M., Sommerkorn M., Griffin K.L., Shaver G.R., and Gamon J.A., 2003. Response of NDVI, biomass, and ecosystem gas exchange to long-term warming and fertilization in wet sedge tundra. Oecologia, 135, 414-421.
Borge N.H. and Leblanc E., 2001. Comparing prediction power and stability of broadband and hyper spectral vegetation indices for estimation of green leaf area index and canopy chlorophyll density. Remote Sensing Environ., 76, 156-172.
Brantley S.T., Zinnert J.C., and Young D.R., 2011. Application of hyperspectral vegetation indices to detect variations in high leaf area index temperate shrub thicket canopies. Remote Sensing Environ., 115, 514-523.
Carlson T.N. and Ripley D.A., 1997. On the ralation between NDVI, fractional vegetation cover, and leaf area index. Remote Sensing Environ., 62, 241-252.
Chen J.M., 1996. Evaluation of vegetation indices and modified simple ratio for boreal applications. Canadian J. Remote Sensing, 22, 229-242.
Cheng Y., Middleton E.M., Hilker T., Coops N.C., Black T.A., and Krishnan P., 2009. Dynamics pf spectral bio-indica-tors and their correlations with light use efficiency using directional observations at a Douglas-fir forest. Meas. Sci. Technol., 20, 095107, doi: 10.1088/0957-0233/20/9/095107.
Chojnicki B., Michalak M., Acosta M., Juszczak R., Augustin J., Droesler M., and Olejnik J., 2010. Measurements of carbon dioxide fluxes by chamber method at the Rzecin wetland ecosystem, Poland. Polish J. Environ. Studies, 19, 283-291.
Coops N.C., Hilker T., Hall F.G., Nichol C.J., and Drolet G.G., 2010. Estimation of light-use efficiency of terrestrial eco-systems from space: A Status Report. BioScience, 60(10), 788-797.
Dagg J. and Lafleur P., 2010. An application of plot-scale NDVI in predicting carbon dioxide exchange and leaf area index in heterogeneous subarctic tundra. Canadian J. Remote Sensing, 36, 111-123.
Daughtry C.S.T., Walthall C.L., Kim M.S., Brown de Colstoun E., and McMourtney III J.E., 2000. Estimating corn leaf chlorophyll concentration from leaf and canopy reflectance. Remote Sensing Environ., 74, 229-239.
Drösler M., 2005. Trace gas exchange and climatic relevance of bog ecosystem, Southern Germany. Ph.D. Dissertation, Lehrstuhl für Vegetationsokologie, Department für Ökologie, Technischen Universität München, Germany.
Eickenscheidt T., Heinichen J., and Droesler M., 2015. The greenhouse gas balance of a drained fen peatland is mainly controlled by land-use rather than soil organic carbon con-tent. Biogeosciences, 12, 5161-5184.
Filela L., Amaro J.L., and Penuelas J., 1996. Relationship between photosynthetic radiation-use efficiency of barley canopies and the photochemical reflectance index (PRI). Physiologia Plantarum, 96, 211-216.
Flowers M., Weisz R., and Heiniger R., 2001. Remote sensing of winter wheat tiller density for early nitrogen application decisions. Agronomy J., 93, 783-789.
Gamon J.A., Penuelas J., and Field C.B., 1992. A narrow-wave-band spectral index that tracks diurinal changes in photosynthetic efficiency. Remote Sensing Environ., 41, 35-44.
B. UŹDZICKA et al.430
Gamon J.A., Serrano L., and Surfus J.S., 1997. The photo-chemical reflectance index: an optical indicator of photosynthetic radiation use efficiecy across species, func-tional types, and nutrient levels. Oecologia, 112, 492-501.
Gamon J.A. and Surfus J.S., 1999. Assesing leaf pigment con-tent and activity with a reflectometer. New Phytologist, 143, 105-117.
Garbulsky M.F., Penuelas J., Gamon J., Inoue Y., and Filella I., 2011. The photochemical reflectance index (PRI) and the remote sensing of leaf, canopy and ecosystem radiation use efficiencies: A review and meta-analysis. Remote Sens. Environ., 115(2), 281-297.
Gitelson A.A., 2004. Wide dynamic range vegetation index for remote quantification of biophysical characteristics of ve- getation. J. Plant Physiology, 161, 165-173.
Gitelson A.A., Vina A., Masek J.G., Verma S.B., and Suyker A.E., 2008. Synoptic monitoring of gross primary productivity of maize using Landsat data. IEEE Geoscience Remote Sensing Letters, 5, 133-137.
Gitelson A.A., Peng Y., Masek J.G., Rundquist D., Verma S., Suyker A., Baker J.M., Hatfield J.L., and Meyers T., 2012. Remote estimation of crop gross primary production with Landsat data. Remote Sensing Environ., 121, 404-414.
Glenn E.P., Huete A.R., Nagler P.L., and Nelson S.G., 2008. Relationship between remotely-sensed vegetation indices, canopy attributes and plant physiological processes: What vegetation indices can and cannot tell us about the Landscape. Sensors, 8, 2136-2160.
Goerner A., Reichstein M., Tomelleri E., Hanan N., Rambal S., Papale D., Dragoni D., and Schmullius C., 2011. Remote sensing of ecosystem light use efficiency with MODIS-based PRI. Biogeosciences, 8, 189-202.
Goulden M.L., Munger J.W., Fan S.M., Daube B.C., and Wofsy S.C., 1996. Measurement of carbon storage by long term eddy correlation: method and critical assessment of accuracy. Global Change Biology, 2, 169-182.
Grace J., Nichol C.J., Disney M., Lewis P., Quaife T., and Bowyer P., 2007. Can we measure terrestrial photosynthe-sis from space directly, using spectral reflectance and fluorescence? Global Change Biol., 13, 1484-1497.
Haboudane D., Miller J.R., Tremblay N., Zarco-Tejada P.J., and Dextraze L., 2002. Integrated narrow-band vegetation indices for prediction of crop chlorophyll content for appli-cation to precision agriculture. Remote Sensing Environ., 81, 416-426.
Hall F.G., Hilker T., Coops N.C., Lyapustin A., Huemmrich K.F., Middleton E., Margolis H., Drolet G., and Black T.A., 2008. Multi-angle remote sensing of forest light use efficiency by observing PRI variation with canopy shadow fraction. Remote Sensing Environ., 112, 3201-3211.
Harris A. and Dash J., 2010. The potential of the MERIS Terrestrial Chlorophyll Index for carbon flux estimation. Remote Sensing Environ., 114, 1856-1862.
Hassan Q.K., Bourque C.P.A., and Meng F.R., 2006. Estimation of daytime net ecosystem CO2 exchange over balsam fir forests in eastern Canada: combining averaged tower-based flux measurements with remotely sensed MODIS data. Canadian J. Remote Sensing, 32, 405-416.
Huete A.R., 1988. A Soil-adjusted vegetation index (SAVI). Remote Sensing Environ., 25, 295-309.
Ide R., Nakaji T., and Oguma H., 2010. Assessment of canopy photosynthetic capacity and estimation of GPP by using spectral vegetation indices and the light-response function in a larch forest. Agricultural Forest Meteorology, 150, 389-398.
Jackson R.D. and Huete A.R., 1991. Interpreting vegetation indices. Preventive Veterinary Medicine, 11, 185-200.
Jordan C.F., 1969. Derivation of leaf area index from quality of light on the forest floor. Ecology, 50, 663-666.
Juszczak R., Acosta M., and Olejnik J., 2012. Comparison of daytime and nighttime Ecosystem Respiration measured by the closed chamber technique on a temperate mire in Poland. Polish J. Environ. Studies, 21, 643-658.
Juszczak R., 2013. Biases in methane chamber measurements in peatlands. Int. Agrophys., 27, 159-168
Juszczak R., Humphreys E., Acosta M., Michalak-Galczewska M., Kayzer D., and Olejnik J., 2013. Ecosystem respira-tion in a heterogeneous temperate peatland and its sensitivity to peat temperature and water table depth. Plant Soil, 366, 505-520.
Kirschbaum M.U.F., Eamus D., Gifford R.M., Roxburgh S.H., and Sands P.J., 2001. Definitions of some ecological terms commonly used in carbon accounting. Cooperative Research Centre for Greenhouse Accounting, Canberra, Australia, 2-5.
Law B.E., Falge E., Gu L., Baldocchi D.D., Bakwin P., Berbigier P., Davis K., Dolman A.J., Falk M., Fuentes J.D., Goldstein A., Granier A., Grelle A., Hollinger D., Janssens I.A., Jarvis P., Jensen N.O., Katul G., Mahli Y., Matteucci G., Meyers T., Monson R., Munger W., Oechel W., Olson R., Pilegaard K., Paw U K.T., Thorgeirsson H., Valentini R., Verma S., Vesala T., Wilson K., and Wofsy S., 2002. Environmental controls over carbon dioxide and water vapor exchange of terrestrial vegetation. Agricultural Forest Meteorology, 113, 97-120.
Liang S., 2004. Quantitive remote sensing of land surfaces. New Jersey, Wiley-Interscience, USA.
Lloyd J. and Taylor J.A., 1994. On the temperature dependence of soil respiration. Functional Ecology, 8, 315-323.
Louis J., Aurela M., Ounis A., Ducruet J., Evain S., Laurila T., Thum T.,Wingsle G., Alonso L., and Pedros R., 2005. Remote sensing of sunlight-induced chlorophyll fluores-cence and reflectance of Scots pine in the boreal forest during spring recovery. Remote Sens. Environ., 96, 37-48.
Mandal U.K., Victor U.S., Srivastava N.N., Sharma K.L., Ramesh V., Vanaja M., Korwar G.R., and Ramakrishna Y.S., 2007. Estimating yield of Sorghum using root zone water balance model and spectral characteristics of crop in dryland Alfisol. Agricultural Water Manag., 87, 315-327.
Meroni M., Barducci A., Cogliati S., Castagnoli F., Rossini M., Busetto L., Migliavica M., Cremonese E., Galvagno M., Colombo R., and di Cella U.M., 2011. The hyperspectral irradiometer, a new instrument for long-term and unattend-ed field spectroscopy measurements. Rev. Sci. Instrum., 82, 043106, doi: 10.1063/1.3574360.
Michaelis L. and Menten M.L., 1913. Die Kinetik der Inver- tinwirkung. Biochem., 49, 333-369.
Middleton E.M., Cheng Y.B., Hilker T., Black T.A., Krishnan P., Coops N.C., and Huemmrich K.F., 2009. Linking foliage spectral responses to canopy-level ecosystern photo- synthetic light-use efficiency at a Douglas-fir forest in Canada. Can. J. Remote Sens., 35, 166-188.

CO2 EXCHANGE BETWEEN CROPS AND ATMOSPHERE 431
Migliavacca M., Perez-Priego O., Rossini M., El-Madany T., Moreno G., van der Tol Ch., Rascher U., Berninger A., Bessenbacher V., Burkart A., Carrara A., Fava F., Guan J.-H., Hammer T., Henkel K., Juarez-Alcalde E., Julitta T., Kolle O., Pilar Martin M., Musavi T., Pacheco-Labrador J., Perez-Burgueno A., Wutzler T., Zaehle S., and Reichstein M., 2017. Plant functional traits and cano-py structure control the relationship between photosynthetic CO2 uptake and far-red sun-induced fluorescence in a Medi- terranean grassland under different nutrient availability. New Phytologist, doi: 10.1111/nph.14437
Moncrieff J.B., Mahli Y., and Leuning A., 1996. The propaga-tion of errors in long term measurements of land atmosphere fluxes of carbon and water. Global Change Biology, 2, 231-240.
Monteith J.L., 1972. Solar radiation and productivity in tropical ecosystems. J. Appl. Ecology, 9, 747-766.
Monteith J.L., 1977. Climate and efficiency of crop production in Britain. Philos. T. Roy. Soc. B, 281, 271-294.
Nakaji T., Ide R., Oguma H., Saigusa N., and Fujinuma Y., 2007. Utility of spectral vegetation index for estimation of gross CO2 flux under varied sky conditions. Remote Sensing Environ., 109, 274-284.
Nakaji T., Ide R., Takagi K., Kosugi Y., Ohkubo S., Nasahara K.N., Saigusa N., and Oguma H., 2008. Utility of spectral vegetation indices for estimation of light convertion effi-ciency in coniferous forests in Japan. Agricultural Forest Meteorology, 148, 776-787.
Panda S.S., Ames D.P., and Panigrahi S., 2010. Application of vegetation indices for agricultural crop yield prediction using neural network techniques. Remote Sensing, 2, 673-696.
Penuelas J., Filella I., and Gamon J.A., 1995. Assessment of photosynthetic radiation-use efficiency with spectral reflec-tance. New Phytol., 131, 291-296.
Penuelas J., Pinol J., Ogaya R., and Fillela I., 1997. Estimation of plant water concentration by the reflectance Water Index WI (R900/R970). Int. J. Remote Sensing, 18, 2869-2875.
Perez-Priego O., Guan J., Rossini M., Fava F., Wutzler T., Moreno G., Carvalhais N., Carrara A., Kolle O., Julitta T., et al. 2015. Sun-induced chlorophyll fluorescence and photochemical reflectance index improve remote-sensing gross primary production estimates under varying nutrient availability in a typical Mediterranean savanna ecosystem. Biogeosciences, 12, 6351-6367.
Propastin P. and Kappas M., 2009. Modeling net ecosystem exchange for grassland in Central Kazakhstan by combin-ing remote sensing and field data. Remote Sensing, 1, 159-183.
Qi J., Chehbouni A., Huete A.R., and Kerr Y.H., 1994. Modified soil-adjusted vegetation index (MSAVI). Remote Sensing Environ., 48, 119-126.
Rondeaux G., Steven M., and Baret F., 1996. Optimization of soil-adjusted vegetation indices. Remote Sensing Environ., 55, 95-107.
Rossini M., Meroni M., Migliavacca M., Manca G., Cogliati S., Busetto L., Picchi V., Cescatti A., Seufert G., and Colombo R., 2010. High resolution field spectroscopy measurements for estimating gross ecosystem production in a rice field. Agric. Forest Meteorol., 150, 1283-1296.
Rossini M., Cogliati S., Meroni M., Migliavacca M., Galvagno M., Busetto L., Cremonese E., Julitta T., Siniscalco C., Morra di Cella U., and Colombo R., 2012. Remote sensing-based estimation of gross primary production in a subalpine grassland. Biogeosciences, 9, 2565-2584.
Rouse J.W., Haas R.H., Schell J.A., and Deering D.W., 1973. Monitoring the vernal advancement and retrogradation (green wave effect) of natural vegetation. Prog. Rep. RSC 1978-1, Remote Sensing Center, Texas A&M Univ., College Station, 93 (NTIS No. E73-106393).
Sakowska K., Vescovo L., Marcolla B., Juszczak R., Olejnik J., and Gianelle D., 2014. Monitoring of carbon dioxide fluxes in a subalpine grassland ecosystem of the Italian Alps using a multispectral sensor. Biogeosciences, 11, 4695-4712.
Sakowska K., Gianelle D., Zaldei A., MacArthur A., Carotenuto F., Miglietta F., Zampedri R., Cavagna M., and Vescovo L., 2015. WhiteRef: A new tower-based hyperspectral system for continuous reflectance measure-ments. Sensors, 15, 1088-1105.
Sakowska K., Juszczak R., and Gianelle D., 2016. Remote sensing of grassland biophysical parameters in the context of the Sentinel 2 satellite mission. J. Sensors, 2016, Article ID 4612809, 16, http://dx.doi.org/10.1155/2016/4612809
Skinner R.H., Wylie B.K., and Gilmanov T.G., 2011. Using normalized difference vegetation index to estimate carbon fluxes from small rotationally grazed pastures. Agronomy J., 103, 972-979.
Stylinski C.D., Gamon J.A., and Oechel W.C., 2002. Seasonal patterns of reflectance indices, carotenoid pigments and photosynthesis of evergreen chaparral species. Oecologia, 131, 366-374.
Suarez L., Zarco-Tejada P.J., Sepulcre-Canto G., P´erez-Priego O., Jim´enez-Munoz J.C., Miller J.R., and Sobrino J., 2008. Assessing canopy PRI for water stress detection with diurnal airborne imagery, Remote Sens. Environ., 112, 560–575.
Tang S., Zhu Q., Wang J., Zhou Y., and Zhao F., 2005. Principle and application of three-band gradient difference vegeta-tion index. Science in China, 48, 241-249.
Urbaniak M., Chojnicki B., Juszczak R., Augustin J., Leśny J., Ziemblińska K., Sakowska K., Siedlecki P., and Olejnik J., 2016. Measuring major components of the car-bon balance. In: Novel Methods for Monitoring and Managing Land and Water Resources in Siberia (Eds L. Mueller, A.K. Sheudshen, F. Eulenstein). Springer Water 2016, ISBN 978-3-319-24409-9 (eBook), 978-3-319-24407-5 (Hardcover) http://www.springer.com/978-3-319- 24407-5, 401-424.
Uździcka B., Juszczak R., Sakowska K., and Olejnik J., 2012. The relationship between LAI and spectral indices of ve- getation based on some species of crop plants (in Polish). Woda-Środowisko-Obszary Wiejskie, 38, 283-311.
Verma S.B., 1990. Micrometeorological methods for measuring surface fluxes of mass and energy. Remote Sensing Rev., 5, 99-115.
Veroustraete F., Patyn J., and Myneni R.B., 1996. Estimating Net ecosystem exchange of carbon using the normalized difference vegetation index and an ecosystem model. Remote Sensing Environ., 58, 115-130.
B. UŹDZICKA et al.432
Wang Q., Tenhunen J., Dinh N.Q., Reichstein M., Vesala T., and Keronen P., 2004. Similarities in ground- and satellite-based NDVI time series and their relationship to physiological activity of a Scots pine forest in Finland. Remote Sensing Environ., 93, 225-237.
Yueting X., Jinling S., and Jindi W., 2008. The temporal chang-ing information extraction on spectral reflectance and growth parameters of typical crops. Int. Archives of the Photogrammetry, Remote Sensing and Spatial Information Sciences 38, Part B7, Beijing, China.
Zarco-Tejada P.J., Ustin S.L., and Whiting M.L., 2005. Temporal and spatial relationships between within-field yield variability in cotton and high spatial hyperspectral remote sensing imagery. Agronomy J., 97, 641-653.
Zhang Q., Xiao X., Braswell B., Linder E., Baret F., and Moore B., 2005. Estimating light absorption by chlorophyll, leaf and canopy in a deciduous broadleaf forest using MODIS data and a radiative transfer model. Remote Sensing Environ., 99, 357-371.