evaluation the operation of a drip irrigation system …
TRANSCRIPT

Kufa Journal of Engineering
Vol. 7, No. 2, June 2016, P.P. 104-121 Received 2 march 2016, accepted 11 April 2016
EVALUATION THE OPERATION OF A DRIP IRRIGATION
SYSTEM IN DIFFERENT TYPES OF SOIL
Dr. Hassan Ali Omran1, Dr. Ibtisam Raheem Kareem2 and Riyam Sahib Hassan3
1 Building & Construction Eng. Dep., University of Technology, Iraq, Email: [email protected]
2 Building & Construction Eng. Dep., University of Technology, Iraq
3 Building & Construction Eng. Dep., University of Technology, Iraq
ABSTRACT
Drip Irrigation Method is the best method that has been used in the world among the other
irrigation methods because of its good and high uniformity. This method distributes water to
the field using a pipe network and transforms it to the plant by emitters. In spite of the
advantages of drip irrigation method, the system has many problems, such as the impact of soil
type, silt and discharges distribution. To achieve the goals of using a drip irrigation system, it
must be designed and operated properly so that rates and location of delivery of water to the
root zone is suitable for crop requirements. Generally, the criterion for drip irrigation system
operation is based on soil texture. Soil wetting is one of the most important parameters to
determine the deep percolation rate and the efficiency of the system. Knowledge of soil wetting
pattern and its movement plays a large role in deciding depth and spacing of pipes, design of
irrigation scheduling and improving the efficiency of the drip irrigation system.
The objective of this study is to develop an approach to operate the drip irrigation system in
sandy and clay soils by a computerized method regarding the type of crops, its consumptive
use, type of soil, frequency of irrigation and water distribution in the network .The study adopts
two approaches as follows: The field work approach and the theoretical approach. In the field
work approach, soil analysis of the physical and chemical properties of the soil which affect the
soil quality as well as its suitability for growing plants are determined. For the theoretical
approach the well known software CROPWAT is used for the calculation of crop water
requirements and irrigation requirements depending on soil, climate and crop data.
Measurements of the consumptive use, discharge, velocities, wetted soil width, wetted soil
depth, frequency of irrigation for the two types of soil with silt content calculated. The designed
discharge was found to be higher in clay soil than sand soil because it saves the water for a long
time through a small area as it is little porous. Increasing silt rate for each type of soil, cause to
increases the amount of irrigation water requirement. As the wetted soil width depends on
emitter discharge and soil type, it will be increase with soils in high silty clay compared with
the low silt and bigger as compared to sandy soils.
KEYWORDS:
drip irrigation, soil type, CROPWAT, discharge, wetted depth, wetted width, frequency of
irrigation.

Kufa Journal of Engineering, Vol. 7, No. 2, 2016 105
ييم تشغيل منظومات الري بالتنقيط في ترب مختلفهقت
ريام صاحب حسنو ابتسام رحيم كريمو حسن علي عمران
التكنولوجيةقسم البناء والانشاءات، الجامعة
الخلاصة
تهاجودل نظرابين أساليب الري الأخرى من طرق التي تم استخدامها في العالم الأفضل منطريقة الري بالتنقيط تعتبر
ل مياه الري الى اتتولى ايصمنقطات ترتبط بها توزع المياه إلى الحقل باستخدام شبكة أنابيب المياه . اذ يتم وانتظامية توزيع
.اتجذور النبات
النظام له العديد من المشاكل، مثل تأثير نوع التربة و الطمي وتوزيع الا انعلى الرغم من مزايا طريقة الري بالتنقيط ،
كون تلتحقيق أهداف عالية باستخدام نظام الري بالتنقيط ، يجب أن يتم تصميمها و تشغيلها بشكل صحيح بحيث والتصريف .
نطقة الجذر مناسبة لمتطلبات المحاصيل. ويستند المعيار لتشغيل نظام الري بالتنقيط على معدلات وموقع توصيل المياه إلى م
، وتصميم ن الأنابيببيمعرفة نمط ترطيب التربة و حركتها يلعب دورا كبيرا في تحديد العمق والتباعد اذ أن قوام التربة .
بالتنقيط. لريا نظام كفاءة وتحسين الري جدولة
نهج لتشغيل نظام الري بالتنقيط في التربة الرملية والطينية بطريقة كفوءة حسب نوع مالهدف من هذه الدراسة هو وضع أن
علىة الدراس اذ اعتمدت المحاصيل ، والاستهلاك المائي ، ونوع التربة ، والفترة بين الريات و توزيع المياه في الشبكة.
لتربة لتحليل الخصائص الفيزيائية والكيميائية تمالعمل الميداني ، ففيالنظري . لجانبالعمل الميداني وا هما , نهجين م
وهو من CROPWATتم استخدام برنامج فقثد النظريانب جال أما فيوالتي تؤثر على مدى ملاءمتها لنمو النباتات .
ضافة ا التربة والمناخ و المحاصيل. ، البرامج المعروفة لحساب الاحتياجات المائية للمحاصيل ومتطلبات الري طبقا لنوع
. ، عمق التربة المبللة ، الفترة بين الريات لنوعي التربة عرض التربة الى
تم تحديد التصاريف التصيمية والتي وجد بانها تكون أعلى في التربة الطينية من التربة الرملية لقابليتها على حفظ الماء لفترة
يعتمد فعرض وعمق التربة المبللة أمارين لكل نوع من أنواع التربة، يزيد من كمية مياه الري .طويلة كما ان زيادة معدل الغ
على تصريف المنقط و نوع التربة ، حيث انه يكون اكثر في التربة الطينية ذات نسبة الغرين العالية مقارنة مع التربة
الرملية.

106 Hassan A. Omran et.al.
1. INTRODUCTION:
Drip, or trickle irrigation, is a type of irrigation that slowly applies small amounts of water to
part of the plant root zone. Water is applied frequently, often daily, to maintain a favorable soil
moisture condition and prevents moisture stress in the plant. When compared with the other
irrigation systems, drip irrigation accomplishes this process more efficiently. Furthermore, it
requires less water and less labor than other forms of irrigation (Broner, 1998). The system has
been used since ancient times. Modern drip irrigation has arguably become the world's most
valued innovation in agriculture. Careful study of all the relevant factors like land topography,
soil type, crop and agro-climatic conditions are needed to determine the most suitable drip
irrigation The energy losses due to emitter's connection in trickle irrigation laterals is very
important and have a direct effect on the system (Al-Misned and Ahmed, 2000). This system is
suitable for most soils if it is used in the right way. On clay soils water must be applied slowly
to avoid surface water pounding and runoff. On sandy soils higher emitter discharge rates will
be needed to ensure adequate lateral wetting of the soil. The sensitivity of the flow rate emitters
must be examined to ensure the balance operating under large pressure (Hezarjaribi et al, 2009).
There is an exponential relationship between emission rate and operating pressure which is the
most important affecting factor (Haijum et al, 2009). The wetting patterns which develop from
dripping water onto the soil depend on discharge and soil type. Soil analysis can provide
important information about physical conditions and chemical properties that affect a soils
quality as well as suitability for growing plants .The soil over pressure would act as a regulation
and emitters having large flow rates when placed on the ground surface (Gill et al, 2008). Drip
irrigation may also use devices called micro-spray heads, which spray water in a small area,
instead of dripping emitters. These are generally used on tree and vine crops with wider root
zones. It is becoming popular for row crop irrigation, especially in areas where water supplies
are limited or recycled water is used for irrigation.
2. THE AIMS OF THE STUDY
The present study aims to:
1. Use a computer software for operating a drip irrigation system regarding the type of
crops, its consumptive use, type of soil and field dimensions.
2. Evaluate the effect of soil type on the performance of a drip irrigation system by
monitoring the progress of the wetting front through the soil profile of the two soil types.
3. STUDY AREA
The study area is located in Al-Kut Palms station of Kut Province, (185) Km south of Baghdad.
It located between longitude 43°42ʹ and latitude 31°15ʹ.On the road Kut - Baghdad from the
north side as shown in Fig. 1. Its area is about 323760 m2.
4. EFFECTIVENESS OF SOIL TYPES ON SELECTION OF DRIP IRRIGATION
SYSTEM
For drip irrigation systems to deliver improved water, distance between emitters and emitter
flow rates must be matched to the soil's wetting characteristics and the amount and timing of
water to be supplied to the crop. Broad soil texture ranges (e.g. sand, loam, clay) are usually
the only information related to soil wetting used in drip system designs, Peter J.Thorburn, 2003.
Wetting pattern for different types of soil can be summarized as:
1. Clay soil: It has densely packed particles that have little space for water or air. Water is
absorbed very slowly and runoff can occur if water is applied to quickly. At situation,

Kufa Journal of Engineering, Vol. 7, No. 2, 2016 107
water tends to move outward away from the drip emitter, clay soil will hold water very
well and can stay wet for several days. (http:// plasticulture .cas .psu.edu).
2. Sandy soil: It is very loose and has plenty of space for water or air. Water is absorbed
very quickly and runoff usually doesn’t occur. When wet, water tends to move straight
down through the soil. Sandy soil does not hold water very well and can dry out very
quickly, (http://plasticulture.cas.psu.ed).
3. Loam soil: Drip irrigation system has an ideal state in-between mix of clay and sandy
soil. Its absorption rate is greater than that of clay soil but not as fast as sandy soil. At
situation of wet water will move outward and down more evenly. Loam soil will hold
water well and dry out at a medium rate, (http:// plasticulture. cas.psu.edu).
Fig. 1. Area of study
5. FIELD INVESTIGATIONS
Soil analysis can provide important information regarding the physical and chemical properties
affecting a soils quality and suitability for growing plants. Soil samples were collected from ten
points at the depths of 0 to 30 cm using auger and core sampler. The augured samples were air
dried and ground to pass through a 2 mm-sieve for analysis of the physical and chemical
parameters.
Soil of the study area was tested in the engineering Andrea laboratory of Kut Province.
1. Physical soil testing: Physical soil testing is the process of analyzing the gravel, sands,
and amendments, used in green construction to determine many factors such as soil
texture, moisture content, bulk density, particle density, porosity and hydraulic
conductivity. Results of physical characteristics are illustrated in Table 1.
2. Chemical Soil Testing: Chemical analysis is the most common method used to assess
the nutrient content (and nutrient needs) of soil. An accurate determination of nutrient
need is possible if two conditions are satisfied: first that the soil sample is truly

108 Hassan A. Omran et.al.
representative of the field to be analyzed; and, second, that the chemical testing method
has been calibrated through enough research to the crops and soils in the area
(Manachini et al., 2009). Chemical analyses were performed for 10 samples taken from
the study area and the results of the parameter were stated in Table 2.
Table 1. Physical characteristics of the soil samples
Sample
Soil Classification (%)
Type
Moisture
content
(%)
Bulk
density 3gm/cm
Particle
density
)3(gm/cm
Porosity
(%)
Saturated
hydraulic
conductivity
Ks
(cm/min)
Clay Loam Sand
A1 43 43 13 Silty Clay 7.11 1.60 2.58 36.82 0.0005
A2 44 39 18 Clay 3.17 1.68 2.56 39.37 0.002
A3 46 16 48 Sandy Clay 2.58 1.48 2.55 40.39 0.0002
A4 50 35 24 Clay 5.14 1.64 2.53 35.59 0.002
A5 44 41 25 Clay 3.21 1.54 2.60 40.76 0.0015
A6 52 39 23 Clay 2.26 1.66 2.54 33.07 0.003
A7 45 33 25 Clay 3.31 1.61 2.70 37.77 0.002
A8 50 22 42 Sandy Clay 6.68 1.58 2.57 35.40 0.001
A9 51 39 28 Clay 3.16 1.56 2.64 40.90 0.001
A10 49 18 36 Clay 10.29 1.67 2.54 33.46 0.001
Table 2. Chemical characteristics of the soil samples
Sample EC
Ds/m
C.E.C.
mol/kg
Na
mmol/l
3HCO
mmol/l
Ca
mmol/l
Mg
mmol/l
Cl
mmol/l PH SAR
A1 5.41 4.28 9.5 2.2 58.4 30.8 27.6 7.42 2.01
A2 4.88 4.28 12 1.4 49.6 24 24.8 7.48 2.80
A2 4.76 2.67 10.6 2 48.8 25.2 22.6 7.40 2.46
A4 5.81 3.74 10.5 2 58.4 36.8 29.9 7.36 2.27
A5 4.78 4.81 9.8 2.4 50.8 25.2 23.1 7.51 2.25
A6 4.60 4.28 11 1.8 49.6 18.4 21.7 7.38 2.91
A7 5.10 5.35 15 2.2 50.4 21.6 23.4 7.47 3.53
A8 4.79 4.81 11.9 1.2 50.4 21.6 23.1 7.75 2.80
A9 5.11 5.35 13.1 2.2 52.4 23.6 23.4 7.18 3.08
A10 4.72 4.28 9.2 2 54 22 19.5 7.26 2.11
6. CONSUMPTIVE USE DETERMINATION
Two types of soil were tested, clay and sand each with different level of silty, the most common
parameter which importance to estimate is the percentage permanent wilting point
(P.W.P.)which can be found as, (Basak,1999):
P.W.P = F.C / f (1)
Where: F.C = field capacity.
f = factor varying from 2 to 2.4 depending upon the amount of silt content

Kufa Journal of Engineering, Vol. 7, No. 2, 2016 109
While the available moisture content (A.M.C), is equal to:
A.M.C = F.C – P.W.P (2)
The depth of water stored in root zone (Dw) (cm), then written as:
Dw = (Ɣ * d / w) (F.C – Optimum moisture) (3)
Where: Ɣ = bulk density (M/L3).
d = root zone depth (L).
w = Specific weight of water.
Optimum moisture = F.C – R.A.M.C
In which R.A.M.C is the readily available moisture content and it is always assumed to 75% of
A.M.C., (Basak, 1999). Field capacity of the study area is found by the soil tests as 7.5% for
sand soil and 36% for clay soil. While the bulk densities of the two types of soils (sand and
clay) considered in the present study are found as 1.55 gm/cm3 and 1.45 gm/cm3, respectively.
Root zone depth varies depending on the type of plant, for the study area 12 croups of plants
are proposed with root zone depths range between (50–200) cm as shown in Table 3
(http://www.fao.org/).
The depth of water stored in root zone (Dw) was found to be higher in clay soil than sand soil
because it is saving the water for long time by little area as it is little porous. Increasing silt rate
for each type of soil, increases the amount of irrigation water to disposal of silt and paid it out
of the plant root zone. Fig. 2 shows the relationship between stored water (Dw) and the root
zone depth of the proposed croups of crops for both sand and clay soils.
Table 3. Values of root zone depth and crop factor for deferent crops, (http://www.fao.org/)
Item Crop Name Root Zone
(d)(cm)
Crop factor
(k)
1 Cabbage 50 1.05
2 Rice, Potato, Small vegetables 60 1.1
3 Green Beans 70 1.05
4 Groundnut Rabi , Pasture
Sweet peppers, Tobacco 80 1.06
5 Artichoke, Dry Beans, Banana 90 1.12
6 Maize, Pulses, Soybean
Sugar beet, Sweet Melon, Tomato 100 1.07
7 Barley 110 1.15
8 Alfalfa, Small Grain
Millet, Spring Wheat 120 1.04
9 San Flower 130 1.15
10 Citrus, Cotton, Sorghum (Grain) 140 0.92
11 Table Grapes, Wine Grapes, Winter
Wheat, Sugarcane (Raton) 150 1.09
12 Mango, Date Plans 200 1.2

110 Hassan A. Omran et.al.
(a)
(b)
Fig. 2. Relationship between water stored in root zone (Dw) and root zone depth (d); a: sandy
soil, b: clay soil
Consumptive irrigation use can be determined using one of several known empirical equations.
In the present study Blaney _Griddle formula was used as: Blaney and Criddle (1962).
Cu = 0.45 K * P (t + 17.8) (4)
Where: Cu = monthly consumptive use (cm).
K = crop factor of plant, (Table 3).
P = monthly percent of annual daylight hours.
t = highest temperature during the month (°C).
Results of the factor (0.45[p (t + 17.8)]) in equation (4) are obtained according to the annual
maximum temperature and sunny hours of Kut Province (Al_Kut Environment Directorate,
2010) as shown in Table 4.
7. DRIP IRRIGATION SYSTEM PARAMETERS USING CROPWAT
7.1. System Discharge (Q)
The daily dripper discharge expressed as the volume of water wetting specified area of soil, is
for clay soil higher than sand soil because of the ability to save water for a long time as shown
in Fig. 3, a and b. The values were found to be in the range of (2.27– 9.12) mm3/s for clay soil
with low silt (f=2) and (2.64–10.6) mm3/s with high silt (f=2.4), while for the sand soil values
of Q ranged between (0.5–2) mm3/s with low salinity (f=2) and (0.6–2.36) mm3/s with high
salinity (f=2.4). Tables 7 and 8 show the values of dripper discharge for the clay and sandy
soils, respectively.
05
101520253035404550
0 50 100 150 200 250
D w
(cm
)
d (cm)
f=2
f=2.4
0
10
20
30
40
50
0 50 100 150 200 250
D w
(cm
)
d (cm)
f=2
f=2.4

Kufa Journal of Engineering, Vol. 7, No. 2, 2016 111
Table 4. Results of the factor (0.45[p (t + 17.8)]) of Kut Province
Month Max Temp.(°c) Percent of Sun Shine hours 0.45(P (t + 17.8))
Jan. 16 6 0.9126
Feb. 19 7.4 1.2254
Mar. 24 8 1.5048
Apr. 31 8.7 1.9105
May 38 9.5 2.3854
Jun. 42 12 3.2292
Jul. 44 12 3.3372
Aug. 44 11.2 3.1147
Sep. 40 10.2 2.6530
Oct. 33 8.5 1.9431
Nov. 28 7.1 1.4633
Dec. 18 6 0.9666
Total 24.6459
(a)
(b)
Fig. 3. Relationship between dripper discharges (Q) and depth of water stored in root zoon
(Dw); a: sandy soil, b: clay soil
0
5
10
15
20
25
30
35
40
45
50
0 2 4 6 8 10 12
Dw
(cm
)
Q (mm3/s)
f=2
f=2.4
0
10
20
30
40
50
0 5 10 15
Dw
(cm
)
Q(mm3/s)
f=2
f=2.4
112 Hassan A. Omran et.al.
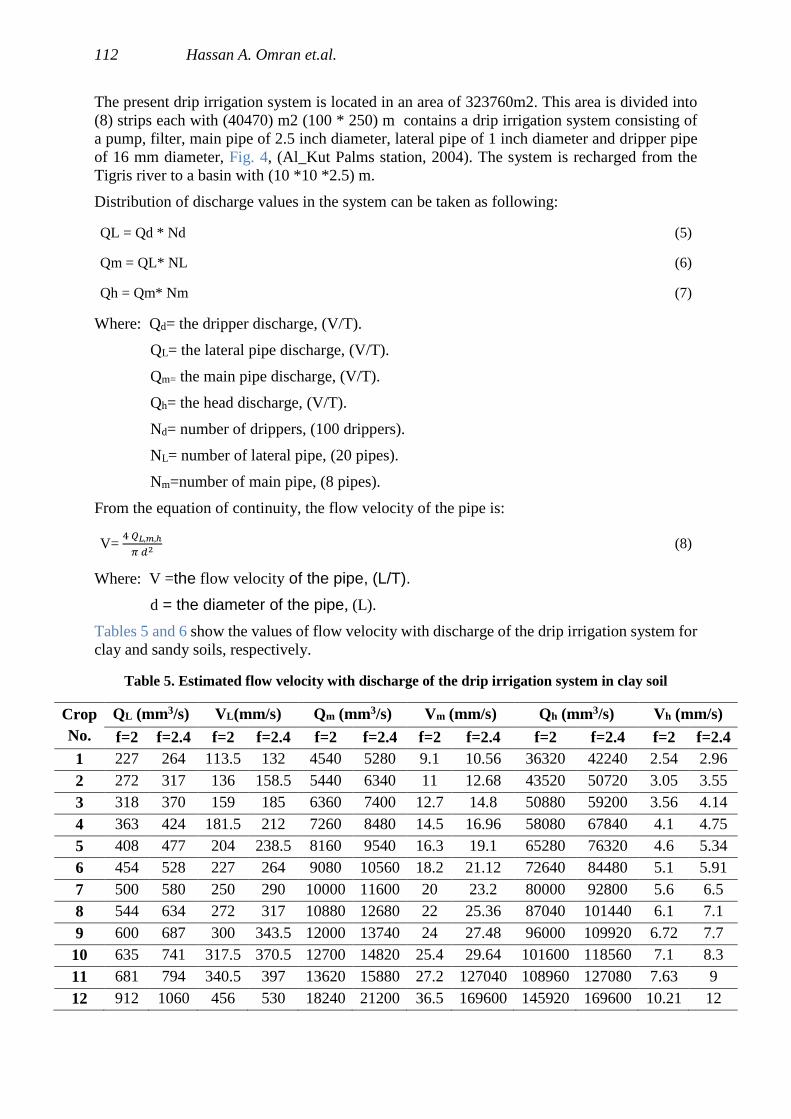
The present drip irrigation system is located in an area of 323760m2. This area is divided into
(8) strips each with (40470) m2 (100 * 250) m contains a drip irrigation system consisting of
a pump, filter, main pipe of 2.5 inch diameter, lateral pipe of 1 inch diameter and dripper pipe
of 16 mm diameter, Fig. 4, (Al_Kut Palms station, 2004). The system is recharged from the
Tigris river to a basin with (10 *10 *2.5) m.
Distribution of discharge values in the system can be taken as following:
QL = Qd * Nd (5)
Qm = QL* NL (6)
Qh = Qm* Nm (7)
Where: Qd= the dripper discharge, (V/T).
QL= the lateral pipe discharge, (V/T).
Qm= the main pipe discharge, (V/T).
Qh= the head discharge, (V/T).
Nd= number of drippers, (100 drippers).
NL= number of lateral pipe, (20 pipes).
Nm=number of main pipe, (8 pipes).
From the equation of continuity, the flow velocity of the pipe is:
V= 4 𝑄𝐿,𝑚,ℎ
𝜋 𝑑2 (8)
Where: V =the flow velocity of the pipe, (L/T).
d = the diameter of the pipe, (L).
Tables 5 and 6 show the values of flow velocity with discharge of the drip irrigation system for
clay and sandy soils, respectively.
Table 5. Estimated flow velocity with discharge of the drip irrigation system in clay soil
Crop
No.
/s)3(mm LQ (mm/s)LV /s)3(mm mQ (mm/s) mV /s)3(mm hQ (mm/s) hV
f=2 f=2.4 f=2 f=2.4 f=2 f=2.4 f=2 f=2.4 f=2 f=2.4 f=2 f=2.4
1 227 264 113.5 132 4540 5280 9.1 10.56 36320 42240 2.54 2.96
2 272 317 136 158.5 5440 6340 11 12.68 43520 50720 3.05 3.55
3 318 370 159 185 6360 7400 12.7 14.8 50880 59200 3.56 4.14
4 363 424 181.5 212 7260 8480 14.5 16.96 58080 67840 4.1 4.75
5 408 477 204 238.5 8160 9540 16.3 19.1 65280 76320 4.6 5.34
6 454 528 227 264 9080 10560 18.2 21.12 72640 84480 5.1 5.91
7 500 580 250 290 10000 11600 20 23.2 80000 92800 5.6 6.5
8 544 634 272 317 10880 12680 22 25.36 87040 101440 6.1 7.1
9 600 687 300 343.5 12000 13740 24 27.48 96000 109920 6.72 7.7
10 635 741 317.5 370.5 12700 14820 25.4 29.64 101600 118560 7.1 8.3
11 681 794 340.5 397 13620 15880 27.2 127040 108960 127080 7.63 9
12 912 1060 456 530 18240 21200 36.5 169600 145920 169600 10.21 12

Kufa Journal of Engineering, Vol. 7, No. 2, 2016 113
Table 6. Estimated flow velocity with discharge of the drip irrigation system in sandy soil
Crop
No.
/s)3(mmLQ (mm/s)LV /s)3(mm mQ (mm/s) mV /s)3(mm hQ (mm/s) hV
f=2 f=2.4 f=2 f=2.4 f=2 f=2.4 f=2 f=2.4 f=2 f=2.4 f=2 f=2.4
1 50 60 25 30 1000 1200 2 2.4 8000 9600 0.56 0.7
2 60 71 30 35.5 1200 1420 2.4 2.84 9600 11360 0.67 0.8
3 70 83 35 41.5 1400 1660 2.8 3.32 11200 13280 0.8 0.93
4 80 49 40 47 1600 1880 3.2 3.76 12800 15040 1 1.1
5 91 106 45.5 53 1820 2120 3.64 4.24 14560 16960 1.02 1.2
6 101 118 50.5 59 2020 2360 4.04 4.72 16160 18880 1.13 1.32
7 111 130 55.5 65 2220 2600 4.44 5.2 17760 20800 1.243 1.46
8 121 142 60.5 71 2420 2840 4.84 5.68 19360 22720 1.355 1.6
9 131 153 65.5 76.5 2620 3060 5.24 6.12 20960 24480 1.47 1.71
10 141 165 70.5 82.5 2820 3300 5.64 6.6 22560 26400 1.6 1.85
11 150 180 75 90 3000 3600 6 7.2 24000 28800 1.7 2
12 200 236 100 118 4000 4720 8 9.44 32000 37760 2.24 2.64
Table 7. Results of discharge, wetted soil width, wetted soil depth, frequency of irrigation for
clay soil and consumptive use
Crop
No.
Dw (cm) /s)3(mm dQ W (m) D (m) Fw (day) Cu
(cm/month) f=2 f=2.4 f=2 f=2.4 f=2 f=2.4 f=2 f=2.4 f=2 f=2.4
1 9.8 11.4 2.27 2.64 0.056 0.06 0.088 0.095 1.14 1.32 25.878
2 11.76 13.7 2.72 3.17 0.062 0.067 0.1 0.107 1.3 1.52 27.111
3 13.72 16 3.18 3.7 0.068 0.073 0.11 0.12 1.6 1.85 25.878
4 15.68 18.3 3.63 4.24 0.073 0.08 0.121 0.131 1.8 2.1 26.125
5 17.64 20.6 4.08 4.77 0.078 0.084 0.131 0.142 1.92 2.24 27.604
6 19.6 22.8 4.54 5.28 0.083 0.09 0.141 0.152 2.23 2.6 26.371
7 21.56 25 5 5.8 0.087 0.094 0.15 0.162 2.28 2.65 28.343
8 23.52 27.4 5.44 6.34 0.092 0.1 0.16 0.172 2.75 3.21 25.632
9 25.48 29.7 6 6.87 0.097 0.103 0.17 0.181 2.7 3.14 28.343
10 27.44 32 6.35 7.41 0.1 0.108 0.177 0.191 3.63 4.23 22.674
11 29.4 34.3 6.81 7.94 0.104 0.11 0.185 0.2 3.3 3.83 26.864
12 39.4 45.7 9.12 10.6 0.123 0.132 0.226 0.24 4 4.64 29.575

114 Hassan A. Omran et.al.
Table 8. Results of discharge, wetted soil width, wetted soil depth and frequency of irrigation for
sandy soil
Crop
No.
Dw (cm) /s)3(mm dQ W (m) D (m) Fw (day)
f=2 f=2.4 f=2 f=2.4 f=2 f=2.4 f=2 f=2.4 f=2 f=2.4
1 2.55 2.175 0.5 0.6 0.026 0.03 0.041 0.045 2.9 2.5
2 3.06 2.61 0.6 0.71 0.03 0.032 0.047 0.051 3.4 3
3 3.57 3.04 0.7 0.83 0.032 0.035 0.052 0.057 4 3.5
4 4.08 3.48 0.8 0.94 0.034 0.037 0.057 0.062 4.8 4
5 4.59 3.92 0.91 1.06 0.037 0.04 0.062 0.067 5 4.3
6 5.1 4.35 1.01 1.18 0.039 0.042 0.066 0.072 5.8 5
7 5.61 4.8 1.11 1.3 0.041 0.045 0.071 0.077 6 5.1
8 6.12 5.22 1.21 1.42 0.043 0.047 0.075 0.081 7.2 6.1
9 6.63 5.65 1.31 1.53 0.045 0.049 0.079 0.086 7 6
10 7.14 6.1 1.41 1.65 0.047 0.051 0.083 0.09 9.4 8
11 7.65 6.5 1.5 1.8 0.05 0.054 0.087 0.095 8.5 7.3
12 10.2 8.7 2 2.36 0.057 0.062 0.106 0.115 10 8.8

Kufa Journal of Engineering, Vol. 7, No. 2, 2016 115
Section (A-A)
Fig. 4. Outline of the drip irrigation system in Kut Province (Al_Kut Palms station, 2004)
7.2. Wetted width (W)
The wetted soil width at the root zone of plants can be determined as: (Phull and Babar, 2012):
W= 3.245 [qw0.5 *d0.065 * t0.435/ks0.065] (9)
Where: W= wetted soil width, (m).
qw =water application rate or discharge rate per unit length of pipe, (m2/s).
116 Hassan A. Omran et.al.
ks = saturated hydraulic conductivity of the soil, (m/s).
d = Depth of root zone, (m).
t = time of crop irrigation, (s).
Fig. 5 shows wetted soil width of clay and sandy soils in the study area.
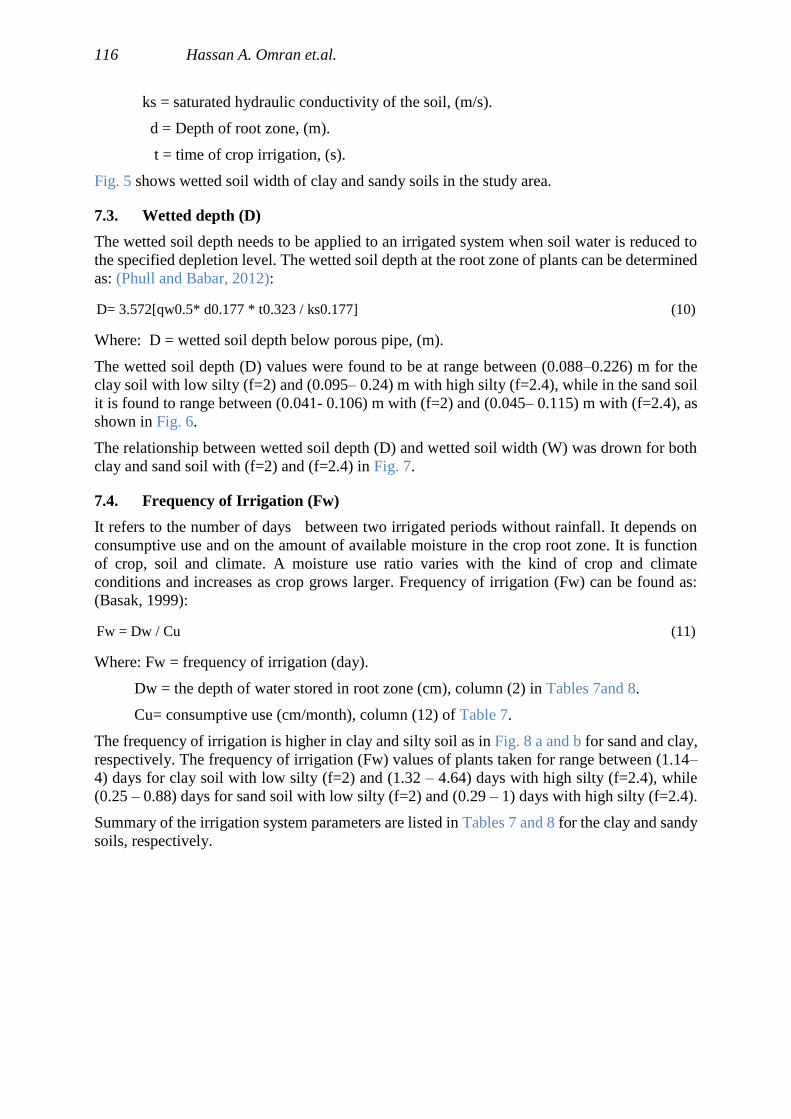
7.3. Wetted depth (D)
The wetted soil depth needs to be applied to an irrigated system when soil water is reduced to
the specified depletion level. The wetted soil depth at the root zone of plants can be determined
as: (Phull and Babar, 2012):
D= 3.572[qw0.5* d0.177 * t0.323 / ks0.177] (10)
Where: D = wetted soil depth below porous pipe, (m).
The wetted soil depth (D) values were found to be at range between (0.088–0.226) m for the
clay soil with low silty (f=2) and (0.095– 0.24) m with high silty (f=2.4), while in the sand soil
it is found to range between (0.041- 0.106) m with (f=2) and (0.045– 0.115) m with (f=2.4), as
shown in Fig. 6.
The relationship between wetted soil depth (D) and wetted soil width (W) was drown for both
clay and sand soil with (f=2) and (f=2.4) in Fig. 7.
7.4. Frequency of Irrigation (Fw)
It refers to the number of days between two irrigated periods without rainfall. It depends on
consumptive use and on the amount of available moisture in the crop root zone. It is function
of crop, soil and climate. A moisture use ratio varies with the kind of crop and climate
conditions and increases as crop grows larger. Frequency of irrigation (Fw) can be found as:
(Basak, 1999):
Fw = Dw / Cu (11)
Where: Fw = frequency of irrigation (day).
Dw = the depth of water stored in root zone (cm), column (2) in Tables 7and 8.
Cu= consumptive use (cm/month), column (12) of Table 7.
The frequency of irrigation is higher in clay and silty soil as in Fig. 8 a and b for sand and clay,
respectively. The frequency of irrigation (Fw) values of plants taken for range between (1.14–
4) days for clay soil with low silty (f=2) and (1.32 – 4.64) days with high silty (f=2.4), while
(0.25 – 0.88) days for sand soil with low silty (f=2) and (0.29 – 1) days with high silty (f=2.4).
Summary of the irrigation system parameters are listed in Tables 7 and 8 for the clay and sandy
soils, respectively.

Kufa Journal of Engineering, Vol. 7, No. 2, 2016 117
(a)
(b)
Fig. 5. Relationship between wetted soil width (W) and dripper discharge (Q); a: sandy soil, b:
clay soil
0
0.02
0.04
0.06
0.08
0.1
0.12
0.14
0 2 4 6 8 10 12
W (
m)
Q (mm3/s)
f=2
f=2.4
0
0.02
0.04
0.06
0.08
0.1
0.12
0.14
0 2 4 6 8 10 12
W (
m)
Q (mm3/s)
f=2
f=2.4

118 Hassan A. Omran et.al.
(a)
(b)
Fig. 6. Relationship between wetted soil depth (D) and dripper discharge (Q); a: sandy soil, b:
clay soil
0
0.05
0.1
0.15
0.2
0.25
0.3
0 2 4 6 8 10 12
D (
m)
Q (mm3/s)
f=2
f=2.4
0
0.05
0.1
0.15
0.2
0.25
0.3
0 2 4 6 8 10 12
D (
m)
Q (mm3/s)
f=2
f=2.4

Kufa Journal of Engineering, Vol. 7, No. 2, 2016 119
(a)
(b)
Fig. 7. Relationship between wetted soil depth (D) and wetted soil width (W); a: sandy soil, b:
clay soil
0
0.05
0.1
0.15
0.2
0.25
0.3
0 0.05 0.1 0.15
D (
m)
W (m)
f=2
f=2.4
0
0.05
0.1
0.15
0.2
0.25
0.3
0 0.05 0.1 0.15
D (
m)
W (m)
f=2
f=2.4

120 Hassan A. Omran et.al.
(a)
(b)
Fig. 8. Relationship between frequency of irrigation (fw) and dripper discharge (Q); a: sandy
soil, b: clay soil
8. CONCLUSIONS
From the information collected during this study, and from the analysis of results, the
following conclusions are drawn:
1. The designed discharge of the drip irrigation was found to be higher in the clay soil than
in the sand soil because it is dominated by large pores compared with fine texture clay
soil. Increasing silt rate for each type of soil, increases the amount of irrigation water
requirement.
2. Flow velocity should be kept low, whenever the pipe diameter of irrigation system
increase, this is to avoid water hammer problems in pipelines.
0
0.5
1
1.5
2
2.5
3
3.5
4
4.5
5
0 2 4 6 8 10 12
Fw (
day
)
Q (mm3/s)
f=2
f=2.4
0
0.5
1
1.5
2
2.5
3
3.5
4
4.5
5
0 2 4 6 8 10 12
Fw (
day
)
Q (mm3/s)
f=2
f=2.4

Kufa Journal of Engineering, Vol. 7, No. 2, 2016 121
3. The wetted soil width depends on emitter discharge and soil type, it will increase with
soils of high silt compared with those of low silt.
4. The wetted soil depth for clay soil is higher than sand soil as it ability to save the water
for long time, with high silt.
5. The frequency of irrigation is higher in high silty clay soil than in sandy soil, the latter
rapidly drained the water, so it needs more irrigation periods.
9. REFERENCES
Al_Kut Environment Directorate, 2010, a project to measure the annual temperatures for Wasit
province, Al_Kut province.
Al_Kut Palms station, 2004, a project to develop palm planting in the Wasit province, Al_Kut
province.
Al-Misned, Ahmeds, 2000, "effect of energy loss due to emitters on the design of trickle
irrigation laterals" , Soil science , King sand <University Riyadh , Saudi Arabic
Basak, N.N, 1999, “Irrigation Engineering”, Tata McGraw-Hill Publishing Co. New Delhi.
Blaney, H.F. and Criddle, W.D., 1962, “Determining consumptive use and irrigation water
requirements”, United States Department of Agriculture, Agricultural Research Service Tech
Bull 1275. 59p.
Broner, I., 1998 "Drip irrigation of home garden", Colorado State University Cooperative
Extension publication.
Food and Agriculture Organization of the United Nation: CROPWAT 8.0,
http://www.fao.org/.
Gil , M. , Rodriguez-Sinoloas ,L , Juana L , Sandez and Lasada A ,2008 "Emitter discharge
variability of sub-surface drip irrigation in uniform soils" Irrigation Science 26, pp 451-458
Huijun , L , Zuoxin , L ,Qiaosheng ,S , and Guarghua, Y ,2009 " Effect of Operating Pressure
in the Discharge Characteristics of Porous Pipes as Micro-Irrigation Laterals" Transaction of
CSAE , 1002-6819-20001-05
Hezarjaribi A , Dehghari , A ,A. , Mcfath M .,and Kini , A , 2000 " Hydraulic Performance of
Various Trickle Irrigation Emitters" , Journal of Agronomy ,7(3), pp265-271
Manachini B., Corsini A. and Bocchi S., 2009, “Soil quality indicator as affected by a long term
barley-maize a cropping systems”, Italian J. Agron. 1(15):15-22.
Penn State University, 2003, “ Drip Irrigation. Discussion of advantages/disadvantages of drip
and links to Plasticulture Research
Phull, A. M. and Babar, M. M., 2012, “Simulation of soil wetting pattern of subsurface drip
irrigation system”, Sixteenth International Water Technology Conference, IWTC 16, Istanbul,
Turkey.