evaluation of the root zone water quality model for predicting water and no3–n movement in an iowa...
TRANSCRIPT

Evaluation of the root zone water quality model for predicting
water and NO3±N movement in an Iowa soil1
Ajay Kumara,*, R.S. Kanwara, P. Singha, L.R. Ahujab
aDepartment of Agricultural and Biosystems Engineering, Iowa State University, Ames, IA 50011, USAbUSDA-ARS Great Plains Research System Unit, Ft. Collins, CO, USA
Accepted 29 November 1998
Abstract
Evaluation of computer models with ®eld data is required before they can be effectively used for predicting agricultural
management systems. A study was conducted to evaluate tillage effects on the movement of water and nitrate±nitrogen (NO3±
N) in the root zone under continuous corn (Zea mays L.) production. Four tillage treatments considered were: chisel plow
(CP), moldboard plow (MP), no-tillage (NT), and ridge-tillage (RT). The root zone water quality model (RZWQM: V.3.25)
was used to conduct these simulations. Three years (1990±1992) of ®eld observed data on soil water contents and NO3±N
concentrations in the soil pro®le were used to evaluate the performance of the model. The RZWQM usually predicted higher
soil water contents compared with the observed soil water contents. The model predicted higher NO3±N concentrations in the
soil pro®le for MP and NT treatments in comparison with CP and RT treatments, but the magnitude of simulated NO3±N peak
concentrations in the soil pro®le were substantially different from those of the observed peaks. The average NO3±N
concentrations for the entire soil pro®le predicted by the model were close to the observed concentrations except for ridge
tillage (percent difference for CP��5.1%, MP��12.8%, NT��18.4%, RT�ÿ44.8%). Discrepancies between the simulated
and observed water contents and NO3±N concentrations in the soil pro®le indicated a need for the calibration of plant growth
component of the model further for different soil and climatic conditions to improve the N-uptake predictions of the RZWQM.
# 1999 Elsevier Science B.V. All rights reserved.
Keywords: Modeling; Groundwater pollution; Tillage practices; RZWQM; Nitrate±nitrogen
1. Introduction
Several studies have con®rmed the presence of
agricultural chemicals in groundwater in Iowa and
other North Central region states of the United States
(Hallberg et al., 1985; Gish et al., 1991; Spalding et
al., 1989; Parsons and Witt, 1988). Nitrate±N is the
most common agricultural chemical found in the
groundwater. Parsons and Witt (1988) have also
reported on the presence of 73 pesticides in the
groundwater of 34 states.
Nitrogen fertilizers and pesticides applied to the soil
surface prior to and immediately after the planting
operation are particularly susceptible to loss through
Soil & Tillage Research 50 (1999) 223±236
*Corresponding author. Present address: Komex H2O Science,
5500 Bolsa Ave., Suite 105, Huntington Beach, CA G26YG, USA.
Tel.: +1-714-3791157; fax: +1-714-3791160; e-mail:
[email protected] paper no. J-15872 of the Iowa Agriculture and Home
Economics Experiment Station, Ames, IA.
0167-1987/99/$ ± see front matter # 1999 Elsevier Science B.V. All rights reserved.
PII: S 0 1 6 7 - 1 9 8 7 ( 9 9 ) 0 0 0 0 2 - 1
surface runoff or leaching to groundwater through the
soil pro®le. Tillage practices modify the physical and
hydraulic properties of the soil, and therefore, affect
the amounts of water and chemicals moving both over
and through the soil water (Blevins et al., 1990). For
example, tillage disrupts macropores (structural
cracks, worm or root holes), whereas no-tillage sys-
tems allow macropore networks to develop and per-
sist. These macropores may act as preferential
pathways for rapid movement of water and/or chemi-
cals in the solution phase. Conservation tillage systems
often reduce surface water contamination because soil
erosion and water runoff are reduced. At the same
time, concern is raised that conservation tillage may
increase groundwater contamination because of
increased in®ltration. This shows a clear need for
evaluating the impacts of different tillage systems
on the subsurface movement of water and chemicals.
Several studies have been conducted that focus on
experimentally determining tillage effects on soil and
water quality (Kanwar et al., 1991; Brins®eld et al.,
1987; Weed, 1992), but little work has been done on
simulating tillage effects on the subsurface water and
chemical movement and comparing these predictions
with observed data (Singh and Kanwar, 1995). The
root zone water quality model (RZWQM, V. 3.25)
developed by USDA-ARS (1992) has not yet been
evaluated for its predictions for NO3±N concentrations
in the soil pro®le. Therefore, this study was designed
to evaluate the latest version of the RZWQM to
simulate water and NO3±N movement through the
vadose zone under four tillage systems, namely chisel
plow, moldboard plow, no-tillage, and ridge tillage and
compare the simulations with the observed data. Soil
properties selected to characterize different tillage
systems were bulk density (BD), residue cover, and
macroporosity (MP).
2. Materials and methods
2.1. A brief overview of RZWQM
The RZWQM (V.3.25) has been developed to simu-
late the movement of water, nutrients, and pesticides
over and through the root zone of a unit area. It is
primarily a one-dimensional model designed to simu-
late conditions at a representative point (unit area) in a
®eld. The model can be used as a tool for assessing the
impacts of alternative agricultural management stra-
tegies on the subsurface environment. These alterna-
tives include evaluation of management plans on a
®eld-by-®eld basis, different levels of conservation
tillage, surface sealing effects, and water quality
impacts of irrigation and methods of fertilizer and
pesticide application. The root zone water quality
model consists of six subsystems or processes that
de®ne the simulation program: physical, plant growth,
soil chemical, nutrient, pesticide, and management
processes.
2.1.1. Physical processes
Physical processes include interrelated hydrologi-
cal processes such as in®ltration, chemical transport
during in®ltration, transfer of chemicals to runoff
during rainfall, water and chemical ¯ow through
macropore channels and their absorption by the soil
matrix, soil hydraulic properties estimation from BD
and 33 or 1500 kPa water content, heat ¯ow, evapo-
transpiration, root water-uptake and soil water redis-
tribution, and chemical transport during redistribution.
Soil surface evaporation and plant transpiration are
calculated by using a form of the Penman±Monteith
equation (Decoursey, 1992) that enables each compo-
nent to be separately identi®ed based on an energy-
transfer approach. These daily evaporation and tran-
spiration rates are impacted by continuously changing
soil and cover conditions brought about by tillage,
residue accumulation, plant growth, and soil water
movement.
2.1.2. Plant growth processes
The plant growth model predicts the relative
response of plants to changes in environment. Envir-
onmental change can be manifested either as normal
variations in climatic variables or by differences in
management practices. The model simulates carbon
dioxide assimilation, carbon allocation, dark respira-
tion, periodic tissue loss, plant mortality, root growth
through the soil pro®le, transpiration, and nitrogen (N)
uptake.
2.1.3. Soil chemical processes
Soil chemical processes include soil inorganic che-
mical processes, nutrient processes, chemical trans-
port, and pesticide processes. The inorganic processes
224 A. Kumar et al. / Soil & Tillage Research 50 (1999) 223±236

include bicarbonate buffering, dissolution and preci-
pitation of calcium carbonate, gypsum, and aluminum
hydroxide; ion exchange involving bases and alumi-
num; and solution chemistry of ion-pair complexes.
The chemical state of the soil is characterized by soil
pH, solution concentration of the major ions, and
adsorbed cations on the exchange complex. The model
is capable of handling soil solution chemistry across a
wide range of soil pH.
2.1.4. Nutrient processes
The nutrient processes de®ne carbon (C) and N
transformations within the soil pro®le. Given initial
levels of soil humus, crop residues, other organics, and
NO3±N and ammonium (NH4±N) concentrations, the
model simulates mineralization, nitri®cation, immo-
bilization, denitri®cation, and volatilization of appro-
priate N. A multi-pool approach is used for organic
matter cycling. Transformation rate equations are
based on chemical kinetic theory, and are controlled
by microbial population density and other environ-
mental variables such as soil temperatures, pH, water
content, and salinity. Levels of soluble nutrients are
used in estimating crop growth, nutrient extraction in
surface runoff, and movement through and below root
zone.
2.1.5. Management processes
The management submodel consists of a descrip-
tion of management activities in¯uencing the state of
the root zone. It includes typical tillage practices (e.g.
plowing, ridging, chiseling, and no-tillage) for most
crop rotations and the impact of these tillage practices
on surface roughness, BD, and micro- and macropor-
osity. The timing of typical management practices
such as fertilizer and pesticide applications, irrigation,
planting densities and timing, primary tillage, cultiva-
tion, and harvest operations are functions of soil water
conditions. Algorithms to describe BD reconsolida-
tion as a function of time, rainfall, and tillage have
been adopted and modi®ed from the USDA-water
erosion prediction project (WEPP) model. In
RZWQM, it is assumed that tillage changes soil bulk
density and macroporosity, and incorporates plant
residues into the soil. The macroporosity change is
assumed to be equal to that of bulk density in absolute
percentage, but in the opposite direction (Rojas et al.,
1992).
2.2. Study site
The study site for which these simulations were
performed was located on a predominantly Kenyon
loam (®ne-loamy, mixed, mesic, Typic Hapludoll) soil
with 3±4% organic matter at Iowa State University's
Northeast Research Center, Nashua, IA (Table 1).
These soils have seasonally high water tables and
bene®t from subsurface drainage. A 15 ha ®eld experi-
ment with 36, 0.4 ha plots was established on this site
in 1977, and was later used to investigate tillage
effects on surface and subsurface water quality. Til-
lage treatments included chisel plow (CP), moldboard
plow (MP), no-tillage (NT), and ridge tillage (RT)
systems. Details on the ®eld experiments are given by
Kanwar et al. (1983).
There were three replications of each tillage treat-
ment on 0.4 ha plots. Each plot has one subsurface
drain passing through the middle of the plot which was
Table 1
Soil properties for different soil horizons used as input for RZWQM simulations on a Kenyon loam in Iowa
Horizon
number
Depth
(cm)
�33 kPaa
(cm3/cm3)
Bulk densitya
(g/cm3)
Porosity
(cm3/cm3)
Organic
carbonb (%)
Particle size distributionb (%)
Sand Silt Clay
1 0±20 0.30 1.36 0.49 2.0 38 42 20
2 20±41 0.27 1.52 0.43 0.8 41 34 25
3 41±50 0.26 1.55 0.42 0.6 42 32 26
4 50±69 0.28 1.60 0.40 0.4 43 30 27
5 69±89 0.28 1.65 0.38 0.3 44 28 28
6 89±123 0.26 1.70 0.36 0.2 44 31 25
7 123±167 0.28 1.75 0.34 0.1 44 31 25
a Taken from Sharpley and William (1990). �33 kPa�soil water content at a tension of 33 kPa.b Experimentally measured (Singh, 1994). No-tillage was done for 15 years before start of these experiments.
A. Kumar et al. / Soil & Tillage Research 50 (1999) 223±236 225

intercepted and connected to individual sumps for
measuring subsurface drainage and collecting water
samples for chemical analyses (Kanwar et al., 1993).
2.2.1. Collecting soil samples for water content and
NO3±N analyses
Three sets of 180 cm long soil cores were collected
from each plot in 1990, 1991, and 1992. The ®rst set of
cores (collected in April or May) represented the
beginning of the growing season, the second set
(collected in September) represented the middle of
the growing season, and the third set (collected in
October or early November) represented the end of the
growing season. The exact dates of sampling are given
in Table 2 for each year. To collect soil samples, a zero
contamination hand-sampler was used to remove
180 cm long, 2.5 cm diameter cores. As the sampler
was pushed into the soil, each core slid into a clean
liner made of PETG (polyethylene, terephthalate,
glycol modi®ed) plastic to protect the sample from
contamination. After removing the sampler, we
plugged the resulting opening in the soil with bento-
nite clay granules. These samples were frozen
promptly after collection. Three cores were collected
from each plot for each sampling date. Soil cores for
the same plot were composited after they were sec-
tioned into a set of samples. In 1990, the cores were
divided into sections representing 0±10, 10±20, 20±
30, 30±45, 45±60, 60±90, 90±120, 120±150 cm
depths. Soil samples for 150±180 cm depth were
discarded. In 1991, cores were divided into sections
representing 0±10, 10±20, 20±30, 30±45, 45±60, 60±
100 cm depths. Soil samples for 100±180 cm depth
were discarded. In 1992, the cores were divided into
sections representing 0±10, 10±20, 20±30, 30±45, 45±
60, 60±90, 90±120 cm depths. Again soil samples for
120±180 cm depth were discarded. Composited sam-
ples were analyzed for soil water and NO3±N con-
Table 2
Dates of tillage, planting, chemical application, and harvesting for simulation runs of RZWQM on a Kenyon loam in Iowaa
Date Day of year Activity
1990
18 April 108 Applied 202 kg N/ha to most continuous corn plots
2 May 122 Planted corn
30 May 150 Early summer soil sampling
25 September 268 Late season soil sampling
1 October 274 Corn harvest
30 October 303 Post harvest soil sampling
7 November 310 Moldboard and chisel plow tillage
1991
11 May 131 Preplant soil sampling
14 May 134 Applied 202 kg N/ha to most continuous corn plots
27 May 147 Planted corn
18 June 169 Early summer soil sampling
23 September 266 Late season soil sampling
8 October 274 Corn harvest
13 November 317 Post harvest soil sampling
1992
2 April 93 Moldboard and chisel plow tillage
29 April 120 Preplant soil sampling
1 May 121 Applied 202 kg N/ha to most continuous corn plots
5 May 126 Planted corn
23 June 175 Early summer soil sampling
18 September 262 Late season soil sampling
14 October 288 Corn harvest
21 October 295 Post harvest soil sampling
10 November 315 Moldboard and chisel plow tillage
a Adapted from Kanwar et al. (1993).
226 A. Kumar et al. / Soil & Tillage Research 50 (1999) 223±236

centrations. Soil water was measured by weighing a
sample of soil, drying it at 1058C for 24 h, reweighing
the cooled sample, and calculating the soil water as the
percentage water on dry soil basis. For NO3±N ana-
lysis, a weighed sample of wet soil was mixed with
2 N potassium chloride (KCl). This mixture was sha-
ken for 1 h, then ®ltered. The resulting ®ltrate was
analyzed with a Lachat Model AE ion analyzer. A
detailed methodology of collecting and analyzing soil
samples is given by Weed (1992). A statistical analysis
on the observed NO3±N concentrations was performed
to test the effects of tillage on concentrations for all the
three years.
2.3. Simulation procedure and data input needs
All of the measured input parameter values used in
the model simulation were either measured in the ®eld
or were taken from previously conducted research at
this site. Input parameter values for which no data
were available were estimated by using the databases
provided in the RZWQM's user manual (USDA-ARS,
1992b). Thus, only on-site input data or estimates
derived by the model were used in the simulations.
Movement of water and NO3±N was simulated under
CP, MP, NT, and RT treatments. A unit gradient was
assumed for the lower boundary condition for all the
simulation runs.
For model simulations, a variable-depth-increment
scheme (layer thickness ranging from 1 cm at the top
to 15 cm at the bottom) was used as described in the
technical documentation of RZWQM (USDA-ARS,
1992a). The pro®le depth simulated was 1.67 m.
Seven soil-horizons for Kenyon loam soil were deli-
neated for model input. Soil pro®le information was
collected from soil survey report of Butler County, IA
(USDA-SCS, 1982). The respective soil properties
were used as inputs for each of these horizons.
2.3.1. Soil properties data
Bulk density and macroporosity for the surface
horizon (0±20 cm) were determined experimentally
as a function of tillage for Kenyon soil (Table 3).
Skopp (1981) de®ned macroporosity as the portion of
soil porosity that provides preferential ¯ow paths
where water or chemical mixing and transfer between
adjacent pore sizes is limited. Macroporosity of top-
soil was investigated from the in®ltration experiments
conducted at 0, 30, 60, and 90 mm tensions at the
study site. As in®ltration measurements at different
tensions were made under approximately steady-state
conditions, macropore conductivity was determined as
the difference between the ponded in®ltration rate and
the in®ltration rate at 30 mm tension. Based on this
assumption, macroporosity for the top-soil was deter-
mined (Table 3) by applying Poiseulle's equation
using the assumptions of laminar ¯ow and cylindrical
macropores as described by Watson and Luxmoore
(1986). Macroporosity is estimated by assuming that
pores are of the minimum radius corresponding to the
lower limiting tension of 30 mm, and therefore, repre-
sent maximum values. For subsequent horizons, bulk
density values were taken from the soils database of
Sharpley and William (1990), and a macroporosity of
0.01% was assumed for these horizons. Total porosity
for each horizon was calculated from bulk density and
Table 3
A list of input soil properties for the surface horizon (0±20 cm) and their values for different tillage systems in RZWQM simulations on a
Kenyon loam in Iowa
Soil property CP MP NT RT
Bulk density (g/cm3) 1.41 1.38 1.50 1.38
Porosity (cm3/cm3) 0.47 0.48 0.43 0.48
Macroporosity (cm3/cm3) 0.00015 0.00025 0.0003 0.0003
Residue pools (mg/g)
Slow pool 450 700 140 310
Fast pool 700 1000 215 480
Residue cover (Mg/ha)a 3.8 0.6 6.2 5.0
CP ± chisel plow; MP ± moldboard plow; NT ± no-tillage; RT ± ridge tillage.a Residue cover was assumed constant during the season.
A. Kumar et al. / Soil & Tillage Research 50 (1999) 223±236 227

an assumed value of 2.65 g/cm3 for particle density.
Other soil properties such as 33 kPa water content
(�33 kPa), 1500 kPa water content (�1500 kPa), and pH
for the Kenyon soil were also taken from Sharpley and
William (1990). Tables 1 and 3 list major soil proper-
ties used as input parameters in the model. All other
hydraulic properties such as Ksat, effective porosity,
and bubbling pressure, were estimated by the model
based on soil texture, BD, and �33 kPa values.
Experimentally measured values of soil texture
were used as inputs to the model. Soil heat properties
(dry volumetric heat capacity and heat conductivity)
were estimated by using soil texture data as described
by Jury et al. (1991) and were used as inputs to the
model. Actual tillage (mode of tillage, depth of tillage,
amount of residue at surface), planting, fertilizer
application, and harvest dates were used as inputs
to the model and are shown in Table 2.
2.3.2. Weather data
Daily meteorological data, including minimum and
maximum temperature, wind speed, radiation, relative
humidity, and pan evaporation, are required by the
model as inputs. All the daily meteorological data
except wind speed and pan evaporation were available
for the Nashua weather station. These data were
obtained from Taylor (1992). Daily evaporation was
estimated by the model by using short-wave radiation
as the energy input to the evaporation algorithm.
When wind speed is missing, the model assumes a
wind speed of 10 km/day.
The RZWQM accepts rainfall in the form of
breakpoint rainfall data to incorporate the effects of
rainfall intensity on the subsurface movement of
water and chemicals. Breakpoints represent breaks
or changes in slope in the cumulative rainfall versus
time plot. For this study, hourly rainfall data for the
Nashua weather station were obtained from Taylor
(1992). For each rainfall event, cumulative rainfall
was plotted as a function of time. Breakpoints were
recorded at every point where there was a signi®cant
change in the slope. For the periods when hourly
rainfall data were not available, daily rainfall was
recorded and breakpoints were noted from a rainfall
event of similar magnitude for which hourly rainfall
data were available.
The model also requires values of surface albedos
for dry and wet soil, mature crop and residue, and
sunshine fraction, as input. Surface albedos were
taken from Jury et al. (1991). Sunshine factor is
estimated based on latitude information provided as
input to the model.
2.3.3. Plant growth variables and parameters
The RZWQM uses a generic plant growth model to
simulate corn growth. Default values of plant growth
parameters were used for the generic growth model, as
recommended in the RZWQM user manual. Tillage
speci®c data on planting and harvesting days, number
of plantings, planting depth, planting density, harvest-
ing ef®ciency, etc. are input to the model and were
based on the actual ®eld information collected at the
research site.
2.3.4. Initial conditions
Initial conditions speci®ed for the simulations con-
sisted of pH, initial soil water content and temperature,
soil inorganic chemistry variables (CEC, fractions of
exchangeable ions, etc.), organic matter pools, micro-
organisms pools, solution chemistry, gas pools, and
initial NO3±N concentrations in the soil pro®le.
Except for pH, organic matter pools, initial soil
water content, and NO3±N concentration pro®les,
default values provided in the model were used. Soil
pH values for different tillage practices were taken
from soil test results (Karlen et al., 1991). Organic
matter values were obtained from Nashua soil report
(Table 1) and were divided into slow (60%), medium
(35%), and fast (5%) pools as described in RZWQM
user's manual (USDA-ARS, 1992b). Initial water
contents were speci®ed as �33 kPa. The values for
�33 kPa were taken from soil database of Sharpley
and William (1990) and were the same for all the
tillage systems. Initial NO3±N concentrations for 1990
were obtained from model calibration. Initial NO3±N
concentrations for 1991 and 1992 were speci®ed as the
observed concentrations in the soil samples at the end
of October 1990 and 1991, respectively. A careful
review of the soil sample data revealed that NO3±N
concentration pro®les at the end of October 1990 were
quite similar to those of the pre-fertilizer application
concentrations in the spring of 1991, indicating little
change in NO3±N concentration pro®les through the
1990±1991 winter period. Initial soil NO3±N concen-
trations for simulation runs for 1990 are provided in
Table 4.
228 A. Kumar et al. / Soil & Tillage Research 50 (1999) 223±236

3. Results and discussion
3.1. Comparison between simulated and observed
soil water contents
Figs. 1±3 show both observed and simulated volu-
metric water contents in the soil pro®le on Julian Day
(JD) 150 (May 30) for 1990, JD 266 (September 23)
for 1991 and JD 119 (April 29) for the year 1992,
respectively. These ®gures represent the sampling
dates at the beginning and middle of crop season
for these years when the sampling was done.
Figs. 1±3 show that predicted soil water contents by
the RZWQM were usually close to the observed soil
water contents except for JD 266 in 1991 for the MP
tillage system. Also, the difference between observed
Table 4
Initial NO3±N concentrations in the soil profile for simulation runs for all tillage treatments for 1990
Horizon NO3±N concentration (mg/kg)
Chisel plow Moldboard plow No-tillage Ridge-tillage
1 15 24 15 20
2 6 11 5 5
3 8 13 5 6
4 11 18 5 8
5 13 18 6 11
6 15 15 7 13
7 9 3 7 10
Fig. 1. Simulated (lines) and observed (points) water contents for soil profile for day 150 for 1990 (error bars show the standard deviation); CP
± chisel plow, MP ± moldboard plow, NT ± no-tillage, RT ± ridge tillage.
A. Kumar et al. / Soil & Tillage Research 50 (1999) 223±236 229

and simulated values generally decreased with the
increase in soil depth for all dates for all three years
with few exceptions (Figs. 1±3). Simulated water
content pro®les on JD 150 for 1990 show that the
MP treatment had a higher soil water content at all
depths in comparison with NT, CP and RT treatments.
On the other hand, the observed soil water content
pro®les on JD 150 showed no consistent pattern
(Fig. 1).
For MP tillage system, the model predicted 33%
higher soil water contents than the observed values for
the year 1991.
For 1992, the model predictions were close to the
observed data for JD 119 (Fig. 3). The simulated water
contents for soil pro®le were slightly higher for all
tillage treatments except for the NT system. Observed
soil water content data showed more distinction
between tillages in surface layers (maximum water
content was observed for the NT and RT treatments).
This difference gradually decreased with depth. On
the average, the soil pro®le water contents predicted
by the RZWQM followed the observed trend reason-
ably well. However, simulated soil water contents did
not show any distinct effects between the tillage
treatments. Similar trends were observed for other
dates for which water contents were simulated in
1990, 1991 and 1992 (not shown).
One of the possible causes of difference between
simulated and observed soil water content in the soil
pro®le is the soil macroporosity. Soil macroporosity is
not only affected by tillage systems, but also by
changing weather conditions. Some other factors
affecting the water movement through the soil
pro®le could be inconsistencies between estimated
and actual rainfall intensities, discrepancies between
estimated and actual values of some of the soil pro-
perties, taking average of water contents over a depth
and assuming at one point, errors in root water
extraction procedures of the model, and ®nally, unac-
counted spatial variability in soil properties, which
plays a major role in the subsurface water and solute
transport.
Fig. 2. Simulated (lines) and observed (points) water contents for soil profile for day 266 for 1991 (error bars show the standard deviation); CP
± chisel plow, MP ± moldboard plow, NT ± no-tillage, RT ± ridge tillage.
230 A. Kumar et al. / Soil & Tillage Research 50 (1999) 223±236

3.2. Comparison between predicted and observed
soil NO3±N concentrations
The model was run from Julian day (JD) 91 (April
1) to JD 335 (November 30) covering the crop grow-
ing seasons of 1990, 1991, and 1992. Simulated NO3±
N concentrations for different days of the growing
seasons were compared with observed data and are
discussed in the following paragraphs.
Figs. 4±7 show predicted and observed NO3±N
concentrations (mg/l) in the soil pro®le for 1990,
1991, and 1992, respectively. Observed NO3±N con-
centrations in the soil pro®le showed no clear pattern
regarding tillage effects on NO3±N concentrations,
although MP and RT treatments generally showed
higher NO3±N concentrations in comparison with
NT and CP treatments. But this trend was not con-
sistent for every year. Observed NO3±N concentra-
tions for the MP system were consistently higher and
for NT system consistently lower for all the years. For
JD 150 of year 1990, MP treatment had the highest
NO3±N concentration in the soil pro®le among all
tillage treatments (Fig. 4), while NT treatment had the
lowest NO3±N concentration on JD 266 of year 1991
(Fig. 6). Minimum NO3±N concentrations in the soil
pro®le usually occurred under the NT treatment (con-
sidering all soil samples for all the years). For JD 119
of year 1992, CP treatment had the lowest NO3±N
concentrations and RT had the highest NO3±N con-
centrations (Fig. 7). Statistical analysis on observed
NO3±N concentrations was performed to test the
signi®cance of differences between tillage treatments
for each date of soil sampling (Table 5). A detailed
discussion on these observed values is provided by
Weed (1992).
Simulated NO3±N concentrations were more or less
in the same range as those of observed concentrations
for JD 150 for the year 1990 (Fig. 4). The maximum
percent difference between predicted and observed
NO3±N concentrations for the entire soil pro®le was
ÿ19% for the NT system (Table 5). But the model
predicted substantially higher NO3±N concentrations
Fig. 3. Simulated (lines) and observed (points) water contents for soil profile for day 120 for 1992 (error bars show the standard deviation); CP
± chisel plow, MP ± moldboard plow, NT ± no-tillage, RT ± ridge tillage.
A. Kumar et al. / Soil & Tillage Research 50 (1999) 223±236 231
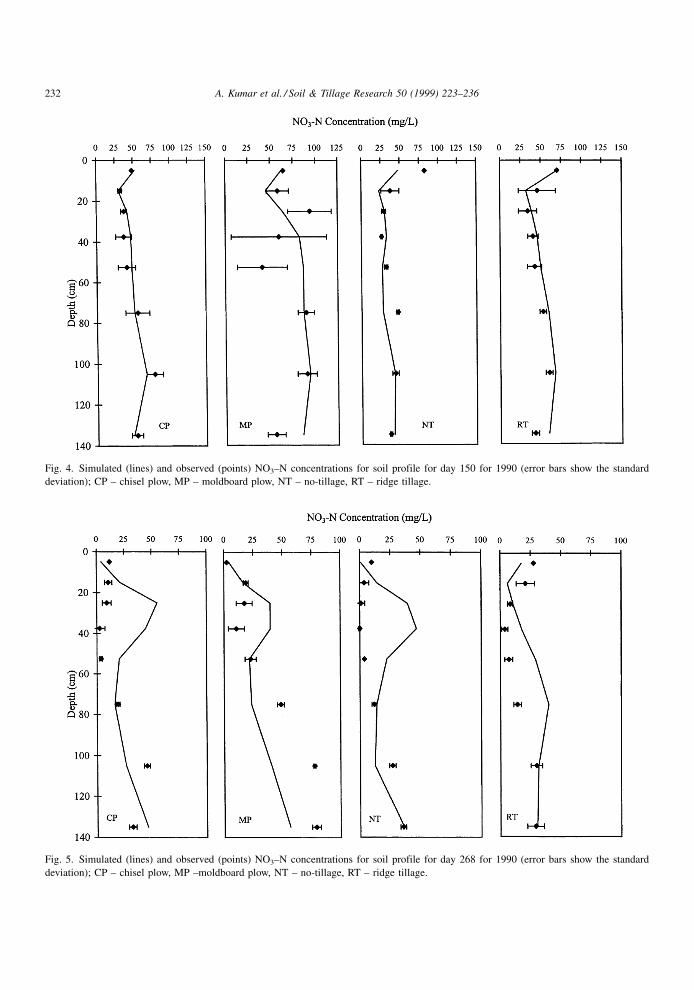
Fig. 4. Simulated (lines) and observed (points) NO3±N concentrations for soil profile for day 150 for 1990 (error bars show the standard
deviation); CP ± chisel plow, MP ± moldboard plow, NT ± no-tillage, RT ± ridge tillage.
Fig. 5. Simulated (lines) and observed (points) NO3±N concentrations for soil profile for day 268 for 1990 (error bars show the standard
deviation); CP ± chisel plow, MP ±moldboard plow, NT ± no-tillage, RT ± ridge tillage.
232 A. Kumar et al. / Soil & Tillage Research 50 (1999) 223±236

Fig. 6. Simulated (lines) and observed (points) NO3±N concentrations for soil profile for day 266 for 1991 (error bars show the standard
deviation); CP ± chisel plow, MP ± moldboard plow, NT ± no-tillage, RT ± ridge tillage.
Fig. 7. Simulated (lines) and observed (points) NO3±N concentrations for soil profile for day 120 for 1992 (error bars show the standard
deviation); CP ± chisel plow, MP ± moldboard plow, NT ± no-tillage, RT ± ridge tillage.
A. Kumar et al. / Soil & Tillage Research 50 (1999) 223±236 233
under CP and NT treatments in comparison with the
MP and RT treatments, usually at upper soil depths,
for JD 268 of the year 1990 (Fig. 5). The reason for
NO3±N bulging in the NT plots around 20±30 cm
could be that ¯ow is bypassed through macropores
and nitrate is not leached down to lower depths. The
NT system tends to have better network of macropores
compared to other tillage systems. On the other hand,
for JD 268, simulated NO3±N concentration pro®les
for different tillage treatments were more or less
similar to the depth of below 60 cm (Fig. 5). For
deeper soil horizons CP, MP and NT treatments
showed substantially lower NO3±N concentrations
in comparison with RT treatment for JD 268. Usually,
the predicted peak NO3±N concentrations occurred
within the same depth increments for all tillages
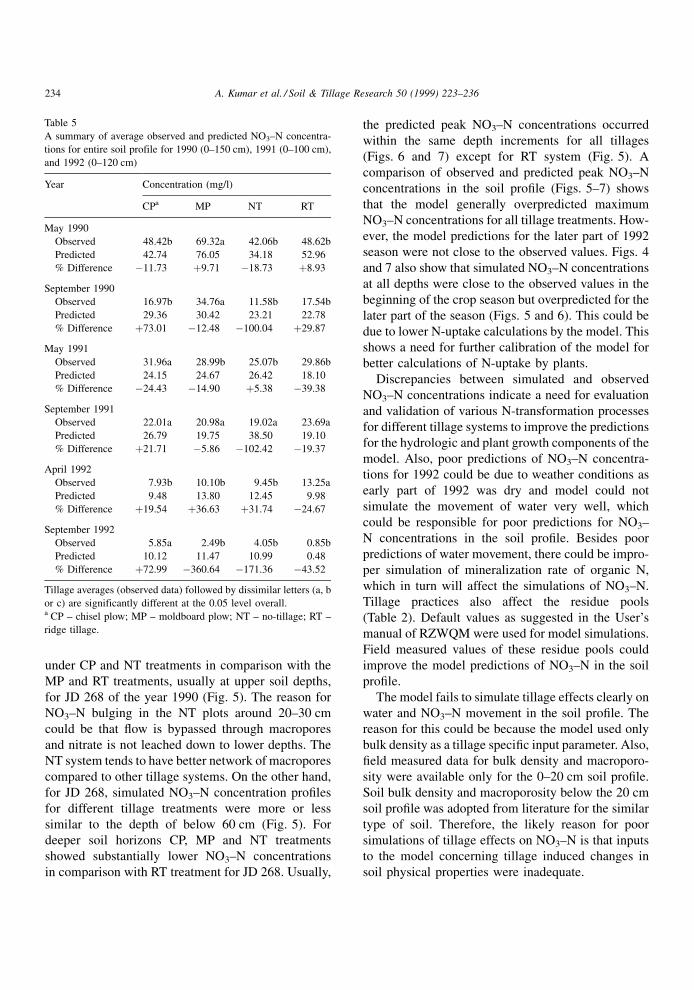
(Figs. 6 and 7) except for RT system (Fig. 5). A
comparison of observed and predicted peak NO3±N
concentrations in the soil pro®le (Figs. 5±7) shows
that the model generally overpredicted maximum
NO3±N concentrations for all tillage treatments. How-
ever, the model predictions for the later part of 1992
season were not close to the observed values. Figs. 4
and 7 also show that simulated NO3±N concentrations
at all depths were close to the observed values in the
beginning of the crop season but overpredicted for the
later part of the season (Figs. 5 and 6). This could be
due to lower N-uptake calculations by the model. This
shows a need for further calibration of the model for
better calculations of N-uptake by plants.
Discrepancies between simulated and observed
NO3±N concentrations indicate a need for evaluation
and validation of various N-transformation processes
for different tillage systems to improve the predictions
for the hydrologic and plant growth components of the
model. Also, poor predictions of NO3±N concentra-
tions for 1992 could be due to weather conditions as
early part of 1992 was dry and model could not
simulate the movement of water very well, which
could be responsible for poor predictions for NO3±
N concentrations in the soil pro®le. Besides poor
predictions of water movement, there could be impro-
per simulation of mineralization rate of organic N,
which in turn will affect the simulations of NO3±N.
Tillage practices also affect the residue pools
(Table 2). Default values as suggested in the User's
manual of RZWQM were used for model simulations.
Field measured values of these residue pools could
improve the model predictions of NO3±N in the soil
pro®le.
The model fails to simulate tillage effects clearly on
water and NO3±N movement in the soil pro®le. The
reason for this could be because the model used only
bulk density as a tillage speci®c input parameter. Also,
®eld measured data for bulk density and macroporo-
sity were available only for the 0±20 cm soil pro®le.
Soil bulk density and macroporosity below the 20 cm
soil pro®le was adopted from literature for the similar
type of soil. Therefore, the likely reason for poor
simulations of tillage effects on NO3±N is that inputs
to the model concerning tillage induced changes in
soil physical properties were inadequate.
Table 5
A summary of average observed and predicted NO3±N concentra-
tions for entire soil profile for 1990 (0±150 cm), 1991 (0±100 cm),
and 1992 (0±120 cm)
Year Concentration (mg/l)
CPa MP NT RT
May 1990
Observed 48.42b 69.32a 42.06b 48.62b
Predicted 42.74 76.05 34.18 52.96
% Difference ÿ11.73 �9.71 ÿ18.73 �8.93
September 1990
Observed 16.97b 34.76a 11.58b 17.54b
Predicted 29.36 30.42 23.21 22.78
% Difference �73.01 ÿ12.48 ÿ100.04 �29.87
May 1991
Observed 31.96a 28.99b 25.07b 29.86b
Predicted 24.15 24.67 26.42 18.10
% Difference ÿ24.43 ÿ14.90 �5.38 ÿ39.38
September 1991
Observed 22.01a 20.98a 19.02a 23.69a
Predicted 26.79 19.75 38.50 19.10
% Difference �21.71 ÿ5.86 ÿ102.42 ÿ19.37
April 1992
Observed 7.93b 10.10b 9.45b 13.25a
Predicted 9.48 13.80 12.45 9.98
% Difference �19.54 �36.63 �31.74 ÿ24.67
September 1992
Observed 5.85a 2.49b 4.05b 0.85b
Predicted 10.12 11.47 10.99 0.48
% Difference �72.99 ÿ360.64 ÿ171.36 ÿ43.52
Tillage averages (observed data) followed by dissimilar letters (a, b
or c) are significantly different at the 0.05 level overall.a CP ± chisel plow; MP ± moldboard plow; NT ± no-tillage; RT ±
ridge tillage.
234 A. Kumar et al. / Soil & Tillage Research 50 (1999) 223±236

4. Summary and conclusions
Evaluation of the root zone water quality model was
done to simulate water and NO3±N movement through
the vadose zone under four different tillage practices
utilizing ®eld-measured soil properties. Based on the
results of this study, model predictions were not
satisfactory. The model needs improvements in its
nutrient component before it can be used as a pre-
dicting tool for agricultural management. The follow-
ing conclusions were made from this study:
1. RZWQM usually predicted higher soil water
contents than observed in the ®eld. Both observed
and simulated values did not show any distinct
tillage effect on soil water contents for all the
three years.
2. Although the average predicted NO3±N concentra-
tions were usually within the range (one standard
deviation) of observed NO3±N concentrations, the
model generally overpredicted maximum NO3±N
concentrations in the soil profile for all the treat-
ments.
3. The model predictions indicate a need for improve-
ment in the crop growth and nutrient components
of the model as well as their evaluation and valida-
tion for different tillage practices. Incorporating the
effect of tillage practices on soil physical properties
other than bulk density, can make these improve-
ments. Since model heavily relies on residual
pools, there is a need to estimate these pools
accurately for each tillage system.
Acknowledgements
This research was funded by the Leopold Center for
Sustainable Agriculture and the USDA-ARS through
MSEA project. The model and model documentation
can be obtained by writing to Dr. L.R. Ahuja, Research
Leader, USDA-ARS, Great Plains Research Center,
Ft. Collins, Co, USA.
References
Blevins, R.L., Frye, W.W., Baldwin, P.L., Robertson, S.D., 1990.
Tillage effects on sediment and soluble nutrient losses from a
Maury silt loam soil. J. Environ. Qual. 19, 683±686.
Brinsfield, R., Staver, K., Magette, W., 1987. Impact of tillage
practices on pesticide leaching in coastal plain soils. ASAE
paper no. 87-2631, Am. Soc. Agric. Eng., St. Joseph, MI.
Decoursey, D.G., 1992. Evaporation and transpiration processes.
In: Root Zone Water Quality Model Manual, USDA-ARS
GPSR. Tech. Rep. No. 2, Ft. Collins, CO.
Gish, T.J., Isensee, A.R., Nash, R.G., Helling, C.S., 1991. Impacts
of pesticides on shallow groundwater quality. Trans. ASAE 34,
1745±1753.
Hallberg, G.R., Libra, R.D., Hoyer, B.E., 1985. Nonpoint source
contamination of groundwater in Karst-carbonate aquifers in
Iowa. In: EPA Publ. 440/5-85-001, Washington, DC 10460, pp.
109±114.
Jury, W., Gardner, W.R., Gardner, W.H., 1991. Soil Physics. Wiley,
New York.
Kanwar, R.S., Johnson, H.P., Baker, J.L., 1983. Comparison of
simulated and measured nitrate losses in tile effluent. Trans.
ASAE 26(5), 1451±1457.
Kanwar, R.S., Karlen, D.L., Colvin, T.S., Simpkins, W.W.,
McFadden, V.J., 1993. Evaluation of tillage and crop rotation
effects on groundwater quality ± Nashua Project. A completion
report prepared for Leopold Center for Sustainable Agriculture.
Iowa State University, Ames, IA.
Kanwar, R.S., Stoltenberg, D.E., Pfeiffer, R., Karlen, D.L., Colvin,
T.S., Honeyman, M., 1991. Long-term effects of tillage and
crop rotation on the leaching of nitrates and pesticides to
shallow groundwater. In: Ritter, W.F. (Ed.), Proceedings of the
1991 National Conference of ASCE, Hawaii, pp. 661±665.
Karlen, D.L., Berry, E.C., Colvin, T.S., Kanwar, R.S., 1991.
Twelve-year tillage and crop rotation effects on yields and soil
chemical properties in Northeast Iowa. Commun. Soil Sci.
Plant Anal. 22(19), 1985±2003.
Parsons, D.W., Witt, J.M., 1988. Pesticides in groundwater of
United States of America. A report. Oregon State Univ. Ext.
Ser., Corvallis, Oregon.
Rojas, K.W., Johnsen, K.E., Ghidey, F., 1992. Management
processes. In: Root Zone Water Quality Model Manual.
USDA-ARS GPSR. Tech. Rep. No. 2, Ft. Collins, CO.
Sharpley, A.N., William, J.R., 1990. EPIC ± Erosion Productivity
Impact Calculator 2. User Manual. USDA-ARS technical
bulletin no. 1768.
Singh, P., 1994. Modification of root zone water quality model
(RZWQM) to simulate the tillage effects on subsurface drain
flows and NO3±N movement. Ph.D. Dissertation. Iowa State
University, Ames, IA (Diss. Abstr. 94-24259).
Singh, P., Kanwar, R.S., 1995. Simulating NO3±N transport to
subsurface drain flows as affected by tillage under continuous
corn. Trans. ASAE 38, 449±506.
Skopp, J., 1981. Comment on micro-, meso- and macroporosity of
soil. Soil Sci. Soc. Am. J. 45, 12±46.
Spalding, R.F., Burbach, M.E., Exner, M.E., 1989. Pesticides in
Nebraska's groundwater. Groundwater Monitoring Rev. 9(4),
126±133.
Taylor, E., 1992. Personal communications. Agronomy Depart-
ment, Iowa State University, Ames, IA.
USDA-ARS, 1992a. Root zone water quality model version 1.0.
Technical Documentation. GPSR Technical Report No. 2.
A. Kumar et al. / Soil & Tillage Research 50 (1999) 223±236 235

USDA-ARS Great Plains Systems Research Unit, Ft. Collins,
CO.
USDA-ARS, 1992b. Root zone water quality model version 1.0.
User's Manual. GPSR Technical Report No. 3. USDA-ARS
Great Plains Systems Research Unit, Ft. Collins, CO.
USDA-SCS, 1982. Soil Survey of Butler County, IA. USDA, SCS
in cooperation with Iowa Agric. and Home Econ. Exp. Stn.,
Cooperative Extension Service, Iowa State University, and the
Dept. of Soil Consv., IA.
Watson, K.W., Luxmoore, R.J., 1986. Estimating macroporosity in
a forested watershed by use of a tension infiltrometer. Soil Sci.
Soc. Am. J. 50, 578±582.
Weed, D.J., 1992. Effects of tillage and crop rotation on soil nitrate
and moisture. M.S. Thesis. Iowa State University, Ames, IA.
236 A. Kumar et al. / Soil & Tillage Research 50 (1999) 223±236