evaluation of the e & n railway corridor: freight analysis · evaluation of the e & n...
TRANSCRIPT

TRANSPORTATION
Ministry of Transportation and Infrastructure
Evaluation of the E & N Railway Corridor: Freight Analysis
REPORT

I B I G R O U P R E P O R T
TABLE OF CONTENTS
Page i.
EXECUTIVE SUMMARY .................................................................................................................... 1
1. INTRODUCTION ...................................................................................................................... 6
2. VANCOUVER ISLAND FREIGHT DEMAND ........................................................................... 7
3. THE VANCOUVER ISLAND INDUSTRIAL BASE .................................................................. 9
3.1 Forest Products ..................................................................................................................................... 9
3.2 Mining ................................................................................................................................................... 15
4. RAIL FREIGHT ON VANCOUVER ISLAND .......................................................................... 18
4.1 Current Rail Freight Services ............................................................................................................. 18
4.2 Current Rail Freight Traffic ................................................................................................................. 18
4.3 Potential Rail Freight Service Improvements ................................................................................... 20
5. VANCOUVER ISLAND TRUCK TRAFFIC ............................................................................ 21
5.1 Truck Ferries ........................................................................................................................................ 21
5.2 Vancouver Island Traffic Counts ....................................................................................................... 22
5.3 Truck Origin-Destination Surveys ..................................................................................................... 26
5.4 Potential Rail Freight Markets – Conclusions from Truck Survey .................................................. 33
6. COMPETITIVENESS OF RAIL FREIGHT TRANSPORTATION ON VANCOUVER ISLAND........................................................................................................... 36
6.1 Rail Rates and Contribution to Constant Costs ............................................................................... 36
6.2 Forest Products and Other Truckload Commodities ....................................................................... 38
6.3 Mining Commodities ........................................................................................................................... 40
7. IMPLICATIONS OF POTENTIAL DISCONTINUANCE OF RAIL SERVICE ........................ 41
7.1 Impact on Shippers ............................................................................................................................. 41
7.2 Impact on the Road Network .............................................................................................................. 42
I B I G R O U P R E P O R T
TABLE OF CONTENTS (CONT’D)
Page ii.
7.3 Impact on Emissions .......................................................................................................................... 42
8. CONCLUSIONS ..................................................................................................................... 43
9. FEASIBILITY OF EXPANDED FREIGHT SERVICE ............................................................. 45
9.1 Current Freight Market and Rail Mode Share ................................................................................... 45
9.2 Forecast Freight Market ...................................................................................................................... 45
9.3 Prospects for Rail ................................................................................................................................ 46
9.4 Railway Costs versus Revenues ........................................................................................................ 49
APPENDIX A: Truck Ferries Serving Vancouver Island
List of Exhibits
Exhibit E.1 – Freight Commodities – Island Highway and E&N Railway ............................................ 2 Exhibit E.2 – Existing/Potential Freight Market (Daily) – Mode Split .................................................. 3 Exhibit E.3 – Freight Market (Annual) – Rail ....................................................................................... 4 Exhibit E.4 – Average Freight Investments Versus Revenues ........................................................... 5 Exhibit 1.1 - E & N Railway Corridor, Vancouver Island ..................................................................... 6 Exhibit 2.1 - Vancouver Island Population Trend ................................................................................ 7 Exhibit 3.1 - Vancouver Island Employment in Goods Production ..................................................... 9 Exhibit 3.2 – Forest Industry Production – Recent Trends ............................................................... 11 Exhibit 3.3 – Forest Product Facilities along Port Alberni Corridor ................................................... 14 Exhibit 3.4 – Forest Product Facilities in Nanaimo-Duncan Segment .............................................. 14 Exhibit 3.5 – Aggregate Mining Operations – Coastal and Vancouver Island .................................. 17 Exhibit 4.1 – Current Rail Shippers on Vancouver Island ................................................................. 19 Exhibit 4.2 – Current Rail Carload Origins and Destinations ............................................................ 19 Exhibit 5.1 – Vancouver Island Traffic Count Locations ................................................................... 22 Exhibit 5.2 – Daily Truck Traffic Volumes (by Month), Island Highway at Cedar Road,
Nanaimo ....................................................................................................................... 23 Exhibit 5.3 – Annual Variation in Daily Truck Traffic Volumes, Island Highway, Nanaimo ............... 24 Exhibit 5.4 – Annual Variation in Daily Truck Traffic, Island Highway, Various Locations ............... 25 Exhibit 5.5 – Surveyed Truck Classification, Parksville, June 2009 ................................................. 26 Exhibit 5.6 – Surveyed Truck Commodity Profile – Northbound, Parksville, June 2009 .................. 27 Exhibit 5.7 – Surveyed Truck Commodity Profile – Southbound, Parksville, June 2009 .................. 28 Exhibit 5.8 – Surveyed Truck Origins – Northbound, Parksville, June 2009 .................................... 29 Exhibit 5.9 – Surveyed Truck Origins and Destination – Southbound, Parksville, June 2009 ......... 30 Exhibit 5.10 – Surveyed Truck Classification, Duncan, June 2009 .................................................. 31 Exhibit 5.11 – Surveyed Truck Commodity Profile – Duncan, June 2009 ........................................ 32 Exhibit 5.12 – Surveyed Truck Origins – Duncan, June 2009 .......................................................... 32 Exhibit 6.1 – BC Lumber Exports by Transportation Mode ............................................................... 37 Exhibit 9.1 – Freight Commodities – Island Highway and E&N Railway .......................................... 45 Exhibit 9.2 – Existing/Potential Freight Market (Daily) – Island Highway and E&N Railway ............ 46 Exhibit 9.3 – Existing/Potential Freight Market (Daily) – Mode Split ................................................. 47 Exhibit 9.4 – Existing/Potential Freight Market (Daily) – Rail ............................................................ 48 Exhibit 9.5 – Freight Market (Annual) – Rail ..................................................................................... 48

I B I G R O U P R E P O R T
TABLE OF CONTENTS (CONT’D)
Page iii.
Exhibit 9.6 – Average Freight Investment versus Revenue per Rail Car ......................................... 50
List of Tables
Table E.1 – Outcomes: Average Investment per Rail Car .................................................................. 5 Table 3.1 – Sawmill Capacities and Transportation Access ............................................................. 12 Table 3.2– Pulp/Paper Mill Capacities and Transportation Access .................................................. 13 Table 3.3 – Wood Chip Mill Capacities ............................................................................................. 13 Table 3.4 – Major Aggregate Production Facilities ........................................................................... 16 Table 5.1 – Truck Survey Commodity Types by Location/Direction ................................................. 33 Table 5.2 – Nanaimo Truck Counts, by Length Classification .......................................................... 34 Table 5.3 – Estimated Forest Product Exports via Nanaimo ............................................................ 34 Table 6.1 – Estimated Trucking Rates, 2009 .................................................................................... 38 Table 6.2 – Ferry Shipping Rates, 2009 ........................................................................................... 38 Table 7.1 – Estimated Impact of Rail Discontinuance - Example ..................................................... 41
I B I G R O U P R E P O R T
Ministry of Transportation and Infrastructure Evaluation of the E & N Railway Corridor: Freight Analysis
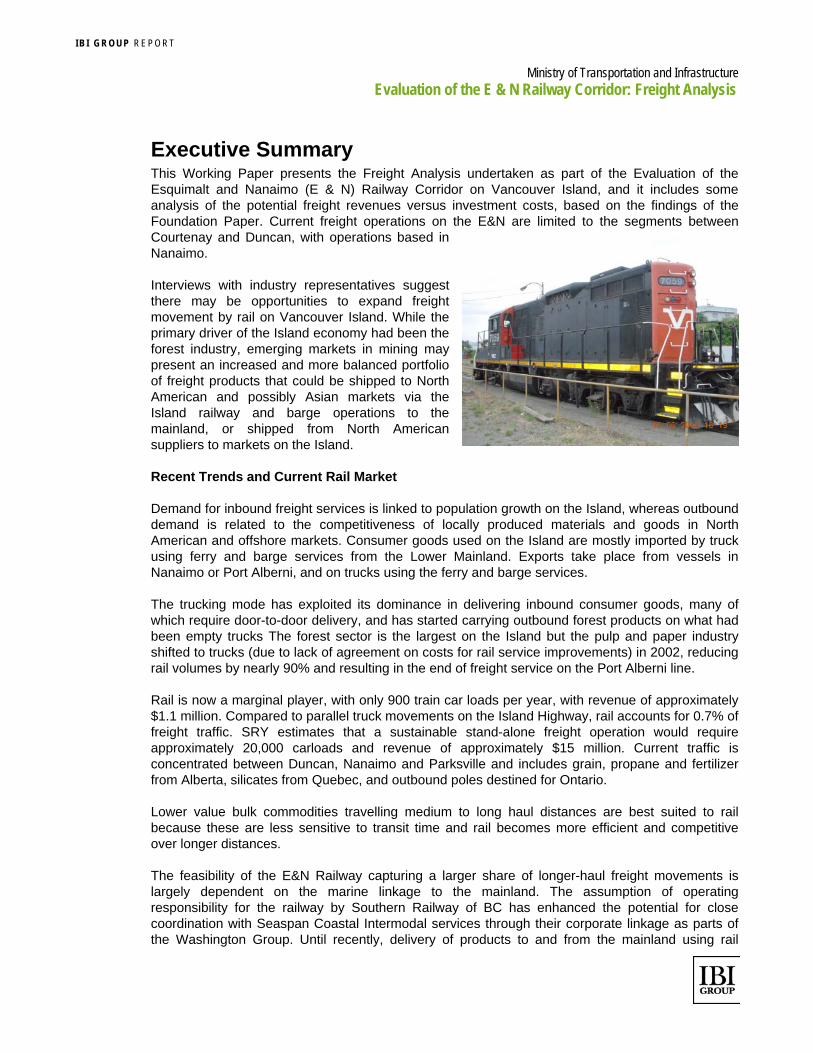
Executive Summary This Working Paper presents the Freight Analysis undertaken as part of the Evaluation of the Esquimalt and Nanaimo (E & N) Railway Corridor on Vancouver Island, and it includes some analysis of the potential freight revenues versus investment costs, based on the findings of the Foundation Paper. Current freight operations on the E&N are limited to the segments between Courtenay and Duncan, with operations based in Nanaimo.
Interviews with industry representatives suggest there may be opportunities to expand freight movement by rail on Vancouver Island. While the primary driver of the Island economy had been the forest industry, emerging markets in mining may present an increased and more balanced portfolio of freight products that could be shipped to North American and possibly Asian markets via the Island railway and barge operations to the mainland, or shipped from North American suppliers to markets on the Island.
Recent Trends and Current Rail Market
Demand for inbound freight services is linked to population growth on the Island, whereas outbound demand is related to the competitiveness of locally produced materials and goods in North American and offshore markets. Consumer goods used on the Island are mostly imported by truck using ferry and barge services from the Lower Mainland. Exports take place from vessels in Nanaimo or Port Alberni, and on trucks using the ferry and barge services.
The trucking mode has exploited its dominance in delivering inbound consumer goods, many of which require door-to-door delivery, and has started carrying outbound forest products on what had been empty trucks The forest sector is the largest on the Island but the pulp and paper industry shifted to trucks (due to lack of agreement on costs for rail service improvements) in 2002, reducing rail volumes by nearly 90% and resulting in the end of freight service on the Port Alberni line.
Rail is now a marginal player, with only 900 train car loads per year, with revenue of approximately $1.1 million. Compared to parallel truck movements on the Island Highway, rail accounts for 0.7% of freight traffic. SRY estimates that a sustainable stand-alone freight operation would require approximately 20,000 carloads and revenue of approximately $15 million. Current traffic is concentrated between Duncan, Nanaimo and Parksville and includes grain, propane and fertilizer from Alberta, silicates from Quebec, and outbound poles destined for Ontario.
Lower value bulk commodities travelling medium to long haul distances are best suited to rail because these are less sensitive to transit time and rail becomes more efficient and competitive over longer distances.
The feasibility of the E&N Railway capturing a larger share of longer-haul freight movements is largely dependent on the marine linkage to the mainland. The assumption of operating responsibility for the railway by Southern Railway of BC has enhanced the potential for close coordination with Seaspan Coastal Intermodal services through their corporate linkage as parts of the Washington Group. Until recently, delivery of products to and from the mainland using rail

I B I G R O U P R E P O R T
Ministry of Transportation and Infrastructure Evaluation of the E & N Railway Corridor: Freight Analysis
Page 2
service was hampered by the low frequency of barge operations to the Tilbury terminal, which was purchased by Washington Group from CP. Rail freight service has been effectively limited to one sailing per week due to infrequent deliveries of railcars to Tilbury by CP from the Port Coquitlam yard. The resulting single weekly sailing substantially increases transit time for rail shipments on and off the Island. The impact has been particularly severe for shipments off the island, since empty cars must be delivered for loading one week and loads cannot be returned to the Mainland until the following week. This is expected to improve when a new barge ramp on Annacis Island opens. Construction of this facility started in mid-2009. The operator plans to have at least one mixed rail/truck barge per day.
Rail market share for freight depends on its ability to compete with truck and barge on time and costs, and relative shipping prices may change if fuel prices climb dramatically (but rail would not be immune to price pressures on fuel). The viability of freight services for various commodities will depend on overall demand for freight services, commodity types, shippers’ service requirements, size of shipments, comparative costs, and the efficiency of multimodal transfers of freight between shipment origin and destination.
Analysis of other goods movement costs between the Island and the mainland, including ferry costs, suggests up to $1000 per full rail car load might be achievable in gross revenues. Typically, 80% of the fees cover the variable costs associated with providing the freight service and 20% contributes towards the fixed costs (and potentially the profits) of the railway system.
Goods Movement along the Corridor
To support an investigation of current and future rail freight market potential, goods movement data collection was carried out at two truck weigh scales (Duncan and Parksville) along the Island Highway, which runs parallel to the railway. This was used in conjunction with data from the rail operation to develop a profile of the overall freight market, as shown in Exhibit E.1.
Exhibit E.1 – Freight Commodities – Island Highway and E&N Railway
This market has an average size equivalent to 1,875 trucks per day (assuming 2.2 trucks are equivalent to one rail car). The current volume of rail cars – 900 per year – is equivalent to only 1980 trucks per year (or 7 per day), while the Island Highway typically sees 450 to 500 trucks per
Feed/Fertilizer1%
Agricultural/Food1% Gravel/Sand
2%
Forest Products20%
Other Bulk Goods/Fuel
3%Consumer
Goods/Machinery /Other
36%
Empty35%
Freight Commodities ‐ Truck and Rail

I B I G R O U P R E P O R T
Ministry of Transportation and Infrastructure Evaluation of the E & N Railway Corridor: Freight Analysis
Page 3
day per direction north and south of Nanaimo. The current share carried by rail is therefore estimated at 0.7%.
Potential Long-Term Freight Markets
In addition to continuing existing freight service, several other opportunities were identified during the technical review and by stakeholders:
The existing market may grow in proportion to population increases.
There is some potential to serve forest mills in the Duncan area if spur lines were constructed, and forest mills around Port Alberni if that line were restored to service. Assuming that the market can recover to recent outputs (the average from 2005 through 2007 was 40% higher) and that rail can recapture some of this market, activity levels on the railway could nearly double from 2008.
Mining-related shipments from south of Courtenay for marine export through Port Alberni have also been noted as potentially significant traffic; the company planning to open a mine is studying two transportation alternatives in support of their proposal, one being rail service. A decision is expected before the end of 2009. The mine may produce 1 to 1.5 million tonnes per year, equivalent to some 10,000 to 15,000 rail cars shipped.
Shipments of aggregates from the North Island to Victoria had also been identified as potential future traffic once other supplies (e.g. Sechelt) accessible by barge have been depleted. This traffic would require tracks and possibly some bridges to be upgraded south of Duncan. Given the potential costs and the lower rates that would be required to compete against barge shipments (barge costs per tonne are fairly low), if this market did switch to rail, it would not likely contribute significantly to revenues.
If these markets could be captured, then the future rail mode share would increase from 0.7% now to 1.4% without the mine and at least 5% with the mine open. This would correspond to 35 to 40 rail cars per weekday or 11,600 rail cars per year in rail car volume. Exhibits E.2 and E.3 depict the overall freight market by mode, and the potential annual rail volumes.
Exhibit E.2 – Existing/Potential Freight Market (Daily) – Mode Split
‐
500
1,000
1,500
2,000
2,500
2009 2026 (No Mine) 2026 with Mine
10 24.9 98.2
1,866
2,340 2,340
Average
Daily Volume (Equivalent Truckloads)
Year/Scenario
Vancouver Island Freight Market ‐ Island Highway/E&N Rail Corridor
Truck
Rail
I B I G R O U P R E P O R T
Ministry of Transportation and Infrastructure Evaluation of the E & N Railway Corridor: Freight Analysis
Page 4
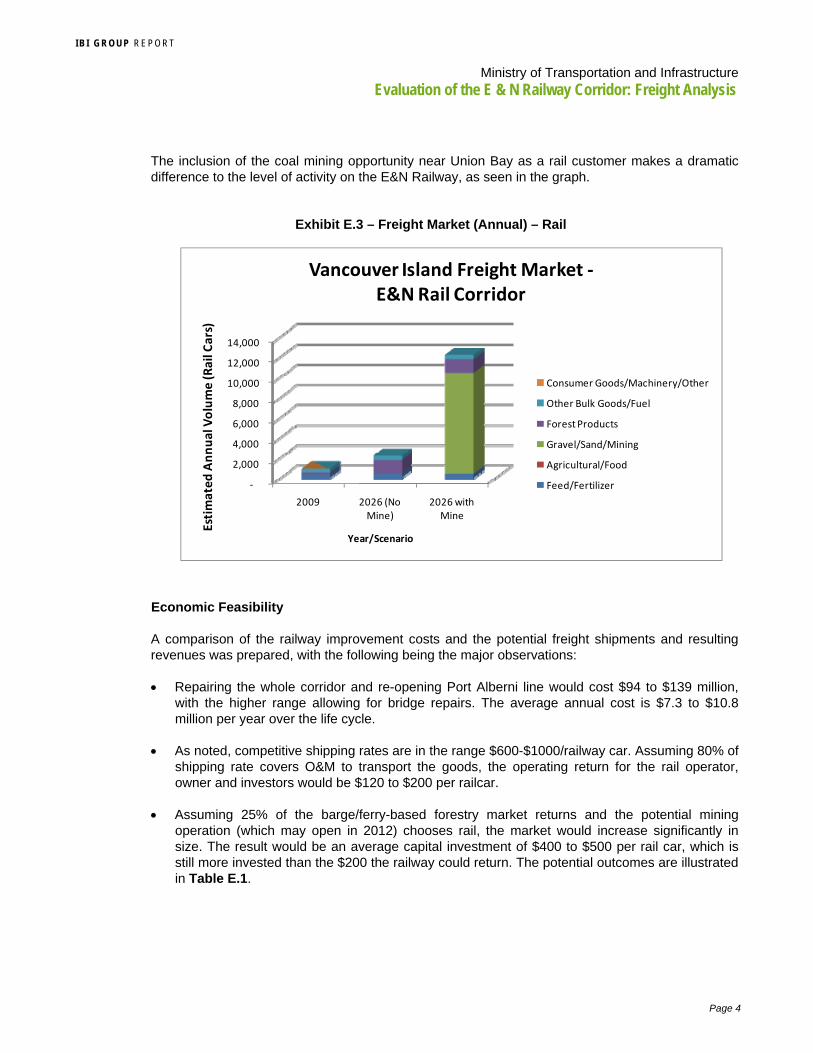
The inclusion of the coal mining opportunity near Union Bay as a rail customer makes a dramatic difference to the level of activity on the E&N Railway, as seen in the graph.
Exhibit E.3 – Freight Market (Annual) – Rail
Economic Feasibility
A comparison of the railway improvement costs and the potential freight shipments and resulting revenues was prepared, with the following being the major observations:
Repairing the whole corridor and re-opening Port Alberni line would cost $94 to $139 million, with the higher range allowing for bridge repairs. The average annual cost is $7.3 to $10.8 million per year over the life cycle.
As noted, competitive shipping rates are in the range $600-$1000/railway car. Assuming 80% of shipping rate covers O&M to transport the goods, the operating return for the rail operator, owner and investors would be $120 to $200 per railcar.
Assuming 25% of the barge/ferry-based forestry market returns and the potential mining operation (which may open in 2012) chooses rail, the market would increase significantly in size. The result would be an average capital investment of $400 to $500 per rail car, which is still more invested than the $200 the railway could return. The potential outcomes are illustrated in Table E.1.
‐
2,000
4,000
6,000
8,000
10,000
12,000
14,000
2009 2026 (No Mine)
2026 with Mine
Estimated Annual Volume (R
ail Cars)
Year/Scenario
Vancouver Island Freight Market ‐E&N Rail Corridor
Consumer Goods/Machinery/Other
Other Bulk Goods/Fuel
Forest Products
Gravel/Sand/Mining
Agricultural/Food
Feed/Fertilizer

I B I G R O U P R E P O R T
Ministry of Transportation and Infrastructure Evaluation of the E & N Railway Corridor: Freight Analysis
Page 5
Table E.1 – Outcomes: Average Investment per Rail Car
Scenario Freight Volume
(including other flows)
Average Investment (Basic Corridor Costs
of $94 M)
Average Investment ($139 M incl. Bridge
Upgrades)
Mine produces 1 M tonnes per year
11,650 cars per year $630 / rail car $930 / rail car
Mine produces 1.5 M tonnes per year
16,500 cars per year $440 / rail car $650 / rail car
If the railway were able to capture 35,000 to 40,000 rail cars of activity, then the average investment in the railway would be less than $200 per rail car of goods (based on the capital cost of $94 Million). This is illustrated by Exhibit E.4. Optimistically, this would match the higher end of potential operating returns. If shipping prices by truck did not increase, then the rates would have to be lower (say $600 per rail car), in which case an even higher rail volume would need to be carried to match the original investment.
Exhibit E.4 – Average Freight Investments Versus Revenues

I B I G R O U P R E P O R T
Ministry of Transportation and Infrastructure Evaluation of the E & N Railway Corridor: Freight Analysis
Page 6
1. INTRODUCTION
This draft Working Paper presents the Freight Analysis undertaken as part of the Evaluation of the Esquimalt and Nanaimo (E & N) Railway Corridor on Vancouver Island, and it includes some analysis of the potential freight revenues versus investment costs, based on the findings of the Foundation Paper. This is one of a series of working papers covering the freight, passenger, and tourism markets, the feasibility of commuter rail, and an update of railway corridor conditions and potential improvement costs.
Current freight operations on the E&N are limited to the segments between Courtenay and Duncan, with operations based in Nanaimo. These are shown on Exhibit 1.1. The red dashed line between the Nanaimo waterfront and Fraser River represents the now-weekly rail barge service.
Exhibit 1.1 - E & N Railway Corridor, Vancouver Island

I B I G R O U P R E P O R T
Ministry of Transportation and Infrastructure Evaluation of the E & N Railway Corridor: Freight Analysis
Page 7
2. VANCOUVER ISLAND FREIGHT DEMAND
The demand for freight transportation is a derived demand, based on consumption and production activity in the local economy. In the context of this study, the key drivers of demand are personal consumption and industrial production (for both local and export markets). The demand for inbound freight services is driven primarily by the consumption needs of the population; the demand for outbound services depends on the competitiveness of locally produced goods in North American and offshore markets.
The key driver for inbound freight is population. The population of Vancouver Island grew from approximately 680,000 in 1998 to 740,000 in 2008, an increase of 8%. The major population centres are the Capital Region District (including Victoria) and Nanaimo. Consequently these are the major destinations for inbound freight.
Exhibit 2.1 - Vancouver Island Population Trend
These areas also contain the major ferry hubs linking the Island to the Mainland transportation system at terminals in Swartz Bay, Duke Point and Nanaimo. The Nanaimo terminal is the only of these which provides service for rail traffic. In addition, the port of Nanaimo has facilities for handling export cargo for shipment by deep-sea vessels, though the balance has shifted in favour of inbound shipments by ferry.
The other population centres on the Island serve local distribution functions, act as hubs for lower volume ferry routes, and provide access to air transportation through local and regional airports. Port Alberni’s unique location on the West Coast, and its deep-sea access, has made it a hub for outbound shipments of forest products to Japan and other Asian markets. In addition to these facilities, many industrial facilities have wharves for deep-sea vessels or barge ramps for shipments by barge.

I B I G R O U P R E P O R T
Ministry of Transportation and Infrastructure Evaluation of the E & N Railway Corridor: Freight Analysis
Page 8
Most of the consumer goods used on the Island must be imported from outside. This traffic moves almost exclusively by truck via BC Ferries vessels or the Seaspan Coastal Intermodal or Van Isle barge ferry services. The characteristics and service requirements for these commodities are best served by truck, which can offer unrivalled flexibility in service locations and schedules, rapid transit times, and competitive rates, particularly for short haul services.
The Canadian Class 1 railways have adapted to the need for long haul movements of consumer goods through the use of intermodal containers transported on unit trains between large terminals in major centres. Local pickup and delivery services are provided by truck. Rail intermodal service is not a feasible option for Vancouver Island because the traffic volumes are small relative to system volumes, and the Canadian Class 1 railways’ business model does not include delivery of intermodal containers by rail to smaller centres. From this perspective, the delivery of an intermodal container is a local dray from the intermodal terminal to the customer destination.
For these reasons, targeting of inbound consumer goods for transfer from truck to rail service is unlikely to succeed. The key potential markets for increased rail traffic are industrial markets, including inputs for industries producing goods on the Island, and the products from industrial facilities destined for external markets.
For Vancouver Island marine transportation has historically been the dominant competing mode of transport for outbound freight movements, as most points on the Island have ready access to deep sea vessel or barge service. In fact, the location of industrial production facilities in the forestry sector favoured sites with immediate access to tidewater. Marine options typically have relatively lower transportation costs. However, the shift to increased value-added production has presented challenges in terms of service frequency, transit time, and cargo shipment size. To be competitive, rail service will face similar challenges as those experienced by the marine mode.
The traffic for which railways have a competitive advantage is low value, heavy commodities over medium to long haul routes (generally over 500 km). Low value commodities are less sensitive to transit time, large volumes maximize the efficiency of rail loadings, and long haul routes enable the railways to take advantage of their lower tonne-km costs. This provides the strategic focus for our examination of the potential for increases rail freight traffic on the Island rail corridor.

I B I G R O U P R E P O R T
Ministry of Transportation and Infrastructure Evaluation of the E & N Railway Corridor: Freight Analysis
Page 9
3. THE VANCOUVER ISLAND INDUSTRIAL BASE
The level of employment in goods-producing industries is a useful measure of the industrial base in a region. Figures on employment in major goods-producing sectors on Vancouver Island and the Coast are illustrated below1.
Exhibit 3.1 - Vancouver Island Employment in Goods Production
The forest products industry has traditionally been the major goods-producing sector on Vancouver Island. Employment in this sector is classified in the Forestry, Fishing, and Mining sector, and in Manufacturing (which includes pulp and lumber production). Employment in these two categories has seen an absolute decline of 32.6% from 40,800 in 1998 to 27,600 in 2008, and a decline from 12.9% of total employment to 7.0 % over the same period. The growth in employment in the goods-producing sector has been due to higher employment in construction, which saw an increase of 102%.2
3.1 Forest Products
3.1 .1 LOGS
The forest products industry on Vancouver Island is part of the BC Coastal Forest sector, which differs from the Interior sector in the species harvested and in the major market destinations. The dominant product in the Interior is Spruce-Pine-Fir (SPF) dimensional lumber. The Coast sector also produces SPF structural lumber, but also produces a variety of commodity and specialty
1 Employment by Industry for BC, Development Regions, and Metro Areas - Annual Averages BC Stats http://www.bcstats.gov.bc.ca/data/dd/handout/EMPREGN.pdf 2 Ibid.
I B I G R O U P R E P O R T
Ministry of Transportation and Infrastructure Evaluation of the E & N Railway Corridor: Freight Analysis
Page 10
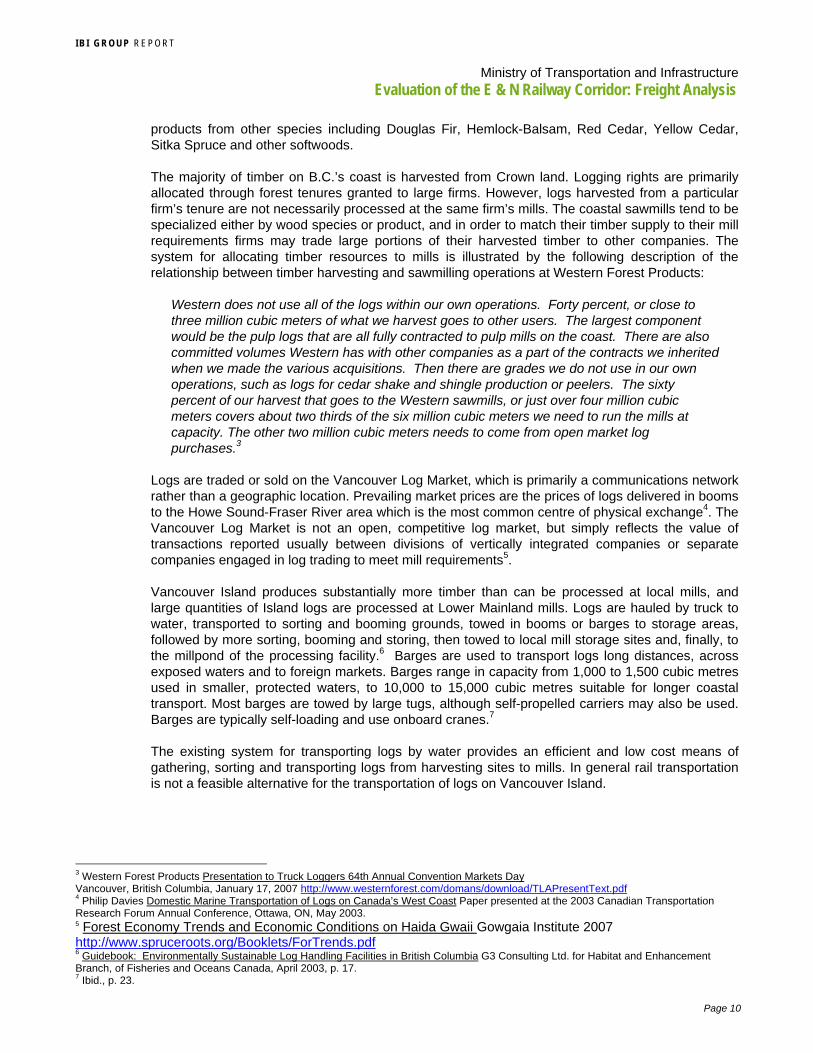
products from other species including Douglas Fir, Hemlock-Balsam, Red Cedar, Yellow Cedar, Sitka Spruce and other softwoods.
The majority of timber on B.C.’s coast is harvested from Crown land. Logging rights are primarily allocated through forest tenures granted to large firms. However, logs harvested from a particular firm’s tenure are not necessarily processed at the same firm’s mills. The coastal sawmills tend to be specialized either by wood species or product, and in order to match their timber supply to their mill requirements firms may trade large portions of their harvested timber to other companies. The system for allocating timber resources to mills is illustrated by the following description of the relationship between timber harvesting and sawmilling operations at Western Forest Products:
Western does not use all of the logs within our own operations. Forty percent, or close to three million cubic meters of what we harvest goes to other users. The largest component would be the pulp logs that are all fully contracted to pulp mills on the coast. There are also committed volumes Western has with other companies as a part of the contracts we inherited when we made the various acquisitions. Then there are grades we do not use in our own operations, such as logs for cedar shake and shingle production or peelers. The sixty percent of our harvest that goes to the Western sawmills, or just over four million cubic meters covers about two thirds of the six million cubic meters we need to run the mills at capacity. The other two million cubic meters needs to come from open market log purchases.3
Logs are traded or sold on the Vancouver Log Market, which is primarily a communications network rather than a geographic location. Prevailing market prices are the prices of logs delivered in booms to the Howe Sound-Fraser River area which is the most common centre of physical exchange4. The Vancouver Log Market is not an open, competitive log market, but simply reflects the value of transactions reported usually between divisions of vertically integrated companies or separate companies engaged in log trading to meet mill requirements5.
Vancouver Island produces substantially more timber than can be processed at local mills, and large quantities of Island logs are processed at Lower Mainland mills. Logs are hauled by truck to water, transported to sorting and booming grounds, towed in booms or barges to storage areas, followed by more sorting, booming and storing, then towed to local mill storage sites and, finally, to the millpond of the processing facility.6 Barges are used to transport logs long distances, across exposed waters and to foreign markets. Barges range in capacity from 1,000 to 1,500 cubic metres used in smaller, protected waters, to 10,000 to 15,000 cubic metres suitable for longer coastal transport. Most barges are towed by large tugs, although self-propelled carriers may also be used. Barges are typically self-loading and use onboard cranes.7
The existing system for transporting logs by water provides an efficient and low cost means of gathering, sorting and transporting logs from harvesting sites to mills. In general rail transportation is not a feasible alternative for the transportation of logs on Vancouver Island.
3 Western Forest Products Presentation to Truck Loggers 64th Annual Convention Markets Day Vancouver, British Columbia, January 17, 2007 http://www.westernforest.com/domans/download/TLAPresentText.pdf 4 Philip Davies Domestic Marine Transportation of Logs on Canada’s West Coast Paper presented at the 2003 Canadian Transportation Research Forum Annual Conference, Ottawa, ON, May 2003. 5 Forest Economy Trends and Economic Conditions on Haida Gwaii Gowgaia Institute 2007 http://www.spruceroots.org/Booklets/ForTrends.pdf 6 Guidebook: Environmentally Sustainable Log Handling Facilities in British Columbia G3 Consulting Ltd. for Habitat and Enhancement Branch, of Fisheries and Oceans Canada, April 2003, p. 17. 7 Ibid., p. 23.

I B I G R O U P R E P O R T
Ministry of Transportation and Infrastructure Evaluation of the E & N Railway Corridor: Freight Analysis
Page 11
3 .1 .2 LUMBER
The Coastal forest sector has faced significant economic challenges over the last 15 years due to the decreasing availability of old-growth timber, high fibre and manufacturing costs, and shifts in market demand. Lumber production in the Coastal sector declined almost 50% from 2004 to 2008 from the equivalent of 2.8 million tonnes to 1.4 million tonnes, as illustrated below8. At 90 tonnes per railcar, the entire Coastal lumber production for 2008 could be accommodated in 16,000 carloads.
Exhibit 3.2 – Forest Industry Production – Recent Trends
The turmoil in the Coastal Forest Sector has resulted in a substantial restructuring of the industry. In 2002 Doman Industries Ltd., one of the largest coastal producers, filed for protection under the Companies’ Creditors Arrangement Act. Following a lengthy period of complex negotiations, a plan of compromise and arrangement was approved by creditors on June 7, 2004 and sanctioned by the British Columbia Supreme Court on June 11. The negotiation and implementation of the plan was led by Tricap Restructuring Fund, an investment fund established by Brascan Corp. and the largest holder of secured notes and unsecured notes of Doman. On July 27, 2004, Doman Industries Ltd. completed its restructuring and emerged from protection under the Companies’ Creditors Arrangement Act, with Western Forest Products Inc. becoming the successor business to Doman.
8 Statistics Canada Service Bulletin: Sawmills Catalogue no. 35 -003-X, various issues. Production figures are shown in tonnes to facilitate transportation needs analysis; production statistics have been converted from cubic metres using a conversion factor of .45 tonnes/cubic metre based on the typical density of major SPF lumber species.

I B I G R O U P R E P O R T
Ministry of Transportation and Infrastructure Evaluation of the E & N Railway Corridor: Freight Analysis
Page 12
In February 2005 Brookfield Asset Management (formerly Brascan) announced it had reached an agreement to purchase Weyerhaeuser’s coastal forest assets, including 258,000 hectares of private Vancouver Island forest lands, rights to 3.6 million cubic metres a year of coastal timber, five sawmills, two remanufacturing plants and $200 million in working capital. Brascan paid $1.4 billion for the Weyerhaeuser assets.9 The properties were subsequently divided between Island Timberlands which retained the timberlands, and Cascadia Forest products which took the operating properties.10
In November 2005 Brookfield Asset Management entered into an agreement to sell Cascadia Forest Products to Western Forest Products. Western Forest Products subsequently acquired Canfor’s Englewood Logging operation on Northern Vancouver Island, including Tree Farm License 37.
As a result of this consolidation, Western Forest Products now dominates the lumber sector on the Island. With the closure of the Timberwest sawmill in Campbell River in May 2008, Western Forest Products accounts for 82.1% of total lumber capacity and 87.8% of mills with capacity greater than 10 million board feet. Details on WFP’s sawmills are shown below11 in Table 3.1.
Table 3.1 – Sawmill Capacities and Transportation Access
Western Forest Products Sawmill Capacity and Transportation Access
Sawmills Location Capacity (MMFBM)
Capacity (000
Tonnes) Current Status Vessel Barge
Rail (direct)
Alberni Pacific Port Alberni 190 202 Operating X X
Somass Port Alberni 110 117 Idle X
Chemainus Chemainus 120 127 Operating X
Cowichan Bay Cowichan Bay 144 153 Operating
Ladysmith Ladysmith 120 127 Idle
Duke Point Nanaimo 108 115 Idle X
Nanaimo Nanaimo 154 164 Idle X
Total 946 1005
Total Operating Capacity 482
As with logging, the lumber sector is integrated to some degree with Lower Mainland mills. A portion of the lumber produced at Island sawmills undergoes further processing at Lower Mainland remanufacturing facilities. Currently lumber is transported off of the Island by truck via either BC Ferries or the Seaspan Coastal Intermodal barge ferries or directly by barge. Large quantities are transferred to lumber reload centres in the Lower Mainland for transfer to rail cars for North American shipments or to containers for shipment overseas.
9 “Brascan buys B.C. coastal lumber assets for $1.4 billion” Vancouver Sun February 19, 2005. http://www.coastforest.org/media_pdf/brascan_buys_assets.pdf 10 Brookfield’s Activities in the Timberlands and Restructuring Side of the Industry Presentation to: PWC 19th Annual Global Forest and Paper Industry Conference, 11 May 2006 https://www.pwc.com/extweb/industry.nsf/docid/E407464A1BE67E918525710D007AC356/$File/Reid_Carter_presentation.pdf 11 Capacity estimates are from Major Primary Timber Processing Facilities In British Columbia 2006 BC Ministry of Forests and Range Economics and Trade Branch.

I B I G R O U P R E P O R T
Ministry of Transportation and Infrastructure Evaluation of the E & N Railway Corridor: Freight Analysis
Page 13
3 .1 .3 PULP AND PAPER
The pulp and paper sector on Vancouver Island has faced challenges similar to those of the lumber sector. A list of facilities on the Island is shown below12 in Table 3.2.
Table 3.2– Pulp/Paper Mill Capacities and Transportation Access
Vancouver Island Pulp and Paper Mills
Company Location Pulp Capacity (000 Tonnes)
Paper Capacity (000
Tonnes) Vessel Barge Rail
Catalyst Paper Campbell River 776 616
Catalyst Paper Crofton 677 508 X X
Catalyst Paper Port Alberni 185 307 X X X
Nanaimo Forest Products Cedar 407 X x
Port Alice Pulp Mill Port Alice 179 X
Catalyst Paper is the largest firm, with pulp and paper operations at Crofton, Port Alberni and Campbell River (Elk Falls). In February 2009 Catalyst announced the indefinite curtailment of the Crofton No. 1 paper machine, the Elk Falls No. 2 and No. 5 paper machines, and NBSK pulp production at Crofton. All three paper machines at Elk Falls are now indefinitely curtailed, and curtailments also took place at the Port Alberni mill in the first quarter.13 The Nanaimo Forest Products mill was previously the Harmac mill owned by Pope and Talbot. The mill was purchased by NFP, a four-way partnership that includes Harmac's workers and three private partners, for $13.2 million in 2008 after Pope & Talbot went bankrupt.
3 .1 .4 OTHER FOREST PRODUCTS
In addition to the major lumber, pulp and paper facilities there are 3 wood chip mills14:
Table 3.3 – Wood Chip Mill Capacities
Vancouver Island Chip Mills
Company Location Capacity
(000 BDU's)
Campbell River Fibre Ltd. Campbell River 113
DCT Chambers Trucking Ltd. Chemainus 187
Western Forest Products Ltd. Nanaimo 326
There is also a veneer mill operated by Coastland Wood Industries in Nanaimo. In addition, the Island has a number of smaller facilities producing utility poles and shakes and shingles.
12 Ibid. 13 “Catalyst improves Q1 results despite declining markets” Catalyst Paper Corporation news release April 29, 2009. http://www.catalystpaper.com/pressreleases/q1-april2009pr.pdf
I B I G R O U P R E P O R T
Ministry of Transportation and Infrastructure Evaluation of the E & N Railway Corridor: Freight Analysis
Page 14
3 .1 .5 MAJOR FOREST FACIL IT IES ON THE ISLAND RAIL CORRIDOR
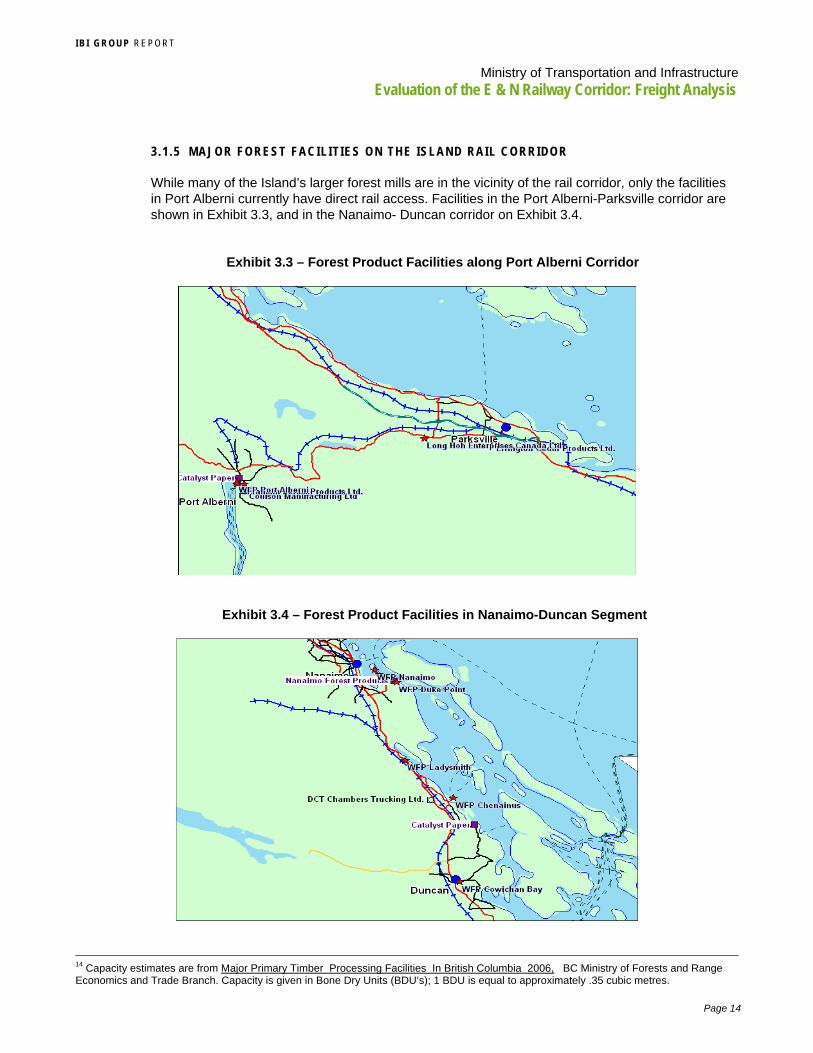
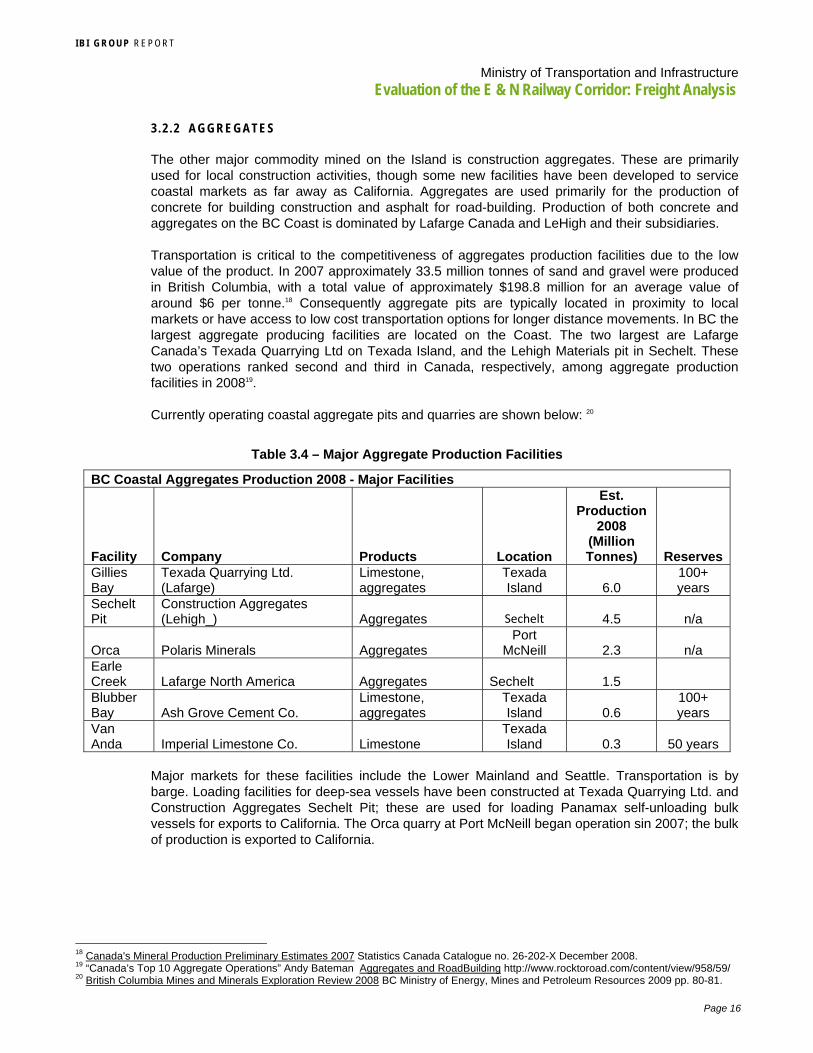
While many of the Island’s larger forest mills are in the vicinity of the rail corridor, only the facilities in Port Alberni currently have direct rail access. Facilities in the Port Alberni-Parksville corridor are shown in Exhibit 3.3, and in the Nanaimo- Duncan corridor on Exhibit 3.4.
Exhibit 3.3 – Forest Product Facilities along Port Alberni Corridor
Exhibit 3.4 – Forest Product Facilities in Nanaimo-Duncan Segment
14 Capacity estimates are from Major Primary Timber Processing Facilities In British Columbia 2006, BC Ministry of Forests and Range Economics and Trade Branch. Capacity is given in Bone Dry Units (BDU’s); 1 BDU is equal to approximately .35 cubic metres.

I B I G R O U P R E P O R T
Ministry of Transportation and Infrastructure Evaluation of the E & N Railway Corridor: Freight Analysis
Page 15
There are no large sawmills, pulp and paper operations, or chip mills in the Parksville-Courtenay portion of the corridor.
In conclusion, there are three major clusters of timber processing activity within the Island Railway Corridor: Port Alberni, the Cowichan-Chemainus-Ladysmith area between Duncan and Nanaimo, and Nanaimo. Of these, only the first two represent potential opportunities for rail traffic, as the Nanaimo facilities are located at Duke Point with direct access to barge, barge ferry and vessel facilities.
3.2 Mining
3 .2 .1 COAL AND METALS
The largest active mining operation on Vancouver Island is Hillsborough Resources’ Quinsam coal mine. Quinsam is an underground mine located 31 km southwest of Campbell River. Production is approximately 500,000 tonnes per year of thermal coal. The mine started production in 1987 as an open pit mine, but was fully converted to underground mining in 1994.15 The major customers for the mine’s production are cement producers and energy utilities with coastal facilities in the Pacific Northwest. Additional product is sold to offshore customers in global markets.
The coal is trucked approximately 32 km to the company’s Middlepoint Barge Loading Facility, which has a storage capacity of 15,000 tonnes and a loading rate of 20,000 tonnes per hour. International shipments are barged to Texada Island where the coal is transferred to vessel at the Texada Island Loading Facility.
Compliance Energy Corporation is exploring the feasibility of a new coal mine to exploit the Raven Coal Deposit in a joint venture with Itochu Corporation and LG International. The Raven Coal Deposit is near Union Bay, 80km northwest from Nanaimo, BC, and approximately 60 km southeast of the Quinsam Coal Mine. Plans are for a mine producing 1 to 1.5 million tonnes per year of coal at the site. Technical trials are under way to determine the viability of producing for metallurgical markets, and an environmental assessment is also under way.
The company is also undertaking a study on transportation options. Three options are under consideration: trucking to Middle Point and transportation by barge to a deepsea terminal at Texada or the Lower Mainland (similar to the existing Quinsam operation); rail to Duke Point, which would require construction of a new port terminal and a spur line to Duke Point; or rail to Port Alberni, which would require construction of a new port terminal and rehabilitation of the rail line to Port Alberni. The mine site is approximately 90 km from each of these potential port terminal locations, and approximately 2 km from the existing rail line. A final decision on the preferred option is expected by spring 2010 and if the mine proceeds production could start in 2012.
Breakwater Resources operates a mine producing zinc and copper concentrates at Myra Falls, approximately 90 km southwest of Campbell River. Production in 2008 was approximately 70,000 tonnes of concentrates. Zinc and copper concentrates from the Myra Falls mine are transported from the property in 38-tonne truck/trailer units 90km to Discovery Terminal, a deep-sea docking facility located in Campbell River. Draft limitation for the ore terminal is 10.5 metres.16 The concentrates are loaded onto barges or ships for smelters in Asia, Europe and North America.17
15 “Quinsam’s high tide” Mining Magazine March 2007 pp. 15-18 16 Controlling Depths and Guidelines for All Berths Pacific Pilotage Authority Jan. 20, 2009. 17 http://wikimapia.org/3325030/Discovery-Terminal
I B I G R O U P R E P O R T
Ministry of Transportation and Infrastructure Evaluation of the E & N Railway Corridor: Freight Analysis
Page 16
3 .2 .2 AGGREGATES
The other major commodity mined on the Island is construction aggregates. These are primarily used for local construction activities, though some new facilities have been developed to service coastal markets as far away as California. Aggregates are used primarily for the production of concrete for building construction and asphalt for road-building. Production of both concrete and aggregates on the BC Coast is dominated by Lafarge Canada and LeHigh and their subsidiaries.
Transportation is critical to the competitiveness of aggregates production facilities due to the low value of the product. In 2007 approximately 33.5 million tonnes of sand and gravel were produced in British Columbia, with a total value of approximately $198.8 million for an average value of around $6 per tonne.18 Consequently aggregate pits are typically located in proximity to local markets or have access to low cost transportation options for longer distance movements. In BC the largest aggregate producing facilities are located on the Coast. The two largest are Lafarge Canada’s Texada Quarrying Ltd on Texada Island, and the Lehigh Materials pit in Sechelt. These two operations ranked second and third in Canada, respectively, among aggregate production facilities in 200819.
Currently operating coastal aggregate pits and quarries are shown below: 20
Table 3.4 – Major Aggregate Production Facilities
BC Coastal Aggregates Production 2008 - Major Facilities
Facility Company Products Location
Est. Production
2008 (Million Tonnes) Reserves
Gillies Bay
Texada Quarrying Ltd. (Lafarge)
Limestone, aggregates
Texada Island 6.0
100+ years
Sechelt Pit
Construction Aggregates (Lehigh_) Aggregates Sechelt 4.5 n/a
Orca Polaris Minerals Aggregates Port
McNeill 2.3 n/a Earle Creek Lafarge North America Aggregates Sechelt 1.5 Blubber Bay Ash Grove Cement Co.
Limestone, aggregates
Texada Island 0.6
100+ years
Van Anda Imperial Limestone Co. Limestone
Texada Island 0.3 50 years
Major markets for these facilities include the Lower Mainland and Seattle. Transportation is by barge. Loading facilities for deep-sea vessels have been constructed at Texada Quarrying Ltd. and Construction Aggregates Sechelt Pit; these are used for loading Panamax self-unloading bulk vessels for exports to California. The Orca quarry at Port McNeill began operation sin 2007; the bulk of production is exported to California.
18 Canada's Mineral Production Preliminary Estimates 2007 Statistics Canada Catalogue no. 26-202-X December 2008. 19 “Canada’s Top 10 Aggregate Operations” Andy Bateman Aggregates and RoadBuilding http://www.rocktoroad.com/content/view/958/59/ 20 British Columbia Mines and Minerals Exploration Review 2008 BC Ministry of Energy, Mines and Petroleum Resources 2009 pp. 80-81.

I B I G R O U P R E P O R T
Ministry of Transportation and Infrastructure Evaluation of the E & N Railway Corridor: Freight Analysis
Page 17
The locations of large coastal aggregate mining operations circa 2004 are shown below.
Exhibit 3.5 – Aggregate Mining Operations – Coastal and Vancouver Island
The major recent change has been closure of Producer’s Pit which was the major source of construction aggregates for the Victoria region. Producer's Pit started production in 1910 and continued until early 2008. It was most recently owned and operated by Construction Aggregates Limited, a subsidiary of Lehigh Northwest Cement Ltd. Historically this pit produced over 60 million tonnes of aggregate and was a major supplier not only to the surrounding area, but also to Vancouver and Seattle21. Production at Producers Pit in 2007 was 1.9 million tonnes.22 Since closure of Producer’s Pit, Construction Aggregates has been sourcing aggregates from their Sechelt Pit via barge to their Victoria materials Depot in Victoria Harbour.
21 MINFILE Record Summary PRODUCER'S PIT, LEHIGH, METCHOSIN GRAVEL PIT, CONSTRUCTION AGGREGATES BC Ministry of Energy and Mines http://minfile.gov.bc.ca/Summary.aspx?minfilno=092B%20%20153 22 British Columbia Mines and Minerals Exploration Review 2007 BC Ministry of Energy, Mines and Petroleum Resources 2008 p. 10.

I B I G R O U P R E P O R T
Ministry of Transportation and Infrastructure Evaluation of the E & N Railway Corridor: Freight Analysis
Page 18
4. RAIL FREIGHT ON VANCOUVER ISLAND
4.1 Current Rail Freight Services
Historically the E&N railway and rail barge service were operated as an integrated service by CP. The existing arrangements relating to the Tilbury terminal operated by Seaspan Coastal Intermodal Company (SCIC) have seriously hampered the potential for rail service improvements. SCIC was formed by Washington Group to operate the barge service following purchase of the CP barge facilities in 1998. Under the terms of purchase, CP retained responsibility for marketing of rail service on the Island, and for delivery of cars to the terminal. Rail service has been limited to one sailing per week. Rail traffic is carried on a “rail-only” barge departing on Monday at 3:30 pm. The single weekly sailing substantially increases transit time for rail shipments on and off the Island. The impact is particularly severe for shipments off of the island, since empty cars must be delivered for loading one week and loads cannot be returned to the Mainland until the following week. CP’s retention of marketing responsibility has also made it more difficult for Island shippers to arrange connections with other North American Class 1 railways. SRVI is currently paid a haulage rate per car by CP for freight traffic on the Island. Rail rates to shippers connecting to the CP network are set by CP.
Existing barge facilities include terminals at Tilbury in Delta on the Fraser River, downtown Nanaimo, and Swartz Bay serving the Victoria area. The Tilbury terminal has 2 working berths capable of handling truck or rail traffic and 3 lay over berths, which accommodate the vessel fleet.
4.2 Current Rail Freight Traffic
Freight traffic on the E&N rail corridor averaged around 8000 carloads per year until 2002. The major shipper was Catalyst Paper’s Port Alberni Mill. In 2002 Catalyst shifted this traffic to truck, and traffic fell to around 900 carloads per year. Traffic has remained below 1000 carloads per year, with four main customers accounting for the majority of the traffic: Top Shelf Feeds, Superior Propane, National Silicates and Lafarge.23 All of this traffic consists of inbound commodity shipments, primarily for industrial consumption. Since taking over operation of the rail line, Southern Railway of Vancouver Island (SRVI) has succeeded in attracting one shipper for outbound forest products (poles) originating in Courtenay.
Current commodity traffic on SRVI fits the typical pattern for rail shipments: relatively low value, heavy commodities over medium to long haul routes. Major inbound commodities include grain, propane, fly ash, biodiesel, and sodium silicate. Outbound shipments consist of poles for further processing in eastern Canada.
23 Vancouver Island Rail Corridor Socio-Economic Assessment Final Report Prepared for The Island Corridor Foundation and Southern Railway of Vancouver Island by College transportation Consulting Inc. July 2007 pp. 6-7.

I B I G R O U P R E P O R T
Ministry of Transportation and Infrastructure Evaluation of the E & N Railway Corridor: Freight Analysis
Page 19
The location of current major shippers is illustrated below. Note that Lafarge traffic is transloaded to truck at the SRVI yard in Nanaimo.
Exhibit 4.1 – Current Rail Shippers on Vancouver Island
The origins of current SRVI traffic are shown below: note that currently inbound traffic far exceeds outbound, at 86% of total traffic.
Exhibit 4.2 – Current Rail Carload Origins and Destinations
Alberta 44%
Other Western Canada
21%
US19%
Vancouver Island14%
Quebec2%
Current SRVI Carloads by Origin

I B I G R O U P R E P O R T
Ministry of Transportation and Infrastructure Evaluation of the E & N Railway Corridor: Freight Analysis
Page 20
Nanaimo45%
Duncan34%
Eastern Canada
14%
Parksville7%
Current SRVI Carloads by Destination
Approximately 45% of existing traffic is destined to Nanaimo, either to local destination or for transloading to truck in the SRVI rail yard. This traffic is not directly dependent on the rail infrastructure on the rest of the Island.
In summary, the existing SRVI traffic base consists of the type of traffic we have identified as the highest potential for competitive rail service: bulk industrial commodities traveling over long distances.
4.3 Potential Rail Freight Service Improvements
Southern Railway of BC has recently announced construction of a new barge ramp to handle trucks and rail cars on Annacis Island. Total cost of the project is estimated at approximately $11.5 million, of which Transport Canada will contribute up to $4.5 million under their Shortsea Shipping Initiative24. This facility will enable Southern Railway to dramatically increase service levels to Vancouver Island through more frequent sailings for combined rail car and truck traffic. It will also facilitate interline connections to Class 1 railways other than CP Rail including CN, BNSF and Union Pacific. CN and BNSF traffic is exchanged locally; SRY connects with UP via BNSF under a traffic solicitation arrangement imposed by the U.S. Surface Transportation Board as a condition of the Burlington Northern and Santa Fe Railroad merger.
24 “The Government of Canada Invests Over $20 Million in British Columbia's Transportation System” Transport Canada Press release September 5, 2008.

I B I G R O U P R E P O R T
Ministry of Transportation and Infrastructure Evaluation of the E & N Railway Corridor: Freight Analysis
Page 21
5. VANCOUVER ISLAND TRUCK TRAFFIC
Though hard data is difficult to obtain, it seems clear that trucking dominates both inbound and outbound freight movements on the Island. As a means of assessing the volume of freight currently moving on Vancouver Island, and the magnitude of traffic potentially available to the railway, we have undertaken an extensive analysis of truck traffic on Vancouver Island. This analysis included an examination of truck movements by ferry between Vancouver Island and the Lower Mainland, a review of truck traffic statistics from BC Ministry of transportation traffic count stations, and roadside surveys at BC MOT weigh scales at Parksville and Duncan to gather additional data on the composition and distribution of freight traffic on Vancouver Island.
5.1 Truck Ferries
By its geography Vancouver Island freight traffic is critically dependent on the marine linkages to the Mainland. There are four major operators offering ferry service to trucks for Vancouver Island: BC Ferries, Seaspan Coastal Intermodal, Van Isle Barge and Black Ball Ferry Line.
Black Ball Ferries operates the MV Coho, which has plied the waters between Victoria and Port Angeles, Washington since 195. For some Vancouver Island shippers it is a constant commercial link between Vancouver Island and destinations in the Pacific Northwest. The Coho remains an important transportation link to Vancouver Island because it services all sectors. The ferry can accommodate 1,000 passengers and 120 vehicles on each sailing, and provides a commercial link between the U.S. and the Island for produce and lumber while acting as a tourist-ferry service and even as a commuter service. It is the most direct link south, for Vancouver Island based forest products trying to access the US market. The frequency of sailings varies with the season from a low of one trip a day in January to four trips during peak summer season. Tour buses and commercial trucks are required to call Blackball for rates & reservations.
There are three services linking the Island with the Lower Mainland:
BC Ferries provides commercial vehicle service between the Lower Mainland and Vancouver Island on their roll on/roll off ferry vessels. The primary services for commercial vehicles are the Spirit and Coastal Class vessels serving the - Swartz Bay and Tsawassen – Duke Point routes. These vessels have nominal capacities of 34 and 32 semi-trailers respectively.
Seaspan Coastal Intermodal Company provides a drop-trailer service on routes linking the Tilbury terminal to downtown Nanaimo and Swartz bay. The fleet consists of four roll on, roll off, self-propelled ferries, an articulating tug and barge unit and a towed-barge specially customized for this service.
Van Isle Barge provides service between a terminal on the Fraser River in Surrey and Duke Point in Nanaimo. The Van Isle service was initiated to handle the Catalyst paper traffic which was transferred from rail to truck in 2002. The Van Isle fleet includes 3 purpose built Articulating Tug-Barge combinations that are both self-powered and "pushed" by third party tugboats. Two barges are currently in service while the third barge is nearing completion of its conversion from a tow ocean-going barge to a coastal pusher barge. The vessels currently in service include the Arctic Hooper/Fraser Link, and the Sea Link Pusher/Van Isle Link, each with a capacity of 44 trailers.
These three services provide a combine capacity of approximately 275 semitrailer trucks per weekday to Nanaimo (including Duke Point), and 310 per day to Swartz Bay. These services make Victoria and Nanaimo the predominant regional hubs for truck traffic. Details on schedules and capacities are provided in Appendix A.

I B I G R O U P R E P O R T
Ministry of Transportation and Infrastructure Evaluation of the E & N Railway Corridor: Freight Analysis
Page 22
All ferry operators were approached for data on typical traffic volumes, but none agreed to do so, citing commercial confidentiality.
5.2 Vancouver Island Traffic Counts
The BC Ministry of Transportation maintains a system of permanent count stations to gather data on traffic volumes on provincial highways. Some of these stations are equipped to classify vehicles by length, which makes it possible to separate data on truck volumes from overall traffic counts. The data from this system provides an indication of the overall volume of truck traffic travelling on the regional highway system.
The locations of permanent count stations on Vancouver Island are shown in Exhibit 5.1:
Exhibit 5.1 – Vancouver Island Traffic Count Locations
Classification counters for traffic relevant to this study are located at locations P12-2 (Cedar Road), P12-3 (Cassidy), P12-4 (Hidden Hill), and P14-5 (Buckley Bay).
The length categories of interest are 12.5 to 22.5 metres, which includes standard semitrailers (maximum vehicle length 20 metres) and 22.5 to 35 metres (including B-trains with a maximum vehicle length of 23 metres). Logging trucks may fit into either category, depending on their configuration. The legal length for a logging truck two-vehicle combination with one articulating point is 21.5 metres. Logging truck combinations with more than one articulating point are allowed 23 metres overall length.25
Monthly data on average daily truck movements by category was obtained from BC Ministry of Transportation for the count stations identified above.
25 “Frequently Asked Questions” BC Ministry of Transportation and Highways Commercial Vehicle Safety Enforcement http://www.th.gov.bc.ca/cvse/faqs.htm

I B I G R O U P R E P O R T
Ministry of Transportation and Infrastructure Evaluation of the E & N Railway Corridor: Freight Analysis
Page 23
P12-2 Cedar Road
This count station is located at the interchange between Cedar Road and the Island Highway in Nanaimo; this location should pick up northbound traffic from the Duke Point ferry terminals (BC Ferries and Van Isle barge) and southbound traffic destined to these terminals, as well as north-south intra-Island traffic and traffic to and from Port Alberni.
Average daily northbound truck traffic for vehicle lengths 12.5 to 22.5 metres at this site is illustrated in Exhibit 5.2. Northbound traffic in the 22.5 metre to 35 metre category for the same period is illustrated in the second chart. The traffic pattern typically has a seasonal peak in the summer and relatively low volumes through the winter months. There is little growth annual growth apparent in this example.
Exhibit 5.2 – Daily Truck Traffic Volumes (by Month), Island Highway at Cedar Road, Nanaimo

I B I G R O U P R E P O R T
Ministry of Transportation and Infrastructure Evaluation of the E & N Railway Corridor: Freight Analysis
Page 24
This traffic includes B-train trucks, which are commonly used to haul lumber (flat decks) and heavy bulk commodities (dry cargo or liquid tankers). It seems reasonable to conclude that the forest sector is responsible for the bulk of this traffic, due to the reduction in volume during the period of a labour dispute which shut down most of the industry in 2007.
Southbound traffic patterns are essentially identical; this is not surprising since even if the freight traffic is asymmetric in one the equipment has to be redeployed. Trends in traffic from 2004 through 2008 are shown below. The data indicate that traffic in the 12.5 to 22.5 m category has grown at a modest rate, but the average volume of the longer trucks has declined by around 25%. This is significant because these trucks typically carry freight more suited to rail transportation.
Exhibit 5.3 – Annual Variation in Daily Truck Traffic Volumes, Island Highway, Nanaimo
A comparison of annual average daily truck traffic for the two length categories is illustrated below. The two count stations within Nanaimo (P12-2 and P12-3) show higher traffic levels than the station between Chemainus and Duncan (P12-4), and the station between Parksville and Courtenay (P14-5). This may be attributable to a higher level of local truck traffic in Nanaimo. The Nanaimo station at Cassidy shows a dramatic decline in trucks in the longer category, but a corresponding increase in shorter trucks; this may simply represent a change in the equipment used for the traffic rather than a change in the underlying freight volume.
Note that the average weekday truck capacity of the ferry service to Nanaimo around 264 standard semitrailers (i.e. in the 12.5 to 22.5 m category); total traffic at the Nanaimo count stations averaged 410 at P12-2 north of the link to Duke Point, and 502 at P12-3 south of the link to the Duke Point ferry terminals.

I B I G R O U P R E P O R T
Ministry of Transportation and Infrastructure Evaluation of the E & N Railway Corridor: Freight Analysis
Page 25
Exhibit 5.4 – Annual Variation in Daily Truck Traffic, Island Highway, Various Locations

I B I G R O U P R E P O R T
Ministry of Transportation and Infrastructure Evaluation of the E & N Railway Corridor: Freight Analysis
Page 26
5.3 Truck Origin-Destination Surveys
To augment our knowledge of Vancouver Island freight traffic, surveys of truck traffic were undertaken at weigh scale stations at Parksville and Duncan on June 18. The survey included classification of trucks by configuration (truck and trailer, truck and two trailers, etc.) and trailer type (dry van, refrigerated van, tanker, etc.). Interviews with a sample of drivers gathered information on trip origin and destination, commodity carried, and other relevant data. The roadside surveys were designed to provide a snapshot of typical freight movements to assist in the identification of potential freight traffic which might be accessible through an improvement in rail freight service on the Island. The most promising freight movements based on typical rail freight characteristics are steady volumes of heavy and/or bulk commodities on long haul routes. A copy of the survey questionnaire is shown in the Appendix.
5 .3 .1 PARKSVILLE TRUCK SURVEY RESULTS
The Parksville weigh scale is located on Highway 19, 6 km south of Parksville. This site captures traffic between Nanaimo (and points farther south), Port Alberni and points farther north on the Island Highway including Comox and Courtenay, the end point of the rail corridor.
A total of 808 trucks were counted and classified at the site, including northbound and southbound traffic. The average daily truck count at the nearest Ministry of Transportation count site for April 2009 was 390 trucks southbound and 393 trucks northbound for a total of 783. Comparable figures for June 2008 were 469 southbound and 459 trips northbound for a total of 928. Note that the truck counts were only carried out for a 9 hour period from 7 am to 4 pm while the BC MOT classification counts include all trucks over a 24 hour period.
The distribution of truck traffic by truck type is shown below.
Exhibit 5.5 – Surveyed Truck Classification, Parksville, June 2009

I B I G R O U P R E P O R T
Ministry of Transportation and Infrastructure Evaluation of the E & N Railway Corridor: Freight Analysis
Page 27
The sample which is used for this analysis consists of heavy trucks which typically are used for carrying large freight volumes (i.e. tractor with single trailer and tractor with 2 trailers). This accounted for approximately 59% of total truck traffic over the survey period.
Commodity Profile
The commodity profile for northbound trucks is shown below. Empty trucks accounted for 33% of the traffic, and lumber was the largest single freight commodity, accounting for 5% of total trips. The “Other” category accounted for 50% of traffic, this category includes a wide range of consumer and household goods, construction equipment, etc. with no commodity predominating.
Exhibit 5.6 – Surveyed Truck Commodity Profile – Northbound, Parksville, June 2009
I B I G R O U P R E P O R T
Ministry of Transportation and Infrastructure Evaluation of the E & N Railway Corridor: Freight Analysis
Page 28
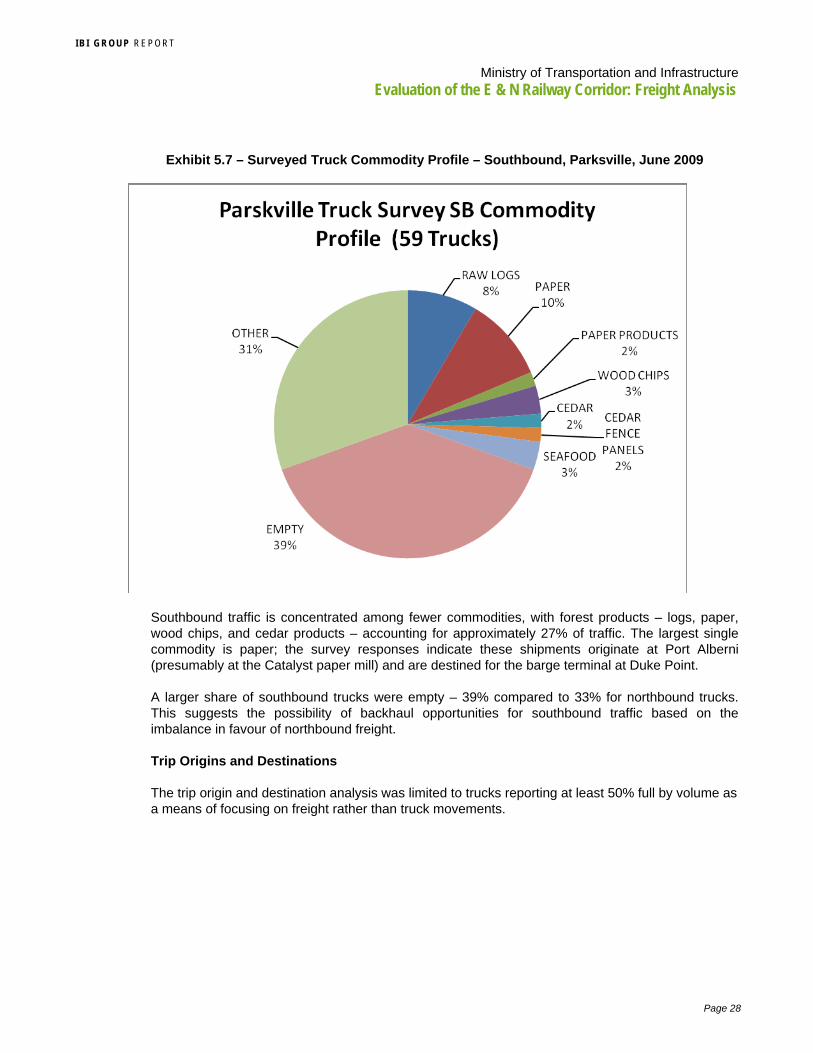
Exhibit 5.7 – Surveyed Truck Commodity Profile – Southbound, Parksville, June 2009
Southbound traffic is concentrated among fewer commodities, with forest products – logs, paper, wood chips, and cedar products – accounting for approximately 27% of traffic. The largest single commodity is paper; the survey responses indicate these shipments originate at Port Alberni (presumably at the Catalyst paper mill) and are destined for the barge terminal at Duke Point.
A larger share of southbound trucks were empty – 39% compared to 33% for northbound trucks. This suggests the possibility of backhaul opportunities for southbound traffic based on the imbalance in favour of northbound freight.
Trip Origins and Destinations
The trip origin and destination analysis was limited to trucks reporting at least 50% full by volume as a means of focusing on freight rather than truck movements.

I B I G R O U P R E P O R T
Ministry of Transportation and Infrastructure Evaluation of the E & N Railway Corridor: Freight Analysis
Page 29
Exhibit 5.8 – Surveyed Truck Origins – Northbound, Parksville, June 2009
The majority of northbound trips originate in the Nanaimo area (including Nanaimo, Lantzville, Northwestern Bay, and Duke Point. Only one trip could be directly attributed to Duke Point – this may indicate that inbound freight destined up-Island from Nanaimo is warehoused in the Nanaimo area rather than hauled directly from off-Island origins. This is the pattern for propane shipments by Superior Propane, which receives propane by rail and stores it in a Nanaimo distribution centre where it is transferred to trucks for delivery to other locations on the Island.
Parksville Southbound Trips
Trip origins for southbound loaded trips are shown on Exhibit 5.9. Locally originated trips account for 20% of the total. Origins on Highway 4 (primarily Port Alberni) account for 45% of the total; origins north of Parksville on Highway 19 account for around 35%. Nanaimo dominates as the destination for loaded truck trips in the survey results, accounting for 68% of total trips. This includes trips destined for Duke Point and for Lower Mainland locations.

I B I G R O U P R E P O R T
Ministry of Transportation and Infrastructure Evaluation of the E & N Railway Corridor: Freight Analysis
Page 30
Exhibit 5.9 – Surveyed Truck Origins and Destination – Southbound, Parksville, June 2009
Parksville Survey Analysis Highlights
The composition of the freight traffic was extremely heterogeneous, including a wide range of consumer and industrial goods. Forest products account for 27% of southbound traffic, but this was divided among a number of commodities as well.
The only significant commodity flow from the viewpoint of potential rail traffic – large volumes of heavy and/or bulk commodities from a single origin to destination – identified through the truck

I B I G R O U P R E P O R T
Ministry of Transportation and Infrastructure Evaluation of the E & N Railway Corridor: Freight Analysis
Page 31
survey data is the paper traffic from the Catalyst mill in Port Alberni. Prior to 2002, this traffic accounted for 75% of the rail traffic, and the loss of this business to trucking resulted in the cessation of rail service to Port Alberni.
Traffic was roughly evenly divided between Highway 19 north (Comox-Courtenay and Campbell River) and Highway 4 West (Port Alberni-Ucluelet); few of the truck trips extended past the Comox-Courtenay area, which marks the end of the rail corridor. Relatively few of the trips extended south of Nanaimo, which suggests that Nanaimo acts as the freight hub for the Northern Island and that Victoria does not play a major role in this area. This further suggests that trucks serving the Northern Island use the Nanaimo ferry services rather than Swartz Bay for access from the Lower Mainland.
5 .3 .2 DUNCAN TRUCK SURVEY
The Duncan weigh scale is located on Highway 19, just north of Duncan in North Cowichan. This site captures traffic between Victoria and Nanaimo (and points farther north). Surveys were only conducted in the northbound direction due to limited operations at the weigh scale.
A total of 378 trucks were counted and classified at the site, including only northbound traffic. The average daily truck count at the nearest Ministry of Transportation count site (P12-4) for April 2009 was 380 trucks northbound. The comparable figure for June 2008 was 324. The truck counts were carried out for a 9 hour period from 8 am to 5 pm while the BC MOT classification counts include all trucks over a 24 hour period.
The distribution of truck traffic by truck type is shown below. The distribution by truck type is very similar to that recorded at the Parksville weigh scale. The trucks of primary interest, Tractor and 1 trailer and tractor and 2 trailers, accounted for 62% of total trucks compared to 59% for Parksville.
Exhibit 5.10 – Surveyed Truck Classification, Duncan, June 2009

I B I G R O U P R E P O R T
Ministry of Transportation and Infrastructure Evaluation of the E & N Railway Corridor: Freight Analysis
Page 32
The commodity profile for trucks surveyed at Duncan is shown below. Forest products accounted for around 29% of total freight shipments, and 39% of trucks were empty.
Exhibit 5.11 – Surveyed Truck Commodity Profile – Duncan, June 2009
Survey results for loaded trip destinations highlight the role of Nanaimo as the mid-Island transportation hub: 68% of trips were destined for Nanaimo and/or Mainland destinations. The sample included 2 trips destined to Kelowna (precast concrete products) and 2 to Calgary (wooden pallets).
Exhibit 5.12 – Surveyed Truck Origins – Duncan, June 2009
I B I G R O U P R E P O R T
Ministry of Transportation and Infrastructure Evaluation of the E & N Railway Corridor: Freight Analysis
Page 33
Highlights of Duncan Origin-Destination data
Specific survey results which can be attributed to specific industries are highlighted below.
Three trucks carrying cement powder north from Bamberton – location of the Lehigh Northwest Cement Ltd. BC Distribution Terminal (Mill Bay).
Six trucks carrying lumber from Cowichan to Nanaimo, Langley Surrey, and Vancouver presumably destined for one of the Nanaimo ferry terminals. Four of these were two-trailer trucks (presumably Super B Trains) ands 2 were single trailer trucks.
Three double-trailer trucks transporting wood chips from Cowichan to Crofton, presumably from the Cowichan Bay sawmill to the Catalyst pulp plant at Crofton.
Five truckloads of raw logs destined either for Nanaimo or Duke Point – though these could be destined either for the timber processing facilities at Duke Point, the ferry terminals or a barge ramp.
5.4 Potential Rail Freight Markets – Conclusions from Truck Survey
Compared to population, there were relatively few trips either originating or destined to Victoria in the survey samples. This suggests that Nanaimo plays the dominant role as the freight transportation hub along the Island Rail Corridor, at least as far south as Duncan. It seems probable that the freight traffic handled at the Swartz Bay terminal is primarily destined for consumption in the Capital Region District. From the Parksville survey results, 67% of northbound loaded truck trips originated at Nanaimo and/or Lower Mainland locations, and 68% of southbound loaded truck trips were destined for Nanaimo and/or Lower Mainland locations. The Duncan survey showed similar results, with 68% of loaded trucks destined for Nanaimo and/or Mainland destinations.
The commodity distribution among loaded truck trips is very similar in the Duncan Northbound and Parksville Southbound survey results. The high proportion of forest products is consistent with Nanaimo’s role as the export point for forest products via the ferry terminals. This traffic presents the greatest potential for capture by rail because it represents the most probable long term sustainable outbound freight flow from the Island, based on the Island’s current industrial structure.
Table 5.1 – Truck Survey Commodity Types by Location/Direction
Truck Survey Commodity Distribution
Duncan NB Parksville SB Parksville NB
Forest Products 28.9% 27.1% 11.1%
Other 33.6% 33.9% 55.7%
Empty 37.5% 39.0% 33.3%
However, the percentage of individual products differs considerably between the Duncan northbound survey results, which indicate that lumber is the largest commodity at 10% of loaded trucks, and Parksville southbound in which paper predominates, with a similar percentage of loaded truck trips. This is consistent with the substantial sawmilling capacity in the Duncan area, and the location of the Catalyst paper plant in Port Alberni.
I B I G R O U P R E P O R T
Ministry of Transportation and Infrastructure Evaluation of the E & N Railway Corridor: Freight Analysis
Page 34
The varied nature of commodities carried by northbound trucks surveyed at Parksville is consistent with the role of Nanaimo as the supply point for inbound consumer products destined to communities farther north. Due to its nature this traffic is not likely to offer significant additional opportunities for rail transportation.
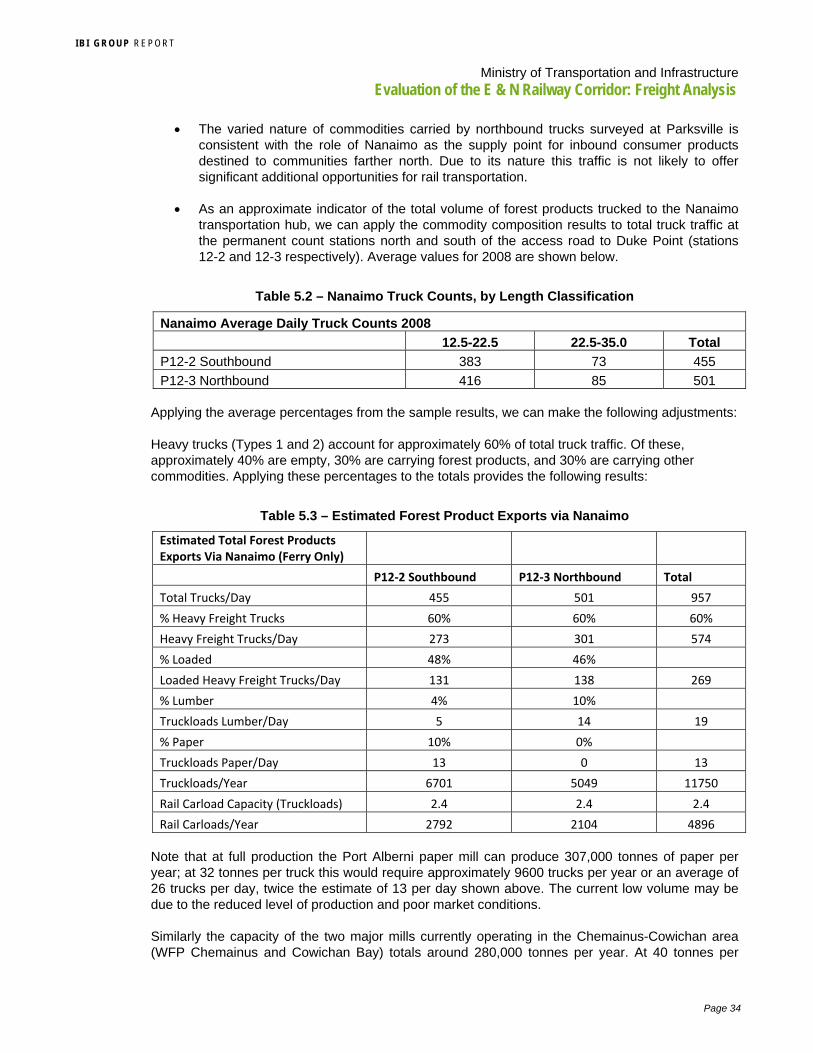
As an approximate indicator of the total volume of forest products trucked to the Nanaimo transportation hub, we can apply the commodity composition results to total truck traffic at the permanent count stations north and south of the access road to Duke Point (stations 12-2 and 12-3 respectively). Average values for 2008 are shown below.
Table 5.2 – Nanaimo Truck Counts, by Length Classification
Nanaimo Average Daily Truck Counts 2008
12.5-22.5 22.5-35.0 Total
P12-2 Southbound 383 73 455
P12-3 Northbound 416 85 501
Applying the average percentages from the sample results, we can make the following adjustments:
Heavy trucks (Types 1 and 2) account for approximately 60% of total truck traffic. Of these, approximately 40% are empty, 30% are carrying forest products, and 30% are carrying other commodities. Applying these percentages to the totals provides the following results:
Table 5.3 – Estimated Forest Product Exports via Nanaimo
Estimated Total Forest Products Exports Via Nanaimo (Ferry Only)
P12‐2 Southbound P12‐3 Northbound Total
Total Trucks/Day 455 501 957
% Heavy Freight Trucks 60% 60% 60%
Heavy Freight Trucks/Day 273 301 574
% Loaded 48% 46%
Loaded Heavy Freight Trucks/Day 131 138 269
% Lumber 4% 10%
Truckloads Lumber/Day 5 14 19
% Paper 10% 0%
Truckloads Paper/Day 13 0 13
Truckloads/Year 6701 5049 11750
Rail Carload Capacity (Truckloads) 2.4 2.4 2.4
Rail Carloads/Year 2792 2104 4896
Note that at full production the Port Alberni paper mill can produce 307,000 tonnes of paper per year; at 32 tonnes per truck this would require approximately 9600 trucks per year or an average of 26 trucks per day, twice the estimate of 13 per day shown above. The current low volume may be due to the reduced level of production and poor market conditions.
Similarly the capacity of the two major mills currently operating in the Chemainus-Cowichan area (WFP Chemainus and Cowichan Bay) totals around 280,000 tonnes per year. At 40 tonnes per

I B I G R O U P R E P O R T
Ministry of Transportation and Infrastructure Evaluation of the E & N Railway Corridor: Freight Analysis
Page 35
Super B train would require 7000 trucks per year or 19 trucks per day at full production. The estimated volume shown above is 14 trucks per day.
The daily truckload estimates amount to around 12% of daily one-way truck capacity for the three ferry services serving Nanaimo.
From our analysis of the location of major forest products industrial clusters, and the truck survey results, the major origins for this traffic are Port Alberni and the Cowichan-Chemainus-Ladysmith area between Duncan and Nanaimo. This implies that for this freight traffic (if these locations are to be served directly by rail) the Nanaimo-Duncan and Nanaimo-Parksville-Port Alberni sections of the corridor are of most importance.
It must be recognized that these estimates are based on a small sample of truck movements, and that more precise estimates would require a significantly greater effort in data collection. The volume of forest products shipments is no doubt depressed below typical levels due to current mill shutdowns. However, truck volumes do not appear to be down; it may be that resurgence in forest products shipments will result in fewer empty trucks, rather than an absolute increase in truck trips. If this is the case, it suggests that the major driver of truck volumes is inbound consumer products shipments, which do not vary as much in response to short term market conditions.
It is worth noting that the truck surveys did not identify any significant volumes of aggregates transported by truck on long haul routes.

I B I G R O U P R E P O R T
Ministry of Transportation and Infrastructure Evaluation of the E & N Railway Corridor: Freight Analysis
Page 36
6. COMPETITIVENESS OF RAIL FREIGHT TRANSPORTATION ON VANCOUVER ISLAND
6.1 Rail Rates and Contribution to Constant Costs
The scope of this study includes an assessment of the viability of future rail operations on the Island Corridor under potential operating scenarios which include a variety of rail services, including passenger rail, commuter rail, tourism, and freight operations. Each of these services would incur operating costs and provide revenues to the railway’s overall financial accounts.
The contribution that freight operations could make to the enterprise is best measured using the concept of contribution to constant costs. The contribution to constant costs represents the surplus over total variable costs of moving products:
In pricing of railway services, the railway benefits economically from an activity if the revenues it receives from that activity exceed the variable costs that that activity imposes upon it. The extent to which a railway price (e.g., a freight rate) exceeds the related variable cost is referred to as the contribution that the railway receives from that activity. 26
In the case of the Island Corridor operator, the contribution to constant cost from freight traffic would represent the revenues available to support maintenance and improvement of the rail infrastructure after the full long run variable costs of the service were paid for. Long run variable costs are described below:
Railway long-run variable costs (LRVC) consist of that component of total railway costs which varies, up or down, with variations in level of use of the railway system. As such, variable costs represent some 80-85 percent of total Canadian railway costs. The residual of total railway costs is referred to as constant costs, and represents costs that do not vary with level of use of the railway system. Examples of variable costs include costs associated with locomotives, freight cars, train crews, train fuel, a portion of railway overheads and approximately 50 percent of the costs associated with the railway track structure. Examples of constant costs include the residual of the costs associated with the track structure and of railway overheads. It is important to note that both variable costs and constant costs include railway overheads (to the extent that they are related to variable or constant elements in the railway activity structure) and cost of capital (depending upon whether the related railway assets are considered to be variable or constant).27
Determination of the actual long run variable costs of SRVI (or an alternative operator) on the Island Corridor would require extensive analysis which is beyond the scope of this study. However, typical contributions to constant costs for various categories of traffic can provide an indication of the potential magnitude of contributions available for Island Railway traffic.
Regulatory agencies in both Canada and the U.S. have rendered decisions in the past which suggest that an aggregate contribution level for all railway traffic in the neighbourhood of 20% is around average. On this basis, one rail costing expert has concluded that “where there is effective competition, the level of contribution that railways can earn is less than 20 % of Long Run Variable Costs”.28
The existing distribution of traffic suggests that the truck and marine modes provide effective competition to rail services on the Island for most traffic. In part, this is due to the patterns of
26 AN ESTIMATE OF THE FREIGHT RATE CONSEQUENCES OF RAIL CAPTIVITY TO RAIL SHIPPERS OF CANADIAN FOREST PRODUCTS - FINAL REPORT Prepared for Forest Products Association of Canada by Travacon Research Limited March 2007, p. 7. 27 Ibid., p. 5. 28 Ibid., p. 16.

I B I G R O U P R E P O R T
Ministry of Transportation and Infrastructure Evaluation of the E & N Railway Corridor: Freight Analysis
Page 37
transportation which have evolved for most commodities in which most freight trips to the Island originate or are destined to the Lower Mainland, whether or not the freight is.
This is a predictable consequence of the large volumes of freight transiting the Lower Mainland, which provides economies of scale, and superior connections to North American and offshore markets. The Lower Mainland provides multiple direct rail connections to North American markets and access to global markets for containerized, bulk and breakbulk shipments through the Port of Vancouver.
As an example, it appears that the largest share of lumber moving by truck off the Island is destined to lumber reload centres in the Lower Mainland. One trucking firm interviewed for this study indicated that 90% of the lumber transported from the Island by his firm is destined for reload facilities. A portion of this traffic is destined to inland North American markets by rail. However the use of a reload centre provides additional flexibility to the shipper with regard to the choice of Class1 rail carriers, more competitive rates, and the option of reloading to containers for shipment to offshore markets if required.
Paper traffic from the Island has evolved in a similar fashion. Catalyst Paper operates a 418.000 square foot distribution centre on the Fraser River which typically handles over a million tonnes of paper products produced at the firm’s four BC mills. In 2003, the company reported that eighty percent of their inbound product arrives via barge and sixty percent of their outbound freight leaves via railcar.29 As noted previously, the loss of the Port Alberni traffic resulted in discontinuance of rail service on the Port Alberni segment of the corridor.
In addition, the share of rail in BC exports of forest products to U.S. markers has been declining. In 2008, only 9.1% of BC lumber exports were shipped by rail, compared to 64.5% for truck and 26.4% for vessel. 30
Exhibit 6.1 – BC Lumber Exports by Transportation Mode
As a consequence of these patterns, it appears that if SRVI is to substantially increase its traffic for outbound commodities from the Island it will have to provide at minimum rates which are competitive with existing truck rates for the short haul movement to the Lower Mainland. This is
29 “Sylvan Distribution Tour Review’ Canadian Material Handling and Distribution Society http://www.cmhds.org/Event_Pages/Sylvan_Tour/sylvan_tour_review.htm 30 Statistics Canada Service Bulletin: Sawmills Catalogue no. 35 -003-X, various issues.

I B I G R O U P R E P O R T
Ministry of Transportation and Infrastructure Evaluation of the E & N Railway Corridor: Freight Analysis
Page 38
probably optimistic, since trucks can generally offer more service flexibility and faster transit times than rail service which suggests that in order to divert large volumes from truck the rail rates would have to be lower.
6.2 Forest Products and Other Truckload Commodities
This section focuses on the costs for moving forest products off of the Island, but the results are applicable to any truckload commodity with similar characteristics.
Trucking companies quote rates to shippers which include the cost of the ferry trip. A range of current rates was obtained from a prominent Island trucking company. Shipper costs for a Super B train load of lumber from the Island to a reload centre in the Lower Mainland range from $750 to $950, depending on the origin point.
Table 6.1 – Estimated Trucking Rates, 2009
Trucking Rates Low High
Total Cost B-Train $750 $950
Payload (Tonnes) 40 40
Cost $ per Tonne $18.75 $23.75
Both truck and rail shipments off of the Island have to pay ferry costs. BC Ferries and Seaspan Coastal Intermodal post rates for commercial vehicles as shown below. Note that BC Ferries service is based on transportation of the tractor and trailer unit, which is longer than just the trailer, and the driver has to pay a passenger fare in addition to the vehicle charge. BC Ferries rates are the same for both routes.
Table 6.2 – Ferry Shipping Rates, 2009
Ferry Rates
Semitrailer BC Ferries Seaspan Coastal -
Nanaimo Seaspan Coastal -
Swartz Bay
Rate ( $/Ft) $5.05 $5.93 $6.45
Semitrailer Length (Ft) 65.6 53 59
Semitrailer Cost $331.28 $314.29 $380.55
Terminal Charge $31.00 $31.00
Driver Charge $13.50
Total $415.43 $404.22 $477.00
Payload 31 31 31
Cost per Tonne $13.40 $13.04 $15.39
B Train BC Ferries Seaspan Coastal -
Nanaimo Seaspan Coastal -
Swartz Bay
Rate ( $/Ft) $5.05 $5.93 $6.45
B Train Length (Ft) 75.4 59 59
B Train Cost $380.77 $349.87 $380.55
Terminal Charge $31.00 $31.00

I B I G R O U P R E P O R T
Ministry of Transportation and Infrastructure Evaluation of the E & N Railway Corridor: Freight Analysis
Page 39
Ferry Rates
Semitrailer BC Ferries Seaspan Coastal -
Nanaimo Seaspan Coastal -
Swartz Bay
Driver Charge $13.50
Total $474.72 $445.80 $477.00
Payload 40 40 40
Cost per Tonne $11.87 $11.15 $11.93
The ferry operators and shippers confirm that most commercial traffic moves at a negotiated rate which is lower than the published tariff. Van Isle Barge does not even publish a tariff. This makes it difficult to ascertain the cost of the ferry segment of trip rates to Vancouver. It seems evident that at a full truck trip rate between $18.75 and $23.75 per tonne, the trucking companies are paying considerably less than the full cost of the published ferry tariffs, which are between $11 and $12 per tonne for the ferry trip alone.
If SRVI’s rate for a similar movement is constrained to match the average truck rate of $18.75 per tonne, the total carload rate (assuming a carload weight of 90 tonnes) would be $1687.50. To calculate the revenue to the railway, we have to deduct the cost of the ferry trip in each direction since it appears unlikely that the railway will be competitive for most of the inbound consumer goods traffic due to service requirements. SCIC does not post rates for railcars, as CP Rail has been their sole customer since taking over the barge operations. However, based on the length of an 80 foot centre beam lumber car31 the rate according to the published per foot charge would be $474.40 or $5.27 per tonne. The two way charges would amount to $10.54 per tonne based on the published rate, though the actual rate could be considerably lower. Assuming total ferry charges of $8.00 per tonne, this would leave revenue of $10.75 per tonne or $967.50 per carload. At a contribution rate of 20% this would provide $193.50 per carload towards the constant costs of the railway. This presupposes that the railway could provide this service for a long run variable cost of $774 per carload.
As a basis for comparison, CP has a published tariff for urea fertilizer from Vancouver to Nanaimo of $9.78 per tonne.32
The trucking industry has an advantage for this traffic because they can easily find backhaul cargo for the return trip to the Island. A trucking company interviewed for this study indicated that they were able to achieve 90% backhaul to the Island on Super B-train trucks, hauling consumer goods and finished products for companies like Home Depot. Trucking companies operating dry vans may have more traffic onto the Island than returning. These companies typically use tridem axle dry vans which allow them to accommodate heavy loads outbound from the Island. If the population on the Island continues to grow, and the industrial export base does not, the balance may shift further in the direction of inbound freight and rates for outbound movements could fall as trucking companies strive to balance their loads.
If the railway could achieve a 10% market share for outbound lumber shipments at the current estimated traffic level, it would add approximately 300 carloads per year to their existing traffic. Assuming a total ferry cost of $800, a 20% contribution rate would yield approximately $60,000 to
31 AAR car type F383 (flat car), plate type C, tare weight 63,100 pounds, total gross weight allowed 263,000 pounds, load limit 199,900 pounds, external dimensions (length 79' 8", width 9' 6", height 15' 5"), internal dimensions (length 73' 0", width 9' 0", pool number 8,020,326. [courtesy of BNSF Equiptment Characteristics, March 2000] http://chicago.railfan.net/cgi/photos.pl/?page=TTZX_85729 32 CPRS 4888 COMMODITY: UREA OTHER THAN LIQUID EQUIPMENT: COVERED HOPPER CARS MINIMUM WEIGHT: 195,000 LBS. RAILROAD OWNED CARS $9.78 ROUTING: 0001 - CPRS DIRECT EFFECTIVE: OCT 19, 2008 EXPIRES: {I}AUG 31, 2009 CP TARIFF INC. CALGARY AB.

I B I G R O U P R E P O R T
Ministry of Transportation and Infrastructure Evaluation of the E & N Railway Corridor: Freight Analysis
Page 40
support the railway’s constant costs. If the railway could capture all of the estimated 2900 carloads of lumber traffic, it would contribute approximately $573,000 per year.
In the future, production volumes in the forest industry are likely to recover as markets rebound. Current production levels are no doubt below those of 2008; it is probable that volumes could double from current levels due to higher capacity utilization of operating plants, and reopening of currently idled facilities.
6.3 Mining Commodities
The pattern for existing mining facilities on the Island – Quinsam Coal and Myra Falls – is to truck via the most direct route to a barge or vessel terminal for transfer to water at the earliest opportunity. This pattern is unlikely to change.
The closure of Producers Pit at the end of 2007 removed the largest source of local production of construction aggregates for the Victoria market. A 2003 study estimated total demand for aggregates in the Victoria area ranging between 2.3 and 2.7 million tonnes per year, of which Producers Pit contributed approximately one third.33 Aggregate was barged from Producers Pit to Lehigh’s Victoria Materials Depot, a distance of approximately A 2007 study on regional aggregate markets conducted by Hanam Canada Corporation estimated barge costs for this movements at $1.85 per tonne using 2500 ton barges, a distance of approximately 30 km.34
Since the closure of Producers Pit, Lehigh has been barging aggregates from their Sechelt pit for local markets in Victoria using their own equipment. Hanam estimated the cost of a similar barge movement from Sechelt to Langley at $2.50 per tonne in 2007. Total barge costs (including loading and trucking costs to the barge ramp) from Duke Point to Victoria were estimated at $11 per tonne, approximately the same as direct trucking. Lehigh have indicated that currently the transportation cost differential between receiving aggregates from Sechelt by barge and trucking from the south side of Nanaimo is around $5 per tonne. This suggests a competitive rate for aggregate movements by rail of approximately $6 per tonne. At 100 tonnes per car, this would amount to about $600 per carload. It seems unlikely that the railway would be able to meet this price and obtain any contribution to constant costs.
The potential mining operation being explored near Union Bay (the Raven Coal Deposit) offers the best prospects for rail transportation provided that the necessary infrastructure improvements could be made to the E&N Railway. This site is only 2 km from the railway.
33 CHANGES IN AGGREGATE PRODUCTION AND USE IN VICTORIA, BC Paper prepared for presentation at the Recycling Materials for Use in Highway Design Session of the 2003 Annual Conference of the Transportation Association of Canada St. John’s, Newfoundland and Labrador Terence S. Coulter, P.Eng. Thurber Engineering Ltd. Victoria, BC pp. 4-5. 34 Vancouver Aggregate Market Hanam Canada Corporation http://hanamcanada.com/vancouver.htm

I B I G R O U P R E P O R T
Ministry of Transportation and Infrastructure Evaluation of the E & N Railway Corridor: Freight Analysis
Page 41
7. IMPLICATIONS OF POTENTIAL DISCONTINUANCE OF RAIL SERVICE
This section has been written to address the question, “what would happen if the railway had to stop operating,” which was asked by the railway corridor owner, the Island Corridor Foundation, so that a ‘no rail’ worst-case baseline could be discussed.
Overall discontinuance of rail service would have relatively little impact on current freight transportation on Vancouver Island due to the low volume of traffic using the rail service. Total traffic on the system was around 900 carloads in 2008. Of this, approximately 55% was destined to Nanaimo and was either delivered to directly to Superior Propane or transloaded to truck in the Nanaimo yard. The more significant impact would be loss of future opportunities to ship by rail.
7.1 Impact on Shippers
Shippers currently receiving direct rail costs would incur additional costs. If service was discontinued over the broader network but maintained in the local vicinity of Nanaimo, the affected shippers would have the option of transloading to truck in the Lower Mainland or at the yard in Nanaimo.
A comparison of costs for direct rail shipment to Duncan compared to transloading in Abbotsford is shown below. Trucking costs are based on the most recent updated of Canadian trucking cost estimates35 for similar equipment (8 axle Super B Train Liquid Bulk Tanker). The high end of truckload costs (for a low mileage carrier with a 10% profit margin) would be $2.85 per kilometre. Rail costs have been taken from the current CP Rail published tariff for domestic feed barley shipments to BC destinations.36 Ferry costs are based on Seaspan Coastal Intermodal rates from Tilbury to Duke Point. Transload costs are estimated at $10 per tonne. The results are shown below.
Table 7.1 – Estimated Impact of Rail Discontinuance - Example
.
For purposes of comparison, the costs of shipping lumber via Super B Train off of Vancouver Island based on the trucking company information cited in Section 6 are $18.75 to $23.75 per tonne inclusive of ferry costs.
Based on these estimates, discontinuance of direct rail service would result in an increase of approximately 20% for affected shippers.
35 Operating Costs of Trucks and Surface Intermodal Transportation in Canada. Ray Barton Associates Ltd. In association with Logistics Solution Builders Inc. and The Research and Traffic Group March 31, 2008, p. 54. Previous editions were published as Operating Costs of Trucks in Canada. 36 CP Rail Tariff 25020 effective August 1, 2009.
Costs in $ per Tonne Rail Cost Truck Cost Ferry CostTransload
Cost Total Rail Direct $63.72 $63.72Truck Direct $93.41 $11.15 $104.56Rail to Abbotsford, Truck to Duncan $46.34 $9.05 $11.15 $10.00 $76.54
Estimated Transportation Costs Feed Barley Origin Alix AB Destination Duncan BC

I B I G R O U P R E P O R T
Ministry of Transportation and Infrastructure Evaluation of the E & N Railway Corridor: Freight Analysis
Page 42
7.2 Impact on the Road Network
Transfer of the non-Nanaimo traffic to truck would result in an increase in truck volumes of 1.6 trucks per day at Duncan, and .8 trucks per day at Parksville and Comox. On this basis it is reasonable to assume that the incremental impact on road maintenance and rehabilitation expenditures, and on traffic congestion, would be minimal.
7.3 Impact on Emissions
The impact on greenhouse gas emissions (GHG’s) has been estimated using the Railway Association of Canada’s Rail Freight GHG calculator. Based on the volume and distances for the shipments of feed grain to Duncan and silicates to Parksville, and poles outbound from Courtenay, the switch from rail to truck would increase GHG emissions by 22.57 tonnes.37
37 The Rail Freight Greenhouse Gas Calculator and details on the calculations are available on the Railway Association of Canada website at http://www.railcan.ca/site_ghg_calculator/default.aspx?language=en
I B I G R O U P R E P O R T
Ministry of Transportation and Infrastructure Evaluation of the E & N Railway Corridor: Freight Analysis
Page 43
8. CONCLUSIONS
Though it was the once the dominant mode of freight transportation on Vancouver Island, rail is now only a marginal player in the overall freight transportation system. This is due to the changing industrial structure of the Island economy, and to the increasing competitiveness of trucking as an alternative.
The type of traffic for which rail is most competitive is low value, heavy commodities over medium to long haul routes (generally over 500 km). Low value commodities are less sensitive to transit time, large volumes maximize the efficiency of rail loadings, and long haul routes enable the railways to take advantage of their lower tonne-km costs. However, the volume of these types of commodities generated by the Island economy has declined. Increasingly, firms have adopted supply chain options based primarily on transloading of freight in the Lower Mainland, which renders most freight movements short haul rather than long haul and thereby more suited to trucking.
Inbound freight movements to Vancouver Island consist primarily of consumer goods. These include high value and perishable goods, for which service quality and flexibility are key requirements. Rail is not a realistic option for this traffic.
Traditionally the major goods-producing sector on Vancouver Island has been the forest products industry. Forest products remain the largest industrial sector on the Island, but the industry has shrunk and further rationalization is anticipated. Lumber shipments shifted to truck more than 15 years ago. The shift of the remaining Catalyst pulp and paper traffic to truck in 2002 resulted in the loss of approximately three quarters of the remaining rail freight traffic, and closure of the Port Alberni subdivision.
The other major generator of industrial traffic outbound from Vancouver Island is the mining sector. The dominant pattern of transportation is based on shipment to the closest possible marine facility for loading onto barge or vessel, which provides an even cheaper option for bulk commodities where markets are accessible.
Existing rail freight traffic on the Island Rail Corridor fits the typical profile for rail freight: low value, heavy commodities shipped over long distance. The major commodities include feed grains, propane and fertilizer from Alberta, silicates from Quebec, and outbound poles destined for treatment plants in Ontario. Typical annual volumes are around 900 carloads. There appears to be limited potential for increased volumes from existing shippers.
The existing rail service has been hampered by the low frequency of rail barge operations. With the construction of Southern Railway’s new barge ramp on Annacis Island, it may be possible to increase service frequency through the use of mixed truck/rail barges. However, it is not likely to provide an increase in service to rival trucking, and improved rail service will not solve the underlying problem of low bulk freight volumes.
Due to difficulties in obtaining truck volumes from the three major ferry operators linking the Island with the Lower Mainland, it is not possible to estimate the total volume of freight moving on and off of the Island. Truck surveys were undertaken at the Parksville and Duncan weigh scales to gather addition data on freight movements by truck. These surveys confirmed the dominance of forest products for outbound freight movements, and reinforced our conclusion that the major clusters of activity in the vicinity of the existing rail corridors are Port Alberni and the Cowichan-Chemainus-Ladysmith area between Duncan and Nanaimo.

I B I G R O U P R E P O R T
Ministry of Transportation and Infrastructure Evaluation of the E & N Railway Corridor: Freight Analysis
Page 44
The nature of inbound and outbound freight flows – consumer goods inbound and forest products outbound –poses a competitive challenge for rail service. Rail service is potentially competitive for outbound forest products shipments but not for inbound consumer products due to the requirement for service flexibility, low transit times and frequent service. Trucking services have successfully exploited their dominance on the inbound traffic to attract outbound forest products shipments, which allows them to balance their loads inbound and outbound. This increases the efficiency and lowers the costs of trucking. In contrast, in order to attract outbound traffic the railway must pay the costs to position empty equipment on the Island for loading, in addition to costs of the outbound leg.
The intense competition on outbound freight volumes makes it likely that even if they succeed in attracting traffic the railway will not be able to obtain large contribution margins over direct costs. Consequently a relatively large volume of traffic would be required to make a significant financial contribution to the constant costs of operating the railway.
Future volumes of freight traffic to and from Vancouver Island are difficult to predict. It has not been possible to establish an estimate of current volumes due to commercial confidentiality of ferry traffic statistics. Forecasting future freight volumes for the forestry sector is difficult due to the uncertainty surrounding the industry’s future. However, the dynamics of the Island economy suggest that industrial shipments outbound may continue to fall (unless new resources are found and exploited), while consumer shipments inbound will continue to rise as the population increases. The consequence of this is that the competition for outbound shipments is likely to intensify over time, which will make it more difficult for the railway to attract this traffic.
Existing freight operations for SRVI are concentrated in the corridor between Duncan and Parksville. The large cluster of forest mills in the Duncan area could be served within this corridor, though direct rail service would require construction of spur lines. Service to the Port Alberni forest mills would require reopening of the Port Alberni subdivision.
The other category of traffic which holds some potential for rail shipments is intra-island shipments of construction aggregates. The Victoria area has a local deficit in aggregates since closure of Producer’s Pit in 2007. However, this deficit is currently supplied by shipments of aggregate by barge from Lehigh’s major production facility in Sechelt. Aggregates could potentially be provided from alternative reserves farther up-Island. However, since production costs are low, it is unlikely that a new aggregate pit on the Island would have a significant cost advantage, and in order to be competitive the railway would have to match the cost of transporting product by barge from coastal origins. Under current economic conditions, this seems unlikely. This would also require upgrading of the rail infrastructure south of Duncan and construction of a suitable storage facility in the Victoria area.
The one other possibility for rail shipments is that the Rave Coal Deposit near Union Bay would be served by rail, in which case approximately 10,000 rail cars per year of coal would be produced and sent through Port Alberni or Nanaimo.
Barge Ramp in Nanaimo, north end of Wellcox Spur
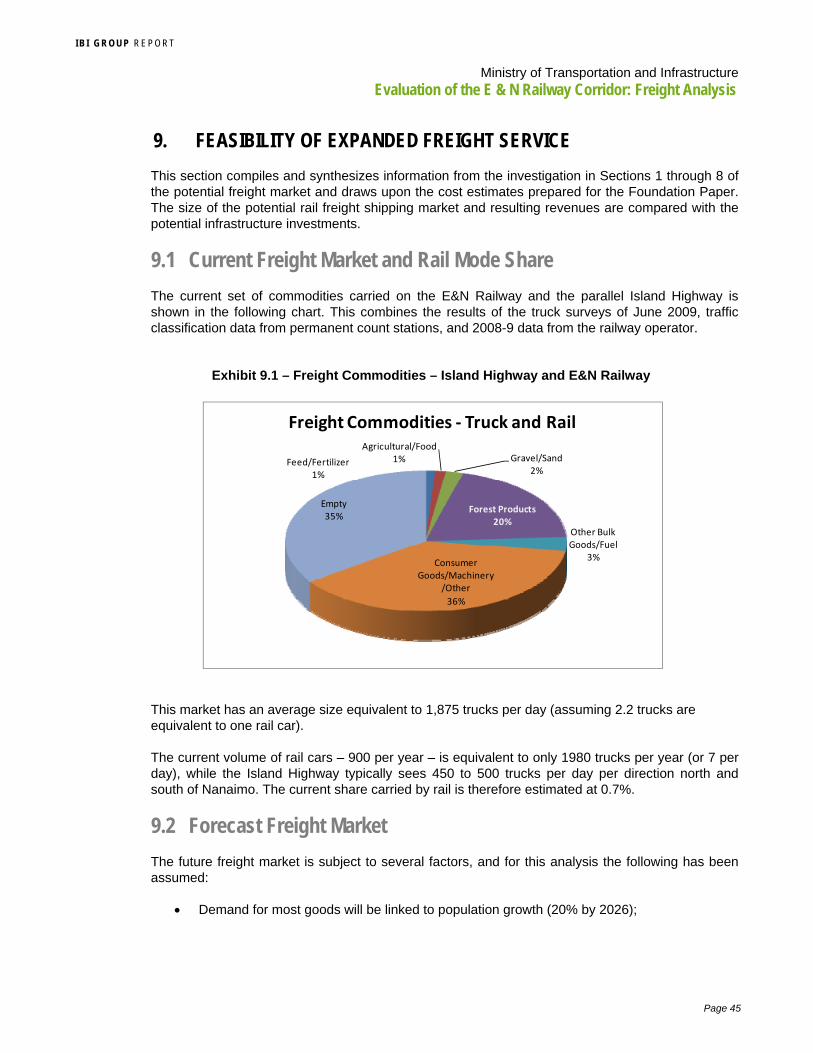
I B I G R O U P R E P O R T
Ministry of Transportation and Infrastructure Evaluation of the E & N Railway Corridor: Freight Analysis
Page 45
9. FEASIBILITY OF EXPANDED FREIGHT SERVICE
This section compiles and synthesizes information from the investigation in Sections 1 through 8 of the potential freight market and draws upon the cost estimates prepared for the Foundation Paper. The size of the potential rail freight shipping market and resulting revenues are compared with the potential infrastructure investments.
9.1 Current Freight Market and Rail Mode Share
The current set of commodities carried on the E&N Railway and the parallel Island Highway is shown in the following chart. This combines the results of the truck surveys of June 2009, traffic classification data from permanent count stations, and 2008-9 data from the railway operator.
Exhibit 9.1 – Freight Commodities – Island Highway and E&N Railway
This market has an average size equivalent to 1,875 trucks per day (assuming 2.2 trucks are equivalent to one rail car).
The current volume of rail cars – 900 per year – is equivalent to only 1980 trucks per year (or 7 per day), while the Island Highway typically sees 450 to 500 trucks per day per direction north and south of Nanaimo. The current share carried by rail is therefore estimated at 0.7%.
9.2 Forecast Freight Market
The future freight market is subject to several factors, and for this analysis the following has been assumed:
Demand for most goods will be linked to population growth (20% by 2026);
Feed/Fertilizer1%
Agricultural/Food1% Gravel/Sand
2%
Forest Products20%
Other Bulk Goods/Fuel
3%Consumer
Goods/Machinery /Other
36%
Empty35%
Freight Commodities ‐ Truck and Rail

I B I G R O U P R E P O R T
Ministry of Transportation and Infrastructure Evaluation of the E & N Railway Corridor: Freight Analysis
Page 46
The forest product market (exports) will rebound to recent historical output38, some 40% higher than in 2008-9;
The proportion of empty trucks would remain the same;
If the Raven Mine opened, the output is expected to be 1 Million tonnes per year, equivalent to nearly 75 equivalent trucks per day.
Exhibit 9.2 – Existing/Potential Freight Market (Daily) – Island Highway and E&N Railway
9.3 Prospects for Rail
The ability of the railway to capture the potential markets depends on the investments made to restore and improve the existing corridor, and the ability of the railway to operate at a fairly competitive variable cost, so that fees collected from shippers can go towards the owner, operator and investors in the corridor.
Competitive shipping rates are in the range $600-$1000 per railway car, based on current fees paid to trucking companies and the ferry service to send goods to the mainland. Assuming 80% of shipping rate covers O&M to transport the goods, the operating return for the rail operator, owner and investors would be $120 to $200 per railcar.
Section 8 noted that the focus for future rail markets is lower-cost bulk goods, mostly on longer-haul routes (over 500 km). Consumer goods shipped from Vancouver to the Island, whose value is more sensitive to shipping times, would not be as realistic a market to compete against trucking.
38 BC lumber exports averaged 14 million tonnes between 2004 and 2007, peaking at 15 million in 2005. Exports in 2008 were less than 10 million tonnes.
‐
500
1,000
1,500
2,000
2,500
2009 2026 (no Mine)
2026 with Mine
Average
Daily Volume (Equivalent Truckloads)
Year/Scenario
Vancouver Island Freight Market ‐ Island Highway/E&N Rail Corridor
Empty
Consumer Goods/Machinery/Other
Other Bulk Goods/Fuel
Forest Products
Gravel/Sand/Mining
Agricultural/Food
Feed/Fertilizer

I B I G R O U P R E P O R T
Ministry of Transportation and Infrastructure Evaluation of the E & N Railway Corridor: Freight Analysis
Page 47
The freight analysis identified several potential markets, including: forest mills around Duncan and Port Alberni; modest container traffic from Vancouver; mining shipments from the Raven Coal Deposit; and aggregates from Northern Vancouver Island.
Forecast Rail Volumes
The future rail freight market is subject to several factors, and for this analysis the following has been assumed:
These estimates are predicated on the railway being able to compete at similar prices to the truck mode.
The market for consumer goods will be linked to population growth (20% by 2026);
The forest market will rebound to recent historical output, and if the railway were improved, some of this market could be recaptured. Based on an estimate of current traffic bound for the port in Nanaimo, capturing 25% of that market would amount to 750 rail cars per year;
If the Raven Mine opened and chose to ship by rail, the equivalent volume would be at least 10,000 rail cars per year (and estimates range as high as 15,000).
Depending on future costs and the long-term prospects of other aggregate sources (e.g. Sechelt, which can ship to Vancouver Island by barge), there is interest in carrying aggregates along the Island. This is least likely to generate significant revenue above the cost of carrying the shipments since barge costs are currently fairly low. There is also greater risk of needing significant bridge upgrades in the southern corridor. For this analysis, the aggregate market is not included since its contribution to revenues may be very limited.
If these events took place, the future rail mode share would increase from 0.7% now to 1.4% without the mine and at least 5% with the mine open. This would correspond to 35 to 40 rail cars per weekday or 11,600 rail cars per year in rail car volume. Exhibits 9.3 through 9.5 depict the overall freight market by mode, the potential daily rail volumes, and the annual rail volumes.
Exhibit 9.3 – Existing/Potential Freight Market (Daily) – Mode Split
‐
500
1,000
1,500
2,000
2,500
2009 2026 (No Mine) 2026 with Mine
10 24.9 98.2
1,866
2,340 2,340
Average
Daily Volume (Equivalent Truckloads)
Year/Scenario
Vancouver Island Freight Market ‐ Island Highway/E&N Rail Corridor
Truck
Rail

I B I G R O U P R E P O R T
Ministry of Transportation and Infrastructure Evaluation of the E & N Railway Corridor: Freight Analysis
Page 48
Exhibit 9.4 – Existing/Potential Freight Market (Daily) – Rail
Exhibit 9.5 – Freight Market (Annual) – Rail
Rail Cars versus Trucks
The impact of the railway on highway traffic is at most 0.7% of the truck traffic being offset, on the Island Highway. This would apply to the section from Duncan to Courtenay. (This figure is likely somewhat smaller since some of the rail traffic is fairly local to Nanaimo and would not offset longer-distance truck hauls).
‐
50
100
150
200
250
2009 2026 (No Mine)
2026 with Mine
Estim
ated Daily Volume (Rail Cars)
Year/Scenario
Freight Market (Daily) ‐ E&N Rail Corridor
Consumer Goods/Machinery/Other
Other Bulk Goods/Fuel
Forest Products
Gravel/Sand/Mining
Agricultural/Food
Feed/Fertilizer
‐
2,000
4,000
6,000
8,000
10,000
12,000
14,000
2009 2026 (No Mine)
2026 with Mine
Estimated Annual Volume (R
ail Cars)
Year/Scenario
Vancouver Island Freight Market ‐E&N Rail Corridor
Consumer Goods/Machinery/Other
Other Bulk Goods/Fuel
Forest Products
Gravel/Sand/Mining
Agricultural/Food
Feed/Fertilizer

I B I G R O U P R E P O R T
Ministry of Transportation and Infrastructure Evaluation of the E & N Railway Corridor: Freight Analysis
Page 49
In the future, the impact of the railway on traffic would be on average 1.4% to 5% of truck traffic, but in the latter case, the removal of truck traffic would be some 75 trucks per day on the route to/from the Raven Coal Mine, where trucks would otherwise be in the range of 500 per day. This would therefore represent an offset of nearly 15% of truck volumes from that segment of the corridor (Union Bay to Parksville).
9.4 Railway Costs versus Revenues
Railway Upgrading Costs
Repairing the whole corridor and re-opening Port Alberni line would cost $94 million, and up to $139 million if bridge repairs were required. At a 6% discount, this amounts to $7.3 to $10.8 M per year respectively.
(The cost to upgrade the corridor and introduce other rail services such as expanded intercity and commuter rail could range from $217 to $340 million, including the bridges and several potential grade separations. These additional costs are not included within the analysis of freight costs.)
Investment Recovery
Assuming 25% of east-west forestry market returns to rail and a large mining operation chooses rail, the market could increase to12,000 (as shown above) to over 15,000 (higher end estimates) rail cars per year.
The average capital investment per rail car is indicated in the following table:
Scenario Freight Volume (including other flows)
Average Investment (Basic Corridor Costs of $94 M)
Average Investment ($139 M incl. Bridge Upgrades)
Mine produces 1 M tonnes per year
11,650 cars per year $630 / rail car $930 / rail car
Mine produces 1.5 M tonnes per year
16,500 cars per year $440 / rail car $650 / rail car
All of these scenarios would result in a larger investment than the $120 to $200 the railway could return on shipping fees.
If the railway were able to capture 35,000 to 40,000 rail cars of activity, then the average investment in the railway would be less than $200 per rail car of goods (based on the capital cost of $94 Million). Optimistically, this would match the higher end of potential operating returns. If shipping prices by truck did not increase, then the rates would have to be lower (say $600 per rail car), in which case an even higher rail volume would need to be carried to match the original investment.
This is illustrated by Exhibit 9.6.
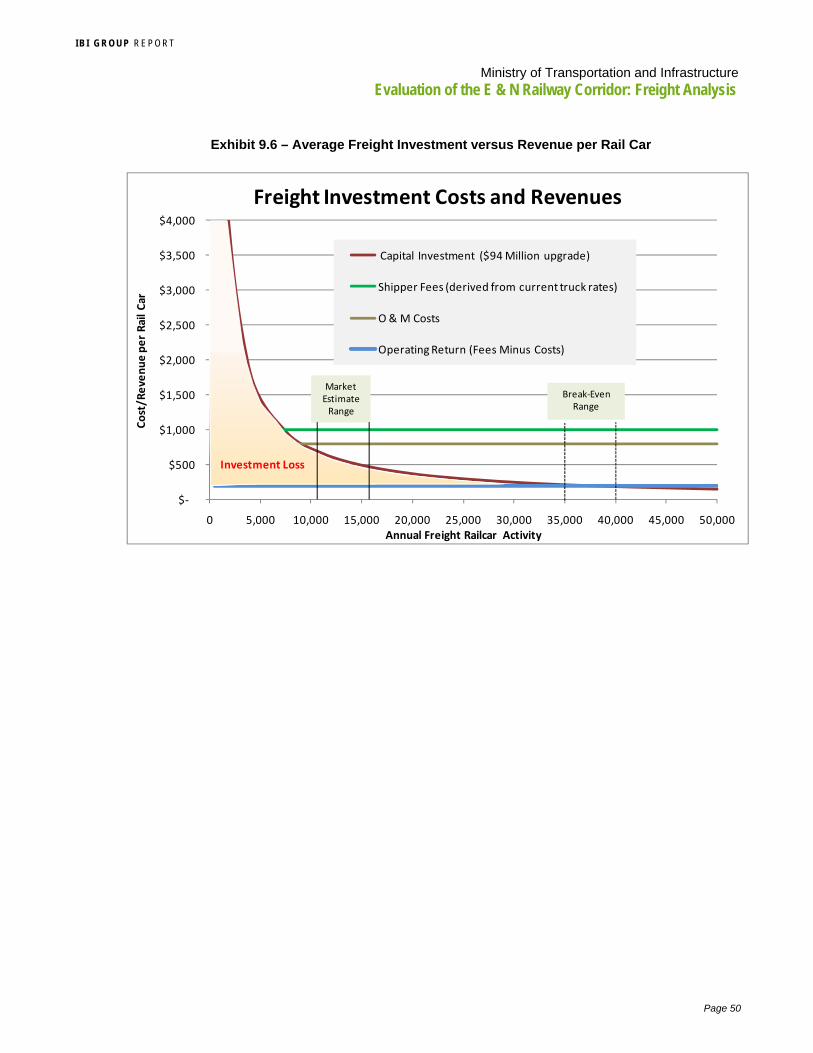
I B I G R O U P R E P O R T
Ministry of Transportation and Infrastructure Evaluation of the E & N Railway Corridor: Freight Analysis
Page 50
$‐
$500
$1,000
$1,500
$2,000
$2,500
$3,000
$3,500
$4,000
0 5,000 10,000 15,000 20,000 25,000 30,000 35,000 40,000 45,000 50,000
Cost/Revenue per Rail Car
Annual Freight Railcar Activity
Freight Investment Costs and Revenues
Capital Investment ($94 Million upgrade)
Shipper Fees (derived from current truck rates)
O & M Costs
Operating Return (Fees Minus Costs)
Break‐Even Range
Market Estimate Range
Investment Loss
Exhibit 9.6 – Average Freight Investment versus Revenue per Rail Car

I B I G R O U P R E P O R T
Ministry of Transportation and Infrastructure Evaluation of the E & N Railway Corridor: Freight Analysis
APPENDIX A: Truck Ferries Serving Vancouver Island

I B I G R O U P R E P O R T
Ministry of Transportation and Infrastructure Evaluation of the E & N Railway Corridor: Freight Analysis
Appendix A Truck Ferries Serving Vancouver Island
Though hard data is difficult to obtain, it seems clear that trucking dominates both inbound and outbound freight movements on the Island. By its geography Vancouver Island freight traffic is critically dependent on the marine linkages to the Mainland. Three major ferry services enable the trucking industry to bridge the gap in what is essentially a short haul movement of freight between the Lower Mainland and Vancouver Island.
BC Ferries is one of the largest ferry operators in the world, providing year-round vehicle and passenger service on 25 routes to 47 terminals, with a fleet of 36 vessels. Formerly a provincial Crown corporation, BC Ferries was transformed from a Crown corporation into an independent, commercial organization under the Company Act in April 2003. Commercial vehicle service between the Lower Mainland and Vancouver Island is provided primarily on BC Ferries’ Spirit and Coastal Class vessels, with nominal capacities of 34 and 32 semi-trailers respectively. The primary commercial vehicle routes are Tswassen - Swartz Bay and Tsawassen – Duke Point (Nanaimo).
A typical weekly schedule is shown below. Actual capacity is difficult to assess since the “truck’ capacity is shared with buses. Additional sailings are added in summer which reduces the impact of the seasonal tourist bus traffic on truck capacity. Note that the capacity estimates are based on the full length of the tractor and trailer unit, as traditionally BC Ferries service has been limited to drive on-drive off service in which the driver accompanies the truck on the journey. The company has recently introduced a drop-trailer service similar to those offered by Seaspan Coastal Intermodal and Van Isle Barge on the Tsawassen- Nanaimo route. For this service, trailers are delivered to the terminal and BC Ferries hostlers tow them on and off of the ferry.
BC Ferries Schedule Tsawassen-Nanaimo
Vessel Depart Arrive Capacity
(Semi Trailers)
Queen of Alberni 5:15 7:15 24
Coastal Inspiration 7:45 9:45 32
Queen of Alberni 10:15 12:15 24
Coastal Inspiration 12:45 14:45 32
Queen of Alberni 15:15 17:15 24
Queen of Alberni 20:15 22:15 24
Coastal Inspiration 22:45 0:45 32
Total Truck Capacity 192
Tsawassen-Swartz Bay
Vessel Depart Arrive Capacity
Spirit of British Columbia 7:00 8:35 34
Spirit of Vancouver Island 9:00 10:35 34
Coastal Celebration 10:00 11:35 32
Spirit of British Columbia 11:00 12:35 34
Spirit of Vancouver Island 13:00 14:35 34
Coastal Celebration 14:00 15:35 32
Total Truck Capacity 200
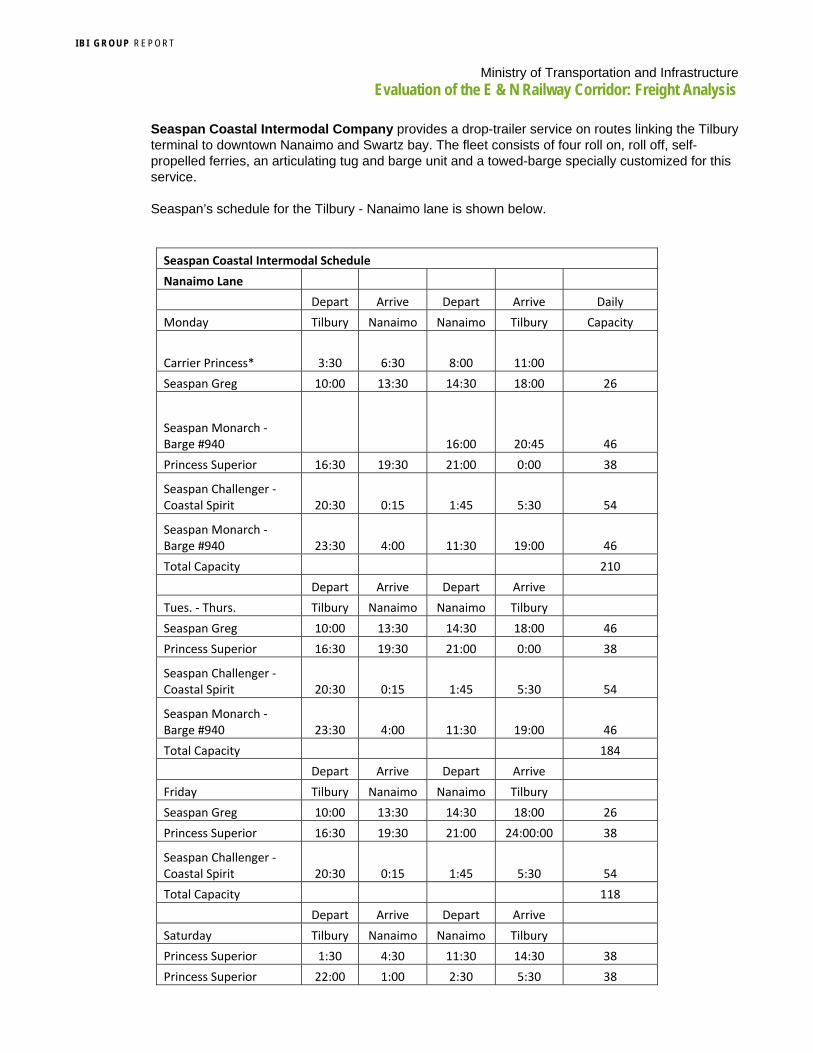
I B I G R O U P R E P O R T
Ministry of Transportation and Infrastructure Evaluation of the E & N Railway Corridor: Freight Analysis
Seaspan Coastal Intermodal Company provides a drop-trailer service on routes linking the Tilbury terminal to downtown Nanaimo and Swartz bay. The fleet consists of four roll on, roll off, self-propelled ferries, an articulating tug and barge unit and a towed-barge specially customized for this service.
Seaspan’s schedule for the Tilbury - Nanaimo lane is shown below.
Seaspan Coastal Intermodal Schedule
Nanaimo Lane
Depart Arrive Depart Arrive Daily
Monday Tilbury Nanaimo Nanaimo Tilbury Capacity
Carrier Princess* 3:30 6:30 8:00 11:00
Seaspan Greg 10:00 13:30 14:30 18:00 26
Seaspan Monarch ‐ Barge #940 16:00 20:45 46
Princess Superior 16:30 19:30 21:00 0:00 38
Seaspan Challenger ‐ Coastal Spirit 20:30 0:15 1:45 5:30 54
Seaspan Monarch ‐ Barge #940 23:30 4:00 11:30 19:00 46
Total Capacity 210
Depart Arrive Depart Arrive
Tues. ‐ Thurs. Tilbury Nanaimo Nanaimo Tilbury
Seaspan Greg 10:00 13:30 14:30 18:00 46
Princess Superior 16:30 19:30 21:00 0:00 38
Seaspan Challenger ‐ Coastal Spirit 20:30 0:15 1:45 5:30 54
Seaspan Monarch ‐ Barge #940 23:30 4:00 11:30 19:00 46
Total Capacity 184
Depart Arrive Depart Arrive
Friday Tilbury Nanaimo Nanaimo Tilbury
Seaspan Greg 10:00 13:30 14:30 18:00 26
Princess Superior 16:30 19:30 21:00 24:00:00 38
Seaspan Challenger ‐ Coastal Spirit 20:30 0:15 1:45 5:30 54
Total Capacity 118
Depart Arrive Depart Arrive
Saturday Tilbury Nanaimo Nanaimo Tilbury
Princess Superior 1:30 4:30 11:30 14:30 38
Princess Superior 22:00 1:00 2:30 5:30 38

I B I G R O U P R E P O R T
Ministry of Transportation and Infrastructure Evaluation of the E & N Railway Corridor: Freight Analysis
Seaspan Coastal Intermodal Schedule
Nanaimo Lane
Total Capacity 76
Depart Arrive Depart Arrive
Sunday Tilbury Nanaimo Nanaimo Tilbury
Seaspan Challenger ‐ Coastal Spirit 21:00 0:45 2:15 6:00 54
Weekly Capacity 1010
Seaspan’s schedule and capacity for the Tilbury- Swartz bay route is shown below.
Seaspan Coastal Intermodal Schedule
Swartz Bay Lane
Depart Arrive Depart Arrive
Monday Tilbury Swartz Bay Swartz Bay Tilbury
Carrier Princess 14:15 17:15 18:45 21:45 22
Seaspan Greg 19:00 22:30 23:30 3:00 26
Carrier Princess 23:15 2:15 3:45 6:45 22
Total Capacity 70
Depart Arrive Depart Arrive
Tues.‐Thurs Tilbury Swartz Bay Swartz Bay Tilbury
Princess Superior 1:30 4:30 11:30 14:30 38
Carrier Princess 14:15 17:15 18:45 21:45 22
Seaspan Greg 19:00 22:30 23:30 3:00 26
Carrier Princess 23:15 2:15 3:45 6:45 22
Total Capacity 108
Depart Arrive Depart Arrive
Friday Tilbury Swartz Bay Bay Swartz Bay
Princess Superior 1:30 4:30 11:30 14:30 38
Carrier Princess 14:15 17:15 18:45 21:45 22
Seaspan Greg 19:00 22:30 23:30 3:00 26
Carrier Princess 0:00 3:00 4:30 7:30 22
Total Capacity 108
Depart Arrive Depart Arrive
Saturday Tilbury Swartz Bay Bay Swartz Bay
Carrier Princess 23:15 2:15 3:45 6:45 22
Depart Arrive Depart Arrive
Sunday Tilbury Swartz Bay Bay Swartz Bay
Seaspan Greg 19:30 23:00 0:00 3:30 26
Princess Superior 23:30 2:30 3:45 6:45 38
Total Capacity 64
Weekly Capacity 588

I B I G R O U P R E P O R T
Ministry of Transportation and Infrastructure Evaluation of the E & N Railway Corridor: Freight Analysis
Van Isle Barge provides service between a terminal on the Fraser River in Surrey and Duke Point in Nanaimo. The Van Isle service was initiated to handle the Catalyst paper traffic which was transferred from rail to truck in 2002. The Van Isle fleet includes 3 purpose built Articulating Tug-Barge combinations that are both self-powered and "pushed" by third party tugboats. Two barges are currently in service while the third barge is nearing completion of its conversion from a tow ocean-going barge to a coastal pusher barge. The vessels currently in service include the Arctic Hooper/Fraser Link, and the Sea Link Pusher/Van Isle Link, each with a capacity of 44 trailers.
The Van Isle Barge schedule and capacity are shown below:
Van Isle Barge Schedule
Nanaimo Lane
Depart Arrive Depart Arrive
Monday -Friday Surrey Duke Point Duke Point Surrey Capacity
ATB #1 18:00 22:45 44
ATB #2 21:00 1:45 44
Daily Capacity 88
Saturday-Sunday
ATB#1 & #2 18:45 23:30 88
Weekly Capacity 616
Tuesday-Saturday
ATB #1 0:45 6:00
ATB #2 3:30 8:45
Sunday-Monday
ATB#1 & #2 1:45 7:00

I B I G R O U P R E P O R T
Ministry of Transportation and Infrastructure Evaluation of the E & N Railway Corridor: Freight Analysis
Total Ferry Capacity
Total weekly ferry capacity for the three scheduled services is shown below:
Total Scheduled Ferry Capacity - Inbound to Vancouver Island
Nanaimo Seaspan Coastal BC Ferries Van Isle Total
Monday 210 192 88 298
Tuesday 184 192 88 272
Wednesday 184 192 88 272
Thursday 184 192 88 272
Friday 118 192 88 206
Saturday 76 192 88 164
Sunday 54 192 88 142
Weekly Capacity 1010 1344 616 1626
Swartz Bay Seaspan Coastal BC Ferries Total
Monday 70 200 270
Tuesday 108 200 308
Wednesday 108 200 308
Thursday 108 200 308
Friday 108 200 308
Saturday 22 200 222
Sunday 64 200 264
Weekly Capacity 588 1400 1988
The ferry schedules indicate a weekly capacity of approximately 2000 trucks per week, based on a standard semitrailer with a trailer length of 53 feet. All three ferry operators declined to provide information on current traffic levels due to commercial confidentiality concerns.