evaluation of scientific work experience programs for
TRANSCRIPT

Evaluation of Scientific Work Experience Programs for Teachers: Current Practice and Future Directions
Kathryn Sloane, Ph.D. University of Illinois at Urbana-Champaign
Judy Young College Park High School
Danville, CA.
February 1996
A Working Paper Commissioned by Industry Initiatives for Science and Math Education, Santa Clara, CA

2
Abstract
This paper describes the current evaluation practices employed by Scientific Work Experience Programs (SWEPs) across the country. A survey on current practices in evaluation was administered to SWEP program directors in 1995 and the results are summarized. Results were analyzed to determine the degree of commonality across SWEPs in their evaluation purposes, contexts, and strategies, and the degree of consensus on important goals and objectives across the projects. The authors conclude that there is sufficient commonality in these areas to support a multi-site collaborative evaluation effort. Issues relating to the design of a collaborative evaluation strategy are discussed. This paper is considered a "working paper" and the authors would welcome comments, suggestions, and corrections. Comments may be directed to Kathryn Sloane ([email protected]) or Judy Young ([email protected]).

3
The Authors: Dr. Kathryn Sloane is currently a visiting faculty member in the Division of Quantitative and Evaluative Research Methodologies (QUERIES) in the College of Education at the University of Illinois at Urbana-Champaign. Dr. Sloane was the Director of Education and Research for the Industry Initiatives for Science and Math Education (IISME) program from 1987-1991 and has served on the IISME Board of Directors since 1991. She was the Co-Director for the Berkeley Evaluation and Assessment Research project in the Graduate School of Education at the University of California at Berkeley, where she also taught evaluation and statistical analyses. Dr. Sloane has conducted program evaluations for curriculum development and teacher enhancement projects, primarily in the area of math and science education, for over ten years. Judy Young has taught mathematics for 28 years and is currently a mathematics teacher at College Park High School in Pleasant Hill, CA. She created and coordinates the Senior Experience Exchange at College Park High School, and she has presented at numerous conferences and workshops on mathematics education and on issues relating to counseling. Ms. Young was an IISME Fellow for four years and served as IISME Peer Coach for two summers. She has served on the IISME Board of Directors since 1993.

4
Table of Contents
Introduction The Survey Survey Results Who Evaluates and Why? Commonalities in Evaluation Contexts Priority Outcomes Commonalities in Priorities Current evaluation Strategies Commonalities in Evaluation Strategies and Concerns Viability of a Collaborative, Multi-site Evaluation Establishing Common Ground Benefits of a Collaborative Evaluation Potential Problems and Pitfalls Methodological and Substantive Issues to Consider Evaluation Approaches Methodological Models Measuring Variables Next Steps Appendix A: Tally of Survey Responses Appendix B: List of Survey Respondents List of Tables Table 1 Priority Outcomes for Institutional/Corporate Support Table 2 Priority Outcomes for Program Implementation Table 3 Priority Outcomes for Teacher Effects Table 4 Priority Outcomes for Classroom Transfer Table 5 Items with Lower Ratings on Classroom Transfer Table 6 Priority Outcomes for Students Table 7 Evaluation Data by Priority Statements Table 8 Evaluation Instruments Ordered by Use

5
Evaluation of Scientific Work Experience Programs for Teachers: Current Practice and Future Directions
Kathryn Sloane and Judy Young
INTRODUCTION
At the 1994 National Conference of Scientific Work Experience Programs (SWEP), program evaluation emerged as the "topic of greatest concern to program managers and funders" (Conference Report, 1995). There were "lively discussions" during the Conference sessions on program evaluation topics and "many unanswered questions" following reports on current evaluation strategies (by local SWEPs or by National Center for Improving Science Education (NCISE)). There seemed to be a sense of frustration among the conference participants: local program evaluation is a professional responsibility and a political necessity--but the projects are complex, the outcomes difficult to measure, and time and resources for evaluation are slim. There was a strong desire to share ideas and strategies, and a renewed discussion of the idea of a collaborative multi-site evaluation effort. In response to the discussion at the Conference, IISME agreed to commission a "white paper" to pull together some of the issues and concerns in SWEP evaluation and (perhaps) to propose some future directions in local or national evaluation. As a first step in achieving this aim, the authors surveyed SWEP program managers to gain a clearer picture of "the current state of affairs": What are the evaluation requirements at the local level? What are the important project objectives and which of these are, and are not, being evaluated? What types of evaluation strategies are currently in place? What are the most pressing concerns with respect to local evaluation? In this paper, we summarize and discuss the results of this survey with three purposes in mind. The first is to provide information to the SWEP community on current practices in evaluation. There seems to be a great deal of interest in "what others are doing" and in whether other projects are struggling with the same issues. The second purpose is to determine if there is enough common ground (in project purposes, evaluation requirements, and existing strategies) to proceed with plans for a national evaluation, and/or the development of a "common set of procedures" that local projects might use. Finally, we offer some suggestions on ways the survey and the survey results might guide further discussions of local or national evaluation strategies, and some methods that might be considered in such efforts.

6
THE SURVEY
In July 1995, we sent a survey to all of the 75 SWEPs listed in the latest SWEP directory. The survey contained questions about current evaluation requirements and strategies, as well as a list of project goals and objectives that we asked respondents to rate on importance. We received full responses from 35 project directors. Of the remaining 40, we learned that six projects are now defunct, that many others were not fully "up and running" (i.e., only had 2 or 3 teachers in summer positions as of yet), and that some project directors didn't want to complete the survey because they felt their projects were too small or too new. There were a few projects that, to the best of our knowledge, were well-established in 1993, but we were unable to elicit responses from those projects. Our best estimate is that the "potential population" for this survey was about 50 projects, giving us a return rate of 70%.
SURVEY RESULTS
The full survey and tallies of the item responses for the total group are presented in Appendix A. The items were also analyzed for differences among subgroups of projects, with subgroups defined along the following dimensions1:
Type: Industry-based (n=17) or Research-based (TRAC or University Research Lab) (n=16) or "other" (n=2) Size: Large (more than 15 teachers) (n=17) or Small (n=16) Age: Mature (more than 5 years old) (n=26) or Young (n=7)
While there were some differences on specific items, in general the responses were remarkably consistent across all of the subgroups. Therefore, we discuss the results for the group at large, noting areas in which there were noteworthy differences across subgroups. Who Evaluates and Why? Nearly all projects have some formal evaluation component: 27 respondents reported conducting formal program evaluations, and an additional 3 projects have evaluation strategies "under development." Evaluation is required in 24 (58%) of the projects, but the remaining 11 projects have no formal requirement. 1The cross tabulations are as follows: Research: small and young (6); large and mature (8); small and mature (2). Industry: small and mature (7); large and mature (7); small and young (1).
7
We posed a series of questions to try to discern the primary purposes of existing evaluations. These questions were: By whom are you required to do evaluation? What do they want to know? Who would read an evaluation report if you wrote it? What are the priority ratings of different potential purposes of evaluation? How do you currently use the evaluation data you collect? The responses are reported in detail in Appendix A and are summarized briefly in the following. By whom are evaluations required? Not surprisingly, the most frequent response to this question was "the funding agency." Grants from the National Science Foundation (NSF), the National Institute of Health (NIH), and other federal and private agencies mandate some form of evaluation, at least of the project activities funded by the grant. The TRAC program contains an evaluation component (managed by Associated Western Universities, as well as recent work by NCISE) required by the Department of Energy. Local governing boards (Boards of Directors, self-governing councils) also require program evaluations at many sites. Two respondents named an outside evaluator as the one requiring evaluation; but presumably, those evaluators were hired (or mandated) by a funding agent or a local governing board. What do they want to know? The most frequent (n=9) category of response to this question was attainment of goals. This category includes broad statements such as, "how well we meet our goals," "program effectiveness," or "return on the dollar." In these broad statements, "goals and objectives" or "effectiveness with respect to what" were not defined and could presumably include implementation goals and/or desired impact. Other responses could be categorized more specifically. Six (6) responses contained an explicit emphasis on implementation of project activities, such as, "evaluation of how each component of the grant has been carried out," "ratings of aspects of the program (e.g., availability of resources, assistance by staff, relationships with mentors)", "lab activities and enrichment activities," or "parameters of teachers' research experiences." Some responses focused on specific types of outcomes. The most frequent, by far, (n=8) was teacher outcomes, defined as changes in attitudes and behaviors, changes in philosophy of education and teaching styles, or retention in teaching careers. These were distinct from specific issues of classroom transfer, which were listed in only two (2) responses. And interestingly, student outcomes were mentioned specifically in only three (3) responses (and one qualified it by saying "sometimes"). Another two (2) responses noted sponsor outcomes, such as sponsor satisfaction or impact on mentors. What are the primary purposes of your evaluation? In this question, respondents were asked to rate a series of purposes as "primary," "secondary," or "probably not a purpose." Consistent with the emphasis on attainment of goals and outcomes as the

8
information desired by funders and governing boards, most program managers rated "monitor outcomes of the existing program" as the top priority (34 out of 35 responses). "Use as justification for funding" ranked next, with 24 respondents rating this as a "primary purpose". Traditional uses of formative evaluation (for ongoing program adjustment and for pilot-testing new activities or strategies) ranked third, with a little over half of the program managers rating these purposes as "primary." Almost none of the program managers saw "comparing your SWEP to other programs" as a primary purpose; 14 coded this item as "not a purpose" and another 16 rated it a "secondary purpose" at best. How do you currently use the data you collect? This question was included to distinguish between the intended purposes of evaluation and the actual uses of evaluation data. About half (n=15) of the program managers cited formative (program improvement) uses of the data and about one-third (n=10) described more summative uses (judging effectiveness; decisions regarding continued funding). Reporting functions (e.g., annual reports to funders and sponsors, journal articles, presentations to professional groups) were cited in nine (9) responses. Recruitment and marketing was mentioned in four (4) responses (but was also listed as a possible "other use", in another survey question, an additional five times). Contrasting these responses with those to the previous question, it appears that there is a slightly greater emphasis on "outcomes" in the intended purposes than in the actual uses. But on the whole, intents and uses of evaluation seem fairly consistent (which in this evaluator's opinion is somewhat remarkable). Who would read an evaluation report? This question was designed to identify the potential audiences for the evaluation. Three primary audiences were listed most frequently: 1) funding agencies (n=21); 2) project staff and management (n=15); and 3) the management and mentors at the local industry or research sites (n=15). Interestingly, teacher participants or school administrators were listed much less frequently (n=7 and n=5, respectively), about as often as academic colleagues (n=6). Commonalities in Evaluation Contexts Based on the results reported above, the 35 responding SWEP sites have many commonalities in the contexts within which local evaluation occurs: Formal evaluations are required from "the top", with the clients and primary audiences of the evaluations being what might be termed the "upper level management" (funders, sponsors, governing bodies) in the projects. There are consistently high expectations (or at least desires) for proof of program effectiveness, regardless of whether the project is relatively new or

9
well-established, or whether it serves a very small or very large number of teachers. Formal evaluation is mandated for accountability purposes (documenting implementation of funded activities, verifying attainment of stated goals, demonstrating program effectiveness), but project directors also have clear needs and uses of evaluation that go beyond the required accountability purposes (internal program adjustment and improvement, dissemination of information about the project, recruitment and marketing). Finally, the projects appear to share a predominantly "pre ordinate" or "goals-oriented" approach to evaluation, i.e., evaluations focus on the question, "are pre-established goals and objectives being met in practice?". This consistency in the contexts for evaluation bodes well for future efforts to collaborate on evaluation studies: it suggests that projects share similar constraints, concerns, and expectations regarding the purposes of evaluation--which is probably a necessary condition for collaborative efforts in this area. An even more important condition, however, is that the content of the evaluation is consistent, or at least compatible. In other words, are the projects consistent in their views of the important goals and objectives they are trying to attain? We turn next to that question, in our analyses of the ratings of program objectives. Priority Outcomes In this part of the survey, we included a "laundry list" of statements representing possible goals, objectives, or intended outcomes of the SWEP experience. To construct the list, we gathered documents (brochures, reports, evaluation instruments) from a number of SWEPs and included just about every statement we could find regarding goals or objectives. There was considerable overlap, of course, but we retained the various statements so we could see which ones resonated most with the largest number of respondents. The intent here was to determine if there was agreement on the "most important" objectives that might be assessed across projects, and if the wording of those objectives could provide direction in the development of specific instruments and strategies. The statements were grouped into six broad categories: a) institutional and program support; b) program implementation; c) teacher effects; d) classroom effects; e) student outcomes; and f) school and community impact. Some categories have more items than others; this is because there were more statements relating to these categories in the project materials we reviewed. Respondents were asked to rate each statement on a 5-point "priority" scale, with the following points defined:

10
5 = Highest priority. Critical outcome of our program; program cannot be considered successful if this does not occur for most teachers.
3 = Moderate priority. Desired objective of our program; would hope this occurs for many teachers.
1= Low priority. Would be "nice" if this occurred for some teachers. There was a tendency for respondents to rate most of the items highly, which is not surprising given the sources of the statements. Of the 76 statements, over half (n=43) have mean ratings greater than 4.0. Items with relatively lower mean ratings tended to have larger standard deviations, indicating greater variability in the priority ratings assigned. The means and standard deviations for all of the items are reported in Appendix A. In the following sections, we list and discuss those items in each category that were rated as having the "highest priority" across projects. We have selected those items with mean ratings greater than 4.0. Within each category, we give special attention to those items that clearly stood out as important (mean ratings greater than 4.2 or 4.5) and for which there was relatively strong agreement (standard deviations less than 1.0) about their importance. For contrast, in some categories we also mention those items that received notably low ratings, or those for which there was considerable disagreement across projects. Institutional/Corporate Support Eight (8) items were included in this category, focusing on mentor reactions and outcomes, and on changes in the institutions which support the projects. Of these eight items, only three (3) had mean ratings greater than 4.0. These are displayed in Table 1.
Table 1 Priority Outcomes for Institutional/Corporate Support
CAT ITEM Mean SD
IS A. Mentors feel that the program is worthwhile for teachers. 4.40
0.77
IS H. Teachers successfully complete the task assigned them.
4.17 1.06
IS B. Mentors feel that the program is worthwhile for themselves.
4.11 0.71
IS CATEGORY TOTALS 3.58 1.19

11
The priority items in this category basically reflect a focus on mentors' satisfaction with the project and with their teachers' performances during the summer internships. Items that did not receive high ratings focused on broader outcomes, such as more institutional and Board support for education (mean rating about 2.7), or greater understanding (on the Mentor's part) of teachers' roles and responsibilities in schools (mean ratings about 3.6). The Category Total row lists the mean and standard deviation for all of the eight items in the category; the relatively low mean2 (3.58) indicates that most of the items in this category did not receive consistently high ratings across the projects.
Program Implementation Nine (9) items considered aspects of the project structure and implementation, i.e., project activities and elements used to screen, place, and support teachers during the summer experience. In Table 2, the items are ranked according to mean ratings of importance
Table 2 Priority Outcomes for Program Implementation3
CAT ITEM Mean SD Prog G. Teachers receive support for extending experience to classroom
4.66 0.54
Prog I. Teachers will consider internship as a high level professional development program.
4.57 0.90
Prog B. Teachers adjusted well to the demands of internship.
4.50 0.56
Prog A. Screening process places teachers in best possible position.
4.43 0.85
Prog D. Orientation and other program meetings will enhance internship
4.30 0.78
Prog F. Teachers receive advice and support for sharing experience.
4.22 0.93
2A mean rating of 3.58 certainly indicates that goal statements had value to the project directors. But given the consistently high ratings across items, items with mean ratings below 4.0 stand out as notably less important than other items or categories and/or as items for which there was less consensus about their importance. 3All of the items in the category are included in Table 2, because there was only one item that did not meet the 4.0 or greater standard.

12
Prog E. Teachers are exposed to a variety of scientific & technical caree
4.19 1.01
Prog C. Increased participation of teachers of underrepresented groups.
4.00 1.00
Prog H. Mechanisms / academies are developed to continue dialogue after the internship.
3.64 1.25
CATEGORY TOTALS
4.28
0.93
What is immediately notable is the high category mean, which indicates that nearly all of the items received ratings higher than 4.0. The first three items on the list were very high priorities in nearly all of the projects, with mean ratings above 4.5. One might argue that these items do represent the central most important features of the SWEP experience: teachers are successful in the industry/research setting; they see the program as relevant to their professional growth; and they receive support for translating the summer experience into classroom practice. Following close behind in ranking is the goal of placing teachers in the "best possible position"; this certainly is consistent with, and perhaps a prerequisite for, teachers adjusting well and finding the experience professionally rewarding4. There was fairly consistent agreement on the importance of meetings (Orientation and other meetings) enhancing the internship (i.e., being a worthwhile use of limited time during the summer) and on teachers receiving advice and support for sharing their experience (although it is not clear if this means with their SWEP teacher colleagues, teachers at their school site, or some other target group). There was slightly less agreement on the importance of recruiting teachers of underrepresented or minority student groups. The one item that did not receive consistently high ratings in this category related to follow up mechanisms--Academies or other regular meetings during the school year to provide ongoing support for teachers after the summer experience. For some projects (like the TRAC program), this is not a viable option since teachers are not "local"; for other projects (like IISME), the Academy structure is considered an integral part of the program model. Teacher Effects In this category, we included those statements that focus on the teachers' own knowledge, attitudes, and professional skills. Items related specifically to classroom
4 Establishing the criterion for this objective may not be straightforward, however, and as we will report in a later section of this paper, very few projects collect data to assess this goal.

13
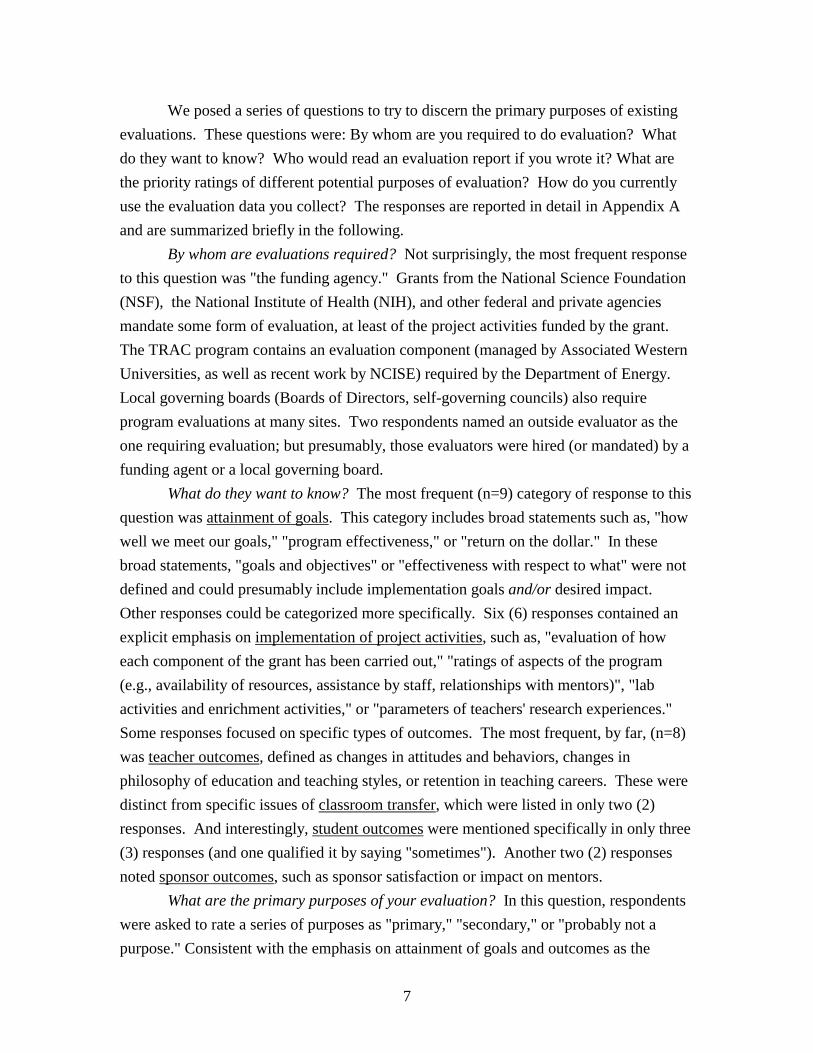
transfer are included in the next category. The ranked results in this category are displayed in Table 3. Fourteen (14) of the 21 items had mean ratings of 4.0 or higher. Again, there were three items that emerged as very high priority, with mean ratings greater than 4.5. These, too, represent central, defining features of the SWEP experience: gaining first hand knowledge of the industry or research culture; becoming credible models to students of the excitement of math and science; and gaining a renewed enthusiasm for teaching5. While still enjoying high ratings, the next set of items are somewhat less "vital" to the success of the projects. There are relatively lower ratings, and relatively more variability in assigned ratings, for items that represent specific "manifestations" of the broader goals in the top three items. For example, it is considered very important, across projects, for teachers to gain knowledge of the culture and careers in the industry or research environment. But it is considered a little less important for teachers to gain specific knowledge of manufacturing or research processes, to know about specific post-secondary opportunities, to demonstrate gains in their knowledge of subject matter, or to increase their awareness of specific subject-to-work applications.
5As an aside, verification of this last item has been an important issue in some projects. In IISME, for example, there was great concern at the beginning of the program that teachers would be enticed to leave teaching for the world of industry. Consistent evidence across the years that the experience renews their commitment to teaching was an important point in explaining the program goals to potential sponsors.
14
Table 3
Priority Outcomes for Teacher Effects
As a result of a SWEP internship, teachers will CAT ITEM Mean SD Tchr A. gain first hand knowledge of industry/research culture and
careers. 4.81 0.47
Tchr L. become credible model to students of excitement with math/science subjects.
4.61 0.69
Tchr K. demonstrate renewed enthusiasm for teaching.
4.59 0.86
Tchr M. have higher professional self esteem.
4.43 0.98
Tchr N. be revitalized after the summer.
4.37 0.84
Tchr B. be more knowledgeable of manufacturing or research processes.
4.32 0.84
Tchr O. have new perspectives on education.
4.31 1.01
Tchr I. develop activities to use in their classroom.
4.30 1.13
Tchr D. be more knowledgeable in their subject area.
4.28 0.97
Tchr C. increase awareness of specific subject to work application. 4.19
0.95
Tchr J. be more self confident in work-world skills. 4.19
0.98
Tchr P. share experience with school personnel or community groups. 4.19
0.86
Tchr E. know a larger number of post secondary opportunities for students.
4.06
0.83
Tchr G. be more competent in the use of technology. 4.00
0.79
Tchr CATEGORY TOTAL 4.05 1.09
Other sets of items show this pattern of greater agreement and higher value ratings on broader purpose statements, with less agreement and lower value ratings on specific examples of how that purpose might be manifested. For example, "share experience with school personnel or community groups" had a mean rating of 4.19; but, items that might indicate specific ways of sharing the experience (such as "conduct inservice related to internship", or "become involved in school reform outside their own

15
classroom") had much lower mean ratings (around 3.2) and much higher standard deviations (over 1.25). Also rating relatively less important were items relating to assuming new leadership roles in the school or district, continuing with more professional development, and being retained in the teaching force. Classroom Transfer This category had an equal number of items (n=21) to the Teacher Effects category, and represents the goals of translating the summer experience into classroom practices which will, in turn, contribute to better learning and appreciation for math and science among students. The ranked items in this category are presented in Table 4.
Table 4 Priority Outcomes for Classroom Transfer
As a result of a SWEP internship, teachers will CAT ITEM Mean SD Class L. use applications & examples from summer experience.
4.68 0.54
Class S. use more teamwork and cooperative learning with students.
4.49 0.82
Class T. design & implement more hands-on lessons.
4.38 0.78
Class R. promote student investigation & inquiry.
4.37 0.77
Class G. revise or add new content to lessons & labs.
4.26 0.86
Class I. integrate math, science and technology.
4.12 1.07
Class J. provide more "business/real world" applications.
4.12 1.23
Class U. act more as a facilitator than a lecturer.
4.09 1.09
Class K. value and encourage better communication skills.
4.06 1.15
Class CATEGORY TOTALS
3.72 1.21
The project directors agree that, as a result of the summer experience, teachers should modify their classroom practice to include more applications and examples of how math and science are used in industry and research. They agree that teachers should work to integrate math, science and technology, to promote investigation and inquiry (perhaps

16
through more hands-on lessons), and to encourage communication skills. These items reflect a sense of what the projects are promoting as "desirable" classroom practice in math and science education. While these items are rated highly, there is more variability in the item ratings, as indicated by the relatively larger standard deviations on at least five of the items. In this category, 12 of the 21 items had mean ratings less than 4.0. The pattern noted in the Teacher Effects category is very obvious in this category: there is agreement on the value of general principles of classroom transfer, but not on the specifics of how this should occur, or of what specifically should be expected of teachers in their classroom practice. For example, while there is agreement that teachers should encourage communication skills, project directors are not, as a group, willing to assign priorities to teachers' requiring more oral reports or assigning more written reports. To illustrate further, we include in Table 5 the list of items that had substantially lower ratings.
Table 5
Items with Lower Ratings on Classroom Transfer ITEM Mean SD Q. increase use of computers & technology in their classroom. 3.80 0.96 A. invite mentors and speakers to schools. 3.63 1.11 H. include lessons on science careers & job requirements. 3.54 1.38 E. provide activities that strengthen school-industry partnerships. 3.47 1.24 B. take students on field trip to internship site. 3.46 1.07 F. increase emphasis on work habits such as punctuality, dependability, meeting deadlines, & professionalism.
3.36 1.22
D. receive materials or equipment from lab or industry. 3.26 1.11 C. take students on more field trips to industry and lab sites. 3.11 1.18 M. cover fewer topics but in more depth. 3.09 1.33 N. require more oral reports & presentations. 3.09 1.28 P. assign long term joint projects. 2.94 1.28 O. assign more formal written reports. 2.71 1.12 There is less priority given to "career education" and specific strategies for increasing students' knowledge of careers, or to increasing links between the specific industry or

17
research site and the school (see items A, E, B, D, C6). Interestingly, the group emphasized improved communication skills, but assigned much lower ratings to improved "work habits" among students (such as punctuality, meeting deadlines, and the like). Student Outcomes While SWEP model is one of professional development and teacher enhancement, the students are, of course, the ultimate beneficiaries of improvements teachers may subsequently make in their classroom approach and instruction. Exactly how this "line of influence" is to occur is difficult to establish, however. And, there is ample recognition of the many factors that affect student attitudes, performance, and persistence in math and science (as in any other field of study). Of the 14 items included in this category7, eight (8) earned mean priority ratings greater than 4.0. These ranked items are displayed in Table 6.
Table 6 Priority Outcomes for Students
As a result of having a teacher with a SWEP internship, students will CAT ITEM Mean SD Stud D. improve skills in problem solving.
4.39 0.87
Stud K. enhance their observational & analytical skills.
4.28 0.81
Stud I. show increased enthusiasm and appreciation for science/math.
4.22 0.99
Comm E. be better prepared to enter the science/ technical workforce.
4.20 1.11
Stud B. increase knowledge of careers and requirements.
4.14 0.91
Stud C. have a greater appreciation of role of math, science and technology in society.
4.08 0.91
Stud E. increase computer & technical literacy.
4.00 0.86
Stud H. engage more in cooperative/ collaborative learning.
4.00 1.17
6Links with the internship site are not possible in some projects, such as TRAC or other projects that recruit teachers from wide geographic areas. 7Two items relating to student outcomes appeared in the "school/community" category, because they pertain to the impact of improving the technological talent and scientific literacy of the citizenry. They are included in this discussion, however, since they relate directly to expectations of student impact.

18
Comm A. more students graduate and enter math/science fields.
3.68 1.32
The priority items for student outcomes are fairly consistent with the priorities in the classroom transfer category: project priorities for student outcomes focus on improved skills in problem-solving, analyses, and technical literacy; priorities for classroom transfer focus on applying knowledge to "real-world" applications, promoting investigation and inquiry, and integrating math, science, and technology. Project directors place a high value on students' learning more about math and science careers, increasing their interest and enthusiasm in math, science, and technology, and gaining a better appreciation of the roles these fields play in society. Relatively high priorities (by some projects, at any rate) were also assigned to students' increasing their knowledge of the world of work and considering careers in math/science teaching. There is less endorsement of the goal of students' enrolling in more math and science classes or becoming more involved in extracurricular math/science programs (less than 3.5). And, there is relatively less value and agreement for the goal of having more students enter math/science fields after they graduate (mean = 3.68). School/Community Effects The final set of items focused on effects in the school environment or in the community (society) at large. The two items relating to students were discussed in the previous section. Of the remaining three items in this set, only one--"A 'critical mass' of program teachers will influence the climate of the school"--had a mean rating greater than 4.0. Much lower ratings were assigned to the following two items: "administration will be more involved in school-community partnerships" and "the public will become more involved with issues of education." Apparently, these potential benefits of the program are too distant and tenuous to receive consistently high priority ratings among the group of project directors. Commonalities in Priorities Our first and strongest reaction to these survey results is the remarkable consistency among respondents as to the highest priorities of their projects. Given the number of items, the overlap among them, and the various choices of wordings offered, we were skeptical about the degree of consensus that would be achieved. The distinctions among types of programs (research-based versus industry-based, for example) account for some of the discrepancies in ratings, but by and large there was a tremendous amount of agreement about what these projects aim to accomplish. This

19
degree of consensus suggests that projects might well profit from collaborative evaluation efforts, since their basic goals and objectives are in harmony. Further, agreement on statements of goals and priorities provides a strong starting point for identifying criteria or data collection strategies that can be used to document goal attainment. One method of summarizing and interpreting the survey findings is to organize the statements in a "conceptual map" of the program model. A very simple version, perhaps better described as a "flow chart", is presented in Figure 1. In this figure, we have inserted the goals statements into different points, corresponding to the summer experience, the immediate teacher effects, intermediate effects (mainly classroom transfer), and longer-term effects for both teachers and students8. This organization may facilitate further discussion among project directors regarding: a) the implicit assumptions of how the program is expected to exert its influence; b) program mechanisms that are designed to facilitate the intended effects; and c) other ("extraneous") factors that may be influential at various points in the process. Further discussion and refinement of the program model is an important next step toward any effort to design a collaborative evaluation effort. The figure, or one like it, may also be useful at the local project level--as a means of clarifying goals, expectations, and the linkages between intents and project mechanisms. For example, we administered this survey to the members of the IISME Board of Directors and to Figure 1
8 A similar "program model" is included in Gottfried, et. al (1992)

20
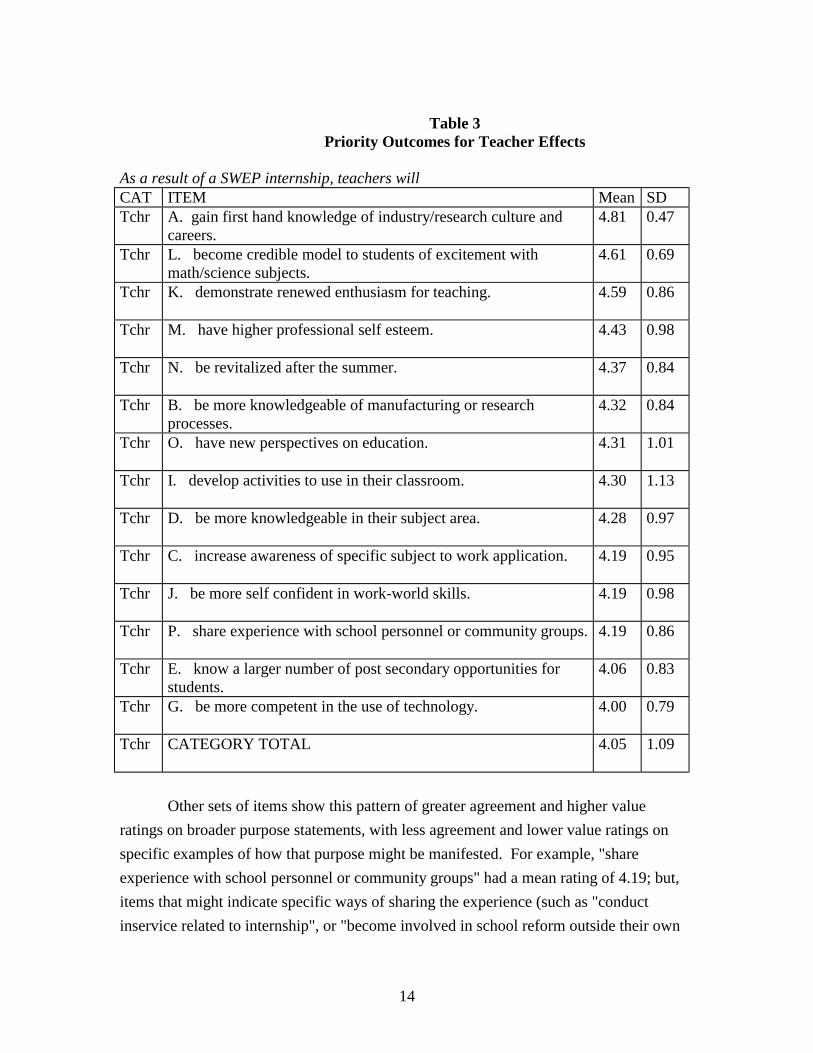
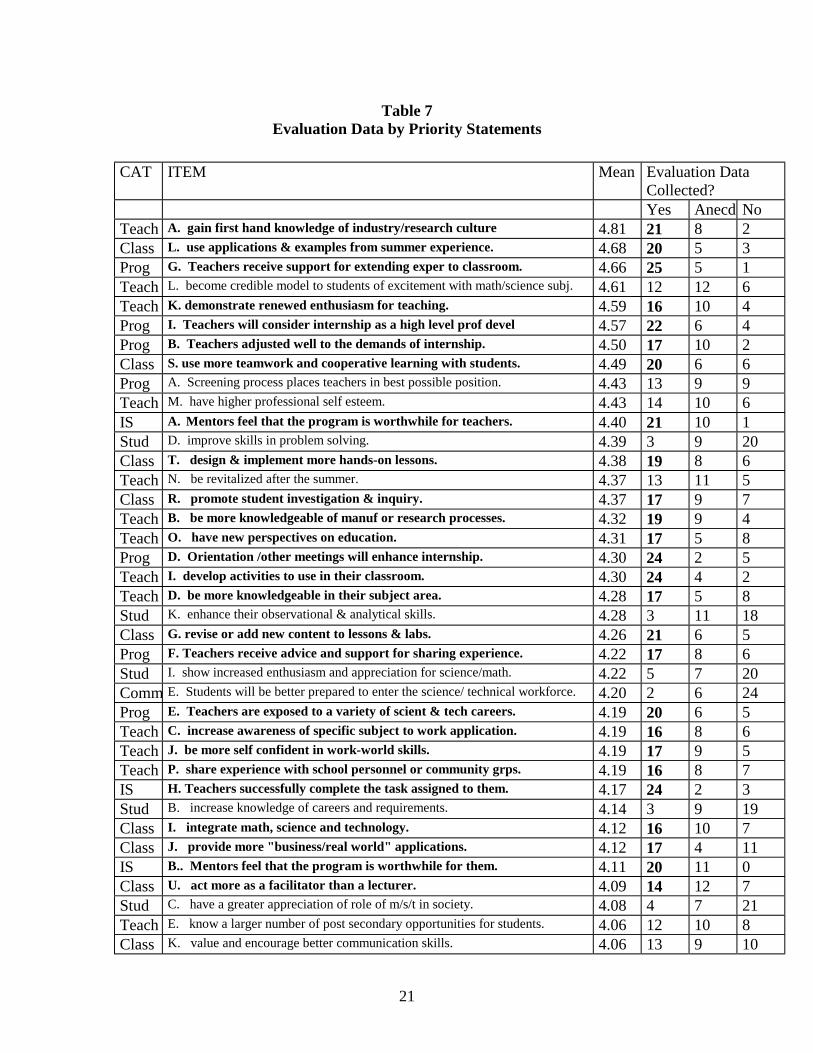
the IISME Fellows during the summer 1995 session. Using Figure 1 as a model, we inserted the priority statements identified by teachers into one figure, those from the Board in another, and those agreed to by both groups in a third figure. These were then used in a Board retreat as a mechanism for strategic planning. The survey results provided information on the teachers' views of the important aspects of the experience as input into the strategic planning process. Further, areas of discrepancy in ratings could be explored further: e.g., are discrepancies the result of different perspectives, or are there expectations that are not being clearly communicated to teachers, or do teachers see benefits and values that the Board is not aware of? The IISME staff and Board found the process to be extremely useful in their strategic planning. Current Evaluation Strategies The survey also contained questions about current evaluation and data collection strategies used by project directors. These results will be discussed in two parts: 1) what is being evaluated; and 2) what data collections strategies are being used. What is being evaluated? As part of the "priority ratings" of the statements of intended outcomes, we asked project directors to indicate whether or not that outcome is formally evaluated in their project. There were three possible responses: "yes", "informal or anecdotal evidence only", and "no." In Table 7, we have aggregated all of the "top priority" (mean ratings greater than 4.0) goal statements from all of the categories into one ranked list. We list the mean rating for reference, and then include the numbers of projects collecting "formal" data, "informal" data, or "no" data related to this outcome. In this table, statements for which 16 or more projects reported "formal" data collection strategies in place are highlighted in bold-face type. The choice of "16" was somewhat arbitrary, but chosen because it represents about half of the average number of responses across the items. We also realize that one person's "yes" might be another person's "anecdotal", but we assumed that if half of the project directors were willing to say "yes, we collect data on this item," then the item probably is being evaluated systematically (in some fashion) across projects.
21
Table 7 Evaluation Data by Priority Statements
CAT ITEM Mean Evaluation Data
Collected? Yes Anecd No Teach A. gain first hand knowledge of industry/research culture 4.81 21 8 2 Class L. use applications & examples from summer experience. 4.68 20 5 3 Prog G. Teachers receive support for extending exper to classroom. 4.66 25 5 1 Teach L. become credible model to students of excitement with math/science subj. 4.61 12 12 6 Teach K. demonstrate renewed enthusiasm for teaching. 4.59 16 10 4 Prog I. Teachers will consider internship as a high level prof devel 4.57 22 6 4 Prog B. Teachers adjusted well to the demands of internship. 4.50 17 10 2 Class S. use more teamwork and cooperative learning with students. 4.49 20 6 6 Prog A. Screening process places teachers in best possible position. 4.43 13 9 9 Teach M. have higher professional self esteem. 4.43 14 10 6 IS A. Mentors feel that the program is worthwhile for teachers. 4.40 21 10 1 Stud D. improve skills in problem solving. 4.39 3 9 20 Class T. design & implement more hands-on lessons. 4.38 19 8 6 Teach N. be revitalized after the summer. 4.37 13 11 5 Class R. promote student investigation & inquiry. 4.37 17 9 7 Teach B. be more knowledgeable of manuf or research processes. 4.32 19 9 4 Teach O. have new perspectives on education. 4.31 17 5 8 Prog D. Orientation /other meetings will enhance internship. 4.30 24 2 5 Teach I. develop activities to use in their classroom. 4.30 24 4 2 Teach D. be more knowledgeable in their subject area. 4.28 17 5 8 Stud K. enhance their observational & analytical skills. 4.28 3 11 18 Class G. revise or add new content to lessons & labs. 4.26 21 6 5 Prog F. Teachers receive advice and support for sharing experience. 4.22 17 8 6 Stud I. show increased enthusiasm and appreciation for science/math. 4.22 5 7 20 Comm E. Students will be better prepared to enter the science/ technical workforce. 4.20 2 6 24 Prog E. Teachers are exposed to a variety of scient & tech careers. 4.19 20 6 5 Teach C. increase awareness of specific subject to work application. 4.19 16 8 6 Teach J. be more self confident in work-world skills. 4.19 17 9 5 Teach P. share experience with school personnel or community grps. 4.19 16 8 7 IS H. Teachers successfully complete the task assigned to them. 4.17 24 2 3 Stud B. increase knowledge of careers and requirements. 4.14 3 9 19 Class I. integrate math, science and technology. 4.12 16 10 7 Class J. provide more "business/real world" applications. 4.12 17 4 11 IS B.. Mentors feel that the program is worthwhile for them. 4.11 20 11 0 Class U. act more as a facilitator than a lecturer. 4.09 14 12 7 Stud C. have a greater appreciation of role of m/s/t in society. 4.08 4 7 21 Teach E. know a larger number of post secondary opportunities for students. 4.06 12 10 8 Class K. value and encourage better communication skills. 4.06 13 9 10

22
Comm C. A "critical mass" of program teachers will influence school climate. 4.03 3 12 17 Prog C. Increase partic of teachers of underrepresented groups. 4.00 21 3 7 Teach G. be more competent in the use of technology. 4.00 16 9 7 Stud E. increase computer & technical literacy. 4.00 3 8 21 Stud H. engage more in cooperative/ collaborative learning. 4.00 3 10 19 Two patterns are immediately evident in Table 7. The first is that the highest priority items are being evaluated: 28 of the 43 statements received "yes" ratings by the majority of responding projects. Evaluation efforts are focused on these most important objectives. As the mean priority ratings decrease, fewer projects report collecting formal data. This trend continues: of all of the items in the survey, only one with a mean rating lower than 4.0 was cited by half the group as a data collection item. That item was related to teacher retention. The second pattern is the lack of formal data collection related to student outcomes. Very few programs collect any student data, and most of that tends to be rated by the project directors as informal or anecdotal. The problems with collecting student data are well-known: accessing data from school records; gaining access to schools and classrooms; identifying variables that would be appropriate to use across different subjects, grade levels, and student demographic groups; identifying or developing valid and reliable instruments; finding the time and resources to engage in systematic data collection in many different schools; and, justification of the time and resource expense, given the difficulties in establishing strong and direct relationships between teacher behaviors and student outcomes (e.g., GAO, 1994). How are evaluation data collected? We asked project directors to respond to a list of possible types of evaluation instruments, indicating whether or not they employ that method in their project and, if so, how valuable they view that strategy. The value ratings were as follows: 3 = most valuable 2 = valuable 1 = least valuable N = never used. The results of these ratings are presented in Table 8. Project directors are clearly collecting a lot of information about their projects. Teacher surveys, Action Plans or technical reports, formal and informal interviews with teachers, site visits during the summer, and checks with mentors are part of the repertoire of over two-thirds of the projects reporting. Spring follow-up surveys and implementation reports are the primary methods of assessing classroom implementation or school/classroom-based transfer of the experience. Talks with school personnel,

23
classroom visits, or surveys of longer-term teacher behaviors (such as retention) are used less frequently. Only a very few projects attempt to collect any data from students.

24
Table 8 Evaluation Instruments Rank Ordered by Use
EVALUATION INSTRUMENT #
Use Mean Rating
I. Informal interviews with teachers, mentors, company personnel 32 2.38 C. Teacher survey at end of the program 30 2.67 L. Action Plans or technical reports of teachers 30 2.47 G. Face to face interviews with teachers 29 2.48 N. Teacher evaluations of program meetings 26 2.46 A. Teacher survey at entry of the program 25 2.16 P. Site visits to internship by staff 25 2.64 F. Mentor surveys at end of summer 24 2.62 D. Teacher survey follow-up in spring semester 23 2.48 M. Implementation reports of teachers 23 2.43 S. Talks with principal, Dept. chair, school administration 18 1.94 O. A template designed to profile programs 17 2.06 H. Telephone interviews with teachers 16 2.12 R. Classroom visitations 15 2.47 B. Teacher survey in the middle of the program 11 2.27 E. Teacher survey periodically for special topics (e.g. retention) 8 2.38 Q. Student surveys 7 1.86 J. Student interviews 5 2.00 K. Data collection on student performance 5 2.20
Use does not necessarily imply value, however. While we did not explicitly define "value" in the survey, we feel it safe to assume that project directors responded to this rating according to the quality of the information they receive and/or the usefulness of the information in documenting effects, understanding processes, or improving activities in the project. Table 8 also displays the mean "value" ratings (with 3 as the highest and 1 as the lowest possible ratings; mean values were calculated based on ratings from projects who use the evaluation instrument). Project directors assigned the highest values to teacher surveys at the end of the program, site visits to the internship site, and mentor surveys at the end of the summer. These instruments focus on program implementation and immediate outcomes (to use the categories in Figure 1). Informal interviews with teachers, mentors, or company personnel were the most frequently used data collection strategy, but this strategy received a notably lower mean value rating than other more comprehensive or systematic approaches (such as surveys, Action Plans, or implementation reports). Face-to-face interviews were seen as more valuable than telephone or informal interviews; internship

25
site visitations were rated as more valuable than classroom visitations. Even though 18 projects reported some interaction with school administrators, the information obtained from these contacts was rated very low, relative to the other strategies. And among those projects that do collect student data, student performance data was seen as most valuable, followed by student interviews; student surveys received the lowest value rating of all the strategies listed. There were some differences between industry-based and research-based projects in their value ratings. Managers of industry-based projects assigned higher value to implementation reports than did their research-based counterparts. Managers of research-based projects assigned relatively higher value to teacher and mentor surveys at the end of the summer, and spring follow-up surveys to teachers, than did industry-based managers. The groups were very consistent in the high value ratings for site visits to internship sites and face-to-face interviews with teachers9. Commonalities in Evaluation Strategies (and Concerns) The SWEP projects, as a group, are collecting a tremendous amount of information from participating teachers. Further, most of the group reports that their primary objectives are being assessed--at least to some extent. This implies that project directors are focusing their resources on the most important aspects of their projects, which in turn might imply that all is running smoothly with respect to local evaluation10. The comments from some of the project directors suggest that they are satisfied with their existing evaluation strategies. Several are engaged in intensive data collection efforts, with multiple data sources (including classroom and student data), and (for at least one) longitudinal designs. Others feel that their level of involvement in program operation affords them a good sense of what is and is not working and that their "audiences" (e.g., Boards or governing councils) are satisfied with the information they are receiving.11 As one respondent said: "My needs are basically met by the many tools I have available to me. Although sometimes cumbersome, the tools do get at what the
9 Some projects employ a "peer coach" in the summer--an experienced Fellow who can visit the sites, talk regularly with the teachers, identify potential problems, and assist teachers in adjusting to the summer experience and in reflecting on ways the summer experience transfers to classroom practice. 10We wish, in hindsight, that we had asked that question directly! 11We should note that this group also contains some project directors who feel the "data collection" burdens placed on them and their participating teachers are already too great, and that the money spent on these efforts might be better used in networking, disseminating, or providing more project resources at the local level.

26
meat of the program is." Another said: "Our participants understand/accept the benefits of the program based on our methods of evaluation and reporting." Throughout the group, however, project directors (even those cited above) convey concerns about the lack of "hard" data on program effects--particularly, although not solely, with respect to students. For example, one project manager wrote that the local evaluation audience "would probably like more hard data, which we are unable to provide." The following quotes reflect similar concerns:
"We need a way to determine unambiguously how successful the programs are. We think they are, we 'feel' they are...but we haven't found a way to determine that objectively yet." "We need 'data' that will be acceptable to business people that clearly shows the value of the program...[and perhaps to show that qualitative data is 'good' data]." "Biggest issue is time required to collect and analyze the data. There is absolutely no doubt in my mind that evaluation is necessary and valuable. Also, in the situation I am in, 'soft' data, while okay, is not as valued as 'hard' data and that is much more difficult and time-consuming to collect."
Our sense is that most project directors are satisfied with their current efforts to monitor implementation (e.g., if all's okay during the summer internship, if teachers respond well to project meetings and activities, if mentors are satisfied with the teacher's work and their participation in the project)12 and to document immediate teacher effects (e.g., valuing the summer experience as high quality professional development; attitudes and reactions at the end of the summer experience; intents to incorporate new strategies into classroom instruction; feeling revitalized or more self-confident about their capabilities). There are more concerns, however, about current procedures for documenting actual classroom transfer, for trying to establish causal links between the summer experience and teachers' subsequent classroom practice, and, of course, for gaining some insight into student effects. These concerns are legitimate and are confirmed by the list of frequently used evaluation strategies. The survey results indicate that most efforts are focused on "self-report" data from teachers. While this is the best (and perhaps only viable) method of
12 We should note, however, that there are "important" program implementation goals that are not being assessed, such as whether teachers are placed in the "best possible position."

27
assessing teacher satisfaction with the program or teacher attitudes toward teaching and/or the summer experience, it is a less-defensible (though the most efficient) method of assessing other outcomes, such as classroom transfer. Action Plans and implementation reports are somewhat more direct measures of classroom transfer, but these must be analyzed systematically or coded according to some clear-cut criteria if they are to yield data that can provide "harder" evidence on how the summer experience contributes to substantive improvements in math and science education. Establishing the criteria, reading these reports, and summarizing the information are tasks that take a tremendous amount of time (which project directors don't have) and a combination of expertise in the subject area, in instruction, and in qualitative analyses (which a project manager may or may not have)13. Further, in a comprehensive evaluation, one would hope for even more direct evidence, gathered from the classroom, to confirm and expand the data collected in teacher surveys and written reports. The lack of student data has emerged in all aspects of this survey. Some project directors (although perhaps fewer than might be expected) wrote at length about the pressure to document student outcomes and their frustration with lack of time, resources, or valid measures to do so. The following four quotes are offered as illustration:
"Our governing council wants data on student attitudes/behavior impacts, but we work with teachers from 23 school districts across the country and can't collect data on students. Do most SWEPs get student data?" "We know (and have supportive data) that teachers and industry benefit [from the project]. Less apparent is the degree of 'transfer' to students (and teacher peers and administration). Means can be devised to measure student impact, however, bureaucracy of school administration must be gotten around. PLUS, the 'pros' need to quite shooting disqualifications (i.e., we know that not every single variable can be controlled in the social sciences). However, simplistic measurements of student knowledge, attitude, observation, and motivation can be accomplished. If significant changes occur, then we can start to worry about the various variables which may skew findings." "Priority should be given to a student outcome evaluation tool. I am concerned about the time/cost to develop and implement reliability/credibility of instrument. We should also rate curriculum development to school-to-work (careers) and national skill standards. The information from this survey should be used as
13IISME employed a strategy of having teams of Teacher Fellows review Action Plans and select "exemplary" ones for dissemination. It proved to be a daunting task, even for experienced Fellows. Several projects do disseminate Action Plans or classroom projects--in paper form, on networks or disks, or through teacher presentations. This is a no doubt valuable and very useful strategy for dissemination and for encouraging collegiality and networking among teachers.
28
leverage for funding professional design/development of effective evaluation tools. This cannot be done by any one SWEP." [Our project] realizes that standardized test scores will show little, if any, statistical difference following a teacher's participation in the program. Regardless, data will be collected and studied. . . . The program feels the best evidence of student 'change' can be measured by 'how they vote with their feet' (i.e., enrollment in science classes beyond the required number and level, participation in science clubs, science class attendance, etc.). This data is currently being collected for a program evaluation."
In discussing the evaluation issues that confront them, a number of project directors specifically raised the issues of logistics (time and resources to conduct local evaluations). Others focused on the somewhat related issues of time, resources, and expertise needed to: a) develop valid and reliable measures for important project objectives; b) discern which variables can and cannot be "measured"; c) design a viable set of evaluation procedures that includes quantitative and qualitative approaches; and d) build a defensible case for a "mixed methods" evaluation plan and for decisions regarding how specific "effects" will and will not be assessed. Finally, a third (also related) methodological issue was raised regarding the "power" of the conclusions that any one project can draw, given relatively small sample sizes. These three sets of issues "come together" in the call for a multi-site collaborative evaluation effort. While the amount of pressure being exerted for additional evaluation data varies across projects, the survey results suggest that project directors would consider adding to or replacing current evaluation strategies if newer methods met one or more of the following criteria: a) were part of a comprehensive, defensible plan for assessing important objectives; b) focused on difficult-to-measure outcomes; or c) improved the efficiency (e.g., logistics) of local data collection efforts. In other words, the project directors seemed receptive to (and in some cases, specifically requested) such a collaborative effort. In the following section, we explore the viability, and some of the "pros and cons", of a multi-site evaluation. In the final section, we offer some suggestions on approaches, tactics, foci, and methods that might be considered, should such an effort proceed.
VIABILITY OF A COLLABORATIVE, MULTI-SITE EVALUATION Establishing Common Ground

29
Before any collaborative effort at evaluation can proceed, there must be evidence that projects share similar views of what they are trying to accomplish and how they intend to accomplish it. Given that: a) clusters of projects were initiated from a common funder (such as TRAC projects) or project model (such as IISME), b) projects have implicitly agreed to a common "name" (Scientific Work Experience Programs for Teachers), and c) project directors come together in national conferences to share their experiences and strategies, it might reasonably be presumed that there is substantial common ground. Local projects, once born, take on characteristics of their own, however. Over time, these local features may result in projects that share less than their common origin may imply. And, "the devil is in the details." That is, while broad intents may be similar, local projects may vary so much in their implementation that attempts to "aggregate results" are meaningless. One need only think of Head Start, Title I, Follow-Through, Cities-in-Schools--or even Project 2061--to generate examples of "national programs" whose "local implementation projects" defy standardized evaluation procedures. Thus, even if the results of this survey "tell us what we already know", confirmation of areas of common ground is an important first step. The survey results do indicate a substantial amount of common ground among local projects. First, there is commonality in the contexts for evaluation. The purposes of evaluation, the clients and primary audiences, and the uses of evaluation data are quite similar across projects. These are the first "facts" an evaluator must determine in designing an evaluation, and if the contexts varied too much across projects, a collaborative effort would be immediately doomed to failure. Second, there is remarkable consensus on important goals and objectives across the projects. We would be concerned if this consensus were only on broad, grandiose aims that are held by any and all math/science educational programs. There are those types of statements in the list (e.g., "students have better appreciation for m/s/t in society"), but on the whole the agreed-upon statements reflect a level of specificity that does: a) identify unique intents and procedures of the SWEP model; b) facilitate the generation of potential indicators; and c) accomplish a) and b), yet allow for local adaptation and variation in the project characteristics and actual implementation activities. Third, there is consistency across the projects in the scope and types of evaluation (data collection) strategies already in place. This suggests that there may already be a "pool" of instrumentation for some important objectives. These could be reviewed and streamlined for a collaborative evaluation effort (perhaps), thereby allowing time and

30
resources for the development of procedures for those objectives not being assessed (or assessed well). Fourth, there is consistency in the general approach to evaluation that has been used to date, i.e., a "pre-ordinate" or "goals-attainment" approach. This approach may--or may not--be the best one to employ for a collaborative evaluation effort (and we discuss this issue more in a subsequent section). But the consistency does imply that a consortium of project directors would approach the table with a common mind-set on the general model (if not the specific methods) of a collaborative effort. In our opinion, the survey results confirm that SWEP can be conceptualized as a program consisting of local projects.14 There is sufficient justification for an evaluation design that would result in an aggregation of results across projects and in an analyses of the relationship between project characteristics and program outcomes. The consensus on program objectives indicates that some aspects of the evaluation could focus on the pervasiveness of certain effects across local projects, while identifying other effects that are unique to individual or subgroups of projects. Benefits of a Collaborative Evaluation There are at least four categories of potential benefits of a collaborative evaluation (and these have been implied throughout the preceding sections of this paper). The first is resource efficiency. Individual projects do not have the time, money, or personnel to conduct intensive evaluation studies or to develop and validate specific instrumentation and procedures. Every project manager who faces the need to evaluate must develop and implement his/her own procedures. A "generic" set of instruments or procedures that could be adapted for local use would reduce development time and "reinventing the wheel"; a collaborative effort that funded some data collection would free up project directors' time to focus on specific aspects of the local project (implementation, documentation, or evaluation) that needed attention. The second benefit is in determining the effectiveness of the program model in a more defensible way. Identifying effects that persist across a variety of projects, and/or increasing the sample size used in analyses of effects adds "power" (substantive and statistical) difficult to attain in one local evaluation study. All projects could then use these results in their requests for funding or sponsorship and in planning new project directions or needs. 14 A program is a coordinated effort to address some mission or goal; projects are individual investigative, developmental, or implementation efforts under the program "umbrella" (see Joint Committee on Standards for Educational Evaluation, 1994; Madaus et al, 1992; Stevens, et al (no date))..

31
The third benefit is in examining the relationships between project characteristics (e.g., number of teachers, length of internship, requirements and/or supports for classroom transfer, number of years teachers are allowed to participate, type and amount of follow-up, mechanisms for supporting teacher collaboration and collegiality) and types of effects (e.g., degree and type of change in classroom practice, sustained improvements in professional self-esteem or satisfaction). Project directors throughout the SWEP network experiment with various project requirements, activities, and mechanisms and could greatly benefit from some feedback on which project characteristics seem to best support which types of outcomes. This type of information cannot be easily obtained in one local evaluation. The fourth benefit is the potential impact on policy. Federal funding agencies (such as the Department of Energy and the National Science Foundation) must make decisions about which types of projects to fund. The recent Government Accounting Department report on Department of Energy educational programs is a case in point (GAO, 1994). Citing the lack of "hard"15 evaluative evidence regarding teacher enhancement projects, the report all but recommended withdrawing funds from support of those types of projects. Regional or national organizations of business leaders, partnership programs, and the like also make recommendations to their membership regarding the types of educational activities to support. Potential Problems and Pitfalls It appears that there is enough consistency in goals and objectives (at a specific enough level to work with) to proceed with discussions regarding a collaborative evaluation plan. However, there is certainly the potential problem of agreement on the specifics of what should be assessed and how. We suspect the "what" would be easier to resolve than the "how." As long as the consortium recognizes that everything cannot be evaluated at once, and that local program priorities may not be fully reflected in a multi-site plan, we would anticipate reasonable agreement among participating projects on a subset of goals and objectives to be selected. Decisions regarding how objectives and project processes are assessed may prove more troublesome. One problem is satisfactorily establishing the validity of any specific measurement instruments used. There are the construct validity issues that would accompany instruments designed to measure teacher attitudes or beliefs, for example. 15The criteria used to evaluate evaluation quality was decidedly quantitative. Evaluation methods were considered "strong" if they included supporting data and (when appropriate) included statistical tests with a n>30 and a significance level of .05.

32
And, a given instrument is valid only in a given context, for a particular, well-defined purpose. Projects may not feel that a given instrument is a "valid" indicator of their important objectives, or of the experiences teachers have had the opportunity (and the guidance) to engage in. Another problem is establishing consensus on what counts as satisfactory evidence. And this problem, unfortunately, has its roots in the "qualitative-quantitative" debate, or the "paradigm wars" as it is sometimes called. Datta (1994) and others (e.g., House, 1994; Yin, 1994) have argued persuasively for an end to the debate over whether qualitative or quantitative procedures are "better." Qualitative and quantitative methods serve different purposes, address questions differently, and provide different types of answers; the selection of methods depends on the context, the "match" between questions and methods, and--to a large extent--the preferences of the evaluator hired to conduct the evaluation. Most of us "in the field" have become comfortable with using different methods for different purposes, although we don't always "mix methods" well. As noted in some of the preceding quotes from project directors, however, sponsors of SWEPs (business managers, scientists, federal agencies) do have a tendency to distinguish between "hard" and "soft" data, with the "softer" data presumably that of case studies, interviews, and descriptions of project activities. Datta (1994) points out that federal agencies have accepted case study data for a number of years, although the preference for a particular paradigm might fluctuate over time and across agencies. She cites, as one example, the preference for randomized and quasi-experimental designs at the US. Department of Education during the 1970's, while the National Science Foundation education offices emphasized case studies during the same period. She also estimates that approximately one-third of the non-financial audits conducted by the US. General Accounting Office (GAO) involve some type of case study. But, she goes on to explain:
The price for acceptability within GAO for case studies is the same as it is for any method: an emphasis on study quality, including documentation of the basis for all statements and findings in a report that can be checked independently through a quality-assurance process called 'indexing/referencing'. Subjectivity, in the sense of using as data the impressions of the evaluatee and evaluator, does not in itself create problems for the agency; bias does. 'Case studies, like any other method GAO uses, have to meet two criteria of impartiality: accuracy and lack of bias in the sense that the evaluator's personal, preconceived opinions about the situation do not distort reporting and that the evaluator is scrupulously even-handed in examining all sides of a situation' (Datta, 1990, p. 63, cited in Datta, 1994, p. 56).

33
In a similar vein, Yin (1994) cites four characteristics of "quality" that should be of utmost importance, regardless of the type of data collection methods used: 1) thorough coverage and investigation of all evidence; b) constant awareness and testing of rival hypotheses; c) results have significant (substantive) implications beyond the immediate work; and d) demonstrated depth of expertise about the subject at hand. From a slightly different perspective, Joseph Wholey (see Shadish, Cook, and Leviton, (1991) for a summary of Wholey's ideas and methods) has stressed the importance of making practical decisions about what will count as evidence in a given situation. He points out that, in practice, decisions must be made about the allocation of resources and not all project objectives can be subjected to intensive data collection. In a given situation, "rough" indicators may be perfectly appropriate for some objectives, while other objectives (because of their importance, measurability, or other issues) may merit more intensive study. Wholey advocates involvement of the ultimate "decision-makers" in making choices about the types of evidence and the resource allocation that will be used in a given evaluation context. All of this is to say that the emphasis must be on the quality of the design, implementation, and interpretation of the evaluation study--and not on deciding a priori whether qualitative or quantitative procedures should dominate. The largest, and potentially more troublesome "pitfall", in our opinion, is related to what Robert Stake has termed the "quieting of reform" (Stake, 1986). Stake has noted that in many educational and social service contexts, the potential value of the reform is squelched (or at least "quieted") because the outcomes are not easily measured or are not susceptible to quantitative indices and causal conclusions. Program operations, bent to focus most on the "bottom line" indicators to be used in a formal evaluation, may suffer. The emphasis on "scientific knowledge", to the exclusion of the "common knowledge" or insights into the complexity of the program held by its practitioners, may not in the end serve the program or its constituents well. In his keynote speech at the first annual meeting of the UK Evaluation Society (1995), Stake also discusses the "criterion problem". i.e., the difficulty of identifying measures of good teaching, of quality education, or of successful student learning. Citing the pressure to demonstrate immediate change in student performance as a result of a classroom innovation, he notes:
"The usual finding is that the innovation has not improved student performance, and that is one reason why reform is so difficult. Better teaching for a few months changes the quality of education a very small amount. Even better

34
learning conditions, better fellow students, better support from parents, all of these improve knowledge and academic skills only gradually. . . .We can make our classrooms better but the progress of that innovation will seldom show up on our criterion tests. . . .Single-component changes in education seldom change the quality of education. When movement occurs, the pace is evolutionary, not revolutionary. So--faced with the difficulty of providing a proper criterion and faced with the intransigence of educational systems--we evaluators should be reluctant to share the enthusiasm of innovation advocates. We should be reluctant to assure we will measure the good that will come of it. (Stake, 1996, p. 101-102).
Stake concluded his remarks with a call for greater emphasis on establishing the validity of evaluation studies and on effectively describing the activities of good teaching that we do find. There are, of course, more mundane (but critical) issues that must be considered in a collaborative effort, such as funding for the evaluation, to whom (and through what competitive mechanism) to award the evaluation contract, and how to proceed with planning and designing the evaluation. In the following section, we offer some strategies and approaches that might be considered by a panel charged with following through on the idea of collaborative evaluation.
SOME METHODOLOGICAL AND SUBSTANTIVE ISSUES TO CONSIDER
Many pages have been spent in this paper outlining the results of the evaluation survey and making a case (we hope) for the viability of a coordinated, collaborative effort to evaluate the SWEP program model. This was, we believe, a necessary first step and the type of information a task-force (or a potential evaluator) would need to proceed with the next steps of planning such a coordinated effort. There is a second paper that needs to be written, to examine more fully some of the possibilities and strategies that could be used to guide the evaluation design; perhaps this second paper will emerge from the 1996 national conference of SWEPs, or perhaps it is best written by the respondents to a request for evaluation proposals. Nevertheless, we offer some notes and comments on issues that we feel should be considered more fully in the "next phase"--whatever form that may take. Evaluation Approaches There is no one right strategy for conducting an evaluation. Over the past 30 years or so, evaluation theorists and researchers have explicated a variety of "approaches" to evaluation (for example, see summaries in Patton, 1982; Shadish, Cook & Leviton, 1991; see also McLaughlin & Phillips, 1991). The "orientations" of the various

35
approaches (e.g., objectives-oriented, management-oriented, consumer-oriented, expertise-oriented, adversary-oriented, naturalistic and participant-oriented, to use Worthen and Sanders' (1987) classifications) sometimes imply a preference for relatively more emphasis on qualitative or quantitative procedures, but theoretically the approach does not dictate the type of data to be collected. Rather, selection of an approach16 has implications for the types of evaluation questions posed, the uses of the evaluation results, and the relationships between the evaluator and the project staff. Often, three broad labels--goals-oriented, decision-oriented, and responsive--are sufficient to distinguish among approaches (Madaus, Haney & Kreitzer, 1992). In goals- or decision-oriented approaches, evaluation data are collected according to a pre-established framework of variables to be assessed. Projects may be evaluated according to the extent to which they have attained goals (for implementation and/or for outcomes), using pre-established criteria for "success". Or the framework may be derived from the specific types of information project management needs to make specific types of decisions regarding the project at a particular point in time (e.g., information about inputs and costs, context and process, intended as well as unintended outcomes). Responsive approaches focus more on understanding and describing the complexities of an educational activity, on "what is happening" rather than on "what should be happening", and on representing the needs and perspectives of the participants and various stakeholders. Pre ordinate approaches tend to employ more quantitative measures and statistical or cost-benefit analyses; responsive approaches tend to rely more on naturalistic, ethnographic, and qualitative methods for data collection and analyses. Currently, SWEPs tend to be more "objectives-oriented" or pre-ordinate in their approaches to implementation evaluations (such as the NCISE template) and outcome evaluations (e.g., Dubner, 1994; Gottfried et al, 1992), with reliance on a mix of quantitative (surveys) and qualitative (interviews, focus groups, site visits) data collection strategies. There are examples of somewhat more "responsive" approaches, in descriptions of teachers' summer experiences or in journalistic accounts of the ways teachers apply their experiences to classroom practice or professional growth (e.g., the IISME "Success Stories"). In a multi-site evaluation, it is likely that a goals-oriented approach would dominate-- appropriately, perhaps, since there is a clear delineation of (some) objectives and an strong interest (from project management and decision-makers) on assessing the 16 Practicing evaluators rarely use these approaches as models to be followed "to the letter" in a given evaluation, but rather pick and choose elements from various approaches to fit the evaluation problem and context at hand.

36
extent to which goals have been attained. Self-report surveys and direct measures of teacher knowledge or classroom practice or student performance may be combined with project descriptions, interviews, and vignettes of illustrative practice. Pre and post data may be collected, but we see more of an emphasis on "progress toward goals" than on the use of comparison groups. Responsive approaches should be given some thought, however. It appears that relatively little emphasis has been placed on giving voice to, or understanding the perspectives of, the various audiences that have a stake in the projects. The most obvious example is the school community. Principals, department chairs, district administrators and staff developers, school board members, other teachers in the school, parents, students--all have a "stake", to some degree, in the projects. How does "what the teacher brings back" fit into the broader needs of the school community? The perspectives of the teacher fellows themselves should perhaps be examined in a more responsive way: what do the teachers generate as the important benefits of participation? Which of their professional needs are being met, and which aren't? How does their SWEP participation fit in with other professional experiences, responsibilities, and demands? From the business and research communities, we might search for better understanding of how this program contributes to their goals for supporting education, and/or the criteria they use to determine which types of programs to support. We suspect that the answers to some of these questions lie in the store of "common knowledge" project directors possess. But we also suspect that a systematic attempt to understand the perspectives of the various stakeholders may cast new light on program goals and priorities, on areas of program implementation and outcomes that need to be defined and explored further, and on the implications of the program for meaningful educational reform. Methodological Models In a goal attainment approach, a multi-site evaluation plan would identify a core set of objectives that can be assessed across projects, to determine the degree and the pervasiveness of outcomes. To the extent that a core set of evaluation instruments (whether these are surveys, interviews, or other types of indicators) can be used for certain objectives, the data from these instruments can be aggregated across sites and thereby increase the sample size for the analyses. Local project characteristics can be documented and some of these used in analyses of the relationship between implementation variables and outcome variables. For some objectives, standard instruments may not be feasible or desirable. It may be possible, however, to adapt an approach akin to meta-analytic techniques, to

37
combine data across projects. In meta-analysis (Hedges and Olkin, 1985), techniques can be used to combine data on similar constructs, even when the specific methods of measuring the construct vary. These techniques are also useful in identifying factors (like project characteristics, or types of measurement instruments used) that might account for differences in results across project sites, as well as for calculating effect sizes to summarize the relationships among variables of interest. This meta-analytic mindset may be particularly useful for collecting student data. While there may well be standard approaches that are valid across sites and across teachers within sites for assessing certain student outcomes (attitudes toward math/science/technology, for example), more valid measures of what students are gaining are likely to be much more teacher specific. It is an integral part of the SWEP model, we contend, that teachers use the information and insights they have gained in the summer in ways that they deem most appropriate for their given classroom situation. In other words, the teachers set the instructional goals that they have for themselves, as a result of the summer experience--and these goals will (and should) vary across teachers. It may be reasonable to ask teachers to generate evidence of student performance themselves, as part of their ongoing classroom instruction and assessment. If the construct can be identified in these assessments, meta-analytic techniques may prove useful in combining different types of evidence regarding similar achievement or skills variables. This approach may be particularly appropriate in light of recent advances in alternative forms of assessment (which are by definition "non-standard" and which are, by design, better indicators of problem-solving skills and other "higher-order" cognitive processes than more traditional forms of testing (e.g., Harmon, 1995)). A related evaluation methodology model is "cluster evaluation." As defined by Jenness and Barley (1995), cluster evaluation is
an evaluation methodology17 that engages a group of projects/programs with common or similar purposes in common evaluation efforts to determine the impact of the set of projects. The evaluation provides a complex, rich data set derived to a large extent from the involvement of stakeholders in the formation of the evaluation itself. The processes of the cluster also enable and prepare project directors to improve their own evaluation skills, thereby allowing them to become better consumers of evaluation data. (p. 57).
17The authors report that this methodology was initiated by the W.K. Kellogg Foundation in the late 1980's, and that the Foundation has continued to support evaluation efforts employing this methodology.

38
The authors define nine major elements in this evaluation methodology: 1) organizing the cluster; 2) cluster evaluation team selection; 3) setting clear expectations; 4) negotiated common cluster outcomes; 5) collaborative data collection; 6) regular networking conferences; 7) technical assistance to individual projects; 8) data analysis and interpretation; and 9) cooperative dissemination of results (p. 60). They include examples of evaluations of science education reform efforts to illustrate these elements in practice. The cluster evaluation methodology does not dictate particular evaluation designs or approaches, but it does provide an organizational structure for conducting collaborative evaluations. The SWEP consortium already has some of the required elements of this methodology: the existing network forms a basis for organizing a "cluster," and there is already a model of "regular networking conferences" as well as stated interests in a collaborative evaluation effort. And certainly, the survey results reported in this paper represent a start on "negotiating common cluster outcomes". Measuring Program Variables Techniques for documenting local project characteristics and implementation have been developed by individual projects and by external agencies (such as the template designed by NCISE). The challenge in a muli-site evaluation would be to select a subset of important variables in this category to document, and to design documentation procedures that are not overly burdensome to project staff. Different projects have experimented with various methods of documenting and assessing teacher effects. These methods are primarily self-report, but there are examples of attempts to use more "direct" assessments of changes in teachers' knowledge or scientific process skills (Gottfried, et al, 1992), philosophical views , or self-esteem18. While teachers' self-report data often indicate that teachers believe they have changed, more direct measures have failed to detect these changes (Orner, in progress). The reason may be that the measures are not assessing the right things; it may also be that teacher fellows rate highly on these measures at the outset, creating "ceiling effects" in the instruments; or it may be that the relatively short summer experience is not enough to yield meaningful and measurable change (as the 1994 GAO report contends). One promising approach to studying teacher effects of SWEP participation is derived from recent research on professional development models (Little, 1993; Little
18 References to these types of data collection activities were made by some respondents to the survey reported here (e.g., Nancy Roberts of Creating Lasting Links and Joanna Fox of GIFT).

39
and McLaughlin, 1993; McLaughlin et al, 1992). These research efforts have identified components of quality professional development opportunities and have emphasized the importance of collaboration, collegiality, and community among teachers. Claire Orner (in progress) is developing a plan for studying SWEPs in light of a model of Professional Learning Communities (PLC). These research-based and theoretical frameworks may be useful in guiding new conceptualizations of teacher effects in SWEPs and of methods for assessing these effects. [This is one area, by the way, that comparative designs may be feasible and appropriate]. Mechanisms for assessing changes in classroom practice should also be based on some defensible framework. The recent, well-publicized efforts in developing "standards" for math and science curriculum and instruction (NCTM, NSTA, Project 2061, New Standards Project, etc.) provide some sources for developing such a framework. There are two issues that we believe should be taken into account in this area, however. The first is the degree to which projects specify their expectations with respect to classroom practice. If specific expectations are not conveyed, or if the project does not have mechanisms for supporting teachers in meeting these expectations, it may not be reasonable to define a specific set of classroom practices to assess. Second, SWEP teachers may already be practicing many of the "desired" techniques and strategies in their classrooms; modifications may be subtle and not obvious enough to be detected by observation checklists or classroom learning environment surveys. In assessing student outcomes, it may be possible to design (or select existing) surveys to assess student attitudes towards or interests in math, science, and technology. At least one project has collected indicators of "how students vote with their feet" (see quote on page 21). But the survey results reported here indicate a more widespread interest in documenting students' problem-solving, observational, and analytic skills. Frankly, we see no hope for developing "standardized" measures of these skills that would be appropriate across the subject areas, grade levels, and school/classroom/community contexts teacher fellows represent. The only approach we can think of would have to involve the teachers in designing, implementing, and scoring the student assessments. As we discussed earlier, there may be promise in using assessment results generated by the teachers as part of their classroom based assessment practice. While this approach is fraught with difficulty and is likely to be resource-intensive, it may be worth some preliminary pilot-testing to see if procedures could be developed.
NEXT STEPS

40
If there is continued interest in a collaborative evaluation of the SWEP model, the upcoming national conference seems an ideal time to plan next steps. It would be very useful for the consortium to discuss the findings from this survey--to determine if there is consensus among the group on important objectives and approaches, and to confirm the applicability of these findings to those projects that did not respond to the survey. A task force could perhaps be convened to further refine the intents, purposes, and objectives of a multi-site evaluation, to solicit participation from specific projects, and to explore possible sources of funding. The evaluation should be conducted by an outside evaluator, we believe--but one who would work effectively and collaboratively with the task force (or other "steering committee") throughout.

41
REFERENCES
Datta, L. (1990). Case study evaluations. Transfer Paper 10.1.9. Washington, DC:
General Accounting Office. Datta, L. (1994). Paradigm wars: A basis for peaceful coexistence and beyond. New
Directions for Program Evaluation,61, pp. 53-70. Dubner, J. (1994). Evaluation of the Columbia University Summer Research Program
for Secondary Science Teachers (New York, NY). Presented at the National Conference for Scientific Work Experience Programs, Berkeley, CA (October).
Gottfried, S., Brown, C., Markovitz, P.& Changar, J. (1992). Scientific work experience
programs for teachers: A focus on research-related internships. Association for the Education of Teachers in Science Yearbook.
Harmon, M. (1995). The changing role of assessment in evaluating science education
reform. In R. O'Sullivan (Ed), Emerging roles of evaluation in science education reform. New Directions for Program Evaluation,65, pp.31-52.
Hedges, L. & Olkin, I. (1985). Statistical methods for meta-analysis. Orlando, FL:
Academic Press. House, E. (1994). Integrating the quantitative and qualitative. New Directions for
Program Evaluation,61, pp. 13-22. Jenness, M. & Barley, Z. (1995). Using cluster evaluation in the context of science
education. In R. O'Sullivan (Ed), Emerging roles of evaluation in science education reform. New Directions for Program Evaluation,65, pp.53-70.
Joint Committee on Standards for Educational Evaluation (1994). The program evaluation standards, 2nd edition: How to assess evaluations of educational programs. Thousand Oaks, CA: Sage Publications. Little, J.W. (1993). Teacher professional development in a climate of educational
reform. Educational Evaluation and Policy Analyses,15(2), pp. 129-151. Little, J.W., & McLaughlin, M.W. (1993). Introduction: Perspectives on cultures and
contexts of teaching. In J.W. Little & M.W. McLaughlin (Eds.), Teachers’ work: Individuals, colleagues, and contexts (pp. 1-8). New York: Teachers College Press.

42
Madaus, G., Haney, W. & Kreitzer, A. (1992). Testing and evaluation: Learning from the projects we fund. New York: Council for Aid to Education.
McLaughlin, M.W. (1991). Enabling professional development: What have we learned?
In A. Lieberman & L. Miller (Eds.), Staff development for education in the ‘90s: New demands, new realities, new perspectives (2nd ed.; pp. 61-82). New York: Teachers College Press.
McLaughlin, Milbrey and Phillips, D.C. (Eds) (1991). Evaluation and education: At
quarter century. Ninetieth yearbook of the National Society for the Study of Education, Part II. Chicago: NSSE.
National Center for Improving Science Education (1993). Template for teacher research
participation programs. Washington, DC: The Network, Inc. National Conference of Scientific Work Experience Programs (1995). "Sharing Our
Successes II": Proceedings from the 1994 National Conference. Santa Clara, CA: Industry Initiatives for Science and Math Education (IISME).
Orner, C. (in progress). "Professional Learning Community (PLC) in the Context of the
SWEPT Network." University of Washington. Patton, M. (1982). Practical evaluation. Newbury Park, CA: Sage Publications. Shadish, W., Cook. T., and Leviton, L. (1991). Foundations of program evaluation:
Theories of practice. Newbury Park, CA: Sage Publications. Stake, R. (1986). Quieting reform. Urbana, IL: University of Illinois Press. Stake, R. (1996). For all program evaluations, there's a criterion problem. Invited
Address at the first Annual Conference of the UK Evaluation Society, London, September 1995. Reprinted in Evaluation, 2(1), pp.99-103.
Stevens, F., Lawrenz, F., Sharp, L. (no date). User-friendly handbook for project
evaluation: Science, Mathematics, Engineering, and Technology Education. The National Science Foundation: Directorate for Education and Human Resources; Division of Research, Evaluation, and Dissemination.
Worthen, B. & Sanders, J. (1987). Educational evaluation: Alternative approaches and
practical guidelines. New York: Longman. U.S. General Accounting Office (1994). Department of Energy's precollege program
managed ineffectively: Report to the Chairman, Committee on Governmental Affairs, U.S. Senate. GAO: HEHS-94-208.

43
Yin, R. (1994). Evaluation: A singular craft. New Directions for Program Evaluation,61, pp. 71-83.

44
Survey on the Evaluation of SWEPs for program managers
SUMMARY OF RESULTS
1. Do you do any formal evaluation? YES NO Developing 27 2 3 2. Circle the value of those instruments or methods you have used: 1 = most valuable 2 = valuable 3 = least valuable n = never used
EVALUATION INSTRUMENT Most Valuab
Valuab
Least Valuab
NeverUsed
Mean Rating
A. Teacher survey at entry of the program 7 15 3 8 2.16 B. Teacher survey in the middle of the program 3 8 0 10 2.27 C. Teacher survey at end of the program 20 10 0 3 2.67 D. Teacher survey follow-up in spring semester 12 10 1 10 2.48 E. Teacher survey periodically for special topics (e.g. reten 4 3 1 22 2.38 F. Mentor surveys at end of summer 15 9 0 7 2.62 G. Face to face interviews with teachers 17 9 3 3 2.48 H. Telephone interviews with teachers 6 6 4 15 2.12 I. Informal interviews with teachers, mentors, company p 14 16 2 0 2.38 J. Student interviews 1 3 1 27 2.00 K. Data collection on student performance 2 2 1 28 2.20 L. Action Plans or technical reports of teachers 14 16 0 4 2.47 M. Implementation reports of teachers 12 9 2 9 2.43 N. Teacher evaluations of program meetings 13 12 1 7 2.46 O. A template designed to profile programs 3 12 2 16 2.06 P. Site visits to internship by staff 17 7 1 9 2.64 Q. Student surveys 2 2 3 26 1.86 R. Classroom visitations 8 6 1 18 2.47 S. Talks with principal, Dept. chair, school administration 5 7 6 15 1.94
Describe any other methods or instruments you have used.
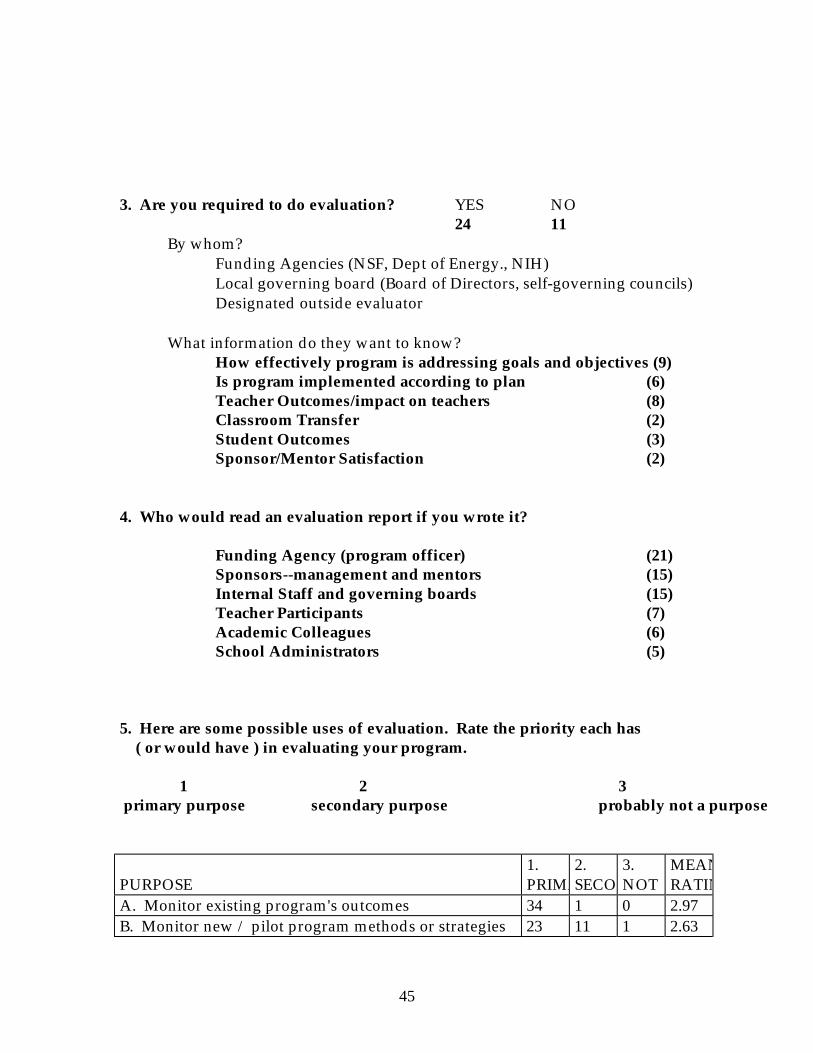
45
3. Are you required to do evaluation? YES NO
24 11 By whom? Funding Agencies (NSF, Dept of Energy., NIH) Local governing board (Board of Directors, self-governing councils) Designated outside evaluator What information do they want to know? How effectively program is addressing goals and objectives (9) Is program implemented according to plan (6) Teacher Outcomes/impact on teachers (8) Classroom Transfer (2) Student Outcomes (3) Sponsor/Mentor Satisfaction (2)
4. Who would read an evaluation report if you wrote it? Funding Agency (program officer) (21) Sponsors--management and mentors (15) Internal Staff and governing boards (15) Teacher Participants (7) Academic Colleagues (6) School Administrators (5) 5. Here are some possible uses of evaluation. Rate the priority each has ( or would have ) in evaluating your program.
1 2 3 primary purpose secondary purpose probably not a purpose
PURPOSE
1. PRIMA
2. SECO
3. NOT
MEANRATIN
A. Monitor existing program's outcomes 34 1 0 2.97 B. Monitor new / pilot program methods or strategies 23 11 1 2.63

46
C. Adjust immediate program e.g. presentations & meeti 22 9 3 2.56 D. Use as justification for funding 24 9 3 2.58 E. Use to explain why your SWEP program should be co 21 9 2 2.59 F. Use to compare your SWEP with other programs 4 16 14 1.71 G. Provide accountability to others 18 13 4 2.40 Describe any other uses you might have for evaluations. Recruting (sponsors, mentors, teachers) (5) Information to administrators and teachers (5) 6. How do you currently use the data you collect? For questions 7 - 12, rate each item on the following topics using the indicated scale. A. Rate the level of importance / priority of the following intended outcomes for your specific SWEP. 5 = Highest priority: critical outcome of our program; program cannot be considered successful if this does not occur for most teachers 3 = Moderate priority: desired objective of our program; would hope this occurs for many teachers 1 = Low priority for our specific program: would be "nice" if this occured for some teachers. B. Have you systematically collected data to evaluate this area? Y= Yes I= Informal or anecdotal N= No 7. Institutional / Corporate Support (Please circle one number for importance AND one letter for having collected data.) CAT ITEM Mean SD Yes Inf/A No IS A. Mentors feel that the program is worthwhile for teachers. 4.40 0.77 21 10 1 IS B.. Mentors feel that the program is worthwhile for themselv4.11 0.71 20 11 0 IS C. Mentors altered perception of schools and school needs. 3.63 1.06 13 12 5 IS D. Mentors gain knowledge of teacher duties/ responsibiliti 3.66 0.94 13 13 4 IS E. More institutional people are involved with education com
and schools 2.86 1.14 4 13 12
IS F. Institutions will refine networking skills regarding educat3.00 1.32 4 10 16 IS G. Program board will be actively involved with education. 2.68 1.22 2 6 18 IS H. Teachers successfully complete the task assigned to them. 4.17 1.06 24 2 3

47
CATEGORY TOTALS 3.58 1.19 101 77 59
8. Program Implementation CAT ITEM Mean SD Yes Inf/A No Prog A. Screening process places teachers in best possible position
4.43 0.85 13 9 9
Prog B. Teachers adjusted well to the demands of internship.
4.50 0.56 17 10 2
Prog C. Increased participation of teachers of underrepresented g
4.00 1.00 21 3 7
Prog D. Orientation and other program meetings will enhance int
4.30 0.78 24 2 5
Prog E. Teachers are exposed to a variety of scientific & technical
4.19 1.01 20 6 5
Prog F. Teachers receive advice and support for sharing experien
4.22 0.93 17 8 6
Prog G. Teachers receive support for extending experience to clas
4.66 0.54 25 5 1
Prog H. Mechanisms / academies are developed to continue dialothe internship.
3.64 1.25 14 8 9
Prog I. Teachers will consider internship as a high level professiondevelopment program.
4.57 0.90 22 6 4
CATEGORY TOTALS 4.28 0.93 173/9
19.2 57/9 6.3
48/5.3
9. Teacher Effects: As a result of a SWEP internship, teachers will CAT ITEM Mean SD Yes Inf/A No Teach A. gain first hand knowledge of industry/research culture a 4.81 0.47 21 8 2 Teach B. be more knowledgeable of manufacturing or research pro4.32 0.84 19 9 4 Teach C. increase awareness of specific subject to work application4.19 0.95 16 8 6 Teach D. be more knowledgeable in their subject area. 4.28 0.97 17 5 8 Teach E. know a larger number of post secondary opportunities fo4.06 0.83 12 10 8 Teach F. be more active with email and on the Internet. 3.41 1.17 12 7 12 Teach G. be more competent in the use of technology. 4.00 0.79 16 9 7

48
Teach H. increase the use of supplemental material and outside re 3.85 0.83 12 11 8 Teach I. develop activities to use in their classroom. 4.30 1.13 24 4 2 Teach J. be more self confident in work-world skills. 4.19 0.98 17 9 5 Teach K. demonstrate renewed enthusiasm for teaching. 4.59 0.86 16 10 4 Teach L. become credible model to students of excitement with m 4.61 0.69 12 12 6 Teach M. have higher professional self esteem. 4.43 0.98 14 10 6 Teach N. be revitalized after the summer. 4.37 0.84 13 11 5 Teach O. have new perspectives on education. 4.31 1.01 17 5 8 Teach P. share experience with school personnel or community gr 4.19 0.86 16 8 7 Teach Q assume new leadership roles in school or district. 3.77 1.26 13 9 8 Teach R. conduct in-service courses related to internship. 3.28 1.28 11 10 10 Teach S. be retained in the teaching force. 3.69 1.45 16 4 10 Teach T. continue with even more professional development. 3.31 1.08 7 13 11 Teach U. become involved in school reform outside their own clas 3.19 1.37 9 8 14 Teach CATEGORY TOTALS 4.05 1.09 310/2
14.76 180/28.57
1517.19
10. Classroom Effects: As a result of a SWEP internship, teachers will CAT ITEM Mean SD Yes Inf/A No Class A. invite mentors and speakers to schools. 3.63 1.11 12 12 8 Class B. take students on field trip to internship site. 3.46 1.07 12 12 8 Class C. take students on more field trips to industry and lab sites3.11 1.18 7 13 11 Class D. receive materials or equipment from lab or industry. 3.26 1.11 14 11 7 Class E. provide activities that strengthen school-industry partner3.47 1.24 10 12 10 Class F. increase emphasis on work habits such as punctuality, de
meeting deadlines, & professionalism. 3.36 1.22 8 11 13
Class G. revise or add new content to lessons & labs. 4.26 0.86 21 6 5 Class H. include lessons on science careers & job requirements. 3.54 1.38 12 8 13 Class I. integrate math, science and technology. 4.12 1.07 16 10 7 Class J. provide more "business/real world" applications. 4.12 1.23 17 4 11 Class K. value and encourage better communication skills. 4.06 1.15 13 9 10 Class L. use applications & examples from summer experience. 4.68 0.54 20 5 3 Class M. cover fewer topics but in more depth. 3.09 1.33 6 8 17 Class N. require more oral reports & presentations. 3.09 1.28 9 9 13 Class O. assign more formal written reports. 2.71 1.12 8 8 16 Class P. assign long term joint projects. 2.94 1.28 10 11 13

49
Class Q. increase use of computers & technology in their classroo 3.80 0.96 13 10 10 Class R. promote student investigation & inquiry. 4.37 0.77 17 9 7 Class S. use more teamwork and cooperative learning with stude 4.49 0.82 20 6 6 Class T. design & implement more hands-on lessons. 4.38 0.78 19 8 6 Class U. act more as a facilitator than a lecturer. 4.09 1.09 14 12 7 Class CATEGORY TOTALS 3.72 1.21 278 194 201 11. Student Outcomes: As a result of having a teacher with a SWEP internship, students will CAT ITEM Mean SD Yes Inf/A No Stud A. increase respect for teachers and teachers' abilities. 3.83 1.04 2 7 22 Stud B. increase knowledge of careers and requirements. 4,14 0.91 3 9 19 Stud C. have a greater appreciation of role of m/s/t 4.08 0.91 4 7 21 Stud D. improve skills in problem solving. 4.39 0.87 3 9 20 Stud E. increase computer & technical literacy. 4.00 0.86 3 8 21 Stud F. increase involvement in extra curricular math/science pr 3.19 1.19 3 8 22 Stud G. enroll in m/s classes beyond required number & level of 3.56 1.32 3 7 23 Stud H. engage more in cooperative/ collaborative learning. 4.00 1.17 3 10 19 Stud I. show increased enthusiasm and appreciation for science/4.22 0.99 5 7 20 Stud J. consider more a career in math/science teaching 3.92 1.02 4 7 21 Stud K. enhance their observational & analytical skills. 4.28 0.81 3 11 18 Stud L. increase knowledge of world of work; work cultures 3.91 1.17 3 7 21 Stud CATEGORY TOTALS 3.96 1.07 39 97 24712. School / Community CAT ITEM Mean SD Yes Inf/A No CommA. More students graduate and enter math/science fields.
3.68 1.32 0 1 30
CommB. Administration will be more involved in school- commun partnerships.
3.48 1.18 3 3 25
CommC. A "critical mass" of program teachers will influence the c school.
4.03 0.95 3 12 17
CommD. The public will become more involved with issues of edu
3.20 1.45 0 5 27
CommE. Students will be better prepared to enter the science/ tech workforce.
4.20 1.11 2 6 24
CommCATEGORY TOTALS 3.72 1.25 8 27 123

50
13. What are the big issues in evaluation for you? Attach an addtional sheet with comments if necessary.
What are your needs regarding evaluation? Which areas should be given priority? Describe your concerns and problems with focusing and implementing evaluations. Is there anything else you think should have been covered in this survey on the evaluation of SWEPs?
Besides reporting the responses on this survey to all SWEPs, what would you like to be done with this information?

51
Appendix 2
List of Survey Respondents

52
Royace Aikin Battelle, Richlent, Washington TRAC Allen Dallas , Texas STARS Don Beck Cocoa, Florida SIFT Florine Belanger San DIego, Calif. Industry Fellows Gert Clark Hoboken, New Jersey NJBISEC (TIP) Thomas Deans MESTEP Jay Dubner Columbia, NYC Summer Research Program Eileen Engel LBL, Berkeley, Calif. TRAC Peter Farnham Bethesda, Md. ASBMB Joanna Fox Atlanta, Georgia GIFT Richard French Middletown, Ohio Partners for Terrific Science Mary Lynn Grayeski Tucson, Ariz. Partners in Science Research Corp. Diane Hageman Hampton, Va. ATTAC 2000 Pamela Hall Medford, Oregon Comm./ Bus. Ed. Center Lou Harnisch Argonne, Illnois TRAC Lisa Joss Golden, Colorado TRAC Bonnie Kaiser Rockefeller U. , NYC Science Outreach Program
J.A. Kampmerer Rochester, NY Summer Research for HS & College Teachers Carole Kubota Seattle, Washington U. Wash Sci./Math prog Adele Kupfer CUNY, NYC STIR Terry Lashley Oak Ridge, Tenn. TRAC Nina Leonhardt Brookhaven, Uptown, NY TRAC Paul Markovits St. Louis, Missouri Tech. in Context (TIC) Marsha Matyas Rockville, Maryland Frontiers in Physiology Carol Mooney LosAlamos TRAC Pat Moore Portland, Oregon IISME Lesa Morris Boulder, Colorado Colorado Alliance for Science Claire Orner Seatte, Wash. College of Edu. ,U. of Washington Sue Rinehart Dayton, Ohio Wright Connection (GEMMA) Nancy Roberts Creating Lasting Links Karin Rosman SF Bay Area, Calif. IISME Mary Anne Sheline Allendale, Michigan Teachers in Industry

53