evaluation of percolation tank efficiency on groundwater … 5.pdf · · 2018-04-14the increasing...
TRANSCRIPT
L.Surinaidu, A. Raviraj and R. Rangarajan
292
Evaluation of Percolation Tank Efficiency on Groundwater Recharge: A Case Study for Karnampettai Percolation Pond, India
L.Surinaidu1, A. Raviraj2 and R. Rangarajan1*1CSIR-National Geophysical Research Institute (NGRI), Hyderabad- 500 007
2Water Technology Center, Tamil Nadu Agriculture University, Coimbatore - 641003*Corresponding Author: [email protected]
AbSTRACTOver abstraction of groundwater when compared to less amount of rainfall recharge throughout India is mainly due to increasing demands for irrigated agriculture causing severe groundwater depletion. Such an alarming situation is increasing unabated in spite of massive water harvesting measures that are implemented through watershed development programs (WDP). In order to improve the artificial percolation efficiency some new developmental programs are being implemented through managed aquifer recharge (MAR) (mainly percolation tanks and check dams). Keeping in view the well known Water Development Programs limitations due to the increasing number of recharging structures and huge cost involved in their construction, it has become necessary and important to evaluate and understand the MAR performance for sustainable management of groundwater resources. The present study examines the percolation efficiency of typical Karnampettai percolation tank located in Tamilnadu, South India using an integrated approach combining geophysical, hydrogeological and geotracer (radiotracer: tritium and chemical tracers: rhodamine B, bromide) investigations. The results indicated that percolation from the tank is 28 to 35 mm/day with an average percolation rate of 32 mm/day. The percolation rate is reduced progressively with a gradual decline of water level in the percolation tank. The average natural recharge (rainfed and irrigation fields) in the study area is 30 mm (8% of the rainfall). The study indicated that 65% of the total rainfall is lost due to soil moisture deficiency caused by evaporation and evapotranspiration. The study also reveals that the groundwater flow velocity near to the percolation pond is 2 m/day with effective groundwater recharge zone of 275 m.
Key words: Percolation tank, tracers, MAR, WDP, Karnampettai.
INTRODUCTION
The significant development of Indian irrigated agriculture after independence has helped to generate sufficient agriculture and horticulture output and improved food security, which supported the economic growth of the country (Tripathi and Prasad, 2009; NRAA, 2011). However, this food security has seriously hampered the sustainability of water resources (Massuel et al., 2014; Batchelor et al., 2003; Shah, 2012). Compared to river basins, coastal corridor and soft rock zones the situation is considerably precarious in the crystalline hard rock aquifer regions of India. In the hard rock areas, weathered and fractured zones play a major role in groundwater recharge and production/storage that supports the agriculture development (World Bank, 2010). In these regions groundwater is being exploited through large diameter open wells and shallow bore wells by tapping weathered zone aquifers and semi confined /fractured aquifers (Pavelic, 2012; Surinaidu et al., 2013a; CGWB, 2014).
The combined effect of overexploitation of groundwater mainly for irrigated agriculture and recurring low order of rainfall recharge has resulted in lowering and decline of water table over the years in India (CGWB, 2014).Since three decades progressively the open wells have gone dry
in early summer season itself and shallow bore wells up to 60 m depth have shown reduction in yield or drying out. Watershed development programs are being implemented through Managed Aquifer Recharge (MAR) Programmes to increase the artificial recharge by the government of India as a flagship program to boost the irrigated agriculture and there by to improve the livelihoods of the rural farming and other societal and economically back ward communities. Percolation tanks or ponds are the most common artificial recharge structures for augmenting the groundwater recharge/reserves in the western and in major part of the southern peninsular India covered by hard rocks, where the average annual rainfall is less than 700 mm and having high potential evaporation of 1500-2000 mm/year (CGWB, 2014; NRAA, 2011).
The percolation tanks generally have a storage capacity of 0.15 to 0.6 million cubic meters with command area extending to a maximum distance of 2-3 km from the tank (World Bank, 2010). The infiltration capacity of tank bed area, storativity of the weathered zone and utilization of groundwater in the command area of the tank governs the efficiency of a percolation tank. The impact of percolation tank depends on the efficiency of its percolation through its bed, its lateral movement and augmentation of the groundwater in the command area in improving the yield
J. Ind. Geophys. Union ( May 2018 )v.22, no.3, pp: 292-305

Evaluation of Percolation Tank Efficiency on Groundwater Recharge: A Case Study for Karnampettai Percolation Pond, India
293
of open/ shallow bore wells. The efficiency of percolation tank reduces with time due to settling of silt and forming a crust during the ponding period and increase in thickness of silt load over the years.
Limited published literature is available on water accounting (Muralidharan et al., 2005; Rolland et al., 2005; Sharda et al. 2006; Sukhija et al., 1997; Sayana et al., 2010; Abraham and Mohan, 2015). These studies in general have not focused on hydrodynamics (Massuel et al., 2014). On the other hand various researchers pointed the lack of knowledge and data for proper evaluation of artificial recharge structures (Dillon et al., 2009; Glendenning et al., 2012).Existing evaluations of large programmes show limited local impact on groundwater recharge (Kerr et al., 2002). However, focused studies taken up by some researchers have shown that mega structures have led to over-exploration of surface and groundwater water and degeneration of river basin dynamics; at places even irreversible damage to river basins (Sakthivadivel, 2007; Glendenning et al., 2012).
In such a scenario, the present study has been taken up to systematically evaluate the impact of percolation efficiency on groundwater recharge. In the present study, we have carried out integrated hydro-geological investigations that combine Electrical Resistivity Tomography (ERT), chemical tracer experiments, groundwater level and tank water level monitoring to evaluate the impact of Karnampettai percolation tank on groundwater recharge in Kodangipalayam village, Coimbatore district, Tamil Nadu, South India.
STUDY AREA AND HYDROGEOLOGY
The present study focused on Karnampettai percolation tank located in the Kodangipalayam village, Palladam taluk, Coimbatore district, South India (Figure 1). The area falls under semiarid region with an average annual rainfall of 650 mm (Indian Meteorological Department). This includes southwest monsoon from the period of June to September (26 %), northeast monsoon during the period of October to January (60 %) and summer showers from February to May (14 %). The tank is elongated in shape; water-spread area of the tank is around 0.9 ha with a storage capacity of 0.1 million cubic meters (Figure 1). The maximum water level in percolation tank is about 2 m height and above it water escapes through waste weir and flows through a stream in the command area. The catchment area for the tank is about 1.5 km2.
The study area is underlain by Charnockite formations of Archaean age, covered by reddish brown soils and thin alluvium. Groundwater for agriculture in the area is mainly exploited by open wells excavated up to the maximum depth of 15 m. Thick weathered zone with vertical and horizontal fractures are observed in the open well sections. The thickness of weathered zone varies from 5-15 m.
DATA COLLECTION AND METHODOLOGY
Hydrological Data
Rainfall and evaporation is monitored by installing an automated weather station (AWS), which measures rainfall, relative humidity, solar radiation, air temperature and evaporation in the study area (Figure 1). Detailed topographic survey of the percolation tank is carried out with grid intervals of 5m x 5m, to infer the volume of water being stored. It can be calculated from the standing water level. The observation bore wells in the study area are drilled up to a maximum depth of 60 m for static water level monitoring. The lithologs of these bore wells have indicated presence of a thick weathered zone and occurrence of the potential fractured zone within the depth of 40 m. The standing water level in the percolation tank is measured once in a week. The observation bore wells (O series wells) are monitored at regular interval of time (weekly and bimonthly) for static water level measurements in order to know the influence of percolation tank structure. The open wells (K series wells) are subjected to pumping for irrigation on a regular basis. All the wells are connected to common datum plane with respect to temporary benchmark. The total storage in the percolation tank is calculated by multiplying water spread area and water level height in the percolation pond. Percolation rate from the pond is calculated using evaporation rate, rainfall and pond water level decline at two time intervals (refer table 2 and figure 5a).
The undisturbed shallow zone soil samples up to the depth of 5 cm (top soil zone) are collected from the experimental sites (8 numbers) using hand auger to find out saturated permeability coefficient (K). The samples collected in rings are loaded in the laboratory permeameter, where the samples are saturated in the container of the permeameter. The ring samples are placed in the ring holder to gradually saturate them, using the adjustable level regulator. Constant head method is used for estimating saturated permeability coefficient. The detailed procedure is well explained by Todd, 1980.
Darcy ’s law is used to calculate the K-factor, when applying the constant head method to determine permeability. Darcy’s law states:V = K * I * A * tWhereas;V = volume of water flowing through the sample (cm3)K = permeability coefficient or K factor (cm/d)I = permeability rise gradient or (h/L)L = length of the soil sample (cm)A = cross section surface of the sample (cm2)t = time dimension dayThe permeability coefficient is calculated as; K= (V.L) / (A.t.h) h = water level difference inside and outside ring holder or sample cylinder (cm)

L.Surinaidu, A. Raviraj and R. Rangarajan
294
Electrical Resistivity Tomography
Multi electrode resistivity tomography (ERT) surveys have been carried out at 8 locations (E series in figure 1) to obtain subsurface lithological information of tank storage area and also in the command area of percolation tank using ABEM multi electrode resistivity imaging system. The multi-core cable is connected to an electronic switching and transmitter unit, which is connected to a laptop computer. The data acquisition is fully automatic and sequence of measurements depends on electrode array used for the study. In the present study area, Wenner electrode configuration has been used to acquire the subsurface resistivity data. The length of the profile was selected depending on vacant space availability in the area. The measured apparent resistivity is converted in to true resistivity using RES2D.INV inversion program in order to produce the 2D resistivity cross-section image. The data inversion was carried out with the least squares inversion method (Dahlin, 1996). The ERT technique is used by many researchers for aquifer mapping, to map saline water zones, for groundwater surface water interactions and other environmental impact assessment studies (Surinaidu et al., 2012, 2013b; Chandra et al., 2011; Zarroca et al., 2011).
Tracer Studies
Borehole tracer experiments in hydrogeological studies provide information on hydraulic connectivity, velocity
and direction of groundwater flow. The tracers can be used via single and multiple well methods. In the single well method, the velocity of groundwater flow is ascertained from dilution characteristics of the same test bore hole. In the multiple well methods, the time taken by the ground water to cover a certain distance is taken in to consideration and hence the distance velocity (point to point velocity) is determined (Drost et al., 1974). Injected tritium tracer studies can be used to estimate the natural recharge caused by rainfall and bore hole tracer studies is used to measure the groundwater velocity and to determine the hydraulic connectivity within the aquifer zone. Tritium injection technique is successfully employed for rainfall-recharge measurements (Munnich, 1968; Rangarajan et al., 2009, 2014; Wu et al., 2016) and borehole tracer technique (Pitrak et al., 2007; Lin et al., 2013; Wang et al., 2008) is used for groundwater velocity measurements and also to estimate the hydraulic continuity.
In the present study both single hole and multiple well tracer methods are used. In addition, groundwater electrical conductivity is also measured, making use of tracer method to see the maximum zone of influence of a percolation tank on recharge. Tritium and chemical tracer studies have been carried out in the study area for the estimation of natural recharge caused by rainfall, to measure the groundwater velocity and also to determine the hydraulic connectivity of percolation tank.
In the study area, tritium tracer was injected at 9 sites before onset of the northeast monsoon of 2005. The
Figure 1. Location of observation wells, ERT, tracer injection and automated weather (AWS) station in the study area. Note: K Series- Open wells and O Series - Bore wells, hp-hand pump, T-Tritium injection sites.

Evaluation of Percolation Tank Efficiency on Groundwater Recharge: A Case Study for Karnampettai Percolation Pond, India
295
sites selected are fallow non-agricultural land, rain fed agricultural fields and supplemental irrigated fields near the observation bore holes. The tracer has been injected at the depth of 60 cm below ground level. Vertical soil samples were collected in 20 cm section up to maximum depth of 2 m using recovery pipes in the month of January 2005 after the completion of northeast monsoon. The collected depth wise samples were analyzed in the laboratory for moisture content, tracer concentration and grain size analysis.
The recharge value for each site is calculated first by determining the center of gravity of the tritium versus depth profile and the moisture content of the displaced zone. The displacement of the tracer from the depth of injection is the distance between injection depth and center of gravity or peak of the tritium concentration in the profile. The recharge is calculated by;
Re = M x D where, Re = recharge in mmM = moisture content of the displaced zone in 1 sq.mm.D = displacement of tracer from the depth of injection
Re is the height of an imaginary water column over 1 sq.mm in the soil profile between the depth of injection and peak in tritium activity. As per the piston flow model, this amount is finally added to the groundwater as recharge. Assuming this ‘Re’ is due to rainfall ‘R’ during time ‘t’ (period between dates of injection and soil core collection).The percentage of rainfall R contributing to the recharge is given as,
Re (%) = 100 x D x M/RIn order to study the dynamic/induced movement
and direction of percolated water movement from the tank, Bromide as chemical tracer and Rhodamine-B as dye tracer have been used. Bromide in the form of potassium bromide (KBr) has been injected at 45 m depth of a bore well (O9 in Figure 1) present at a distance of about 60 m from the embankment of the percolation tank. 7000 grams of Analar Grade potassium bromide, dissolved in 40 liters of the same bore well water, is transferred to the well within a period of 3 minutes and thoroughly mixed using mechanical device. Tracer has been injected on 19th December 2004, when the tank was half filled to its capacity with 3 feet of water column. The constraints faced are that the observation wells are located at far off distance from the tank and not in ideal location for tracer experiments.
20 grams of Rhodamine-B is dissolved in 5 liters of water and injected at 60 cm depth below the tank bed level at 55 locations (50 mm cm diameter slim holes) in a grid pattern over an area of 50 m x 50 m on 22.1.2005 (Figure 1). To achieve thorough mixing of tracer, normal water is added at all the 55 locations twice for 3 days. Water samples have been collected from tank and observation bore wells at weekly/ bimonthly interval of time. The
samples are stored in double capped polythene bottles and labeled. The samples have been analyzed in the laboratory for conductivity, Rhodamine-B and bromide concentrations. Bromide concentration in the samples has been measured using titration/specific ion electrode methods. Rhodamine concentration in water samples has been analyzed using portable Fluorimeter (Skougstad et al., 1979). The groundwater/seepage velocity (V) is estimated by dividing distance between injection well and observation wells with time (d/t).
RESULTS AND DISCUSSION
Hydrological Investigations
The total annual rainfall during 2004 and 2005 are 750 mm and 811 mm, respectively. They are excess than the average annual rainfall of 650 mm. The average annual potential evaporation computed as 1634 mm is twice the amount of annual rainfall. The pattern of rainfall shows bimodal distribution with significant summer showers of greater than 20% (Figure 2a). The pattern of rainfall shows that the seasonal precipitation occurs in pulses with large gaps between the events during the southwest monsoon and small gaps during the northeast monsoon season. Rainfall during the southwest monsoon is significantly less than the northeast monsoon. Several medium intensity rainfall events (20-40 mm/day) and few high intensity events (> 40 mm/day) have occurred during study period (Figure 2a). The monthly rainfall during the study (2004-2005) period is varying from 8 mm in February, 2005 to 204 mm in October, 2004 (Figure 2b).
The observed average evaporation during the study period from the year 2004 to 2005 is 13 mm in 2004 and 32 mm in 2005, with minimum evaporation (1.63 mm/day) in July 2004 and maximum of 7.61 mm/day in April 2004 (Figure 2b). The observed relation between rainfall pattern and water level height in the tank from January 2004 to December 2005 indicates that a single day rainfall events exceeding greater than 100 mm or group of events ranging from 20-40 mm per day can only generate runoff and fill the storage structure.
Geophysical Investigations
In order to calibrate the resistivity imaging results with a known lithological control, a site near O5 observation well and a dried dug well is selected (E1 in Figure 3) with electrode spacing of 2 m following Wenner method (E1 in Figure 3). The lithology of observation well is not available at the time of survey during June 2004. However, the cross section of dried dug well part is mapped. The topsoil is less than 30 cm followed by highly weathered granites (pink) extending to a depth of 3.5 m followed by semi-weathered

L.Surinaidu, A. Raviraj and R. Rangarajan
296
formation up to the bottom well having a depth of 7 m. Since, the aim of present investigation is to know about the sub-surface formation forming the phreatic aquifer, which will be benefited from the percolation tank recharge, the adopted imaging electrode spacing of 2 m with 42 electrodes covering a profile line of 80 m length facilitated to get subsurface information of 12 m.
The resistivity image at this place has clearly indicated that the thickness of weathered zone increases towards the west away from the percolation tank. Based on the
geo-electrical nature of sub-surface at the investigated site, the subsurface can be broadly classified into two layers. The first layer with resistivity range of 40-100 Ohm.m representing the weathered zone followed by basement forming the second layer with resistivity range of 400 to more than 600 Ohm.m having a transition zone of semi-weathered zone. The depth to basement inferred from the image is about 7-8 m which is coinciding with the observation made in the dried dug well. However, the shape of the high resistive layer is having inclination
Figure 2. Daily rainfall (mm) (2a) and monthly rainfall vs. evaporation (2b) during the study period.
Figure 3. Vertical Electrical Resistivity tomographic cross sections carried out in the tank bed area.

Evaluation of Percolation Tank Efficiency on Groundwater Recharge: A Case Study for Karnampettai Percolation Pond, India
297
towards western part of the profile alignment. The image analysis indicates that the groundwater movement from the percolation tank towards this direction in phreatic zone might be restricted by the presence of basement rise. However, the movement of groundwater through fractures within the basement must be taking place, which is evidenced by water table response of the well O5 located nearby the investigated site (refer Figure 4).
Electrical resistivity tomography survey (E2) is conducted with a length of 80 m and 2 m electrode spacing at a distance of 40 m from the weir and along the length of the tank in NW-SE direction. It revealed sub-surface information to a depth of 12 m (E2a in Figure 3 and refer figure 1 for location). Based on the vertical distribution of resistivity ranges, the sub-surface under the profile line can be grouped into a three geo-electrical layered shallow sub surface structure. The top layer with a thickness of 2 m is more or less uniform in nature. It is represented by a resistivity that ranges from 20-40 Ohm-m, probably representing the conductive topsoil and highly weathered formation. However, these conductive formations are not of continuous nature and they are separated by some moderate resistive formation (resistivity around 100 Ohm-m) exhibiting probably the variation in degree of weathering and variable soil thickness with variable moisture content. The second geo-electric layer with a resistivity range 150-300 Ohm-m represents the
semi-weathered formation extending to a depth of 7m. The basement that follows the semi-weathered zone forms the third geo-electric layer having resistivity more than 300 Ohm-m.
In order to critically understand the composition and structure of sub-surface to a depth of 3 meters along the study profile line, the collected data (E2a) has been subjected to splicing analysis. The resultant resistivity cross section (E2b) of shallow zone under the ponding area to a depth of 3 m indicated the first geo-electric layer with resistivity range of 24 to 40 Ohm-m represents the soil and highly weathered part extending to the depth of 1.98 m or 2 m (E2b in Figure 3). However, the low order of resistivity in the NW part indicates that the area must be having high silted condition compared to the SE part. In the field it is observed that the NW part nearer to weir side is the deepest part of the tank having high silt accumulation.
A second profile (E3) is laid perpendicular to the direction to E2 keeping the center same with 40 m total length and 1 m electrode spacing following the Wenner configuration (E3 in Figure 4). The image obtained in the perpendicular direction also shows a similar geo-electric layered structure in the sub-surface. The first geo-electric layer with resistivity range of 20–30 Ohm-m indicates a maximum thickness of 2 m on the SW part, coinciding with the depression part seen as a stream channel inside the tank. In the central part, the weathering thickness is
Figure 4. Vertical Electrical Resistivity tomographic cross sections in the study area
L.Surinaidu, A. Raviraj and R. Rangarajan
298
moderate and exposures of highly jointed rocks are seen. This is being reflected in the image with a resistivity range of 50-90 Ohm-m. The second geo-electric layer following the first layer that extends to a depth of 4 m is of semi-weathered formation with resistivity range of 100 – 250 Ohm-m. The third geo-electric layer with resistivity more than 250 Ohm-m is the basement that extends to a depth beyond 4 m. The perpendicular directional investigation confirms that the tank is almost having a uniform and stratified formation of which the first geo-electric layer of 2 m thickness is the beneficiary zone of ponding.
The resistivity imaging (E4) is carried out in the downstream of the percolation tank and near to the hand pump well (E4 in Figure 4) clearly depicted a three geo-electric layered sequence of which the first layer extending to a depth of 5 m is of highly conductive nature towards the percolation tank direction (east) when compared to the western side. However, the image results indicate that the thickness of the first geo-electric layer is of uniform thickness with varying degree of weathering and saturation. The second geo-electric layer following the weathered zone represented by resistivity range of 170-400 Ohm-m is considered to be of semi-weathered nature extends to a depth of 10m. The last or bottommost geo-electric layer with more than 1000 Ohm-m is considered to be the basement. The order of resistivity range more than 2000 Ohm-m reaching a value of 6000 Ohm-m shows that the basement at this site is more compact. The water level monitoring at O9 observation well near to the investigated site has shown a fluctuation of 4 m (pre- & post-monsoon) within depth section between 2 m to 6 m below ground level. This indicates that the saturated condition varies within the first geo-electric layer with time. The collated inference brings out that the shallow zone is influenced by the percolation tank. This inference is supported by the water level response over various functional stages of percolation tank.
ERT6 is carried out inside the coconut garden on the extreme northern side of the study area (E6 in Figure 4). A dug well in the garden is being used for irrigating the coconut fields, once in ten days as reported by the farmer. The image obtained at this site clearly showed that the top layer is very thin and the maximum thickness is about 2 m only followed by thick semi-weathered formation extending to a depth of 10 m followed by basement. However, the resistivity range of the basement (250-500 Ohm-m) denote that the rock is not highly compact. It could probably indicate highly jointed basement having saturation in fractures/joints.
Percolation Tank Influence on Groundwater Recharge Dynamics
The observed relation between storage and standing water column in the tank shows exponential pattern (Figure 5a).
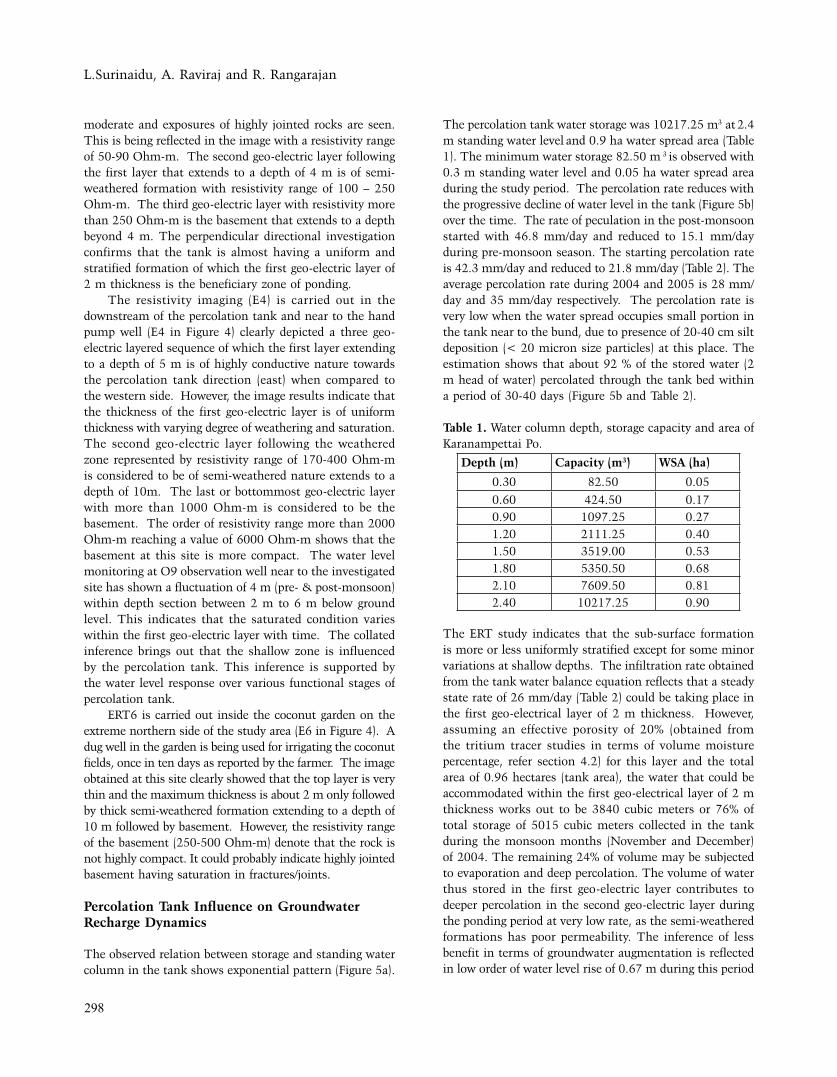
The percolation tank water storage was 10217.25 m3 at 2.4 m standing water level and 0.9 ha water spread area (Table 1). The minimum water storage 82.50 m 3 is observed with 0.3 m standing water level and 0.05 ha water spread area during the study period. The percolation rate reduces with the progressive decline of water level in the tank (Figure 5b) over the time. The rate of peculation in the post-monsoon started with 46.8 mm/day and reduced to 15.1 mm/day during pre-monsoon season. The starting percolation rate is 42.3 mm/day and reduced to 21.8 mm/day (Table 2). The average percolation rate during 2004 and 2005 is 28 mm/day and 35 mm/day respectively. The percolation rate is very low when the water spread occupies small portion in the tank near to the bund, due to presence of 20-40 cm silt deposition (< 20 micron size particles) at this place. The estimation shows that about 92 % of the stored water (2 m head of water) percolated through the tank bed within a period of 30-40 days (Figure 5b and Table 2).
Table 1. Water column depth, storage capacity and area of Karanampettai Po.
Depth (m) Capacity (m3) WSA (ha)
0.30 82.50 0.050.60 424.50 0.170.90 1097.25 0.271.20 2111.25 0.401.50 3519.00 0.531.80 5350.50 0.682.10 7609.50 0.812.40 10217.25 0.90
The ERT study indicates that the sub-surface formation is more or less uniformly stratified except for some minor variations at shallow depths. The infiltration rate obtained from the tank water balance equation reflects that a steady state rate of 26 mm/day (Table 2) could be taking place in the first geo-electrical layer of 2 m thickness. However, assuming an effective porosity of 20% (obtained from the tritium tracer studies in terms of volume moisture percentage, refer section 4.2) for this layer and the total area of 0.96 hectares (tank area), the water that could be accommodated within the first geo-electrical layer of 2 m thickness works out to be 3840 cubic meters or 76% of total storage of 5015 cubic meters collected in the tank during the monsoon months (November and December) of 2004. The remaining 24% of volume may be subjected to evaporation and deep percolation. The volume of water thus stored in the first geo-electric layer contributes to deeper percolation in the second geo-electric layer during the ponding period at very low rate, as the semi-weathered formations has poor permeability. The inference of less benefit in terms of groundwater augmentation is reflected in low order of water level rise of 0.67 m during this period

Evaluation of Percolation Tank Efficiency on Groundwater Recharge: A Case Study for Karnampettai Percolation Pond, India
299
in well O9 nearby the percolation tank in the downstream. The present analysis indicates that the development of water column height of 1.75 m in the percolation tank may not be adequate to induce more recharge to the groundwater. The maximum storage height of (weir level) 1.95 may also be inadequate to achieve a maximum benefit in augmenting the groundwater over the area.
In general improved groundwater levels (rise in water levels) under the influence of any recharge source can be observed in the downstream. But, in the study area significant water level rise is observed in the upstream wells located (northwest) at 275 m and 218 m from the tank (O3 and O4) due to induced hydraulic gradient and
preferential groundwater flow towards these wells resulted from regular pumping in nearby wells (figure 6b and refer figure 1 for location). The water table build up was significant in the observation bore wells located around the tank during 2004 northeast monsoon, low during summer and insignificant during southwest monsoon. The average water level rise observed in downstream area wells due to 2004 northeast monsoon is 8.5 m compared to 4.4 m in the upstream area wells (Table 3).
The rainfall events during the month of November 2004 caused storage of water in the percolation tank during the monitoring period. The O5 well has shown a rise in water table of 5.41 m. The dug well to a depth of 7 m being
Figure 5. Water level height versus volume relationship in the percolation pond (a) and Time versus percolation rare of water (b).
Table 2. Estimated groundwater percolation from the percolation pond during the study period.
DateStorage
(m3)(A)
Water column
(m)(B)
Water loss (mm)(C=Storage
difference between two time intervals)
Rainfall (mm)(D)
Evaporation (mm)
(F)
Percolation (mm)
(C+D-F)
Percolation (m3/day)
Percolation(mm/day)
26.11.04 5015 1.7530.11.04 3786 1.55 200 0 12.8 187.2 1150 46.82.12.04 3348 1.47 80 0 6.4 73.6 402 36.83.12.04 3192 1.44 30 0 3.2 26.8 139 26.86.12.04 2748 1.35 90 0 9.6 80.4 397 26.8
10.12.04 2215 1.23 120 0 12.8 107.2 476 26.817.12.04 1435 1.02 210 0 22.4 187.6 697 26.827.12.04 641 0.72 300 0 32 268 709 26.830.12.04 488 0.64 80 0 9.6 70.4 135 23.43.01.05 373 0.57 70 0 9.6 60.4 99 15.1
Total 4204 28 Average12.04.05 6597 1.974.05.05 1248 0.96 1001 0 70.4 930.6 4973 42.311.05.05 641 0.72 240 37.3 22.4 254.9 645 36.419.05.05 216 0.45 270 0 25.6 244.4 385 30.525.05.05 66 0.27 180 0 19.2 160.8 134 26.81.6.05 17 0.15 120 55.2 22.4 152.8 62 21.8Total 6199 35 Average

L.Surinaidu, A. Raviraj and R. Rangarajan
300
capacity level during the month of April-May, 2004 has not shown any influencing signature in the hydrograph. However, the wells in the downstream of percolation tank have shown the response due to ponding in terms of rise in groundwater level. The second cycling filling stage of the year has shown a rise in water level of the order of 7 m. The response of water level rise is from 15-10-04 onwards which is nearly 30 days earlier to the tank inflow and the rise reached the maximum on 3-12-04 within 21 days of maximum ponding. The hydrographs of the wells in the
in a dried condition throughout the observation period and borehole showing a rise in water level of the order of 5-6 m clearly indicates the movement of groundwater from recharge area through fractured zone within the basement. This is supported by a meager rise of 0.67 m in O9 well, which is just below the weir part of percolation tank. The hydrograph of O2 observation well was plotted for the calendar year of 2004 to study the influence of percolation tank towards the northern part of the area. It is surprising to note that the first cyclic filling in the tank to maximum
Figure 6. Percolation pond water level (a), upstream observation well water level (b) and downstream observation wells water level (c).
Figure 7. Groundwater contours in m amsl and arrows indicate groundwater flow direction (a), groundwater conductivity contours in micro Siemens/cm (b) in 08/12/2004.

Evaluation of Percolation Tank Efficiency on Groundwater Recharge: A Case Study for Karnampettai Percolation Pond, India
301
water recharge and subsequently the percolated water from the tank forced the groundwater flow forward causing immediate water level rise in wells.
The water table (m amsl) contour map (Figure 7a) shows groundwater flow caused by percolation of water from the tank is towards northwest, west and southwest
second cyclic filing depicts an immediate response of water table rise in wells with the impoundment of water in the tank (Figure 6a and Figure 6b).
The reason for groundwater flow dynamics noticed in the present study may be due to the aquifer zone in the ponding area is fully saturated with earlier ponding
Figure 8. Tritium moisture profiles at selected rainfed and irrigated sites.
Figure 9. Brodmide concentration in observation wells.

L.Surinaidu, A. Raviraj and R. Rangarajan
302
a distance of about 275 m from the tank in northwestern side. Whereas, in the southwestern side the influence is up to a distance of about 165 m from the tank and beyond which little influence is noticed.
Geo-Tracers and Recharge Estimation
The mean natural recharge computed from five rainfed sites in the study area is 18 mm for the rainfall of 374 mm and it is equivalent to 5 % of the rainfall (Table 4 and refer figure 1 for locations). Natural recharge estimated at 3 supplemental irrigation sites as 53 mm for the rainfall of 374 mm plus unknown quantity of irrigation input. All the profiles indicate clear single peak occurring within depths
in the downstream side of the tank. The gradient is significant along west and northwest directions compared to southwest direction (Figure 7a). The zone of influence area of percolation pond or tank can be inferred from spatial and temporal water level variations and conductivity (Muralidharan and Nair, 1998). Normally the conductivity of runoff water collected in the tank will be much lower than the natural conductivity levels of groundwater in the downstream area. When the low conductivity water in the tank travels and mixes with groundwater of the downstream area, it is expected to lower the conductivity values of water in the zone of influence. Figure 7b, shows the conductivity values of well water in the study area. The map indicated that the influence of recharge is up to
Figure 10. Rhodamine concentration in observation wells.
Table 3. Groundwater level rise in downstream and upstream during the study period.
WellsNE monsoon
(2004)Summer shower
(2005)Downstream side ( NW part)
O1 13.3 4.09O2 7.31 0.76O5 6.85 1.75O6 6.44 2.09
Average 8.5 2.2Upstream side
O3 4.18 0.18O4 4.64 0.63
Average 4.4 0.4
Evaluation of Percolation Tank Efficiency on Groundwater Recharge: A Case Study for Karnampettai Percolation Pond, India
303
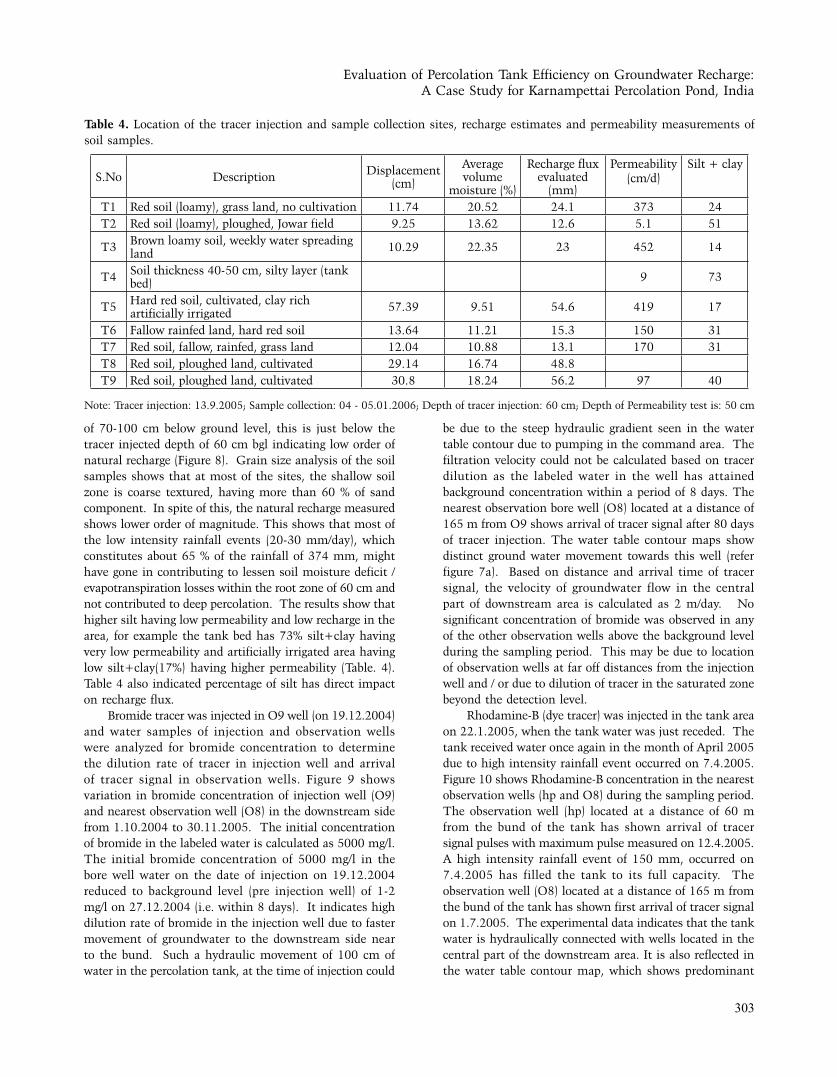
of 70-100 cm below ground level, this is just below the tracer injected depth of 60 cm bgl indicating low order of natural recharge (Figure 8). Grain size analysis of the soil samples shows that at most of the sites, the shallow soil zone is coarse textured, having more than 60 % of sand component. In spite of this, the natural recharge measured shows lower order of magnitude. This shows that most of the low intensity rainfall events (20-30 mm/day), which constitutes about 65 % of the rainfall of 374 mm, might have gone in contributing to lessen soil moisture deficit / evapotranspiration losses within the root zone of 60 cm and not contributed to deep percolation. The results show that higher silt having low permeability and low recharge in the area, for example the tank bed has 73% silt+clay having very low permeability and artificially irrigated area having low silt+clay(17%) having higher permeability (Table. 4). Table 4 also indicated percentage of silt has direct impact on recharge flux.
Bromide tracer was injected in O9 well (on 19.12.2004) and water samples of injection and observation wells were analyzed for bromide concentration to determine the dilution rate of tracer in injection well and arrival of tracer signal in observation wells. Figure 9 shows variation in bromide concentration of injection well (O9) and nearest observation well (O8) in the downstream side from 1.10.2004 to 30.11.2005. The initial concentration of bromide in the labeled water is calculated as 5000 mg/l. The initial bromide concentration of 5000 mg/l in the bore well water on the date of injection on 19.12.2004 reduced to background level (pre injection well) of 1-2 mg/l on 27.12.2004 (i.e. within 8 days). It indicates high dilution rate of bromide in the injection well due to faster movement of groundwater to the downstream side near to the bund. Such a hydraulic movement of 100 cm of water in the percolation tank, at the time of injection could
be due to the steep hydraulic gradient seen in the water table contour due to pumping in the command area. The filtration velocity could not be calculated based on tracer dilution as the labeled water in the well has attained background concentration within a period of 8 days. The nearest observation bore well (O8) located at a distance of 165 m from O9 shows arrival of tracer signal after 80 days of tracer injection. The water table contour maps show distinct ground water movement towards this well (refer figure 7a). Based on distance and arrival time of tracer signal, the velocity of groundwater flow in the central part of downstream area is calculated as 2 m/day. No significant concentration of bromide was observed in any of the other observation wells above the background level during the sampling period. This may be due to location of observation wells at far off distances from the injection well and / or due to dilution of tracer in the saturated zone beyond the detection level.
Rhodamine-B (dye tracer) was injected in the tank area on 22.1.2005, when the tank water was just receded. The tank received water once again in the month of April 2005 due to high intensity rainfall event occurred on 7.4.2005. Figure 10 shows Rhodamine-B concentration in the nearest observation wells (hp and O8) during the sampling period. The observation well (hp) located at a distance of 60 m from the bund of the tank has shown arrival of tracer signal pulses with maximum pulse measured on 12.4.2005. A high intensity rainfall event of 150 mm, occurred on 7.4.2005 has filled the tank to its full capacity. The observation well (O8) located at a distance of 165 m from the bund of the tank has shown first arrival of tracer signal on 1.7.2005. The experimental data indicates that the tank water is hydraulically connected with wells located in the central part of the downstream area. It is also reflected in the water table contour map, which shows predominant
Table 4. Location of the tracer injection and sample collection sites, recharge estimates and permeability measurements of soil samples.
S.No Description Displacement (cm)
Average volume
moisture (%)
Recharge flux evaluated
(mm)
Permeability(cm/d)
Silt + clay
T1 Red soil (loamy), grass land, no cultivation 11.74 20.52 24.1 373 24T2 Red soil (loamy), ploughed, Jowar field 9.25 13.62 12.6 5.1 51
T3 Brown loamy soil, weekly water spreading land 10.29 22.35 23 452 14
T4 Soil thickness 40-50 cm, silty layer (tank bed) 9 73
T5 Hard red soil, cultivated, clay rich artificially irrigated 57.39 9.51 54.6 419 17
T6 Fallow rainfed land, hard red soil 13.64 11.21 15.3 150 31T7 Red soil, fallow, rainfed, grass land 12.04 10.88 13.1 170 31T8 Red soil, ploughed land, cultivated 29.14 16.74 48.8T9 Red soil, ploughed land, cultivated 30.8 18.24 56.2 97 40
Note: Tracer injection: 13.9.2005; Sample collection: 04 - 05.01.2006; Depth of tracer injection: 60 cm; Depth of Permeability test is: 50 cm

L.Surinaidu, A. Raviraj and R. Rangarajan
304
groundwater flow is towards central part of the downstream area in addition to northwestern part (refer figure 7). No significant rhodamine-B concentration was observed in any of the other observation wells in the downstream area. This is because the wells are located at far off distances (> 200 m) from the tank that may indicate out of range of percolation tank influence.
CONCLUSIONS
The integrated approach of combining hydrological, hydrogeophysical and geo-tracer studies in the study area revealed clear positive impact of the percolation tank on the groundwater recharge augmentation in the command area. The most of the moderate intensity precipitation events (20-40 mm/day) that constitute 65% of the total rainfall has been lost in lessening the soil moisture deficit caused by evaporation and evapotranspiration. Only single high intensity daily rainfall events of > 100 mm/day or several moderate intensity daily rainfall events (20-60 mm/day) separated by small gaps of non-rainy days can generate runoff and cause storage in the tank with substantial groundwater percolation from the tank. The geophysical investigations, permeability and grain size analysis inferred that tank bed having more silt on the top may be causing low rate of percolation. Whereas on the other side high weathering thickness has contributed to more recharge away from the tank bed area within the tank. The average percolation rate from the tank is estimated as 32 mm/day that ranges from 47 mm/day to 15 mm/day. The percolated water from the percolation tank contributes very small quantity of percolated water to groundwater recharge, when water column is very low in the tank. Once the tank water level is above the bed level, the percolation rate is likely to be driven by the hydraulic gradient of the aquifer due to the hydraulic connection in the area. The observations also indicated that the pumping of groundwater could significantly influence the hydraulic gradient and thus contribute to the control of the artificial recharge from the tank. The natural recharge caused by rainfall in the rain fed agricultural fields of the command area of the tank is 18 mm (5 % of the rainfall) and in irrigation fields is 53 mm (14 % of the rainfall). The velocity of groundwater flow during the period of ponding is 1- 2 m/day with an influenced zone of recharge of 275 m from the tank.
ACKNOWLEDGEMENTS
CISR-National Geophysical Research Institute (NGRI), Hyderabad and Water Technology Center, Tamil Nadu Agricultural University (WTC, TNAU) have jointly undertaken a project entitled “Augmenting groundwater resource by Artificial Recharge (AGRAR)” funded by United Kingdom. The authors are thankful to the director CSIR-
NGRI for his kind permission to publish this paper. The authors gratefully acknowledge continued support, precise refinement of the manuscript through focused evaluation and apt editing by Dr.P.R.Reddy.
Compliance with Ethical Standards
The authors declare that they have no conflict of interest and adhere to copyright norms.
REFERENCES
Abraham, M., and Mohan, S., 2015. Effectiveness of Artificial
Recharge Structures in Enhancing Groundwater Storage: A
Case Study. Indian Journal of Science and Technology, v.8,
no.20, DOI: 10.17485/ijst/2015/v8i20/81596, August 2015.
Batchelor, C.H., Rama Mohan Rao, D.V., and Manohar Rao, S.,
2003. Watershed development: a solution to water shortages
in semi-arid India or part of the problem? Land Use Water
Resource. Res, v.3, pp: 1-10.
Central Ground Water Board (CGWB), 2014. Ministry of Water
Resources, River development and Ganga Rejuvenation
Government of India. DYNAMIC GROUND WATER
RESOURCES OF INDIA. http://www.cgwb.gov.in/documents/
Dynamic-GW-Resources-2011.pdf
Chandra, S., Ahmed, S., Nagaiah, E., Shashi Kant Singh., and
Chandra, P.C., 2011. Geophysical exploration for lithological
control of arsenic contamination in groundwater in Middle
Ganga Plains, India. Physics and Chemistry of the Earth,
2011, v.36, no.16, pp: 1353-1362.
Drost, W., Moser, H., Neumaier, F., and Rauert, W., 1974. Isotope
methods in groundwater Hydrology, published by Eurisotop,
Germany.
Dahlin, T., 1996. 2D resistivity surveying for environmental and
engineering applications. First Break, v.14, pp: 275–284.
Dillon, P., Gale, I., Contreras, S., Pavelic, P., Evans, R., and Ward,
J., 2009. Managing aquifer recharge and discharge to sustain
irrigation livelihoods under water scarcity and climate
change. IAHS Publ, v.330, pp: 1-12.
Glendenning, C.J., van Ogtrop, F.F., Mishra, A.K., and Vervoort,
R.W., 2012. Balancing watershed and local scale impacts
of rain water harvesting in India – a review. Agric. Water
Manag., v.107, pp: 1-13.
Kerr, J., Pangare, G., and Lokur Pangare, V., 2002. Watershed
development projects in India – an evaluation. Research
Report 127. IFPRI, Washington, DC.
Lin, D., Jin, M., Liang, X., and Zhan, H., 2013. Estimating
groundwater recharge beneath irrigated farmland using
environmental tracers fluoride, chloride and sulfate.
Hydrogeology Journal, v.21, pp: 1469-1480.
Muralidharan, D., Rangarajan, R., Hodlur, G.K. and Sathyanarayana,
U., 2005. Optimal desliting for improving the efficiency of
tanks in semiarid regions. Journal of Geological society of
India, v.65, no.1, pp: 83-88.

Evaluation of Percolation Tank Efficiency on Groundwater Recharge: A Case Study for Karnampettai Percolation Pond, India
305
Received on: 9.2.18; Revised on: 14.2.18; Accepted on: 19.2.18
Survey, Techniques of Water-Resources Investigations, Book
5, Chapter Al, pp: 626.
Shah, T., 2012. Community response to aquifer development:
distinct patterns in India’s alluvial and hard rock aquifer
areas. Irrig. Drain; v.61, no.1, pp: 14–25.
Sharda V.N., Kurothe R.S., Sena D.R., Pande V.C., and Tiwari
S.P., 2006. Estimation of groundwater recharge from water
storage structures in a semi-arid climate of India.Journal of
Hydrology, v.329, pp: 224-243.
Surinaidu, L., Bacon, C.G.D., Pavelic, P., 2013a. Agricultural
groundwater management in the Upper Bhima Basin, India:
current status and future scenarios, Hydrology and Earth
System Sciences; v.17, no.2, pp: 507-517, doi:10.5194/
hess-17-507-2013.
Surinaidu, L., Rao, V.V.S.G., Prasad, P.R., and Sarma, V.S.,
2013b. Use of Geophysical and Hydrochemical Tools
to Investigate Seawater Intrusion in Coastal Alluvial Aquifer,
Andhra Pradesh, India Groundwater in the Coastal Zones
of Asia-Pacific, v.7, pp: 49-65, Springer publications.
Surinaidu, L., Rao, V.V.S.G., Rao, G.T., Mahesh, J., Padalu, G., and
Sarma, V.S., 2012. An integrated approach to investigate
saline water intrusion and to identify the salinity sources in
the Central Godavari delta, Andhra Pradesh, India. Arabian
Journal of Geosciences, v. 6, no.10, pp: 3709–3724, DOI:
10.1007/s12517-012-0634-2.
Todd, D.K., 1980. Ground Water Hydrology, John Wiley & Sons, Inc., USA.
Tripathi, A., and Prasad, A.R., 2009. Agricultural Development in
India since Independence: A Study on Progress, Performance,
and Determinants. Journal of Emerging Knowledge
on Emerging Markets, v.1, Art. 8, Published by Digital
Commons.Kennesaw State University, 2009.
Wang, B., Menggui Jin., John, R., Nimmo, Lei Yang., Wenfeng,
Wang., 2008. Estimating groundwater recharge in Hebei
Plain, China under varying land use practices using tritium
and bromide tracers. Journal of Hydrology 2008; v.356, pp:
209-222.
World Bank., 2010. Deep wells and prudence: Towards pragmatic
action for addressing groundwater overexploitation in India,
Report 51676, The International Bank for Reconstruction
and Development/The World Bank 1818 H Street, NW,
Washington DC,20433, USA, pp: 100.
Wu, Q., Wang, G., Zhang,W., Cui, H., and Zhang, W., 2016.
Estimation of Groundwater Recharge Using Tracers and
Numerical Modeling in the North China Plain Qinghua
Water, 2016, v.8, pp: 353; doi:10.3390/w8080353.
Zarroca, M., Bach, J., Linares, R., and Pellicer, X.M., 2011.
Electrical methods (VES and ERT) for identifying, mapping
and monitoring different saline domains in a coastal plain
region (Alt Empordà, Northern Spain). Journal of Hydrology, v.409, no.1-2, pp: 407–422.
Munnich, K.O., 1968. Moisture movement measured by isotope
tagging, In: Guide book on Nuclear technique in Hydrology.
International Atomic Energy Agency, Vienna, pp: 112-117.
Massuel,S., Perrin,J., Mascre, C., Mohamed, W., Boisson, A., and
Ahmed, S., 2014. Managed aquifer recharge in South India:
What to expect from small percolation tanks in hard rock?,
Journal of Hydrology, 2014, v.512, pp: 157–167.
NRAA., 2011. Monitoring and Evaluation of Artificial Recharge of
Ground Water Programmes/ Schemes/Projects in the Rainfed
Regions of Maharashtra. Study Report 3. National Rainfed
Area Authority, New Delhi, India, pp: 151.
Pavelic, P., Patankar, U., Acharya, S., Jella, K., and Gumma, M.K.,
2012. Role of groundwater in buffering irrigation production
against climate variability at the basin scale in South-West
India, Agr. Water Manage, v.103, pp: 78–87.
Pitrak, M., Mares, and Kobr, M., 2007. A Simple Borehole
Dilution Technique in Measuring Horizontal Ground
Water Flow. GROUND WATER, v.45, no.1, pp: 89-92, doi:
10.1111/j.1745-6584.2006.00258.x.
Rangarajan, R., Rolland Andrade., Shankar, G.B.K., Muralidharan,
D., and Peters, E., 2014. Understanding area specific
recharge process from Vadoze zone resistivity
variations – a case study in basalt watershed, Ujjain district,
Madhya Pradesh. J. Ind. Geophys. Union, April 2014, v.18,
no.2, pp: 211-224.
Rangarajan, R., Mondal, N.C., Singh, V.S., and Singh, S.V., 2009.
Estimation of natural recharge and its relation with aquifer
parameters in and around Tuticorin town, Tamil Nadu,
India. Current Science, v.97, no.2, pp: 25.
Rama Prasad., 1979. Rain water harvesting in India and Middle
East. Technical report by Indian Institute of Science,
Bangalore, 80 pages.
Rolland, A., Muralidharan, D., and Rangarajan, R., 2005. Evaluation
of check dam recharge through water table response in the
ponding area. Current Science, v.89, pp: 677-681.
Sayana, V.B.M., Arunbabu E., Mahesh Kumar, L., Ravichandran,
S., and Karunakaran, K., 2010. Groundwater responses to
artificial recharge of rainwater in Chennai, India: A case
study in an educational institution campus. Indian Journal
of Science and Technology, v.3, no.2, pp: 124-30.
Sukhija, B.S., Reddy, D.V., Nandakumar, M.V. and Rama., 1997.
A method of evaluation of artificial recharge through
percolation tanks using environmental chloride. Ground
Water, v.35, no.1, pp: 161-165.
Sakthivadivel, R., 2007. The ground water recharge movement
in India. In: Giordano, M., Villholth, K.G. (Eds.). The
Agricultural Groundwater Revolution:Opportunities and
Threats to Development. CAB International.
Skougstad, M.W., Fishman, M.J., Friedman, L.C., and Erdmann,
D.E., 1979. Methods for determination of inorganic
substances in water and fluvial sediments: U.S. Geological