evaluation of oxygen transmission rate of packaging...
TRANSCRIPT

EVALUATION OF OXYGEN TRANSMISSION RATE OF PACKAGING FILMS ON
GROWTH OF CLOSTRIDIUM SPOROGENES AND MEDIA OXIDATION REDUCTION POTENTIAL IN PACKAGED SEAFOOD SIMULATING MEDIA
By
JAYASHREE GNANARAJ
A THESIS PRESENTED TO THE GRADUATE SCHOOL OF THE UNIVERSITY OF FLORIDA IN PARTIAL FULFILLMENT
OF THE REQUIREMENTS FOR THE DEGREE OF MASTER OF ENGINEERING
UNIVERSITY OF FLORIDA
2003

Copyright 2003
by
Jayashree Gnanaraj

This thesis is dedicated to my parents and my brother who have always supported and encouraged me from near and afar.
iv
ACKNOWLEDGMENTS
I am grateful to Dr. Bruce A. Welt, my advisor, supervisor and mentor who taught
me more than I hoped to learn here at graduate school, without whose support this
research work would not have been possible. His work has been my inspiration. This
work has been a product of his patience and endurance. He has inspired me to be a better
researcher and also a better person. He understood my problems and helped me to
succeed inspite of them. My success is and will be a reflection of his outstanding abilities
as a teacher. Nothing short of this will be adequate to express my gratitude to him.
I would like to thank Dr. Art A. Teixeira and Dr. Hordur G. Kristinsson for
agreeing to serve on my committee, guiding me and always ready to help. I would like to
thank Dr. Steven Otwell for his suggestions. I would like to thank National Fisheries
Institute and Florida Sea Grant for financial assistance without which this project would
not have been completed.
This paper is also result of enduring support and love and cooperation of my
parents, Mrs. and Mr. Gnanaraj. I would like to thank my brother Sriram for being there
for me. My family members have given me strength for what I started. I am indebted to
them for being there as unshakeable pillars of support.
This thesis is incomplete without acknowledging my friends in Gainesville. Special
thanks go to Bob, Billy, Dhuruva, Ralph, Teresa and Vivek. Most of all I would like to
thank the faculty and staff in Department of Agriculture and Biological Engineering.

v
TABLE OF CONTENTS page ACKNOWLEDGMENTS ................................................................................................. iv
LIST OF TABLES............................................................................................................ vii
LIST OF FIGURES .............................................................................................................x
ABSTRACT....................................................................................................................... xi
CHAPTER 1 INTRODUCTION ........................................................................................................1
FDA Alert .....................................................................................................................1 Food-Borne Botulism ...................................................................................................2
Significance of Clostridium botulinum ..........................................................2 Conducive conditions for growth of C. botulinum ........................................3
Reduced Oxygen Packaging .........................................................................................3 Packaging of Horticultural Products ..............................................................4 Packaging of Flesh Foods ..............................................................................5
Dynamic nature of atmosphere in ROP packaged flesh foods .....................................5 Research Hypothesis.....................................................................................................6
2 EFFECT OF TEMPERATURE AND RELATIVE HUMIDITY ON FILM
PERMEABILITY.........................................................................................................8
Materials and Method ...................................................................................................9 Results and Discussion ...............................................................................................13
3 EFFECT OF FILM OTR, PACKAGE AREA AND TEMPERATURE ON
CLOSTRIDIUM SPOROGENES SPORE OUTGROWTH........................................18
Materials and Method .................................................................................................20 Results and Discussion ...............................................................................................25
4 CONCLUSION AND FUTURE WORK ...................................................................34
Conclusion ..................................................................................................................34 Future Work................................................................................................................35
vi
APPENDIX A OXYGEN TRANSMISSION RATE OF PACKAGING FILMS AT DIFFERENT
TEMPERATURES AND RELATIVE HUMIDITY..................................................36
B DIGITAL PICTURES OF SPORE OUTGROWTH IN DIFFERENT FILMS AND BAG SIZES.......................................................................................................39
C OXIDATION REDUCTION POTENTIAL WITHOUT PH COMPENSATION...150
LIST OF REFERENCES.................................................................................................152
BIOGRAPHICAL SKETCH ...........................................................................................155

vii
LIST OF TABLES
Table page 2-1 Film description........................................................................................................10
2-2 Oxygen transmission rates of different films measured at different temperature and relative humidity................................................................................................13
2-3 Comparison of measured oxygen transmission rates with value reported by manufacturer.............................................................................................................13
2-4 Ea and k0 values for Arrhenius relationship between OTR and temperature for the packaging films at 0% RH .......................................................................................16
2-5 Ea and k0 values for Arrhenius relationship between OTR and temperature for the packaging films at 50% RH .....................................................................................16
3-1 OTR of film used in this study .................................................................................21
3-2 Spore outgrowth over time in regular media for various film types at various temperatures .............................................................................................................26
3-3 Spore outgrowth over time in anaerobic media for various film types at various temperatures .............................................................................................................28
3-4 Oxidation reduction potential of highly reduced anaerobic media in bags of various film types at different temperatures.............................................................30
A-1 OTR of packaging films at 0% RH ..........................................................................37
A-2 OTR of packaging films at 50% RH ........................................................................38
B-1 Growth table for C60 8X8 at 15˚C Anaerobic Media ..............................................40
B-2 Growth table for AET 8x8 at 15˚C Anaerobic Media..............................................44
B-3 Growth table for BDF 8x8 at 15˚C Anaerobic Media..............................................47
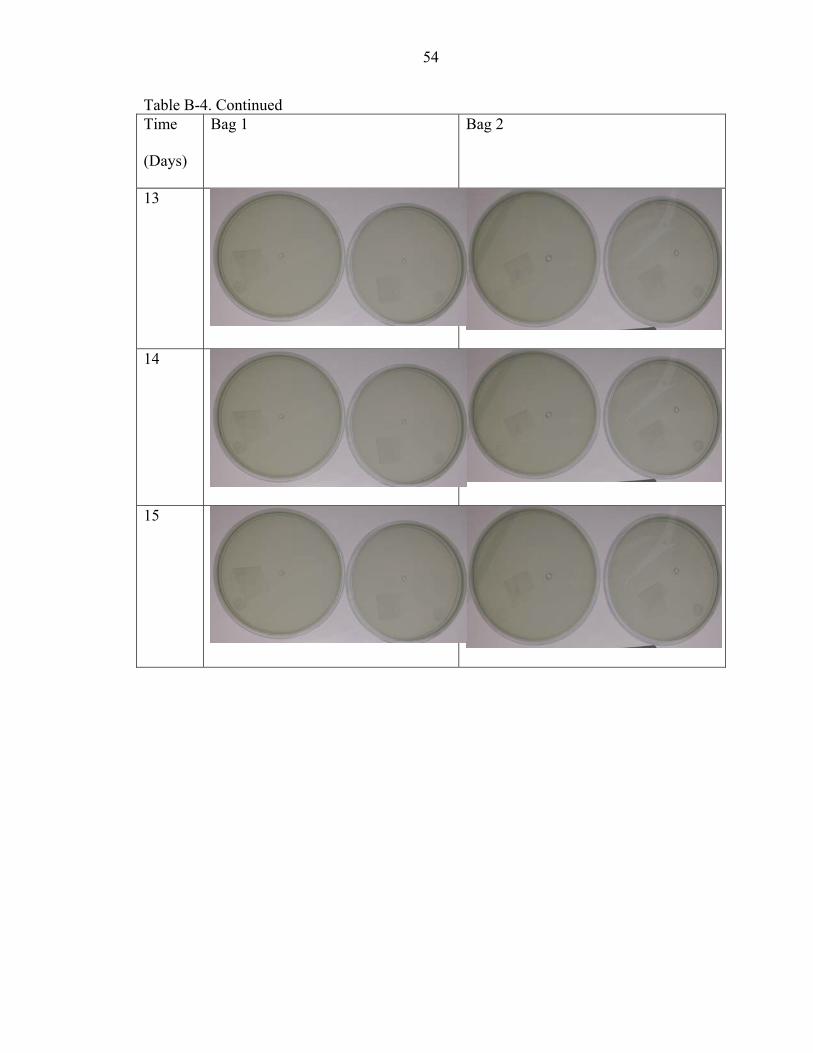
B-4 Growth table for C60 18X14 at 15˚C Anaerobic Media ..........................................51
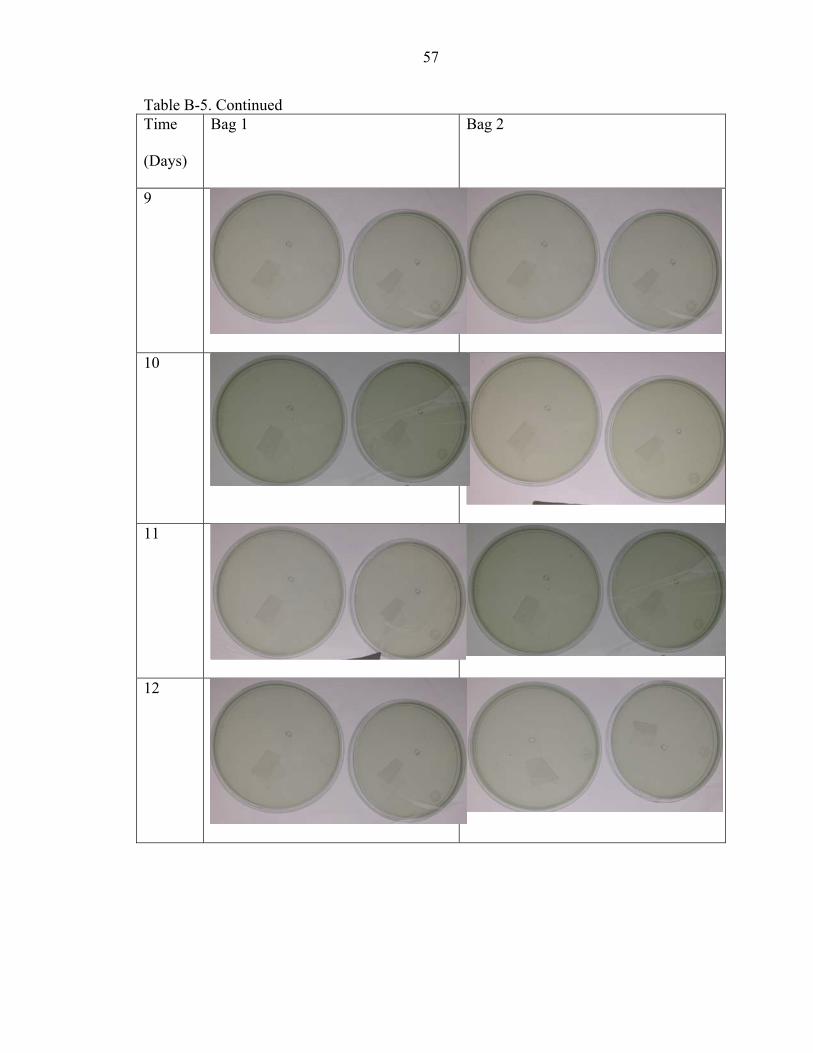
B-5 Growth table for AET 18X14 at 15˚C Anaerobic Media.........................................55
viii
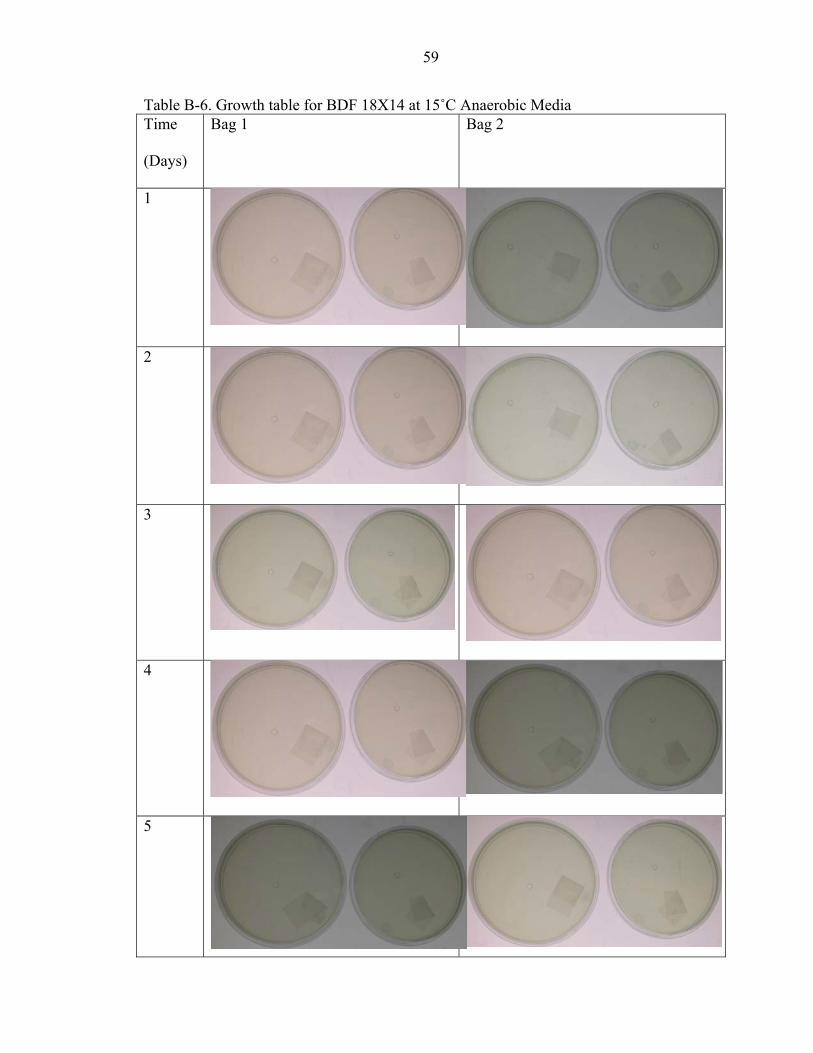
B-6 Growth table for BDF 18X14 at 15˚C Anaerobic Media.........................................59
B-7 Growth table for C60 8X8 at 23˚C Anaerobic Media ..............................................62
B-8 Growth table for AET 8x8 at 23˚C Anaerobic Media..............................................63
B-10 Growth table for C60 18x14 at 23˚C Anaerobic Media...........................................65
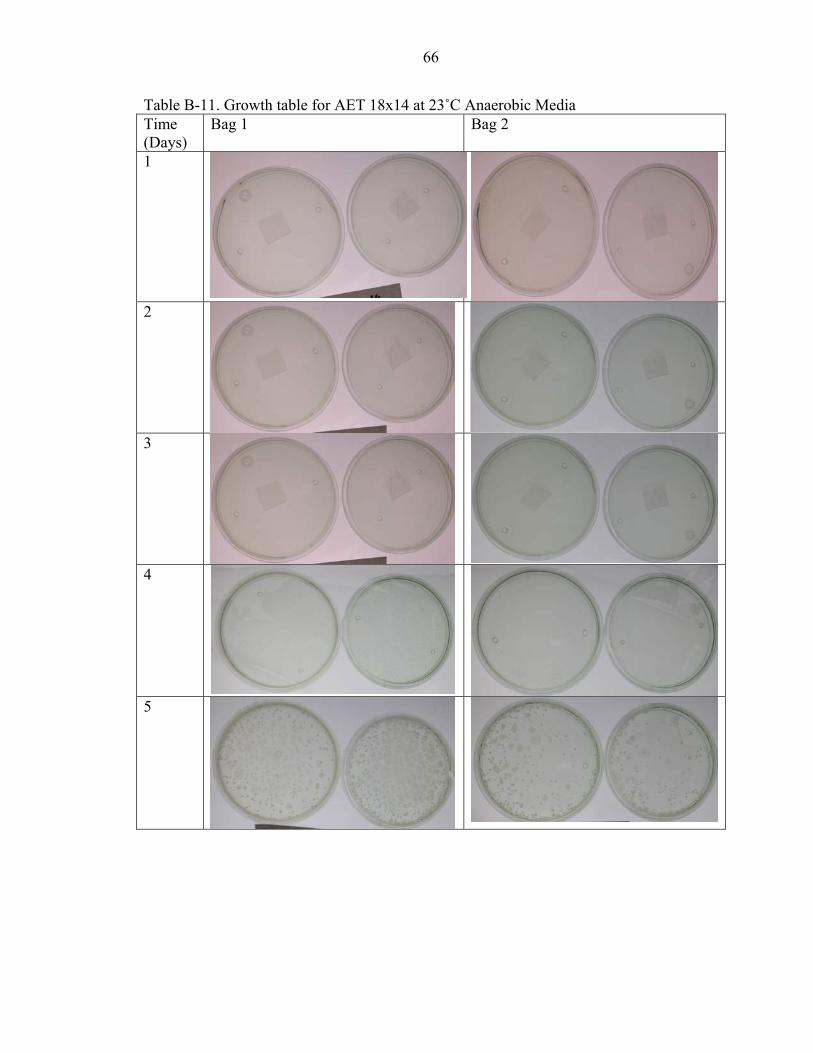
B-11 Growth table for AET 18x14 at 23˚C Anaerobic Media..........................................66
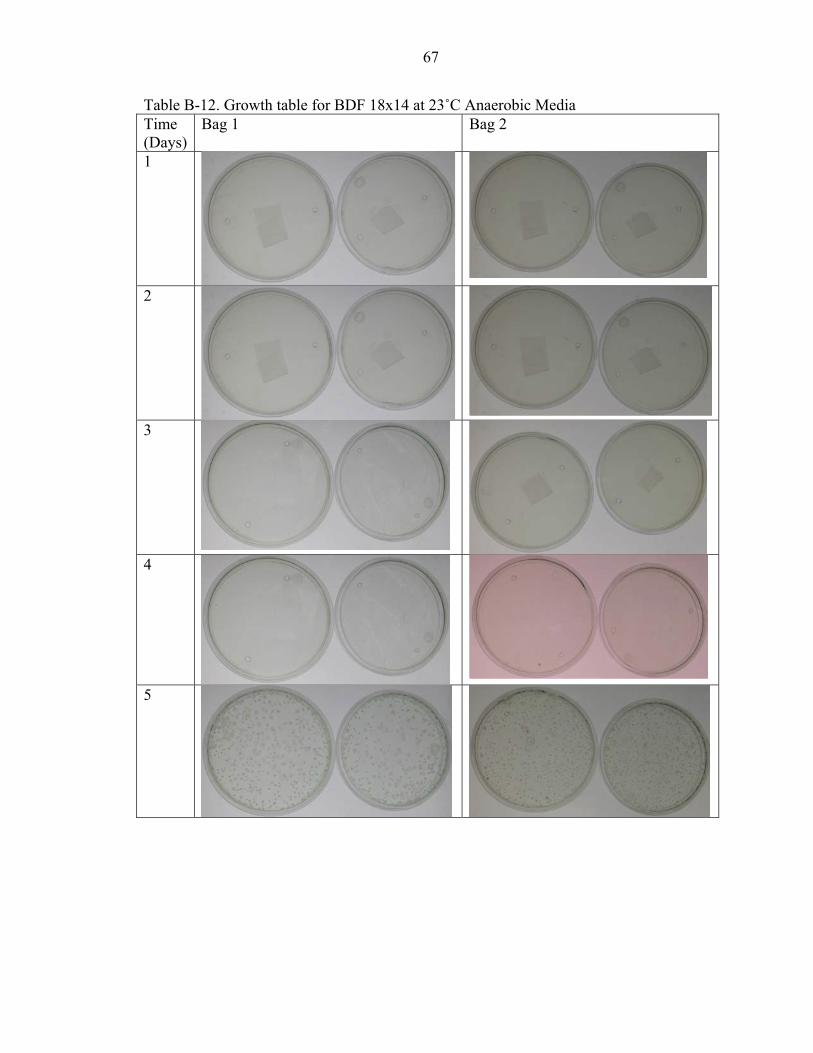
B-12 Growth table for BDF 18x14 at 23˚C Anaerobic Media..........................................67
B-13 Growth table for C60 8x8 at 30˚C Anaerobic Media...............................................68
B-14 Growth table for AET 8x8 at 30˚C Anaerobic Media..............................................69
B-15 Growth table for BDF 8x8 at 30˚C Anaerobic Media..............................................70
B-16 Growth table for C60 18x14 at 30˚C Anaerobic Media...........................................71
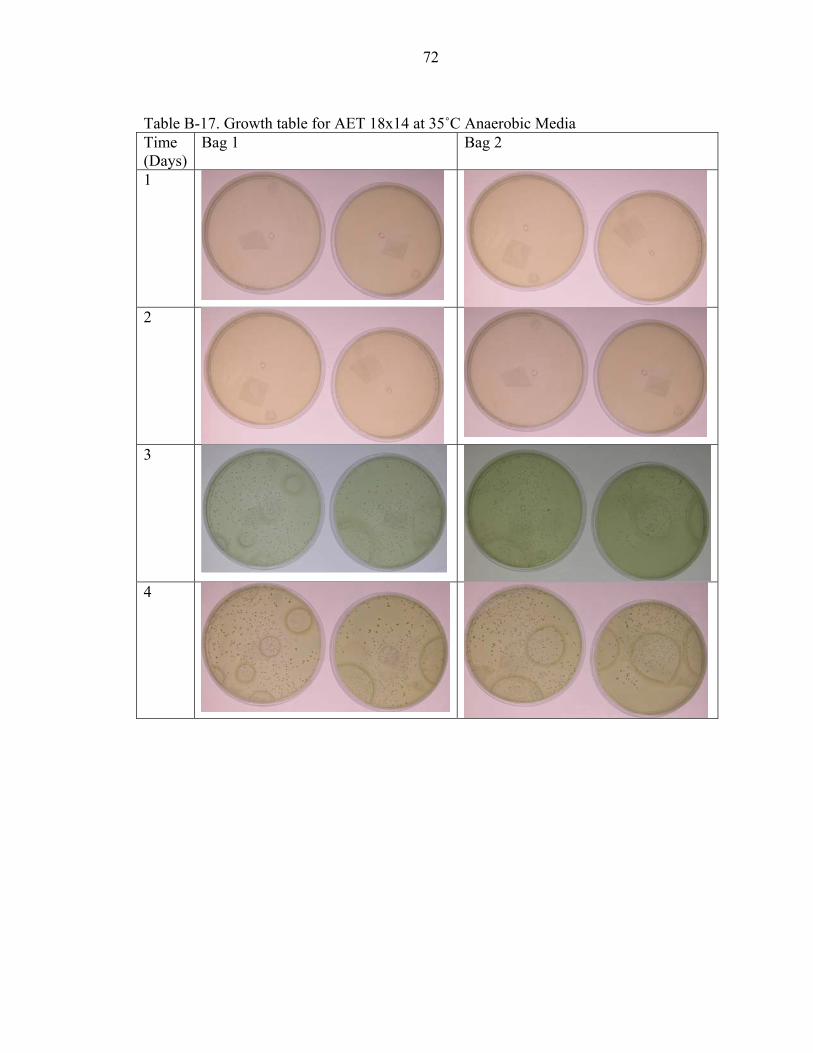
B-17 Growth table for AET 18x14 at 35˚C Anaerobic Media..........................................72
B-18 Growth table for BDF 18x14 at 35˚C Anaerobic Media..........................................73
B-19 Growth table for C60 8x8 at 35˚C Anaerobic Media...............................................74
B-20 Growth table for AET 8x8 at 35˚C Anaerobic Media..............................................75
B-21 Growth table for BDF 8x8 at 35˚C Anaerobic Media..............................................75
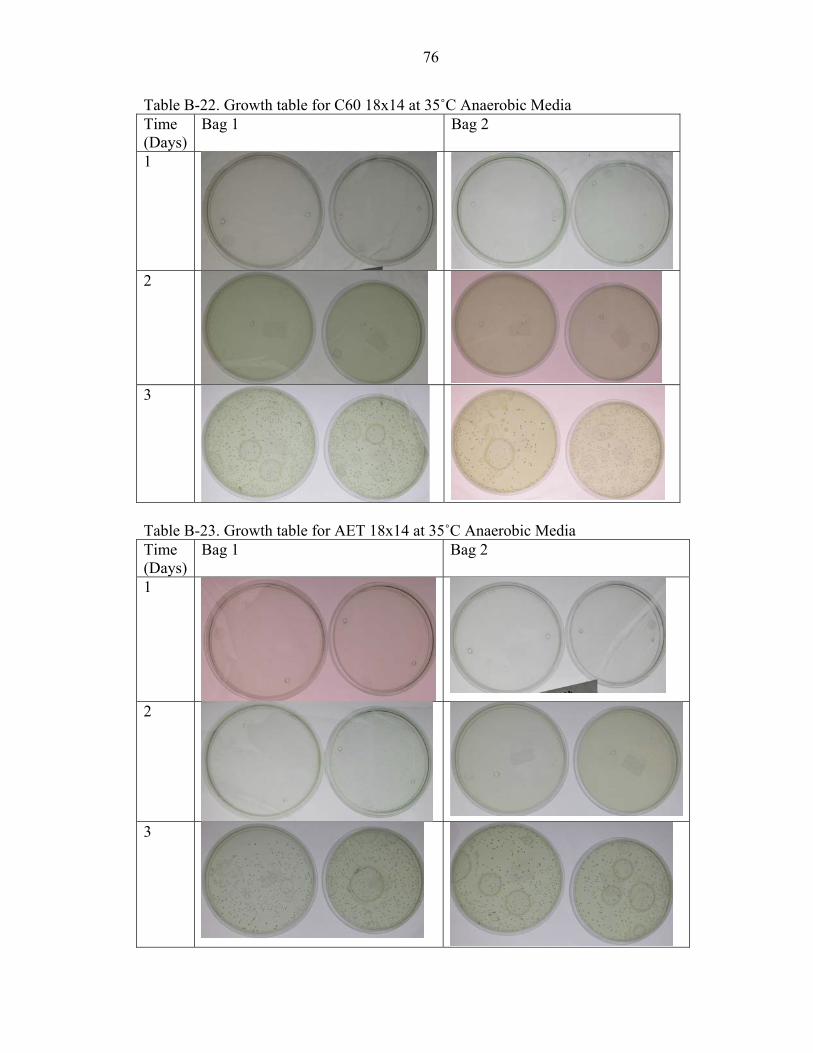
B-22 Growth table for C60 18x14 at 35˚C Anaerobic Media...........................................76
B-23 Growth table for AET 18x14 at 35˚C Anaerobic Media..........................................76
B-24 Growth table for BDF 18x14 at 35˚C Anaerobic Media..........................................77
B-25 Growth table for C60 8x8 at 15˚C Regular Media...................................................78
B-26 Growth table for AET 8x8 at 15˚C Regular Media..................................................81
B-28 Growth table for C60 18x14 at 15˚C Regular Media...............................................87
B-29 Growth table for AET 18x14 at 15˚C Regular Media..............................................90
B-30 Growth table for BDF 18x14 at 15˚C Regular Media..............................................93
B-31 Growth table for C60 8x8 at 20˚C Regular Media...................................................96
B-32 Growth table for AET 8x8 at 20˚C Regular Media..................................................99
ix
B-33 Growth table for BDF 8x8 at 20˚C Regular Media................................................102
B-34 Growth table for C60 18x14 at 20˚C Regular Media.............................................105
B-35 Growth table for AET 18x14 at 20˚C Regular Media............................................108
B-36 Growth table for BDF 18x14 at 20˚C Regular Media............................................111
B-37 Growth table for C60 8x8 at 30˚C Regular Media.................................................114
B-38 Growth table for AET 8x8 at 30˚C Regular Media................................................117
B-39 Growth table for BDF 8x8 at 30˚C Regular Media................................................120
B-40 Growth table for C60 18x14 at 30˚C Regular Media.............................................123
B-41 Growth table for AET 18x14 at 30˚C Regular Media............................................126
B-42 Growth table for BDF 18x14 at 30˚C Regular Media............................................129
B-43 Growth table for C60 8x8 at 35˚C Regular Media.................................................132
B-44 Growth table for AET 8x8 at 35˚C Regular Media................................................135
B-45 Growth table for BDF 8x8 at 35˚C Regular Media................................................138
B-46 Growth table for C60 18x14 at 35˚C Regular Media.............................................141
B-47 Growth table for AET 18x14 at 35˚C Regular Media............................................144
B-48 Growth table for BDF 18x14 at 35˚C Regular Media............................................147
C-1 Redox potential values without compensating for pH 7...........................................151

x
LIST OF FIGURES
Figure page 2-1 Mocon Oxtran 2/20 ..................................................................................................10
2-2 Film cutting template ...............................................................................................11
2-3 A diagram representing gas flow through films inside MOCON instrument. .........12
2-4 Comparison of 0% and 50% RH of C60 ..................................................................14
2-5 Arrhenius relationship between OTR and temperature at 0% RH ...........................15
2-6 Arrhenius relationship between OTR and temperature at 50% RH .........................15
2-7 Comparison of PE, C60 and C75 FTIR spectra .......................................................17
3-1 Sample of bag sizes used for the experiment ...........................................................22
3-2 Rack arrangement inside the chamber .....................................................................22
3-3 Back lighted stand used for taking digital pictures ..................................................23
3-4 Fiber optic oxygen sensor system ............................................................................23
3-5 Oxygen sampling inside the bag ..............................................................................24
3-6 Equipment used to measure ORP and pH ................................................................25
3.7 Control plate at 30˚C inside anaerobic box..............................................................28
3-8 Headspace oxygen content over time in film types C60 and BDF at 23˚C .............31
3-9 Dissolved oxygen content over time in highly reduced media at 23˚C for film types C60 and BDF ..................................................................................................32
3-10 Dissolved oxygen content over time in highly reduced media at 35˚C for film types C60 and BDF ..................................................................................................32

xi
Abstract of Thesis Presented to the Graduate School
of the University of Florida in Partial Fulfillment of the Requirements for the Degree of Master of Engineering
EVALUATION OF OXYGEN TRANSMISSION RATE OF PACKAGING FILMS ON GROWTH OF CLOSTRIDIUM SPOROGENES AND MEDIA OXIDATION
REDUCTION POTENTIAL IN PACKAGED SEAFOOD SIMULATING MEDIA
By
Jayashree Gnanaraj
August 2003
Chair: Dr. Bruce A. Welt Major Department: Agricultural and Biological Engineering
Studies with packaged fish have shown that obvious spoilage can be delayed by
removing oxygen. However, anaerobic pathogenic Clostridium botulinum may thrive in
reduced oxygen packaging, causing packaged fish to become toxic prior to obvious
spoilage. In an attempt to mitigate development of reduced oxygen atmospheres within
fresh seafood packaging, FDA has specified a minimum oxygen transmission rate (OTR)
for seafood packaging films of 10,000 cc/m2/day at 24˚C. However, this specification
does not take the actual package design into consideration. It is suspected that a
specification that combines film OTR with descriptive parameters of the package, such as
film area, may offer a better structure for specification. Additionally, while it is generally
accepted that C. botulinum is an obligate anaerobe, it remains unclear if a particular
concentration of oxygen is capable of preventing toxigenesis. Like C. botulinum, C.
sporogenes is an obligate anaerobe but nonpathogenic, so it was used as a surrogate for
C. botulinum in this study.

xii
The objective of this work was to develop a scientific rationale for a new seafood
package OTR specification, and to study the relationships among film OTR, package area
and storage temperature on C.sporogenes spore outgrowth in regular and anaerobic
media.
Commercially available packaging films with a wide range of OTR were used in
the study. OTR as a function of temperature was determined in the range of 10-35˚C at
0% and 50% relative humidity (RH). Films were converted into packages with areas of
8x8 and 18x14 inches. Inoculated petri dishes were sealed in these packages using
multiple vacuum/ nitrogen gas flush cycles. Inoculated packages were incubated at 10,
15, 20, 30 and 35 ˚C. Dynamic oxygen concentrations were measured in packaged media
and package headspace. Oxidation reduction potentials (ORP) of media were measured
before and after incubation.
As expected, oxygen levels in high OTR films increased quickly to an approximate
level of 12% O2. Oxidation reduction potentials tended to become more positive with
rising oxygen levels, suggesting that sample ORP plays an important role in predicting
potential outgrowth of spores.
Results suggest that a critical parameter for inhibiting outgrowth is the time
required to raise oxygen concentration sufficiently to increase ORP above some critical
value. It was found that package area, within a practical range of package dimensions, is
not sufficiently important to provide an avenue for modifying FDAs OTR guideline.
Since film OTR plays a key role in this process, this parameter may continue to offer the
most convenient approach toward ensuring safety of fresh seafood.

1
CHAPTER 1 INTRODUCTION
Limited availability and increased transportation of raw fish and seafood make it
important to minimize losses. Improved management and food preservation technology
are needed because trends show increased interest in minimally preserved products
(Gould, 1996). Annual landed seafood in Florida was estimated to be over $200 million
(Welt et al., 2003). Fresh pre-prepared seafood items like sushi, raw oysters and clams
and use of fish as a substitute for meat have been instrumental in making fish/seafood an
everyday alternative. Seafood menu mentions for entrees were up 10.2% over previous
year in 2000, growing more than any other center-of-the-plate category, including
chicken and beef (Sloan, 2000). Determination and prediction of shelf life of fresh fish
and lightly preserved seafood has become particularly important to prevent losses due to
spoilage.
FDA Alert
Specifics of Alert
Section 402 (a) (4) of Food, Drug and Cosmetic Act considers refrigerated fresh
fish stored under reduced oxygen conditions such as modified atmosphere packaging
(MAP) and vacuum packaging (VP) as adulterated when no controls for Clostridium
botulinum toxin liberation are employed. FDA issued an import alert which states
“Detention without physical examination of refrigerated products (not frozen) vacuum
packaged or modified atmosphere packaged raw fish and fishery products due to the
potential for C. botulinum toxin production” (FDA, 2002).

2
This alert affects 4100 U.S seafood processors, most of which are small scale
businesses responsible for processing over 350 species of fish. The alert also affects
foreign seafood processors and U.S seafood importers. Overall financial impacts caused
by these regulations are estimated to be more than $1 million per year (Otwell, 2002).
FDA identifies the following two ways to package unfrozen fish products safely:
• Use of packaging film with a minimum OTR of 10,000 cc/m2/day.
• An indicator can be used in or on the packaging to show that the product has not been exposed to time and temperature combination that could result in an unsafe product between the time of packaging and the time of use by the consumer.
Food-Borne Botulism
Food borne botulism is a severe type of food poisoning due to ingestion of foods
containing potent neurotoxin produced by Clostridium botulinum. Intoxication occurs
when toxin enters the body and directly affects bodily functions. Symptoms of this
progressive paralytic disease begin with numbness in the extremities and double vision.
Death is often slow and typically results from suffocation as control of respiration fails.
Though incidence of food borne botulism is low, it remains a considerable food safety
concern because of high mortality rates.
Significance of Clostridium botulinum
C. botulinum is a food pathogen that is common in the natural environment,
particularly in soil and marine and freshwater sediments. This organism is so ubiquitous
that it is not possible to exclude it from foods. C. botulinum is a rod shaped gram
positive, anaerobic bacteria capable of forming heat resistant spores that withstand long
periods of dryness and fairly severe thermal treatments. Seven (A, B, C, D, E, F and G)
strains are recognized based on their antigenic specificity of toxin. Strains causing human
botulism include types (A, B, E and F), while botulism from types C and D occurs in
3
animals. Given favorable conditions, this organism produces a heat labile neurotoxin that
can be destroyed by boiling for 10 minutes or longer (Sumner et al., 1995). An extremely
small amount of toxin (few nanograms) has been shown to be capable of causing illness.
In 1987, eight cases of type E botulism that occurred due to the consumption of dry salted
whole uneviscerated fish (FDA/CFSAN, 1992).
Conducive Conditions for Growth of C. botulinum
Botulism has been associated with
• Inadequately processed home canned foods.
• Foods with water phase salt concentrations less than 5% (water activity, aW, of 0.97).
• Almost any type of food that is not very acidic (pH above 4.6)
• Sausages, meat products, canned vegetables and seafood products have been the most frequent vehicles for botulism (FDA/CFSAN, 1992).
Reduced Oxygen Packaging
Altering atmospheres within food packages to extend shelf life is a method of food
preservation. Reduced oxygen packaging (ROP) contains little or no oxygen. FDA
defines ROP as any package that when sealed, has the potential to result in an internal
atmosphere that contains lower concentration of oxygen than standard ambient
conditions. Cook-chill, controlled atmosphere packaging (CAP), modified atmosphere
packaging (MAP), sous vide and vacuum packaging (VP) fall under ROP category.
Advantages of Reduced Oxygen Packaging
Advantages of ROP include
• Prevents growth of aerobic spoilage micro organisms such as pseudomonas, aerobic yeast and molds which are often responsible for organoleptic spoilage.
• Shelf-life extension.
4
• Inhibition of oxidative processes that degrade food quality.
• Prevents color deterioration in raw meats during storage and retail display.
• Reduces product shrinkage by preventing water loss (FDA, 1997).
Trends and Rationale for Vacuum Packaging and Modified Atmosphere Packaging
The principle involved in VP is removal of gases from a package. MAP involves
methods to maintain a specific gaseous atmosphere within the package that is different
from standard atmospheric conditions. MAP in conjunction with refrigeration has been
shown to increase shelf life of many types of foods. MAP offers several potential
advantages to the seafood industry, including
• Possibility of centralized production. • Reduced economic loss by preventing quality degradation. • Increased distribution efficiency due to standardized packaging. • Potential shelf-life increases of 50 to 400% (Farber, 1991). Relationship between packaging film permeability to food safety and quality
Ability to establish and maintain a specific atmosphere in MAP packaging depends
on gas permeation characteristics of the packaging films particularly with respect to
oxygen and carbon dioxide.
Packaging of Horticultural Products
When applying MAP to horticultural products like fruits and vegetables, it is often
desired to maintain low oxygen levels and relatively high carbon dioxide levels
(Robertson, 1992). Such conditions tend to slow product respiration resulting in extended
shelf life. To achieve specific modified atmospheres, a delicate balance between film
permeation and product respiration must be established. When this balance is violated,
either due to improper packaging films or abusive temperatures, anoxic conditions can

5
develop which results in rapid product quality loss. As a result of these considerations,
highly permeable films are typically used in such applications.
Packaging of Muscle Foods
Important properties to be considered during packaging of muscle foods are
product color and microbial population. Although oxygen may be harmful to red meat
product, it is essential for development of the bright red color that consumer’s desire.
Since packaged flesh foods do not respire, MAP of such foods typically involves flushing
packages with a specific atmosphere prior to sealing. Use of high barrier films (low
permeability) are intended to “trap” injected gases in the package. The primary gases
involved are oxygen, carbon dioxide and nitrogen. These packaging techniques typically
utilize high barrier films in an attempt to trap modified atmospheres within package.
Dynamic Nature of Atmosphere in ROP Packaged Muscle Foods
Flesh foods spoil through the combined effects of chemical reaction, biochemical
reactions (enzyme activity) and microbial growth. These reactions typically consume
oxygen, which can lead to anaerobic conditions inside the package. This often leads to
progression of microbial activity from aerobic to facultative anaerobe to obligate
anaerobic. There is a possibility of C. botulinum producing neurotoxin under favorable
conditions which may render foods toxic prior to visible signs of organoleptic spoilage.
Potential Control for ROP Fish
The National Advisory Committee for Microbiological Criteria for Foods
recommended temperature control below 3.3˚C as a primary preventive measure against
C. botulinum growth. However, temperature abuse of 7-10˚C is encountered by the
product in retail and distribution chain (NACMCF, 1991). National Food Processors

6
Association (NFPA) has recommended that there be a secondary safety control for foods
that are packaged in reduced oxygen atmospheres and offered at retail (NFPA, 1989).
Recently FDA has put forward following control guidelines for ROP seafood.
• Packaging material has a permeability of more than 10,000 cc/m2/day at 24˚C • Water phase salt level is at least 5% • Water activity (aW) is below 0.97 • pH is 5.0 or less • Time temperature integrators (FDA, 2002) Any one hurdle, or a combination of several, may be used to control pathogenic
outgrowth.
It is important to note that the motivation of the recent FDA alerts was not to
control toxigenesis, but to ensure normal rapid aerobic spoilage so that toxigenesis does
not precede organoleptic spoilage.
Potential Weakness in FDA’s OTR Specification
FDA’s specific interpretation of ROP covers all unfrozen seafood in any
hermetically sealed package with oxygen transmission rate less than 10,000 cc/m2/day.
This results in different absolute oxygen transmission rates in terms of cc O2/package/day
for packages with different films areas. A question arises as to whether an improved
regulation based on whole package area (cc/package/day) might provide better safety for
ROP fish. Such a specification would extend the flexibility of packaging film selection
and allow manufacturers to choose any packaging film, provided that sufficient film area
is used to achieve a minimum absolute oxygen transmission rate into packages.
Research Hypothesis
The hypothesis of this study is that Clostridium sporogenes spores will germinate
and grow sooner and more robustly in packages with less film area than those with more

7
film area for any given film. To test this hypothesis a design of experiments were
conducted in two parts in this project with the following specific objectives :
Part I objectives (addressed in Chapter 2) were to
• Determine oxygen transmission rate (OTR) of commercially available packaging films
• Study the effect of temperature and relative humidity on OTR.
Part II objectives (addressed in Chapter 3) were to measure
• Time required to observe visible colonies in inoculated regular and anaerobic (highly reduced) seafood simulating bacterial media when packaged with different areas and incubated at different temperatures.
• Dynamic oxygen profiles in package headspace and media during inoculation.
• Oxidation reduction potential of media samples prior to packaging and when visible colonies were observed.
8
CHAPTER 2 EFFECT OF TEMPERATURE AND RELATIVE HUMIDITY ON FILM
PERMEABILITY
Properly designed food packaging systems offer a means of extending shelf lives of
food products. Traditionally, packaging was viewed as a simple physical barrier against
contamination or recontamination of contained food. Plastic films are being increasingly
used in food packaging due to advantages in physical, chemical, mechanical and
economic properties over other package materials such as metals, glass and paper
(Rubino et al., 2001). With recent trends towards minimally processed foods, packaging
must play a greater role in protecting consumers from microbiological hazards associated
with foods (Brody, 2001). Shelf life of products that have not undergone antimicrobial
treatment (e.g., sterilization, pasteurization, freezing) depends on initial food quality and
design of the package.
A package that results in a reduced oxygen level (less than 21%) in a sealed
package is often referred to as reduced oxygen packaging (ROP). Even when higher
levels of oxygen are used, concentrations can fall below safe levels due to
microbiological and chemical activity (Cameron et al., 1993). When oxygen levels fall
below safe levels, anaerobic conditions develop inside the package. Anaerobic conditions
favor growth of Clostridium botulinum while suppressing typical aerobic spoilage
organisms, which are responsible for the organoleptic cues of spoilage. Since consumers
rely on spoilage indications to make consumption decisions, anaerobic conditions may
allow foods to appear acceptable even though pathogens and toxins are present. This has

9
led FDA to restrict the use of ROP for certain food products. A recent example involves
types of fresh fish and other seafood products. In order to ensure typical aerobic spoilage,
FDA has set a minimum OTR level of for packaging material that may be used for fresh
fish as one approach for protecting consumers from botulism. FDA’s current minimum
OTR specification is stated as follows “… packaging that provides an oxygen
transmission rate of 10,000 cc/m2/ 24 hrs at 24°C (e.g. 1.5 mil polyethylene) can be
regarded as an oxygen-permeable packaging material for fishery products” ( FDA 2002 )
Small errors in permeability can cause significant deviation between the predicted
and the actual oxygen levels in packages (Cameron et al., 1995). Since there are very
little data published for permeation of gases through various films (Mapes et al., 1994)
direct comparisons between reported permeabilities can vary widely, and this has led to
the need for greater availability of permeability data, particularly as a function of
temperature (Doyon et al., 1991).
The aim of this work was to study how OTR varies with temperature and relative
humidity for several commercially available packaging films that might be considered to
be used to package fresh fish. Measurements of OTR are reported for four films obtained
from three different packaging film suppliers. These films were selected based upon their
oxygen transmission rates relative to the FDA specification and were considered as high,
medium and low oxygen transmitters.
Materials and Method
Films tested are identified in Table 1. and consisted of C60 and C75 (Dupont
Wilmington, Delaware - Dupont’s Clysar division was purchased by Bemis Corporation
on August 1, 2002), AET (Applied Extrusion Technologies, Inc., Atlanta, Georgia) and

10
BDF (Cryovac-Sealed Air Corporation ,Duncan, South Carolina). The thickness was
measured using a micrometer.
Table 2-1. Film description Name Type of Film Description C60 High Transmission Clysar 60 HPGF C75 High Transmission Clysar 75 HPGF AET Medium Transmission AET PST2-060 BDF Low Transmission BDF 1000
Oxygen transmission rate (OTR) was measured using a two-cell Oxtran 2/20
(Mocon Controls Inc, Minneapolis) as shown in Figure 2-1
Figure 2-1. Mocon Oxtran 2/20
The test gas was 96% nitrogen and 4% hydrogen. Oxygen (100%) was applied to
the opposite side of the film sample. Films were cut using a razor knife and stainless steel
template that provided a film area for testing of 100 cm2 (Figure 2-2).
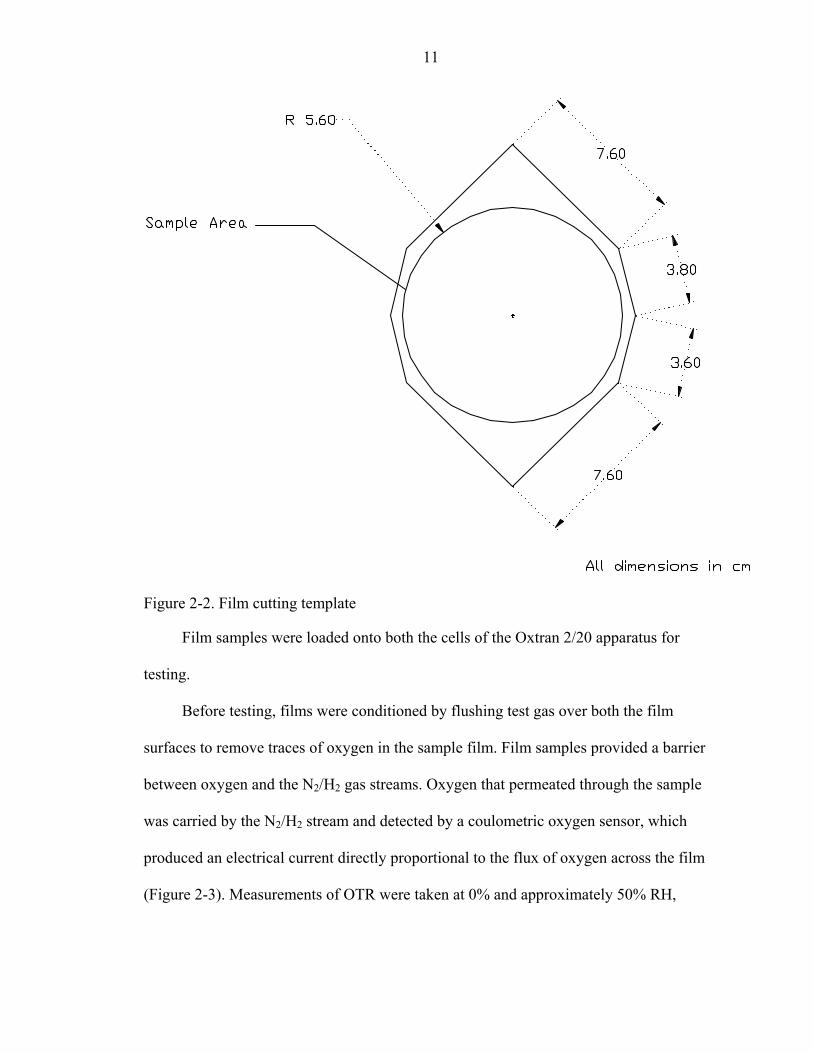
11
Figure 2-2. Film cutting template
Film samples were loaded onto both the cells of the Oxtran 2/20 apparatus for
testing.
Before testing, films were conditioned by flushing test gas over both the film
surfaces to remove traces of oxygen in the sample film. Film samples provided a barrier
between oxygen and the N2/H2 gas streams. Oxygen that permeated through the sample
was carried by the N2/H2 stream and detected by a coulometric oxygen sensor, which
produced an electrical current directly proportional to the flux of oxygen across the film
(Figure 2-3). Measurements of OTR were taken at 0% and approximately 50% RH,
12
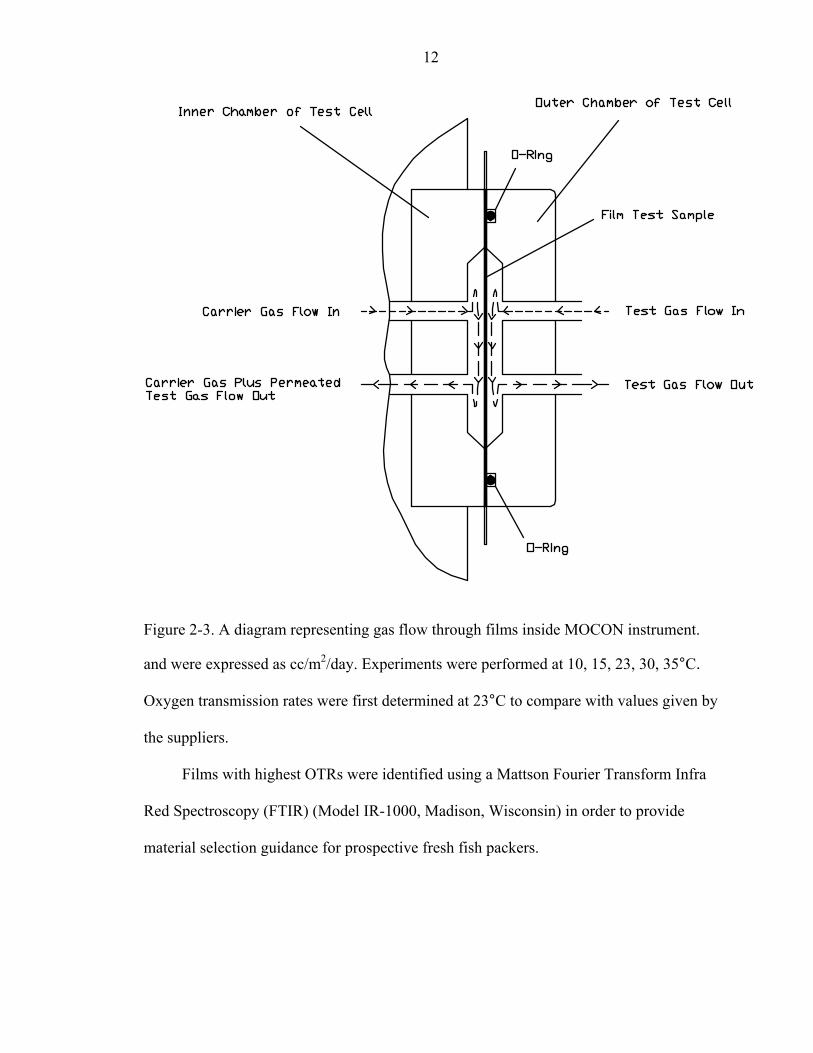
Figure 2-3. A diagram representing gas flow through films inside MOCON instrument.
and were expressed as cc/m2/day. Experiments were performed at 10, 15, 23, 30, 35°C.
Oxygen transmission rates were first determined at 23°C to compare with values given by
the suppliers.
Films with highest OTRs were identified using a Mattson Fourier Transform Infra
Red Spectroscopy (FTIR) (Model IR-1000, Madison, Wisconsin) in order to provide
material selection guidance for prospective fresh fish packers.
13
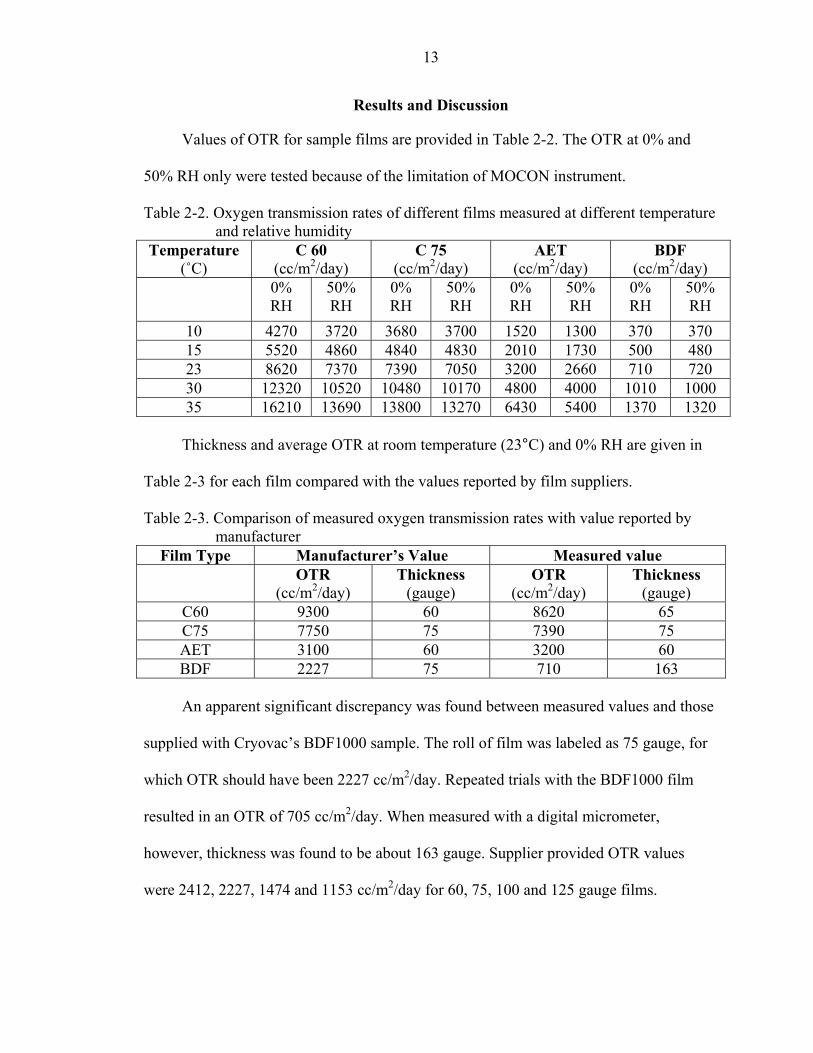
Results and Discussion
Values of OTR for sample films are provided in Table 2-2. The OTR at 0% and
50% RH only were tested because of the limitation of MOCON instrument.
Table 2-2. Oxygen transmission rates of different films measured at different temperature and relative humidity
Temperature (˚C)
C 60 (cc/m2/day)
C 75 (cc/m2/day)
AET (cc/m2/day)
BDF (cc/m2/day)
0% RH
50% RH
0% RH
50% RH
0% RH
50% RH
0% RH
50% RH
10 4270 3720 3680 3700 1520 1300 370 370 15 5520 4860 4840 4830 2010 1730 500 480 23 8620 7370 7390 7050 3200 2660 710 720 30 12320 10520 10480 10170 4800 4000 1010 1000 35 16210 13690 13800 13270 6430 5400 1370 1320
Thickness and average OTR at room temperature (23°C) and 0% RH are given in
Table 2-3 for each film compared with the values reported by film suppliers.
Table 2-3. Comparison of measured oxygen transmission rates with value reported by manufacturer
Film Type Manufacturer’s Value Measured value OTR
(cc/m2/day) Thickness
(gauge) OTR
(cc/m2/day) Thickness
(gauge) C60 9300 60 8620 65 C75 7750 75 7390 75 AET 3100 60 3200 60 BDF 2227 75 710 163
An apparent significant discrepancy was found between measured values and those
supplied with Cryovac’s BDF1000 sample. The roll of film was labeled as 75 gauge, for
which OTR should have been 2227 cc/m2/day. Repeated trials with the BDF1000 film
resulted in an OTR of 705 cc/m2/day. When measured with a digital micrometer,
however, thickness was found to be about 163 gauge. Supplier provided OTR values
were 2412, 2227, 1474 and 1153 cc/m2/day for 60, 75, 100 and 125 gauge films.

14
Extrapolating this trend to 163 gauge provides a value of 716, which matches closely to
the measured value.
Results show that none of the films tested satisfy the FDA’s film OTR specification
for fresh fish packaging (10,000 cc/m2/24 hrs). Additionally, OTR values were not
significantly altered by increased relative humidity at lower temperatures which are
normally used for seafood storage as shown in Figure 2-4.
0
2000
4000
6000
8000
10000
12000
14000
16000
18000
0 5 10 15 20 25 30 35 40
Temperature (degree C)
OT
R(c
c/m
2 /day
)
0% RH
50% RH
Figure 2-4. Comparison of 0% and 50% RH of C60
A plot of the logarithm of OTR versus inverse absolute temperature gives a straight
line suggesting that Arrhenius relationships shown in Figures 2-5 and 2-6. At 50% RH
Film 1 and Film 2 have similar OTR.
Oxygen transmission rate increases with temperature as expected. It is possible to
express permeation, OTR, as a function of temperature by the following Arrhenius
expression:
=
RTE
kOTR aexp0 2.1

15
where OTR is Oxygen Transmission Rate in cc/m2/day, k0 is the Arrhenius pre-
exponential factor in cc/m2/day, Ea is Arrhenius activation energy in J/mol, R is the Ideal
Gas Law constant (8.314 J/mol/K), and T is absolute temperature in Kelvin (K).
Equation (1) may be used to estimate OTR at a specific temperature. Values for Ea and k0
are tabulated in Tables 4 and 5 for 0% and 50% RH, respectively.
100
1000
10000
100000
0.0032 0.00325 0.0033 0.00335 0.0034 0.00345 0.0035 0.00355
1/Temperature (K)
OT
R (c
c/m
2 /day
)
C60
C75
AET
BDF
Figure 2-5. Arrhenius relationship between OTR and temperature at 0% RH
100
1000
10000
100000
0.0032 0.00325 0.0033 0.00335 0.0034 0.00345 0.0035 0.00355
1/Temperature (K)
OT
R(c
c/m
2 /day
)
C60
C75
AET
BDF
Figure 2-6. Arrhenius relationship between OTR and temperature at 50% RH

16
Table 2-4. Ea and k0 values for Arrhenius relationship between OTR and temperature for the packaging films at 0% RH
Sample
k0 (cc/m2/day)
Ea (kJ/mol)
R2
C60
6.00E+10 38.70 0.999
C75
4.00E+10 38.20 0.995
AET
8.00E+10 41.90 0.999
BDF
2.00E+10 36.70 0.993
Table 2-5. Ea and k0 values for Arrhenius relationship between OTR and temperature for
the packaging films at 50% RH Sample k0
(cc/m2/day)
Ea (kJ/mol)
R2
C60
3.00E+10 37.60 0.999
C75
2.00E+10 36.70 0.997
AET
5.00E+10 41.10 0.998
BDF
2.00E+09 36.50 0.998
Analysis of FTIR was performed for the Clysar films because they were closest to
the FDA OTR specification. Identification of these materials should be helpful in
selecting the potential candidates for seafood packaging. Results of FTIR showed that
these films were essentially thin gauge polyethylene (PE). Sample FTIR spectra are
compared with a library of spectra for known standards (Figure 2-7). Note that, AET
PST2-060 is oriented polypropylene film with inner sealable side, and BDF1000 is
multilayered co-extruded film with external polypropylene layers.

17
0
400
050010001500200025003000350040004500
Wavenumbers
Rel
ativ
e A
bsor
banc
e
Signature Spectrum of LDPE
C60
C75
Figure 2-7. Comparison of PE, C60 and C75 FTIR spectra

18
CHAPTER 3 EFFECT OF FILM OTR, PACKAGE AREA AND TEMPERATURE ON
CLOSTRIDIUM SPOROGENES SPORE OUTGROWTH
In modified atmosphere packaging of fresh and minimally processed foods, oxygen
is often intentionally reduced to decrease enzymatic, biochemical and aerobic
microbiological activities. This method of packaging is called reduced oxygen package
(ROP) an FDA term for a package that has a potential to result in oxygen levels below
21%. ROP provides an environment that contains little or no oxygen, offers unique
advantages such as increase in shelf life, improved handling and reduced weight lose.
However, there may be marked increase in safety concerns with some foods, particularly
with ROP fresh fish. Studies have demonstrated that formation of type E botulinum toxin
prior to organoleptic spoilage at mildly abusive temperatures is possible, thus making the
seafood product unfit for consumption (Dufresne et al., 2000; Post et al., 1985; Reddy et
al., 1996, 1997a, 1997b). To mitigate this problem FDA considers a package that
provides an oxygen transmission rate of 10,000 cc/m2/day at 24˚C as acceptable for
packaging seafood products (FDA, 2002). However, this specification does not take into
consideration the design of the package. It is suspected that a regulation that combines
film OTR with descriptive parameters of the package, such as film area, may offer a
better regulatory alternative and an ease in choosing packaging material by the seafood
manufacturers.
Studies show that residual oxygen plays a key role in food quality and shelf life
determination (Tewari et al., 1999). Oxygen profiles indicate change in quality of
19
products and also the packaging film’s quality. Non-destructive monitoring of oxygen
profiles inside the package and food product has remained a difficult and expensive
objective (Johnson, 1997). Optical sensor approach offers a realistic alternative and a
number of methods of optical oxygen sensing have been described in recent years
(Fitzgerald, 2001). Research shows that C. botulinum is an obligate anaerobe, it remains
unclear if a particular concentration of oxygen is capable of preventing toxigenesis. So
luminescence-based oxygen sensor was used for destructive oxygen measurement for this
study.
Measurement of oxidation reduction (Eh) potential (redox potential) could provide
information on how the background redox potential might be adjusted by addition of a
suitable oxidant or reductant as to make the substrate uncongenial to the likely microbial
contaminants while not affecting its palatability and attractiveness as a foodstuff (Brown
and Emberger 1980). In anoxic conditions, a marked fall in C. botulinum culture Eh can
accompany germination of a large spore inoculum, thereby providing conditions suitable
for multiplication of the outgrowing vegetative cells (Morris, 2000). Studies have been
conducted to see whether there can be a limiting value of redox potential to prevent the
growth of C. botulinum (Lund and Wyatt, 1984; Montville and Conway, 1982). But there
are very few data available for C. botulinum growth and toxin production where Eh has
been used as a variable (Smoot and Pierson, 1979).
Clostridium sporogenes is an obligate anaerobe but non pathogenic with similar
physiological properties to C. botulinum. Therefore, it was used as a surrogate for C.
botulinum in this study.
The objective of this work was to develop a scientific rationale for a new seafood
package OTR specification, and to study the relationships among film OTR, package area

20
and storage temperature on C.sporogenes spore outgrowth in regular and anaerobic
media.
Materials and Method
Sample Preparation
C.sporogenes (PA 3679) spores were purchased from National Food Laboratory
Inc., (Dublin, California). When spores were received, a stock solution was prepared by
diluting 10 ml of 2x10⁷ CFU/ml into 1000 ml of autoclave-sterilized, 0.15 M potassium
phosphate buffer solution at pH 7. The initial concentration for all trials was 2x10⁴
CFU/ml.
Spore Enumeration
Inoculum was treated at 80˚C for 20 mins to stimulate germination of the spores
and to prevent growth of contaminating organisms. Plates were inoculated with
concentration of 2x10³ CFU/ml by pour plate technique. Regular and highly reduced
anaerobic media was used for spore recovery. Regular media was prepared with 24 g of
dehydrated brain heart infusion (Fisher Scientific, Springfield, New Jersey) and 10 grams
of Difco Bacto Agar (Fisher Scientific, Springfield, New Jersey) in 700 ml of 0.15 M
potassium phosphate buffer solution to maintain pH of 7.0. Anaerobic agar was prepared
by boiling 40.6 grams of anaerobic agar (Scientific, Springfield, New Jersey) in 700 ml
of distilled water. The media ingredients were transferred to a Teflon bottle (Nalgene
Nunc International, Rochester, New York) and autoclave sterilized along with test tubes
and pipette tips. Twenty-eight plates were prepared by aseptic pour plate technique for
each set of experiments.
Film Samples
21
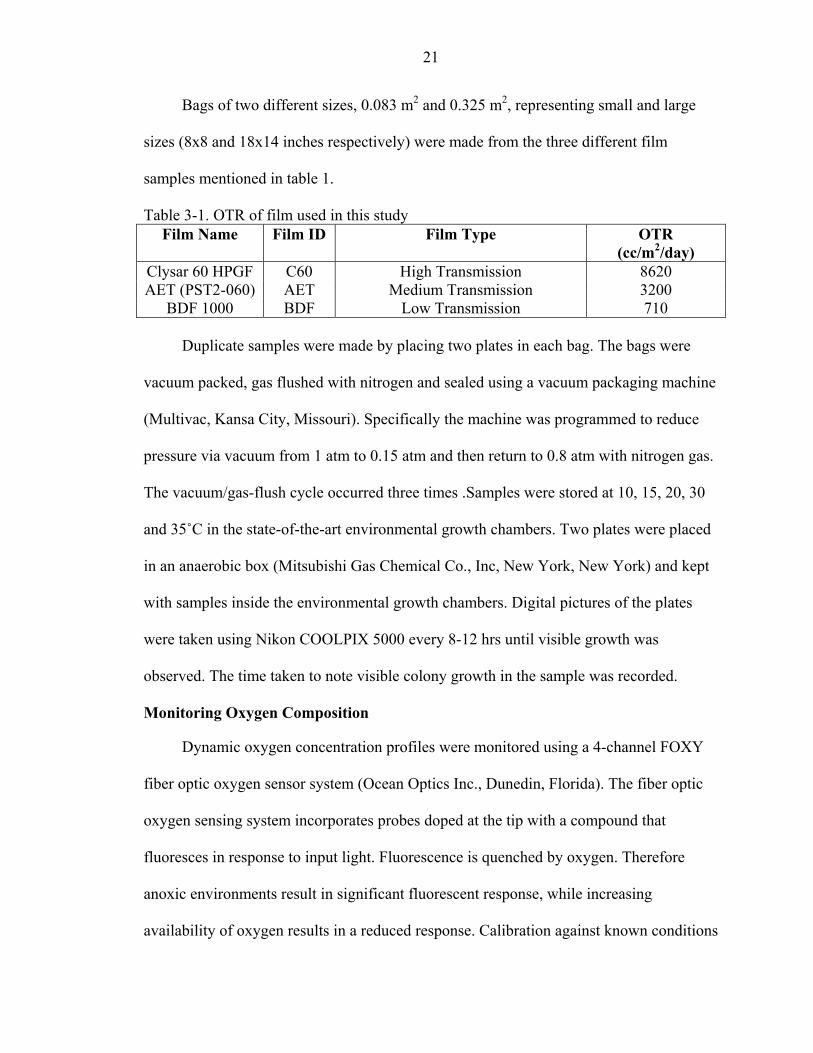
Bags of two different sizes, 0.083 m2 and 0.325 m2, representing small and large
sizes (8x8 and 18x14 inches respectively) were made from the three different film
samples mentioned in table 1.
Table 3-1. OTR of film used in this study Film Name Film ID Film Type OTR
(cc/m2/day) Clysar 60 HPGF C60 High Transmission 8620 AET (PST2-060) AET Medium Transmission 3200
BDF 1000 BDF Low Transmission 710
Duplicate samples were made by placing two plates in each bag. The bags were
vacuum packed, gas flushed with nitrogen and sealed using a vacuum packaging machine
(Multivac, Kansa City, Missouri). Specifically the machine was programmed to reduce
pressure via vacuum from 1 atm to 0.15 atm and then return to 0.8 atm with nitrogen gas.
The vacuum/gas-flush cycle occurred three times .Samples were stored at 10, 15, 20, 30
and 35˚C in the state-of-the-art environmental growth chambers. Two plates were placed
in an anaerobic box (Mitsubishi Gas Chemical Co., Inc, New York, New York) and kept
with samples inside the environmental growth chambers. Digital pictures of the plates
were taken using Nikon COOLPIX 5000 every 8-12 hrs until visible growth was
observed. The time taken to note visible colony growth in the sample was recorded.
Monitoring Oxygen Composition
Dynamic oxygen concentration profiles were monitored using a 4-channel FOXY
fiber optic oxygen sensor system (Ocean Optics Inc., Dunedin, Florida). The fiber optic
oxygen sensing system incorporates probes doped at the tip with a compound that
fluoresces in response to input light. Fluorescence is quenched by oxygen. Therefore
anoxic environments result in significant fluorescent response, while increasing
availability of oxygen results in a reduced response. Calibration against known conditions

22
provides a means to measure gaseous and dissolved oxygen in samples. A FOXY 18-G
fiber optic oxygen probe was inserted inside the bag and dynamic oxygen concentration
in packaged media and headspace was monitored continuously.
Figure 3-1. Sample of bag sizes used for the experiment
Figure 3-2. Rack arrangement inside the chamber
23
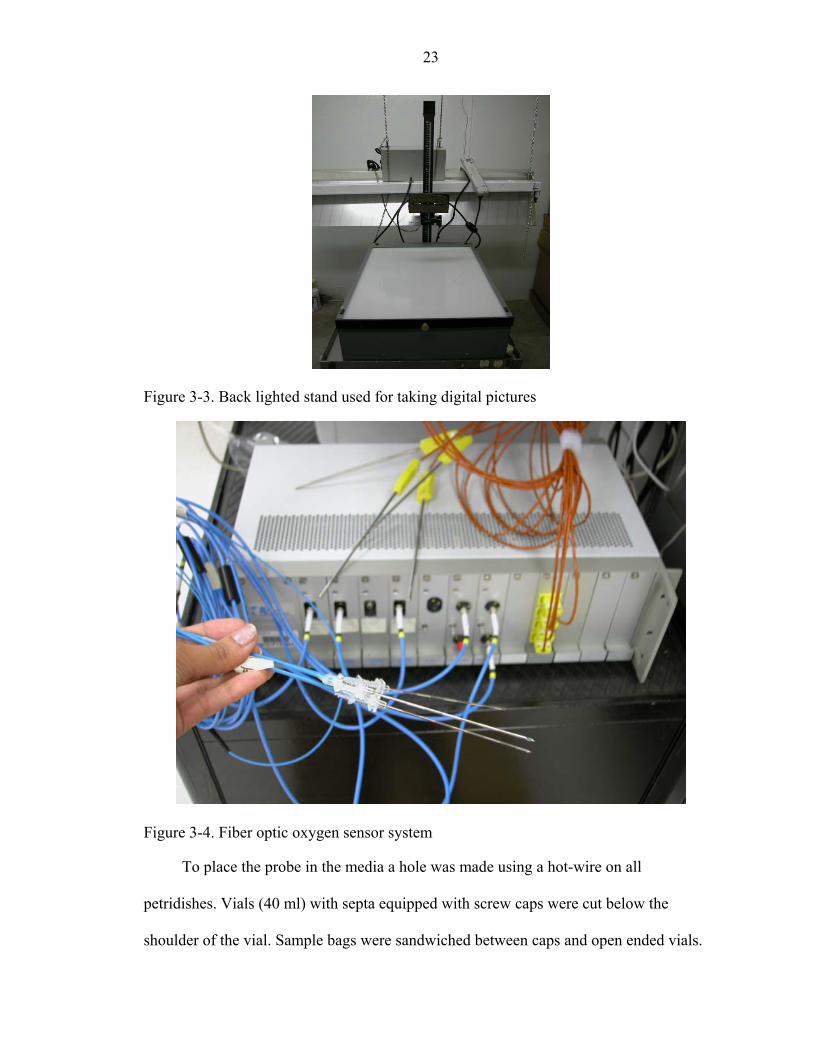
Figure 3-3. Back lighted stand used for taking digital pictures
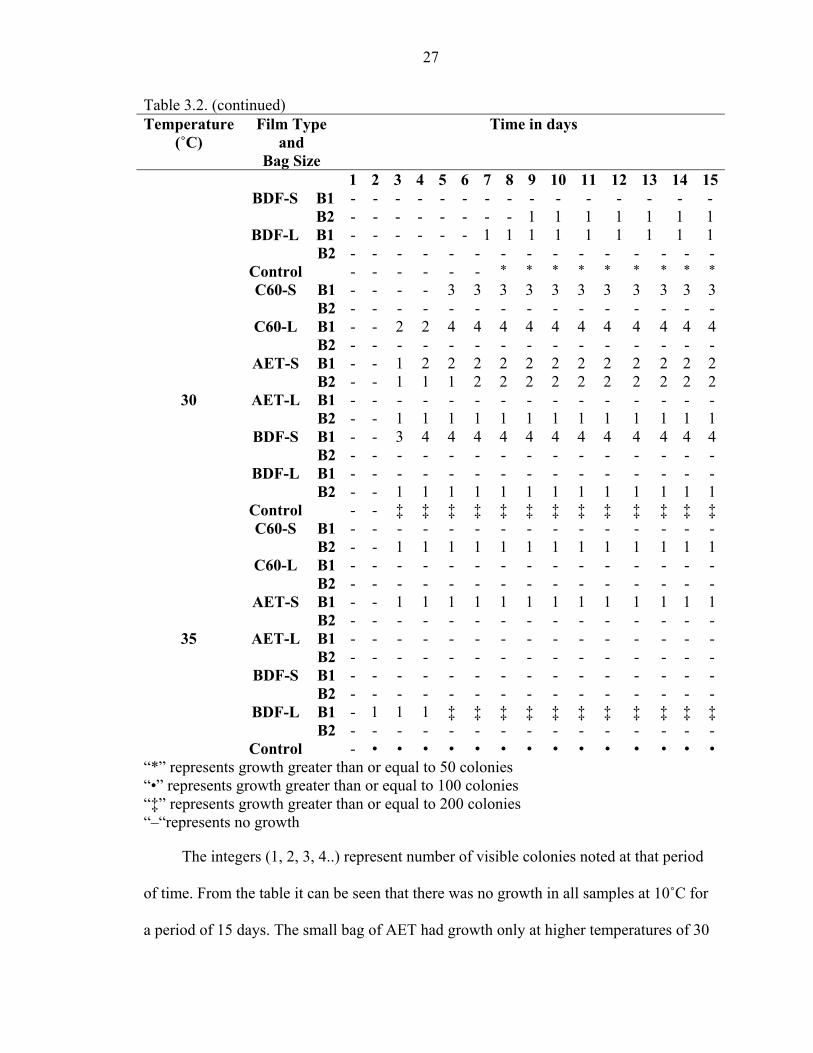
Figure 3-4. Fiber optic oxygen sensor system
To place the probe in the media a hole was made using a hot-wire on all
petridishes. Vials (40 ml) with septa equipped with screw caps were cut below the
shoulder of the vial. Sample bags were sandwiched between caps and open ended vials.

24
Oxygen profile was monitored in the high barrier (BDF) and low barrier (C60) small size
bags (Figure 3-5).
Figure 3-5. Oxygen sampling inside the bag
Oxidation Reduction Potential
Oxidation Reduction Potential of the anaerobic media was measured in millivolts
before and after incubation using Accumet 13-620-81 combination ORP probe (Fisher
Scientific, Springfield, New Jersey). The ORP of a sample is measured by comparing the
electrical potential between an inert electrode (typically platinum) that is in intimate
contact with the sample, and a reference electrode with a known potential versus the ideal
standard hydrogen electrode (“SHE”). The silver-silver chloride reference electrode is
one of the most commonly used reference electrodes due to its ease of manufacture and
its useful temperature range. The electrode is a silver wire coated with a thin layer of
silver chloride that is deposited either by electroplating or by dipping the wire in molten
silver chloride. The ORP value was measured within 24 hrs of visible growth under a
nitrogen blanket. Calibration of the ORP probe was performed in pH 4 potassium acid
phthalate standard buffer solution and pH 7 potassium and sodium phosphate standard
Headspace O2 probe
Anaerobic Media
Dissolved O2 probe
Cut Vial
Cap Septum
Sample bag

25
buffer solution (Sensorex, Garden Grove, California). Both buffer solutions were
saturated with quinhydrone at 25˚C. Simultaneously, pH of the media at the end of the
experiment was also measured. The ORP probe and pH probe were standardized before
each set of experiments to ensure accuracy and consistency of the measuring system.
Figure 3-6. Equipment used to measure ORP and pH
Measured ORP values were adjusted to pH 7.0 to eliminate the effect of pH on Eh
by use of equation 3.1 (George et al., 1998).
Eh7 = Eobs + Eref + 2.303 (RT/F) (pHX – 7.0) 3.1
Where Eobs is the measured potential of the system, Eref is the reference electrode
potential of the internal electrolyte (saturated KCl silver/silver chloride) of the electrode
and equals 199 mV, 2.303 (RT/F) is the Nernst potential equaled to 59.1 mV at 25˚C and
pHX is the measured pH of the system.
Results and Discussion
Time taken for spore outgrowth in regular and highly reduced anaerobic media in
different bags over a period of 15 days in temperatures 10, 15, 20, 30 and 35˚C is

26
tabulated in tables 3-2 and 3-3. Different bag sizes are represented as “S” denoting small
bag and “L” denoting large bag of sizes 0.083 m2 and 0.325 m2 respectively. The “B1”
and “B2” represent sample duplicates for bag 1 and bag 2, respectively.
Table 3-2. Spore outgrowth over time in regular media for various film types at various temperatures
Temperature (˚C)
Film Type and
Bag Size
Time in days
1 2 3 4 5 6 7 8 9 10 11 12 13 14 15C60-S B1 - - - - - - - - - - - - - - -
B2 - - - - - - - - - - - - - - - C60-L B1 - - - - - - - - - - - - - - -
B2 - - - - - - - - - - - - - - - AET-S B1 - - - - - - - - - - - - - - -
B2 - - - - - - - - - - - - - - - AET-L B1 - - - - - - - - - - - - - - -
B2 - - - - - - - - - - - - - - - BDF-S B1 - - - - - - - - - - - - - - -
B2 - - - - - - - - - - - - - - - BDF-L B1 - - - - - - - - - - - - - - -
B2 - - - - - - - - - - - - - - -
10
Control - - - - - - - - - - - - - - - C60-S B1 - - - - - - - - - - - - - - -
B2 - - - - - - - - - - - - - - - C60-L B1 - - - - - - - - - - - - - - -
B2 - - - - - - - - - 1 1 1 1 1 1 AET-S B1 - - - - - - - - - - - - - - -
B2 - - - - - - - - - - - - - - - AET-L B1 - - - - - 1 1 2 3 4 4 4 4 4 4
B2 - - - - - 2 2 2 2 2 2 2 2 2 2 BDF-S B1 - - - - - 1 1 1 1 1 1 1 1 1 1
B2 - - - - - - 2 2 2 2 2 2 2 2 2 BDF-L B1 - - - - - - - 1 1 1 1 1 1 1 1
B2 - - - - - 1 1 2 2 2 2 2 2 2 2
15
Control - - - - - 1 1 1 1 1 1 1 1 1 1 C60-S B1 - - - - - - - - - - - - - - -
B2 - - - - - 1 1 1 1 1 1 1 1 1 1 C60-L B1 - - - - - - - - - - - - - - -
B2 - - - - - 1 1 1 1 1 1 1 1 1 1 AET-S B1 - - - - - - - - - - - - - - -
B2 - - - - - - - - - - - - - - - AET-L B1 - - - - - - - - - - - - - - -
20
B2 - - - - - - 1 1 1 1 1 1 1 1 1
27
Table 3.2. (continued) Temperature
(˚C) Film Type
and Bag Size
Time in days
1 2 3 4 5 6 7 8 9 10 11 12 13 14 15BDF-S B1 - - - - - - - - - - - - - - -
B2 - - - - - - - - 1 1 1 1 1 1 1
BDF-L B1 - - - - - - 1 1 1 1 1 1 1 1 1 B2 - - - - - - - - - - - - - - -
Control - - - - - - * * * * * * * * * C60-S B1 - - - - 3 3 3 3 3 3 3 3 3 3 3
B2 - - - - - - - - - - - - - - - C60-L B1 - - 2 2 4 4 4 4 4 4 4 4 4 4 4
B2 - - - - - - - - - - - - - - - AET-S B1 - - 1 2 2 2 2 2 2 2 2 2 2 2 2
B2 - - 1 1 1 2 2 2 2 2 2 2 2 2 2 AET-L B1 - - - - - - - - - - - - - - -
B2 - - 1 1 1 1 1 1 1 1 1 1 1 1 1 BDF-S B1 - - 3 4 4 4 4 4 4 4 4 4 4 4 4
B2 - - - - - - - - - - - - - - - BDF-L B1 - - - - - - - - - - - - - - -
B2 - - 1 1 1 1 1 1 1 1 1 1 1 1 1
30
Control - - ‡ ‡ ‡ ‡ ‡ ‡ ‡ ‡ ‡ ‡ ‡ ‡ ‡ C60-S B1 - - - - - - - - - - - - - - -
B2 - - 1 1 1 1 1 1 1 1 1 1 1 1 1 C60-L B1 - - - - - - - - - - - - - - -
B2 - - - - - - - - - - - - - - - AET-S B1 - - 1 1 1 1 1 1 1 1 1 1 1 1 1
B2 - - - - - - - - - - - - - - - AET-L B1 - - - - - - - - - - - - - - -
B2 - - - - - - - - - - - - - - - BDF-S B1 - - - - - - - - - - - - - - -
B2 - - - - - - - - - - - - - - - BDF-L B1 - 1 1 1 ‡ ‡ ‡ ‡ ‡ ‡ ‡ ‡ ‡ ‡ ‡
B2 - - - - - - - - - - - - - - -
35
Control - • • • • • • • • • • • • • • “*” represents growth greater than or equal to 50 colonies “•” represents growth greater than or equal to 100 colonies “‡” represents growth greater than or equal to 200 colonies “–“represents no growth
The integers (1, 2, 3, 4..) represent number of visible colonies noted at that period
of time. From the table it can be seen that there was no growth in all samples at 10˚C for
a period of 15 days. The small bag of AET had growth only at higher temperatures of 30
28
and 35˚C. A maximum number of growth in all the bags were seen at 30˚C. At 35˚C
comparatively lower growth was noticed in all bags which is because of increase in OTR
at high temperatures. There was growth in all the control plates inside the anaerobic box
at different temperatures. Maximum growth in control plates was noted at temperatures
higher than 15˚C.
Two to three days after noticing initial growth in the plates, there was no increase
in the number of colonies which represents the rise in oxygen level inside the bag that
prevents further germination of spores.
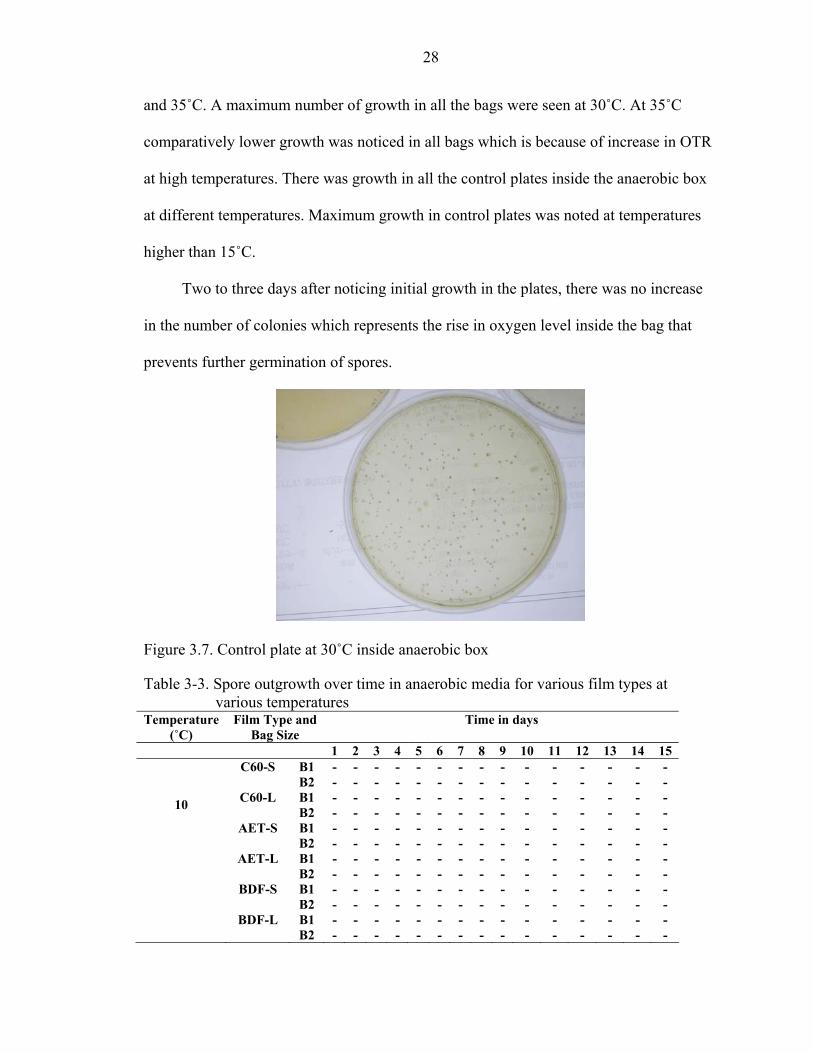
Figure 3.7. Control plate at 30˚C inside anaerobic box
Table 3-3. Spore outgrowth over time in anaerobic media for various film types at various temperatures
Temperature (˚C)
Film Type and Bag Size
Time in days
1 2 3 4 5 6 7 8 9 10 11 12 13 14 15 C60-S B1 - - - - - - - - - - - - - - -
B2 - - - - - - - - - - - - - - - C60-L B1 - - - - - - - - - - - - - - -
B2 - - - - - - - - - - - - - - - AET-S B1 - - - - - - - - - - - - - - -
10
B2 - - - - - - - - - - - - - - - AET-L B1 - - - - - - - - - - - - - - -
B2 - - - - - - - - - - - - - - - BDF-S B1 - - - - - - - - - - - - - - -
B2 - - - - - - - - - - - - - - -
BDF-L B1 - - - - - - - - - - - - - - - B2 - - - - - - - - - - - - - - -

29
Table 3.3. (continued) Temperature
(˚C) Film Type and
Bag Size Time in days
1 2 3 4 5 6 7 8 9 10 11 12 13 14 15 C60-S B1 - - - - - - - - - - - - - - -
B2 - - - - - - - - - - - - - - - C60-L B1 - - - - - - - - - - - - - - -
B2 - - - - - - - - - - - - - - - AET-S B1 - - - - - - - - - - - - - - -
B2 - - - - - - - - - - - - - - - AET-L B1 - - - - - - - - - - - - - - -
B2 - - - - - - - - - - - - - - - BDF-S B1 - - - - - - - - - - - - - - -
B2 - - - - - - - - - - - - - - - BDF-L B1 - - - - - - - - - - - - - - -
15
B2 - - - - - - - - - - - - - - - C60-S B1 - - - - -
B2 - - - - - C60-L B1 - - - - -
B2 - - - 2 3 AET-S B1 - - - 4 4
B2 - - - - - AET-L B1 - - - ‡ ‡
B2 - - - • • BDF-S B1 - - - ‡ ‡
B2 - - - • • BDF-L B1 - - - ‡ ‡
23
B2 - - - ‡ ‡ C60-S B1 - - * *
B2 - - 4 8 C60-L B1 - - * *
B2 - - 6 13 AET-S B1 - - ‡ ‡
B2 - - 7 11 AET-L B1 - - ‡ ‡
30
B2 - - ‡ ‡ BDF-S B1 - - ‡ ‡
B2 - - ‡ ‡ BDF-L B1 - - ‡ ‡
B2 - - ‡ ‡ C60-S B1 - • •
B2 - • • C60-L B1 - ‡ ‡ 35
B2 - ‡ ‡ AET-S B1 - ‡ ‡
B2 - ‡ ‡ AET-L B1 - ‡ ‡
B2 - ‡ ‡ BDF-S B1 - ‡ ‡
B2 - ‡ ‡ BDF-L B1 - ‡ ‡
B2 - ‡ ‡ “*” represents growth greater than or equal to 100 “•” represents growth greater than or equal to 500 “‡” represents growth greater than or equal to 1000 “–“ represents no growth

30
Unlike the control plates of regular media, surprisingly there was no growth noticed
in control plates of anaerobic media even though they had an ideal anaerobic
environment and low ORP value to germinate. There was no growth noted in 10 and
15˚C. Compared to regular media, growth was faster in highly reduced anaerobic media.
A gradual increase in the amount of colonies as the temperature increased was obvious.
As expected, time taken to observe growth increased as the temperature decreased.
Oxidation reduction potentials were measured within 24 hours of growth and
values are tabulated below after elimination of pH effect (Table 3-4). Initial redox
potential of anaerobic media before inoculation was measured to be 137 mV.
Table 3-4. Oxidation reduction potential of highly reduced anaerobic media in bags of various film types at different temperatures
Temperature Film Type ORP Time taken for Visible Growth (˚C) (mV) (Days)
S L S L Bag 1 332.8 266.0 - - C60 Bag 2 322.0 259.4 - - Bag 1 266.6 262.2 - - AET Bag 2 300.6 289.8 - - Bag 1 271.3 257.8 - -
15
BDF Bag 2 260.8 252.2 - - Bag 1 222.7 239.8 - - C60 Bag 2 270.4 254.5 - 4 Bag 1 226.7 253.8 4 4 AET Bag 2 253.0 257.8 - 4 Bag 1 120.7 78.7 4 4
23
BDF Bag 2 197.1 94.0 4 4 Bag 1 177.9 177.0 3 3 C60 Bag 2 152.9 118.0 3 3 Bag 1 110.4 106.0 3 3 AET Bag 2 216.0 100.6 3 3 Bag 1 224.5 30.6 3 3
30
BDF Bag 2 251.7 20.0 3 3 Bag 1 27.4 39.7 2 2 C60 Bag 2 208.5 120.3 2 2 Bag 1 32.4 48.6 2 2 AET Bag 2 54.8 80.6 2 2 Bag 1 12.3 13.5 2 2
35
BDF Bag 2 19.9 29.7 2 2
31
There was an increase in redox potential as the temperature decreased. This is due
to more time taken for spore outgrowth at lower temperatures allowing oxygen to
permeate inside the bag and increase the ORP of the media. Oxidation reduction potential
of media in C60 bags was lower than that of media in BDF bags regardless of bag sizes.
The C60 small bag at 30˚C shows a high ORP value which was due to change in probe
position or contamination.
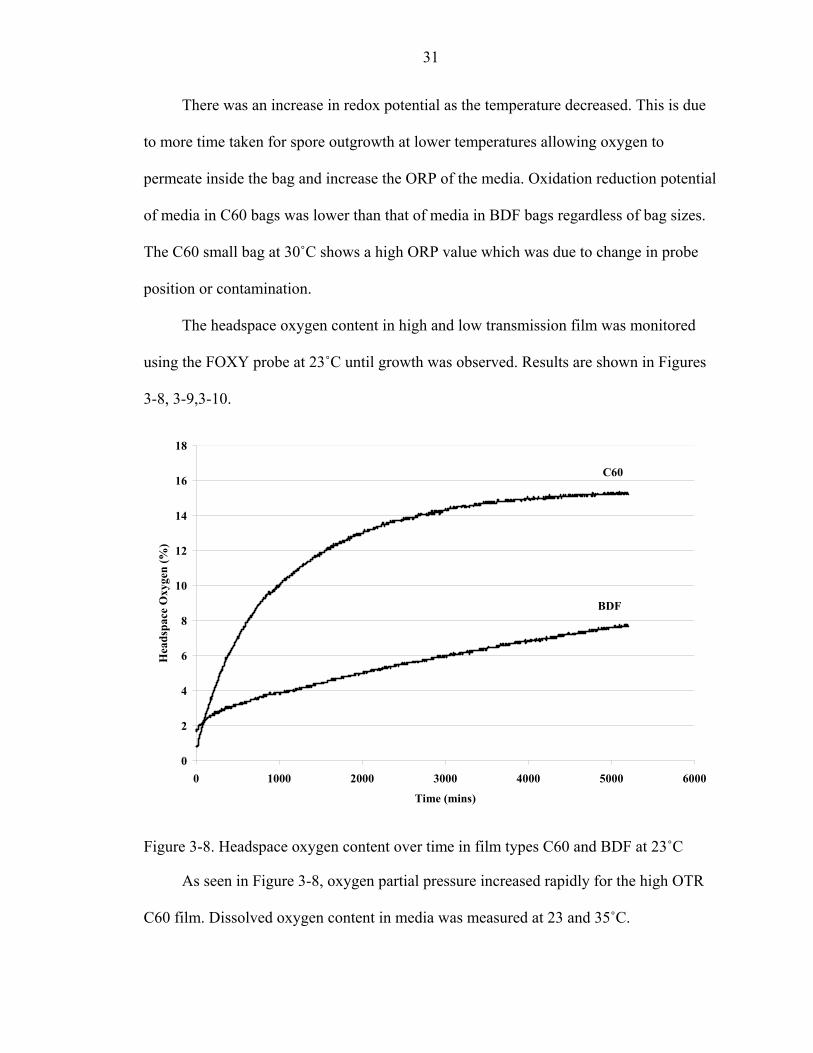
The headspace oxygen content in high and low transmission film was monitored
using the FOXY probe at 23˚C until growth was observed. Results are shown in Figures
3-8, 3-9,3-10.
0
2
4
6
8
10
12
14
16
18
0 1000 2000 3000 4000 5000 6000
Time (mins)
Hea
dspa
ce O
xyge
n (%
)
C60
BDF
Figure 3-8. Headspace oxygen content over time in film types C60 and BDF at 23˚C
As seen in Figure 3-8, oxygen partial pressure increased rapidly for the high OTR
C60 film. Dissolved oxygen content in media was measured at 23 and 35˚C.
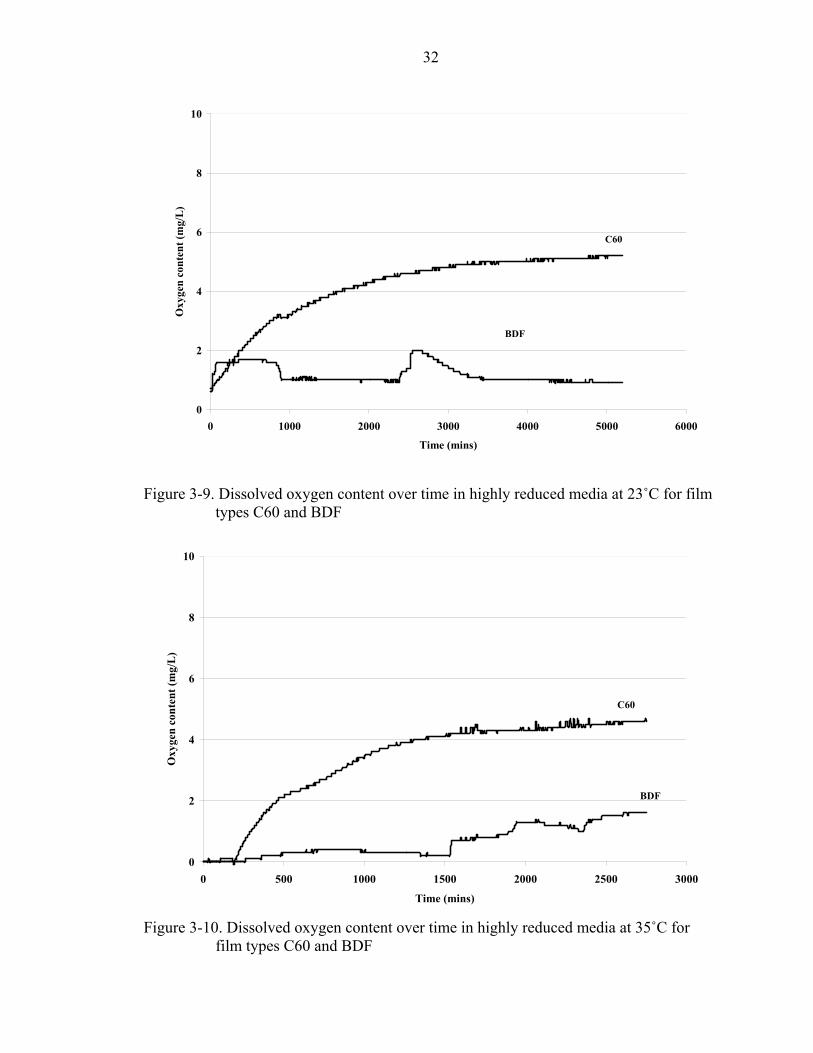
32
0
2
4
6
8
10
0 1000 2000 3000 4000 5000 6000
Time (mins)
Oxy
gen
cont
ent (
mg/
L)
C60
BDF
Figure 3-9. Dissolved oxygen content over time in highly reduced media at 23˚C for film types C60 and BDF
0
2
4
6
8
10
0 500 1000 1500 2000 2500 3000
Time (mins)
Oxy
gen
cont
ent (
mg/
L)
C60
BDF
Figure 3-10. Dissolved oxygen content over time in highly reduced media at 35˚C for
film types C60 and BDF

33
The oxygen content of the media gradually increases in C60 whereas in BDF it
follows an irregular pattern due severe growth in media.

34
CHAPTER 4 CONCLUSION AND FUTURE WORK
Conclusion
Oxygen transmission rate results obtained from MOCON Oxtran 2/20 show that
none of the films studied fully satisfy FDA’s OTR guideline of 10,000 cc/m2/day at room
temperature. Clysar 60 (~0.60 mil – polyethylene film) provided the highest OTR at
around 8600 cc/m2/day at 23°C. These results suggest that it may be difficult for
suppliers of packaged fresh fish to source a variety of acceptable packaging films.
Arrhenius parameters were provided in order to allow estimation of OTR values at
desired temperatures. The lowest temperature studied, 10°C, represented the limit of
capability for the MOCON Oxtran 2/20. However, it is expected that at least for the
Clysar (polyethylene) films, Arrhenius relationships will provide suitable OTR estimates
throughout the range important for packaged fresh fish (0 – 35°C), because no significant
latent thermal transitions exist within this extended lower temperature range (glass
transition temperature, Tg, for LDPE occurs at about -175°C).
There is not much variation in growth between small and large bags. The area of
the large bag (0.325 m2) represented the maximum size that can be sealed using available
vacuum packaging equipment. Although larger package areas might have had a
significant effect on spore outgrowth, such sizes would not be of practical value for
packaging seafood. So the research hypothesis of observing a difference in spore
outgrowth between lower and larger film area was not supported.

35
The difference in package area affected the oxidation reduction potential of highly
reduced anaerobic media at different temperatures. It was observed that as the
temperature decreased, the oxidation reduction potential increased due to the increasing
time taken for visible spore outgrowth. As expected, the headspace oxygen and dissolved
oxygen content in the media was more in C60 than BDF.
Future Work
From these experiments it is observed that redox potential and bag specification
plays a vital role in spore outgrowth. So a package design that combines oxidation
reduction potential and packaging film permeation to control growth of C. botulinum can
be developed. This methodology that combines oxidation reduction potential to dynamic
oxygen permeation might prevent C.botulinum hazard and helps in assessing package
safety.
Similarity in physiological properties between C. sporogenes and C. botulinum has
been mentioned earlier. However, C. sporogenes has a different temperature window of
15-45˚C for visible spore outgrowth, whereas C. botulinum can grow and produce toxin
at temperatures above 3.3˚C. The experimental method and data of this project can be
used to provide a basis for future experiments and clues about potential behavior of C.
botulinum.
This data should not be used by FDA for regulations on control of C. botulinum
spore outgrowth in ROP packed seafood for the above reasons.

APPENDIX A OXYGEN TRANSMISSION RATE OF PACKAGING FILMS AT DIFFERENT
TEMPERATURES AND RELATIVE HUMIDITY

37
Table A-1. OTR of packaging films at 0% RH Sample ID Cell Temperature 1/Tabs Measured OTR Ln(OTR) R^2
A 10 0.003534 3736.3 8.2258511 B 10 0.003534 3570.9 8.1805729 A 15 0.003472 4943.45 8.5058187 B 15 0.003472 4731.95 8.4620927 A 23 0.003378 7631.05 8.9399807 B 23 0.003378 7139.7 8.873426 A 30 0.0033 10867.95 9.2935734 B 30 0.0033 10080.65 9.218373 A 35 0.003247 14357.95 9.5720591
Clysar 75HPGF
B 35 0.003247 13238.8 9.4909072
0.9952
A 10 0.003534 4263.75 8.3579043 B 10 0.003534 4269.15 8.35917 A 15 0.003472 5543.75 8.6204264 B 15 0.003472 5483.15 8.609435 A 23 0.003378 8636.75 9.0637816 B 23 0.003378 8589.9 9.0583424 A 30 0.0033 12343.35 9.4208727 B 30 0.0033 12280.8 9.4157923 A 35 0.003247 16296.85 9.6987271
0.9993 Clysar 60HPGF
B 35 0.003247 16119.35 9.6877757 A 10 0.003534 1514.25 7.3226755 B 10 0.003534 1522.2 7.3279119 A 15 0.003472 1999.3 7.6005524 B 15 0.003472 2017.9 7.6098126 A 23 0.003378 3205 8.0724674 B 23 0.003378 3196.9 8.0699369 A 30 0.0033 4795.8 8.4754958 B 30 0.0033 4790.55 8.4744005 A 35 0.003247 6486.25 8.7774398
AET
B 35 0.003247 6371.4 8.7595745
0.9992
A 10 0.003534 386.95 5.9582955 B 10 0.003534 355.05 5.8722586 A 15 0.003472 503.55 6.221683 B 15 0.003472 501.05 6.2167059 A 23 0.003378 717.35 6.5755639 B 23 0.003378 690.95 6.5380675 A 30 0.0033 1013.95 6.9216089 B 30 0.0033 1005.25 6.9129915 A 35 0.003247 1364.45 7.2185067
BDF1000
B 35 0.003247 1366.1 7.2197152
0.9932

38
Table A-2. OTR of packaging films at 50% RH Sample ID Cell Temperature 1/Tabs Measured OTR Ln(OTR) R^2
A 10 0.003534 3706.45 8.2178298 B 10 0.003534 3736 8.2257708 A 15 0.003472 4844.3 8.485558 B 15 0.003472 4869.1 8.4906644 A 23 0.003378 7372.7 8.9055393 B 23 0.003378 7360.2 8.9038424 A 30 0.0033 10526.55 9.2616559 B 30 0.0033 10504.6 9.2595685 A 35 0.003247 13927.95 9.5416529
Clysar 60HPGF
B 35 0.003247 13444 9.5062882
0.999
A 10 0.003534 3636.35 8.1987357 B 10 0.003534 3774.25 8.235957 A 15 0.003472 4744.7 8.4647835 B 15 0.003472 4914.2 8.4998843 A 23 0.003378 6982.7 8.8511909 B 23 0.003378 7111 8.8693982 A 30 0.0033 10044.3 9.2147606 B 30 0.0033 10292.95 9.2392145 A 35 0.003247 13033.2 9.4752552
Clysar 75HPGF
B 35 0.003247 13511.3 9.5112817
0.997
A 10 0.003534 1293.3 7.1649524 B 10 0.003534 1303.35 7.1726932 A 15 0.003472 1708.45 7.4433418 B 15 0.003472 1742.25 7.4629327 A 23 0.003378 2649.4 7.8820885 B 23 0.003378 2668.65 7.889328 A 30 0.0033 3983.65 8.2899538 B 30 0.0033 4002.15 8.294587 35 0.003247 5387.2 8.591781
AET
35 0.003247 5406.9 8.5954312
0.998
A 10 0.003534 375.45 5.9281253 B 10 0.003534 364.55 5.8986637 A 15 0.003472 482.45 6.1788773 B 15 0.003472 475.7 6.1647874 A 23 0.003378 728.2 6.5905757 B 23 0.003378 705.35 6.5586941 A 30 0.0033 1008.6 6.9163185 B 30 0.0033 986 6.8936564 A 35 0.003247 1334 7.1959372
BDF1000
B 35 0.003247 1308.75 7.1768278
0.998

APPENDIX B DIGITAL PICTURES OF SPORE OUTGROWTH IN DIFFERENT FILMS AND BAG
SIZES
40
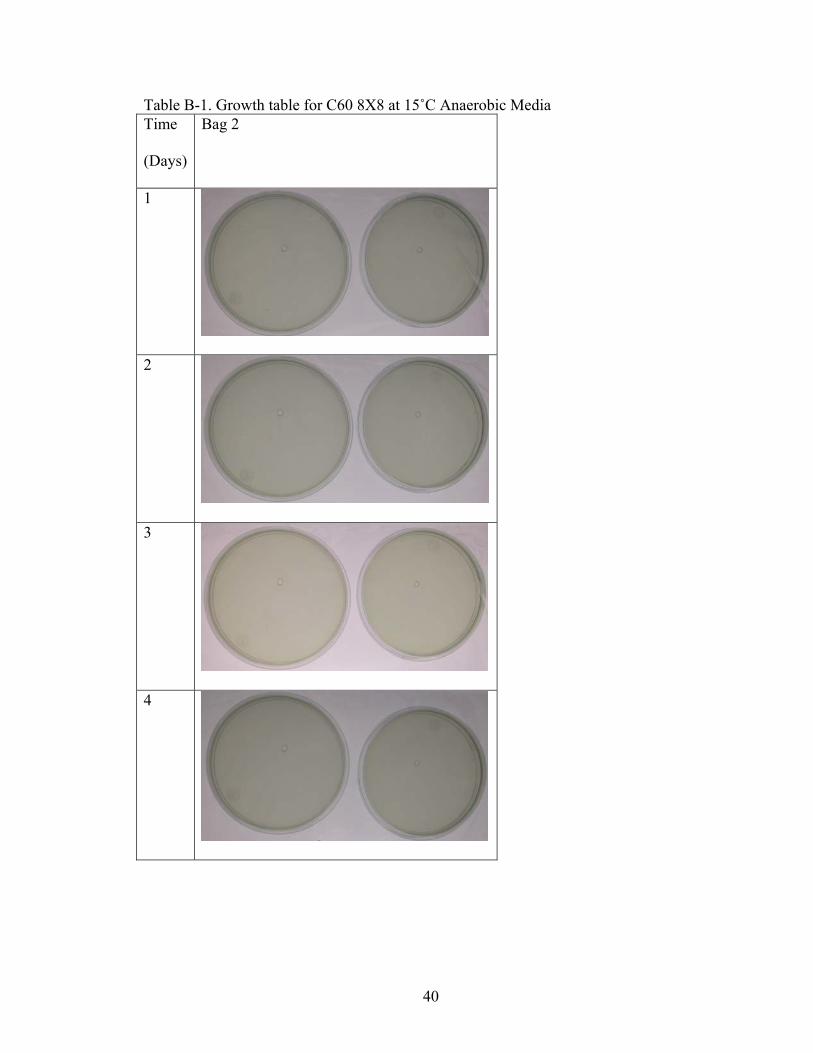
Table B-1. Growth table for C60 8X8 at 15˚C Anaerobic Media Time
(Days)
Bag 2
1
2
3
4

41
Table B-1. Continued Time
(Days)
Bag 2
5
6
7
8

42
Table B-1. Continued Time
(Days)
Bag 2
9
10
11
12

43
Table B-1. Continued Time
(Days)
Bag 2
13
14
15

44
Table B-2. Growth table for AET 8x8 at 15˚C Anaerobic Media Time (Days)
Bag 2
1
2
3
4
5
6

45
Table B-2. Continued Time (Days)
Bag 2
7
8
9
10
11
46
Table B-2. Continued Time (Days)
Bag 2
12
13
14
15

47
Table B-3. Growth table for BDF 8x8 at 15˚C Anaerobic Media Time
(Days)
Bag 2
1
2
3
4

48
Table B-3. Continued Time
(Days)
Bag 2
5
6
7
8

49
Table B-3. Continued Time
(Days)
Bag 2
9
10
11
12
50
Table B-3. Continued Time
(Days)
Bag 2
13
14
15

51
Table B-4. Growth table for C60 18X14 at 15˚C Anaerobic Media Time
(Days)
Bag 1 Bag 2
1
2
3
4

52
Table B-4. Continued Time
(Days)
Bag 1 Bag 2
5
6
7
8

53
Table B-4. Continued Time
(Days)
Bag 1 Bag 2
9
10
11
12
54
Table B-4. Continued Time
(Days)
Bag 1 Bag 2
13
14
15

55
Table B-5. Growth table for AET 18X14 at 15˚C Anaerobic Media Time
(Days)
Bag 1 Bag 2
1
2
3
4

56
Table B-5. Continued Time
(Days)
Bag 1 Bag 2
5
6
7
8
57
Table B-5. Continued Time
(Days)
Bag 1 Bag 2
9
10
11
12

58
Table B-5. Continued Time
(Days)
Bag 1 Bag 2
13
14
15
59
Table B-6. Growth table for BDF 18X14 at 15˚C Anaerobic Media Time
(Days)
Bag 1 Bag 2
1
2
3
4
5

60
Table B-6. Continued Time
(Days)
Bag 1 Bag 2
6
7
8
9
10
61
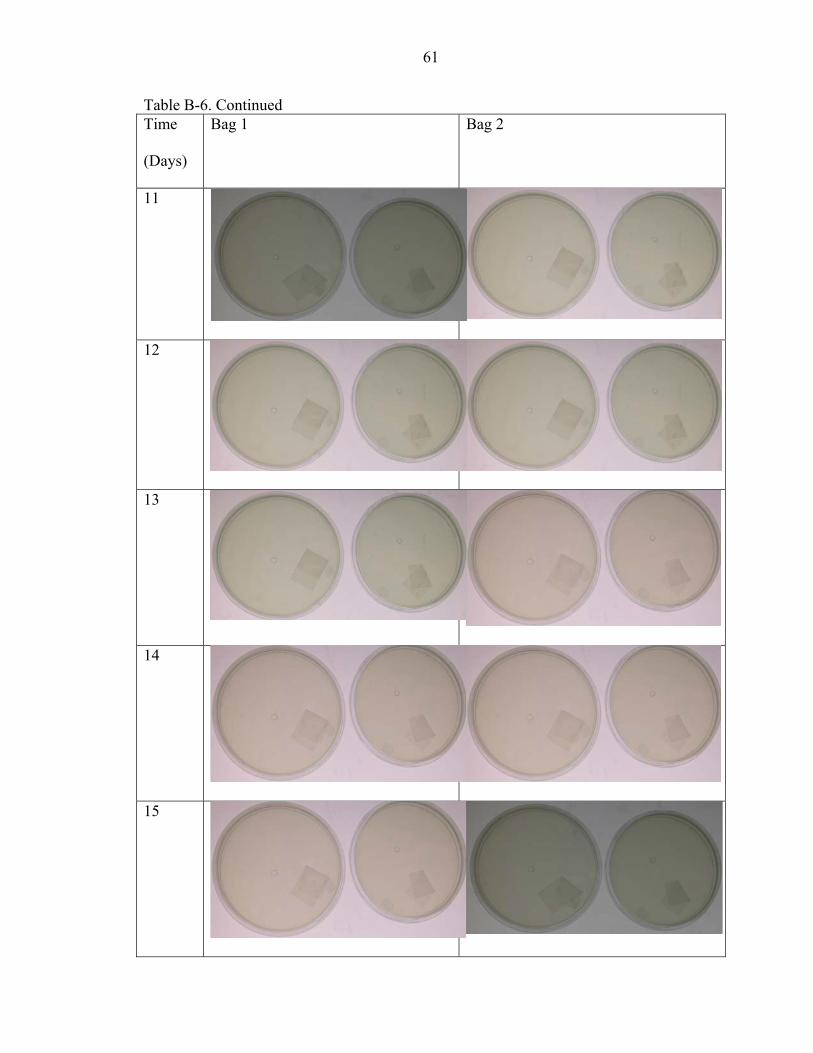
Table B-6. Continued Time
(Days)
Bag 1 Bag 2
11
12
13
14
15

62
Table B-7. Growth table for C60 8X8 at 23˚C Anaerobic Media Time (Days)
Bag 2
1
2
3
4
5

63
Table B-8. Growth table for AET 8x8 at 23˚C Anaerobic Media Time (Days)
Bag 1 Bag 2
1
2
3
4
5

64
Table B-9. Growth table for BDF 8x8 at 23˚C Anaerobic Media Time (Days)
Bag 2
1
2
3
4
5

65
Table B-10. Growth table for C60 18x14 at 23˚C Anaerobic Media Time (Days)
Bag 1 Bag 2
1
2
3
4
5
66
Table B-11. Growth table for AET 18x14 at 23˚C Anaerobic Media Time (Days)
Bag 1 Bag 2
1
2
3
4
5
67
Table B-12. Growth table for BDF 18x14 at 23˚C Anaerobic Media Time (Days)
Bag 1 Bag 2
1
2
3
4
5

68
Table B-13. Growth table for C60 8x8 at 30˚C Anaerobic Media Time (Days)
Bag 1 Bag 2
1
2
3
4

69
Table B-14. Growth table for AET 8x8 at 30˚C Anaerobic Media Time (Days)
Bag 1 Bag 2
1
2
3
4

70
Table B-15. Growth table for BDF 8x8 at 30˚C Anaerobic Media Time (Days)
Bag 1 Bag 2
1
2
3
4

71
Table B-16. Growth table for C60 18x14 at 30˚C Anaerobic Media Time (Days)
Bag 1 Bag 2
1
2
3
4
72
Table B-17. Growth table for AET 18x14 at 35˚C Anaerobic Media Time (Days)
Bag 1 Bag 2
1
2
3
4

73
Table B-18. Growth table for BDF 18x14 at 35˚C Anaerobic Media Time (Days)
Bag 1 Bag 2
1
2
3
4

74
Table B-19. Growth table for C60 8x8 at 35˚C Anaerobic Media Time (Days)
Bag 1 Bag 2
1
2
3

75
Table B-20. Growth table for AET 8x8 at 35˚C Anaerobic Media Time (Days)
Bag 1 Bag 2
1
2
3
Table B-21. Growth table for BDF 8x8 at 35˚C Anaerobic Media Time (Days)
Bag 1 Bag 2
1
2
3
76
Table B-22. Growth table for C60 18x14 at 35˚C Anaerobic Media Time (Days)
Bag 1 Bag 2
1
2
3
Table B-23. Growth table for AET 18x14 at 35˚C Anaerobic Media Time (Days)
Bag 1 Bag 2
1
2
3

77
Table B-24. Growth table for BDF 18x14 at 35˚C Anaerobic Media Time (Days)
Bag 1 Bag 2
1
2
3
78
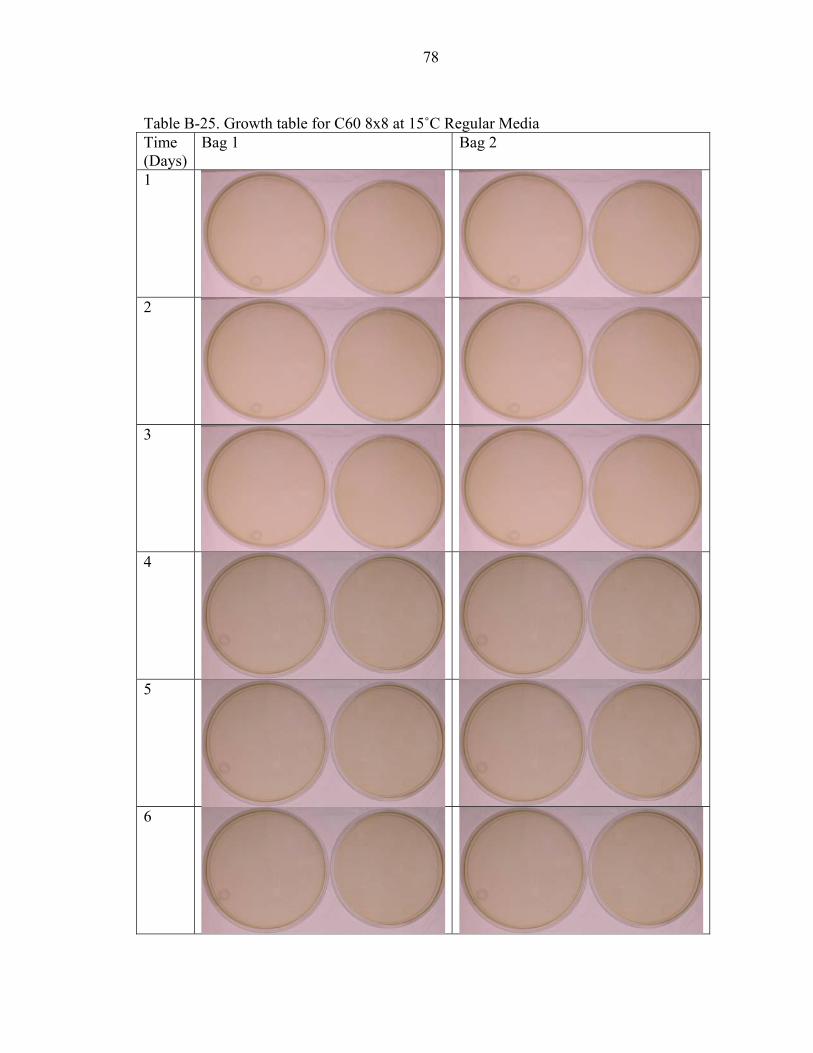
Table B-25. Growth table for C60 8x8 at 15˚C Regular Media Time (Days)
Bag 1 Bag 2
1
2
3
4
5
6

79
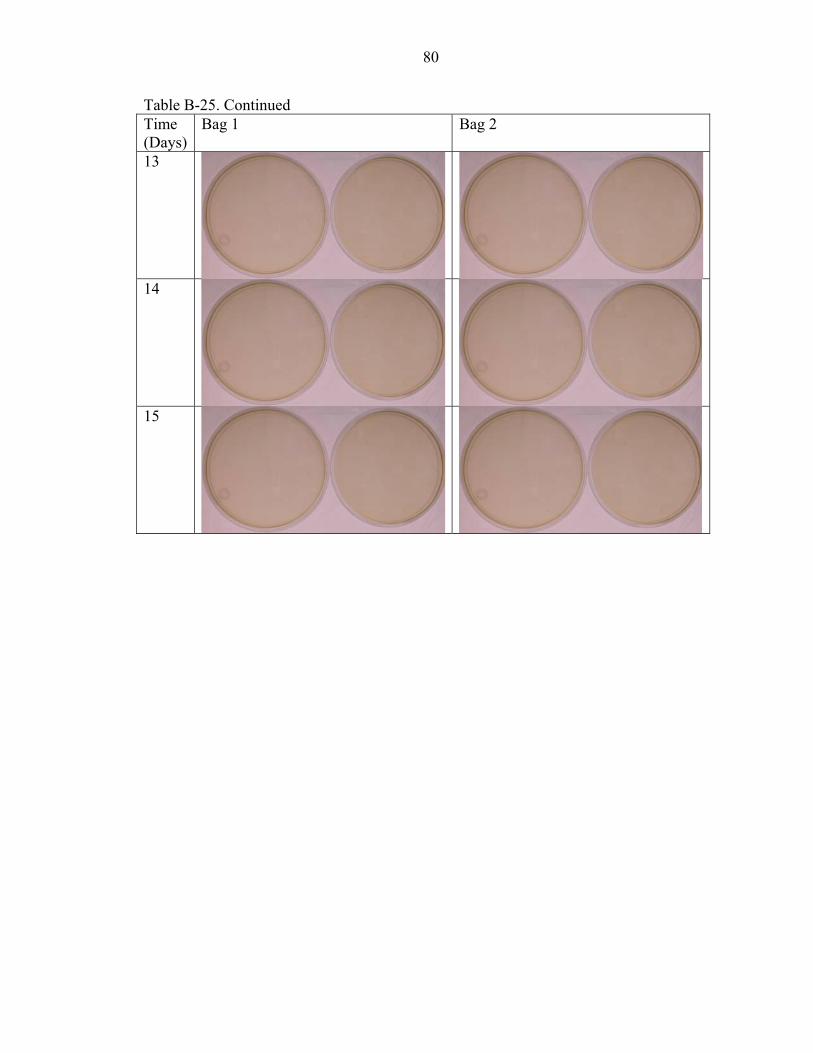
Table B-25. Continued Time (Days)
Bag 1 Bag 2
7
8
9
10
11
12
80
Table B-25. Continued Time (Days)
Bag 1 Bag 2
13
14
15

81
Table B-26. Growth table for AET 8x8 at 15˚C Regular Media Time (Days)
Bag 1 Bag 2
1
2
3
4
5
6

82
Table B-26. Continued Time (Days)
Bag 1 Bag 2
7
8
9
10
11
12

83
Table B-26. Continued Time (Days)
Bag 1 Bag 2
13
14
15

84
Table B-27. Growth table for BDF 8x8 at 15˚C Regular Media Time (Days)
Bag 1 Bag 2
1
2
3
4
5
6
85
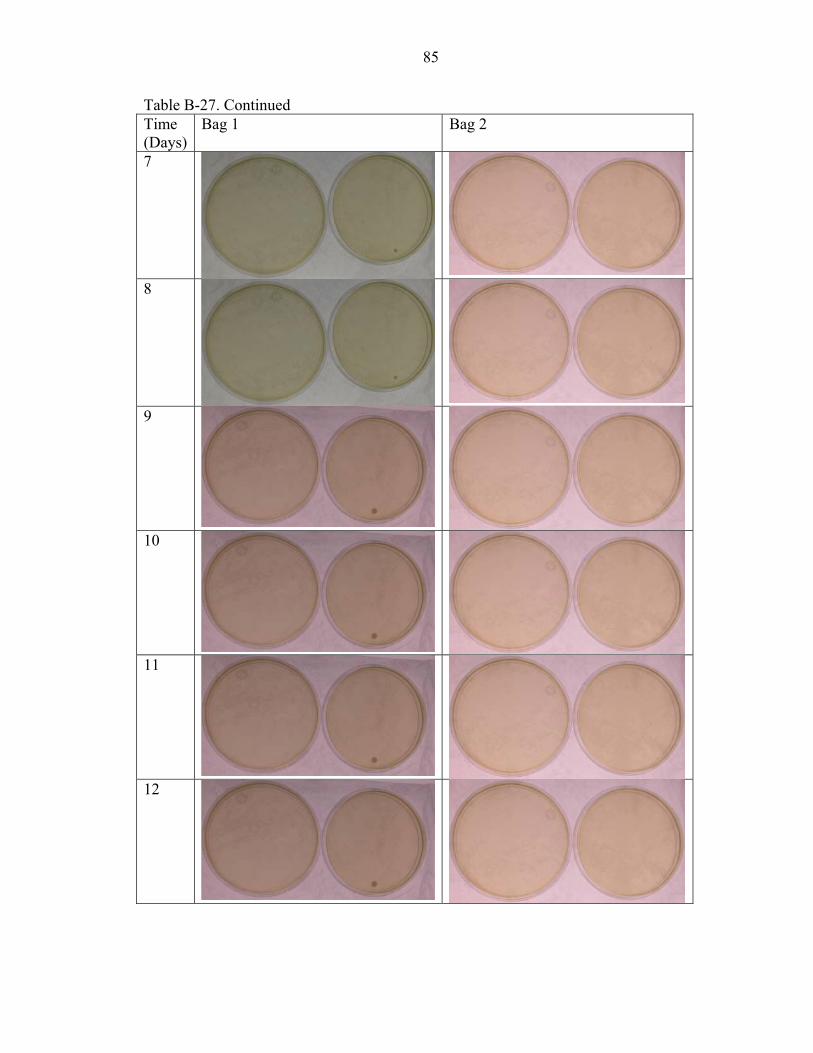
Table B-27. Continued Time (Days)
Bag 1 Bag 2
7
8
9
10
11
12
86
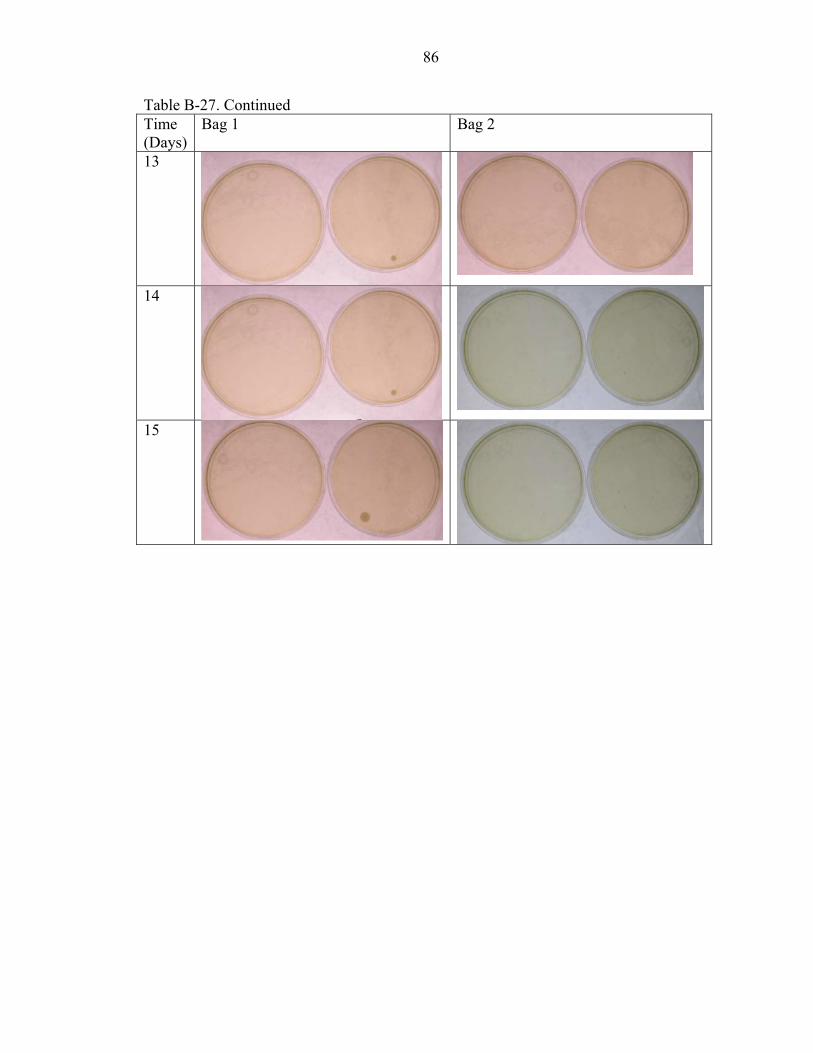
Table B-27. Continued Time (Days)
Bag 1 Bag 2
13
14
15
87
Table B-28. Growth table for C60 18x14 at 15˚C Regular Media Time (Days)
Bag 1 Bag 2
1
2
3
4
5
6

88
Table 28. Continued Time (Days)
Bag 1 Bag 2
7
8
9
10
11
12

89
Table 28. Continued Time (Days)
Bag 1 Bag 2
13
14
15

90
Table B-29. Growth table for AET 18x14 at 15˚C Regular Media Time (Days)
Bag 1 Bag 2
1
2
3
4
5
6

91
Table B-29. Continued Time (Days)
Bag 1 Bag 2
7
8
9
10
11
12

92
Table B-29. Continued Time (Days)
Bag 1 Bag 2
13
14
15

93
Table B-30. Growth table for BDF 18x14 at 15˚C Regular Media Time (Days)
Bag 1 Bag 2
1
2
3
4
5
6
94
Table B-30. Continued Time (Days)
Bag 1 Bag 2
7
8
9
10
11
12

95
Table B-30. Continued Time (Days)
Bag 1 Bag 2
13
14
15

96
Table B-31. Growth table for C60 8x8 at 20˚C Regular Media Time (Days)
Bag 1 Bag 2
1
2
3
4
5
6

97
Table B-31. Continued Time (Days)
Bag 1 Bag 2
7
8
9
10
11
12

98
Table B-31. Continued Time (Days)
Bag 1 Bag 2
13
14
15

99
Table B-32. Growth table for AET 8x8 at 20˚C Regular Media Time (Days)
Bag 1 Bag 2
1
2
3
4
5
6

100
Table B-32. Continued Time (Days)
Bag 1 Bag 2
7
8
9
10
11
12

101
Table B-32. Continued Time (Days)
Bag 1 Bag 2
13
14
15

102
Table B-33. Growth table for BDF 8x8 at 20˚C Regular Media Time (Days)
Bag 1 Bag 2
1
2
3
4
5
6

103
Table B-33. Continued Time (Days)
Bag 1 Bag 2
7
8
9
10
11
12

104
Table B-33. Continued Time (Days)
Bag 1 Bag 2
13
14
15

105
Table B-34. Growth table for C60 18x14 at 20˚C Regular Media Time (Days)
Bag 1 Bag 2
1
2
3
4
5
6

106
Table B-34. Continued Time (Days)
Bag 1 Bag 2
7
8
9
10
11
12

107
Table B-34. Continued Time (Days)
Bag 1 Bag 2
13
14
15

108
Table B-35. Growth table for AET 18x14 at 20˚C Regular Media Time (Days)
Bag 1 Bag 2
1
2
3
4
5
6
109
Table B-35. Continued Time (Days)
Bag 1 Bag 2
7
8
9
10
11
12

110
Table B-35. Continued Time (Days)
Bag 1 Bag 2
13
14
15

111
Table B-36. Growth table for BDF 18x14 at 20˚C Regular Media Time (Days)
Bag 1 Bag 2
1
2
3
4
5
6

112
Table B-36. Continued Time (Days)
Bag 1 Bag 2
7
8
9
10
11
12
113
Table B-36. Continued Time (Days)
Bag 1 Bag 2
13
14
15

114
Table B-37. Growth table for C60 8x8 at 30˚C Regular Media Time (Days)
Bag 1 Bag 2
1
2
3
4
5
6

115
Table B-37. Continued Time (Days)
Bag 1 Bag 2
7
8
9
10
11
12
116
Table B-37. Continued Time (Days)
Bag 1 Bag 2
13
14
15
117
Table B-38. Growth table for AET 8x8 at 30˚C Regular Media Time (Days)
Bag 1 Bag 2
1
2
3
4
5
6
118
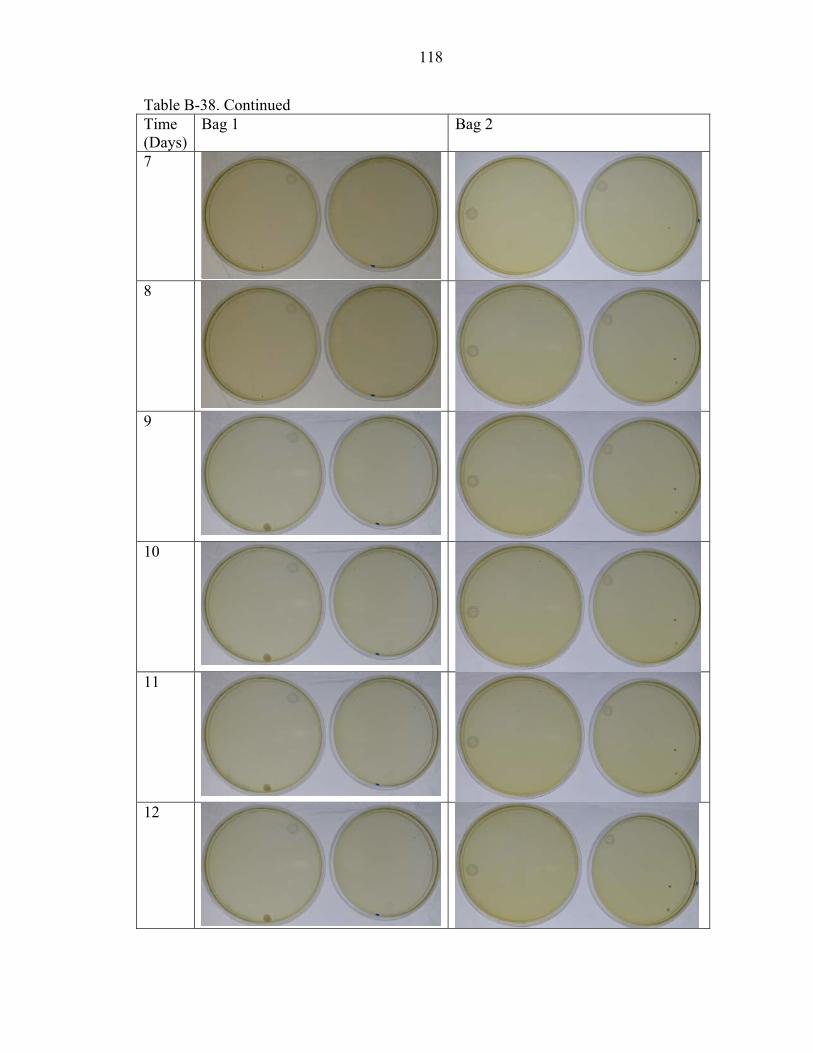
Table B-38. Continued Time (Days)
Bag 1 Bag 2
7
8
9
10
11
12

119
Table B-38. Continued Time (Days)
Bag 1 Bag 2
13
14
15
120
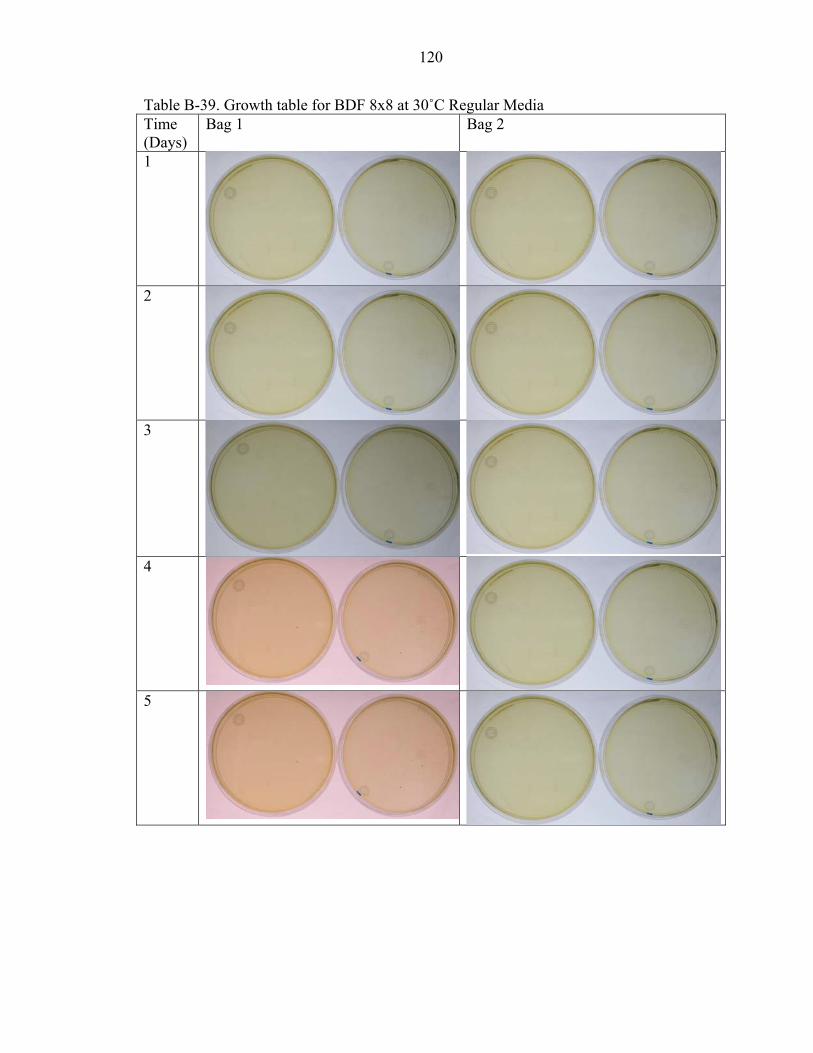
Table B-39. Growth table for BDF 8x8 at 30˚C Regular Media Time (Days)
Bag 1 Bag 2
1
2
3
4
5

121
Table B-39. Continued Time (Days)
Bag 1 Bag 2
6
7
8
9
10

122
Table B-39. Continued Time (Days)
Bag 1 Bag 2
11
12
13
14
15

123
Table B-40. Growth table for C60 18x14 at 30˚C Regular Media Time (Days)
Bag 1 Bag 2
1
2
3
4
5
6
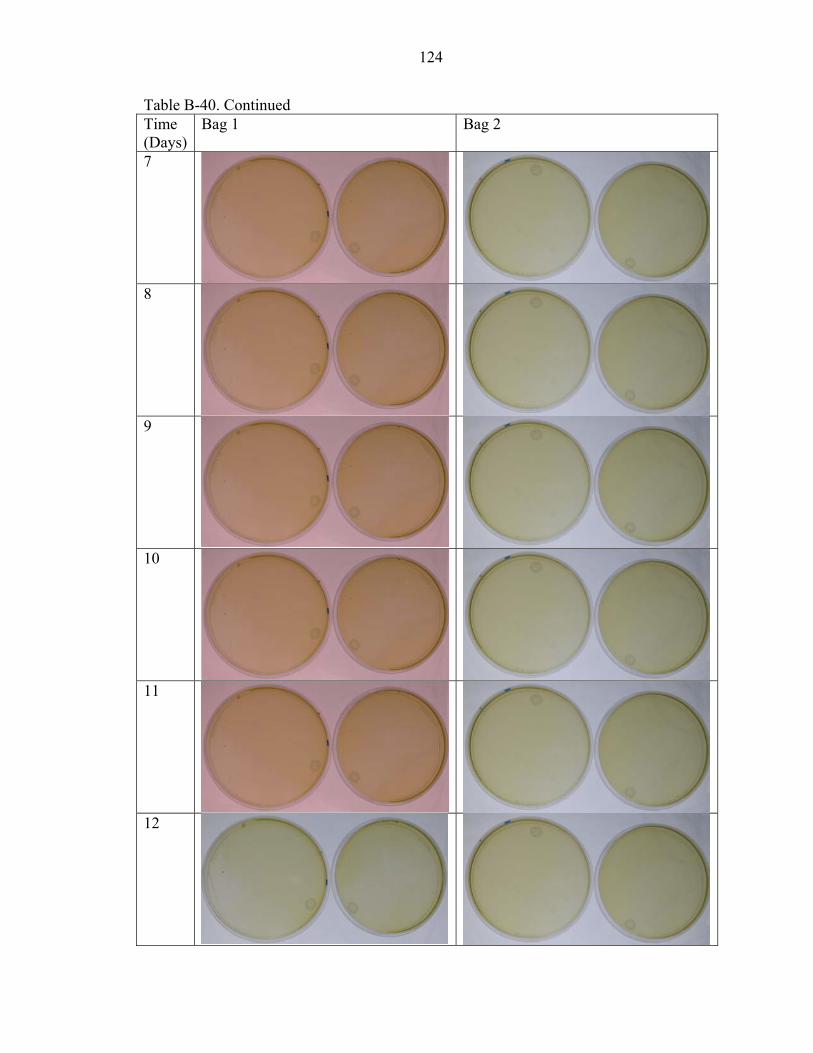
124
Table B-40. Continued Time (Days)
Bag 1 Bag 2
7
8
9
10
11
12
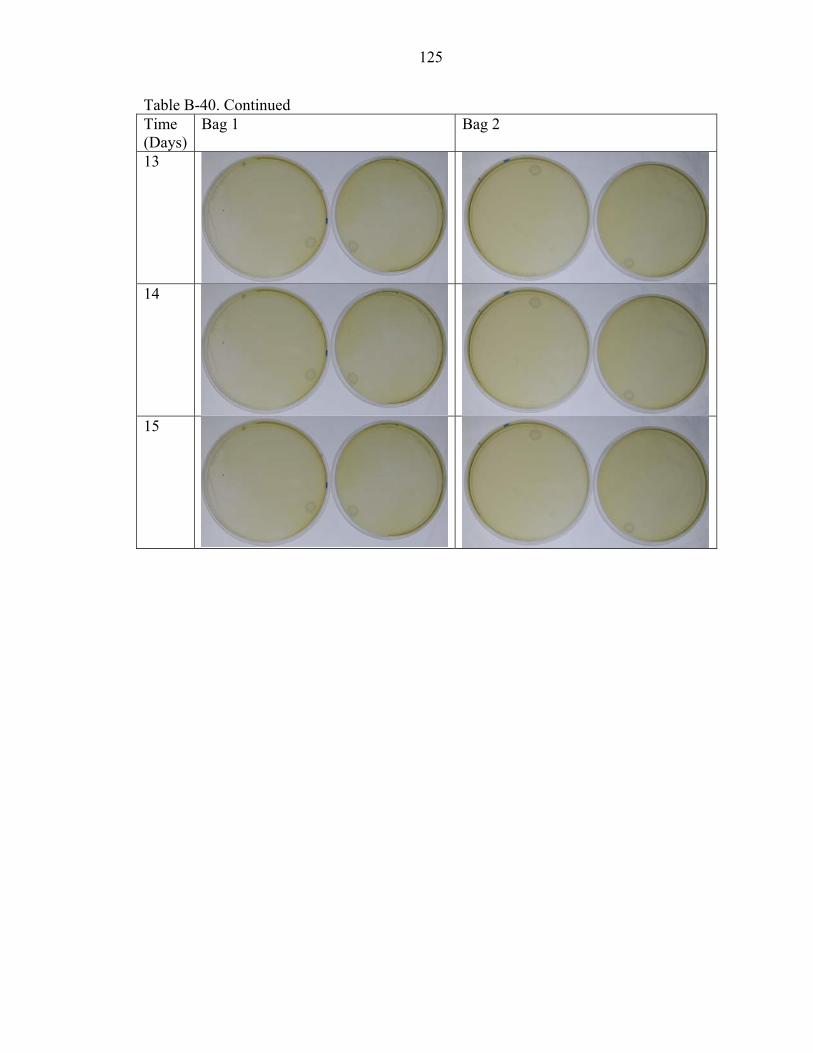
125
Table B-40. Continued Time (Days)
Bag 1 Bag 2
13
14
15

126
Table B-41. Growth table for AET 18x14 at 30˚C Regular Media Time (Days)
Bag 1 Bag 2
1
2
3
4
5
6
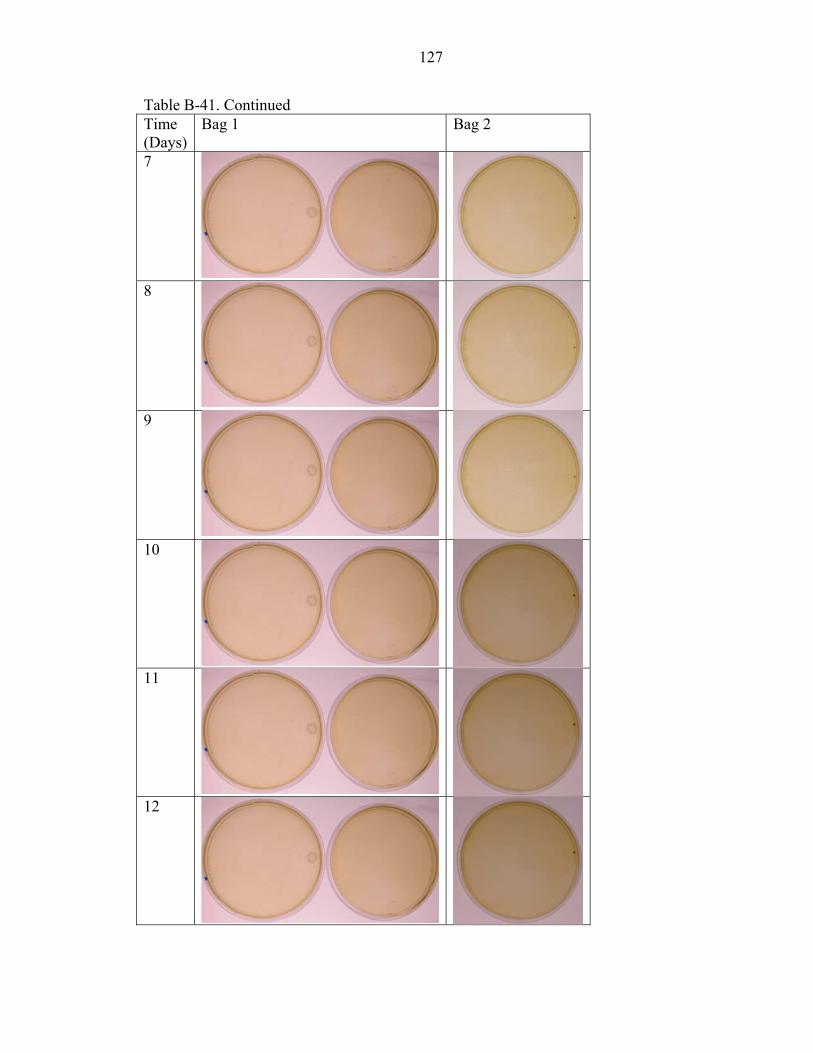
127
Table B-41. Continued Time (Days)
Bag 1 Bag 2
7
8
9
10
11
12

128
Table B-41. Continued Time (Days)
Bag 1 Bag 2
13
14
15

129
Table B-42. Growth table for BDF 18x14 at 30˚C Regular Media Time (Days)
Bag 1 Bag 2
1
2
3
4
5
6
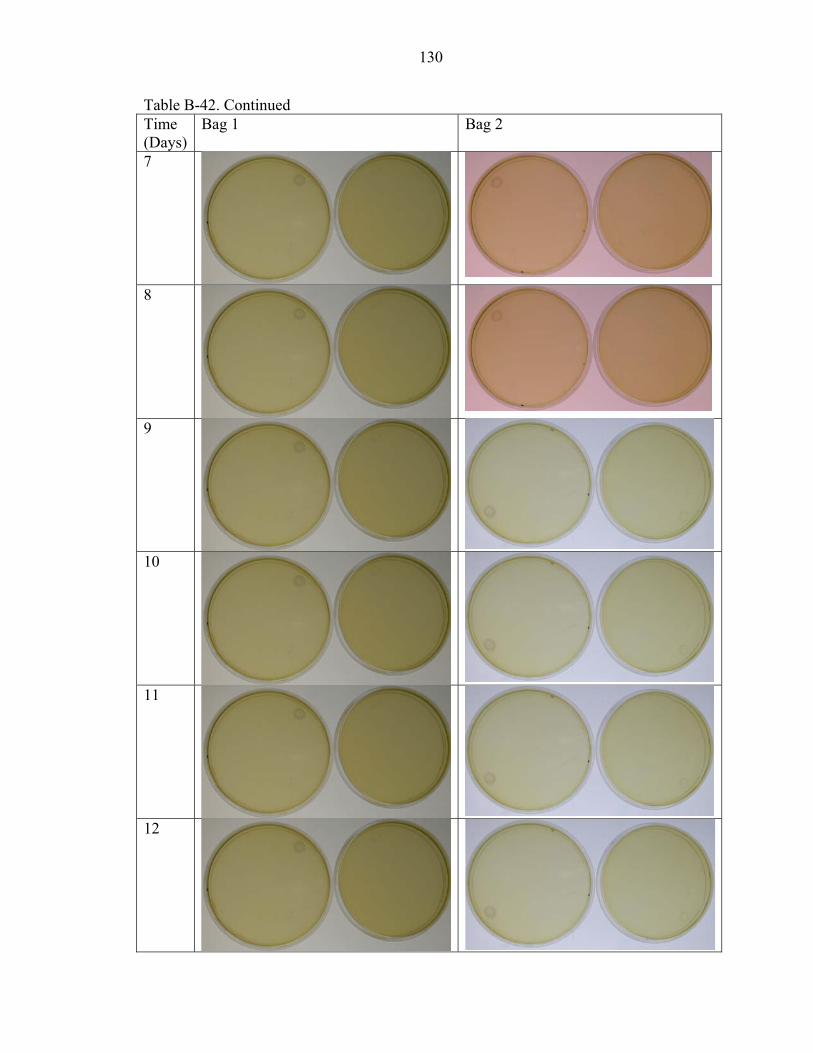
130
Table B-42. Continued Time (Days)
Bag 1 Bag 2
7
8
9
10
11
12

131
Table B-42. Continued Time (Days)
Bag 1 Bag 2
13
14
15

132
Table B-43. Growth table for C60 8x8 at 35˚C Regular Media Time (Days)
Bag 1 Bag 2
1
2
3
4
5
6

133
Table B-43. Continued Time (Days)
Bag 1 Bag 2
8
9
10
11
12
13

134
Table B-43. Continued Time (Days)
Bag 1 Bag 2
14
15

135
Table B-44. Growth table for AET 8x8 at 35˚C Regular Media Time (Days)
Bag 1 Bag 2
1
2
3
4
5
6

136
Table B-44. Continued Time (Days)
Bag 1 Bag 2
7
8
9
10
11
12

137
Table B-44. Continued Time (Days)
Bag 1 Bag 2
13
14
15

138
Table B-45. Growth table for BDF 8x8 at 35˚C Regular Media Time Days
Bag 1 Bag 2
1
2
3
4
5
6
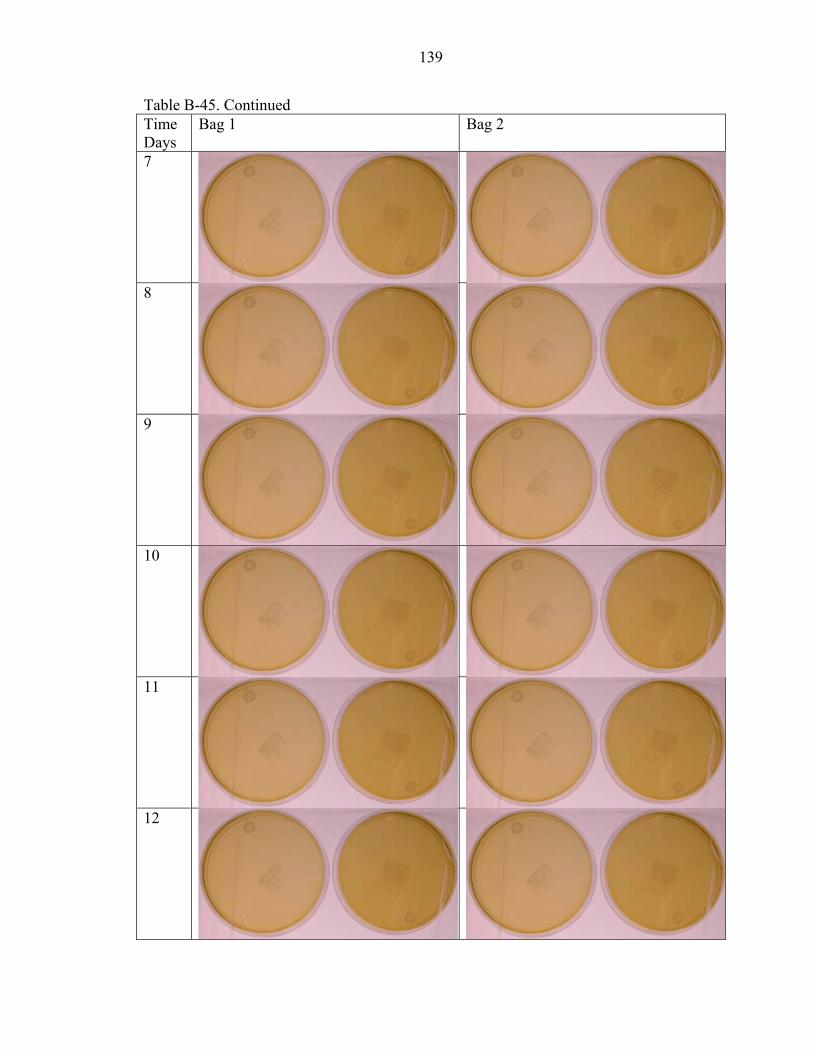
139
Table B-45. Continued Time Days
Bag 1 Bag 2
7
8
9
10
11
12

140
Table B-45. Continued Time Days
Bag 1 Bag 2
13
14
15
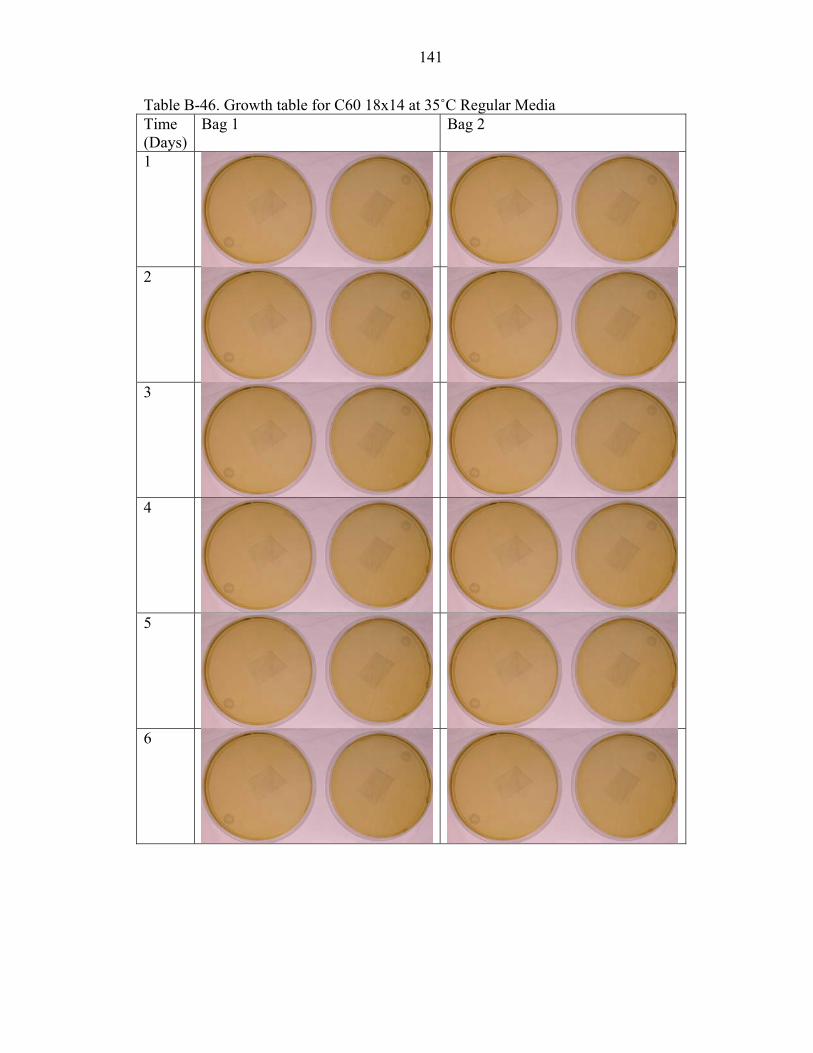
141
Table B-46. Growth table for C60 18x14 at 35˚C Regular Media Time (Days)
Bag 1 Bag 2
1
2
3
4
5
6

142
Table B-46. Continued Time (Days)
Bag 1 Bag 2
7
8
9
10
11
12
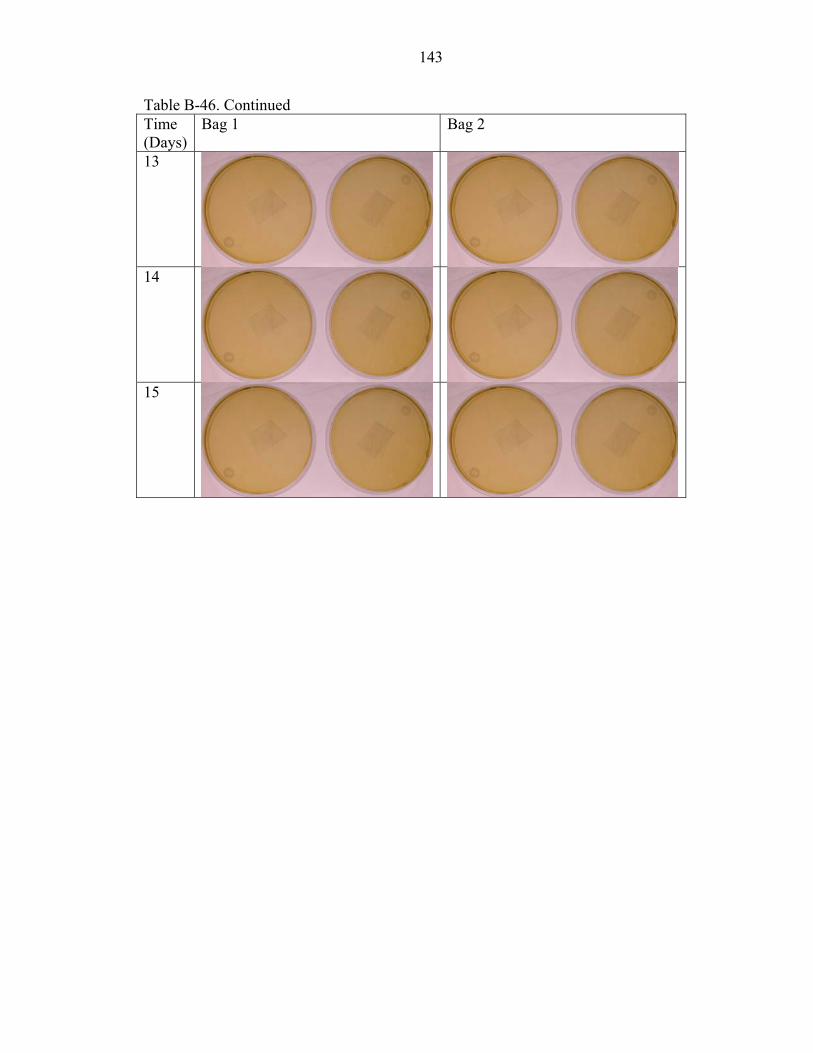
143
Table B-46. Continued Time (Days)
Bag 1 Bag 2
13
14
15
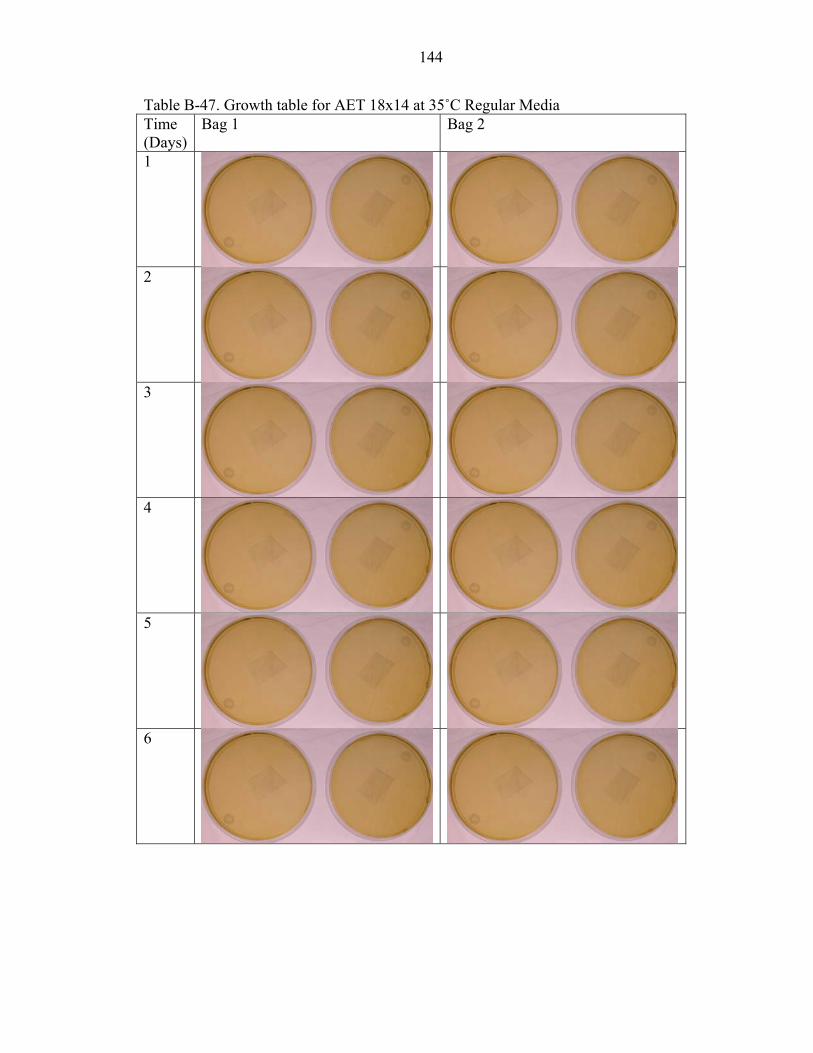
144
Table B-47. Growth table for AET 18x14 at 35˚C Regular Media Time (Days)
Bag 1 Bag 2
1
2
3
4
5
6
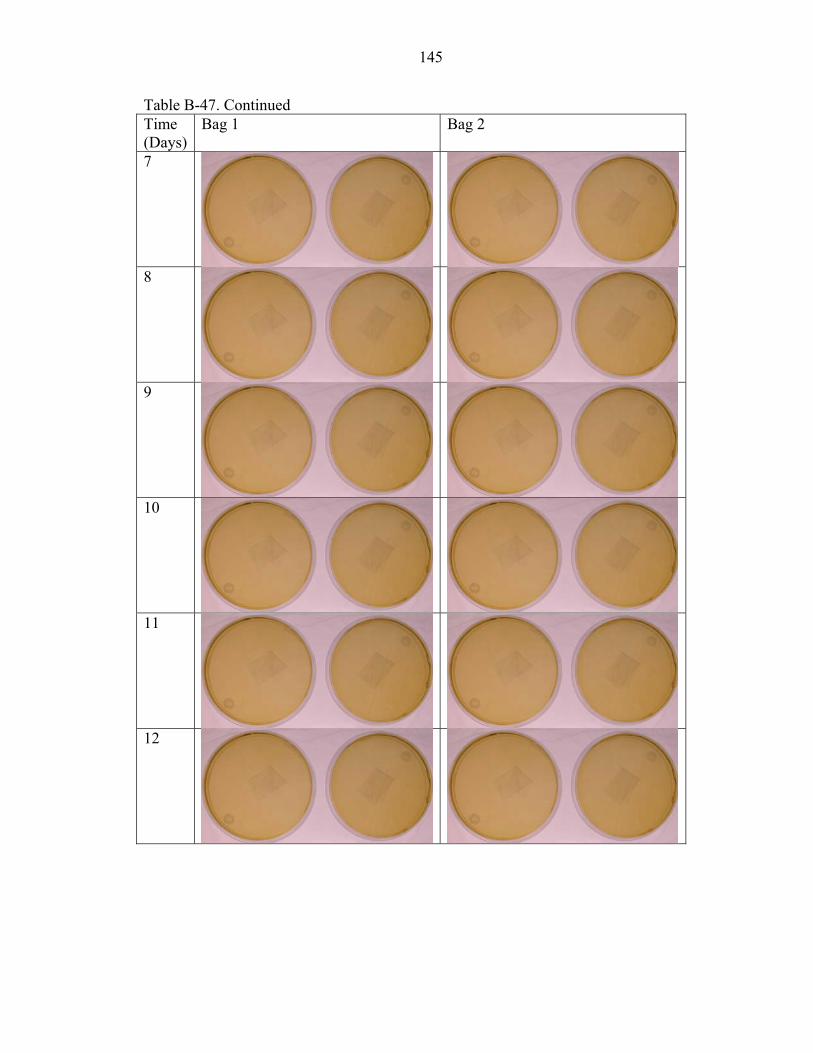
145
Table B-47. Continued Time (Days)
Bag 1 Bag 2
7
8
9
10
11
12

146
Table B-47. Continued Time (Days)
Bag 1 Bag 2
13
14
15

147
Table B-48. Growth table for BDF 18x14 at 35˚C Regular Media Time (Days)
Bag 1 Bag 2
1
2
3
4
5
6

148
Table B-48. Continued Time (Days)
Bag 1 Bag 2
7
8
9
10
11
12
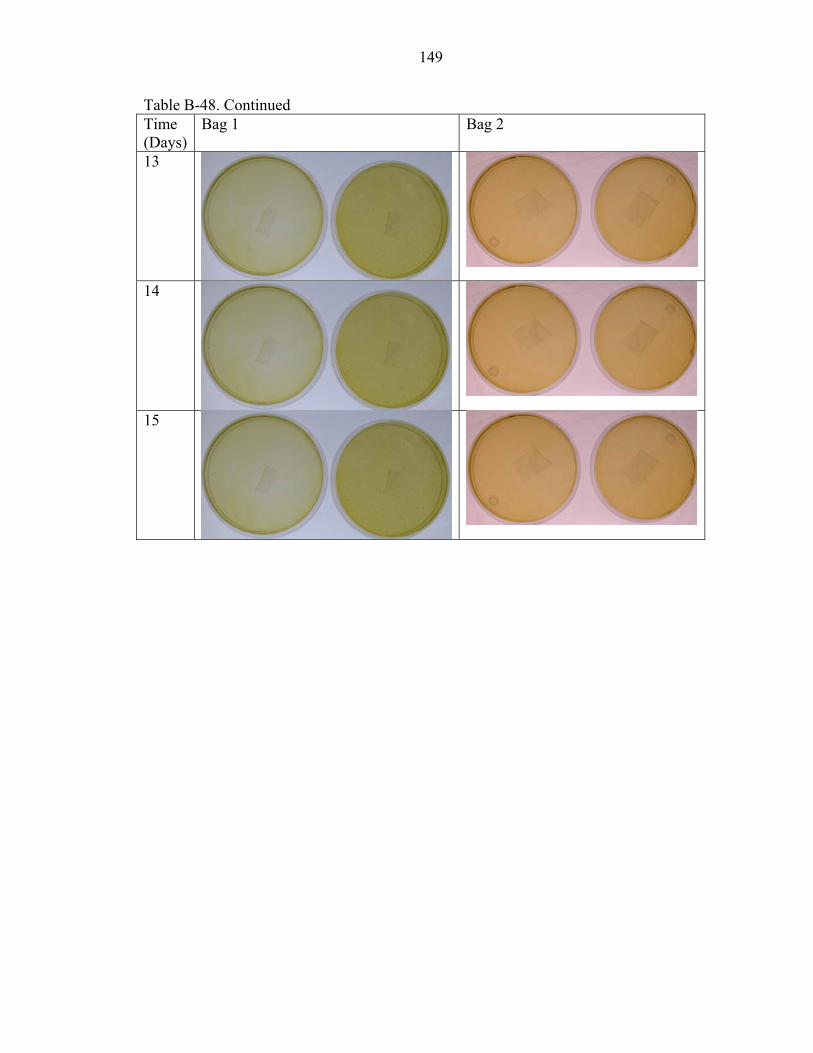
149
Table B-48. Continued Time (Days)
Bag 1 Bag 2
13
14
15

APPENDIX C OXIDATION REDUCTION POTENTIAL WITHOUT PH COMPENSATION
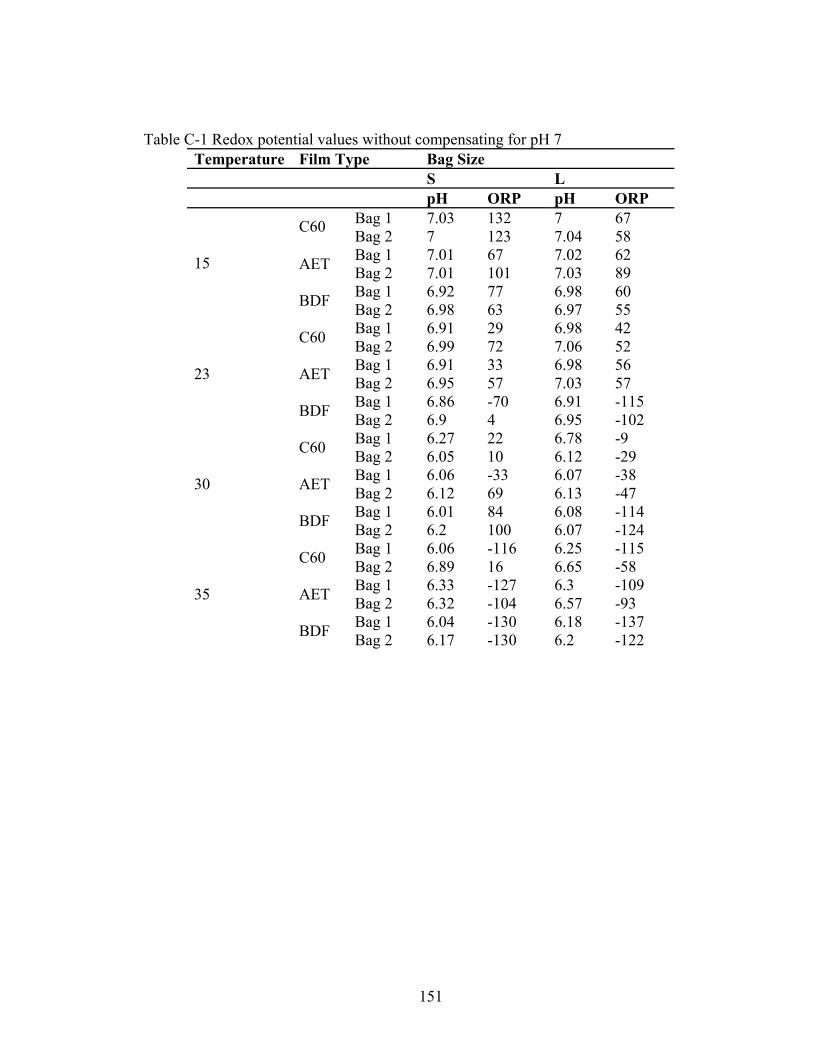
151
Table C-1 Redox potential values without compensating for pH 7 Temperature Film Type Bag Size S L pH ORP pH ORP
Bag 1 7.03 132 7 67 C60 Bag 2 7 123 7.04 58 Bag 1 7.01 67 7.02 62 AET Bag 2 7.01 101 7.03 89 Bag 1 6.92 77 6.98 60
15
BDF Bag 2 6.98 63 6.97 55 Bag 1 6.91 29 6.98 42 C60 Bag 2 6.99 72 7.06 52 Bag 1 6.91 33 6.98 56 AET Bag 2 6.95 57 7.03 57 Bag 1 6.86 -70 6.91 -115
23
BDF Bag 2 6.9 4 6.95 -102 Bag 1 6.27 22 6.78 -9 C60 Bag 2 6.05 10 6.12 -29 Bag 1 6.06 -33 6.07 -38 AET Bag 2 6.12 69 6.13 -47 Bag 1 6.01 84 6.08 -114
30
BDF Bag 2 6.2 100 6.07 -124 Bag 1 6.06 -116 6.25 -115 C60 Bag 2 6.89 16 6.65 -58 Bag 1 6.33 -127 6.3 -109 AET Bag 2 6.32 -104 6.57 -93 Bag 1 6.04 -130 6.18 -137
35
BDF Bag 2 6.17 -130 6.2 -122

152
LIST OF REFERENCES
Brody, A.L. 2001 Packaging to limit microbiological concerns. Food Technology. 55(12), pp. 74-75.
Brown, M.H, Emberger, O. 1980. Oxidation reduction potential. In Microbial Ecology of Foods (J.H. Silliker eds.), Academic Press, New York. Vol. 1,pp. 112-115.
Cameron, A.C, Patterson, B.D, Talasila, P.C and Joles, D.W.1993. Modeling the risk in modified atmosphere packaging: A case for sense and respond packaging. In Proc. Sixth Intl. Controlled Atmosphere Res. Conf, vol. 1. 15-17 June 1993 (G.D. Blanpied, J.A. Bartsch, and J.R. Hicks eds.), Ithaca, N.Y, pp. 95-102.
Cameron, A.C, Talasila, P.C, Joles, D.W. 1995. Predicting film permeability needs for modified atmosphere packaging of lightly processed fruits and vegetables. HortScience. Vol. 30(1). pp. 25-34.
Dalgaard, P. 2000. Fresh and lightly preserved seafood. In Shelf-Life Evaluation of Foods. Second edition (C.M.D. Man, A.A. Jones eds.), Aspen publishers, Gaithersburg, Maryland. pp. 110-133.
Doyon, G.J, Gagnon, Castaigne, F. 1991. Gas transmission properties of polyvinyl chloride (PVC) films studied under sub ambient and ambient conditions for modified atmospheric packaging applications. Packaging Technology Science Vol.4. pp. 157-165.
Dufrense I, Smith J.P, Liu J.N, Tarte I, Blanchfield B, Austin J.W. 2000. Effect of films of different OTR on toxin production by C. botulinum Type E in vacuum packaged cold and hot-smoked trout fillets. Journal of Food Safety. Vol. 20. pp. 251-268.
Farber, J.M. 1991. Microbiological aspects of modified atmosphere packaging technology –A review. Journal of Food Protection. Vol. 54(1). pp. 58-70.
FDA/CFSAN Bad Bug Book. 1992. http://www.cfsan.fda.gov/mow/chap2.html
Food and Drug Administration (FDA). 1997. Food processing. Food code. Annex 6.
Food and Drug Administration (FDA). 2001. Fish and Fishery Products Hazards and Controls Guide, 3rd ed. Washington, D.C
Food and Drug Administration (FDA). 2002. Import Alert # 16-125.
153
Fitzgerald, M, Papkovsky, D.M, Smiddy, M, Kerry, J.P, O’Sullivan, C.K, Buckley, D.J, Guilbault, G.G. 2001. Nondestructive monitoring of oxygen profiles in packaged foods using phase-fluorimetric oxygen sensor. Journal of Foods Science. Vol. 66(1). pp. 105-110.
Gould, G.W. 1996, Methods for preservation and extension of shelf-life. International Journal of Food Microbiology. Vol.33, pp. 51-64.
Johnson, B. 1997. Headspace analysis and shelf-life. Cereals Foods World. Vol. 42(9). pp. 752-754.
Morris, J.G. 2000. The effect of redox potential. In The Microbiological Safety and Quality of Food (B.M. Lund, T.C. Baird-Parker, G.W. Gould eds.), Aspen Publishers, Gaithersburg, Maryland. Vol.1, pp. 235-250.
Lund, B.M, Wyatt, G.M. 1984. The effect of redox potential and its interaction with sodium chloride concentration on the probability of growth of C. botulinum type E from spore inocula. Food Microbiology. Vol. 1. pp. 49-65.
Mapes, M., Hseuh, H.C., Jiang, W.S. 1994. Permeation of argon, carbon dioxide, helium, nitrogen and oxygen through Mylar windows. Journal of Vacuum Science and Technology. Vol.12(4). pp. 1699-1704.
Montville, T.J and Conway, L.K 1982. Oxidation reduction potential o the outgrowth and chemical inhibition of Clostridium botulinum 10755 A spores. Journal of Food Science. Vol.44. pp. 700-705.
National Advisory Committee for Microbiological Criteria for Foods. 1991. Vaccum or modified atmosphere packaging for refrigerated raw fishery products. http://www.fsis.usda.gov/OPHS/nacmcf/past/map_fishery.htm
NFPA 1989, Guidelines for the Development Production and Handling of Refrigerated Foods. National Food Processors Association, Washington, D.C.
Otwell, S. 2002. Proceedings of 6th Joint meeting Seafood Science and Technology Meeting and Atlantic Fisheries Technology Society.
Robertson, G.L. 1992. Food Packaging. Marcel Dekker, New York.
Rubino, M., Tung, M.A., Yada. S., Britt, I.J. 2001. Permeation of oxygen, water vapor, and limonene through printed and unprinted biaxially oriented polypropylene films source. J Agric and Food Chemistry. Vol. 49(6). pp. 3041-3045.
Sloan, E.A. 2000. Food Technology. Vol. 54(12). pp. 22.
Sumner, S.S, Albrecht, J.A. 1994. Clostridium botulinum. Nebraska Cooperative Extension NF94-162. http://www.ianr.unl.edu/pubs/foods/nf162.htm
154
Smoot, L.A, Pierson, M.D. 1979. Effect of oxidation reduction potential on the outgrowth and chemical inhibition of Clostridium botulinum 10755A spores. Journal of Food Science. Vol 44. pp. 700-704.
Tewari, G, Jayas, D.S, Holley, R.A. 1999. Centralized packaging of retail meat cuts- A review. Journal of Food Protection. Vol. 62(4). pp. 218-425.
Welt, B.A, Sage, D.S, Berger, K.L. 2003. Performance specification of time-temperature integrators designed to protect against botulism in refrigerated fresh foods. Journal of Food Science. Vol. 68(1). pp. 2-9.
Zakour, O.P. 2001. Vacuum packaging and reduced oxygen packaging of foods. Venture, A Newsletter for the Small Scale Food Entrepreneur. Vol. 3(3).
155
BIOGRAPHICAL SKETCH
Jayashree Gnanaraj was born in Madurai, TamilNadu, India, in May 1980 and
moved to Coimbatore in 1989 where she completed her elementary, secondary school
certification and undergraduate studies. In May 2001 she received her bachelor of
engineering degree in food processing and preservation technology from Avinashilingam
University where she was among top three and the student body president of engineering
department 00’- 01‘ which comprised of 600 students. She was also the secretary of Food
Technology Association 99’- 00’. During the last year of under graduation studies she
interned in Indira Gandhi Center for Atomic Research which made her realize her passion
for scientific research.
In August 2001 she was admitted in Agricultural and Biological Engineering
Department at the University of Florida and now feels prepared to get involved with the
food processing field because of the excellent mentoring provided by the faculty.