evaluating non-motorized transportation benefits and · pdf fileevaluating non-motorized...
TRANSCRIPT
www.vtpi.org [email protected] 250-360-1560
Todd Litman © 1997-2011 You are welcome and encouraged to copy, distribute, share and excerpt this document and its ideas, provided the author is given attribution. Please send you corrections, comments and suggestions for improvement.
Evaluating Non-Motorized Transportation Benefits and Costs
16 May 2011
Todd Litman Victoria Transport Policy Institute
Abstract This report describes methods for evaluating non-motorized transport (walking, cycling, and their variants) benefits and costs, including direct benefits to users from improved walking and cycling conditions, and various benefits to society from increased non-motorized travel activity, reduced automobile travel, and support for more compact land use development. It identifies various types of benefits and costs, and describes methods for measuring them. It discusses non-motorized transport demand and ways to increase non-motorized travel activity. This analysis indicates that non-motorized travel provides significant benefits, many of which are overlooked or undervalued in conventional transport economic evaluation.
This report updates and expands on the article, “Bicycling and Transportation Demand Management,”
Transportation Research Record 1441, Transportation Research Board, 1994, pp. 134-140.
Evaluating Non-Motorized Transport Benefits and Costs Victoria Transport Policy Institute
1
Contents Executive Summary ...................................................................................................... 2
Introduction ................................................................................................................... 4
Evaluation Framework .................................................................................................. 7
Non-Motorized Transport Demand ................................................................................ 9
Evaluating Non-Motorized Travel Conditions ................................................................ 15
NMT Improvement and Encouragement Strategies ...................................................... 16
Benefit and Cost Categories ......................................................................................... 19 User Benefits .................................................................................................................. 21 Option Value ................................................................................................................... 23 Equity Benefits ................................................................................................................ 23 Physical Fitness and Health ........................................................................................... 25 Vehicle Savings .............................................................................................................. 26 Avoided Chauffeuring ..................................................................................................... 27 Congestion Reduction .................................................................................................... 27 Barrier Effect ................................................................................................................... 29 Roadway Costs Savings ................................................................................................ 30 Parking Cost Savings ..................................................................................................... 31 Traffic Safety Impacts ..................................................................................................... 32 Energy Conservation ...................................................................................................... 34 Pollution Reduction ......................................................................................................... 34 Land Use Impacts ........................................................................................................... 35 Economic Development.................................................................................................. 37
Costs ............................................................................................................................. 41 Facility Costs .................................................................................................................. 41 Vehicle Traffic Impacts ................................................................................................... 41 Equipment and Fuel Costs ............................................................................................. 42 User Travel Time Costs .................................................................................................. 42 Accident and Health Risk ............................................................................................... 43
Benefit and Cost Summary ........................................................................................... 44 Improved Non-Motorized Travel Conditions ................................................................... 47 Increased Non-Motorized Travel Activity ....................................................................... 47 Reduced Automobile Travel ........................................................................................... 47 Land Use Impacts ........................................................................................................... 48 Economic Development Impacts .................................................................................... 48 Non-Motorized Transport Costs ..................................................................................... 49
Evaluating Specific Non-Motorized Improvements ....................................................... 50
Calculating Optimum Investments ................................................................................ 54
Examples ...................................................................................................................... 56
Recommendations for Comprehensive Evaluation ....................................................... 58
Criticisms....................................................................................................................... 59
Conclusions .................................................................................................................. 61
References and Information Resources ........................................................................ 62
Evaluating Non-Motorized Transport Benefits and Costs Victoria Transport Policy Institute
2
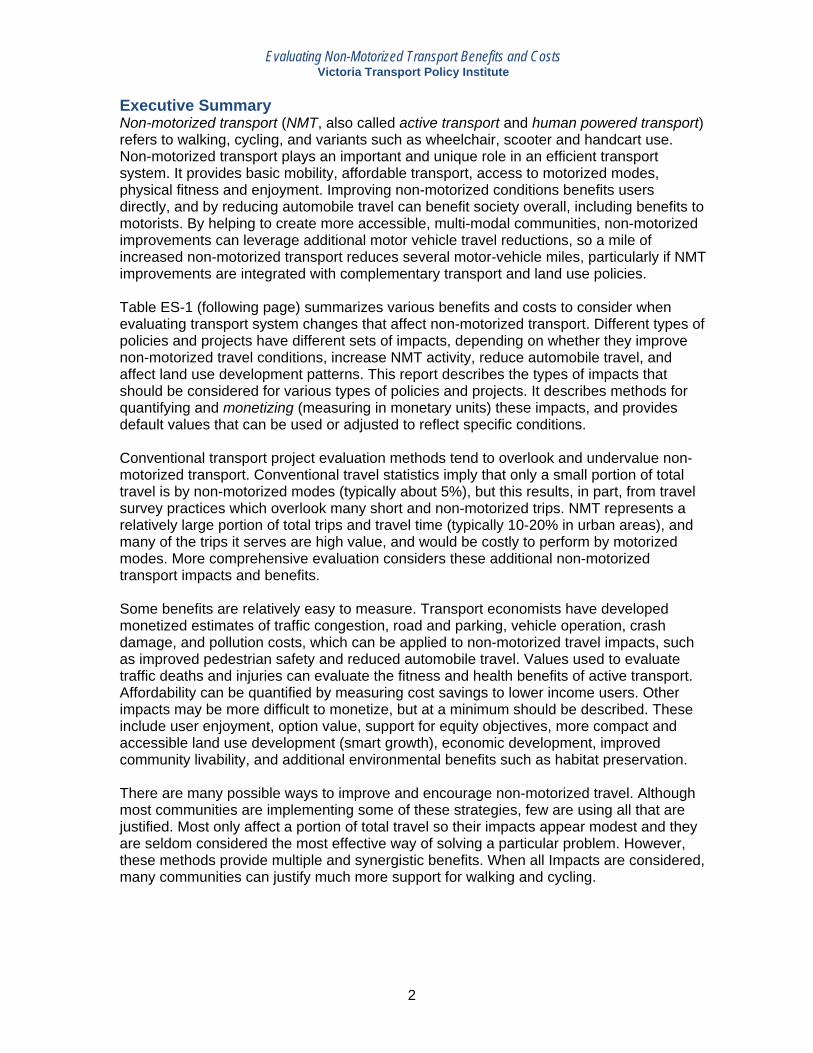
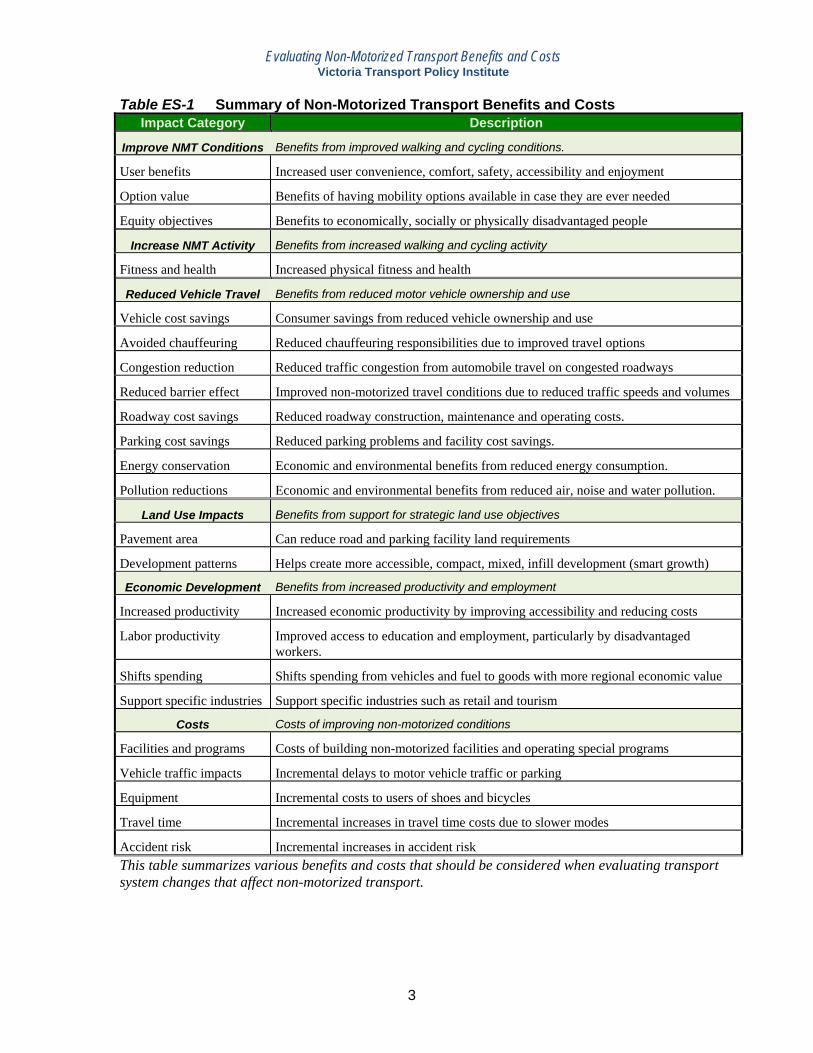
Executive Summary Non-motorized transport (NMT, also called active transport and human powered transport) refers to walking, cycling, and variants such as wheelchair, scooter and handcart use. Non-motorized transport plays an important and unique role in an efficient transport system. It provides basic mobility, affordable transport, access to motorized modes, physical fitness and enjoyment. Improving non-motorized conditions benefits users directly, and by reducing automobile travel can benefit society overall, including benefits to motorists. By helping to create more accessible, multi-modal communities, non-motorized improvements can leverage additional motor vehicle travel reductions, so a mile of increased non-motorized transport reduces several motor-vehicle miles, particularly if NMT improvements are integrated with complementary transport and land use policies. Table ES-1 (following page) summarizes various benefits and costs to consider when evaluating transport system changes that affect non-motorized transport. Different types of policies and projects have different sets of impacts, depending on whether they improve non-motorized travel conditions, increase NMT activity, reduce automobile travel, and affect land use development patterns. This report describes the types of impacts that should be considered for various types of policies and projects. It describes methods for quantifying and monetizing (measuring in monetary units) these impacts, and provides default values that can be used or adjusted to reflect specific conditions. Conventional transport project evaluation methods tend to overlook and undervalue non-motorized transport. Conventional travel statistics imply that only a small portion of total travel is by non-motorized modes (typically about 5%), but this results, in part, from travel survey practices which overlook many short and non-motorized trips. NMT represents a relatively large portion of total trips and travel time (typically 10-20% in urban areas), and many of the trips it serves are high value, and would be costly to perform by motorized modes. More comprehensive evaluation considers these additional non-motorized transport impacts and benefits. Some benefits are relatively easy to measure. Transport economists have developed monetized estimates of traffic congestion, road and parking, vehicle operation, crash damage, and pollution costs, which can be applied to non-motorized travel impacts, such as improved pedestrian safety and reduced automobile travel. Values used to evaluate traffic deaths and injuries can evaluate the fitness and health benefits of active transport. Affordability can be quantified by measuring cost savings to lower income users. Other impacts may be more difficult to monetize, but at a minimum should be described. These include user enjoyment, option value, support for equity objectives, more compact and accessible land use development (smart growth), economic development, improved community livability, and additional environmental benefits such as habitat preservation. There are many possible ways to improve and encourage non-motorized travel. Although most communities are implementing some of these strategies, few are using all that are justified. Most only affect a portion of total travel so their impacts appear modest and they are seldom considered the most effective way of solving a particular problem. However, these methods provide multiple and synergistic benefits. When all Impacts are considered, many communities can justify much more support for walking and cycling.
Evaluating Non-Motorized Transport Benefits and Costs Victoria Transport Policy Institute
3
Table ES-1 Summary of Non-Motorized Transport Benefits and Costs Impact Category Description
Improve NMT Conditions Benefits from improved walking and cycling conditions.
User benefits Increased user convenience, comfort, safety, accessibility and enjoyment
Option value Benefits of having mobility options available in case they are ever needed
Equity objectives Benefits to economically, socially or physically disadvantaged people
Increase NMT Activity Benefits from increased walking and cycling activity
Fitness and health Increased physical fitness and health
Reduced Vehicle Travel Benefits from reduced motor vehicle ownership and use
Vehicle cost savings Consumer savings from reduced vehicle ownership and use
Avoided chauffeuring Reduced chauffeuring responsibilities due to improved travel options
Congestion reduction Reduced traffic congestion from automobile travel on congested roadways
Reduced barrier effect Improved non-motorized travel conditions due to reduced traffic speeds and volumes
Roadway cost savings Reduced roadway construction, maintenance and operating costs.
Parking cost savings Reduced parking problems and facility cost savings.
Energy conservation Economic and environmental benefits from reduced energy consumption.
Pollution reductions Economic and environmental benefits from reduced air, noise and water pollution.
Land Use Impacts Benefits from support for strategic land use objectives
Pavement area Can reduce road and parking facility land requirements
Development patterns Helps create more accessible, compact, mixed, infill development (smart growth)
Economic Development Benefits from increased productivity and employment
Increased productivity Increased economic productivity by improving accessibility and reducing costs
Labor productivity Improved access to education and employment, particularly by disadvantaged workers.
Shifts spending Shifts spending from vehicles and fuel to goods with more regional economic value
Support specific industries Support specific industries such as retail and tourism
Costs Costs of improving non-motorized conditions
Facilities and programs Costs of building non-motorized facilities and operating special programs
Vehicle traffic impacts Incremental delays to motor vehicle traffic or parking
Equipment Incremental costs to users of shoes and bicycles
Travel time Incremental increases in travel time costs due to slower modes
Accident risk Incremental increases in accident risk This table summarizes various benefits and costs that should be considered when evaluating transport system changes that affect non-motorized transport.
Evaluating Non-Motorized Transport Benefits and Costs Victoria Transport Policy Institute
4
Introduction Non-motorized transport (NMT, also called active transport and human powered transport) refers to walking, cycling, and variants such as wheelchair, scooter and handcart use.1 It includes both utilitarian and recreational travel activity, plus stationary uses of pedestrian environments such as standing on sidewalks and sitting at bus stops. Non-motorized travel plays important and unique roles in an efficient transport system:
• Walking is a nearly universal human activity that provides mobility, exercise and pleasure.
• Typically 10-20% of trips are entirely by non-motorized modes, and most motorized trips involve non-motorized links, to access public transit, and for travel between parked cars and destinations. Parking lots, transport terminals, airports, and commercial centers are all pedestrian environments. Better non-motorized conditions can improve motorized travel.
• Walking and cycling provide affordable, basic transportation. People who are physically, economically and socially disadvantaged often rely significantly on non-motorized modes, so non-motorized improvements can help increase social equity and economic opportunity.
• Active transport is the most common form of physical exercise. Increasing walking and cycling is often the most practical way to improve public fitness and health.
• Non-motorized modes support land use planning objectives, such as urban redevelopment and compact, mixed-use community design.
• Pedestrian environments (sidewalks, paths and hallways) are a major portion of the public realm. Many beneficial activities (socializing, waiting, shopping and eating) occur in pedestrian environments, and so are affected by their quality. Shopping districts and resort communities depend on walkable environments to attract customers.
• Walking and cycling improvements can support strategic land use development objectives by helping to create more compact, mixed, multi-modal, “smart growth” communities, where residents drive less and rely more on alternative modes.
• Walking and cycling are popular recreational activities. Improving walking and cycling conditions provides enjoyment and health benefits to users, and it can support related industries, including retail, recreation and tourism.
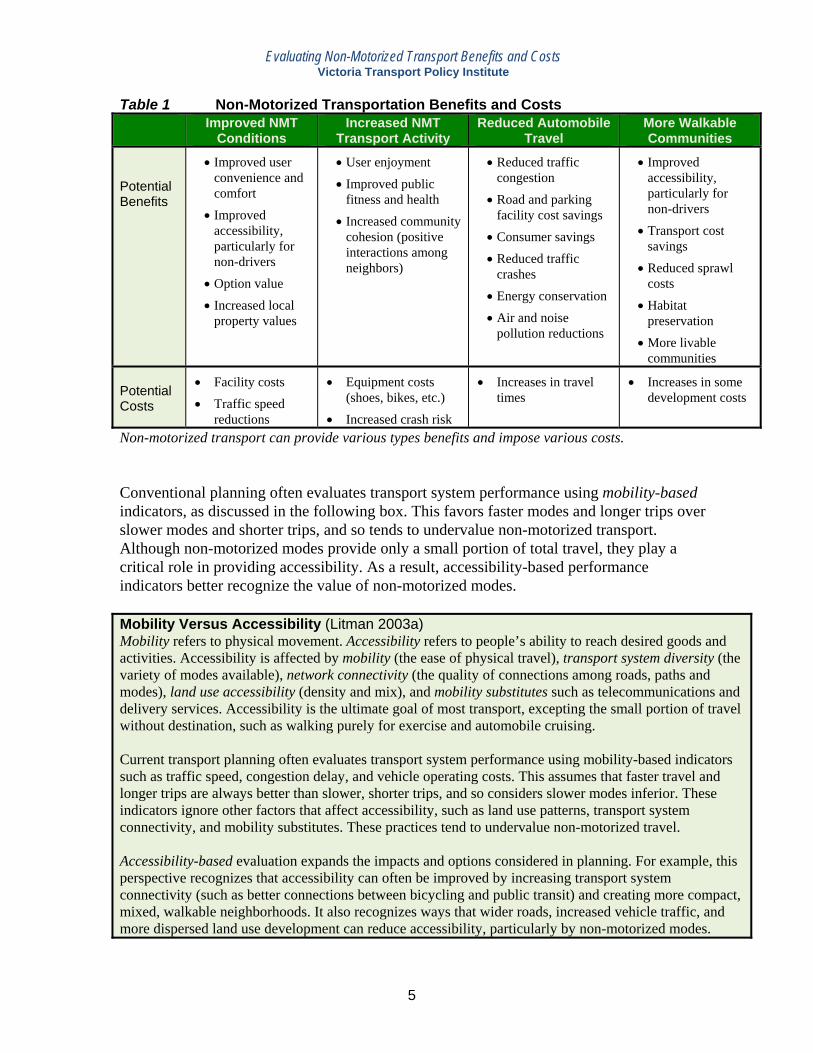
Non-motorized transport can provide various types of benefits and costs, as summarized in Table 1. These include the direct user benefits that result from improved walking and cycling conditions, as well as various benefits to society from increased walking and cycling activity, reduced automobile travel, and from more compact, mixed land use development patterns that support, and are supported by, non-motorized modes. Since physically and economically disadvantaged people often depend on walking and cycling, improving these modes tends to increase social equity and economic opportunity.
1 In this report, pedestrian, walker, cyclist, active transport users, and non-drivers refer to people who use non-motorized modes, while motorist and driver refer to automobile users. Of course, most people fall into multiple categories at various times.
Evaluating Non-Motorized Transport Benefits and Costs Victoria Transport Policy Institute
5
Table 1 Non-Motorized Transportation Benefits and Costs Improved NMT
Conditions Increased NMT
Transport Activity Reduced Automobile
Travel More Walkable Communities
Potential Benefits
• Improved user convenience and comfort
• Improved accessibility, particularly for non-drivers
• Option value • Increased local
property values
• User enjoyment • Improved public
fitness and health • Increased community
cohesion (positive interactions among neighbors)
• Reduced traffic congestion
• Road and parking facility cost savings
• Consumer savings • Reduced traffic
crashes • Energy conservation • Air and noise
pollution reductions
• Improved accessibility, particularly for non-drivers
• Transport cost savings
• Reduced sprawl costs
• Habitat preservation
• More livable communities
Potential Costs
• Facility costs • Traffic speed
reductions
• Equipment costs (shoes, bikes, etc.)
• Increased crash risk
• Increases in travel times
• Increases in some development costs
Non-motorized transport can provide various types benefits and impose various costs. Conventional planning often evaluates transport system performance using mobility-based indicators, as discussed in the following box. This favors faster modes and longer trips over slower modes and shorter trips, and so tends to undervalue non-motorized transport. Although non-motorized modes provide only a small portion of total travel, they play a critical role in providing accessibility. As a result, accessibility-based performance indicators better recognize the value of non-motorized modes. Mobility Versus Accessibility (Litman 2003a) Mobility refers to physical movement. Accessibility refers to people’s ability to reach desired goods and activities. Accessibility is affected by mobility (the ease of physical travel), transport system diversity (the variety of modes available), network connectivity (the quality of connections among roads, paths and modes), land use accessibility (density and mix), and mobility substitutes such as telecommunications and delivery services. Accessibility is the ultimate goal of most transport, excepting the small portion of travel without destination, such as walking purely for exercise and automobile cruising. Current transport planning often evaluates transport system performance using mobility-based indicators such as traffic speed, congestion delay, and vehicle operating costs. This assumes that faster travel and longer trips are always better than slower, shorter trips, and so considers slower modes inferior. These indicators ignore other factors that affect accessibility, such as land use patterns, transport system connectivity, and mobility substitutes. These practices tend to undervalue non-motorized travel. Accessibility-based evaluation expands the impacts and options considered in planning. For example, this perspective recognizes that accessibility can often be improved by increasing transport system connectivity (such as better connections between bicycling and public transit) and creating more compact, mixed, walkable neighborhoods. It also recognizes ways that wider roads, increased vehicle traffic, and more dispersed land use development can reduce accessibility, particularly by non-motorized modes.
Evaluating Non-Motorized Transport Benefits and Costs Victoria Transport Policy Institute
6
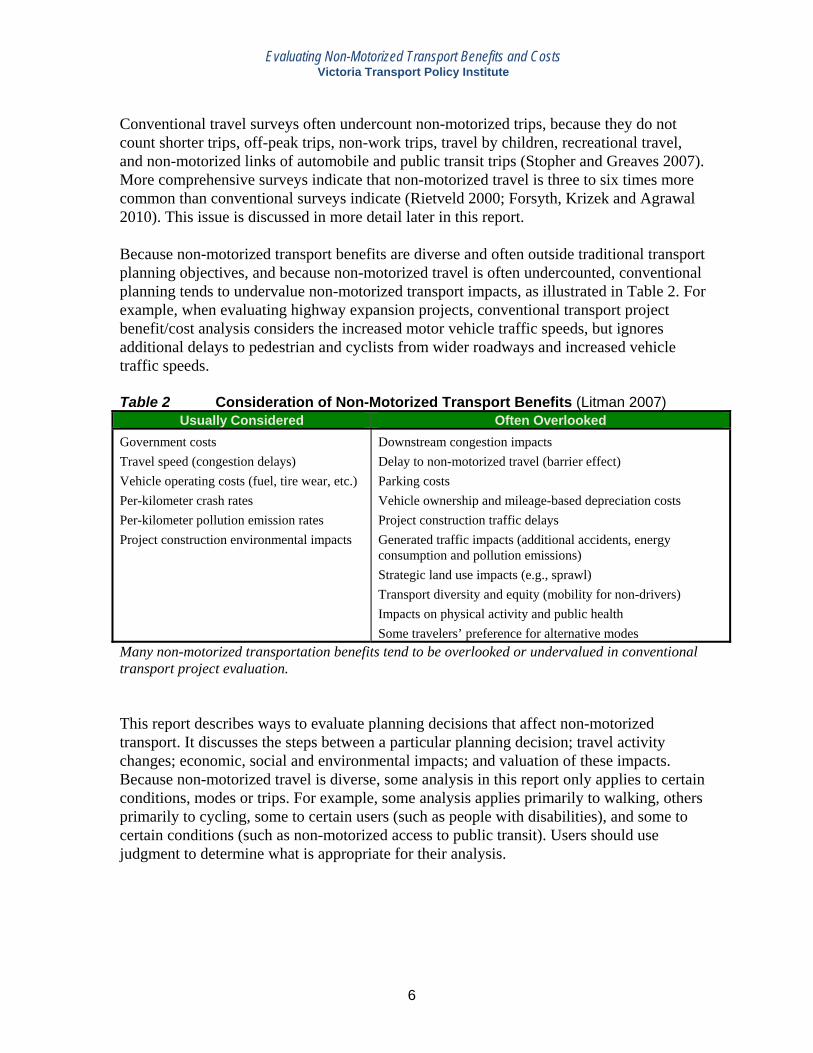
Conventional travel surveys often undercount non-motorized trips, because they do not count shorter trips, off-peak trips, non-work trips, travel by children, recreational travel, and non-motorized links of automobile and public transit trips (Stopher and Greaves 2007). More comprehensive surveys indicate that non-motorized travel is three to six times more common than conventional surveys indicate (Rietveld 2000; Forsyth, Krizek and Agrawal 2010). This issue is discussed in more detail later in this report. Because non-motorized transport benefits are diverse and often outside traditional transport planning objectives, and because non-motorized travel is often undercounted, conventional planning tends to undervalue non-motorized transport impacts, as illustrated in Table 2. For example, when evaluating highway expansion projects, conventional transport project benefit/cost analysis considers the increased motor vehicle traffic speeds, but ignores additional delays to pedestrian and cyclists from wider roadways and increased vehicle traffic speeds. Table 2 Consideration of Non-Motorized Transport Benefits (Litman 2007)
Usually Considered Often Overlooked Government costs Travel speed (congestion delays) Vehicle operating costs (fuel, tire wear, etc.) Per-kilometer crash rates Per-kilometer pollution emission rates Project construction environmental impacts
Downstream congestion impacts Delay to non-motorized travel (barrier effect) Parking costs Vehicle ownership and mileage-based depreciation costs Project construction traffic delays Generated traffic impacts (additional accidents, energy consumption and pollution emissions) Strategic land use impacts (e.g., sprawl) Transport diversity and equity (mobility for non-drivers) Impacts on physical activity and public health Some travelers’ preference for alternative modes
Many non-motorized transportation benefits tend to be overlooked or undervalued in conventional transport project evaluation. This report describes ways to evaluate planning decisions that affect non-motorized transport. It discusses the steps between a particular planning decision; travel activity changes; economic, social and environmental impacts; and valuation of these impacts. Because non-motorized travel is diverse, some analysis in this report only applies to certain conditions, modes or trips. For example, some analysis applies primarily to walking, others primarily to cycling, some to certain users (such as people with disabilities), and some to certain conditions (such as non-motorized access to public transit). Users should use judgment to determine what is appropriate for their analysis.
Evaluating Non-Motorized Transport Benefits and Costs Victoria Transport Policy Institute
7
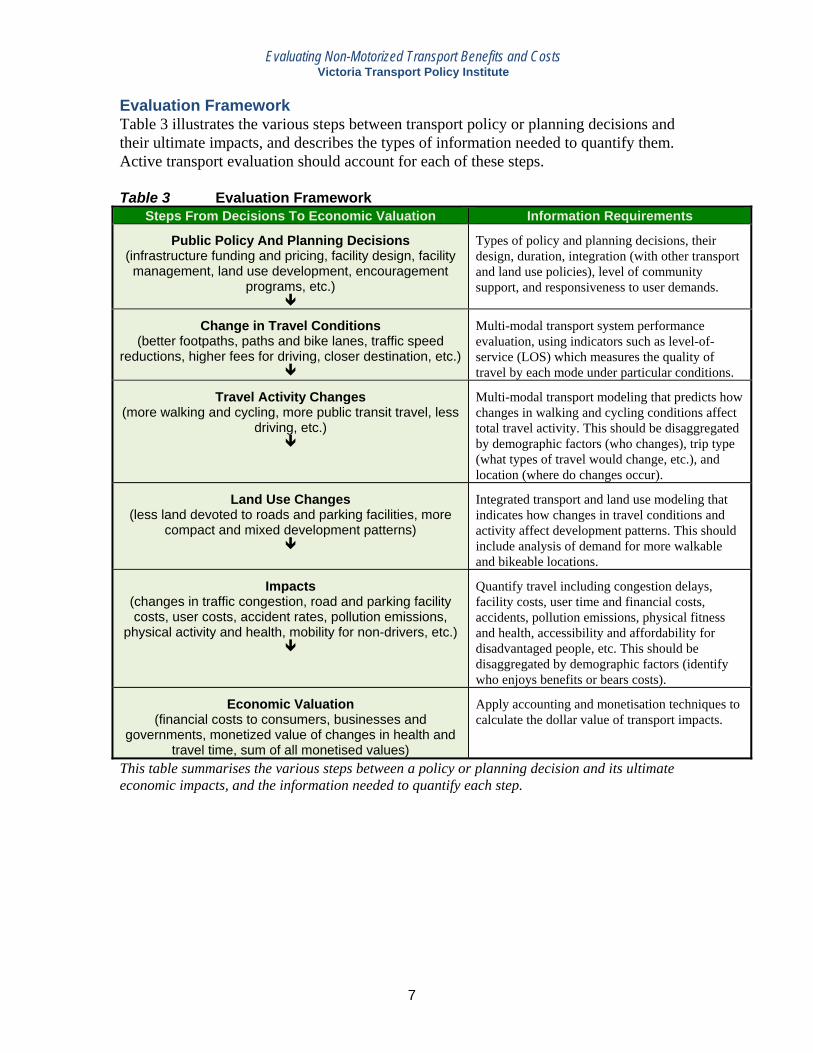
Evaluation Framework Table 3 illustrates the various steps between transport policy or planning decisions and their ultimate impacts, and describes the types of information needed to quantify them. Active transport evaluation should account for each of these steps. Table 3 Evaluation Framework
Steps From Decisions To Economic Valuation Information Requirements
Public Policy And Planning Decisions (infrastructure funding and pricing, facility design, facility management, land use development, encouragement
programs, etc.)
Types of policy and planning decisions, their design, duration, integration (with other transport and land use policies), level of community support, and responsiveness to user demands.
Change in Travel Conditions (better footpaths, paths and bike lanes, traffic speed
reductions, higher fees for driving, closer destination, etc.)
Multi-modal transport system performance evaluation, using indicators such as level-of-service (LOS) which measures the quality of travel by each mode under particular conditions.
Travel Activity Changes (more walking and cycling, more public transit travel, less
driving, etc.)
Multi-modal transport modeling that predicts how changes in walking and cycling conditions affect total travel activity. This should be disaggregated by demographic factors (who changes), trip type (what types of travel would change, etc.), and location (where do changes occur).
Land Use Changes (less land devoted to roads and parking facilities, more
compact and mixed development patterns)
Integrated transport and land use modeling that indicates how changes in travel conditions and activity affect development patterns. This should include analysis of demand for more walkable and bikeable locations.
Impacts (changes in traffic congestion, road and parking facility costs, user costs, accident rates, pollution emissions,
physical activity and health, mobility for non-drivers, etc.)
Quantify travel including congestion delays, facility costs, user time and financial costs, accidents, pollution emissions, physical fitness and health, accessibility and affordability for disadvantaged people, etc. This should be disaggregated by demographic factors (identify who enjoys benefits or bears costs).
Economic Valuation (financial costs to consumers, businesses and
governments, monetized value of changes in health and travel time, sum of all monetised values)
Apply accounting and monetisation techniques to calculate the dollar value of transport impacts.
This table summarises the various steps between a policy or planning decision and its ultimate economic impacts, and the information needed to quantify each step.
Evaluating Non-Motorized Transport Benefits and Costs Victoria Transport Policy Institute
8
Non-Motorized Transport And Transport Diversity Many communities are, to various degrees, automobile dependent, meaning that their transport systems patterns are designed for automobile access and provide relatively poor access by other modes. The alternative is not necessarily a car-free community, rather, it is a community with a diverse, multi-modal transport system, which provides good quality walking, cycling, public transit, automobile, taxi, telework and delivery services. Because transport demands are diverse (different people, areas and trips have differing travel needs and abilities), a multi-modal transport system tends to be most efficient and equitable, because it allows each mode to be used for what it does best and provides relatively good accessibility for non-drivers (people who, for any reason, cannot rely on automobile transport). For example, it would be inefficient if, due to poor non-motorized travel conditions, physically able people who enjoy walking and cycling are forced to drive for short trips; or if, due to inadequate public transit services and inefficient road and parking pricing, people drive on congested urban corridors where it is not cost effective to expand roads and parking facilities due to high costs. A diverse transport system allows non-motorized modes to be used for short trips by physically able people, public transit to be used on congested urban corridors where expanding roads and parking facilities is costly, and automobiles to be used for longer trips to more dispersed destinations. Non-motorized modes play important roles in a diverse transport system. Walking is generally the second most common mode of transport (after automobile). Improving walking and cycling conditions allows non-motorized modes to be used for more local errands. Although cycling has a small mode share in most communities, it is efficient and cost effective, and if given suitable support can serve a significant share of travel, typically 5-15% in communities with good facilities. Walking and cycling provide access to public transit; often the best way to improve and encourage public transit travel is to improve local walking and cycling conditions. Increasing walkability involves creating more compact, mixed land use patterns, with more connected transport systems (more connected roads and paths, and better connections between different modes, such as bicycle parking at transit stations). Improved walkability also expands the range of parking spaces that can serve a destination, reducing the number of parking spaces needed in an area, which allows more compact land use development. These land use patterns help create more accessible, multi-modal communities. For these reasons, a key step in creating more diverse, efficient and equitable transport systems is to improve non-motorized travel conditions and create more walkable and bikeable communities. Even modest shifts to non-motorized travel (for example, if walking and cycling increase from 10% to 15% of total trips) can provide large benefits to users and society. The additional non-motorized travel is likely to include many high value trips, including more mobility for non-drivers, public transit access trips (and therefore an increase in public transit travel), and as a substitute for costly automobile trips (for example, for short trips in congested urban conditions, or requiring drivers to chauffeur non-drivers).
Evaluating Non-Motorized Transport Benefits and Costs Victoria Transport Policy Institute
9
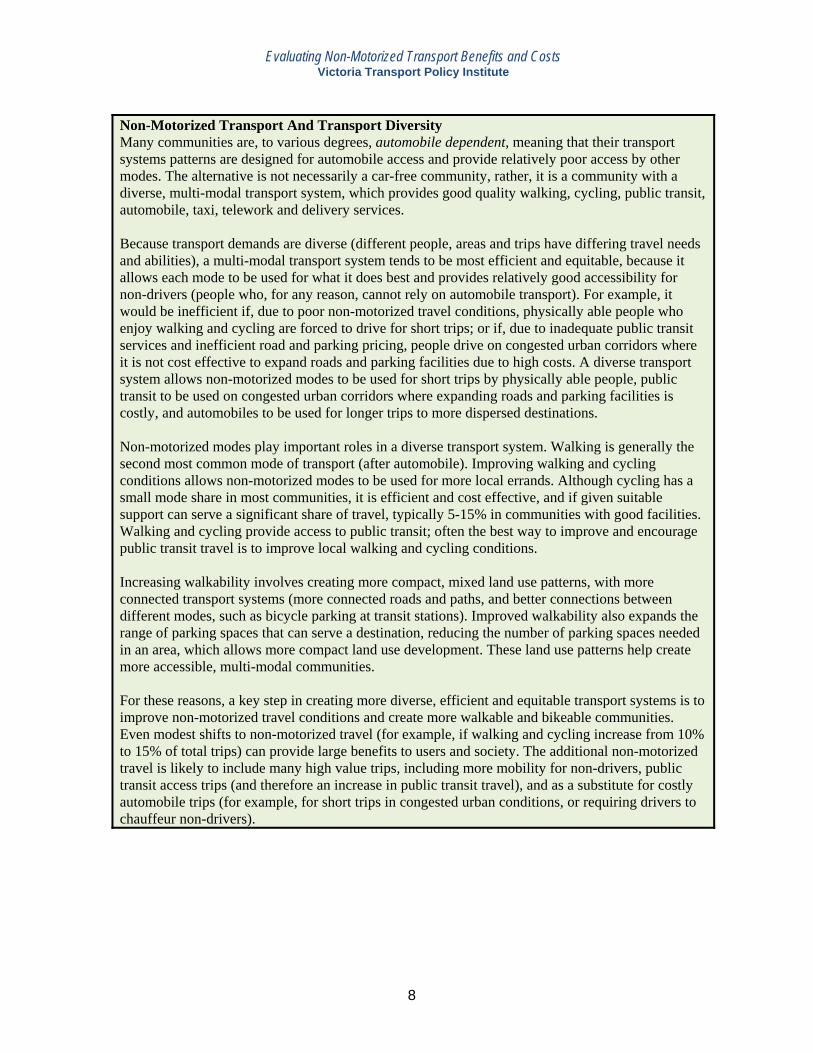
Non-Motorized Transport Demand Transport demand refers to the amount and type of travel people would choose in specific conditions. Many factors affect non-motorized travel demand including demographics and economics, walking and cycling conditions, the quality and price of alternatives, and land use patterns (Dill and Gliebe 2008). Transport modeling refers to methods used to predict how specific transport system changes will affect travel activity (Krizek, et al. 2006). Walking and cycling are generally more common than most travel statistics indicate because conventional travel surveys undercount shorter trips (those within a traffic analysis zone), off-peak trips, non-work trips, travel by children, and recreational travel (ABW 2010; Stopher and Greaves 2007). Many surveys ignore non-motorized links of motor vehicle trips, for example, a bike-transit-walk trip is usually classified simply as a transit trip, and a motorist who walks several blocks from their parked car to a destination is considered an automobile user. More comprehensive surveys indicate that non-motorized travel is three to six times more common than conventional surveys indicate (Rietveld 2000; Forsyth, Krizek and Agrawal 2010; Pike 2011), so if statistics indicate that only 5% of trips are non-motorized, the actual amount is probably 10-30% (Litman 2010). According to the 2009 National Household Travel Survey, 10.9% of personal trips are by walking and 1.0% are by bicycle, a 25% increase since 2001. Figure 1 shows the mode share for various trip lengths. For the 14% trips less than a half-mile mile in length, 46% are by non-motorized modes. For the 27% of trips less than a mile, 31% are non-motorized. For the 49% of trips under three miles, 19% are non-motorized. About half of walking and cycling trips are just for recreation and about half are for transport, and only about 5% is for commuting (Gallup 2008). This indicates that for each non-motorized commute trip there are about nine other utilitarian non-motorized trips and about ten recreational trips. Figure 1 Mode Split By Mileage Category (Litman 2010)
0%
5%
10%
15%
20%
25%
0-0.5 0.5-1 1 to 2 2 to 3 3 to 5 5 to 10 10 or More
Mileage Category
Port
ion
of T
otal
Trip
s
POVTransitBikeWalk
This figure illustrates the share of total trips by mode and trip distance category. “POV” refers to Private Owned Vehicle, which includes cars, vans, SUVs, light trucks and motorcycles.
Evaluating Non-Motorized Transport Benefits and Costs Victoria Transport Policy Institute
10
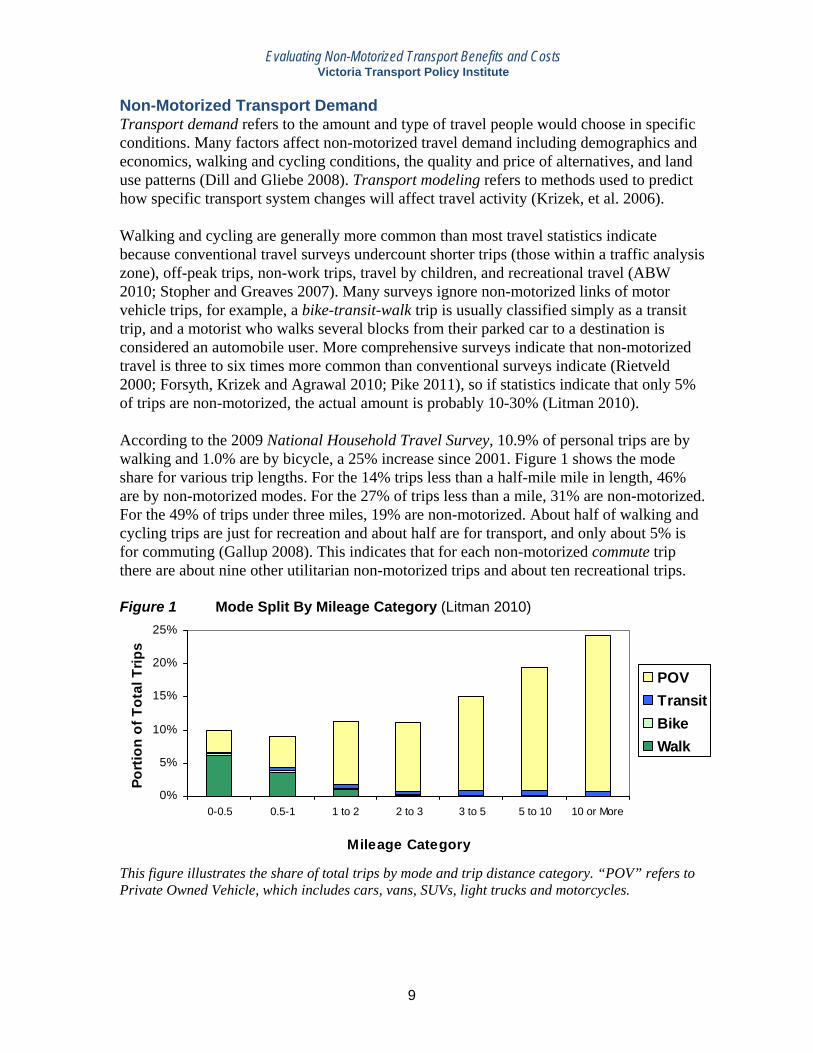
Although non-motorized modes are a small portion of total travel distance, they represent a much larger portion of share of travel time and trips. For example, the NHTS indicates that walking represents only about one percent of total mileage but more than ten percent of personal trips and travel time, as shown in Figure 2. Figure 2 Mode Share By Distance, Time and Trips (Litman 2010)
0%
5%
10%
15%
20%
Total Trips Total Travel Time Total Travel Distance
TransitBikeWalk
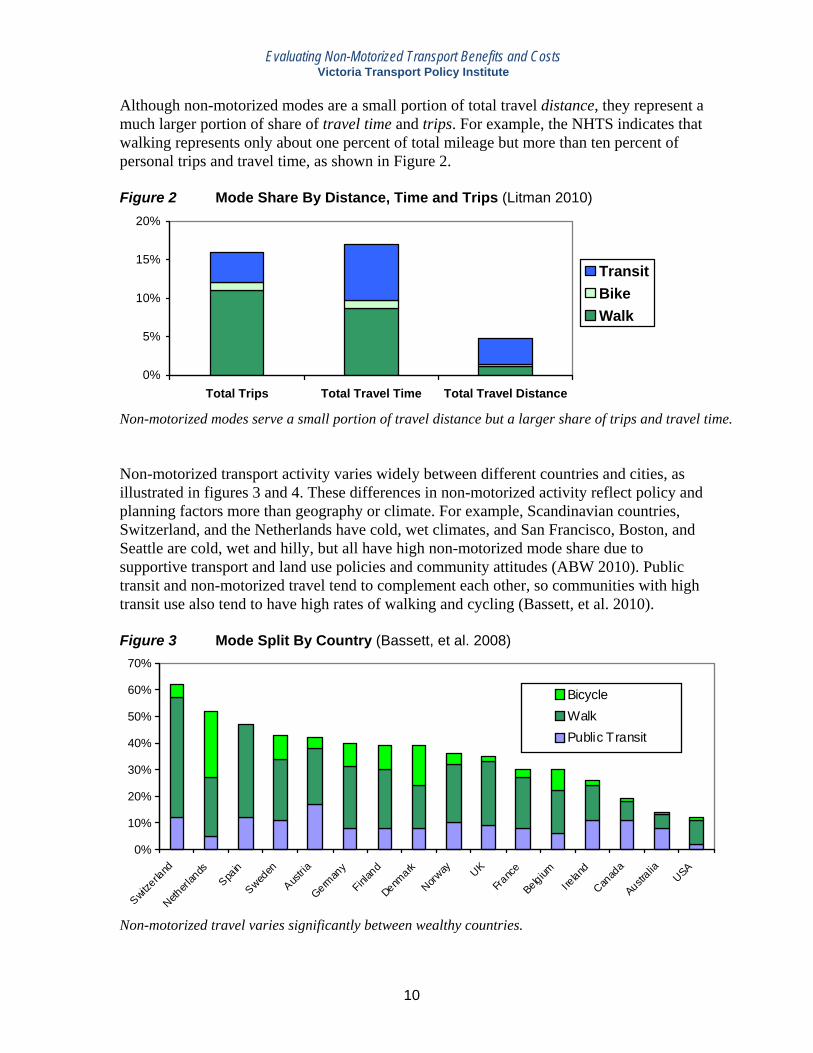
Non-motorized modes serve a small portion of travel distance but a larger share of trips and travel time. Non-motorized transport activity varies widely between different countries and cities, as illustrated in figures 3 and 4. These differences in non-motorized activity reflect policy and planning factors more than geography or climate. For example, Scandinavian countries, Switzerland, and the Netherlands have cold, wet climates, and San Francisco, Boston, and Seattle are cold, wet and hilly, but all have high non-motorized mode share due to supportive transport and land use policies and community attitudes (ABW 2010). Public transit and non-motorized travel tend to complement each other, so communities with high transit use also tend to have high rates of walking and cycling (Bassett, et al. 2010). Figure 3 Mode Split By Country (Bassett, et al. 2008)
0%
10%
20%
30%
40%
50%
60%
70%
Switzerla
nd
Netherl
ands
Spain
Sweden
Austria
German
y
Finlan
d
Denmark
Norway UK
Franc
e
BelgiumIre
land
Canad
a
Australia
USA
BicycleWalkPublic Transit
Non-motorized travel varies significantly between wealthy countries.
Evaluating Non-Motorized Transport Benefits and Costs Victoria Transport Policy Institute
11
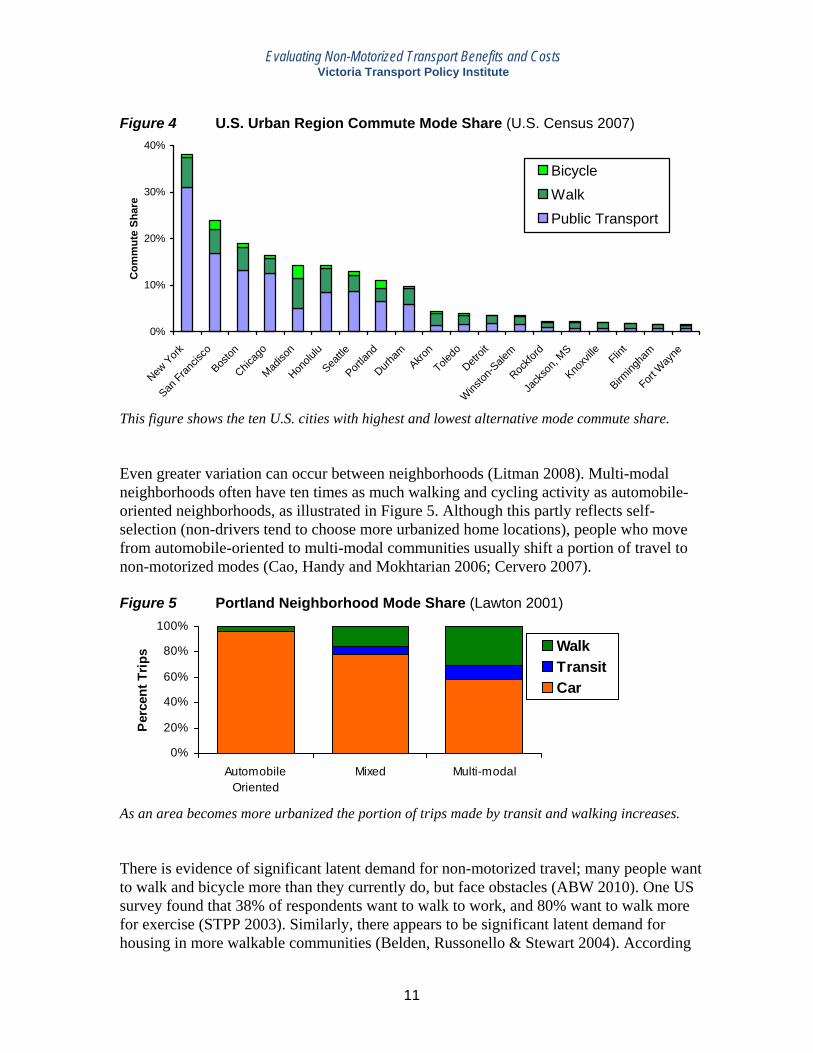
Figure 4 U.S. Urban Region Commute Mode Share (U.S. Census 2007)
0%
10%
20%
30%
40%
New Y
ork
San Fran
cisco
Boston
Chicag
o
Madiso
n
Honolu
lu
Seattle
Portlan
d
Durham
Akron
Toledo
Detroit
Winston
-Sale
m
Rockfo
rd
Jack
son,
MS
Knoxv
ille Flint
Birming
ham
Fort W
ayne
Com
mut
e Sh
are
BicycleWalkPublic Transport
This figure shows the ten U.S. cities with highest and lowest alternative mode commute share. Even greater variation can occur between neighborhoods (Litman 2008). Multi-modal neighborhoods often have ten times as much walking and cycling activity as automobile-oriented neighborhoods, as illustrated in Figure 5. Although this partly reflects self-selection (non-drivers tend to choose more urbanized home locations), people who move from automobile-oriented to multi-modal communities usually shift a portion of travel to non-motorized modes (Cao, Handy and Mokhtarian 2006; Cervero 2007). Figure 5 Portland Neighborhood Mode Share (Lawton 2001)
0%
20%
40%
60%
80%
100%
AutomobileOriented
Mixed Multi-modal
Per
cent
Trip
s WalkTransitCar
As an area becomes more urbanized the portion of trips made by transit and walking increases. There is evidence of significant latent demand for non-motorized travel; many people want to walk and bicycle more than they currently do, but face obstacles (ABW 2010). One US survey found that 38% of respondents want to walk to work, and 80% want to walk more for exercise (STPP 2003). Similarly, there appears to be significant latent demand for housing in more walkable communities (Belden, Russonello & Stewart 2004). According
Evaluating Non-Motorized Transport Benefits and Costs Victoria Transport Policy Institute
12
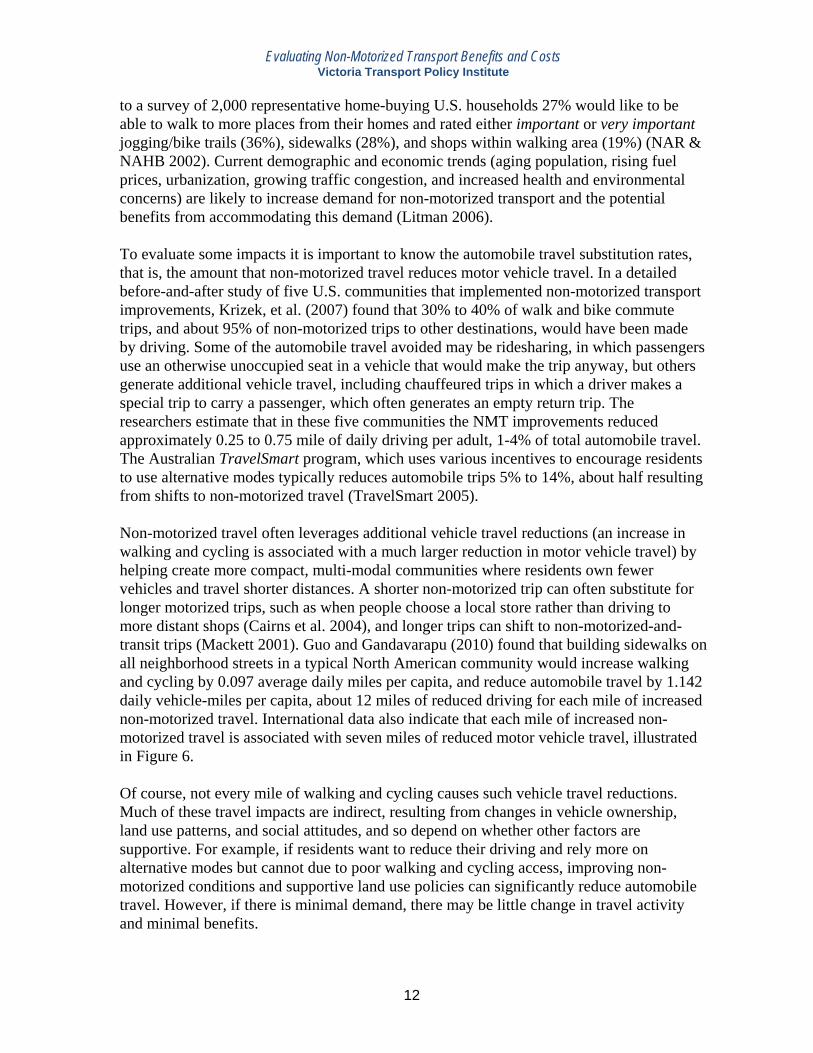
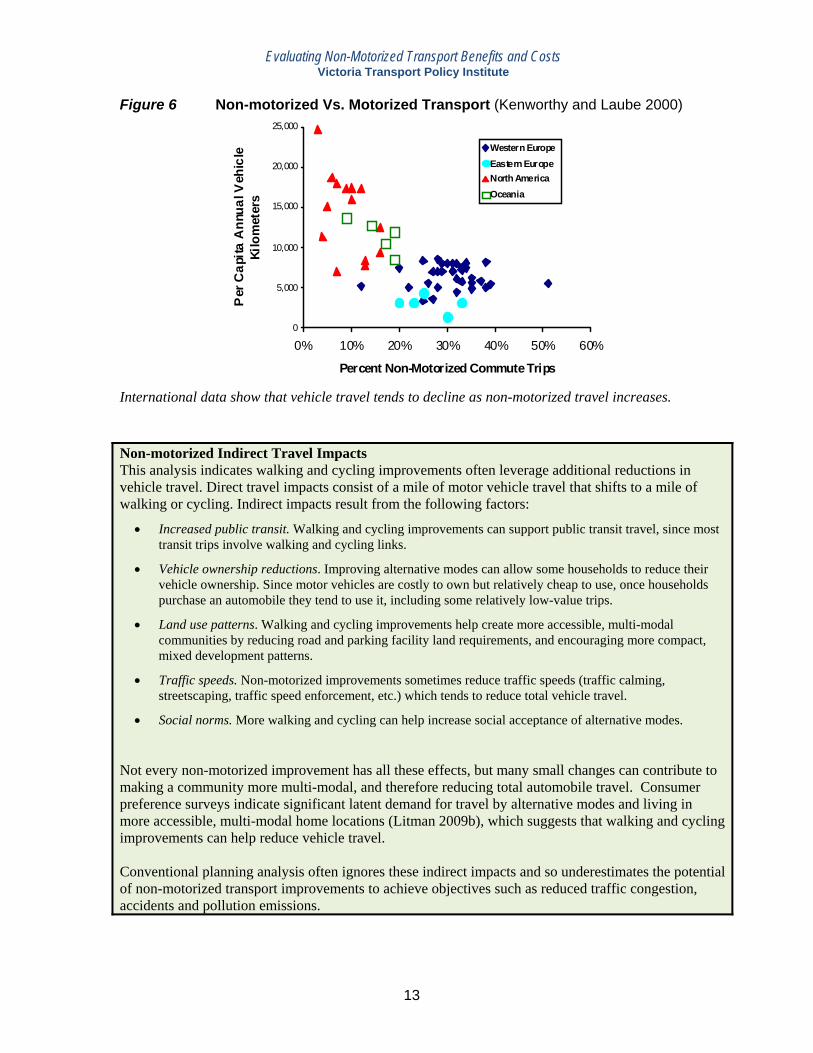
to a survey of 2,000 representative home-buying U.S. households 27% would like to be able to walk to more places from their homes and rated either important or very important jogging/bike trails (36%), sidewalks (28%), and shops within walking area (19%) (NAR & NAHB 2002). Current demographic and economic trends (aging population, rising fuel prices, urbanization, growing traffic congestion, and increased health and environmental concerns) are likely to increase demand for non-motorized transport and the potential benefits from accommodating this demand (Litman 2006). To evaluate some impacts it is important to know the automobile travel substitution rates, that is, the amount that non-motorized travel reduces motor vehicle travel. In a detailed before-and-after study of five U.S. communities that implemented non-motorized transport improvements, Krizek, et al. (2007) found that 30% to 40% of walk and bike commute trips, and about 95% of non-motorized trips to other destinations, would have been made by driving. Some of the automobile travel avoided may be ridesharing, in which passengers use an otherwise unoccupied seat in a vehicle that would make the trip anyway, but others generate additional vehicle travel, including chauffeured trips in which a driver makes a special trip to carry a passenger, which often generates an empty return trip. The researchers estimate that in these five communities the NMT improvements reduced approximately 0.25 to 0.75 mile of daily driving per adult, 1-4% of total automobile travel. The Australian TravelSmart program, which uses various incentives to encourage residents to use alternative modes typically reduces automobile trips 5% to 14%, about half resulting from shifts to non-motorized travel (TravelSmart 2005). Non-motorized travel often leverages additional vehicle travel reductions (an increase in walking and cycling is associated with a much larger reduction in motor vehicle travel) by helping create more compact, multi-modal communities where residents own fewer vehicles and travel shorter distances. A shorter non-motorized trip can often substitute for longer motorized trips, such as when people choose a local store rather than driving to more distant shops (Cairns et al. 2004), and longer trips can shift to non-motorized-and-transit trips (Mackett 2001). Guo and Gandavarapu (2010) found that building sidewalks on all neighborhood streets in a typical North American community would increase walking and cycling by 0.097 average daily miles per capita, and reduce automobile travel by 1.142 daily vehicle-miles per capita, about 12 miles of reduced driving for each mile of increased non-motorized travel. International data also indicate that each mile of increased non-motorized travel is associated with seven miles of reduced motor vehicle travel, illustrated in Figure 6. Of course, not every mile of walking and cycling causes such vehicle travel reductions. Much of these travel impacts are indirect, resulting from changes in vehicle ownership, land use patterns, and social attitudes, and so depend on whether other factors are supportive. For example, if residents want to reduce their driving and rely more on alternative modes but cannot due to poor walking and cycling access, improving non-motorized conditions and supportive land use policies can significantly reduce automobile travel. However, if there is minimal demand, there may be little change in travel activity and minimal benefits.
Evaluating Non-Motorized Transport Benefits and Costs Victoria Transport Policy Institute
13
Figure 6 Non-motorized Vs. Motorized Transport (Kenworthy and Laube 2000)
0
5,000
10,000
15,000
20,000
25,000
0% 10% 20% 30% 40% 50% 60%
Percent Non-Motorized Commute Trips
Per
Cap
ita A
nnua
l Veh
icle
Ki
lom
eter
s
Western EuropeEastern EuropeNorth AmericaOceania
International data show that vehicle travel tends to decline as non-motorized travel increases. Non-motorized Indirect Travel Impacts This analysis indicates walking and cycling improvements often leverage additional reductions in vehicle travel. Direct travel impacts consist of a mile of motor vehicle travel that shifts to a mile of walking or cycling. Indirect impacts result from the following factors:
• Increased public transit. Walking and cycling improvements can support public transit travel, since most transit trips involve walking and cycling links.
• Vehicle ownership reductions. Improving alternative modes can allow some households to reduce their vehicle ownership. Since motor vehicles are costly to own but relatively cheap to use, once households purchase an automobile they tend to use it, including some relatively low-value trips.
• Land use patterns. Walking and cycling improvements help create more accessible, multi-modal communities by reducing road and parking facility land requirements, and encouraging more compact, mixed development patterns.
• Traffic speeds. Non-motorized improvements sometimes reduce traffic speeds (traffic calming, streetscaping, traffic speed enforcement, etc.) which tends to reduce total vehicle travel.
• Social norms. More walking and cycling can help increase social acceptance of alternative modes. Not every non-motorized improvement has all these effects, but many small changes can contribute to making a community more multi-modal, and therefore reducing total automobile travel. Consumer preference surveys indicate significant latent demand for travel by alternative modes and living in more accessible, multi-modal home locations (Litman 2009b), which suggests that walking and cycling improvements can help reduce vehicle travel. Conventional planning analysis often ignores these indirect impacts and so underestimates the potential of non-motorized transport improvements to achieve objectives such as reduced traffic congestion, accidents and pollution emissions.
Evaluating Non-Motorized Transport Benefits and Costs Victoria Transport Policy Institute
14
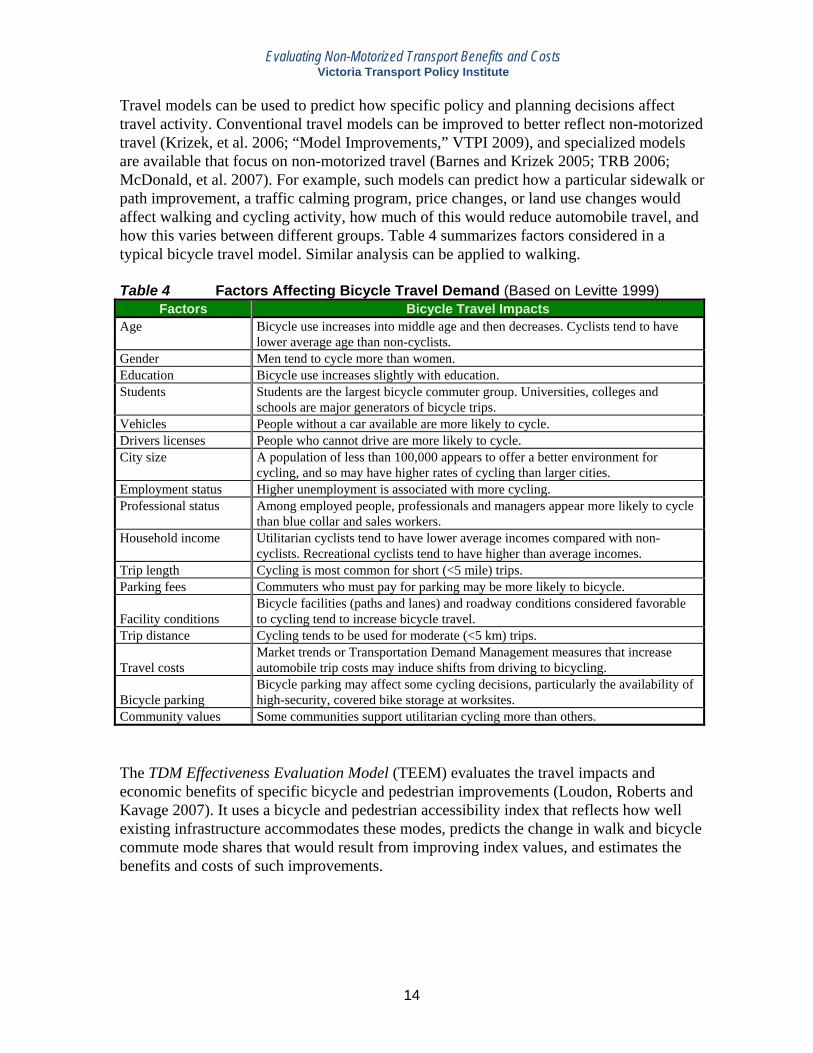
Travel models can be used to predict how specific policy and planning decisions affect travel activity. Conventional travel models can be improved to better reflect non-motorized travel (Krizek, et al. 2006; “Model Improvements,” VTPI 2009), and specialized models are available that focus on non-motorized travel (Barnes and Krizek 2005; TRB 2006; McDonald, et al. 2007). For example, such models can predict how a particular sidewalk or path improvement, a traffic calming program, price changes, or land use changes would affect walking and cycling activity, how much of this would reduce automobile travel, and how this varies between different groups. Table 4 summarizes factors considered in a typical bicycle travel model. Similar analysis can be applied to walking. Table 4 Factors Affecting Bicycle Travel Demand (Based on Levitte 1999)
Factors Bicycle Travel Impacts Age Bicycle use increases into middle age and then decreases. Cyclists tend to have
lower average age than non-cyclists. Gender Men tend to cycle more than women. Education Bicycle use increases slightly with education. Students Students are the largest bicycle commuter group. Universities, colleges and
schools are major generators of bicycle trips. Vehicles People without a car available are more likely to cycle. Drivers licenses People who cannot drive are more likely to cycle. City size A population of less than 100,000 appears to offer a better environment for
cycling, and so may have higher rates of cycling than larger cities. Employment status Higher unemployment is associated with more cycling. Professional status Among employed people, professionals and managers appear more likely to cycle
than blue collar and sales workers. Household income Utilitarian cyclists tend to have lower average incomes compared with non-
cyclists. Recreational cyclists tend to have higher than average incomes. Trip length Cycling is most common for short (<5 mile) trips. Parking fees Commuters who must pay for parking may be more likely to bicycle. Facility conditions
Bicycle facilities (paths and lanes) and roadway conditions considered favorable to cycling tend to increase bicycle travel.
Trip distance Cycling tends to be used for moderate (<5 km) trips. Travel costs
Market trends or Transportation Demand Management measures that increase automobile trip costs may induce shifts from driving to bicycling.
Bicycle parking
Bicycle parking may affect some cycling decisions, particularly the availability of high-security, covered bike storage at worksites.
Community values Some communities support utilitarian cycling more than others. The TDM Effectiveness Evaluation Model (TEEM) evaluates the travel impacts and economic benefits of specific bicycle and pedestrian improvements (Loudon, Roberts and Kavage 2007). It uses a bicycle and pedestrian accessibility index that reflects how well existing infrastructure accommodates these modes, predicts the change in walk and bicycle commute mode shares that would result from improving index values, and estimates the benefits and costs of such improvements.
Evaluating Non-Motorized Transport Benefits and Costs Victoria Transport Policy Institute
15
Evaluating Non-Motorized Travel Conditions Performance indicators are widely used to evaluate problems, prioritize improvements and measure progress (“Performance Evaluation” VTPI 2009). Below are examples of non-motorized transport performance indicators:
• Level-of-Service (LOS, also called Service Quality) rates performance from A (best) to F (worst). Until recently, only motor vehicle LOS ratings were available, but in recent years rating systems have been developed for non-motorized modes (TRB 2008; Walkability Tools Research Website, www.levelofservice.com). These include: 1. Cycling LOS considers the availability of parallel bicycle paths, the number of unsignalized
intersections and driveways, outside through lane and bike lane widths, motor vehicle traffic volumes and speeds, portion of heavy vehicles, the presence of parallel parked cars, grades (hills), and special conflicts such as freeway off-ramps.
2. Pedestrian LOS considers pedestrian facility crowding, the presence of sidewalks and paths, vehicle traffic speeds and volumes, perceived separation between pedestrians and motor vehicle traffic (including barriers such as parked cars and trees), street crossing widths, extra walking required to reach crosswalks, average pedestrian road crossing delay, and special conflicts.
• WalkScore (www.walkscore.com) calculates a location’s proximity to services such as
stores, schools and parks, as an indication of the ease of walking to such destinations. It provides no information on walking condition quality.
• Neighborhood Bikeability Score (www.ibpi.usp.pdx.edu/neighborhoods.php) is a rating from 0 (worst) to 100 (best) that indicates the number of destinations (stores, schools, parks, etc.) that can be reached within a 20-minute bike ride, taking into account the quality of cycling infrastructure (McNeil 2010).
• The Walkability Checklist and Bikeability Checklist developed by the Pedestrian and Bicycle Information Center (www.walkinginfo.org) includes ratings for road and off-road facilities, user behavior, and ways to improve walking and bicycling conditions.
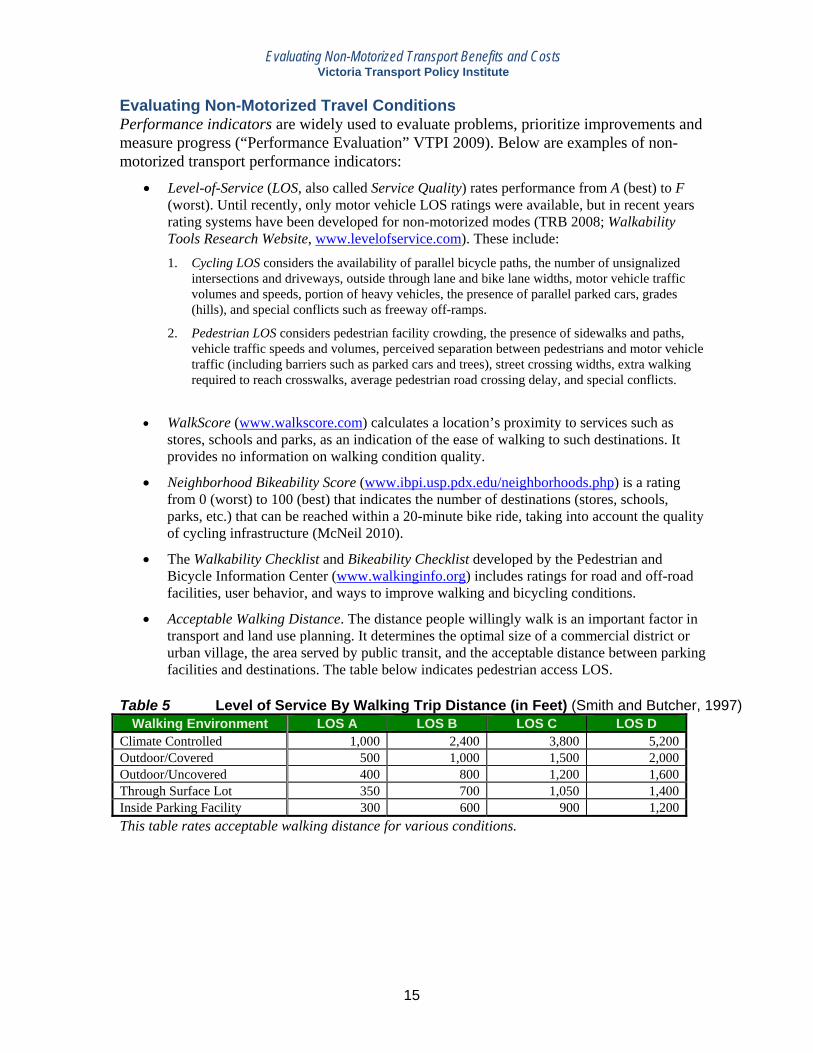
• Acceptable Walking Distance. The distance people willingly walk is an important factor in transport and land use planning. It determines the optimal size of a commercial district or urban village, the area served by public transit, and the acceptable distance between parking facilities and destinations. The table below indicates pedestrian access LOS.
Table 5 Level of Service By Walking Trip Distance (in Feet) (Smith and Butcher, 1997)
Walking Environment LOS A LOS B LOS C LOS D Climate Controlled 1,000 2,400 3,800 5,200Outdoor/Covered 500 1,000 1,500 2,000Outdoor/Uncovered 400 800 1,200 1,600Through Surface Lot 350 700 1,050 1,400Inside Parking Facility 300 600 900 1,200This table rates acceptable walking distance for various conditions.
Evaluating Non-Motorized Transport Benefits and Costs Victoria Transport Policy Institute
16
NMT Improvement and Encouragement Strategies There are many possible ways to improve and encourage non-motorized transport (Alta Planning 2005; FHWA 2004; VTPI 2010). Non-motorized transport improvement and encouragement programs tend to have synergistic effects (total impacts are greater than the sum of their individual impacts), so it is generally best to implement and evaluate integrated programs. Experts generally recommend that non-motorized plans include Four Es: engineering, encouragement, education and enforcement. Below are examples:
• Walking and cycling facility improvements. Improved sidewalks, crosswalks, paths, bikelanes, bicycle parking and changing facilities. Apply universal design, which refers to design features that accommodate all possible users, including wheelchair and handcart users, and people who cannot read local languages.
• Non-motorized transport encouragement and safety programs. Special programs that encourage people to walk and bicycle for transport, and teach safety skills.
• Public bikes (easy-to-rent bikes distributed around a community).
• Roadway redesign, including traffic calming, road diets, and traffic speed controls. Traffic calming changes roadway design to reduce traffic speeds. Road diets reduce the number of traffic lanes, particularly on urban arterials. Traffic speed controls can involve driver information, changes in posted speed limits, and increased enforcement.
• Improved road and path connectivity. More connected roadway and pathway systems allow more direct travel between destinations. Walking and cycling shortcuts are particularly effective at encouraging motorized to non-motorized travel shifts.
• Public transport improvements. Public transport complements active transport: Public transit improvements often involve pedestrian and cycling facility improvements (such as better sidewalks and bicycle parking), and it can reduce vehicle traffic and sprawl.
• Commute trip reduction programs. This includes various programs that encourage use of alternative modes, particularly for commuting to work and school. These often include features that encourage non-motorized travel such as improving bicycle parking or financial rewards such as parking cash out.
• Pricing reforms. This includes more efficient road, parking, insurance and fuel pricing (motorists pay directly for costs they impose).
• Smart growth (also called new urban, transit-oriented development, and location-efficient development) land use policies. More compact, mixed, connected land use, and reduced parking supply tends to improve walking and cycling conditions and encourage use of active modes by reducing the distances people must travel to reach common destinations such as shops, schools, parks, public transit, and friends.
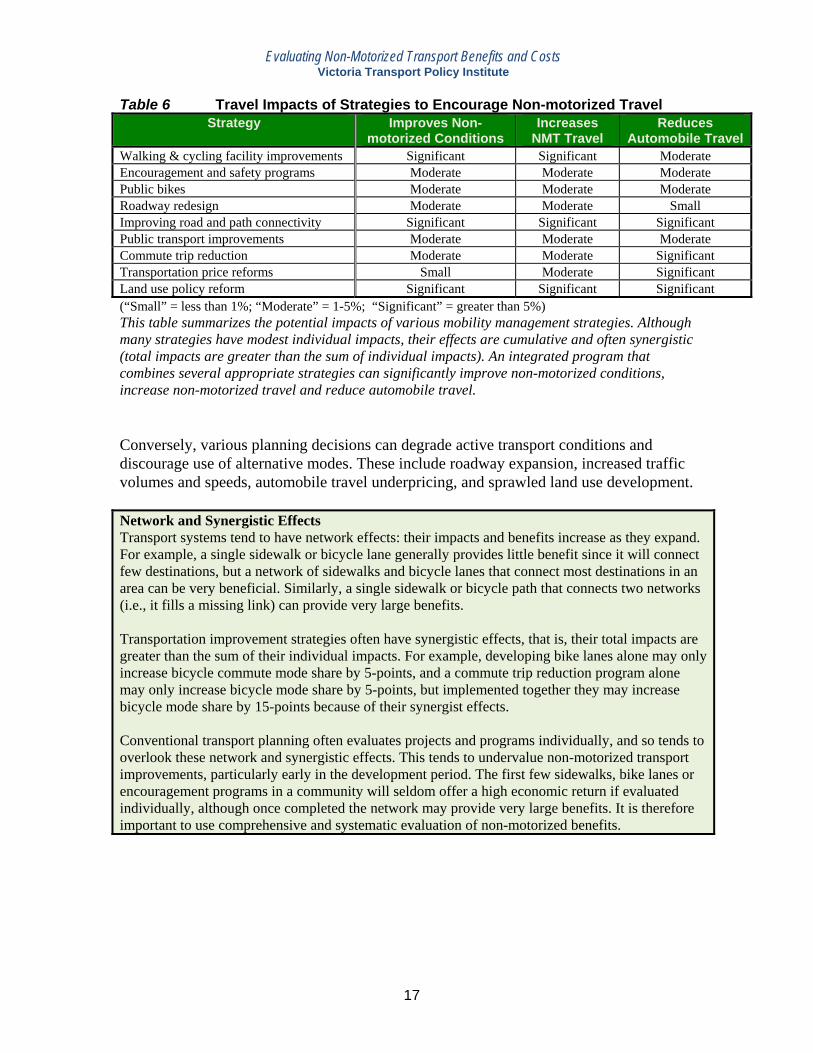
Table 6 summarizes the travel impacts of these strategies. Some strategies only affect a portion of total travel (for example, Commute Trip Reduction programs only affect commute travel at participating worksites). A combination of these strategies can have significant impacts, improving non-motorized travel conditions, increasing non-motorized travel, and shifting 10-30% of motorized travel to non-motorized modes.
Evaluating Non-Motorized Transport Benefits and Costs Victoria Transport Policy Institute
17
Table 6 Travel Impacts of Strategies to Encourage Non-motorized Travel Strategy Improves Non-
motorized Conditions Increases
NMT Travel Reduces
Automobile TravelWalking & cycling facility improvements Significant Significant Moderate Encouragement and safety programs Moderate Moderate Moderate Public bikes Moderate Moderate Moderate Roadway redesign Moderate Moderate Small Improving road and path connectivity Significant Significant Significant Public transport improvements Moderate Moderate ModerateCommute trip reduction Moderate Moderate Significant Transportation price reforms Small Moderate Significant Land use policy reform Significant Significant Significant (“Small” = less than 1%; “Moderate” = 1-5%; “Significant” = greater than 5%) This table summarizes the potential impacts of various mobility management strategies. Although many strategies have modest individual impacts, their effects are cumulative and often synergistic (total impacts are greater than the sum of individual impacts). An integrated program that combines several appropriate strategies can significantly improve non-motorized conditions, increase non-motorized travel and reduce automobile travel. Conversely, various planning decisions can degrade active transport conditions and discourage use of alternative modes. These include roadway expansion, increased traffic volumes and speeds, automobile travel underpricing, and sprawled land use development. Network and Synergistic Effects Transport systems tend to have network effects: their impacts and benefits increase as they expand. For example, a single sidewalk or bicycle lane generally provides little benefit since it will connect few destinations, but a network of sidewalks and bicycle lanes that connect most destinations in an area can be very beneficial. Similarly, a single sidewalk or bicycle path that connects two networks (i.e., it fills a missing link) can provide very large benefits. Transportation improvement strategies often have synergistic effects, that is, their total impacts are greater than the sum of their individual impacts. For example, developing bike lanes alone may only increase bicycle commute mode share by 5-points, and a commute trip reduction program alone may only increase bicycle mode share by 5-points, but implemented together they may increase bicycle mode share by 15-points because of their synergist effects. Conventional transport planning often evaluates projects and programs individually, and so tends to overlook these network and synergistic effects. This tends to undervalue non-motorized transport improvements, particularly early in the development period. The first few sidewalks, bike lanes or encouragement programs in a community will seldom offer a high economic return if evaluated individually, although once completed the network may provide very large benefits. It is therefore important to use comprehensive and systematic evaluation of non-motorized benefits.
Evaluating Non-Motorized Transport Benefits and Costs Victoria Transport Policy Institute
18
Non-Motorized Planning Resources
AASHTO (2004), Guide for the Planning, Design, and Operation of Pedestrian Facilities, American Association of State Highway and Transportation Officials (www.aashto.org).
Nelson\Nygaard (2009), Abu Dhabi Urban Street Design Manual, Urban Planning Council (www.upc.gov.ae); at www.upc.gov.ae/guidelines/urban-street-design-manual.aspx?lang=en-US.
ABW (2010), Bicycling and Walking in the U.S.: 2010 Benchmarking Report, Alliance for Biking & Walking (www.peoplepoweredmovement.org/site/index.php/site/memberservices/C529)
Alta Planning (2005), Caltrans Pedestrian and Bicycle Facilities Technical Reference Guide, California DOT (www.dot.ca.gov/hq/traffops/survey/pedestrian/TR_MAY0405.pdf).
Bicycle Information Center (www.bicyclinginfo.org), provides nonmotorized planning information.
Bicyclepedia (www.bicyclinginfo.org/bikecost), bicycle facility benefit/cost analysis tool.
Complete Streets (www.completestreets.org), provides information on multi-modal road planning.
FHWA Bicycle and Pedestrian Program Office (www.fhwa.dot.gov/environment/bikeped) promotes bicycle and pedestrian accessibility, use and safety.
Fietsberaad (www.fietsberaad.nl), the Dutch Centre of Expertise on Bicycle Policy develops and disseminates practical knowledge and experience for improving and encouraging cycling.
GTZ (2009), Cycling-inclusive Policy Development: A Handbook, Sustainable Urban Transport Project (www.sutp.org/index.php?option=com_content&task=view&id=1462&Itemid=1&lang=uk)
David Harkey and Charles Zegeer (2004), PEDSAFE: Pedestrian Safety Guide and Countermeasure Selection System, Pedestrian and Bicycling Information Center (www.walkinginfo.org); at www.walkinginfo.org/library/details.cfm?id=10.
ITE (2010), Designing Walkable Urban Thoroughfares: A Context Sensitive Approach, Institute of Transportation Engineers (www.ite.org/css); at www.ite.org/emodules/scriptcontent/Orders/ProductDetail.cfm?pc=RP-036A-E.
PBIC (2009), Assessing Walking Conditions With An Audit, Pedestrian and Bicycle Information Center (www.walkinginfo.org); at www.walkinginfo.org/problems/audits.cfm.
PROWAC (2007), Accessible Public Rights-of-Way: Planning and Designing for Alterations, Access Board (www.access-board.gov); at www.access-board.gov/prowac/alterations/guide.htm.
VTPI (2010), Online TDM Encyclopedia, Victoria Transport Policy Institute (www.vtpi.org/tdm).
Walk Friendly Communities (www.walkfriendly.org) is a USDOT program that encourages communities to create safer walking environments.
WFC (2010), Walk Friendly Community Assessment Tool, Walk Friendly Communities (www.walkfriendly.org).
Charles V. Zegeer, Laura Sandt and Margaret Scully (2009), How to Develop a Pedestrian Safety Accident Plan, National Highway Traffic Safety Administration, U.S. Federal Highway Administration; at http://safety.fhwa.dot.gov/ped_bike/docs/fhwasa0512.pdf.
Evaluating Non-Motorized Transport Benefits and Costs Victoria Transport Policy Institute
19
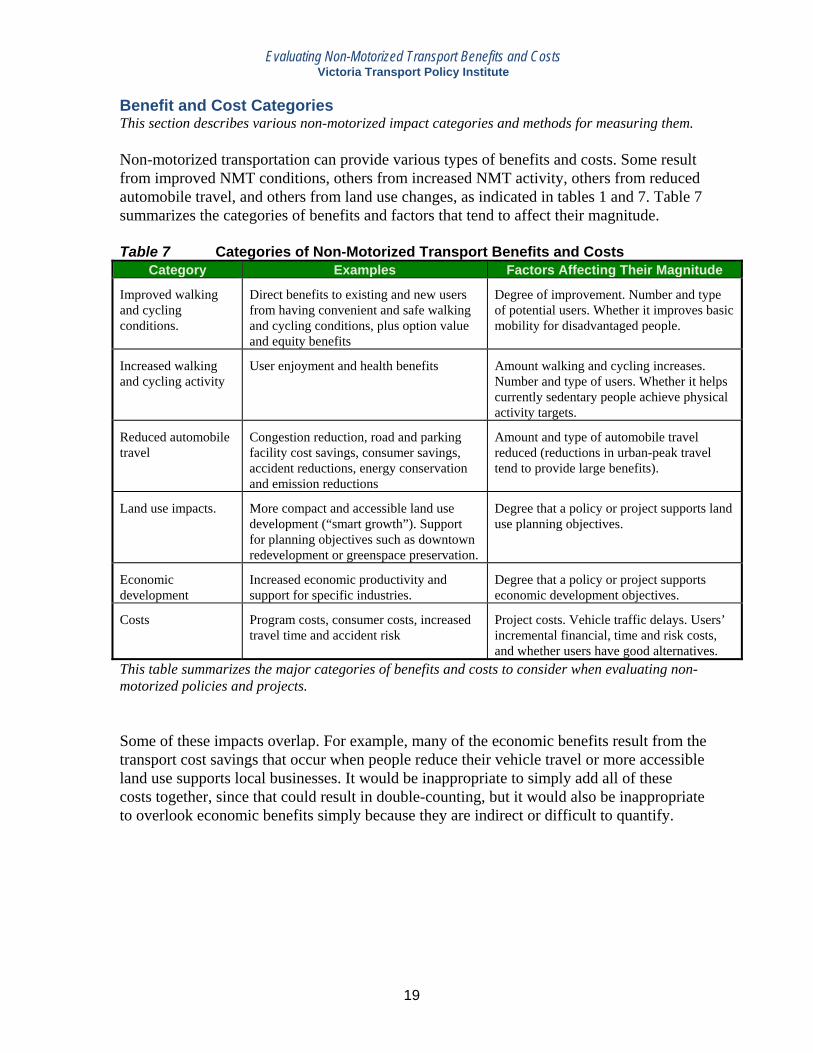
Benefit and Cost Categories This section describes various non-motorized impact categories and methods for measuring them. Non-motorized transportation can provide various types of benefits and costs. Some result from improved NMT conditions, others from increased NMT activity, others from reduced automobile travel, and others from land use changes, as indicated in tables 1 and 7. Table 7 summarizes the categories of benefits and factors that tend to affect their magnitude. Table 7 Categories of Non-Motorized Transport Benefits and Costs
Category Examples Factors Affecting Their Magnitude
Improved walking and cycling conditions.
Direct benefits to existing and new users from having convenient and safe walking and cycling conditions, plus option value and equity benefits
Degree of improvement. Number and type of potential users. Whether it improves basic mobility for disadvantaged people.
Increased walking and cycling activity
User enjoyment and health benefits Amount walking and cycling increases. Number and type of users. Whether it helps currently sedentary people achieve physical activity targets.
Reduced automobile travel
Congestion reduction, road and parking facility cost savings, consumer savings, accident reductions, energy conservation and emission reductions
Amount and type of automobile travel reduced (reductions in urban-peak travel tend to provide large benefits).
Land use impacts. More compact and accessible land use development (“smart growth”). Support for planning objectives such as downtown redevelopment or greenspace preservation.
Degree that a policy or project supports land use planning objectives.
Economic development
Increased economic productivity and support for specific industries.
Degree that a policy or project supports economic development objectives.
Costs Program costs, consumer costs, increased travel time and accident risk
Project costs. Vehicle traffic delays. Users’ incremental financial, time and risk costs, and whether users have good alternatives.
This table summarizes the major categories of benefits and costs to consider when evaluating non-motorized policies and projects. Some of these impacts overlap. For example, many of the economic benefits result from the transport cost savings that occur when people reduce their vehicle travel or more accessible land use supports local businesses. It would be inappropriate to simply add all of these costs together, since that could result in double-counting, but it would also be inappropriate to overlook economic benefits simply because they are indirect or difficult to quantify.
Evaluating Non-Motorized Transport Benefits and Costs Victoria Transport Policy Institute
20
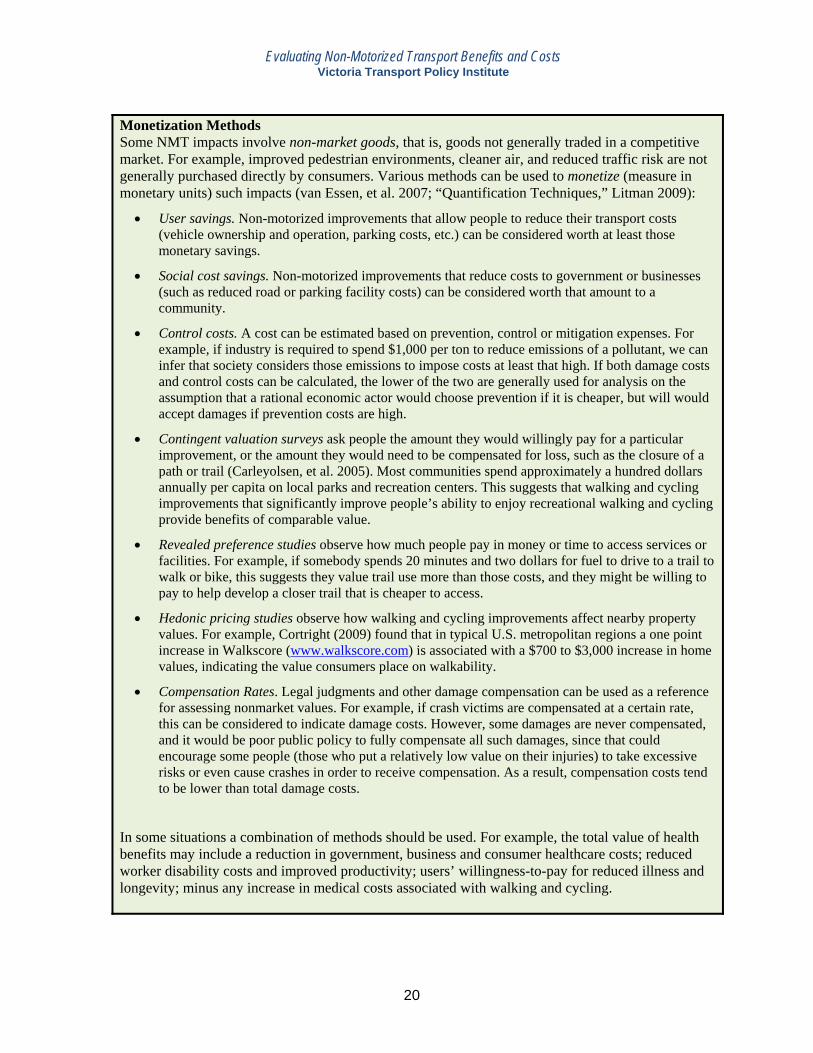
Monetization Methods Some NMT impacts involve non-market goods, that is, goods not generally traded in a competitive market. For example, improved pedestrian environments, cleaner air, and reduced traffic risk are not generally purchased directly by consumers. Various methods can be used to monetize (measure in monetary units) such impacts (van Essen, et al. 2007; “Quantification Techniques,” Litman 2009):
• User savings. Non-motorized improvements that allow people to reduce their transport costs (vehicle ownership and operation, parking costs, etc.) can be considered worth at least those monetary savings.
• Social cost savings. Non-motorized improvements that reduce costs to government or businesses (such as reduced road or parking facility costs) can be considered worth that amount to a community.
• Control costs. A cost can be estimated based on prevention, control or mitigation expenses. For example, if industry is required to spend $1,000 per ton to reduce emissions of a pollutant, we can infer that society considers those emissions to impose costs at least that high. If both damage costs and control costs can be calculated, the lower of the two are generally used for analysis on the assumption that a rational economic actor would choose prevention if it is cheaper, but will would accept damages if prevention costs are high.
• Contingent valuation surveys ask people the amount they would willingly pay for a particular improvement, or the amount they would need to be compensated for loss, such as the closure of a path or trail (Carleyolsen, et al. 2005). Most communities spend approximately a hundred dollars annually per capita on local parks and recreation centers. This suggests that walking and cycling improvements that significantly improve people’s ability to enjoy recreational walking and cycling provide benefits of comparable value.
• Revealed preference studies observe how much people pay in money or time to access services or facilities. For example, if somebody spends 20 minutes and two dollars for fuel to drive to a trail to walk or bike, this suggests they value trail use more than those costs, and they might be willing to pay to help develop a closer trail that is cheaper to access.
• Hedonic pricing studies observe how walking and cycling improvements affect nearby property values. For example, Cortright (2009) found that in typical U.S. metropolitan regions a one point increase in Walkscore (www.walkscore.com) is associated with a $700 to $3,000 increase in home values, indicating the value consumers place on walkability.
• Compensation Rates. Legal judgments and other damage compensation can be used as a reference for assessing nonmarket values. For example, if crash victims are compensated at a certain rate, this can be considered to indicate damage costs. However, some damages are never compensated, and it would be poor public policy to fully compensate all such damages, since that could encourage some people (those who put a relatively low value on their injuries) to take excessive risks or even cause crashes in order to receive compensation. As a result, compensation costs tend to be lower than total damage costs.
In some situations a combination of methods should be used. For example, the total value of health benefits may include a reduction in government, business and consumer healthcare costs; reduced worker disability costs and improved productivity; users’ willingness-to-pay for reduced illness and longevity; minus any increase in medical costs associated with walking and cycling.
Evaluating Non-Motorized Transport Benefits and Costs Victoria Transport Policy Institute
21
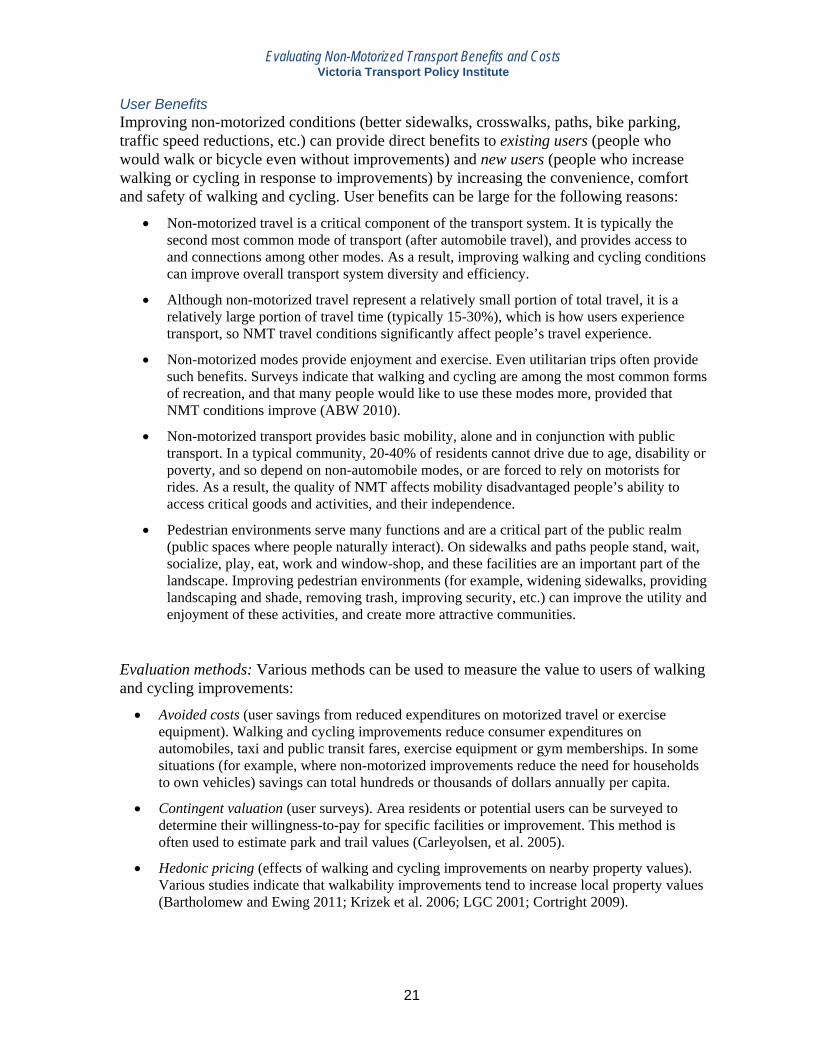
User Benefits Improving non-motorized conditions (better sidewalks, crosswalks, paths, bike parking, traffic speed reductions, etc.) can provide direct benefits to existing users (people who would walk or bicycle even without improvements) and new users (people who increase walking or cycling in response to improvements) by increasing the convenience, comfort and safety of walking and cycling. User benefits can be large for the following reasons:
• Non-motorized travel is a critical component of the transport system. It is typically the second most common mode of transport (after automobile travel), and provides access to and connections among other modes. As a result, improving walking and cycling conditions can improve overall transport system diversity and efficiency.
• Although non-motorized travel represent a relatively small portion of total travel, it is a relatively large portion of travel time (typically 15-30%), which is how users experience transport, so NMT travel conditions significantly affect people’s travel experience.
• Non-motorized modes provide enjoyment and exercise. Even utilitarian trips often provide such benefits. Surveys indicate that walking and cycling are among the most common forms of recreation, and that many people would like to use these modes more, provided that NMT conditions improve (ABW 2010).
• Non-motorized transport provides basic mobility, alone and in conjunction with public transport. In a typical community, 20-40% of residents cannot drive due to age, disability or poverty, and so depend on non-automobile modes, or are forced to rely on motorists for rides. As a result, the quality of NMT affects mobility disadvantaged people’s ability to access critical goods and activities, and their independence.
• Pedestrian environments serve many functions and are a critical part of the public realm (public spaces where people naturally interact). On sidewalks and paths people stand, wait, socialize, play, eat, work and window-shop, and these facilities are an important part of the landscape. Improving pedestrian environments (for example, widening sidewalks, providing landscaping and shade, removing trash, improving security, etc.) can improve the utility and enjoyment of these activities, and create more attractive communities.
Evaluation methods: Various methods can be used to measure the value to users of walking and cycling improvements:
• Avoided costs (user savings from reduced expenditures on motorized travel or exercise equipment). Walking and cycling improvements reduce consumer expenditures on automobiles, taxi and public transit fares, exercise equipment or gym memberships. In some situations (for example, where non-motorized improvements reduce the need for households to own vehicles) savings can total hundreds or thousands of dollars annually per capita.
• Contingent valuation (user surveys). Area residents or potential users can be surveyed to determine their willingness-to-pay for specific facilities or improvement. This method is often used to estimate park and trail values (Carleyolsen, et al. 2005).
• Hedonic pricing (effects of walking and cycling improvements on nearby property values). Various studies indicate that walkability improvements tend to increase local property values (Bartholomew and Ewing 2011; Krizek et al. 2006; LGC 2001; Cortright 2009).
Evaluating Non-Motorized Transport Benefits and Costs Victoria Transport Policy Institute
22
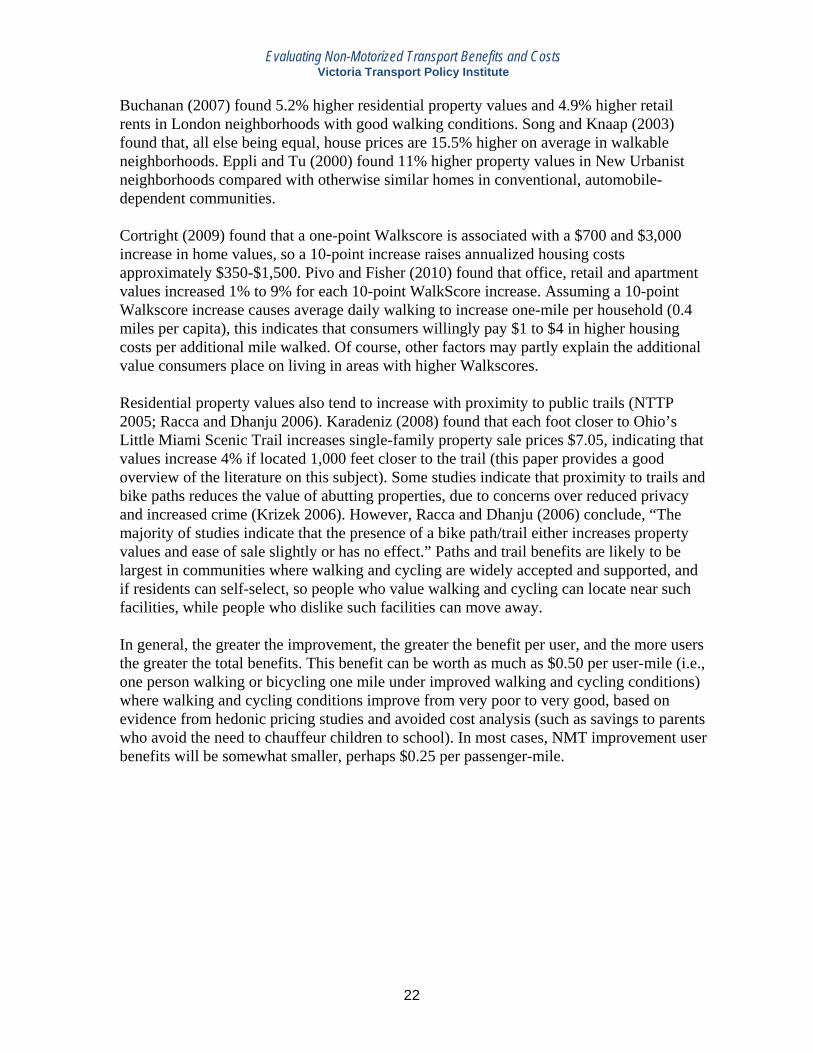
Buchanan (2007) found 5.2% higher residential property values and 4.9% higher retail rents in London neighborhoods with good walking conditions. Song and Knaap (2003) found that, all else being equal, house prices are 15.5% higher on average in walkable neighborhoods. Eppli and Tu (2000) found 11% higher property values in New Urbanist neighborhoods compared with otherwise similar homes in conventional, automobile-dependent communities. Cortright (2009) found that a one-point Walkscore is associated with a $700 and $3,000 increase in home values, so a 10-point increase raises annualized housing costs approximately $350-$1,500. Pivo and Fisher (2010) found that office, retail and apartment values increased 1% to 9% for each 10-point WalkScore increase. Assuming a 10-point Walkscore increase causes average daily walking to increase one-mile per household (0.4 miles per capita), this indicates that consumers willingly pay $1 to $4 in higher housing costs per additional mile walked. Of course, other factors may partly explain the additional value consumers place on living in areas with higher Walkscores. Residential property values also tend to increase with proximity to public trails (NTTP 2005; Racca and Dhanju 2006). Karadeniz (2008) found that each foot closer to Ohio’s Little Miami Scenic Trail increases single-family property sale prices $7.05, indicating that values increase 4% if located 1,000 feet closer to the trail (this paper provides a good overview of the literature on this subject). Some studies indicate that proximity to trails and bike paths reduces the value of abutting properties, due to concerns over reduced privacy and increased crime (Krizek 2006). However, Racca and Dhanju (2006) conclude, “The majority of studies indicate that the presence of a bike path/trail either increases property values and ease of sale slightly or has no effect.” Paths and trail benefits are likely to be largest in communities where walking and cycling are widely accepted and supported, and if residents can self-select, so people who value walking and cycling can locate near such facilities, while people who dislike such facilities can move away. In general, the greater the improvement, the greater the benefit per user, and the more users the greater the total benefits. This benefit can be worth as much as $0.50 per user-mile (i.e., one person walking or bicycling one mile under improved walking and cycling conditions) where walking and cycling conditions improve from very poor to very good, based on evidence from hedonic pricing studies and avoided cost analysis (such as savings to parents who avoid the need to chauffeur children to school). In most cases, NMT improvement user benefits will be somewhat smaller, perhaps $0.25 per passenger-mile.
Evaluating Non-Motorized Transport Benefits and Costs Victoria Transport Policy Institute
23
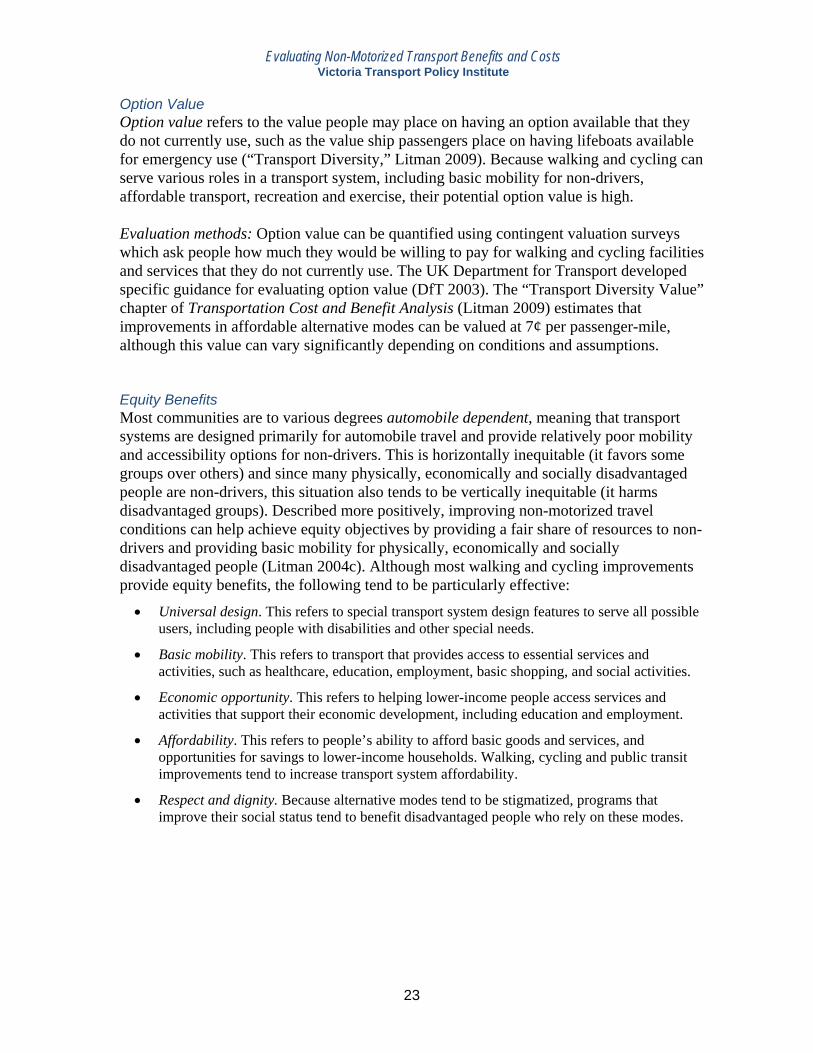
Option Value Option value refers to the value people may place on having an option available that they do not currently use, such as the value ship passengers place on having lifeboats available for emergency use (“Transport Diversity,” Litman 2009). Because walking and cycling can serve various roles in a transport system, including basic mobility for non-drivers, affordable transport, recreation and exercise, their potential option value is high. Evaluation methods: Option value can be quantified using contingent valuation surveys which ask people how much they would be willing to pay for walking and cycling facilities and services that they do not currently use. The UK Department for Transport developed specific guidance for evaluating option value (DfT 2003). The “Transport Diversity Value” chapter of Transportation Cost and Benefit Analysis (Litman 2009) estimates that improvements in affordable alternative modes can be valued at 7¢ per passenger-mile, although this value can vary significantly depending on conditions and assumptions. Equity Benefits Most communities are to various degrees automobile dependent, meaning that transport systems are designed primarily for automobile travel and provide relatively poor mobility and accessibility options for non-drivers. This is horizontally inequitable (it favors some groups over others) and since many physically, economically and socially disadvantaged people are non-drivers, this situation also tends to be vertically inequitable (it harms disadvantaged groups). Described more positively, improving non-motorized travel conditions can help achieve equity objectives by providing a fair share of resources to non-drivers and providing basic mobility for physically, economically and socially disadvantaged people (Litman 2004c). Although most walking and cycling improvements provide equity benefits, the following tend to be particularly effective:
• Universal design. This refers to special transport system design features to serve all possible users, including people with disabilities and other special needs.
• Basic mobility. This refers to transport that provides access to essential services and activities, such as healthcare, education, employment, basic shopping, and social activities.
• Economic opportunity. This refers to helping lower-income people access services and activities that support their economic development, including education and employment.
• Affordability. This refers to people’s ability to afford basic goods and services, and opportunities for savings to lower-income households. Walking, cycling and public transit improvements tend to increase transport system affordability.
• Respect and dignity. Because alternative modes tend to be stigmatized, programs that improve their social status tend to benefit disadvantaged people who rely on these modes.
Evaluating Non-Motorized Transport Benefits and Costs Victoria Transport Policy Institute
24
Evaluation methods: Various objectives and impacts can be considered in transport equity analysis (Forkenbrock and Weisbrod 2001; Forkenbrock and Sheeley 2004; Litman 2004c):
• Egalitarian equity (everybody receives equal shares) suggests that non-motorized transport should receive an approximately proportional share of transport resources, measured either as mode share or per capita. For example, if non-motorized mode share is 12%, it would be fair to spend that portion of total transport budgets on non-motorized improvements; and if governments spend $500 annually per motorist on road, parking facilities and traffic services, a comparable amount should be spent for each person who depends primarily on walking and cycling. Of course, there are many possible ways to measure these factors, which can result in different conclusions concerning what is fair.
• Cost allocation equity (each user group should pay their share of costs) suggests that public expenditures on non-motorized facilities should be comparable to what users pay in taxes.
• Impact compensation (people should compensate the harms they impose on others). To the degree that motor vehicle traffic imposes delay, risk or discomfort on non-motorized modes, there is a horizontal equity justification for motorists to finance non-motorized facilities to mitigate such impacts. To the degree that sidewalks, crosswalks and pedestrian overpasses are needed to protect pedestrians and cyclists from motor vehicle traffic impacts, it is fair that motorists should bear the costs of these facilities.
• Vertical equity (policies should favor disadvantaged people) suggests that special effort to improve non-motorized conditions is justified to the degree that disadvantaged people rely on walking or cycling. Since non-motorized modes provide basic mobility for physically, economically and socially disadvantaged people, walking and cycling improvements are likely to help achieve this objective, particularly if directed to areas or users who tend to be disadvantaged. To the degree pedestrians and cyclists are physically, economically or socially disadvantaged compared with motorists, policies that reduce these impacts increase vertical equity. For example, traffic calming and speed control, and funding cycling facilities with motor vehicle user fees, help achieve vertical equity objectives by reducing the negative impacts that automobile traffic imposes on non-motorized travelers.
Various methods can help determine the value that a community places on social equity objectives, and the degree that a particular policy or project helps achieve these objectives. For example, contingent valuation surveys can determine the amount community members are willing to pay to improve travel conditions for people who are disabled or have low incomes. Census and survey data can identify where disadvantaged populations live and travel. Transit subsidies can indicate society’s willingness-to-pay to provide mobility for non-drivers. Such subsidies average about 60¢ per transit passenger-mile, about half of which are justified to provide basic mobility for non-drivers (the other half is intended to reduce congestion, parking and pollution problems), indicating that basic mobility is worth at least 30¢ per passenger-mile to society.
Evaluating Non-Motorized Transport Benefits and Costs Victoria Transport Policy Institute
25
Physical Fitness and Health Non-motorized travel provides physical exercise which can provide physical fitness and health benefits (Pucher, et al. 2010). Even small increases in physical activity can improve public health (Sallis, et al. 2004). Experts recommend that adults spend at least 150 minutes per week (22 minutes per day) in moderate physical activity, with additional health benefits if the exercise is more rigorous and longer duration (CDC 2010). Diseases Associated With Inadequate Physical Activity • Heart disease • Hypertension • Stroke • Depression
• Diabetes • Osteoporosis (weak bones and joints) • Cancer • Dementia
Although there are many ways to be physically active, walking and cycling are among the most practical and effective, particularly for inactive and overweight people (Sevick, et al. 2000; Bassett, et al. 2010; Pucher and Beuhler 2010). Residents of more multi-modal communities exercise more and are less likely to be overweight than residents of automobile-oriented communities (Ewing, Schieber and Zegeer 2003; Frank 2004). Commuters who walk or bicycle tend to be more productive and take fewer sick days (Queensland Transport 1999). Increased walking appears to reduce long-term cognitive decline and dementia (Erickson, et al. 2010). The U.S. Center for Disease Control’s Healthy People 2020 program includes specific objectives to increase walking and cycling (www.healthypeople.gov, PAF 10 and PAF 11). Evaluation methods: Some studies monetize the health benefits of improved walking and cycling (“Safety and Health,” Litman 2009; Boarnet, Greenwald and McMillan 2008; SQW 2007; Cavill, et al. 2008). Cavill, Cope and Kennedy (2009) estimated that an integrated program that increases walking in British towns provides benefits worth £2.59 for each £1.00 spent, considering just reduced mortality. Including other benefits (reduced morbidity, congestion and pollution) would increase this value. The Department for Transport found even higher economic returns (DfT 2010). The Active Transport Quantification Tool (ICLEI 2007) provides a methodology for valuing the active transportation benefits, including savings from avoided driving, increased happiness, and reductions in coronary heart disease, diabetes risk, congestion, pollution and crash risk. Guo and Gandavarapu (2010) conclude that the incremental costs of residential sidewalk construction is usually repaid by the health benefits of increased physical fitness and reduced vehicle air pollution. They estimate that building sidewalks on all city streets would increase residents’ average daily non-motorized travel by 0.097 miles and reduce average automobile travel 1.142 vehicle-miles. The increased walking and cycling would provide an average of 15 kcal/day per capita in additional physical activity. They estimated that this intervention could offset weight gain in about 37% of the population, providing substantial healthcare cost savings.
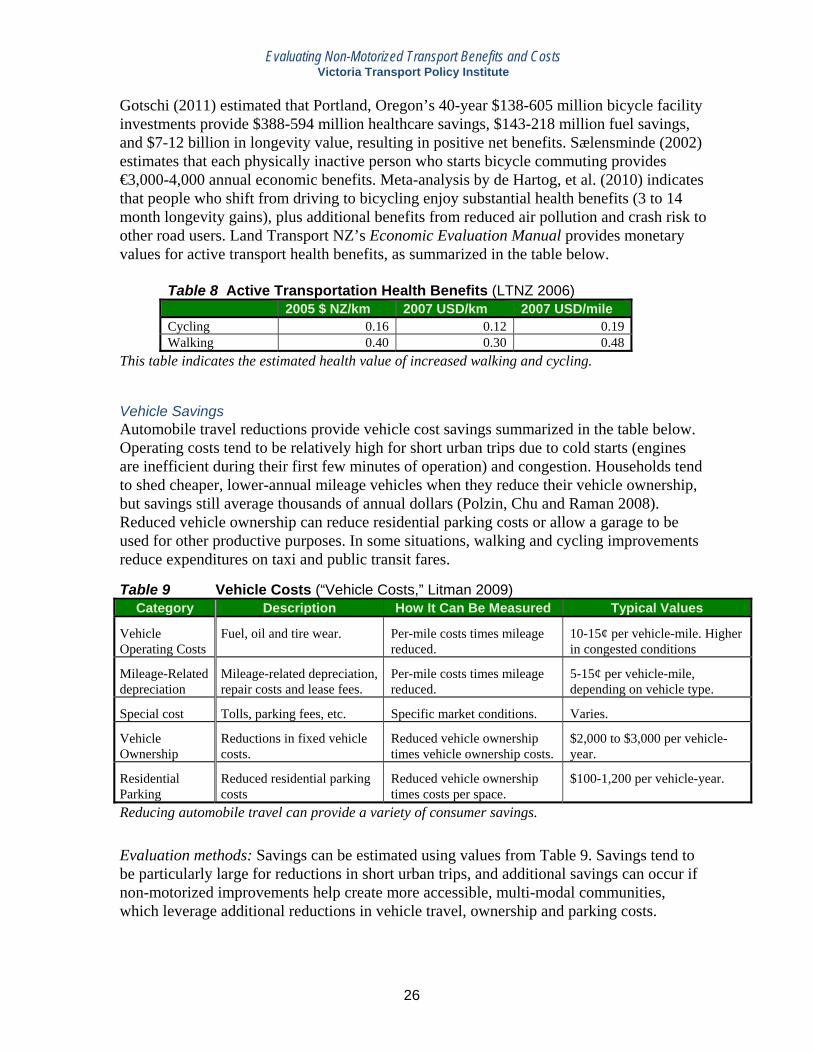
Evaluating Non-Motorized Transport Benefits and Costs Victoria Transport Policy Institute
26
Gotschi (2011) estimated that Portland, Oregon’s 40-year $138-605 million bicycle facility investments provide $388-594 million healthcare savings, $143-218 million fuel savings, and $7-12 billion in longevity value, resulting in positive net benefits. Sælensminde (2002) estimates that each physically inactive person who starts bicycle commuting provides €3,000-4,000 annual economic benefits. Meta-analysis by de Hartog, et al. (2010) indicates that people who shift from driving to bicycling enjoy substantial health benefits (3 to 14 month longevity gains), plus additional benefits from reduced air pollution and crash risk to other road users. Land Transport NZ’s Economic Evaluation Manual provides monetary values for active transport health benefits, as summarized in the table below.
Table 8 Active Transportation Health Benefits (LTNZ 2006) 2005 $ NZ/km 2007 USD/km 2007 USD/mile Cycling 0.16 0.12 0.19 Walking 0.40 0.30 0.48
This table indicates the estimated health value of increased walking and cycling. Vehicle Savings Automobile travel reductions provide vehicle cost savings summarized in the table below. Operating costs tend to be relatively high for short urban trips due to cold starts (engines are inefficient during their first few minutes of operation) and congestion. Households tend to shed cheaper, lower-annual mileage vehicles when they reduce their vehicle ownership, but savings still average thousands of annual dollars (Polzin, Chu and Raman 2008). Reduced vehicle ownership can reduce residential parking costs or allow a garage to be used for other productive purposes. In some situations, walking and cycling improvements reduce expenditures on taxi and public transit fares. Table 9 Vehicle Costs (“Vehicle Costs,” Litman 2009)
Category Description How It Can Be Measured Typical Values
Vehicle Operating Costs
Fuel, oil and tire wear. Per-mile costs times mileage reduced.
10-15¢ per vehicle-mile. Higher in congested conditions
Mileage-Related depreciation
Mileage-related depreciation, repair costs and lease fees.
Per-mile costs times mileage reduced.
5-15¢ per vehicle-mile, depending on vehicle type.
Special cost Tolls, parking fees, etc. Specific market conditions. Varies.
Vehicle Ownership
Reductions in fixed vehicle costs.
Reduced vehicle ownership times vehicle ownership costs.
$2,000 to $3,000 per vehicle-year.
Residential Parking
Reduced residential parking costs
Reduced vehicle ownership times costs per space.
$100-1,200 per vehicle-year.
Reducing automobile travel can provide a variety of consumer savings.
Evaluation methods: Savings can be estimated using values from Table 9. Savings tend to be particularly large for reductions in short urban trips, and additional savings can occur if non-motorized improvements help create more accessible, multi-modal communities, which leverage additional reductions in vehicle travel, ownership and parking costs.
Evaluating Non-Motorized Transport Benefits and Costs Victoria Transport Policy Institute
27
Avoided Chauffeuring Chauffeuring refers to extra vehicle travel to transport a passenger, as opposed to ridesharing in which a passenger is carried in a vehicle that would travel anyway. Chauffeuring is particularly inefficient because it often requires empty return trips, so transporting a passenger 5 miles generates 10 vehicle-miles. Improving alternative modes can reduce chauffeuring by providing mobility to non-drivers. This reduces driver travel time, vehicle and external costs. Non-drivers gain independence. Experts believe that walking and bicycling (for example, to school and neighborhood activities) helps children develop emotionally and socially (O’Brien 2001), and non-drivers often express unhappiness being dependent on friends and family for transport (PPI 2002). Chauffeuring can have positive value, for example, when it allows drivers and passenger to converse, but this can also occur with non-motorized travel. Chauffeur trips sometimes impose high costs, for example, when a driver must interrupt important activities to chauffeur, or when chauffeuring responsibilities cause domestic conflicts. Evaluation methods: Reduced chauffeuring benefits include previously described vehicle cost savings (including reduced vehicle ownership costs if non-motorized improvements allow some households to reduce the number of vehicle they must own), driver travel time savings which are typically estimated at 30-50% of average wage rates, and reduced external costs (congestion, accident risk and pollution). Assuming that a typical chauffeuring trip involves 5 miles of vehicle travel at 25¢ per mile in vehicle costs, and 20 minutes of travel time valued at $9.00 per hour, this totals $4.25 per trip or $0.85 per vehicle-mile. The previous sections on Option and Equity values describe methods for valuing increased independence to non-drivers. Congestion Reduction Traffic congestion costs consist of the incremental travel time, vehicle operating costs, stress and pollution emissions that a vehicle imposes on other road users (Litman 2009). Walking and cycling improvements can help reduce traffic congestion in several ways. Poor walking and cycling conditions force people to drive for even short trips. In urban areas a significant portion of automobile traffic (often 10-30%) consists of short trips that could shift to non-motorized travel (Litman 2010). In addition, walking and cycling improvements reduce traffic congestion by supporting public transit travel. Since both non-motorized travel and traffic congestion tend to increase with city size and density, simplistic analysis can imply that increased non-motorized travel increases congestion. Increased land use density tends to increase congestion intensity (measured by roadway level-of-service rating) but by reducing travel distances and improving alternative modes, it tends to reduce per capita congestion delay (“Congestion Costs,” Litman 2009). Comparing similar size cities indicates that per capita congestion delays decline as non-motorized mode share increases, as summarized in the following table. For example, New York City with 6.8% NMT mode share has about half the per capita congestion delay as Los Angeles with 3.4% NMT mode share. Philadelphia with 4.3% mode share has much less per capita congestion delay than Miami, which also has lower NMT mode share. Of course, other factors also account for these differences, particularly public transit service
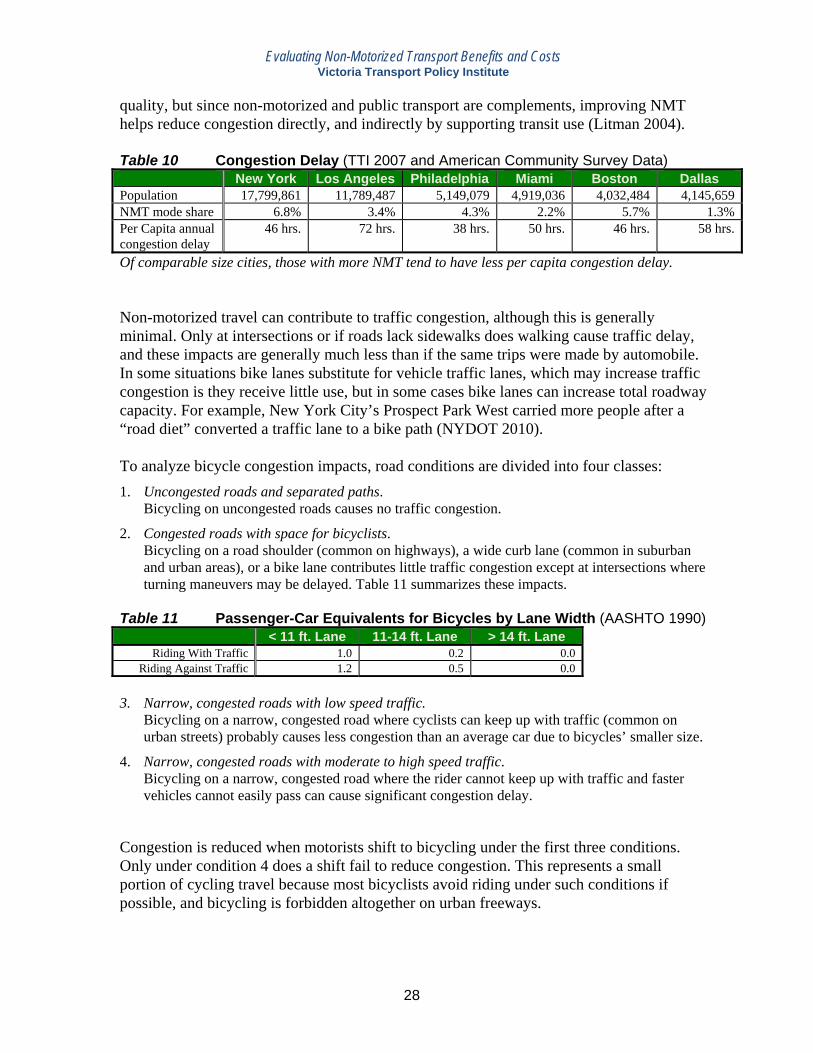
Evaluating Non-Motorized Transport Benefits and Costs Victoria Transport Policy Institute
28
quality, but since non-motorized and public transport are complements, improving NMT helps reduce congestion directly, and indirectly by supporting transit use (Litman 2004). Table 10 Congestion Delay (TTI 2007 and American Community Survey Data)
New York Los Angeles Philadelphia Miami Boston Dallas Population 17,799,861 11,789,487 5,149,079 4,919,036 4,032,484 4,145,659NMT mode share 6.8% 3.4% 4.3% 2.2% 5.7% 1.3%Per Capita annual congestion delay
46 hrs. 72 hrs. 38 hrs. 50 hrs. 46 hrs. 58 hrs.
Of comparable size cities, those with more NMT tend to have less per capita congestion delay. Non-motorized travel can contribute to traffic congestion, although this is generally minimal. Only at intersections or if roads lack sidewalks does walking cause traffic delay, and these impacts are generally much less than if the same trips were made by automobile. In some situations bike lanes substitute for vehicle traffic lanes, which may increase traffic congestion is they receive little use, but in some cases bike lanes can increase total roadway capacity. For example, New York City’s Prospect Park West carried more people after a “road diet” converted a traffic lane to a bike path (NYDOT 2010). To analyze bicycle congestion impacts, road conditions are divided into four classes: 1. Uncongested roads and separated paths.
Bicycling on uncongested roads causes no traffic congestion.
2. Congested roads with space for bicyclists. Bicycling on a road shoulder (common on highways), a wide curb lane (common in suburban and urban areas), or a bike lane contributes little traffic congestion except at intersections where turning maneuvers may be delayed. Table 11 summarizes these impacts.
Table 11 Passenger-Car Equivalents for Bicycles by Lane Width (AASHTO 1990) < 11 ft. Lane 11-14 ft. Lane > 14 ft. Lane
Riding With Traffic 1.0 0.2 0.0 Riding Against Traffic 1.2 0.5 0.0
3. Narrow, congested roads with low speed traffic.
Bicycling on a narrow, congested road where cyclists can keep up with traffic (common on urban streets) probably causes less congestion than an average car due to bicycles’ smaller size.
4. Narrow, congested roads with moderate to high speed traffic. Bicycling on a narrow, congested road where the rider cannot keep up with traffic and faster vehicles cannot easily pass can cause significant congestion delay.
Congestion is reduced when motorists shift to bicycling under the first three conditions. Only under condition 4 does a shift fail to reduce congestion. This represents a small portion of cycling travel because most bicyclists avoid riding under such conditions if possible, and bicycling is forbidden altogether on urban freeways.
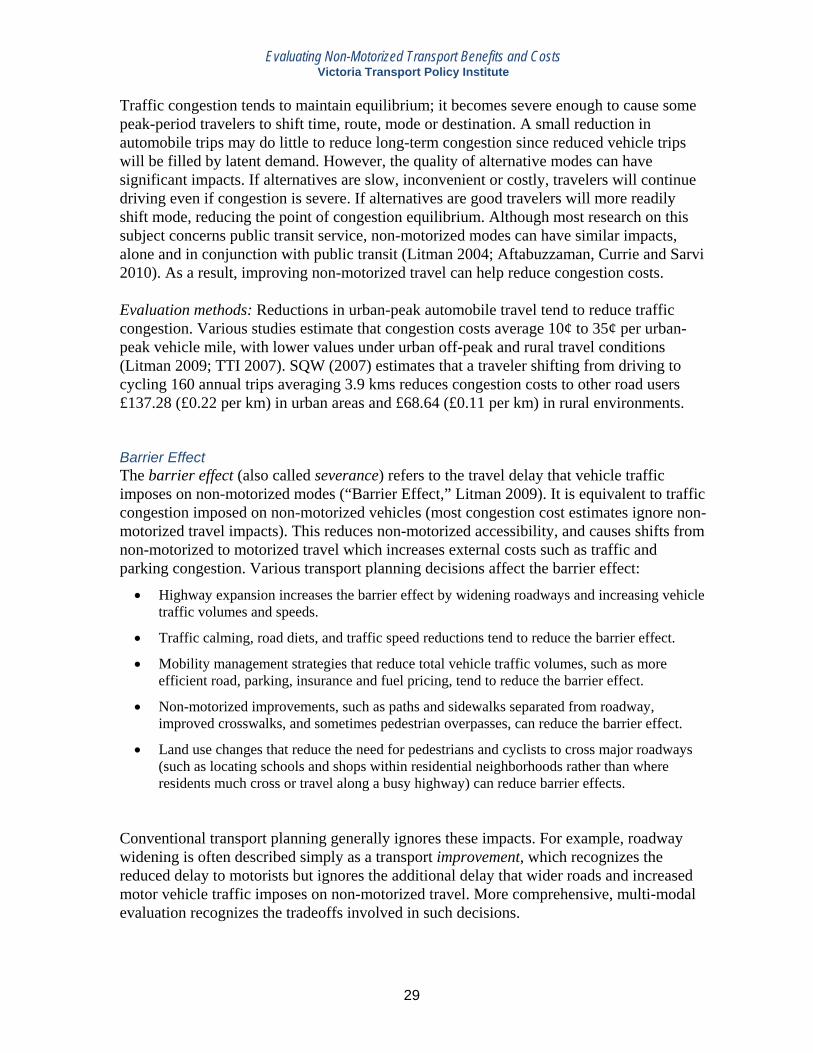
Evaluating Non-Motorized Transport Benefits and Costs Victoria Transport Policy Institute
29
Traffic congestion tends to maintain equilibrium; it becomes severe enough to cause some peak-period travelers to shift time, route, mode or destination. A small reduction in automobile trips may do little to reduce long-term congestion since reduced vehicle trips will be filled by latent demand. However, the quality of alternative modes can have significant impacts. If alternatives are slow, inconvenient or costly, travelers will continue driving even if congestion is severe. If alternatives are good travelers will more readily shift mode, reducing the point of congestion equilibrium. Although most research on this subject concerns public transit service, non-motorized modes can have similar impacts, alone and in conjunction with public transit (Litman 2004; Aftabuzzaman, Currie and Sarvi 2010). As a result, improving non-motorized travel can help reduce congestion costs. Evaluation methods: Reductions in urban-peak automobile travel tend to reduce traffic congestion. Various studies estimate that congestion costs average 10¢ to 35¢ per urban-peak vehicle mile, with lower values under urban off-peak and rural travel conditions (Litman 2009; TTI 2007). SQW (2007) estimates that a traveler shifting from driving to cycling 160 annual trips averaging 3.9 kms reduces congestion costs to other road users £137.28 (£0.22 per km) in urban areas and £68.64 (£0.11 per km) in rural environments. Barrier Effect The barrier effect (also called severance) refers to the travel delay that vehicle traffic imposes on non-motorized modes (“Barrier Effect,” Litman 2009). It is equivalent to traffic congestion imposed on non-motorized vehicles (most congestion cost estimates ignore non-motorized travel impacts). This reduces non-motorized accessibility, and causes shifts from non-motorized to motorized travel which increases external costs such as traffic and parking congestion. Various transport planning decisions affect the barrier effect:
• Highway expansion increases the barrier effect by widening roadways and increasing vehicle traffic volumes and speeds.
• Traffic calming, road diets, and traffic speed reductions tend to reduce the barrier effect.
• Mobility management strategies that reduce total vehicle traffic volumes, such as more efficient road, parking, insurance and fuel pricing, tend to reduce the barrier effect.
• Non-motorized improvements, such as paths and sidewalks separated from roadway, improved crosswalks, and sometimes pedestrian overpasses, can reduce the barrier effect.
• Land use changes that reduce the need for pedestrians and cyclists to cross major roadways (such as locating schools and shops within residential neighborhoods rather than where residents much cross or travel along a busy highway) can reduce barrier effects.
Conventional transport planning generally ignores these impacts. For example, roadway widening is often described simply as a transport improvement, which recognizes the reduced delay to motorists but ignores the additional delay that wider roads and increased motor vehicle traffic imposes on non-motorized travel. More comprehensive, multi-modal evaluation recognizes the tradeoffs involved in such decisions.
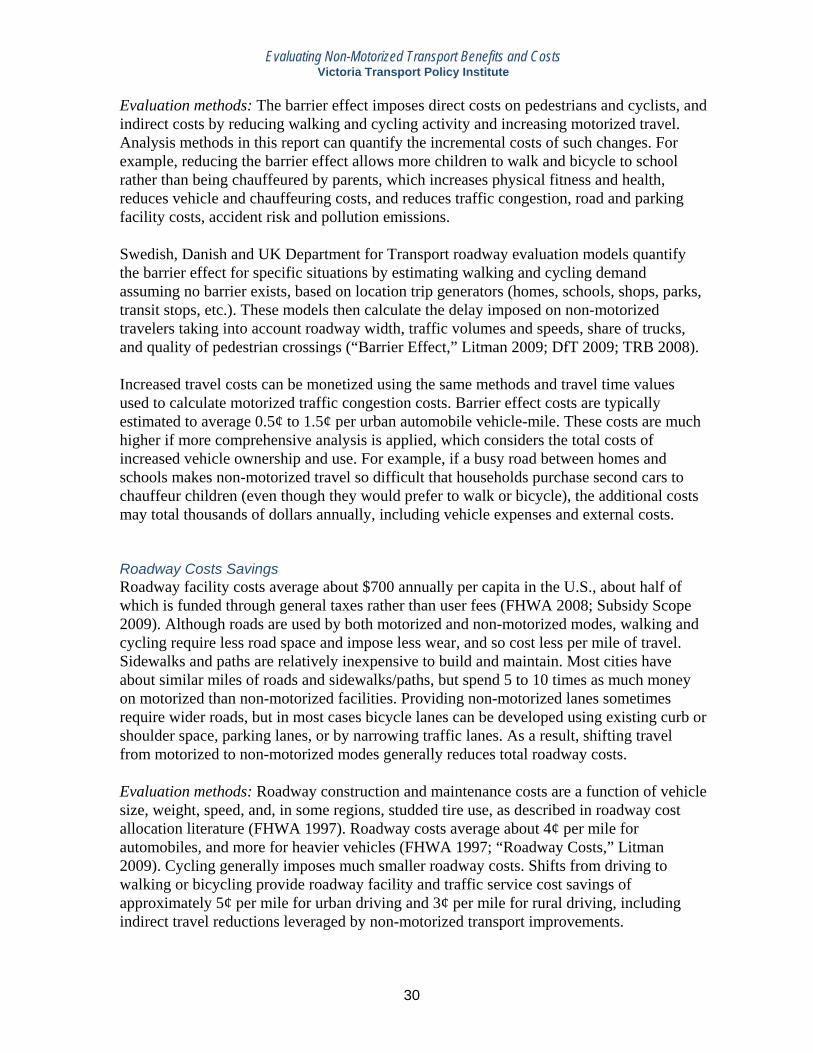
Evaluating Non-Motorized Transport Benefits and Costs Victoria Transport Policy Institute
30
Evaluation methods: The barrier effect imposes direct costs on pedestrians and cyclists, and indirect costs by reducing walking and cycling activity and increasing motorized travel. Analysis methods in this report can quantify the incremental costs of such changes. For example, reducing the barrier effect allows more children to walk and bicycle to school rather than being chauffeured by parents, which increases physical fitness and health, reduces vehicle and chauffeuring costs, and reduces traffic congestion, road and parking facility costs, accident risk and pollution emissions. Swedish, Danish and UK Department for Transport roadway evaluation models quantify the barrier effect for specific situations by estimating walking and cycling demand assuming no barrier exists, based on location trip generators (homes, schools, shops, parks, transit stops, etc.). These models then calculate the delay imposed on non-motorized travelers taking into account roadway width, traffic volumes and speeds, share of trucks, and quality of pedestrian crossings (“Barrier Effect,” Litman 2009; DfT 2009; TRB 2008). Increased travel costs can be monetized using the same methods and travel time values used to calculate motorized traffic congestion costs. Barrier effect costs are typically estimated to average 0.5¢ to 1.5¢ per urban automobile vehicle-mile. These costs are much higher if more comprehensive analysis is applied, which considers the total costs of increased vehicle ownership and use. For example, if a busy road between homes and schools makes non-motorized travel so difficult that households purchase second cars to chauffeur children (even though they would prefer to walk or bicycle), the additional costs may total thousands of dollars annually, including vehicle expenses and external costs. Roadway Costs Savings Roadway facility costs average about $700 annually per capita in the U.S., about half of which is funded through general taxes rather than user fees (FHWA 2008; Subsidy Scope 2009). Although roads are used by both motorized and non-motorized modes, walking and cycling require less road space and impose less wear, and so cost less per mile of travel. Sidewalks and paths are relatively inexpensive to build and maintain. Most cities have about similar miles of roads and sidewalks/paths, but spend 5 to 10 times as much money on motorized than non-motorized facilities. Providing non-motorized lanes sometimes require wider roads, but in most cases bicycle lanes can be developed using existing curb or shoulder space, parking lanes, or by narrowing traffic lanes. As a result, shifting travel from motorized to non-motorized modes generally reduces total roadway costs. Evaluation methods: Roadway construction and maintenance costs are a function of vehicle size, weight, speed, and, in some regions, studded tire use, as described in roadway cost allocation literature (FHWA 1997). Roadway costs average about 4¢ per mile for automobiles, and more for heavier vehicles (FHWA 1997; “Roadway Costs,” Litman 2009). Cycling generally imposes much smaller roadway costs. Shifts from driving to walking or bicycling provide roadway facility and traffic service cost savings of approximately 5¢ per mile for urban driving and 3¢ per mile for rural driving, including indirect travel reductions leveraged by non-motorized transport improvements.
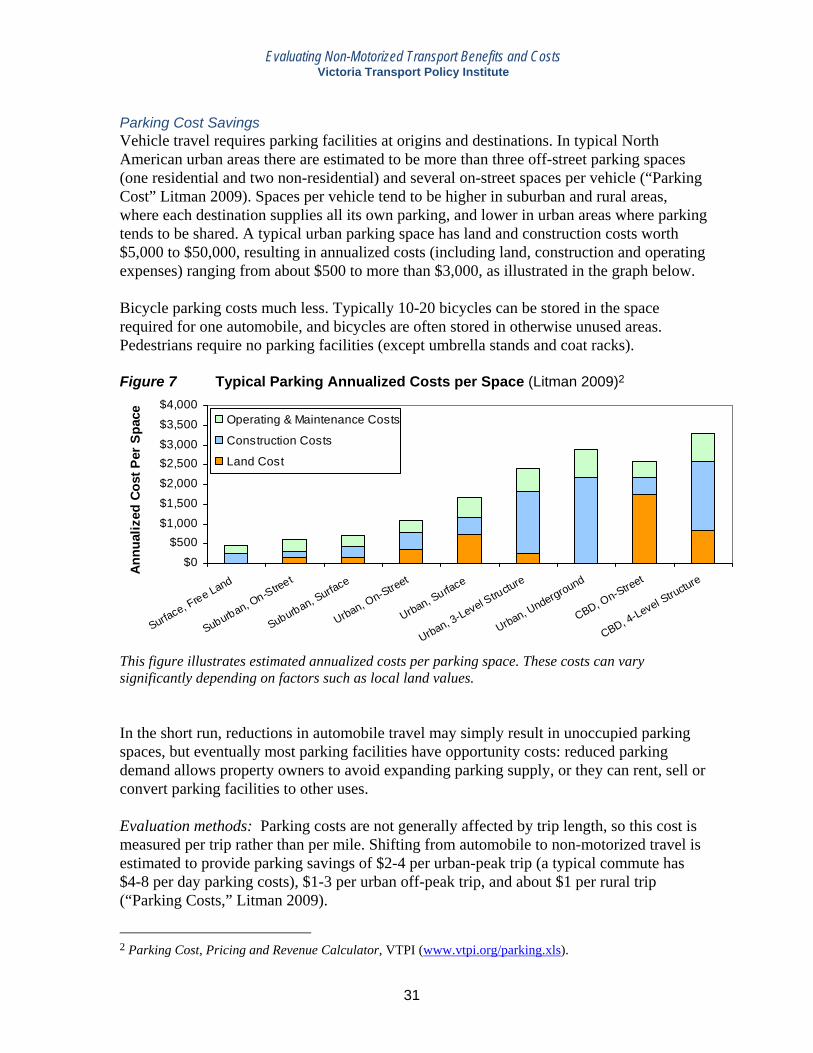
Evaluating Non-Motorized Transport Benefits and Costs Victoria Transport Policy Institute
31
Parking Cost Savings Vehicle travel requires parking facilities at origins and destinations. In typical North American urban areas there are estimated to be more than three off-street parking spaces (one residential and two non-residential) and several on-street spaces per vehicle (“Parking Cost” Litman 2009). Spaces per vehicle tend to be higher in suburban and rural areas, where each destination supplies all its own parking, and lower in urban areas where parking tends to be shared. A typical urban parking space has land and construction costs worth $5,000 to $50,000, resulting in annualized costs (including land, construction and operating expenses) ranging from about $500 to more than $3,000, as illustrated in the graph below. Bicycle parking costs much less. Typically 10-20 bicycles can be stored in the space required for one automobile, and bicycles are often stored in otherwise unused areas. Pedestrians require no parking facilities (except umbrella stands and coat racks). Figure 7 Typical Parking Annualized Costs per Space (Litman 2009)2
$0
$500$1,000
$1,500
$2,000
$2,500$3,000
$3,500
$4,000
Surface, Free Land
Suburban, On-Street
Suburban, Surface
Urban, On-Street
Urban, Surface
Urban, 3-Level Structure
Urban, Underground
CBD, On-Street
CBD, 4-Level Structure
Ann
ualiz
ed C
ost P
er S
pace Operating & Maintenance Costs
Construction Costs
Land Cost
This figure illustrates estimated annualized costs per parking space. These costs can vary significantly depending on factors such as local land values. In the short run, reductions in automobile travel may simply result in unoccupied parking spaces, but eventually most parking facilities have opportunity costs: reduced parking demand allows property owners to avoid expanding parking supply, or they can rent, sell or convert parking facilities to other uses. Evaluation methods: Parking costs are not generally affected by trip length, so this cost is measured per trip rather than per mile. Shifting from automobile to non-motorized travel is estimated to provide parking savings of $2-4 per urban-peak trip (a typical commute has $4-8 per day parking costs), $1-3 per urban off-peak trip, and about $1 per rural trip (“Parking Costs,” Litman 2009).
2 Parking Cost, Pricing and Revenue Calculator, VTPI (www.vtpi.org/parking.xls).
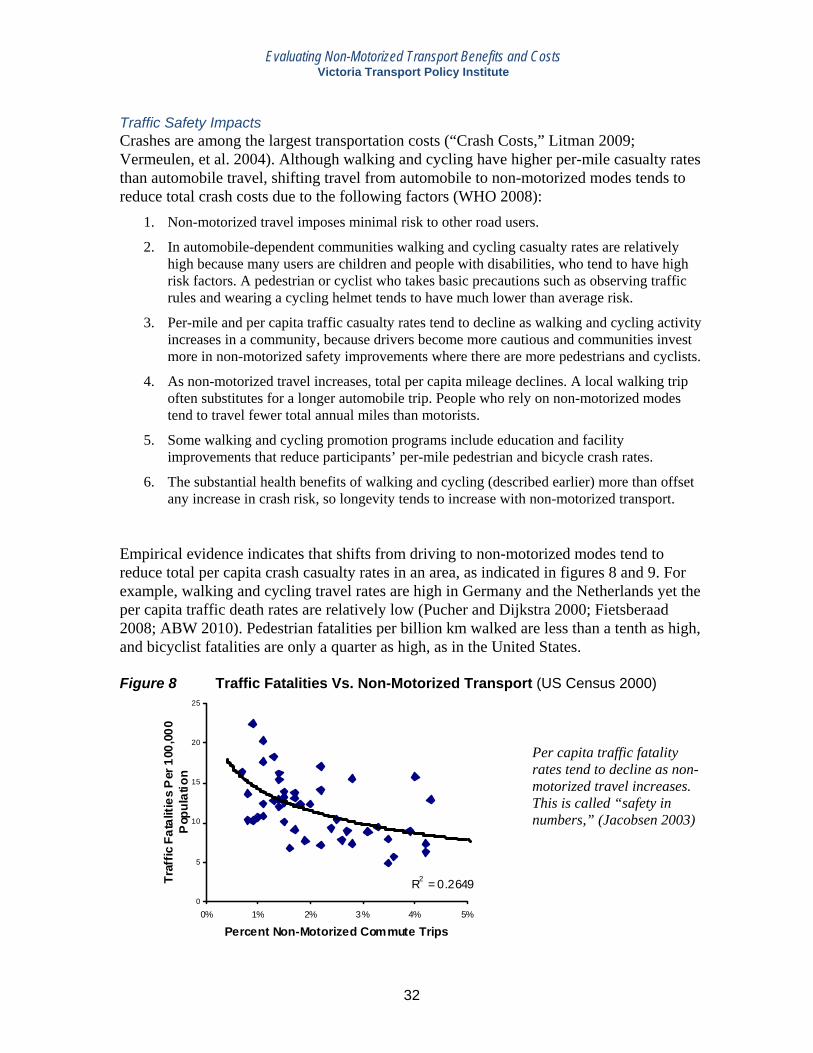
Evaluating Non-Motorized Transport Benefits and Costs Victoria Transport Policy Institute
32
Traffic Safety Impacts Crashes are among the largest transportation costs (“Crash Costs,” Litman 2009; Vermeulen, et al. 2004). Although walking and cycling have higher per-mile casualty rates than automobile travel, shifting travel from automobile to non-motorized modes tends to reduce total crash costs due to the following factors (WHO 2008):
1. Non-motorized travel imposes minimal risk to other road users.
2. In automobile-dependent communities walking and cycling casualty rates are relatively high because many users are children and people with disabilities, who tend to have high risk factors. A pedestrian or cyclist who takes basic precautions such as observing traffic rules and wearing a cycling helmet tends to have much lower than average risk.
3. Per-mile and per capita traffic casualty rates tend to decline as walking and cycling activity increases in a community, because drivers become more cautious and communities invest more in non-motorized safety improvements where there are more pedestrians and cyclists.
4. As non-motorized travel increases, total per capita mileage declines. A local walking trip often substitutes for a longer automobile trip. People who rely on non-motorized modes tend to travel fewer total annual miles than motorists.
5. Some walking and cycling promotion programs include education and facility improvements that reduce participants’ per-mile pedestrian and bicycle crash rates.
6. The substantial health benefits of walking and cycling (described earlier) more than offset any increase in crash risk, so longevity tends to increase with non-motorized transport.
Empirical evidence indicates that shifts from driving to non-motorized modes tend to reduce total per capita crash casualty rates in an area, as indicated in figures 8 and 9. For example, walking and cycling travel rates are high in Germany and the Netherlands yet the per capita traffic death rates are relatively low (Pucher and Dijkstra 2000; Fietsberaad 2008; ABW 2010). Pedestrian fatalities per billion km walked are less than a tenth as high, and bicyclist fatalities are only a quarter as high, as in the United States. Figure 8 Traffic Fatalities Vs. Non-Motorized Transport (US Census 2000)
R2 = 0.26490
5
10
15
20
25
0% 1% 2% 3% 4% 5%
Percent Non-Motorized Commute Trips
Traf
fic F
atal
ities
Per
100
,000
P
opul
atio
n
Per capita traffic fatality rates tend to decline as non-motorized travel increases. This is called “safety in numbers,” (Jacobsen 2003)
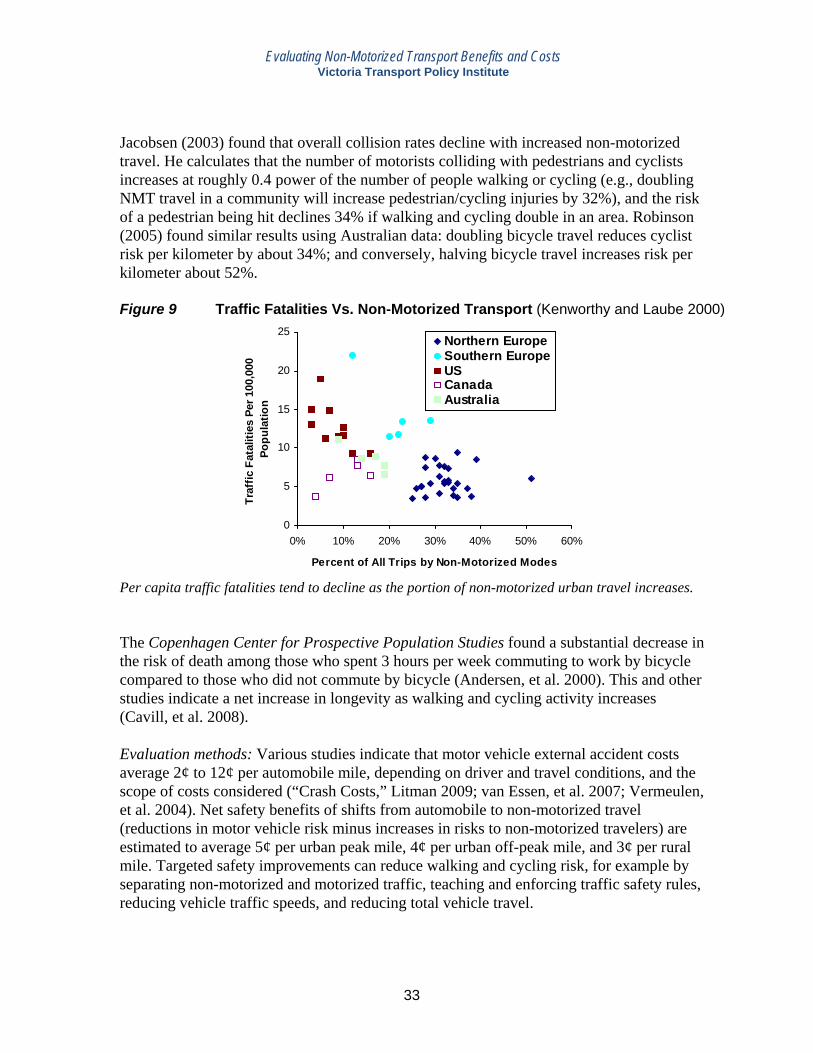
Evaluating Non-Motorized Transport Benefits and Costs Victoria Transport Policy Institute
33
Jacobsen (2003) found that overall collision rates decline with increased non-motorized travel. He calculates that the number of motorists colliding with pedestrians and cyclists increases at roughly 0.4 power of the number of people walking or cycling (e.g., doubling NMT travel in a community will increase pedestrian/cycling injuries by 32%), and the risk of a pedestrian being hit declines 34% if walking and cycling double in an area. Robinson (2005) found similar results using Australian data: doubling bicycle travel reduces cyclist risk per kilometer by about 34%; and conversely, halving bicycle travel increases risk per kilometer about 52%. Figure 9 Traffic Fatalities Vs. Non-Motorized Transport (Kenworthy and Laube 2000)
0
5
10
15
20
25
0% 10% 20% 30% 40% 50% 60%
Percent of All Trips by Non-Motorized Modes
Traf
fic F
atal
ities
Per
100
,000
Po
pula
tion
Northern EuropeSouthern EuropeUSCanadaAustralia
Per capita traffic fatalities tend to decline as the portion of non-motorized urban travel increases. The Copenhagen Center for Prospective Population Studies found a substantial decrease in the risk of death among those who spent 3 hours per week commuting to work by bicycle compared to those who did not commute by bicycle (Andersen, et al. 2000). This and other studies indicate a net increase in longevity as walking and cycling activity increases (Cavill, et al. 2008). Evaluation methods: Various studies indicate that motor vehicle external accident costs average 2¢ to 12¢ per automobile mile, depending on driver and travel conditions, and the scope of costs considered (“Crash Costs,” Litman 2009; van Essen, et al. 2007; Vermeulen, et al. 2004). Net safety benefits of shifts from automobile to non-motorized travel (reductions in motor vehicle risk minus increases in risks to non-motorized travelers) are estimated to average 5¢ per urban peak mile, 4¢ per urban off-peak mile, and 3¢ per rural mile. Targeted safety improvements can reduce walking and cycling risk, for example by separating non-motorized and motorized traffic, teaching and enforcing traffic safety rules, reducing vehicle traffic speeds, and reducing total vehicle travel.
Evaluating Non-Motorized Transport Benefits and Costs Victoria Transport Policy Institute
34
Energy Conservation Motor vehicle production and use consume large amounts of natural resources, particularly energy such as petroleum and coal (Chester and Horvath 2008). This consumption imposes various external costs, including economic and national security impacts from dependence on imported petroleum, plus environmental and health damages from pollution. As a result, resource conservation can provide various benefits (NRC 2009). Non-motorized transport can provide relatively large energy savings because it tends to substitute for short urban trips that have high emission rates per mile due to cold starts (engines are inefficient during the first few minutes of operation) and congestion. As a result, each 1% shift from automobile to non-motorized travel typically reduces fuel consumption 2-4% (Komanoff and Roelofs 1993). In addition, as previously described, non-motorized transport tends to have leverage effects, so comprehensive programs to improve walking and cycling can provide additional energy conservation benefits. Evaluation methods: Petroleum consumption external costs are estimated to be 1-4¢ per vehicle-mile (“Resource Consumption External Costs,” Litman 2009; NRC 2009). Relatively high values are justified because non-motorized travel substitutes for short urban trips in which motor vehicles are fuel inefficient due to cold starts and congestion. Pollution Reduction Motor vehicle production and use produce air, noise and water pollution which harm people, agricultural and the natural environment (Chester and Horvath 2008). Some pollutants, such as noise, carbon monoxide and particulates, have local impacts so their costs vary depending on where emissions occur, while others, such as ozone, methane and carbon dioxide, have regional and global impacts (Litman 2009). Walking and cycling produce virtually no pollution. Per mile emission reductions tend to be relatively large when non-motorized modes substitute for short urban trips which have high emission rates due to cold starts and congestion. Pedestrians and cyclists are exposed to vehicle pollution, although no more than motor vehicle occupants (Frank, et al. 2010). Estimated Benefits: Various studies quantify and monetize motor vehicle pollution damages, but many of these estimates include only a limited portion of total pollution costs. For example, some consider ozone, CO and NOx damages but ignore particulate and air toxic damages, so total costs are higher than most published estimates (van Essen 2004). Automobile air, noise and water pollution costs are typically estimated to average 2¢ to 15¢ per vehicle-mile, with lower-range values in rural conditions and higher values under congested urban conditions, but relatively high values can be justified to reflect the tendency of walking and cycling to reduce short urban trips (Delucchi 2007; Litman 2009; Vermeulen, et al. 2004). A British study estimates that shifts from driving to non-motorized modes provide air pollution reduction benefits of £0.11 in urban areas and £0.02 in rural areas, with higher values for diesel vehicles (SQW 2007). A reasonable estimate is 10¢ per mile for urban-peak driving, 5¢ for urban off-peak and 1¢ for rural driving.

Evaluating Non-Motorized Transport Benefits and Costs Victoria Transport Policy Institute
35
Land Use Impacts Transportation planning decisions often affect land use patterns. Decisions that favor automobile travel generally increase transport infrastructure land requirements (particularly roads and parking) and encourage lower-density, dispersed development (sprawl). Decisions that favor walking, cycling and public transit generally reduce transport land requirements and lead to more compact, mixed development (smart growth). These land use patterns have many economic, social and environmental impacts (CTE 2008; “Land Use Impacts,” Litman 2009). Many communities have planning objectives such as community redevelopment, urban infill, reduced impervious surface coverage, more compact and mixed development, and openspace (habitat, park and farmland) preservation. Table 12 lists various smart growth benefits. Table 12 Smart Growth Benefits (Burchell, et al. 2002; Litman 1995)
Economic Social Environmental Reduced development and public service costs Consumer transportation cost savings Economies of agglomeration More efficient transportation
Improved transport options, particularly for nondrivers Improved housing options Community cohesion
Greenspace and habitat preservation Reduced air pollution Energy conservation Reduced water pollution Reduced “heat island” effect
This table summarizes various benefits to society of smart growth development patterns. Non-motorized improvements tend to support smart growth. This occurs because walking and cycling require less space than motorized travel, and because as slower modes they encourage compact and mixed development. Improving walking and cycling conditions tend to enhance the public realm (public spaces where people naturally interact) and increase community cohesion (positive interactions among residents), creating more secure and livable communities (Appleyard 1981; Forkenbrock and Weisbrod 2001). Rogers, et al. (2010) use a case study approach to evaluate the impacts of walkable social capital. Residents living in neighborhoods of varying built form and thus varying levels of walkability in three communities in New Hampshire were surveyed about their levels of social capital and travel behaviors. The results indicate that levels of social capital are higher in more walkable neighborhoods. The space requirements of different modes can be compared using time-area: the product of area and times. Space requirements tend to increase with vehicle size and speed since faster vehicles need more shy distance (clearance from other objects). For example, at 30 miles-per-hour (mph) an automobile requires about 12.5 feet of lane width and 80 feet of lane length, totaling about 1,000 square feet, but at 60 mph this increases to 15 feet of width and 150 feet of length, totaling 2,250 square feet. Table 13 compares time-area requirements of various modes for a 20-minute commute with 8 hours of parking for automobiles and bicycles. This indicates that driving requires approximately 15 times as much space as bicycling, and about 100 times as much as walking. In practice, automobile
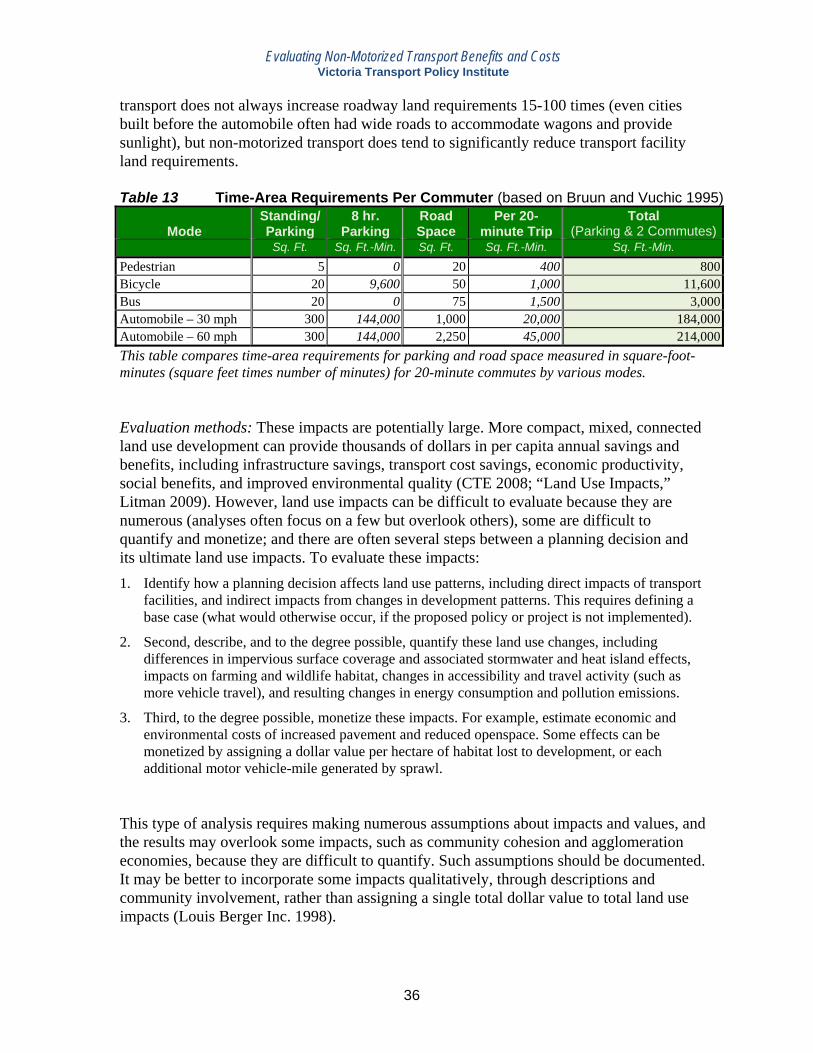
Evaluating Non-Motorized Transport Benefits and Costs Victoria Transport Policy Institute
36
transport does not always increase roadway land requirements 15-100 times (even cities built before the automobile often had wide roads to accommodate wagons and provide sunlight), but non-motorized transport does tend to significantly reduce transport facility land requirements. Table 13 Time-Area Requirements Per Commuter (based on Bruun and Vuchic 1995)
Mode
Standing/ Parking
8 hr. Parking
Road Space
Per 20-minute Trip
Total (Parking & 2 Commutes)
Sq. Ft. Sq. Ft.-Min. Sq. Ft. Sq. Ft.-Min. Sq. Ft.-Min. Pedestrian 5 0 20 400 800Bicycle 20 9,600 50 1,000 11,600Bus 20 0 75 1,500 3,000Automobile – 30 mph 300 144,000 1,000 20,000 184,000Automobile – 60 mph 300 144,000 2,250 45,000 214,000This table compares time-area requirements for parking and road space measured in square-foot-minutes (square feet times number of minutes) for 20-minute commutes by various modes. Evaluation methods: These impacts are potentially large. More compact, mixed, connected land use development can provide thousands of dollars in per capita annual savings and benefits, including infrastructure savings, transport cost savings, economic productivity, social benefits, and improved environmental quality (CTE 2008; “Land Use Impacts,” Litman 2009). However, land use impacts can be difficult to evaluate because they are numerous (analyses often focus on a few but overlook others), some are difficult to quantify and monetize; and there are often several steps between a planning decision and its ultimate land use impacts. To evaluate these impacts: 1. Identify how a planning decision affects land use patterns, including direct impacts of transport
facilities, and indirect impacts from changes in development patterns. This requires defining a base case (what would otherwise occur, if the proposed policy or project is not implemented).
2. Second, describe, and to the degree possible, quantify these land use changes, including differences in impervious surface coverage and associated stormwater and heat island effects, impacts on farming and wildlife habitat, changes in accessibility and travel activity (such as more vehicle travel), and resulting changes in energy consumption and pollution emissions.
3. Third, to the degree possible, monetize these impacts. For example, estimate economic and environmental costs of increased pavement and reduced openspace. Some effects can be monetized by assigning a dollar value per hectare of habitat lost to development, or each additional motor vehicle-mile generated by sprawl.
This type of analysis requires making numerous assumptions about impacts and values, and the results may overlook some impacts, such as community cohesion and agglomeration economies, because they are difficult to quantify. Such assumptions should be documented. It may be better to incorporate some impacts qualitatively, through descriptions and community involvement, rather than assigning a single total dollar value to total land use impacts (Louis Berger Inc. 1998).
Evaluating Non-Motorized Transport Benefits and Costs Victoria Transport Policy Institute
37
Economic Development Economic development refers to progress toward community economic goals such as increased employment, income, productivity, property values and tax revenues. Non-motorized transport can affect economic development in several ways (Buis 2000; Litman 2011; NCDOT 2004):
• Transport efficiency. Walking and cycling improvements can increase transport system efficiency by reducing costs such as traffic congestion, road and parking facility costs, and accident damages, as described previously in this report. To the degree that this reduces costs to commuters, businesses and governments it reduces production costs, which increases economic productivity and competitiveness.
• Labor productivity. Walking and cycling improvements (alone and with public transit improvements) tends to improve access to education and employment opportunities, particularly by non-drivers, increasing the quantity and quality of the lower-wage labor pool, which can reduce business costs and increase productivity and competitiveness. Active transport can also increase labor productivity by increasing worker fitness.
• Land use efficiency. As previously described, walking and cycling can support more accessible and compact land use patterns, which can provide various accessibility benefits, agglomeration efficiencies, and resource cost savings
• Consumer expenditures. Impacts on consumer spending, particularly vehicles and fuel expenditures, which affect regional economic activity.
• Supports specific industries. Certain industries benefit from improved walking and cycling conditions, including bikeshops, tourism (Beeton 2003; Tourism Vermont 2007; Grabow, Hahn and Whited 2010), retail activity, construction (Garrett-Peltier 2010), and real estate development that highlights livability (NBPC 1995; LAB 2009).
Improving walking and cycling conditions can help create more efficient transport system and more accessible land use development patterns, particularly in conjunction with complementary strategies such as public transit improvements and smart growth development policies. By improving accessibility and providing savings to commuters, businesses and governments, they tend to increase economic productivity. For example, businesses benefit if shifts to walking, cycling and public transit reduce freight and service vehicle delays, or the costs to businesses of providing employee and customer parking. In automobile-dependent areas, non-drivers may lack access to jobs, and commuting costs typically increase by $100-300 per month, which drives up wages. Improving affordable transport options tends to expand the labor pool and reduce high commuting cost wage premiums, increasing productivity and competitiveness, particularly for industries that require numerous lower-wage employees, such as offices, hospitality and light manufacturing. Businesses also benefit from non-motorized commuting by improved employee fitness and health, which increases worker productivity, reduces sick leave, and lowers healthcare costs. A meta-analysis of employee wellness programs, indicates an average benefit/cost ratio of 6.3/1 (Chapman 2005), suggesting large potential benefits to businesses from improved walking and cycling.

Evaluating Non-Motorized Transport Benefits and Costs Victoria Transport Policy Institute
38
High quality walking and cycling conditions tends to attract retail customers (Hass-Klau 1993; European Commission 1999). Improved walking and cycling conditions tends to increase local property values and support local development (Bartholomew and Ewing 2011; Cortright 2009; Krizek et al. 2006; LGC 2001). Pivo and Fisher (2010) found that office, retail and apartment values increased 1% to 9% for each 10-point increase in the 100 point WalkScore index. Buchanan (2007) found 5.2% higher residential property values and 4.9% higher retail rents in London neighborhoods with good walking conditions. Property values also tend to increase with proximity to public trails (NTTP 2005; Karadeniz 2008; Racca and Dhanju 2006). Retailers sometimes oppose non-motorized improvements, such as streetscaping and bicycle lanes, because they assume that motorists are better customers than pedestrians and cyclists, but this is often untrue (Sztabinski 2009; TA 2006). Bicycle parking is space efficient and so generates about five times as much spending per square meter as car parking (Lee and March 2010). Although automobile and fuel production are major domestic industries, a large and growing portion of these products are imported. Since they are capital intensive with relatively little labor input, overall national employment and business activity increase as consumers shift expenditures from vehicles and fuel to other common consumer goods, as indicated in Figure 10. As a result, reducing vehicle and fuel spending tends to support economic development. Figure 10 Employment Impacts per $1 Million Expenditures (Chmelynski 2008)
12.8 13.717.3
31.3
05
101520253035
Vehicle Fuel Vehicle Expenses Other ConsumerExpenditures
Public Transit
Jobs
Per
$1
Mill
ion
Expe
ndur
es
Fuel and vehicle expenditures produce fewer domestic jobs than most other consumer expenditures, and far less than spending on public transit.
Because non-motorized facility construction is relatively labor intensive it tends to create more employment and regional business activity than other capital projects. For example, analysis by Garrett-Peltier (2010) found that a $1 million spent to build bike lanes directly creates 11.0 to 14.4 total jobs, compared with approximately 7.0 total jobs created by the same expenditure on roadway projects. Some of these impacts are economic transfers, in which one group benefits at another’s expense, so their analysis depends on perspective and scale. For example, improvements in one commercial center may attract customers from other commercial centers without increasing total regional economic activity. However, some impacts are true efficiency gains: resource savings that increase overall economic productivity.
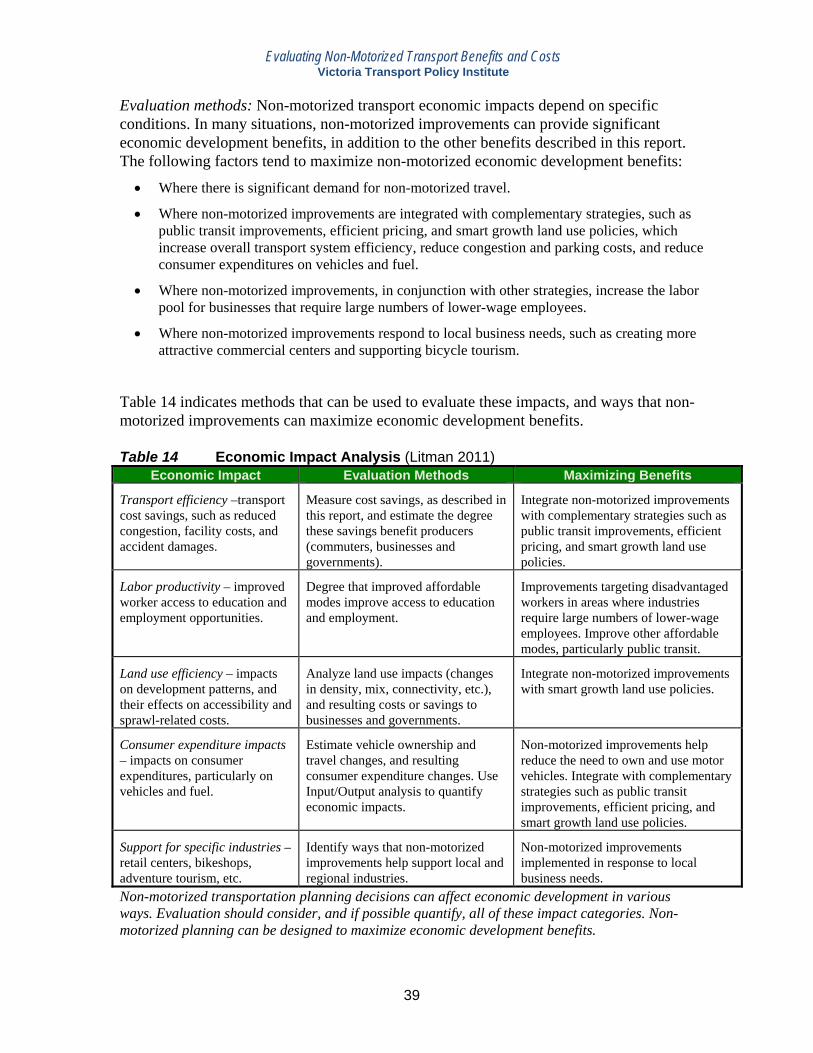
Evaluating Non-Motorized Transport Benefits and Costs Victoria Transport Policy Institute
39
Evaluation methods: Non-motorized transport economic impacts depend on specific conditions. In many situations, non-motorized improvements can provide significant economic development benefits, in addition to the other benefits described in this report. The following factors tend to maximize non-motorized economic development benefits:
• Where there is significant demand for non-motorized travel.
• Where non-motorized improvements are integrated with complementary strategies, such as public transit improvements, efficient pricing, and smart growth land use policies, which increase overall transport system efficiency, reduce congestion and parking costs, and reduce consumer expenditures on vehicles and fuel.
• Where non-motorized improvements, in conjunction with other strategies, increase the labor pool for businesses that require large numbers of lower-wage employees.
• Where non-motorized improvements respond to local business needs, such as creating more attractive commercial centers and supporting bicycle tourism.
Table 14 indicates methods that can be used to evaluate these impacts, and ways that non-motorized improvements can maximize economic development benefits. Table 14 Economic Impact Analysis (Litman 2011)
Economic Impact Evaluation Methods Maximizing Benefits
Transport efficiency –transport cost savings, such as reduced congestion, facility costs, and accident damages.
Measure cost savings, as described in this report, and estimate the degree these savings benefit producers (commuters, businesses and governments).
Integrate non-motorized improvements with complementary strategies such as public transit improvements, efficient pricing, and smart growth land use policies.
Labor productivity – improved worker access to education and employment opportunities.
Degree that improved affordable modes improve access to education and employment.
Improvements targeting disadvantaged workers in areas where industries require large numbers of lower-wage employees. Improve other affordable modes, particularly public transit.
Land use efficiency – impacts on development patterns, and their effects on accessibility and sprawl-related costs.
Analyze land use impacts (changes in density, mix, connectivity, etc.), and resulting costs or savings to businesses and governments.
Integrate non-motorized improvements with smart growth land use policies.
Consumer expenditure impacts – impacts on consumer expenditures, particularly on vehicles and fuel.
Estimate vehicle ownership and travel changes, and resulting consumer expenditure changes. Use Input/Output analysis to quantify economic impacts.
Non-motorized improvements help reduce the need to own and use motor vehicles. Integrate with complementary strategies such as public transit improvements, efficient pricing, and smart growth land use policies.
Support for specific industries – retail centers, bikeshops, adventure tourism, etc.
Identify ways that non-motorized improvements help support local and regional industries.
Non-motorized improvements implemented in response to local business needs.
Non-motorized transportation planning decisions can affect economic development in various ways. Evaluation should consider, and if possible quantify, all of these impact categories. Non-motorized planning can be designed to maximize economic development benefits.
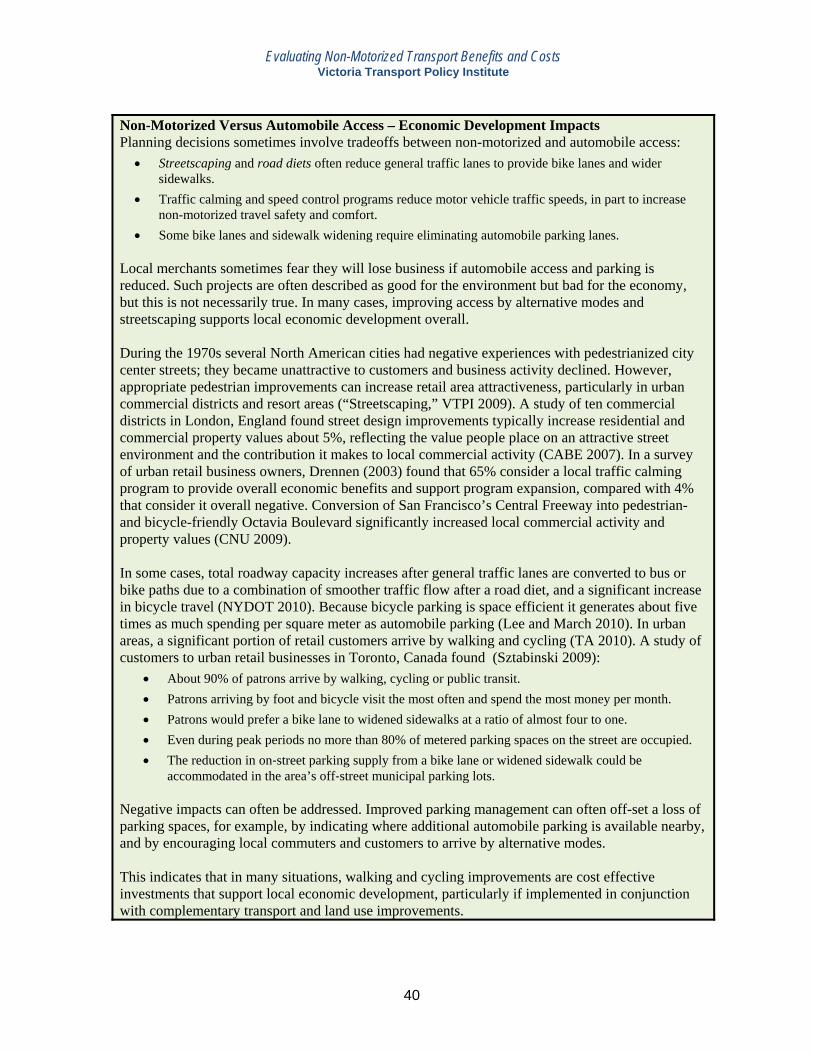
Evaluating Non-Motorized Transport Benefits and Costs Victoria Transport Policy Institute
40
Non-Motorized Versus Automobile Access – Economic Development Impacts Planning decisions sometimes involve tradeoffs between non-motorized and automobile access:
• Streetscaping and road diets often reduce general traffic lanes to provide bike lanes and wider sidewalks.
• Traffic calming and speed control programs reduce motor vehicle traffic speeds, in part to increase non-motorized travel safety and comfort.
• Some bike lanes and sidewalk widening require eliminating automobile parking lanes. Local merchants sometimes fear they will lose business if automobile access and parking is reduced. Such projects are often described as good for the environment but bad for the economy, but this is not necessarily true. In many cases, improving access by alternative modes and streetscaping supports local economic development overall. During the 1970s several North American cities had negative experiences with pedestrianized city center streets; they became unattractive to customers and business activity declined. However, appropriate pedestrian improvements can increase retail area attractiveness, particularly in urban commercial districts and resort areas (“Streetscaping,” VTPI 2009). A study of ten commercial districts in London, England found street design improvements typically increase residential and commercial property values about 5%, reflecting the value people place on an attractive street environment and the contribution it makes to local commercial activity (CABE 2007). In a survey of urban retail business owners, Drennen (2003) found that 65% consider a local traffic calming program to provide overall economic benefits and support program expansion, compared with 4% that consider it overall negative. Conversion of San Francisco’s Central Freeway into pedestrian- and bicycle-friendly Octavia Boulevard significantly increased local commercial activity and property values (CNU 2009). In some cases, total roadway capacity increases after general traffic lanes are converted to bus or bike paths due to a combination of smoother traffic flow after a road diet, and a significant increase in bicycle travel (NYDOT 2010). Because bicycle parking is space efficient it generates about five times as much spending per square meter as automobile parking (Lee and March 2010). In urban areas, a significant portion of retail customers arrive by walking and cycling (TA 2010). A study of customers to urban retail businesses in Toronto, Canada found (Sztabinski 2009):
• About 90% of patrons arrive by walking, cycling or public transit. • Patrons arriving by foot and bicycle visit the most often and spend the most money per month. • Patrons would prefer a bike lane to widened sidewalks at a ratio of almost four to one. • Even during peak periods no more than 80% of metered parking spaces on the street are occupied. • The reduction in on‐street parking supply from a bike lane or widened sidewalk could be
accommodated in the area’s off‐street municipal parking lots. Negative impacts can often be addressed. Improved parking management can often off-set a loss of parking spaces, for example, by indicating where additional automobile parking is available nearby, and by encouraging local commuters and customers to arrive by alternative modes. This indicates that in many situations, walking and cycling improvements are cost effective investments that support local economic development, particularly if implemented in conjunction with complementary transport and land use improvements.
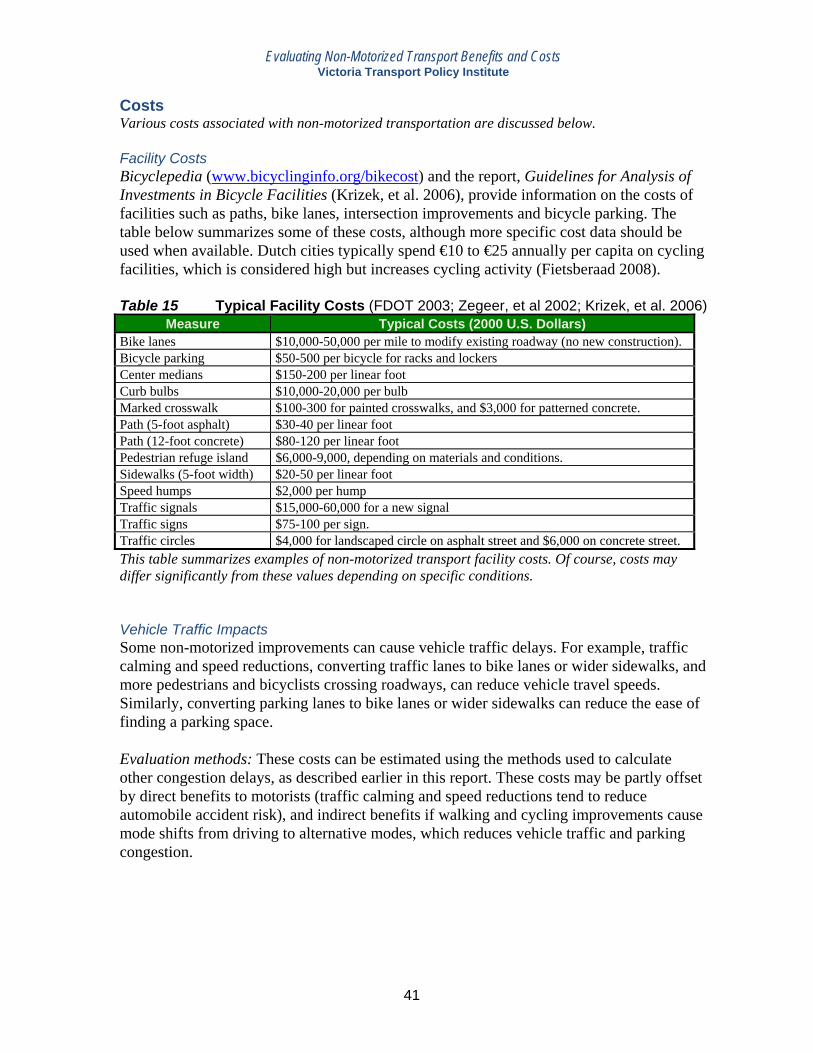
Evaluating Non-Motorized Transport Benefits and Costs Victoria Transport Policy Institute
41
Costs Various costs associated with non-motorized transportation are discussed below. Facility Costs Bicyclepedia (www.bicyclinginfo.org/bikecost) and the report, Guidelines for Analysis of Investments in Bicycle Facilities (Krizek, et al. 2006), provide information on the costs of facilities such as paths, bike lanes, intersection improvements and bicycle parking. The table below summarizes some of these costs, although more specific cost data should be used when available. Dutch cities typically spend €10 to €25 annually per capita on cycling facilities, which is considered high but increases cycling activity (Fietsberaad 2008). Table 15 Typical Facility Costs (FDOT 2003; Zegeer, et al 2002; Krizek, et al. 2006)
Measure Typical Costs (2000 U.S. Dollars) Bike lanes $10,000-50,000 per mile to modify existing roadway (no new construction). Bicycle parking $50-500 per bicycle for racks and lockers Center medians $150-200 per linear foot Curb bulbs $10,000-20,000 per bulb Marked crosswalk $100-300 for painted crosswalks, and $3,000 for patterned concrete. Path (5-foot asphalt) $30-40 per linear foot Path (12-foot concrete) $80-120 per linear foot Pedestrian refuge island $6,000-9,000, depending on materials and conditions. Sidewalks (5-foot width) $20-50 per linear foot Speed humps $2,000 per hump Traffic signals $15,000-60,000 for a new signal Traffic signs $75-100 per sign. Traffic circles $4,000 for landscaped circle on asphalt street and $6,000 on concrete street. This table summarizes examples of non-motorized transport facility costs. Of course, costs may differ significantly from these values depending on specific conditions. Vehicle Traffic Impacts Some non-motorized improvements can cause vehicle traffic delays. For example, traffic calming and speed reductions, converting traffic lanes to bike lanes or wider sidewalks, and more pedestrians and bicyclists crossing roadways, can reduce vehicle travel speeds. Similarly, converting parking lanes to bike lanes or wider sidewalks can reduce the ease of finding a parking space. Evaluation methods: These costs can be estimated using the methods used to calculate other congestion delays, as described earlier in this report. These costs may be partly offset by direct benefits to motorists (traffic calming and speed reductions tend to reduce automobile accident risk), and indirect benefits if walking and cycling improvements cause mode shifts from driving to alternative modes, which reduces vehicle traffic and parking congestion.
Evaluating Non-Motorized Transport Benefits and Costs Victoria Transport Policy Institute
42
Equipment and Fuel Costs Walking and cycling may require extra equipment and fuel. Functional shoes typically cost $100 per pair and last about 1,000 miles (about a year of normal use), or 10¢ per walk-mile, and the marginal cost is often smaller, since consumers often replace shoes before they wear out for aesthetic reasons. A $500 bicycle ridden 3,000 annual miles requires about $100 annual maintenance and lasts 10 years, which averages about 5¢ per mile cycled. Walking and cycling require food for fuel, which is more costly than gasoline per calorie, but the amounts are generally small (a 150 pound person burns 80 calories per mile of walking, about the energy in a slice of bread, and half that when cycling), and most people enjoy eating and consume too many calories, in which case food energy consumption is a benefit rather than a cost. Evaluation methods: Walking and cycling equipment and fuel costs can be estimated based on typical shoe, bicycle and food costs. Many consumers have shoes and bicycles that are underused (people who walk to work do not necessarily spend more on shoes than people who drive, and many people have bicycles that could be ridden more annual miles with little additional cost) so the incremental cost of increased walking and cycling is often small. Because such analysis is not standardized, it is important to specify the assumptions used, such as types of shoes, bicycles and foods. User Travel Time Costs Travel time is one of the largest transportation costs, and since non-motorized modes tend to be slower than motorized modes, some analysts argue that walking and cycling are costly and inefficient. However, this is not necessarily true. Non-motorized travel can be time competitive with driving for short trips: for walking up to a half-mile, which represents about 14% of total personal trips in the U.S.; for cycling up to three miles, which represents about half of total trips (Dill and Gliebe 2008; Litman 2010). Transport planning that improves pedestrian and cycling connectivity, and land use planning that creates more compact, mixed development increases the portion of trips by which non-motorized travel is time competitive. Travel time unit costs (cents per minute or dollars per hours) vary significantly depending on conditions and preferences (Mackie, et al. 2003). Where walking and cycling conditions are unfavorable, travel time costs are high, but under favorable conditions costs are low or even negative: time spent walking or cycling is considered a benefit rather than a cost (“Travel Time Costs,” Litman 2009). Many people value walking or cycling for enjoyment and exercise (it can reduce the need to spend special time exercising), and so will choose these modes even if they take longer than driving. Because walking and cycling are inexpensive travel modes, their effective speed (travel time plus time spent earning money to pay for transport) is often faster than driving (Tranter 2004). These factors are highly variable. A person may one day prefer walking and another day prefer driving. If people have high quality walk and cycling conditions they can choose the mode they consider best overall, taking into account all benefits and costs.
Evaluating Non-Motorized Transport Benefits and Costs Victoria Transport Policy Institute
43
Evaluating Impacts: Various methods can be used to measure the value user place on their travel time (Litman 2009). Travel time is generally valued at 30-50% of prevailing wages, with lower values under favorable conditions and higher values under unfavorable conditions. If people choose non-motorized modes in response to positive incentives (improved walking and cycling conditions, or financial rewards) they must be better off overall (increased consumer surplus), even if their speeds decline. Accident and Health Risk Walking and cycling tend to have relatively high per kilometer crash casualty rates, which implies that policies and programs that increase active transport will increase crash costs. However, as described earlier, total per capita traffic crash and health risks tend to decline as non-motorized travel increases because:
• Average crash rates do not necessarily apply to a particular individual. A responsible pedestrian or cyclist who takes basic precautions, such as observing appropriate traffic rules, using lighting at night, and wearing a helmet can have much lower crash injury rates than overall average.
• Risk to other road users declines, particularly if higher-risk drivers (such as young males) shift to non-motorized modes.
• Per-kilometer pedestrian and cyclist crash injury rates tend to decline with increased use of these modes, called safety in numbers (Jacobsen 2003).
• More use of these modes justifies facility improvements and programs that increase safety.
• Walking and cycling provide fitness and health benefits that can more than offset incremental crash risk.
Evaluating Impacts: Comprehensive analysis described earlier in this report can be used to evaluate the incremental accident and health risks of specific walking and cycling programs, taking into account changes in risk to pedestrians and cyclists and to other road users.
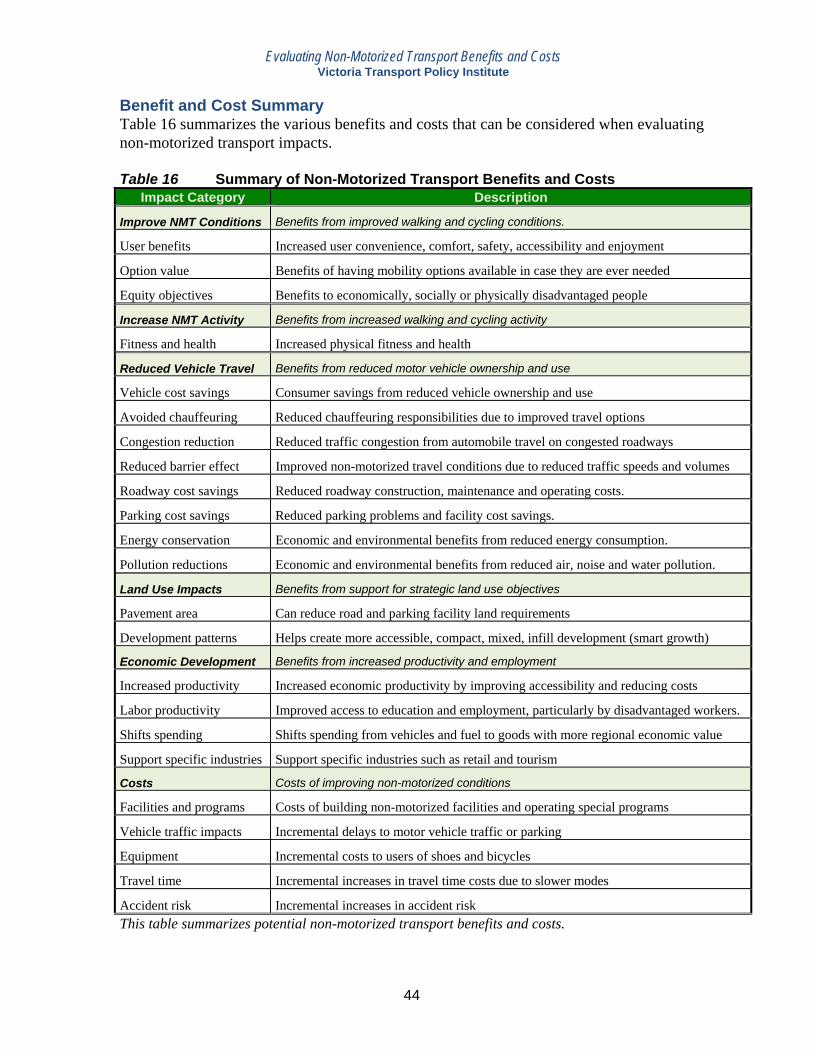
Evaluating Non-Motorized Transport Benefits and Costs Victoria Transport Policy Institute
44
Benefit and Cost Summary Table 16 summarizes the various benefits and costs that can be considered when evaluating non-motorized transport impacts. Table 16 Summary of Non-Motorized Transport Benefits and Costs
Impact Category Description
Improve NMT Conditions Benefits from improved walking and cycling conditions.
User benefits Increased user convenience, comfort, safety, accessibility and enjoyment
Option value Benefits of having mobility options available in case they are ever needed
Equity objectives Benefits to economically, socially or physically disadvantaged people
Increase NMT Activity Benefits from increased walking and cycling activity
Fitness and health Increased physical fitness and health
Reduced Vehicle Travel Benefits from reduced motor vehicle ownership and use
Vehicle cost savings Consumer savings from reduced vehicle ownership and use
Avoided chauffeuring Reduced chauffeuring responsibilities due to improved travel options
Congestion reduction Reduced traffic congestion from automobile travel on congested roadways
Reduced barrier effect Improved non-motorized travel conditions due to reduced traffic speeds and volumes
Roadway cost savings Reduced roadway construction, maintenance and operating costs.
Parking cost savings Reduced parking problems and facility cost savings.
Energy conservation Economic and environmental benefits from reduced energy consumption.
Pollution reductions Economic and environmental benefits from reduced air, noise and water pollution.
Land Use Impacts Benefits from support for strategic land use objectives
Pavement area Can reduce road and parking facility land requirements
Development patterns Helps create more accessible, compact, mixed, infill development (smart growth)
Economic Development Benefits from increased productivity and employment
Increased productivity Increased economic productivity by improving accessibility and reducing costs
Labor productivity Improved access to education and employment, particularly by disadvantaged workers.
Shifts spending Shifts spending from vehicles and fuel to goods with more regional economic value
Support specific industries Support specific industries such as retail and tourism
Costs Costs of improving non-motorized conditions
Facilities and programs Costs of building non-motorized facilities and operating special programs
Vehicle traffic impacts Incremental delays to motor vehicle traffic or parking
Equipment Incremental costs to users of shoes and bicycles
Travel time Incremental increases in travel time costs due to slower modes
Accident risk Incremental increases in accident risk This table summarizes potential non-motorized transport benefits and costs.
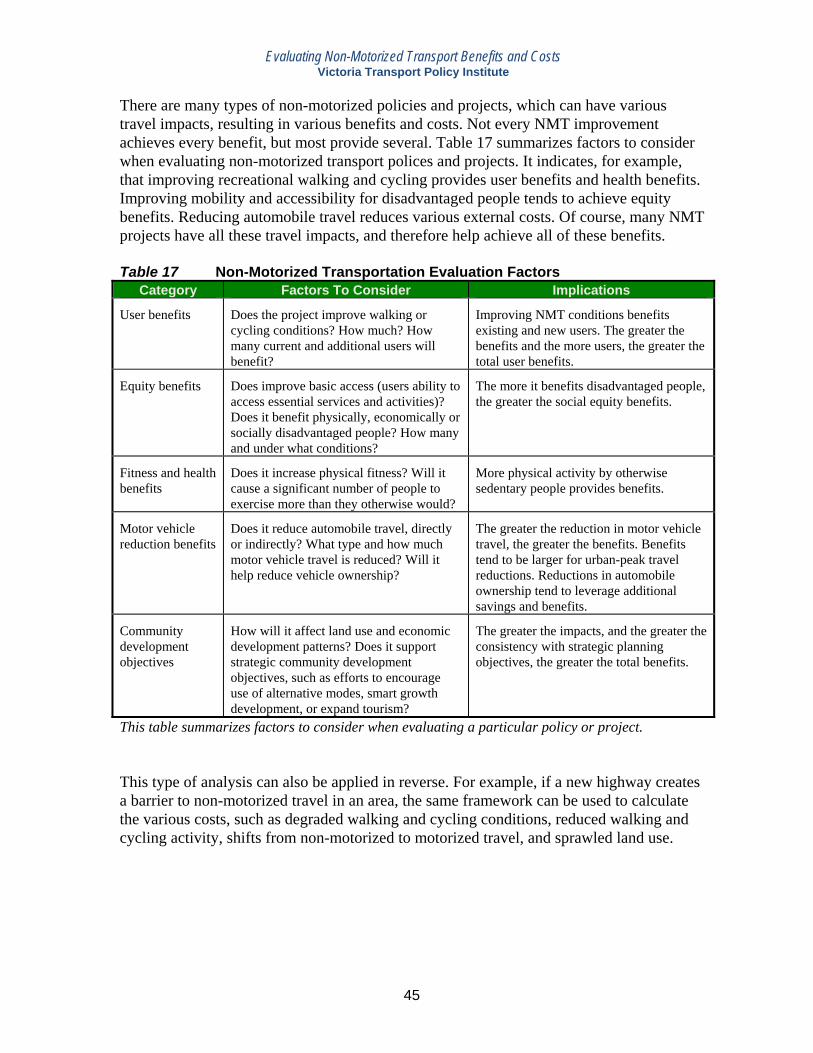
Evaluating Non-Motorized Transport Benefits and Costs Victoria Transport Policy Institute
45
There are many types of non-motorized policies and projects, which can have various travel impacts, resulting in various benefits and costs. Not every NMT improvement achieves every benefit, but most provide several. Table 17 summarizes factors to consider when evaluating non-motorized transport polices and projects. It indicates, for example, that improving recreational walking and cycling provides user benefits and health benefits. Improving mobility and accessibility for disadvantaged people tends to achieve equity benefits. Reducing automobile travel reduces various external costs. Of course, many NMT projects have all these travel impacts, and therefore help achieve all of these benefits. Table 17 Non-Motorized Transportation Evaluation Factors
Category Factors To Consider Implications
User benefits Does the project improve walking or cycling conditions? How much? How many current and additional users will benefit?
Improving NMT conditions benefits existing and new users. The greater the benefits and the more users, the greater the total user benefits.
Equity benefits Does improve basic access (users ability to access essential services and activities)? Does it benefit physically, economically or socially disadvantaged people? How many and under what conditions?
The more it benefits disadvantaged people, the greater the social equity benefits.
Fitness and health benefits
Does it increase physical fitness? Will it cause a significant number of people to exercise more than they otherwise would?
More physical activity by otherwise sedentary people provides benefits.
Motor vehicle reduction benefits
Does it reduce automobile travel, directly or indirectly? What type and how much motor vehicle travel is reduced? Will it help reduce vehicle ownership?
The greater the reduction in motor vehicle travel, the greater the benefits. Benefits tend to be larger for urban-peak travel reductions. Reductions in automobile ownership tend to leverage additional savings and benefits.
Community development objectives
How will it affect land use and economic development patterns? Does it support strategic community development objectives, such as efforts to encourage use of alternative modes, smart growth development, or expand tourism?
The greater the impacts, and the greater the consistency with strategic planning objectives, the greater the total benefits.
This table summarizes factors to consider when evaluating a particular policy or project. This type of analysis can also be applied in reverse. For example, if a new highway creates a barrier to non-motorized travel in an area, the same framework can be used to calculate the various costs, such as degraded walking and cycling conditions, reduced walking and cycling activity, shifts from non-motorized to motorized travel, and sprawled land use.
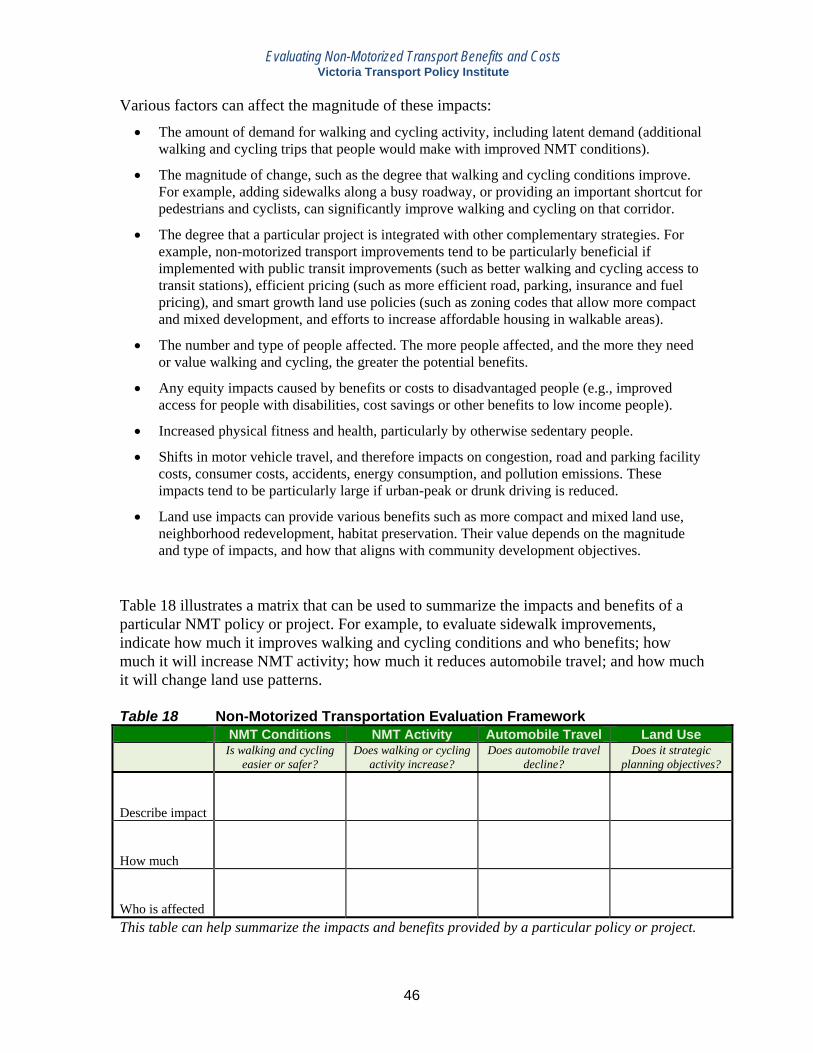
Evaluating Non-Motorized Transport Benefits and Costs Victoria Transport Policy Institute
46
Various factors can affect the magnitude of these impacts:
• The amount of demand for walking and cycling activity, including latent demand (additional walking and cycling trips that people would make with improved NMT conditions).
• The magnitude of change, such as the degree that walking and cycling conditions improve. For example, adding sidewalks along a busy roadway, or providing an important shortcut for pedestrians and cyclists, can significantly improve walking and cycling on that corridor.
• The degree that a particular project is integrated with other complementary strategies. For example, non-motorized transport improvements tend to be particularly beneficial if implemented with public transit improvements (such as better walking and cycling access to transit stations), efficient pricing (such as more efficient road, parking, insurance and fuel pricing), and smart growth land use policies (such as zoning codes that allow more compact and mixed development, and efforts to increase affordable housing in walkable areas).
• The number and type of people affected. The more people affected, and the more they need or value walking and cycling, the greater the potential benefits.
• Any equity impacts caused by benefits or costs to disadvantaged people (e.g., improved access for people with disabilities, cost savings or other benefits to low income people).
• Increased physical fitness and health, particularly by otherwise sedentary people.
• Shifts in motor vehicle travel, and therefore impacts on congestion, road and parking facility costs, consumer costs, accidents, energy consumption, and pollution emissions. These impacts tend to be particularly large if urban-peak or drunk driving is reduced.
• Land use impacts can provide various benefits such as more compact and mixed land use, neighborhood redevelopment, habitat preservation. Their value depends on the magnitude and type of impacts, and how that aligns with community development objectives.
Table 18 illustrates a matrix that can be used to summarize the impacts and benefits of a particular NMT policy or project. For example, to evaluate sidewalk improvements, indicate how much it improves walking and cycling conditions and who benefits; how much it will increase NMT activity; how much it reduces automobile travel; and how much it will change land use patterns. Table 18 Non-Motorized Transportation Evaluation Framework
NMT Conditions NMT Activity Automobile Travel Land Use Is walking and cycling
easier or safer? Does walking or cycling
activity increase? Does automobile travel
decline? Does it strategic
planning objectives?
Describe impact
How much
Who is affected
This table can help summarize the impacts and benefits provided by a particular policy or project.
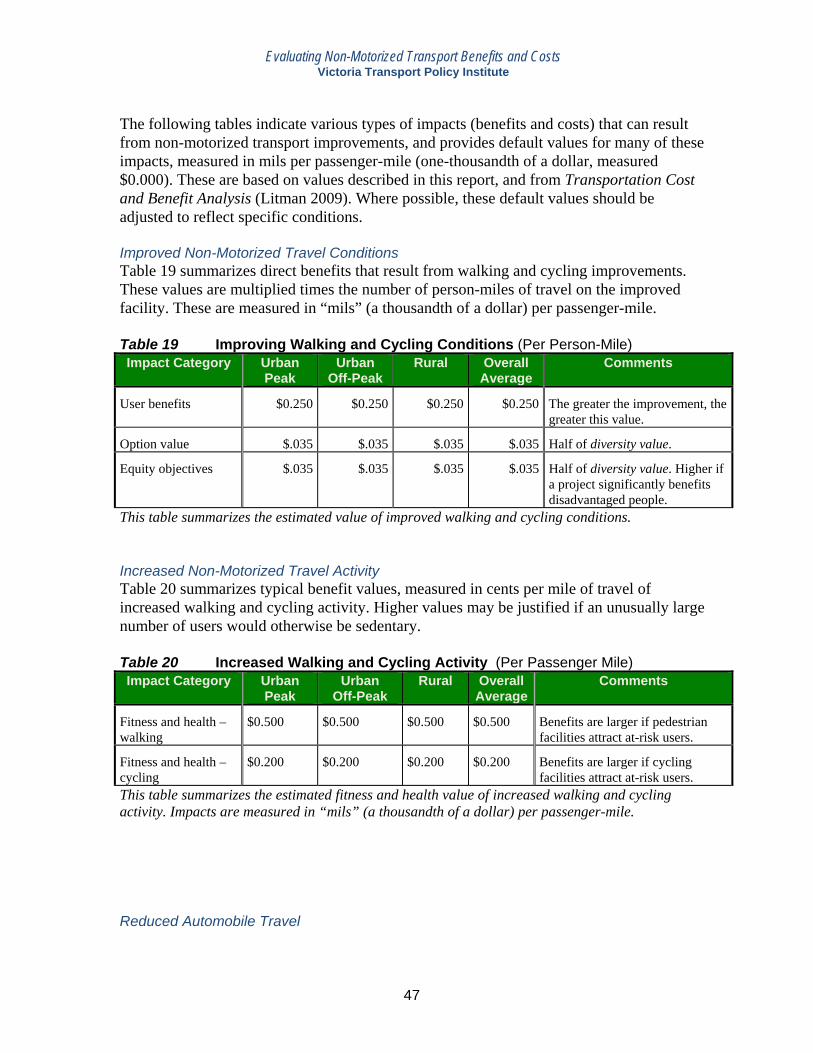
Evaluating Non-Motorized Transport Benefits and Costs Victoria Transport Policy Institute
47
The following tables indicate various types of impacts (benefits and costs) that can result from non-motorized transport improvements, and provides default values for many of these impacts, measured in mils per passenger-mile (one-thousandth of a dollar, measured $0.000). These are based on values described in this report, and from Transportation Cost and Benefit Analysis (Litman 2009). Where possible, these default values should be adjusted to reflect specific conditions. Improved Non-Motorized Travel Conditions Table 19 summarizes direct benefits that result from walking and cycling improvements. These values are multiplied times the number of person-miles of travel on the improved facility. These are measured in “mils” (a thousandth of a dollar) per passenger-mile. Table 19 Improving Walking and Cycling Conditions (Per Person-Mile) Impact Category Urban
Peak Urban
Off-Peak Rural Overall
Average Comments
User benefits $0.250 $0.250 $0.250 $0.250 The greater the improvement, the greater this value.
Option value $.035 $.035 $.035 $.035 Half of diversity value.
Equity objectives $.035 $.035 $.035 $.035 Half of diversity value. Higher if a project significantly benefits disadvantaged people.
This table summarizes the estimated value of improved walking and cycling conditions. Increased Non-Motorized Travel Activity Table 20 summarizes typical benefit values, measured in cents per mile of travel of increased walking and cycling activity. Higher values may be justified if an unusually large number of users would otherwise be sedentary. Table 20 Increased Walking and Cycling Activity (Per Passenger Mile) Impact Category Urban
Peak Urban
Off-Peak Rural Overall
AverageComments
Fitness and health – walking
$0.500 $0.500 $0.500 $0.500 Benefits are larger if pedestrian facilities attract at-risk users.
Fitness and health – cycling
$0.200 $0.200 $0.200 $0.200 Benefits are larger if cycling facilities attract at-risk users.
This table summarizes the estimated fitness and health value of increased walking and cycling activity. Impacts are measured in “mils” (a thousandth of a dollar) per passenger-mile. Reduced Automobile Travel
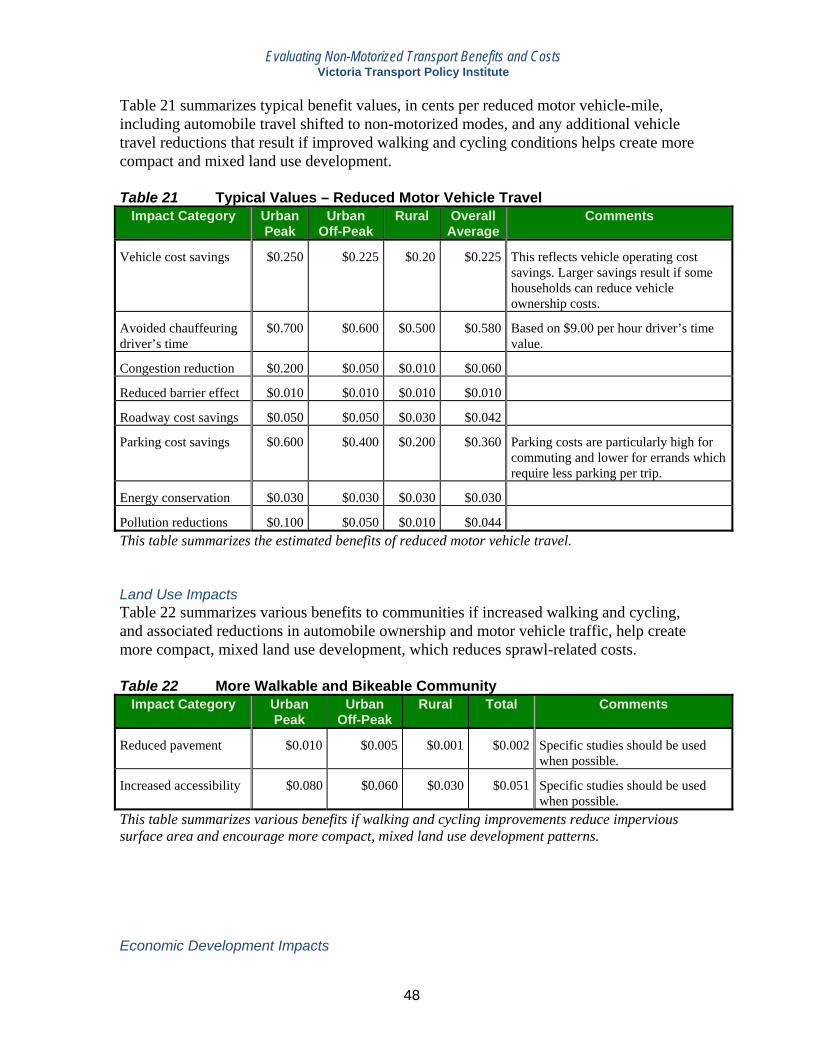
Evaluating Non-Motorized Transport Benefits and Costs Victoria Transport Policy Institute
48
Table 21 summarizes typical benefit values, in cents per reduced motor vehicle-mile, including automobile travel shifted to non-motorized modes, and any additional vehicle travel reductions that result if improved walking and cycling conditions helps create more compact and mixed land use development. Table 21 Typical Values – Reduced Motor Vehicle Travel
Impact Category Urban Peak
Urban Off-Peak
Rural Overall Average
Comments
Vehicle cost savings $0.250 $0.225 $0.20 $0.225 This reflects vehicle operating cost savings. Larger savings result if some households can reduce vehicle ownership costs.
Avoided chauffeuring driver’s time
$0.700 $0.600 $0.500 $0.580 Based on $9.00 per hour driver’s time value.
Congestion reduction $0.200 $0.050 $0.010 $0.060
Reduced barrier effect $0.010 $0.010 $0.010 $0.010
Roadway cost savings $0.050 $0.050 $0.030 $0.042
Parking cost savings $0.600 $0.400 $0.200 $0.360 Parking costs are particularly high for commuting and lower for errands which require less parking per trip.
Energy conservation $0.030 $0.030 $0.030 $0.030
Pollution reductions $0.100 $0.050 $0.010 $0.044 This table summarizes the estimated benefits of reduced motor vehicle travel. Land Use Impacts Table 22 summarizes various benefits to communities if increased walking and cycling, and associated reductions in automobile ownership and motor vehicle traffic, help create more compact, mixed land use development, which reduces sprawl-related costs. Table 22 More Walkable and Bikeable Community
Impact Category Urban Peak
Urban Off-Peak
Rural Total Comments
Reduced pavement $0.010 $0.005 $0.001 $0.002 Specific studies should be used when possible.
Increased accessibility $0.080 $0.060 $0.030 $0.051 Specific studies should be used when possible.
This table summarizes various benefits if walking and cycling improvements reduce impervious surface area and encourage more compact, mixed land use development patterns. Economic Development Impacts
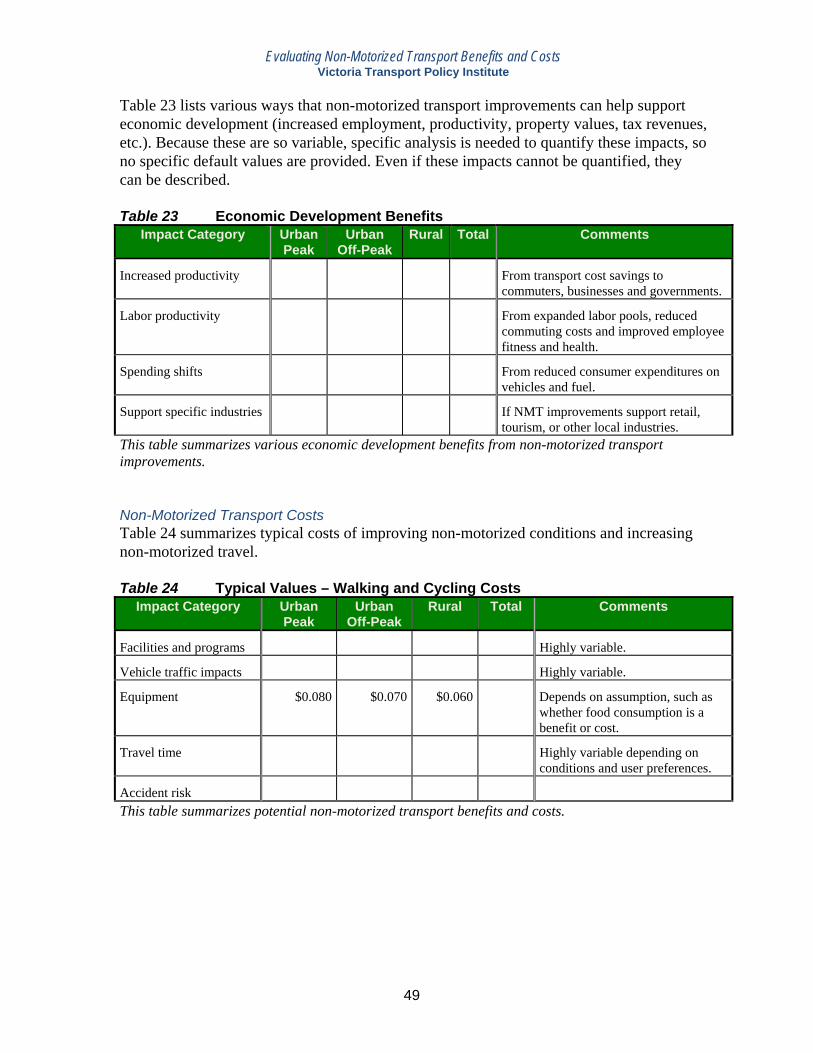
Evaluating Non-Motorized Transport Benefits and Costs Victoria Transport Policy Institute
49
Table 23 lists various ways that non-motorized transport improvements can help support economic development (increased employment, productivity, property values, tax revenues, etc.). Because these are so variable, specific analysis is needed to quantify these impacts, so no specific default values are provided. Even if these impacts cannot be quantified, they can be described. Table 23 Economic Development Benefits
Impact Category Urban Peak
Urban Off-Peak
Rural Total Comments
Increased productivity From transport cost savings to commuters, businesses and governments.
Labor productivity From expanded labor pools, reduced commuting costs and improved employee fitness and health.
Spending shifts From reduced consumer expenditures on vehicles and fuel.
Support specific industries If NMT improvements support retail, tourism, or other local industries.
This table summarizes various economic development benefits from non-motorized transport improvements. Non-Motorized Transport Costs Table 24 summarizes typical costs of improving non-motorized conditions and increasing non-motorized travel. Table 24 Typical Values – Walking and Cycling Costs
Impact Category Urban Peak
Urban Off-Peak
Rural Total Comments
Facilities and programs Highly variable.
Vehicle traffic impacts Highly variable.
Equipment $0.080 $0.070 $0.060 Depends on assumption, such as whether food consumption is a benefit or cost.
Travel time Highly variable depending on conditions and user preferences.
Accident risk This table summarizes potential non-motorized transport benefits and costs.
Evaluating Non-Motorized Transport Benefits and Costs Victoria Transport Policy Institute
50
Evaluating Specific Non-Motorized Improvements This section describes examples of NMT evaluation. Pedestrian Facility Improvements (Sidewalks, Paths and Crosswalks) Pedestrian improvements tend to benefit existing and new users, increase walking activity, and reduce driving. Pedestrians may comfortably share roadspace with motor vehicles if traffic speeds and volumes are very low (less than 12 miles per hour and fewer than 30 vehicles during peak hour, sometimes called naked streets), however, sidewalks, paths and crosswalks become important on streets with higher traffic speeds, particularly for vulnerable pedestrians such as children and people with disabilities. Increased walking tends to improve public fitness and health. Since physically and economically disadvantaged people often depend on walking, pedestrian improvements tend to provide option and equity value. Pedestrian facilities tend to have network effects so benefits increase as the network expands. A short, isolated length of sidewalk may provide minimal benefit, while a link that connects two otherwise isolated sidewalk networks, or provides a shortcut (such as connecting two cul de sacs) can provide large benefits. Pedestrian improvements can have leverage effects: increases in walking cause proportionately larger reductions in vehicle travel. For example, Guo and Gandavarapu (2010) estimate that completing the sidewalk network in a typical U.S. town would increase average per capita non-motorized travel 16% (from 0.6 to 0.7 miles per day) and reduce automobile travel 5% (from 22.0 to 20.9 vehicle-miles), or about 10 miles of reduced VMT for each mile of increased walking. Sidewalks usually increase adjacent property values by improving access (Peffer 2009; PBIC 2009), but this reflects only a portion of total benefits since non-residents also benefit from improved access and reduced driving, so total benefits are likely to be much greater than property value changes indicate. Factors affecting pedestrian facility improvement benefits
Magnitude of improvement • Whether it significantly improves pedestrian conditions where walking is otherwise difficult. Demand • Number of potential users, including youths, people with disabilities or low incomes, seniors,
dog owners, and people who want to walk for exercise. • Connects important destinations such as schools, businesses, public transit stops, and parks. Supports special planning objectives • If located in a commercial or resort area where walkability supports economic development. • Whether it includes universal design to improve mobility for people with disabilities. • If it increases physical activity by otherwise sedentary people. Network and synergetic effects • Whether it connects to a large pedestrian network (other sidewalks and paths). • Whether part of an integrated program to improve alternative modes and support smart growth.
Evaluating Non-Motorized Transport Benefits and Costs Victoria Transport Policy Institute
51
Bicycle Facility Improvement (Paths, Bike Lanes and Parking Facilities) Bicycle improvements are similar to pedestrian improvements, although with a more limited range of users. Such enhancements benefit existing and new users, can increase cycling activity, and reduce driving. Although many cyclists can comfortably share road space with motor vehicles, particularly if traffic speeds and volumes are moderate and traffic lanes are sufficiently wide and smooth, many people are reluctant to cycle without special facilities. Increased bicycling tends to improve public fitness and health. Since some physically and economically disadvantaged people depend on cycling, bicycle facility improvements can provide option and equity value. Bicycle facilities tend to have network effects so benefits increase as the network expands. A short, isolated length of bikepath may provide minimal benefit, while a link that connects two otherwise isolated cycling networks, or provides a shortcut (such as connecting two cul de sacs) can provide large benefits. Factors affecting bicycle network benefits
Magnitude of improvement • Whether located on or parallel to a busy roadway where cycling is otherwise difficult. • If a missing link that connects sections of the cycling network. Demand • Number of potential users, including children and young adults, people with lower incomes,
and people who want to bicycle for exercise. • Connects important destinations such as schools, shops, public transit stops and parks. Supports special planning objectives • If in a commercial or resort area where access and recreation support economic development. • If many residents are sedentary and would benefit from increased physical activity. Network and synergetic effects • Connects to a large cycling network. • Is part of an integrated program of to improve alternative modes and support smart growth.
Evaluating Non-Motorized Transport Benefits and Costs Victoria Transport Policy Institute
52
Non-motorized Transport Education and Encouragement Programs Education and encouragement programs help overcome barriers to walking and cycling (ignorance, social stigma, a habit of driving), increase use of these modes, and reduce motor vehicle travel. Such programs tend to have synergistic effects with facility improvements. On the other hand, education and encouragement programs can fail or increase risk if walking and cycling conditions are poor. Factors affecting education and encouragement program benefits
Magnitude of improvement • Program quality. Whether it responds to local conditions and preferences, and so helps
overcome barriers such as ignorance, social stigma, and a habit of driving. • Whether it addresses specific problems, such as high rates of cycling traffic violations. • Community support. Whether it attracts support from sports and recreation, school, public
health, transportation, business, neighborhood and environmental organizations. Demand • Number of people who are likely to increase their walking and cycling activity. • The degree that participants reduce their driving. Supports special planning objectives • Whether located in an area, such as a city or resort community, where reductions in
automobile travel can provide large benefits (such as reduced traffic congestion and parking problems).
• The program targets people who are sedentary and overweight, and so benefit significantly from more active transport.
Network and synergetic effects • Whether part of an integrated program to improve and encourage non-motorized transport. • Whether it helps build broad community support for active transportation.
Public Bike Systems Public Bike Systems (PBS, also called Bike Sharing and Community Bike Programs) provide convenient rental bicycles intended for short (less than 5 kilometer), utilitarian urban trips. A typical Public Bike System consists of a fleet of bicycles, a network of automated stations where bikes are stored, and bike redistribution and maintenance programs. Bikes may be rented at one station and returned to another. Use is free or inexpensive for short periods (typically first 30 minutes). This allows urban residents and visitors to bicycle without needing to purchase, store and maintain a bike. Public bikes tend to benefit users directly, by providing convenient and affordable transport and recreation. They can provide additional benefits by increasing cycling activity and substitute for automobile travel (either alone or in conjunction with public transit).
Evaluating Non-Motorized Transport Benefits and Costs Victoria Transport Policy Institute
53
Factors affecting Public Bike System benefits Magnitude of improvement • The convenience of the service, including the number and location of stations, the ease of
use, and the quality of bikes. Demand • Number of people who are likely to use the services. • The degree that Public Bike users increase their cycling and reduce their driving. Supports special planning objectives • Whether located in an area, such as a city or resort community, where reductions in
automobile travel can provide large benefits. Network and synergetic effects • Whether the system is integrated with public transit services. • Whether part of an integrated program to improve and encourage non-motorized transport.
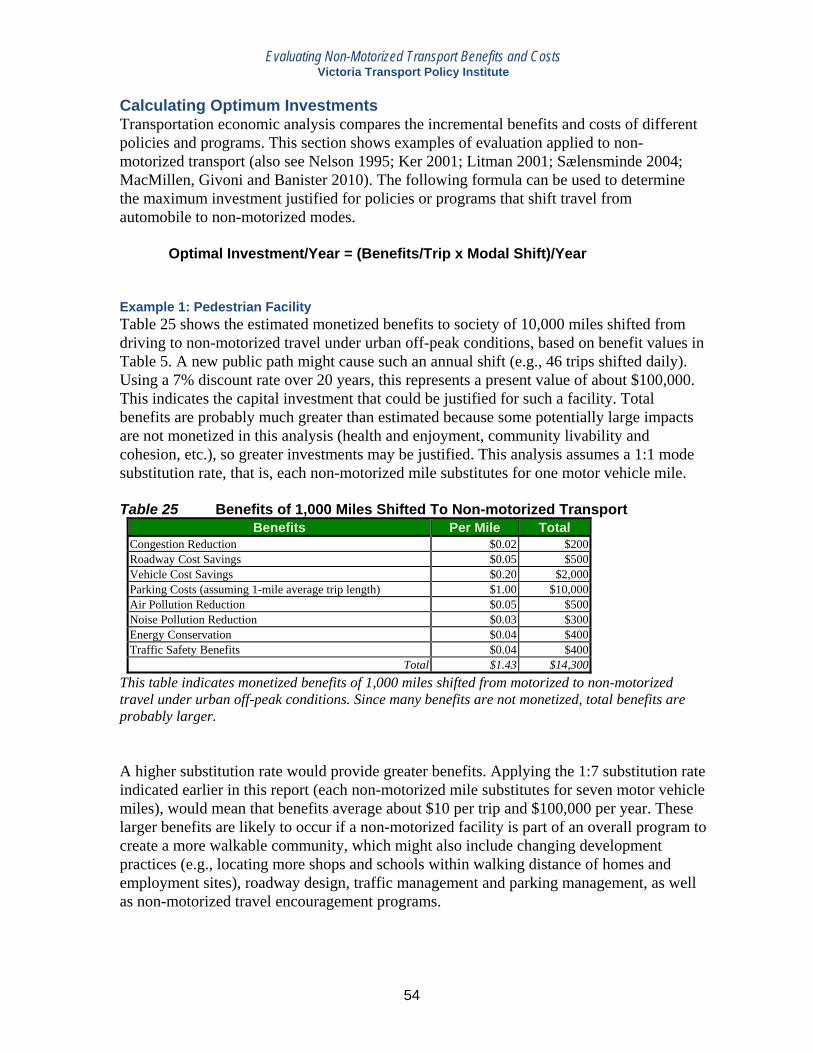
Evaluating Non-Motorized Transport Benefits and Costs Victoria Transport Policy Institute
54
Calculating Optimum Investments Transportation economic analysis compares the incremental benefits and costs of different policies and programs. This section shows examples of evaluation applied to non-motorized transport (also see Nelson 1995; Ker 2001; Litman 2001; Sælensminde 2004; MacMillen, Givoni and Banister 2010). The following formula can be used to determine the maximum investment justified for policies or programs that shift travel from automobile to non-motorized modes. Optimal Investment/Year = (Benefits/Trip x Modal Shift)/Year Example 1: Pedestrian Facility Table 25 shows the estimated monetized benefits to society of 10,000 miles shifted from driving to non-motorized travel under urban off-peak conditions, based on benefit values in Table 5. A new public path might cause such an annual shift (e.g., 46 trips shifted daily). Using a 7% discount rate over 20 years, this represents a present value of about $100,000. This indicates the capital investment that could be justified for such a facility. Total benefits are probably much greater than estimated because some potentially large impacts are not monetized in this analysis (health and enjoyment, community livability and cohesion, etc.), so greater investments may be justified. This analysis assumes a 1:1 mode substitution rate, that is, each non-motorized mile substitutes for one motor vehicle mile. Table 25 Benefits of 1,000 Miles Shifted To Non-motorized Transport
Benefits Per Mile Total Congestion Reduction $0.02 $200 Roadway Cost Savings $0.05 $500 Vehicle Cost Savings $0.20 $2,000 Parking Costs (assuming 1-mile average trip length) $1.00 $10,000 Air Pollution Reduction $0.05 $500 Noise Pollution Reduction $0.03 $300 Energy Conservation $0.04 $400 Traffic Safety Benefits $0.04 $400
Total $1.43 $14,300 This table indicates monetized benefits of 1,000 miles shifted from motorized to non-motorized travel under urban off-peak conditions. Since many benefits are not monetized, total benefits are probably larger. A higher substitution rate would provide greater benefits. Applying the 1:7 substitution rate indicated earlier in this report (each non-motorized mile substitutes for seven motor vehicle miles), would mean that benefits average about $10 per trip and $100,000 per year. These larger benefits are likely to occur if a non-motorized facility is part of an overall program to create a more walkable community, which might also include changing development practices (e.g., locating more shops and schools within walking distance of homes and employment sites), roadway design, traffic management and parking management, as well as non-motorized travel encouragement programs.
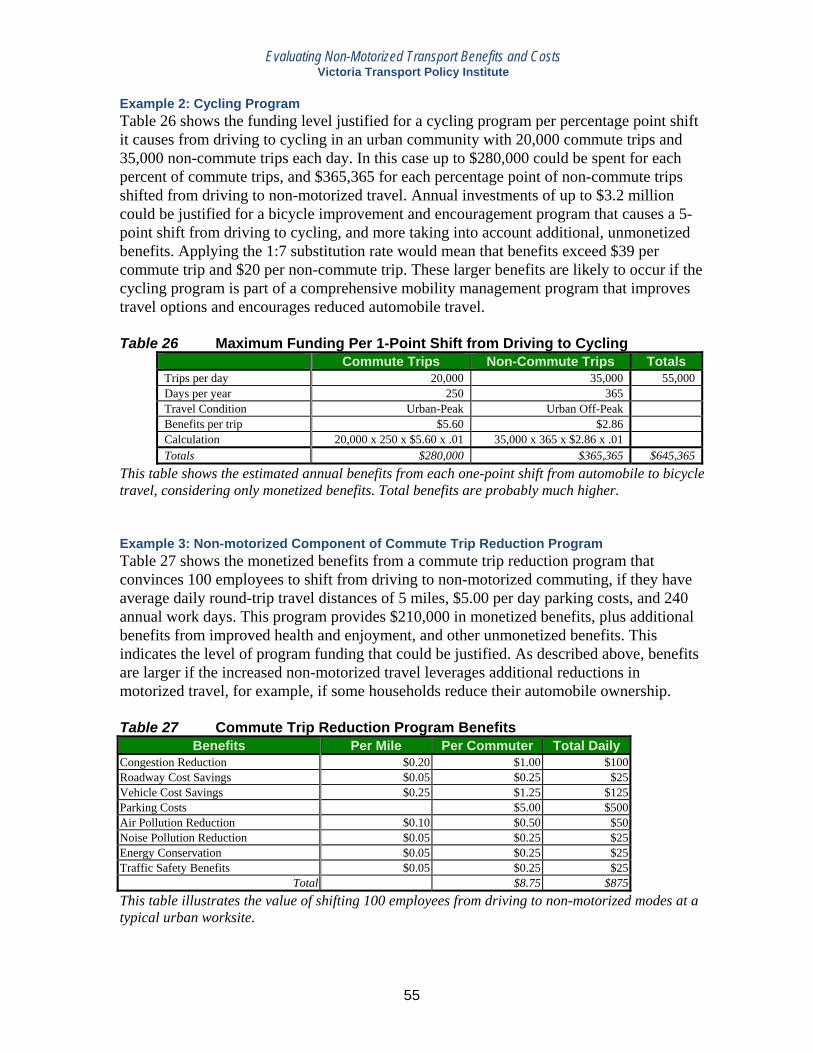
Evaluating Non-Motorized Transport Benefits and Costs Victoria Transport Policy Institute
55
Example 2: Cycling Program Table 26 shows the funding level justified for a cycling program per percentage point shift it causes from driving to cycling in an urban community with 20,000 commute trips and 35,000 non-commute trips each day. In this case up to $280,000 could be spent for each percent of commute trips, and $365,365 for each percentage point of non-commute trips shifted from driving to non-motorized travel. Annual investments of up to $3.2 million could be justified for a bicycle improvement and encouragement program that causes a 5-point shift from driving to cycling, and more taking into account additional, unmonetized benefits. Applying the 1:7 substitution rate would mean that benefits exceed $39 per commute trip and $20 per non-commute trip. These larger benefits are likely to occur if the cycling program is part of a comprehensive mobility management program that improves travel options and encourages reduced automobile travel. Table 26 Maximum Funding Per 1-Point Shift from Driving to Cycling Commute Trips Non-Commute Trips Totals Trips per day 20,000 35,000 55,000 Days per year 250 365 Travel Condition Urban-Peak Urban Off-Peak Benefits per trip $5.60 $2.86 Calculation 20,000 x 250 x $5.60 x .01 35,000 x 365 x $2.86 x .01 Totals $280,000 $365,365 $645,365 This table shows the estimated annual benefits from each one-point shift from automobile to bicycle travel, considering only monetized benefits. Total benefits are probably much higher. Example 3: Non-motorized Component of Commute Trip Reduction Program Table 27 shows the monetized benefits from a commute trip reduction program that convinces 100 employees to shift from driving to non-motorized commuting, if they have average daily round-trip travel distances of 5 miles, $5.00 per day parking costs, and 240 annual work days. This program provides $210,000 in monetized benefits, plus additional benefits from improved health and enjoyment, and other unmonetized benefits. This indicates the level of program funding that could be justified. As described above, benefits are larger if the increased non-motorized travel leverages additional reductions in motorized travel, for example, if some households reduce their automobile ownership. Table 27 Commute Trip Reduction Program Benefits
Benefits Per Mile Per Commuter Total Daily Congestion Reduction $0.20 $1.00 $100 Roadway Cost Savings $0.05 $0.25 $25 Vehicle Cost Savings $0.25 $1.25 $125 Parking Costs $5.00 $500 Air Pollution Reduction $0.10 $0.50 $50 Noise Pollution Reduction $0.05 $0.25 $25 Energy Conservation $0.05 $0.25 $25 Traffic Safety Benefits $0.05 $0.25 $25
Total $8.75 $875 This table illustrates the value of shifting 100 employees from driving to non-motorized modes at a typical urban worksite.
Evaluating Non-Motorized Transport Benefits and Costs Victoria Transport Policy Institute
56
Examples Active Transport Evaluation (MacMillen, Givoni and Banister 2010) In a study titled, The Role Of Walking And Cycling In Advancing Healthy And Sustainable Urban Areas, MacMillen, Givoni and Banister (2010) estimate the costs and benefits of pedestrianizing a commercial street in Oxford, England. They estimate that this project would reduce area vehicle trips 27%, as shoppers and commuters who currently drive shift modes. Estimated costs included the project’s capital and incremental operating expenses, increased traffic crashes, and loss of 25 car parking spaces. Estimated benefits included improved public fitness, reduced traffic congestion, increased journey ambience (more enjoyable travel experience) and greenhouse gas reductions. They conclude that current project evaluation practices overlook or undervalue many active transport benefits, resulting in an underinvestment in walking and cycling improvements. Cycling Improvement Economic Evaluation Foltýnová and Kohlová (2007), analyzed impacts of improved cycling infrastructure on cycling activity using a stated preferences survey to determine willingness to bicycle in response to various cycling improvements in the city of Pilsen, in the Czech Republic. Considering just direct health and air pollution reduction benefits, the cycling facility improvements are not considered cost effective. Valuing Bicycling in Wisconsin (Grabow, Hahn and Whited 2010) The study, Valuing Bicycling’s Economic and Health Impacts in Wisconsin estimated the economic value of bicycling in the state of Wisconsin, including economic activity from bicycle manufacturing and sales ($593 million), tourism and recreational value ($924 million), health benefits of increased physical activity ($320 million) and pollution emission reductions ($90 million). Total estimated benefits average about $360 per resident. The study also investigated factors that affect cycling demand. Bicycle Improvement Benefit/Cost Analysis (Gotschi 2011) This study assessed how costs of Portland’s past and planned investments in bicycling relate to health and other benefits. Bicycle facility costs are compared with 2 types of monetized health benefits: health care cost savings and value of statistical life savings. Levels of bicycling are estimated using past trends, future mode share goals, and a traffic demand model. This analysis indicates that by 2040, investments in the range of $138 to $605 million will result in health care cost savings of $388 to $594 million, fuel savings of $143 to $218 million, and savings in value of statistical lives of $7 to $12 billion. The benefit-cost ratios for health care and fuel savings are between 3.8:1 and 1.2:1, and an order of magnitude larger when value of statistical lives is used. This indicates that such efforts are cost-effective, even when only a limited selection of benefits is considered.
Evaluating Non-Motorized Transport Benefits and Costs Victoria Transport Policy Institute
57
Neighborhood Design and Health The study project, Neighbourhood Design, Travel, and Health (Frank, et al. 2010), describes various factors that affect walkability, methods for measuring those factors, and the impacts of neighborhood walkability on per capita automobile travel, physical activity and fitness in the Vancouver, BC metropolitan region. The results indicate that:
• Adults living in the 25% most walkable neighborhoods walk, bike and take transit 2-3 times more, and drive approximately 58% less than those in more auto-oriented areas.
• Residents in the most walkable areas, with good street connectivity and land use mix, were half as likely to be overweight than those in the least walkable neighborhoods.
• Living in a neighbourhood with at least one grocery store was associated with nearly 1.5 times likelihood of getting sufficient physical activity, compared to areas without grocery stores. Each additional grocery store within a 1-kilometer distance from an individual’s residence was associated with an 11% reduction in the likelihood of being overweight.
• The most walkable neighborhoods have the least ozone pollution, but the most nitric oxide pollution. Some neighborhoods have relatively high walkability and low pollution.
Evaluating Non-Motorized Transport Benefits and Costs Victoria Transport Policy Institute
58
Recommendations for Comprehensive Evaluation As this report discusses, in various ways conventional economic evaluation tends to undervalue non-motorized transport. Most communities that invested significantly in non-motorized travel, such as Davis, California and Eugene, Oregon, did so without formal benefit/cost analysis. These programs resulted from public officials and community members who realized intuitively that non-motorized transport can provide much greater benefits than recognized in conventional planning (Buehler and Handy 2008). Now that these networks are mature, residents of these cities enjoy substantial benefits, including consumer cost savings, parking cost savings, accident reductions, improved public health, reduced pollution, and stronger local economies. More comprehensive economic evaluation may help other communities recognize these benefits and therefore overcome the political and institutional barriers to improving non-motorized transport. Below are guidelines for comprehensive non-motorized transport evaluation.
• Recognize the many roles that walking and cycling can play in an efficient transport system, including basic and affordable mobility, access to motorized travel, exercise, enjoyment and tourism.
• Use comprehensive travel surveys that count all non-motorized travel, including non-commute trips, non-motorized links of automobile and public transit trips, and recreational walking and cycling activity.
• Consider total non-motorized travel demand, including the increased walking and cycling activity that would result from improved walking and cycling conditions, and factors that are likely to increase future demands such as aging population, rising fuel prices, increased urbanization, and rising health and environmental concerns.
• Consider network and synergistic effects. Evaluate non-motorized improvements as an integrated program that includes facility improvements, traffic calming, encouragement programs and demand management strategies, rather than evaluating each project or program individually.
• Consider all categories of benefits from improved and increased non-motorized transport, including improved mobility for non-drivers, consumer savings, user enjoyment, health benefits, congestion reduction, road and parking cost savings, energy conservation, emission reductions, increased economic development, and support for efficient land use development. Do not limit analysis to just the benefits traditionally considered in motorized transport project evaluation.
• Consider non-motorized transport’s leverage effects on automobile travel – each additional mile of walking and cycling tends to reduce 5-10 miles of automobile travel. This significantly increases estimated benefits.
• Consider all funding sources. Walking and cycling programs should receive substantial funding from both transportation and recreational funding sources because non-motorized transport provides both transport and recreational benefits.
Evaluating Non-Motorized Transport Benefits and Costs Victoria Transport Policy Institute
59
Criticisms The following criticisms are sometimes raised against claims of non-motorized benefit analysis. Inferior Good – Declining Demand People sometimes argue that non-motorized transportation is an inferior good, that is, as people become wealthier they shift from non-motorized to motorized transport, so investments in non-motorized facilities is wasteful and efforts to encourage non-motorized travel is either futile or harmful to consumers. Although it is true that as people shift from poverty to a mid-level income they tend to shift from non-motorized to motorized travel, further increases in wealth do not necessarily reduce walking and cycling. Many higher-income cities and countries have relatively high walking and cycling mode share. Activities such as bicycle commuting and neighborhood walking appear to be popular among higher-income people, provided that conditions are favorable (good cycling facilities, walkable neighborhoods, etc.). If this is true then non-motorized transport is not an inferior good in areas with good walking and cycling conditions, so improving such conditions is efficient and responsive to consumer demands. Slow and Inefficient Critics sometimes argue that, since non-motorized modes are slower, they are inefficient, as discussed in the Costs section of this report. While it is true that walking and cycling are often slower than automobile travel, they have an important role to play in an efficient transport system. Improving walking and cycling conditions can contribute to time and money savings that increase efficiency. Walking and cycling are the most efficient modes for shorter trips, which often support motorized travel, for example, by allowing motorists to walk from vehicles to destinations, or to walk rather than drive among various destinations located close together, such as various shops in a commercial center. Improvements, such as pedestrian shortcuts and better roadway crossings improve non-motorized travel speeds. From some perspectives, such as when evaluated based on effective speed (total time spent in travel, including time devoted to working to pay for vehicles and fares) non-motorized travel is often more time-efficient than motorized travel overall. Improving non-motorized travel can save drivers’ time by reducing traffic congestion and the need to chauffeur non-drivers. The most efficient transport system is one in which travelers have viable options, including good walking and cycling conditions, so they can choose the most efficient mode for each trip, considering all benefits and costs. Excessive Costs and Subsidies Some pedestrian and cycling projects and programs may have relatively high subsidy costs per mile of travel, and so seem cost-inefficient. For example, a special pedestrian signal or pedestrian bridge may costs tens or hundreds of thousands of dollars, and depending on use and how costs are allocated, the costs may average many dollars per user, which seems high compared with roadway costs per automobile passenger. However, such analysis often underestimates true automobile travel costs and subsidies (ignoring, for example, parking subsidies and total accident costs). A pedestrian signal or bridge may allow walking or cycling to replace automobile trips that impose many dollars in total costs.
Evaluating Non-Motorized Transport Benefits and Costs Victoria Transport Policy Institute
60
Unfair To Motorists Motorist organizations sometimes argue that motor vehicle user revenue (fuel taxes and registration fees) expenditures on pedestrian and cycling facilities is an unfair diversion of money that should be dedicated to roadway facilities. This reflects a horizontal equity principle that consumers should generally “get what they pay for and pay for what they get.” However, such arguments only reflect half of the equation (get what they pay for) and ignore the other (pay for what you get), which would require that virtually all roadway costs be financed by user fees, which would require 50-100% increase in such fees. In addition, special walking and cycling facilities are largely needed because of the risk and pollution that motorized traffic imposes on pedestrians and cyclists, and to reduce conflicts so motorists can drive faster than would otherwise be required. To the degree that this is true, motorists have a responsibility to help finance non-motorized facilities. Inefficient and Wasteful There is sometimes criticism that demand for non-motorized travel is exaggerated by wishful thinking, and that a particular facility or program will fail to attract users and achieve benefits as claimed. This certainly could occur, but it may reflect other problems with program design rather than an overall lack of demand. For example, a sidewalk or crosswalk improvement may attract few users if it is located in an automobile-dependent location, and a walk-to-school encouragement program may fail if walking conditions are inferior. However, where an appropriate combination of physical improvements and support are implemented, impacts are often significant, and many non-motorized projects and programs have exceeded expectations.
Evaluating Non-Motorized Transport Benefits and Costs Victoria Transport Policy Institute
61
Conclusions Non-motorized transport plays an important and unique role in an efficient transport system. It provides basic mobility, affordable transport, access to motorized modes, physical fitness and enjoyment. Improving non-motorized conditions benefits users directly, and benefits society overall, including motorists who experience less traffic congestion, accident risk and chauffeuring burdens. By helping to create more accessible, multi-modal communities, non-motorized improvements can leverage additional motor vehicle travel reductions, so a mile of increased non-motorized transport reduces several motor-vehicle miles. Conventional transport project evaluation methods tend to overlook and undervalue non-motorized transport. Conventional travel statistics imply that only a small portion of total travel is by non-motorized modes (typically about 5%), but this results, in part, from travel survey practices which overlook many short and non-motorized trips. NMT represents a relatively large portion of total trips and travel time (typically 10-20% in urban areas), and many of the trips it serves are high value, and would be costly to perform by motorized modes. More comprehensive evaluation considers additional non-motorized transport benefits, including indirect reductions in vehicle travel, and additional benefit categories. Some benefits are relatively easy to measure. Transport economists have developed methods for monetizing (measuring in monetary units) traffic congestion, road and parking facility costs, vehicle expenses, crash risk, and pollution emissions. Some non-motorized benefits can be estimated by adapting these values, for example, by applying the same methods used to measure reductions in vehicle congestion delays to calculating the value of reduced barrier effect delay and pedestrian shortcuts. Values used to evaluate traffic deaths and injuries can be used to value the fitness and health benefits of active transport. Affordability can be quantified by indicating cost savings to lower income users. Other impacts may be more difficult to monetize, but should at least be described. These include user enjoyment, option value, support for equity objectives, more compact and accessible land use development (smart growth), economic development, improved community livability, and additional environmental benefits such as habitat preservation. There are many ways to improve and encourage non-motorized travel. Although most communities are implementing some of these strategies, few are implementing all that are justified. Most of these strategies only affect a portion of total travel, so their impacts appear modest, so they are seldom considered the most effective way of solving a particular problem. However, they provide multiple and synergistic benefits. When all impacts are considered, many communities can justify much more support for walking and cycling.
Evaluating Non-Motorized Transport Benefits and Costs Victoria Transport Policy Institute
62
References and Information Resources AASHTO (1990), Policy on Geometric Design for Streets and Highways, American Association of State Highway and Transportation Officials (www.aashto.org). AASHTO (2004), Guide for the Planning, Design, and Operation of Pedestrian Facilities, American Association of State Highway and Transportation Officials (www.aashto.org); at www.walkinginfo.org/library/details.cfm?id=2067. ABW (2010), Bicycling and Walking in the U.S.: 2010 Benchmarking Report, Alliance for Biking & Walking, (www.peoplepoweredmovement.org); at www.peoplepoweredmovement.org/site/index.php/site/memberservices/C529. ADONIS (1999), Best Practice to Promote Cycling and Walking and How to Substitute Short Car Trips by Cycling and Walking, ADONIS Transport RTD Program, European Union (www.cordis.lu/transport/src/adonisrep.htm). Md Aftabuzzaman, Graham Currie and Majid Sarvi (2010), “Evaluating the Congestion Relief Impacts of Public Transport in Monetary Terms,” Journal of Public Transportation, Vol. 13, No. 1, pp. 1-24; www.nctr.usf.edu/jpt/pdf/JPT13-1.pdf. Alta Planning (2005), Caltrans Pedestrian and Bicycle Facilities Technical Reference Guide: A Technical Reference and Technology Transfer Synthesis for Caltrans Planners and Engineers, California Department of Transportation (www.dot.ca.gov); at www.dot.ca.gov/hq/traffops/survey/pedestrian/TR_MAY0405.pdf. L.B. Andersen, et al. (2000), “All-Cause Mortality Associated With Physical Activity During Leisure Time, Work, Sports and Cycling to Work,” Archives of Internal Medicine Vo. 160, No. 11, pp. 1621-1628. Donald Appleyard (1981). Livable Streets, University of California Press (Berkeley). Linda Baker (2009), “How To Get More Bicyclists On The Road,” Scientific American, October (www.scientificamerican.com); at www.scientificamerican.com/article.cfm?id=getting-more-bicyclists-on-the-road. Gary Barnes and Kevin Krizek (2005), Tools for Predicting Usage and Benefits of Urban Bicycle, Humphrey Institute of Public Affairs, University of Minnesota (www.lrrb.org/pdf/200550.pdf). Also see Estimating Bicycling Demand (www.hhh.umn.edu/img/assets/11475/biking_demand.pdf). Keith Bartholomew and Reid Ewing (2011), “Hedonic Price Effects of Pedestrian- and Transit-Designed Development,” Journal of Planning Literature; at http://faculty.arch.utah.edu/bartholomew/Individual%20Files/12_Hedonic_Price_Effects.pdf. David Bassett, John Pucher, Ralph Buehler, Dixie L. Thompson, and Scott E. Crouter (2008), “Walking, Cycling, and Obesity Rates in Europe, North America, and Australia,” Journal of Physical Activity and Health, Vol. 5 (www.humankinetics.com/jpah/journalAbout.cfm), pp. 795-814; at http://policy.rutgers.edu/faculty/pucher/JPAH08.pdf.
Evaluating Non-Motorized Transport Benefits and Costs Victoria Transport Policy Institute
63
David R. Bassett, Holly R. Wyatt, Helen Thompson, John C. Peters, And James 0. Hill (2010), “Pedometer-Measured Physical Activity And Health Behaviors In U.S. Adults,” Medicine & Science in Sports & Exercise, Vol. 42, Is. 10, October, pp 1819-1825; summary at www.ncbi.nlm.nih.gov/pubmed/20305579; at www.dundeeopt.com/wp-content/uploads/2010/12/steps-per-day.pdf. Sue Beeton (2003), An Economic Analysis Of Rail Trails In Victoria, Australia, La Trobe University (www.abc.dotars.gov.au); at www.latrobe.edu.au/bus/Rail%20Trails%20Report.pdf. Belden, Russonello and Stewart (2004) American Community Survey, National Association of Realtors (www.realtor.org) and Smart Growth America (www.smartgrowthamerica.org); at www.brspoll.com/Reports/Smart%20Growth.pdf. Bicyclepedia (www.bicyclinginfo.org/bikecost), a free bicycle facility benefit/cost analysis tool. Marlon G. Boarnet, Michael Greenwald and Tracy E. McMillan (2008), “Walking, Urban Design, and Health: Toward a Cost-Benefit Analysis Framework,” Journal of Planning Education and Research, Vol. 27, No. 3, pp. 341-358; at http://jpe.sagepub.com/cgi/content/abstract/27/3/341. Eric Bruun and Vukan Vuchic (2005), “The Time-Area Concept: Development, Meaning and Applications,” Transportation Research Record 1499, TRB (www.trb.org); at http://pubsindex.trb.org/view.aspx?id=452722. BTS (2002), National Survey of Pedestrian and Bicyclist Attitudes and Behaviors, Bureau of Transportation Statistics (www.bts.gov) and National Highway Traffic Safety Administration; at www.bts.gov/programs/omnibus_surveys/targeted_survey/2002_national_survey_of_pedestrian_and_bicyclist_attitudes_and_behaviors. Colin Buchanan (2007), Paved With Gold, Commission for Architecture and the Built Environment (www.cabe.org.uk); at www.cabe.org.uk/files/paved-with-gold-summary.pdf. Ted Buehler and Susan Handy (2008), “Fifty Years of Bicycle Policy in Davis, California,” Transportation Research Record 2074, TRB (www.trb.org), pp. 52–57; at www.des.ucdavis.edu/faculty/handy/Davis_bike_history.pdf. Jeroen Buis (2000), The Economic Significance of Cycling: A Study to Illustrate the Costs and Benefits of Cycling Policy, VNG (The Haag, the Netherlands; www.vnguitgeverij.nl) and Interface for Cycling Expertise (www.cycling.nl). Robert Burchell, et al. (2002), The Costs of Sprawl – 2000, TCRP Report 74, TRB (www.trb.org); at http://onlinepubs.trb.org/Onlinepubs/tcrp/tcrp_rpt_74-a.pdf. CABE (2007), Paved with Gold: The Real Value of Street Design, Commission on Architecture and the Built Environment (www.cabe.org.uk); at www.cabe.org.uk/default.aspx?contentitemid=1956. Sally Cairns, et al (2004), Smarter Choices - Changing the Way We Travel, UK Department for Transport (www.dft.gov.uk); at www.dft.gov.uk/pgr/sustainable/smarterchoices/ctwwt.
Evaluating Non-Motorized Transport Benefits and Costs Victoria Transport Policy Institute
64
Richard Campbell, Margaret Wittgens (2004), The Business Case for Active Transportation: The Economic Benefits of Walking and Cycling, Better Environmentally Sound Transportation (www.best.bc.ca); at http://thirdwavecycling.com/pdfs/at_business_case.pdf. Xinyu Cao, Susan L. Handy and Patricia L. Mokhtarian (2006), “The Influences Of The Built Environment And Residential Self-Selection On Pedestrian Behavior,” Transportation (www.springerlink.com), Vol. 33, No. 1, pp. 1 – 20. Sanya Carleyolsen, Tanya Meyer, Joseph Rude and Ian Scott (2005), Measuring the Economic Impact and Value of Parks, Trails and Open Space in Jefferson County Accounting for Current and Future Scenarios, for Jefferson County Parks Department and Wisconsin Department of Natural Resources (http://urpl.wisc.edu/academics/workshop/jefferson%20county/team1/JCEconfinal.pdf). Nick Cavill and Adrian Davis (2007), Cycling & Health: What’s The Evidence?, Cycling England, Department for Transport (www.dft.gov.uk); at www.dft.gov.uk/cyclingengland/site/wp-content/uploads/2009/01/cycling_and_health_full_report.pdf. Nick Cavill, Sonja Kahlmeier, Harry Rutter, Francesca Racioppi and Pekka Oja (2008), “Economic Analyses Of Transport Infrastructure And Policies Including Health Effects Related To Cycling And Walking: A Systematic Review,” Transport Policy, Vol. 15, No. 5, pp. 291–304. Nick Cavill, Andy Cope and Angela Kennedy (2009), Valuing Increased Cycling in the Cycling Demonstration Towns, Cycling England, Department for Transport (www.dft.gov.uk); at www.dft.gov.uk/cyclingengland/site/wp-content/uploads/2009/12/valuing-increased-cycling-in-the-cycling-demonstration-towns.pdf. Robert Cervero (2007), “Transit Oriented Development’s Ridership Bonus: A Product Of Self Selection And Public Policies,” Environment and Planning, Vol. A, No. 39, pp. 2068-2085; at www.uctc.net/papers/765.pdf. CDC (2010), How Much Physical Activity Do You Need? Center of Disease Control ; at www.cdc.gov/physicalactivity/everyone/guidelines Larry S. Chapman (2005), “Meta-Evaluation of Worksite Health Promotion Economic Return Studies: 2005 Update,” The Art of Health Promotion, part of the American Journal of Health Promotion (www.healthpromotionjournal.com); at http://fhs.mcmaster.ca/ceb/community_medicine_page/docs/meta%20evaluation%20of%20worksite%20health%20promotion.pdf. Mikhail Chester and Arpad Horvath (2008), Environmental Life-cycle Assessment of Passenger Transportation: A Detailed Methodology for Energy, Greenhouse Gas and Criteria Pollutant Inventories of Automobiles, Buses, Light Rail, Heavy Rail and Air v.2, UC Berkeley Center for Future Urban Transport, (www.its.berkeley.edu/volvocenter/), Paper vwp-2008-2; at www.sustainable-transportation.com. Harry Chmelynski (2008), National Economic Impacts per $1 Million Household Expenditures (2006); Spreadsheet Based On IMPLAN Input-Output Model, Jack Faucett Associates (www.jfaucett.com).
Evaluating Non-Motorized Transport Benefits and Costs Victoria Transport Policy Institute
65
CNU (2009), San Francisco’s Octavia, Congress for New Urbanism (www.cnu.org); at www.cnu.org/highways/sfoctavia. Joe Cortright (2009), Walking the Walk: How Walkability Raises Home Values in U.S. Cities, CEOs for Cities (www.ceosforcities.org); at www.ceosforcities.org/files/WalkingTheWalk_CEOsforCities1.pdf. CPF (2008), Economic Benefits of Cycling for Australia, Cycling Promotion Fund (www.cyclingpromotion.com.au); at www.cyclingpromotion.com.au/images/stories/downloads/CPF_CyclingBenefits.pdf. CTE (2008), Improved Methods For Assessing Social, Cultural, And Economic Effects Of Transportation Projects, NCHRP Project 08-36, Task 66, TRB (www.trb.org), American Association of State Highway and Transportation Officials (AASHTO); at www.statewideplanning.org/_resources/234_NCHRP-8-36-66.pdf. Jeroen Johan de Hartog, Hanna Boogaard, Hans Nijland and Gerard Hoek (2010), “Do The Health Benefits Of Cycling Outweigh The Risks?” Environmental Health Perspectives, doi:10.1289/ehp.0901747; http://ehp03.niehs.nih.gov/article/info%3Adoi%2F10.1289%2Fehp.0901747. Mark Delucchi (2005), The Social-Cost Calculator (SCC): Documentation of Methods and Data, and Case Study of Sacramento, Sacramento Area Council of Governments (SACOG) and the Northeast States for Coordinated Air-Use Management (NESCAUM), UCD-ITS-RR-05-37, (www.its.ucdavis.edu/publications/2005/UCD-ITS-RR-05-37.pdf). DfT (2003), Transport Analysis Guidance: 3.6.1: The Option Values Sub-Objective, Department for Transport (www.dft.gov.uk); at www.dft.gov.uk/webtag/documents/expert/unit3.6.php#3.6.1. DfT (2004), National Travel Survey, UK Department for Transport (www.transtat.dft.gov.uk). DfT (2009), Transport Analysis Guidance: 3.6.2: The Severance Sub-Objective, Department for Transport (www.dft.gov.uk); at www.dft.gov.uk/webtag/documents/expert/unit3.6.2.php. DfT (2010), Cycling Demonstration Towns – Development of Benefit-Cost Ratios by the UK Department for Transport (www.dft.gov.uk/cyclingengland/site/wp-content/uploads/2010/02/091223-cdts-bcr-analysis-final-edit.pdf. Jennifer Dill and John Gliebe (2008), Understanding and Measuring Bicycling Behavior: A Focus on Travel Time and Route Choice, Oregon Transportation Research and Education Consortium (OTREC); at www.lulu.com/items/volume_64/5687000/5687029/1/print/OTREC-RR-08-03_Dill_BicyclingBehavior_FinalReport.pdf. Emily Drennen (2003), Economic Effects of Traffic Calming on Urban Small Businesses, Masters Thesis, San Francisco State University (www.emilydrennen.org); at www.emilydrennen.org/research_trans.shtml. K.I. Erickson, et al. (2010), “Physical Activity Predicts Grey Matter Volume In Late Adulthood: The Cardiovascular Health Study,” Neurology (www.neurology.org); at www.neurology.org/cgi/content/abstract/WNL.0b013e3181f88359v1.
Evaluating Non-Motorized Transport Benefits and Costs Victoria Transport Policy Institute
66
Mark Eppli and Charles C. Tu (2000), Valuing the New Urbanism; The Impact of New Urbanism on Prices of Single-Family Homes, Urban Land Institute (www.uli.org). European Commission (1999), Cycling: The Way Ahead For Towns And Cities: A Handbook for Local Authorities, Environment DG, European Commission (http://europa.eu.int/comm/images/language/lang_en3.gif). Reid Ewing, R Pendall and Don Chen (2002), Measuring Sprawl and Its Impacts, Smart Growth America (www.smartgrowthamerica.org). FDOT (2003), Transportation Costs, Office of Policy Planning, Florida Department of Transportation (www.dot.state.fl.us/planning/policy). FHWA (1997 and 2000), 1997 Federal Highway Cost Allocation Study, USDOT (www.ota.fhwa.dot.gov). FHWA (1999), Guidebook on Methods to Estimate Non-Motorized Travel, FHWA-RD-98-166, Federal Highway Administration (www.fhwa.dot.gov); at www.fhwa.dot.gov/tfhrc/safety/pubs/vol2/contents.htm. FHWA (2004), Travel Demand Management, Office of Operations, Federal Highway Administration (www.fhwa.dot.gov/operations). FHWA (2008), 2008 Highway Statistics, FHWA, USDOT (www.fhwa.dot.gov/policyinformation/statistics/2008). Fietsberaad (2008), Cycling in the Netherlands, Ministry of Transport, Public Works and Water Management, The Netherland; at www.fietsberaad.nl/library/repository/bestanden/Cycling%20in%20the%20Netherlands%20VenW.pdf. Hana Foltýnová And Markéta Braun Kohlová (2007), Cost-Benefit Analysis Of Cycling Infrastructure: A Case Study Of Pilsen, Charles University Environment Centre (www.czp.cuni.cz); at www.czp.cuni.cz/ekonomie/letskolacraj/bruhovakohlova.pdf. David Forkenbrock and Glen Weisbrod (2001), Guidebook for Assessing the Social and Economic Effects of Transportation Projects, NCHRP Report 456, TRB (www.trb.org). David J. Forkenbrock and Jason Sheeley (2004), Effective Methods for Environmental Justice Assessment, National Cooperative Highway Research Program (NCHRP) Report 532, Transportation Research Board (www.trb.org); at http://onlinepubs.trb.org/onlinepubs/nchrp/nchrp_rpt_532.pdf. Ann Forsyth, Kevin J. Krizek and Asha Weinstein Agrawal (2010), Measuring Walking and Cycling Using the PABS (Pedestrian and Bicycling Survey) Approach: A Low-Cost Survey Method for Local Communities, Mineta Transportation Institute, San Jose State University (www.transweb.sjsu.edu); at www.transweb.sjsu.edu/project/2907.html.
Evaluating Non-Motorized Transport Benefits and Costs Victoria Transport Policy Institute
67
Lawrence Frank (2004), “Obesity Relationships with Community Design, Physical Activity and Time Spent in Cars,” American Journal of Preventive Medicine (www.ajpm-online.net), Vol. 27, No. 2, June, pp. 87-97. Lawrence Frank, Sarah Kavage and Todd Litman (2006), Promoting Public Health Through Smart Growth: Building Healthier Communities Through Transportation And Land Use Policies, Smart Growth BC (www.smartgrowth.bc.ca); at www.vtpi.org/sgbc_health.pdf. Lawrence Frank, Andrew Devlin, Shana Johnstone and Josh van Loon (2010), Neighbourhood Design, Travel, and Health in Metro Vancouver: Using a Walkability Index, Active Transportation Collaboratory, UBC (www.act-trans.ubc.ca); at www.act-trans.ubc.ca/documents/WalkReport_ExecSum_Oct2010_HighRes.pdf. Gallup (2008), National Survey of Bicyclist and Pedestrian Attitudes and Behavior, U.S. Department of Transportation’s National Highway Traffic Safety Administration (www.nhtsa.dot.gov) and the Bureau of Transportation Statistics (www.bts.gov); at www.nhtsa.dot.gov/staticfiles/DOT/NHTSA/Traffic%20Injury%20Control/Articles/Associated%20Files/810971.pdf. Heidi Garrett-Peltier (2010), Estimating The Employment Impacts Of Pedestrian, Bicycle, And Road Infrastructure: Case Study: Baltimore, Political Economy Research Institute University of Massachusetts, Bike League (www.bikeleague.org); at www.bikeleague.org/resources/reports/pdfs/baltimore_Dec20.pdf. Thomas Gotschi and Kevin Mills (2008), Active Transportation for America: A Case for Increased Federal Investment in Bicycling and Walking, Rail-To-Trails Conservancy (www.railstotrails.org); at www.railstotrails.org/ATFA. Thomas Gotschi (2011), “Costs and Benefits of Bicycling Investments in Portland, Oregon,” Journal of Physical Activity and Health, Vol. 8, Supplement 1, pp. S49-S58; at http://journals.humankinetics.com/jpah-supplements-special-issues/jpah-volume-8-supplement-january/costs-and-benefits-of-bicycling-investments-in-portland-oregon. Maggie Grabow, Micah Hahn and Melissa Whited (2010), Valuing Bicycling’s Economic and Health Impacts in Wisconsin, Nelson Institute for Environmental Studies, University of Wisconsin‐Madison; at www.bfw.org/uploads/media/Valuing_Bicycling_in_Wisconsin_Final_Report_January_2010[1].pdf. Jessica Y. Guo and Sasanka Gandavarapu (2010), “An Economic Evaluation Of Health-Promotive Built Environment Changes,” Preventive Medicine, Vol. 50, Supplement 1, January, pp. S44-S49; at www.activelivingresearch.org/resourcesearch/journalspecialissues. Sandra A. Ham, Caroline A. Macera and Corina Lindley (2005), “Trends in walking for transportation in the United States, 1995 and 2001,” Preventing Chronic Diseases, Vol. 2, No. 4; at www.cdc.gov/pcd/issues/2005/oct/pdf/04_0138.pdf. C. Hass-Klau (1993), “Impact Of Pedestrianisation And Traffic Calming On Retailing, A Review Of The Evidence From Germany And The UK,” Transport Policy, Vol. 1, No. 1, pp. 21-31.
Evaluating Non-Motorized Transport Benefits and Costs Victoria Transport Policy Institute
68
ICLEI (2007), Active Transportation Quantification Tool, Cities for Climate Protection, International Council for Local Environmental Initiatives (http://att.ccp.iclei.org); at http://att.ccp.iclei.org/more/about. Peter Jacobsen (2003), “Safety In Numbers: More Walkers and Bicyclists, Safer Walking and Bicycling,” Injury Prevention (http://ip.bmjjournals.com), Vol. 9, pp. 205-209. Duygu Karadeniz (2008), Impact of the Little Miami Scenic Trail on Single Family Residential Property Values, Masters Thesis, University of Cincinnati, (http://atfiles.org/files/pdf/LittleMiamiPropValue.pdf). Jeffrey R. Kenworthy and Felix B. Laube (2000), An International Sourcebook of Automobile Dependence in Cities, 1960-1990, University Press of Colorado (Boulder). Ian Ker (2001), “Deconstructing the Future: Assessing New Initiatives in Transport, Including Demand Management and Walking,” World Transport Policy & Practice, Vol. 7, No. 4 (www.ecoplan.org/wtpp). Charles Komanoff and Cora Roelofs (1993), The Environmental Benefits of Bicycling and Walking, National Bicycling and Walking Study Case Study No. 15, USDOT. Kevin J. Krizek (2006), “Two Approaches to Valuing Some of Bicycle Facilities' Presumed Benefits,” Journal of the American Planning Association, Vol. 72. No. 3, Summer, pp. 309-319; at http://carbon.ucdenver.edu/~kkrizek/pdfs/Two%20approaches%20valuing%20bike.pdf. Kevin J. Krizek, et al. (2006), Guidelines for Analysis of Investments in Bicycle Facilities, NCHRP Report 552, TRB (www.trb.org); at http://onlinepubs.trb.org/onlinepubs/nchrp/nchrp_rpt_552.pdf. Kevin J. Krizek, Gary Barnes, Ryan Wilson, Bob Johns and Laurie McGinnis (2007), Nonmotorized Transportation Pilot Program Evaluation Study, Active Communities Transportation Research Group and the Center for Transportation Studies, University of Minnesota (www.cts.umn.edu); at www.cts.umn.edu/Publications/ResearchReports/pdfdownload.pl?id=904. LAB (2009), Economic Benefits of Bicycle Infrastructure Investments, League of American Bicyclists (www.bikeleague.org) and the Alliance for Biking & Walking (www.peoplepoweredmovement.org); at www.bikeleague.org/resources/reports/pdfs/economic_benefits_bicycle_infrastructure_report.pdf. LAB (2010), Highlights the 2009 National Household Travel Survey, League of American Bicyclists (www.bikeleague.org); at www.bikeleague.org/resources/reports/pdfs/nhts09.pdf. Alison Lee and Alan March (2010), “Recognising The Economic Role Of Bikes: Sharing Parking In Lygon Street, Carlton,” Australian Planner, Vol. 47, No. 2, pp. 85 - 93; at http://dx.doi.org/10.1080/07293681003767785; also see http://colabradio.mit.edu/wp-content/uploads/2010/12/Value_of_Bike_Parking_Alison_Lee.pdf. Yael M. Levitte (1999), Bicycle Demand Analysis – A Toronto Case Study, Transportation Research Board Annual Meeting (www.trb.org). LGC (2001), The Economic Benefits of Walkable Communities, Local Government Commission (www.lgc.org); at www.lgc.org/freepub/docs/community_design/focus/walk_to_money.pdf.
Evaluating Non-Motorized Transport Benefits and Costs Victoria Transport Policy Institute
69
Todd Litman (1995), “Land Use Impact Costs of Transportation,” World Transport Policy & Practice, Vol. 1, No. 4, pp. 9-16; an updated version titled Evaluating Transportation Land Use Impacts is available at the VTPI website (www.vtpi.org/landuse.pdf). Todd Litman (2001), What’s It Worth? Life Cycle and Benefit/Cost Analysis for Evaluating Economic Value, Presented at Internet Symposium on Benefit-Cost Analysis, Transportation Association of Canada (www.tac-atc.ca); at VTPI (www.vtpi.org/worth.pdf). Todd Litman (2003a), “Measuring Transportation: Traffic, Mobility and Accessibility,” ITE Journal (www.ite.org), Vol. 73, No. 10, October 2003, pp. 28-32; at www.vtpi.org/measure.pdf. Also see, Evaluating Accessibility for Transport Planning (www.vtpi.org/access.pdf). Todd Litman (2003), “Economic Value of Walkability,” Transportation Research Record 1828, Transportation Research Board (www.trb.org), pp. 3-11; at www.vtpi.org/walkability.pdf. Todd Litman (2004), Evaluating Public Transit Benefits and Costs, VTPI (www.vtpi.org); at www.vtpi.org/tranben.pdf. Todd Litman (2005), Whose Roads? Evaluating Bicyclists’ and Pedestrians’ Right to Use Public Roadways, VTPI (www.vtpi.org); at www.vtpi.org/whoserd.pdf. Todd Litman (2006), The Future Isn’t What It Used To Be: Changing Trends And Their Implications For Transport Planning, Victoria Transport Policy Institute (www.vtpi.org); at www.vtpi.org/future.pdf; originally published as “Changing Travel Demand: Implications for Transport Planning,” ITE Journal, Vol. 76, No. 9, (www.ite.org), September, pp. 27-33. Todd Litman (2007), Comprehensive Transport Planning Framework: Best Practices For Evaluating All Options And Impacts, Victoria Transport Policy Institute (www.vtpi.org); at www.vtpi.org/comprehensive.pdf. Todd Litman (2008), Land Use Impacts On Transport: How Land Use Factors Affect Travel Behavior, VTPI (www.vtpi.org); at www.vtpi.org/landtravel.pdf. Todd Litman (2009), Transportation Cost and Benefit Analysis Guidebook, VTPI (www.vtpi.org/tca). Todd Litman (2009b), Where We Want To Be: Home Location Preferences And Their Implications For Smart Growth, Victoria Transport Policy Institute (www.vtpi.org); at www.vtpi.org/sgcp.pdf. Todd Litman (2010), Short and Sweet: Analysis of Shorter Trips Using National Personal Travel Survey Data, VTPI (www.vtpi.org); at www.vtpi.org/short_sweet.pdf. Todd Litman (2011), Evaluating Transportation Economic Development Impacts, VTPI (www.vtpi.org); at www.vtpi.org/econ_dev.pdf. Todd Litman and Steven Fitzroy (2006), Safe Travels: Evaluating Mobility Management Traffic Safety Impacts, VTPI (www.vtpi.org); at www.vtpi.org/safetrav.pdf.
Evaluating Non-Motorized Transport Benefits and Costs Victoria Transport Policy Institute
70
William R. Loudon, Mandi Roberts and Sarah Kavage (2007), Testing the Effectiveness of Bicycle and Pedestrian Access Improvements in Reducing Commute Vehicle Trips, Transportation Research Board Annual Meeting (www.trb.org). Louis Berger Inc. (1998), Guidance for Estimating the Indirect Effects of Proposed Transportation Projects, NCHRP Report 403, Transportation Research Board (www.trb.org). LTNZ (2006), Economic Evaluation Manual (EEM) – Volumes 1 & 2, Land Transport New Zealand (www.landtransport.govt.nz); at www.landtransport.govt.nz/funding/manuals.html (Active transportation health benefits data is found in Volume 2, section 3.8, p 3-22). P. Mackie, et al. (2003), Values of Travel Time Savings in the UK, UK Dept. for Transport (www.dft.gov.uk); at www.dft.gov.uk/pgr/economics/rdg/valueoftraveltimesavingsinth3130. James MacMillen, Moshe Givoni And David Banister (2010), “Evaluating Active Travel: Decision-Making for the Sustainable City,” Built Environment, Vol. 36, No. 4, Dec. pp. 519-536; summary at www.atypon-link.com/ALEX/doi/abs/10.2148/benv.36.4.519. Andrew A. McDonald, Andrew G. Macbeth, Karisa Ribeiro and David Mallett (2007), Estimating Demand for New Cycling Facilities in New Zealand, Land Transport New Zealand Research Report 340 (www.ltsa.govt.nz); at www.ltsa.govt.nz/research/reports/340.pdf. Roger Mackett (2000), How to Reduce the Number of Short Trips by Car, Centre for Transport Studies, University College London (www.ucl.ac.uk/transport-studies/shtrp.htm). Roger L. Mackett (2001), “Polices to Attract Drivers Out of Their Cars For Short Trips” Transport Policy, Vol. 8, No. 4 (www.elsevier.com/locate/tranpol), October, pp. 295-306. Anne Vernez Moudon, et al. (1996), Effects of Site Design on Pedestrian Travel in Mixed Use, Medium-Density Environments, Washington State Transportation Center, Document WA-RD 432.1, (www.wsdot.wa.gov/ppsc/research/onepages/WA-RD4321.htm). Dan Nabors, et al. (2007), Pedestrian Road Safety Audit Guidelines and Prompt Lists, Pedestrian and Bicycle Information Center (www.pedbikeinfo.org), Federal Highway Administration Office of Safety; at http://drusilla.hsrc.unc.edu/cms/downloads/PedRSA.reduced.pdf. NAR and NAHB (2002), Joint Survey: Survey Suggests Market-Based Vision of Smart Growth, National Association of Realtors & National Association of Home Builders (www.realtor.org/SG3.nsf/Pages/NARNHAB02Survey?OpenDocument). NBPC (1995), Economic and Social Benefits of Off-Road Bicycle and Pedestrian Facilities, Technical Assistance Series, No. 2, National Bicycle and Pedestrian Clearinghouse; at http://greenway.org/pdf/econ_social_benefits.pdf. NCDOT (2004), Pathways to Prosperity: The Economic Impact of Investments in Bicycle Facilities, Division of Bicycle and Pedestrian Transportation, N.C. Department of Transportation (www.ncdot.org/transit/bicycle/safety/safety_economicimpact.html). Arthur C. Nelson (1995), “Private Provision of Public Pedestrian and Bicycle Access Ways; Public Policy Rationale and the Nature of Public and Private Benefits,” Transportation Research Record
Evaluating Non-Motorized Transport Benefits and Costs Victoria Transport Policy Institute
71
1502, TRB (www.trb.org), pp. 96-104; at www.nvc.vt.edu/uap/docs/acnpubs/Transportation/acn_pedandbikeaccess.pdf. Arthur C. Nelson and David Allen (1997), “If You Build Them, Commuters Will Use Them; Cross-Sectional Analysis of Commuters and Bicycle Facilities,” Transportation Research Record 1578, TRB (www.trb.org), pp. 79-83. NHTS (2009), National Household Travel Survey, USDOT (http://nhts.ornl.gov). NRC (2009), Hidden Costs of Energy: Unpriced Consequences of Energy Production and Use, National Research Council (www.nap.edu/catalog/12794.html). NTTP (2005), Economic Values of Greenways, Trails, and River Protection, National Trails Training Partnership, American Trails (www.americantrails.org); at www.americantrails.org/resources/economics/NPSeconStudy.html. NYDOT (2010), Prospect Park West Bicycle Path and Traffic Calming Update, New York City Department of Transportation (www.nyc.gov); at www.nyc.gov/html/dot/downloads/pdf/20101203_ppw_update.pdf. Catherine O’Brien (2001), Ontario Walkability Study: Trip to School: Children’s Experiences and Aspirations, York Centre for Applied Sustainability (www.saferoutestoschool.ca); at www.saferoutestoschool.ca/downloads/guide/Ont_Walk_Study.doc. ODOT (1995), Oregon Bicycle and Pedestrian Plan, Oregon Department of Transportation (www.oregon.gov/ODOT); at www.oregon.gov/ODOT/HWY/BIKEPED/planproc.shtml. Queensland Transport (1999), Integrated Cycle Strategy for South East Queensland. Queensland Transport and Main Roads (www.transport.qld.gov.au/qt/driver.nsf/index/cyc_economic_benefits). PBIC (2009), What objections might homeowners make to installing sidewalks in their neighborhoods and how can I address these concerns? Pedestrian and Bicycle Information Center (www.walkinginfo.org); at www.walkinginfo.org/faqs/answer.cfm?id=3456. Joe Peffer (2009), Sidewalks. Do they add value? Whose responsibility are sidewalks?, Columbus Ohio Realtor Blog (http://columbushomesblog.com); at http://columbushomesblog.com/2009/09/29/sidewalks-do-they-add-value-whose-responsibility-are-sidewalks. Lee Pike (2011), Generation Of Walking, Cycling And Public Transport Trips: Pilot Study, New Zealand Transport Agency (www.nzta.govt.nz); at www.nzta.govt.nz/resources/research/reports/439/docs/439.pdf. Gary Pivo And Jeffrey D. Fisher (2010), “The Walkability Premium In Commercial Real Estate Investments,” forthcoming Real Estate Economics (www.wiley.com/bw/journal.asp?ref=1080-8620); www.u.arizona.edu/~gpivo/Walkability%20Paper%20February%2010.pdf. Steven E. Polzin, Xuehao Chu and Vishaka Shiva Raman (2008), Exploration of a Shift in Household Transportation Spending from Vehicles to Public Transportation, Center for Urban Transportation Research (www.nctr.usf.edu); at www.nctr.usf.edu/pdf/77722.pdf.
Evaluating Non-Motorized Transport Benefits and Costs Victoria Transport Policy Institute
72
PPI (2002), Understanding Senior Transportation: Report And Analysis Of A Survey Of Consumers 50+, Public Policy Institute, American Association for Retired Persons (www.aarp.org); at http://assets.aarp.org/rgcenter/il/inb50_transport.pdf. John Pucher and Lewis Dijkstra (2000), “Making Walking and Cycling Safer: Lessons from Europe,” Transportation Quarterly, Vol. 54, No. 3, Summer; at www.vtpi.org. John Pucher, Ralph Buehler, David R. Bassett and Andrew L. Dannenberg (2010), “Walking and Cycling to Health: A Comparative Analysis of City, State, and International Data,” American Journal of Public Health, at http://ajph.aphapublications.org/cgi/reprint/AJPH.2009.189324v1. John Pucher and Ralph Buehler (2010), “Walking and Cycling for Healthy Cities,” Built Environment, Vol. 36, No. 4 (www.atypon-link.com/ALEX/toc/benv/36/4), December, pp 391-414; at http://policy.rutgers.edu/faculty/pucher/BuiltEnvironment_WalkBike_10Dec2010.pdf. David P. Racca and Amardeep Dhanju (2006), Property Value/Desirability Effects of Bike Paths Adjacent to Residential Areas, Delaware Center For Transportation and The State of Delaware Department of Transportation, University of Delaware (www.udel.edu); at http://128.175.63.72/projects/DOCUMENTS/bikepathfinal.pdf. Wolfgang Rauh and Christian Bleckmann (2004), Mobility Management – Benefits For All, Bicycle Research Report No 161, European Cycling Federation (www.ecf.com/37_1); at www.ecf.com/files/2/12/23/BRR_161_English.pdf. P. Rietveld (2000), “Non-motorized Modes in Transport Systems: A Multimodal Chain Perspective for The Netherlands,” Transportation Research D, Vol. 5, No. 1, January, pp. 31-36. Dorothy Robinson (2005), “Safety in Numbers in Australia: More Walkers and Bicyclists, Safer Walking and Bicycling,” Health Promotion Journal of Australia, Vol. 16, No. 1 (www.healthpromotion.org.au), April 2005, pp. 47-51. Shannon H. Rogers, John M. Halstead, Kevin H. Gardner and Cynthia H. Carlson (2010), “Examining Walkability And Social Capital As Indicators Of Quality Of Life At The Municipal And Neighborhood Scales,” Applied Research In Quality of Life (www.springerlink.com), DOI: 10.1007/s11482-010-9132-4; at www.springerlink.com/content/xtq06270p27r1v0h. Kjartan Sælensminde (2004), “Cost-Benefit Analysis of Walking and Cycling Track Networks Taking Into Account Insecurity, Health Effects and External Costs of Motor Vehicle Traffic,” Transportation Research A, Vol. 38, No. 8 (www.elsevier.com/locate/tra), Oct. 2004, pp. 593-606; at www.toi.no/toi_Data/Attachments/887/sum_567_02.pdf. M.A. Sevick, et al (2000), “Cost-Effectiveness Of Lifestyle And Structured Exercise Interventions In Sedentary Adults: Results Of Project ACTIVE’, American Journal of Preventive Medicine, Vol. 19, No. 1. Yan Song and Gerrit-Jan Knaap (2003), The Effects of New Urbanism on Housing Values: A Quantitative Assessment, National Center for Smart Growth Research and Education, University of Maryland (www.smartgrowth.umd.edu/research/POSTSongKnaap2.htm).
Evaluating Non-Motorized Transport Benefits and Costs Victoria Transport Policy Institute
73
SQW (2007), Valuing the Benefits of Cycling: A Report to Cycling England, Cycling England, UK Department for Transport (www.dft.gov.uk); at www.dft.gov.uk/cyclingengland/site/wp-content/uploads/2008/08/valuing-the-benefits-of-cycling-full.pdf. Peter R. Stopher and Stephen P. Greaves (2007), “Household Travel Surveys: Where Are We Going?” Transportation Research A, Vol. 41/5 (www.elsevier.com/locate/tra), June, pp. 367-381. STPP (2003), Americans Attitudes Toward Walking and Creating More Walkable Communities, Surface Transportation Policy Project (www.transact.org). Subsidy Scope (2009), Analysis Finds Shifting Trends in Highway Funding: User Fees Make Up Decreasing Share Subsidy Scope (www.subsidyscope.com); at www.subsidyscope.com/transportation/highways/funding. Fred Sztabinski (2009), Bike Lanes, On-Street Parking and Business A Study of Bloor Street in Toronto’s Annex Neighbourhood, The Clean Air Partnership (www.cleanairpartnership.org); at www.cleanairpartnership.org/pdf/bike-lanes-parking.pdf. TA (2006), Curbing Cars: Shopping, Parking and Pedestrian Space in SoHo, Transportation Alternatives & Schaller Consulting (www.transalt.org); at www.transalt.org/files/newsroom/reports/soho_curbing_cars.pdf. Thunderhead Alliance (2007), Bicycling and Walking in the U.S.: 2007 Benchmarking Report, (www.thunderheadalliance.org); at http://thunderheadalliance.org/pdf/benchmarking2007.pdf. Paul J. Tranter (2004), Effective Speeds: Car Costs are Slowing Us Down, University of New South Wales; at www.environment.gov.au/settlements/transport/publications/effectivespeeds.html. TravelSmart (2005), Evaluation of Australian TravelSmart Projects in the ACT, South Australia, Queensland, Victoria and Western Australia 2001-2005, Report to the Department of the Environment and Heritage and State TravelSmart Programme Managers (www.travelsmart.gov.au); at www.travelsmart.gov.au/publications/evaluation-2005.html. TRB (2008), Multimodal Level Of Service Analysis For Urban Streets, NCHRP Report 616, Transportation Research Board (www.trb.org); at http://trb.org/news/blurb_detail.asp?id=9470; User Guide at http://onlinepubs.trb.org/onlinepubs/nchrp/nchrp_w128.pdf. TTI (2007), Urban Mobility Study and Mobility Measures, Texas Transportation Institute (http://mobility.tamu.edu/ums). U.S. Census (2007), American Community Survey, US Census Bureau (www.census.gov). H.P. van Essen, et al. (2007), Methodologies For External Cost Estimates And Internalization Scenarios: Discussion Paper For The Workshop On Internalisation On March 15, 2007, CE Delft (www.ce.nl); at www.ce.nl/4288_Inputpaper.pdf. Vermeulen, et al. (2004), The Price of Transport: Overview of the Social Costs of Transport, CE Delft (www.ce.nl); at www.ce.nl/index.php?go=home.showPublicatie&id=181.
Evaluating Non-Motorized Transport Benefits and Costs Victoria Transport Policy Institute
74
Tourism Vermont (2007), Travel and Tourism Industry in Vermont: A Benchmark Study of the Economic Impact of Visitor Expenditures on the Vermont Economy — 2007, Vermont Department of Tourism & Marketing, Vermont Partners (www.vermontpartners.org); at www.vermontpartners.org/pdf/Research_Brochure_2007.pdf. Methodology described in, IMPLAN Methodology for the Study of the Impact of Tourism on the Vermont Economy, University of Vermont (www.uvm.edu); at www.uvm.edu/~snrvtdc/publications/implan_method.pdf. VTPI (2009), Online TDM Encyclopedia, Victoria Transport Policy Institute (www.vtpi.org). Walk Friendly Communities (www.walkfriendly.org) is a national program sponsored by the U.S. Department of Transportation to encourage towns and cities to establish a high priority for supporting safer walking environments. The Resources section provides useful information for bicycle and pedestrian planning and analysis. Meghan Winters and Adam Cooper (2008), What Makes a Neighbourhood Bikeable, Cycling In Cities, University of British Columbia (www.cher.ubc.ca/cyclingincities); at www.cher.ubc.ca/cyclingincities/pdf/WhatMakesNeighbourhoodsBikeable.pdf. WHO (2008), Health Economic Assessment Tool for Cycling (HEAT for Cycling), World Health Organization Region Office Europe (www.euro.who.int); at www.euro.who.int/transport/policy/20070503_1. James Woodcock, Oscar H Franco, Nicola Orsini and Ian Roberts (2010), “Non-Vigorous Physical Activity And All-Cause Mortality: Systematic Review And Meta-Analysis Of Cohort Studies,” International Journal of Epidemiology, doi:10.1093/ije/dyq104 (http://ije.oxfordjournals.org/cgi/content/abstract/dyq104). Chung Yiu and Yim Edward (2009), Impacts of a Pedestrianisation Scheme on Retail Rent - An Empirical Study in Hong Kong, Department of Real Estate and Construction, The University of Hong Kong, Hong Kong; at http://ssrn.com/abstract=1414108. Charles Zegeer, et al. (2010), Pedestrian Safety Strategic Plan: Recommendations for Research and Product Development, Federal Highway Administration Office of Safety (http://safety.fhwa.dot.gov); at http://safety.fhwa.dot.gov/ped_bike/pssp/fhwasaxxxxx/fhwasaxxxxx.pdf. www.vtpi.org/nmt-tdm.pdf