non-motorized database system - oregon.gov
TRANSCRIPT

NON-MOTORIZED
DATABASE
SYSTEM USER
GUIDE
Modern Traffic Analytics
Non-Motorized User Guide 2
2/16/2021
Non-Motorized Database System (NMDS) Documentation
Updated: February 2021
Table of Contents Table of Contents ........................................................................................................................................................................ 2
NMDS Overview ........................................................................................................................................................................... 3
Dashboard .................................................................................................................................................................................... 4
Analysis ........................................................................................................................................................................................... 5
Quick Search and Advanced Search ................................................................................................................................. 5
Analysis: Map ............................................................................................................................................................................ 6
Analysis: Results ......................................................................................................................................................................... 8
Analysis: Details ......................................................................................................................................................................... 9
Analysis: Details- Location ................................................................................................................................................... 9
Analysis: Detail- Count ....................................................................................................................................................... 11
Analysis: Report ....................................................................................................................................................................... 14
Admin Page ................................................................................................................................................................................ 16
Admin: Upload........................................................................................................................................................................ 16
Admin: Export .......................................................................................................................................................................... 17
Admin: Import Status ............................................................................................................................................................. 18
Admin: Add Location ............................................................................................................................................................ 19
For pathways associated with a roadway .................................................................................................................... 21
For crosswalks at intersections with other pathways ................................................................................................... 22
For crosswalks at midblock (or pedestrian bridges, pedestrian underpasses) ........................................................ 23
For crosswalks at intersections with no other pathways associated ......................................................................... 23
For crosswalks at intersections with other pathways .................................................................................................... 23
QC Manager .............................................................................................................................................................................. 24
Admin: Assigning a Location to a QC Group................................................................................................................... 24
Admin: Adding a QC Group ............................................................................................................................................... 26
Admin: Updating a QC Group ............................................................................................................................................ 27
Admin: Adding a QC Rule ................................................................................................................................................... 27
Available QC Rules ............................................................................................................................................................ 28
Admin: Editing a QC Rule ..................................................................................................................................................... 30
Uploading a Count File ......................................................................................................................................................... 31
Seasonal Factors by Mode ...................................................................................................................................................... 34
Admin: Assign locations to a Seasonal Factor Group .................................................................................................... 35

Modern Traffic Analytics
Non-Motorized User Guide 3
2/16/2021
Admin: Adding a Seasonal Factor Group ........................................................................................................................ 36
Admin: Updating a Seasonal Factor Group ..................................................................................................................... 37
Admin: Generating Seasonal Factors ................................................................................................................................ 38
ESRI’s Roads and Highways® Extension ................................................................................................................................. 43
Appendix ..................................................................................................................................................................................... 47
MS2 Template ......................................................................................................................................................................... 47
Download the MS2 Template .......................................................................................................................................... 47
Edit the MS2 Template ....................................................................................................................................................... 47
Using the Two Way Total option ...................................................................................................................................... 49
Import File Types ..................................................................................................................................................................... 52
MS2 Data Template ........................................................................................................................................................... 52
MS2 Template ..................................................................................................................................................................... 52
CMU ...................................................................................................................................................................................... 52
Diamond Omega ............................................................................................................................................................... 53
EcoCounter ......................................................................................................................................................................... 53
MetroCount ......................................................................................................................................................................... 54
Miovision ............................................................................................................................................................................... 54
Sensource ............................................................................................................................................................................ 55
Trafx Datanet ....................................................................................................................................................................... 55
Trafx TXT ................................................................................................................................................................................ 56
TMC Module to NMDS Module Data Transfer ................................................................................................................... 56
Setting up NMDS ................................................................................................................................................................. 57
Example................................................................................................................................................................................ 58
Error Messages ........................................................................................................................................................................ 59
NMDS Overview The Non-Motorized Database System (NMDS) is a powerful tool for the traffic engineer or planner to organize
the agency’s non-motorized count data. It provides a dashboard level summary of the system as well as tools
to maintain, review, and report data at the path level. From bike lanes to sidewalks to bike paths to trails, the
NMDS module helps manage the data.
This guide is for users new to the NMDS system and will provide an overview of the available features and
functions used for many common tasks. Any features not discussed in this guide are considered advanced
features. If there are additional questions, feel free to explore the online help guide or contact the staff at MS2
for assistance.

Modern Traffic Analytics
Non-Motorized User Guide 4
2/16/2021
Dashboard The Dashboard page (Figure 1) provides a high level, system overview of the data and locations. There are
three main features on this page: filters, charts and map.
Figure 1: Dashboard page
The filters will allow the user to refine the level of detail on the dashboard using any or all of the following
attributes: Year, Mode, County, and Community. To see the results by community for the previous year, select:
Year, County and Community. Based on the user selection, the charts and map on the Dashboard page will be
updated to reflect the results of the filter.
The charts show general trends for usage of the system based on the year, month, and day of week. The user
can mouse over the charts to see the values. Using the Location links within the Highest ADT Locations chart, the
user can view additional details of the Location (including counts).
The map displays the locations where data stored within NMDS. The differentiation between permanent count
and short count stations is presented within the Legend to the right of the map. The information displayed in the
pop up above the selected location include: Location ID, Community, Latest Count Date and Latest Count
Total. A View Detail link takes the user to the Analysis page for more details on the station.

Modern Traffic Analytics
Non-Motorized User Guide 5
2/16/2021
Analysis The Analysis page (Figure 2) allows the user to view and report data at a detailed level. There are three areas
which will display information about a location: Results, Map, and Details. For each of these tabs, the
information is queried by two tools, Quick Search and Advanced Search. The database is a location based
system and the search tools use the station attributes to generate a query result.
Figure 2: Analysis page
Quick Search and Advanced Search
The user can perform a simple search for a single station or set of stations using the Quick Search tool. The
Advanced Search tool can be used to generate refined search results based on specific station attributes. The
Location ID field produces results for that location. To search based on geographic locations, use the County
and /or Community fields.
The Counts Available field will generate a query for locations with associated counts. The Year field can be
utilized to further refine the Counts Available field based on available counts for the year selected by the user.
When the search criteria are selected, click the Search button to generate the results for review. The Advanced
Search tool allows the user to perform a refined search based on many more attributes than the Quick Search.

Modern Traffic Analytics
Non-Motorized User Guide 6
2/16/2021
Analysis: Map
The Analysis Map page (Figure 3) operates in the same manner as the Dashboard map. The information
displayed in the pop up above the selected location include: Location ID, Community, Latest Count Date and
Latest Count Total. The View location detail link allows the user to view additional details about the location.
The map navigation tools along the left of the screen provide zooming options for the area. Sitting above the
zoom tools is a Map overlays drop down that allows the user to change the aerial view of the selected area.
The Pegman tool allows the user to view the location at the street level (when available).
Figure 3: Analysis Map
To the right side of the Map overlays are two icons that supports data searches. The first icon allows the user
to perform an address search (Figure 4), either mailing address or coordinates.
Figure 4: Address search
The second icon opens expanded search options to help with area searches. Within the
expanded search options, the first tool is a circle which confines the results to a diameter from the starting
Modern Traffic Analytics
Non-Motorized User Guide 7
2/16/2021
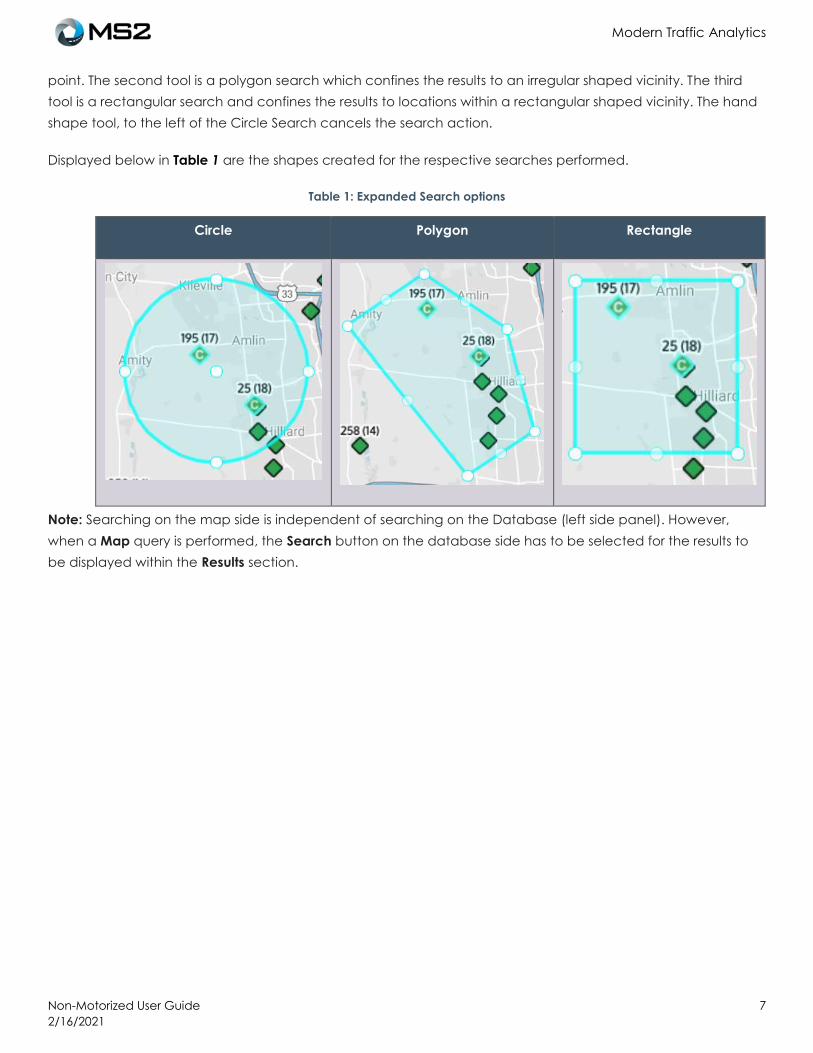
point. The second tool is a polygon search which confines the results to an irregular shaped vicinity. The third
tool is a rectangular search and confines the results to locations within a rectangular shaped vicinity. The hand
shape tool, to the left of the Circle Search cancels the search action.
Displayed below in Table 1 are the shapes created for the respective searches performed.
Table 1: Expanded Search options
Circle Polygon Rectangle
Note: Searching on the map side is independent of searching on the Database (left side panel). However,
when a Map query is performed, the Search button on the database side has to be selected for the results to
be displayed within the Results section.

Modern Traffic Analytics
Non-Motorized User Guide 8
2/16/2021
Analysis: Results
The results of a search will be displayed in a list view on the lower left portion of the screen (see Figure 5). There
are features that allow the user to sort the results in different ways. The column headings can be selected to
sort the information in ascending or descending order.
The Filter field on the top right is an additional feature to allow the user to filter for an item within the query
result. Note: This feature does not change the query results. It simply changes the view of the data on this
page.
The first column displays checkboxes which confirm the respective location(s) used in reports. These can be de-
selected or re-selected to adjust the list for reporting.
In the Location Id column, each location entry is linked to take the user to the location details within the
Analysis: Detail section.
Figure 5: Analysis - Results

Modern Traffic Analytics
Non-Motorized User Guide 9
2/16/2021
Analysis: Details
This section is the most comprehensive when reviewing data at the location level and includes two tabs:
Location and Count.
Analysis: Details- Location
The Location tab (Figure 6) shows the attributes for the location, along with summary charts. Among the
attributes are: charts for ADT, Average Hour Count, and Average Day of Week Count.
Figure 6: Analysis - Details, Location
The top right section of the tab allows the user to view the data in different ways by selecting the check boxes.
Data collected at each path for a station can be viewed using direction of the traffic as well as the paths:
sidewalk, bike path, or roadway.

Modern Traffic Analytics
Non-Motorized User Guide 10
2/16/2021
Figure 7: Path selections
The icon located on the right side of the ‘Travel Directions’ header (Figure 7) will open a pop out to display a
representation of the pathways. The database supports multiple levels of data for the station including: bike
paths or trails, sidewalks, bike lanes, roadway and crosswalk (not pictured). The paths are defined by the offset
direction to the centerline of the roadway (referred to as West Side and East Side) on the example. There are
five designated modes available: pedestrians, bicycles, wheelchair, equestrian and motorized bike. Figure 8
shows the direction of travel as North and South.
Figure 8: Pathway diagram

Modern Traffic Analytics
Non-Motorized User Guide 11
2/16/2021
Analysis: Detail- Count
The Count tab within the Analysis: Details page shows additional information for a specific count which
includes: the attributes of the count, a graph of the Hourly Count and a grid view of the data.
The Calendar View (Figure 9) or the List View (Figure 10) on the upper left portion of the Details tab allows the
user to navigate to additional counts at this location.
Figure 9: Calendar View
Figure 10: List View

Modern Traffic Analytics
Non-Motorized User Guide 12
2/16/2021
The user can use the checkboxes above the Details: Count tab (Figure 11) to view a similar breakdown of Path
level information as presented within the Details: Location tab.
If the data was collected for each path of a station, the user can view by direction of the traffic and by the
respective paths: sidewalk, bike path, or roadway.
Figure 11: Analysis - Details, Count
Additional information about the count may also be captured and
presented within the Count tab (shown to the right). Data includes
precipitation and temperature on the day of the count.
An Hourly Count graph (Figure 12) and a data grid for the counts are
presented in this tab and the user can mouse over the graph to view the
actual values. The grid shows the mode of travel on the left side and the
time interval across the top.

Modern Traffic Analytics
Non-Motorized User Guide 13
2/16/2021
Figure 12: Hourly Count chart
The Images and Notes dialog box (Figure 13) stores additional information about the location including: text,
photos and other electronic files. The stored information can either be designated as visible or invisible to an
external user.
Figure 13: Image and Notes box with Sample
Note: Each file is limited to 10MB.

Modern Traffic Analytics
Non-Motorized User Guide 14
2/16/2021
Analysis: Report
For users familiar with creating reports through MS2’s Traffic Count Database System (TCDS), the NMDS module
offers a similar Report Center to generate reports. The following process used to view a report:
1. Perform a search using the Quick Search/ Advanced Search section
2. Review the results (Figure 14) to confirm the query provided enough data for a report
Figure 14: List of search results
3. Review the checkboxes for any locations that may need to be excluded from the report
4. Select the desired report from the Name drop down within the Reports section (Figure 15)
4. Select the date range needed for the report
5. Select the Run Report button
Note: Reports are only run on the locations with checkboxes that are selected

Modern Traffic Analytics
Non-Motorized User Guide 15
2/16/2021
Figure 15: Reports section
A preview of the report is available within the report preview section and the report can be saved using available
formats shown in the drop down of the disc icon. Figure 16 provides a sample of an existing report.
Figure 16: Sample report

Modern Traffic Analytics
Non-Motorized User Guide 16
2/16/2021
Admin Page The items discussed on the Dashboard and Analysis sections are features available to the public viewer. The
functionality and additional features described in the Admin page (Figure 17) and upcoming sections are only
accessible by users at the admin level and above.
Figure 17: Admin page
Admin: Upload
The Admin: Upload page (Figure 18) manages the import count files into the NMDS module. There are multiple
buttons/ selections on this page (depending on file type) to successfully manage the file import process. Note:
Offset and Pathway includes direction and path type.
The ImportType drop down lists the file types currently supported by MS2. The user must select the appropriate file
type when uploading files.
Figure 18: Admin - Upload page
After selecting the file type, the next step is to add files using the Add files button. The Start Upload and Cancel
Upload buttons are used for starting the upload or for canceling the upload (when needed). The MS2 template can
be downloaded by selecting the hyperlink in the upper right corner of the screen.
Note: The Offset and Pathway selections determine the direction and path type used at the location for the data
import. Example, when data for EB and WB traffic is collected, an Offset of North or South should be selected. The
pathway (bike lane, bike path, sidewalk, etc.) in both the file and location should match.

Modern Traffic Analytics
Non-Motorized User Guide 17
2/16/2021
Admin: Export
The Admin: Export page (Figure 19) allows the user to create a file for data submission to the FHWA. Confirm the
Export Type (Station or Count) and Month before selecting the Submit button.
Figure 19: Admin - Export page
A notification will be displayed (see Figure 20) after the request is submitted alerting the user of a pending
email link to access the file.
Figure 20: FHWA Export submission notification
The email, as displayed below, will provide some preliminary information about the request. It will include: a
Station or Count total, Critical columns of data for review, a link to a file that passed validation checks and a
link to a file that contains all Stations or Counts.

Modern Traffic Analytics
Non-Motorized User Guide 18
2/16/2021
Admin: Import Status
During the file upload process, the Admin: Import Status page (Figure 21) shows the condition of the count files
during the import process. The column headings on the grid can be selected to sort the information in
ascending or descending order. Additional information about the file is provided in the ‘QC Status’ column
when a user hovers over the results of the upload. The Search box on the top right (above the Import Status
fields) is an additional feature that allows the user to refine the results presented. After the files are uploaded,
the Location Id will display as a hyperlink to navigate to the Analysis: Detail/Count tab.
Figure 21: Admin - Import Status page
During the file import process, the application will run through the following steps:
1. The name of the file and file type are checked after selection from storage.
2. When the file is imported into the system additional items are checked in the file, including:
a. Does the location exist?
b. Is the direction provided, and does it match the location?
c. Is the date valid?
The import status shows the condition during the first two steps listed above
3. The data is processed through the QC engine. The data is checked against QC rules and the QC status is
shown during this step.

Modern Traffic Analytics
Non-Motorized User Guide 19
2/16/2021
Admin: Add Location
Locations need to be in the system before counts can be imported to them. Locations are added using the
Admin: Add Location section (Figure 22). Enter the required fields marked with * as well as additional fields that
would benefit the agency’s ability to track details of the location.
The QC Group selection should be done (if known), so that the QC rules can be applied when files are
imported for the location. Within this memo, there is guidance on pathway selection when adding a new
location in NMDS. The following is a screen shot of the Admin: Add Location page showing the Road
Associated radial selected.
Figure 22: Admin - Add Location page

Modern Traffic Analytics
Non-Motorized User Guide 20
2/16/2021
When the No Road Associated radial is selected (Figure 23 & Figure 24), the Selected Pathway options are
modified. Functional Class options will also be limited to Trail or Shared Use Path or General Activity Count.
Figure 23: No Road Associated selection
Figure 24: Pathway diagram with No Road Associated

Modern Traffic Analytics
Non-Motorized User Guide 21
2/16/2021
For pathways associated with a roadway
1. Complete the information on the left side.
(Note the minimum required fields are marked with a red asterisk.)
2. Select the non-motorized mode of traffic flow in the Travel Direction drop down.
(Note the icon, Figure 25. When selected, a pop-up will show the relationship of offsets and direction.
The offset is in relation to the roadway. For example, a NS travel direction and road associated, with have
an east offset (side) and west offset (side) for the pathways as shown below. The pop-up will be different if
the No Road Associated radial is selected)
3. Select the Road Associated radial.
(This is for a location with pathways associated with a road as shown in the pop-up)
4. Select each of the pathways associated with the location.
Figure 25: Pathway diagram

Modern Traffic Analytics
Non-Motorized User Guide 22
2/16/2021
For crosswalks at intersections with other pathways
1. Complete the information on the left side.
(Note the minimum required fields are marked with a red asterisk.)
2. Select the Intersection check box.
(This indicates that the pathway is associated with an intersection and the other selected pathways)
3. Select the non-motorized mode’s traffic flow in the Travel Direction drop down.
4. Select the Road Associated radial. This is for a location with pathways associated with a road as shown in the
pop-up.
(Note the icon. When selected, a pop-up will show the relationship offsets and direction.
The offset is in relation to the roadway. For example, a NS traffic direction and road associated, with have an
east offset and west offset for the pathways. The pop-up will be different if No Road Associated radial is
selected)
5. Using the check boxes, select each of the pathways associated with the location. A selection is available
for each pathway based on the side of the road (or offset).
6. Select the Crosswalk check box for a crosswalk pathway.
Note: the icon next to the Crosswalk check box. The diagram shows which crosswalk will be associated
with the other pathways at the intersection.
For this crosswalk, the physical location related to the intersection is the right side crosswalk at the approach.
For example, at the northbound approach to the intersection, the data is collected for the crosswalk on the
westbound approach. This will allow for consistency in viewing the data within the interface on the Analysis:
Detail page.

Modern Traffic Analytics
Non-Motorized User Guide 23
2/16/2021
For crosswalks at midblock (or pedestrian bridges, pedestrian underpasses)
1. Complete the information on the left side.
(Note the minimum required fields are marked with a red asterisk. The Intersection check box should not be
selected if you are only going to show the crosswalk at the location)
2. Select the non-motorized mode of traffic flow in the Travel Direction drop down. This is not the vehicle flow on
the road, but the non-motorized traffic flow within the crosswalk.
3. Select the Road Associated radial button.
4. Select ONLY the Crosswalk check box for these type of pathways and do not select Intersection.
For crosswalks at intersections with no other pathways associated
(Same as above, For crosswalks at midblock)
For crosswalks at intersections with other pathways
1. Complete the information on the left side.
(Note the minimum required fields are marked with a red asterisk.)
2. Select the Intersection check box.
(This indicates that the pathway is associated with an intersection and the other selected pathways)
3. Select the non-motorized mode’s traffic flow in the Travel Direction drop down.
4. Select the Road Associated radial. This is for a location with pathways associated with a road as shown in the
pop-up.
(Note the icon. When selected, a pop-up will show the relationship offsets and direction.
The offset is in relation to the roadway. For example, a NS traffic direction and road associated, with have
an east offset and west offset for the pathways. The pop-up will be different if No Road Associated radial is
selected)
5. Using the check boxes, select each of the pathways associated with the location. A selection is available
for each pathway based on the side of the road (or offset).
6. Select the Crosswalk check box for a crosswalk pathway.
(Note the icon next to the Crosswalk check box. The diagram shows which crosswalk will be associated
with the other pathways at the intersection.)

Modern Traffic Analytics
Non-Motorized User Guide 24
2/16/2021
QC Manager
Admin: Assigning a Location to a QC Group
A QC Group can be assigned to a location using three options: within the Admin tab during an Add Location
operation, within the Analysis tab during an edit operation or within the QC Group Manager. To complete a
location assignment using the Admin tab, follow the directions within the Admin: Add Location section.
To complete the QC Group association for a location within the Detail: Location tab, use the following steps:
1. Perform a location search
2. Select the Edit Info button at the bottom of the Analysis: Details/ Location tab
3. When the new window opens (Figure 26), scroll to find the QC Group field
4. Select the desired QC Group for the location. ‘Default Group’ is tagged to all new locations or locations
that have not been assigned to a QC Group.
5. Select the Save Location button.
Note: A location cannot be assigned to more than one QC group within the same year.
Figure 26: View when Edit Info is selected

Modern Traffic Analytics
Non-Motorized User Guide 25
2/16/2021
To add a location via the QC Group Manager (Figure 27), perform the following functions:
1. Select the View button of the QC Group to be added
2. Start typing the location ID which will open a list of potential locations
3. Select the Location and click the Add Location button
4. The Location will then be added to the list
Figure 27: QC Group Manager, Add Location

Modern Traffic Analytics
Non-Motorized User Guide 26
2/16/2021
Admin: Adding a QC Group
QC checks are created to validate imported data and are implemented through the Admin page. The first step
in setting up a QC Group is to select the Add New Group button (Figure 28) in the upper left of the QC Manager
tab. Enter the Group Name and Group Description (for tracking purposes), then click Save.
Figure 28: Add QC Group window
When a new QC Group is added, locations can be assigned through the QC Manager tab (Figure 29), Admin:
Add Location page or the Analysis: Details page (as described earlier).
Figure 29: Add Location entry

Modern Traffic Analytics
Non-Motorized User Guide 27
2/16/2021
Admin: Updating a QC Group
To update a QC Group Name or Group Description (Figure 30), review the QC Group Manager and click the
Update button of the group that needs to be changed. Make the necessary adjustment(s) and select the Save
button to complete the update.
Figure 30: View when editing QC Group
Admin: Adding a QC Rule
To add a QC Rule, first select a group name from the QC Group Manager to activate the Add Rule button
(Figure 31). The Group Name will be displayed within the Selected Group Editor field. Select the Add Rule button
and choose an option from the drop down menu.
Figure 31: Add Rule button

Modern Traffic Analytics
Non-Motorized User Guide 28
2/16/2021
Select one of the QC rules (Figure 32) to apply to the group.
Figure 32: QC Rule selection
After selecting the rule to add, a default parameter may be displayed (Figure 33).
Figure 33: Parameters and Filter options
Confirm the parameter(s) for the desired rule and apply any filters before clicking the Save button.
Available QC Rules
Number of Zeros Allowed – This rule checks for the maximum number of zeros allowed within a daily count. It
is based on 24 intervals in a day and will flag when value is greater than the set parameter.
Parameter: MaxZeros (1 to 23)
Compared to Previous Volume – This rule compares the imported volume with the most recent value for the
% change. The parameter is the % change and will flag if the value is greater than the set parameter.
Parameter: Percentage Change (0 to 100%)
Minimum Daily Volume – This rule compares the imported volume for the daily total against the set
parameter. The parameter is the minimum allowable volume and will flag if value is less than the set
parameter. Parameter: Minimum Daily Volume (Greater than 0)

Modern Traffic Analytics
Non-Motorized User Guide 29
2/16/2021
Maximum Daily Volume – The rule compares the imported volume for the daily total against the parameter.
The parameter is the maximum allowable volume and will flag if the value is greater than the set
parameter. Parameter: Maximum Daily Volume
Maximum Hourly Volume – The rule compares the hourly volumes imported against the parameter. The
parameter is the maximum hourly volume allowed and will flag is above the set parameter. Parameter:
Maximum Hourly Volume
DOW Check – This rule checks the daily total of the imported count with the most recent DOW average at
that location. The parameter is a Maximum and Minimum percentage difference allowed from the DOW
daily total and flags outside of the range. If no recent DOW is found, it will not be flagged. Parameter:
Percentage Change (0 to 100%)
Consecutive Zero’s – This rule checks the number of consecutive time intervals with the value of zero. The
parameter is the maximum allowed and will flag if above set parameter. Parameter: Consecutive Zeros (1
to 23)
Identical Consecutive Hours – This rule checks the number of identical, consecutive hourly intervals that
have the same value. The parameter is the maximum allowed and will flag if above the set parameter. This
check does not would apply to values equal to zero. Parameter: Consecutive Hours
3 AM vs 3PM – This rule checks if a count has volume that is higher in the 3AM hour than the 3PM hour. The
parameter is if the 3 AM volume is greater than the 3 PM volume, the count would be flagged.
Adjacent Hour with a Zero Count – This rule compares the imported volume value with the interval that is
adjacent to an interval with a volume=0. The parameter is the maximum value allowed for the volume
adjacent to the interval with the zero volume. It will flag if the volume is greater than the set parameter.
Parameter: Volume
90 Day Moving Average – This rule compares the imported daily volume with the previous 90 days. This
check would only be applied to locations marked as permanent sites (PERM=Yes). The parameter is ratio
between the imported count and the previous 90 days. Parameter: Ratio
The diagram below (Figure 34) illustrates one of the rules that was set up to check the Maximum Daily
Volume. The parameter of 1700 indicates the maximum value of daily traffic that would be valid for this
Pathway type: Trail. Any counts above that value will be flagged for further review.
Additional parameters can be added to a rule and multiple rules can be applied to a QC Group.
Figure 34: Sample QC Rule with parameters

Modern Traffic Analytics
Non-Motorized User Guide 30
2/16/2021
Admin: Editing a QC Rule To edit (or delete) a QC Rule, first select a group name from the QC Group Manager to activate the group to
be edited or deleted. The Group Name will be displayed within the Selected Group Editor field.
Figure 35: QC Rule edit view
A new window (Figure 35) will open to review and complete the edited fields as needed, then select the
Save button. The parameters or filters will be updated based on changes made within the editor.
When deleting a QC Group, select the Delete button (Figure 36) of the rule to be removed.
Figure 36: Rule delete option
A delete notification (Figure 37) will be presented for confirmation, after which the rule will be removed.
Figure 37: QC Rule delete notification

Modern Traffic Analytics
Non-Motorized User Guide 31
2/16/2021
Uploading a Count File 1. Go to Admin: Upload page on the NMDS site.
2. Select MS2 Template from the Import Type drop down (Figure 38).
Figure 38: Admin - Import Type selection
3. Select button Add Files and navigate to the files on your computer (Figure 39) that need to be imported.
Figure 39: File Explorer window
4. Select button Start upload (Figure 40). Within moments, the user will be directed to the Analysis: Import
Status page. An email notification will be sent to confirm the results of the upload. If files fail the upload
process, review the name of the file or format (.xls, .xlsx, or .csv). Any file that fails should be removed from
the Upload page, modified as necessary, and reloaded. Note: the upload process is simply putting the file
in a holding area to be imported.
Figure 40: Start Upload button

Modern Traffic Analytics
Non-Motorized User Guide 32
2/16/2021
5. On the Admin: Import Status page (Figure 41), review the status of the files as they are imported and
processed. The page will refresh automatically every few moments. The file will show a status of Pending
during processing. Once the file is processed, the status will change to Successful or Failed for each file.
Figure 41: File Import Status
For the file import process to be success, the
following must be true:
• The station must exist in the system and must match the import file
• The direction of traffic must match the defined location in the system
• The data of the count must be valid
The file is also reviewed to confirm the template format has not been changed by the user.
6. On the same page (Admin: Import Status), review the status of the files that have completed the QC
process (Figure 42). This is the last step in the import process. An email is sent to indicate the success or
failure of the import.
Figure 42: Import Status queue
7. To review, accept, or reject the count after the quality control process, navigate to the Detail: Count tab by
selecting the station’s hyperlink in the Admin: Import Status page.
8. On the Analysis: Detail Count tab, the count can be further processed depending on the QC status.
• For counts that pass QC, the user can review the data, then delete or accept the count
• For counts that fail QC, the user can review the data, then delete or reject the count (if necessary)

Modern Traffic Analytics
Non-Motorized User Guide 33
2/16/2021
Figure 43: Hourly Count chart
The buttons for this workflow are found within below the Hourly Count chart (Figure 43) within the Analysis: Detail
Count tab.
Figure 44: QC Log
The QC Log (Figure 44) will display any error details of the count after it is imported into the system. For users
needing to identify why the count was not accepted into the system, this portal will provide information about it
in a table format.

Modern Traffic Analytics
Non-Motorized User Guide 34
2/16/2021
Seasonal Factors by Mode A seasonal factor tool is available with NMDS to create an annualized average daily traffic volume (AADT)
similar to the process within the TCDS module. A seasonal factor and AADT can be generated by each mode
available within the system for a location.
Figure 45: Seasonal Factor Manager
The Seasonal Mode page is split into two screens: Seasonal Factor Group Manager (left) and Seasonal Factor
Manager (right—Figure 45).
On the left side, the SF Group Manager displays the Groups that have been created for the agency. On the
right side, the SF Manager displays the seasonal factors applied to the selected location.
The steps listed below are used to process Seasonal Factors:
1. Assign locations to SF Groups
2. Locate SF Groups to process
3. Review Perm stations to verify good data
4. Process SF values for the group(s)

Modern Traffic Analytics
Non-Motorized User Guide 35
2/16/2021
Admin: Assign locations to a Seasonal Factor Group
A SF Group can be assigned to a location using three options: within the Admin tab during an Add Location
operation, within the Analysis tab during an edit operation or within the SF Group Manager. To complete a
location assignment using the Admin tab, follow the directions within the Admin: Add Location section.
To complete the SF Group association for a location within the Detail: Location tab, first perform a search to
identify a location. Select the Edit Info button to open a new window (Figure 46).
Figure 46: View inside Edit Info button
Scroll to the bottom left to view the associated Seasonal Factors field. If the group assigned is [None] --Default,
use the Select SF Groups button to the right and this will open another screen (Figure 47). This will allow for
selection of the year and SF group. Click the Save button to return to the main menu, then select the Save
Location button to complete the update process.
Figure 47: Seasonal Factor Group selection

Modern Traffic Analytics
Non-Motorized User Guide 36
2/16/2021
Admin: Adding a Seasonal Factor Group
A new SF Group is added using the following directions:
1. Select the Add New Group button under the Admin: Seasonal Mode page (Figure 48)
2. A new window (Figure 49) will open to record the Group Name, Group Description and Group Year
3. Click the Save button
Figure 48: Seasonal Mode page
Figure 49: Seasonal Manager Group editor

Modern Traffic Analytics
Non-Motorized User Guide 37
2/16/2021
Admin: Updating a Seasonal Factor Group
Updating a SF Group is managed through the Seasonal Factor Group Manager tab of the Admin
page. Use the following steps to complete the update:
1. Identify the group to be updated and select the Update button
2. A new window (Figure 50) will open to make adjustments to Group Name, Group Description or
Group Year
3. Click the Save button to confirm the update
Figure 50: View inside SF Group edit window

Modern Traffic Analytics
Non-Motorized User Guide 38
2/16/2021
Admin: Generating Seasonal Factors
There are two ways to create seasonal factors (SF) by mode for a SF group. A user can simply enter values into
the grid shown below or generate values using MS2’s Factor Clustering tool (Figure 51) accessed with button
just below the grid.
Figure 51: Factor Clustering results

Modern Traffic Analytics
Non-Motorized User Guide 39
2/16/2021
Seasonal Mode values can be entered manually by selecting the Edit button (Figure 52) at the bottom of the
Seasonal Factor Manager grid.
Figure 52: Factor Clustering Edit button
Use the navigation arrows within each cell or hand enter the values (Figure 53).
Figure 53: Factor Clustering tool display

Modern Traffic Analytics
Non-Motorized User Guide 40
2/16/2021
After adjusting the values, click the Update button to save the configuration. The AADT will be generated over
night for the short count locations within the SF Group.
The second option for creating SF values is the Seasonal Mode Factor Clustering tool (Figure 54). Selecting the
Factor Clustering button of the Seasonal Factor Manager tool will open a new screen (see below). The user will
select from the following: Year, Factor Group, and mode for which these factors need to be generated.
Figure 54: Seasonal Mode processing screen
Once selected, the Progress bar will show the transition as the data is prepared. The screen will be populated
with data points for review.
These factors are generated using data from permanent/continuous count stations. Outliers can skew the
data, so it is best to review the graphs during the preparation phase before completing the process.
During the review (Figure 55), outliers should be removed or the acceptance criteria should be adjusted using
the control selectors. The Outlier Removal control is defaulted based on the recommended Standard
Deviation. Based on the number of locations and volume of reported data, there may be additional outliers
displayed. Removing the outliers will help to normalize the short count locations. The Validation Removal
controls are additional features available to set the minimum requirements for accepting data. Current
settings include Days of Week required for a valid month and number of months required for a valid station.
Current defaults of the system accepts all data.

Modern Traffic Analytics
Non-Motorized User Guide 41
2/16/2021
Figure 55: Factor Clustering tool in progress
The AADT will be generated overnight for the short count locations within the SF Group. A short count station is
defined by the attribute -- Perm Station: No.
The results of the process are displayed in Figure 56 below.

Modern Traffic Analytics
Non-Motorized User Guide 42
2/16/2021
Figure 56: Factor Clustering results
If a previous year is available, the values are available for comparison and a line for manual over writing any
values. The user then selects the Submit button and the values will be populated in the Seasonal Factor
Manager grid. The AADT will be generated over night for the short count locations within the SF Group. A short
count station is defined by the attribute, Perm Station: No.

Modern Traffic Analytics
Non-Motorized User Guide 43
2/16/2021
ESRI’s Roads and Highways® Extension An additional feature within the module is the integration of the ESRI’s Roads and Highways® (R&H) extension.
This would only be available to agencies using the integrated applications. When creating new locations or
editing existing locations, attributes can be pulled from the agency’s Roads & Highways® software to use in
MS2’s NMDS module. The following steps will demonstrate the use of the R&H integration:
1. Perform a search using either the Quick Search, Advanced Search or Map tab within the Analysis
page (Figure 57)
2. Select the Edit Location button within the Location tab of the Analysis: Details section.
3. A new window (Figure 58) will open to review the location details
Figure 57: Analysis page
Figure 58: Analysis – Details interface

Modern Traffic Analytics
Non-Motorized User Guide 44
2/16/2021
4. Select the Map button to open the location view (Figure 59)
Figure 59: NMDS Location on map

Modern Traffic Analytics
Non-Motorized User Guide 45
2/16/2021
5. Click and drag the existing (green) icon (in Figure 60) to the new desired location.
6. The new coordinates (Figure 61) will be displayed below the map for verification. This shows the
attributes that are being pulled from the agency’s Roads and Highways.
Figure 60: Current location marker
Figure 61: New Location marker

Modern Traffic Analytics
Non-Motorized User Guide 46
2/16/2021
7. Save the changes to update the location details (Figure 62)
8. Review the updated attributes, then click the Save Location button to complete the update.
Figure 62: View of updated Location information

Modern Traffic Analytics
Non-Motorized User Guide 47
2/16/2021
Appendix
MS2 Template
The following provides guidance for using
the MS2 Import Template.
Download the MS2 Template
1. Go to Admin: Upload page.
2. Select the MS2 Excel Template from the
Import Type drop down menu (Figure 63).
3. A link for the template will display: click
Download MS2 Import Template to open it.
Edit the MS2 Template 1. Save the file as “stationid_xxx” where xxx
contains user choice of text. It is
recommended to use text that would be
informative to the user.
2. Open the file and select Enable Editing to
begin entering the information.
3. Complete the following information in the
header: Count Date, Station ID (Figure 64).
4. Set the direction of the road as displayed in
Figure 65 (the import process will check this
against the station information).
5. Select the paths that apply to the station
and offset sides of the road (Figure 66).
• If this is a stand-alone bike path: the only
thing that should be selected would be the
bike path and E-side or W-side.
6. Select the hours for which the data was
collected.
• If 6-hr count: select six hours that the data
was collected using check boxes.
Figure 63: Import Type drop down
Figure 64: Location details section
Figure 65: Road Direction menu
Figure 66: Pathway selection headers

Modern Traffic Analytics
Non-Motorized User Guide 48
2/16/2021
• If 24-hr count: select all 24 hours.
Note: for a 6-hr count, the user should not
select all hours and leave zeros in those hours.
This would imply that a count was taken and
the value is zero.
7. Using the drop-down menu, select the
mode at the top each column.
8. Scroll down the sheet to find the relevant
pathway selection (roadway, sidewalk, or
bike path) to enter the counts. The data
from these sections will update the
cumulative pathway sections at the top of
the page.
9. Enter the data into the appropriate blue cells (Figure 67). If copying from another file, be sure to use
the paste option: Values Only.
10. Save the file as “stationid_xxx” where xxx is decided by the user (if not completed).
Figure 67: Data entry for counts by Pathway selection

Modern Traffic Analytics
Non-Motorized User Guide 49
2/16/2021
Using the Two Way Total option
A 2-Way Total Only functionality (Figure 68) was added to facilitate the storage and display of data which is
representative of travel along both offset directions. When this option is selected, the number of columns
displayed for data entry will adjust as shown in Figure 69 and Figure 70.
Figure 69: Pathway view without 2-Way selection
When the 2-Way Total Only option is selected, at least one Blue column will be displayed based on the offset
direction(s) selected within the template.
The additional column(s) will be grayed out indicating there is no longer a requirement to report data for the
subsequent offset(s) columns.
Figure 68: 2-Way Totals toggle

Modern Traffic Analytics
Non-Motorized User Guide 50
2/16/2021
Figure 70: Pathway view with 2-Way selection
The Hourly Count chart (Figure 71) will also show how the data is displayed using the 2-Way Total option which
looks at all counts within the file.
Figure 71: Hourly Count interface

Modern Traffic Analytics
Non-Motorized User Guide 51
2/16/2021
Based on the change in Travel Direction selection, the 2-Way Total counts will be removed from display. The
reason is because 2-Way Total is based on data representing both directions as shown in Figure 72 below.
Figure 72: Hourly Count without 2-Way Total

Modern Traffic Analytics
Non-Motorized User Guide 52
2/16/2021
Import File Types MS2 Data Template
Figure 73: File Import view - MS2 Data Template
The MS2 Data Template (Figure 73) files are stores as XML (,xml) or ZIP (.zip files and is available as a download
within the Admin: Upload tab. It will be visible when the MS2 Template is selected from the ImportType drop
down. When this template is used, no additional fields are needed before selecting the Start Upload button.
MS2 Template
Figure 74: File Import view - MS2 Template
The MS2 Template (Figure 74) files are stores as Excel (,xls) files and is available as a download within the Admin:
Upload tab. It will be visible when the MS2 Template is selected from the ImportType drop down. When using
this template, all Blue fields within the file must be completed. When this template is used, no additional fields
will need to be entered before selecting the Start Upload button.
CMU Figure 75: File Import view – CMU Template
The CMU Template (Figure 75) files are stored as comma-separated values (.csv). Uploading CMU files will
require completion of additional fields including: Offset and Pathway. The upload process, Start upload, will not
be accessible until the additional fields are complete and must be done for each file import. Station id is
defined within the file and must match a location within the NMDS module.
Modern Traffic Analytics
Non-Motorized User Guide 53
2/16/2021
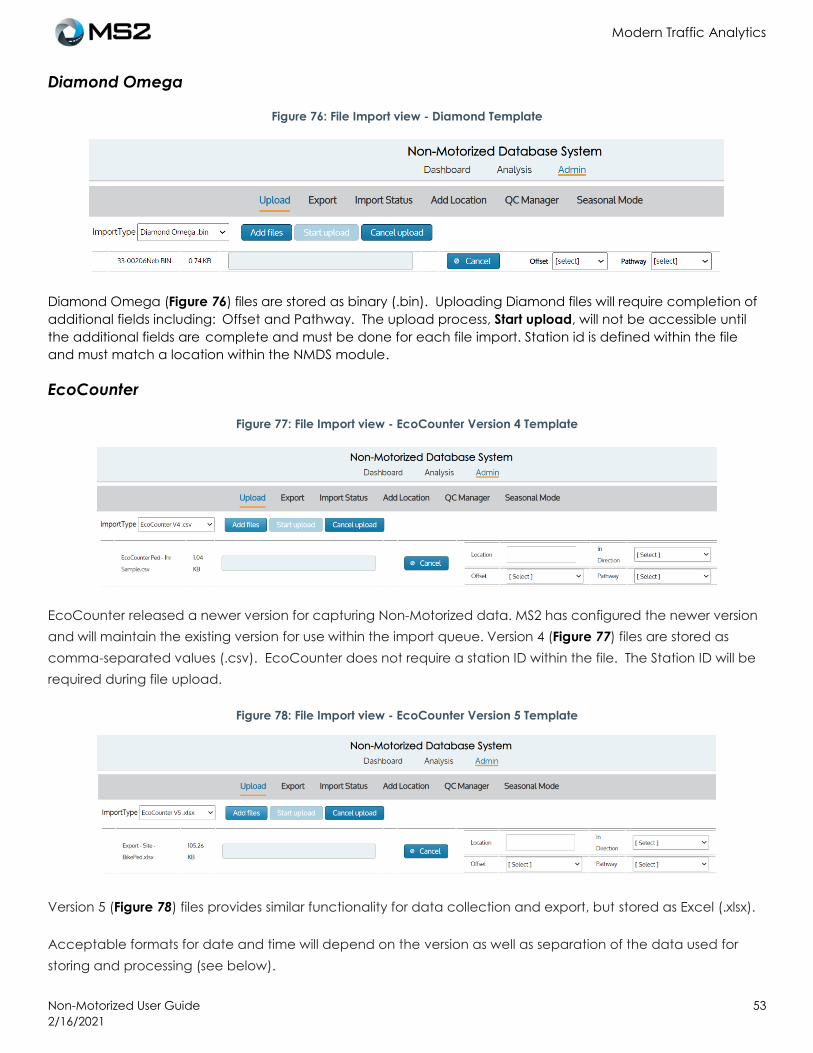
Diamond Omega
Figure 76: File Import view - Diamond Template
Diamond Omega (Figure 76) files are stored as binary (.bin). Uploading Diamond files will require completion of
additional fields including: Offset and Pathway. The upload process, Start upload, will not be accessible until
the additional fields are complete and must be done for each file import. Station id is defined within the file
and must match a location within the NMDS module.
EcoCounter
Figure 77: File Import view - EcoCounter Version 4 Template
EcoCounter released a newer version for capturing Non-Motorized data. MS2 has configured the newer version
and will maintain the existing version for use within the import queue. Version 4 (Figure 77) files are stored as
comma-separated values (.csv). EcoCounter does not require a station ID within the file. The Station ID will be
required during file upload.
Figure 78: File Import view - EcoCounter Version 5 Template
Version 5 (Figure 78) files provides similar functionality for data collection and export, but stored as Excel (.xlsx).
Acceptable formats for date and time will depend on the version as well as separation of the data used for
storing and processing (see below).

Modern Traffic Analytics
Non-Motorized User Guide 54
2/16/2021
Two columns: “MM/DD/YYYY,HH:MM”, “YYYY/MM/DD,HH:MM” - Version 4
One column (Date): “DD/MM/YYYY” - Version 4
One column (Date): “YYMMDD” - Version 5
Uploading EcoCounter files will require completion of additional fields including: Location, In Direction, Offset
and Pathway. The upload process, Start upload, will not be accessible until the additional fields are complete
and must be done for each file import.
Location, Offset, and Pathway are explained previously. For In Direction, the NMDS module reads within the EcoCounter
files at the column with IN to establish the traffic flow of the mode. For example, the column header says Ped In. After
the Location is entered, the user selects the direction that “In” represents for the traffic flow. For example, if a
counter is setup with IN counting the northbound direction, the user would select north for the In Direction
drop down.
MetroCount
Figure 79: Import File view - MetroCount
MetroCount (Figure 79) files are stored as data (.dat), but can also be supported using text (.txt). Uploading
MetroCount files will require completion of additional fields including: Offset and Pathway. The upload process,
Start upload, will not be accessible until the additional fields are complete and must be done for each file
import. Station id is defined within the file and must match a location within the NMDS module.
Miovision Figure 80: File Import view - Miovision Template
Miovision (Figure 80) files are stored as comma-separated values (.csv). Uploading Miovision files will require the
completion of additional fields including: Offset and Pathway. The upload process, Start upload, will not be
accessible until the additional fields are complete and must be done for each file import. Station id is defined
within the file and must match a location within the NMDS module.

Modern Traffic Analytics
Non-Motorized User Guide 55
2/16/2021
Importing from Miovision
1. Download the “Intersection Count CSV Full” from the Miovision software
2. Visit the NMDS module before going to the Admin page
3. Click on the ‘ImportType’ drop down meu and select Miovision CSV
4. Click the ‘Add files’ button, browse to the .csv files that were saved and import them
5. Click the ‘Start upload’ button to begin the import process
6. The import status page will display the progress of the files
Note: Miovision multiple day import files are now supported by the software.
Sensource Figure 81: File Import view - Sensource Template
Sensource (Figure 81) files are stored as text (.csv). Uploading Sensource files will require completion of
additional fields including: Location (station ID, Direction, Offset and Pathway. Sensource does not
require a station ID within the file. However, it must be included when preparing the file(s) for import.
The Start upload button, will not be accessible until the additional fields are complete and must be
done for each file import.
Trafx Datanet Figure 82: File Import view - Trafx Datanet Template
Trafx DataNet (Figure 82) files are stored as text (.csv). Uploading Trafx Datanet files will require
completion of additional fields including: Location ID, Direction, Offset and Pathway. Similar to a couple of
the other formats, the Station ID is not contained in the file and must be added during the file upload
process to ensure data is posted to the correct station. The Start upload button will not be accessible until
the additional fields (mentioned above) are complete and must be done for each import. Station ID is
identified within the file and must match a location within the NMDS module.

Modern Traffic Analytics
Non-Motorized User Guide 56
2/16/2021
Trafx TXT Figure 83: File Import view - Trafx Txt Template
Trafx (Figure 83) files are stored as text (.txt). Uploading Trafx files will require completion of additional fields
including: Offset and Pathway. The upload process, Start upload, will not be accessible until the additional
fields are complete and must be done for each file import. Station id is defined within the file and must match
a location within the NMDS module. Trafx files can be per vehicle or binned formats.
TMC Module to NMDS Module Data Transfer
An additional component of the TMC application allows data to be transferred to the Non-Motorized
Database System (NMDS) application. The key benefit of this tool is push bike and pedestrian data collected
with a turning movement to the NMDS module.
In managing this process, the agency will need both modules. Within each module, there is a setup process to
ensure the data will be correctly transferred and stored. Note: this is an overnight process which will retrieve
available data and fill the gaps within NMDS.

Modern Traffic Analytics
Non-Motorized User Guide 57
2/16/2021
Setting up NMDS
Use the following steps to review and confirm
NMDS is prepared for the data transfer:
1. Log into the NMDS module.
2. Perform a search for the location to which
data will be transferred.
3. Select the Edit Location button within the
Analysis Detail page (Figure 84).
4. Confirm there are locations for each of the
respective approaches and they are
designated with the correct path types with
intersection selected.
5. If any of the approaches are missing, it will
need to be created.
Figure 84: NMDS module - Edit Location view

Modern Traffic Analytics
Non-Motorized User Guide 58
2/16/2021
Example
The following example uses station 1572 from TMC and 33-0999N from NMDS. The four approaches were setup
in NMDS as follows:
NB Approach
EB Approach
SB Approach

Modern Traffic Analytics
Non-Motorized User Guide 59
2/16/2021
WB Approach
Notice in the above images the Selected Pathways vary by direction but must include at least one valid
pathway (Bike Lane, Bike Path, Roadway and Sidewalk). The name of the NDMS location must include the
underscore direction, i.e., _NB. The other key categories include the Crosswalk and the Intersection (Road
Associated) checkboxes.
Error Messages
Below is a list of errors that may be displayed to a user when importing data:
Invalid Location – The location is not currently in the database
Invalid Import: file is to import for pathways Crosswalk, Trail, Unspecified which don’t exist at the given location –
The file contains checked boxes for fields which has no data
There is either duplicate data in the file or a count already exists for this date – The file may contain duplicate
counts for a day or may already be stored in the system
The offset and pathway selected at the File Upload does not match offset and pathway defined at location –
Review the Offset and Pathway as listed in the file and compare with the station information within the Details:
Location tab