european union, trade in goods with...
TRANSCRIPT
European Commission
Directorate-Generalfor Trade
16-04-2018 1 Units A4 / G2
European Union, Trade in goods with Pakistan
Table of Contentspg
European Union, Trade with Pakistan
- Key Figures 2
- Imports / Exports 2017 2
- - AMA/NAMA product Groups 2
- - SITC product Groups 2
- - Top 5 - HS sections 2
- - Top 5 - SITC sections 2
- EU Trade flows and balance: Total goods: 2007 - 2017 3
- EU Trade flows by SITC section 2017 4
- EU Trade flows by SITC product grouping 2017 4
- EU Trade flows by SITC section 2014 - 2017 5
- EU Trade flows by SITC product grouping 2014 - 2017 5
- EU Trade flows by HS section 2017 6
- EU Trade flows by HS section 2014 - 2017 7
Pakistan, Trade with World
- Pakistan Trade flows and balance: Total goods: 2007 - 2017 8
- Pakistan Top trading partners: Total goods: 2017 8
- Pakistan Trade with partner regions: Total goods: 2017 8
European Union, Trade with World
- EU Trade flows and balance: Total goods: 2007 - 2017 9
- EU Top trading partners: Total goods: 2017 9
- EU Top product sections: Total goods: 2017 9
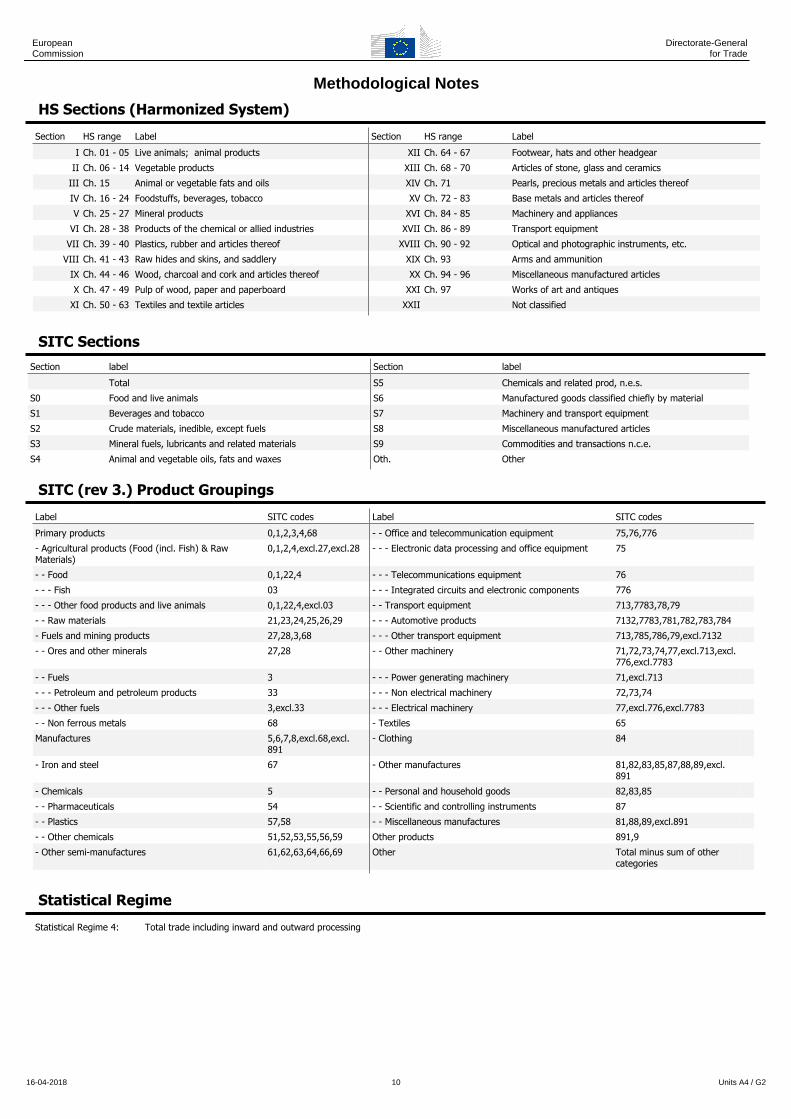
Methodological Notes
- HS Sections (Harmonized System) 10
- SITC Sections 10
- SITC (rev 3.) Product Groupings 10
Important note:Unless otherwise mentioned all figures for "EU" concern the European Union of 28 members for all indicated years.

European Commission
Directorate-Generalfor Trade
16-04-2018 2 Units A4 / G2
European Union, Trade with Pakistan
Key Figures
Indicator Unit Period Imports Exports Total trade Balance
Last year Mio euros 2017 6,689 6,149 12,838 -540
Rank as EU partner 2017 42 39 42
Share in EU trade % 2017 0.4 0.3 0.3
Annual growth rate % 2016 - 2017 6.2 15.1
Annual average growth rate % 2013 - 2017 10.2 12.5
Imports 2017 Exports 2017
AMA/NAMA product Groups
Product Value Mio € % Total Product Value Mio € % Total
Agricultural products (WTO AoA) 356 5.3 Agricultural products (WTO AoA) 345 5.6
Fishery products 5 0.1 Fishery products 0 0.0
Industrial products 6,328 94.6 Industrial products 5,805 94.4
Total 6,689 100.0 Total 6,149 100.0
SITC product Groups
Product Value Mio € % Total Product Value Mio € % Total
Primary products 408 6.1 Primary products 1,843 30.0
Manufactures 6,269 93.7 Manufactures 4,069 66.2
Other products 9 0.1 Other products 121 2.0
Other 3 0.1 Other 115 1.9
Top 5 - HS sections
Product Value Mio € % Total Product Value Mio € % Total
XI Textiles and textile articles 5,257 78.6 XVI Machinery and appliances 1,769 28.8
VIII Raw hides and skins, and saddlery 430 6.4 VI Products of the chemical or allied industries 911 14.8
II Vegetable products 203 3.0 V Mineral products 764 12.4
XX Miscellaneous manufactured articles 177 2.7 XV Base metals and articles thereof 711 11.6
XVIII Optical and photographic instruments, etc. 112 1.7 XVII Transport equipment 336 5.5
Top 5 - SITC sections
Product Value Mio € % Total Product Value Mio € % Total
8 Miscellaneous manufactured articles 3,419 51.1 7 Machinery and transport equipment 2,123 34.5
6 Manufactured goods classified chiefly by material
2,699 40.4 5 Chemicals and related prod, n.e.s. 1,039 16.9
0 Food and live animals 234 3.5 3 Mineral fuels, lubricants and related materials 756 12.3
2 Crude materials, inedible, except fuels 158 2.4 2 Crude materials, inedible, except fuels 744 12.1
5 Chemicals and related prod, n.e.s. 109 1.6 6 Manufactured goods classified chiefly by material
508 8.3
% Total: Share in Total: Total defined as all products

European Commission
Directorate-Generalfor Trade
16-04-2018 3 Units A4 / G2
European Union, Trade with Pakistan
Total goods: EU Trade flows and balance, annual data 2007 - 2017 Source Eurostat Comext - Statistical regime 4
Total goods: EU Trade flows and balance Source Eurostat Comext - Statistical regime 4
Period Imports Exports Balance Total trade
Value Mio € % Growth % Extra-EU Value Mio € % Growth % Extra-EU Value Mio € Value Mio €
2007 3,474 0.2 3,763 0.3 289 7,237
2008 3,651 5.1 0.2 3,899 3.6 0.3 248 7,549
2009 3,349 -8.3 0.3 3,604 -7.6 0.3 256 6,953
2010 3,879 15.9 0.3 3,731 3.5 0.3 -149 7,610
2011 4,672 20.4 0.3 3,757 0.7 0.2 -916 8,429
2012 4,138 -11.4 0.2 4,116 9.6 0.2 -21 8,254
2013 4,538 9.7 0.3 3,839 -6.7 0.2 -699 8,377
2014 5,514 21.5 0.3 4,094 6.6 0.2 -1,420 9,607
2015 6,088 10.4 0.4 4,435 8.3 0.2 -1,653 10,524
2016 6,298 3.4 0.4 5,343 20.5 0.3 -955 11,641
2017 6,689 6.2 0.4 6,149 15.1 0.3 -540 12,838
% Growth: relative variation between current and previous period
% Extra-EU: imports/exports as % of all EU partners i.e. excluding trade between EU Member States

European Commission
Directorate-Generalfor Trade
16-04-2018 4 Units A4 / G2
European Union, Trade with Pakistan
Trade flows by SITC section 2017 Source Eurostat Comext - Statistical regime 4
Imports Exports
Value Mio € % Total % Extra-EU % Growth Value Mio € % Total % Extra-EU % Growth
Total 6,689 100.0 0.4 6.2 6,149 100.0 0.3 15.1
0 Food and live animals 234 3.5 0.2 -0.8 265 4.3 0.3 6.7
1 Beverages and tobacco 2 0.0 0.0 -46.3 7 0.1 0.0 -3.7
2 Crude materials, inedible, except fuels 158 2.4 0.2 33.0 744 12.1 1.7 16.9
3 Mineral fuels, lubricants and related materials 0 0.0 0.0 -46.3 756 12.3 0.8 291.6
4 Animal and vegetable oils, fats and waxes 0 0.0 0.0 2.4 14 0.2 0.3 9.4
5 Chemicals and related prod, n.e.s. 109 1.6 0.1 11.9 1,039 16.9 0.3 0.7
6 Manufactured goods classified chiefly by material 2,699 40.4 1.4 6.2 508 8.3 0.3 2.2
7 Machinery and transport equipment 56 0.8 0.0 -12.5 2,123 34.5 0.3 -2.3
8 Miscellaneous manufactured articles 3,419 51.1 1.2 6.3 479 7.8 0.2 45.2
9 Commodities and transactions n.c.e. 8 0.1 0.0 -30.2 99 1.6 0.2 2.3
Other 3 0.1 n.a. n.a. 115 1.9 n.a. n.a.
Trade flows by SITC product grouping 2017 Source Eurostat Comext - Statistical regime 4
Imports Exports
SITC Rev. 3 Product Groups Value Mio € % Total % Extra-EU % Growth Value Mio € % Total % Extra-EU % Growth
Total 6,689 100.0 0.4 6.2 6,149 100.0 0.3 15.1
Primary products 408 6.1 0.1 9.9 1,843 30.0 0.6 58.8
- Agricultural products (Food (incl. Fish) & Raw Materials) 305 4.6 0.2 -0.1 565 9.2 0.4 5.2
- - Food 239 3.6 0.2 -2.0 299 4.9 0.2 -2.7
- - - of which Fish 5 0.1 0.0 9.5 0 0.0 0.0 -38.3
- - Raw materials 66 1.0 0.3 7.8 266 4.3 1.1 15.8
- Fuels and mining products 103 1.6 0.0 55.9 1,278 20.8 0.9 104.9
- - Ores and other minerals 89 1.3 0.3 65.7 465 7.6 2.6 26.3
- - Fuels 0 0.0 0.0 -46.3 756 12.3 0.8 291.6
- - - of which Petroleum and petroleum products 0 0.0 0.0 -55.0 734 11.9 0.8 311.6
- - Non ferrous metals 14 0.2 0.0 13.4 58 0.9 0.2 -8.1
Manufactures 6,269 93.7 0.5 6.1 4,069 66.2 0.3 2.6
- Iron and steel 2 0.0 0.0 -31.2 124 2.0 0.4 16.9
- Chemicals 109 1.6 0.1 11.9 1,039 16.9 0.3 0.7
- - of which Pharmaceuticals 1 0.0 0.0 133.9 354 5.8 0.2 -8.2
- Other semi-manufactures 163 2.4 0.2 3.0 294 4.8 0.2 1.8
- Machinery and transport equipment 56 0.8 0.0 -12.5 2,123 34.5 0.3 -2.3
- - Office and telecommunication equipment 5 0.1 0.0 -33.3 207 3.4 0.3 49.1
- - - Electronic data processing and office equipment 1 0.0 0.0 -6.1 60 1.0 0.3 34.8
- - - Telecommunications equipment 4 0.1 0.0 -38.3 133 2.2 0.4 65.3
- - - Integrated circuits and electronic components 0 0.0 0.0 77.1 13 0.2 0.1 -1.0
- - Transport equipment 15 0.2 0.0 -39.0 376 6.1 0.1 8.1
- - - of which Automotive products 8 0.1 0.0 28.4 95 1.6 0.1 -7.0
- - Other machinery 37 0.6 0.0 11.3 1,534 25.0 0.4 -8.6
- - - Power generating machinery 22 0.3 0.1 27.9 376 6.1 0.6 -20.5
- - - Non electrical machinery 9 0.1 0.0 -18.4 946 15.4 0.4 -6.5
- - - Electrical machinery 6 0.1 0.0 23.5 212 3.4 0.2 9.4
- Textiles 2,521 37.7 9.2 6.4 32 0.5 0.2 19.3
- Clothing 2,998 44.8 3.4 7.3 10 0.2 0.0 12.9
- Other manufactures 420 6.3 0.2 -0.3 446 7.3 0.2 40.6
- - of which Scientific and controlling instruments 108 1.6 0.3 1.3 254 4.1 0.4 46.3
Other products 9 0.1 0.0 -27.7 121 2.0 0.2 22.5
Other 3 0.1 n.a. n.a. 115 1.9 n.a. n.a.
% Growth: relative variation between current and previous period
% Total: Share in Total: Total defined as all products
% Extra-EU: imports/exports as % of all EU partners i.e. excluding trade between EU Member States

European Commission
Directorate-Generalfor Trade
16-04-2018 5 Units A4 / G2
European Union, Trade with PakistanTrade flows by SITC section 2014 - 2017 Source Eurostat Comext - Statistical regime 4
Imports Exports
Value Mio € Value Mio €
2014 2015 2016 2017 2014 2015 2016 2017
Total 5,514 6,088 6,298 6,689 4,094 4,435 5,343 6,149
0 Food and live animals 317 271 236 234 180 224 248 265
1 Beverages and tobacco 5 4 5 2 7 7 7 7
2 Crude materials, inedible, except fuels 183 154 119 158 601 551 636 744
3 Mineral fuels, lubricants and related materials 50 0 0 0 72 128 193 756
4 Animal and vegetable oils, fats and waxes 0 0 0 0 9 11 13 14
5 Chemicals and related prod, n.e.s. 114 73 97 109 846 950 1,032 1,039
6 Manufactured goods classified chiefly by material 2,210 2,423 2,543 2,699 444 452 497 508
7 Machinery and transport equipment 75 62 64 56 1,417 1,625 2,173 2,123
8 Miscellaneous manufactured articles 2,541 3,065 3,215 3,419 331 308 330 479
9 Commodities and transactions n.c.e. 14 14 12 8 57 71 97 99
Other 3 22 8 3 131 108 116 115
Trade flows by SITC product grouping 2014 - 2017 Source Eurostat Comext - Statistical regime 4
Imports Exports
Value Mio € Value Mio €
SITC Rev. 3 Product Groups 2014 2015 2016 2017 2014 2015 2016 2017
Total 5,514 6,088 6,298 6,689 4,094 4,435 5,343 6,149
Primary products 567 432 371 408 949 1,006 1,161 1,843
- Agricultural products (Food (incl. Fish) & Raw Materials) 414 354 305 305 514 456 537 565
- - Food 328 282 244 239 299 246 308 299
- - - of which Fish 3 4 5 5 0 0 0 0
- - Raw materials 86 71 61 66 215 210 230 266
- Fuels and mining products 154 79 66 103 435 550 624 1,278
- - Ores and other minerals 92 76 54 89 282 337 368 465
- - Fuels 50 0 0 0 72 128 193 756
- - - of which Petroleum and petroleum products 50 0 0 0 57 31 178 734
- - Non ferrous metals 11 3 12 14 81 85 63 58
Manufactures 4,929 5,620 5,907 6,269 2,955 3,248 3,967 4,069
- Iron and steel 5 3 2 2 127 96 106 124
- Chemicals 114 73 97 109 846 950 1,032 1,039
- - of which Pharmaceuticals 1 1 1 1 328 354 385 354
- Other semi-manufactures 167 169 158 163 213 242 289 294
- Machinery and transport equipment 75 62 64 56 1,417 1,625 2,173 2,123
- - Office and telecommunication equipment 13 13 7 5 181 154 139 207
- - - Electronic data processing and office equipment 1 1 1 1 36 44 45 60
- - - Telecommunications equipment 11 12 6 4 138 103 81 133
- - - Integrated circuits and electronic components 0 0 0 0 7 8 13 13
- - Transport equipment 17 13 24 15 254 197 348 376
- - - of which Automotive products 6 6 6 8 61 74 102 95
- - Other machinery 45 36 33 37 981 1,267 1,678 1,534
- - - Power generating machinery 34 15 17 22 229 342 473 376
- - - Non electrical machinery 5 14 11 9 638 775 1,012 946
- - - Electrical machinery 7 8 5 6 115 150 194 212
- Textiles 2,027 2,248 2,370 2,521 22 28 26 32
- Clothing 2,155 2,635 2,793 2,998 6 8 9 10
- Other manufactures 386 429 422 420 323 298 317 446
- - of which Scientific and controlling instruments 94 109 107 108 174 157 173 254
Other products 15 14 12 9 59 73 99 121
Other 3 22 8 3 131 108 116 115
European Commission
Directorate-Generalfor Trade
16-04-2018 6 Units A4 / G2
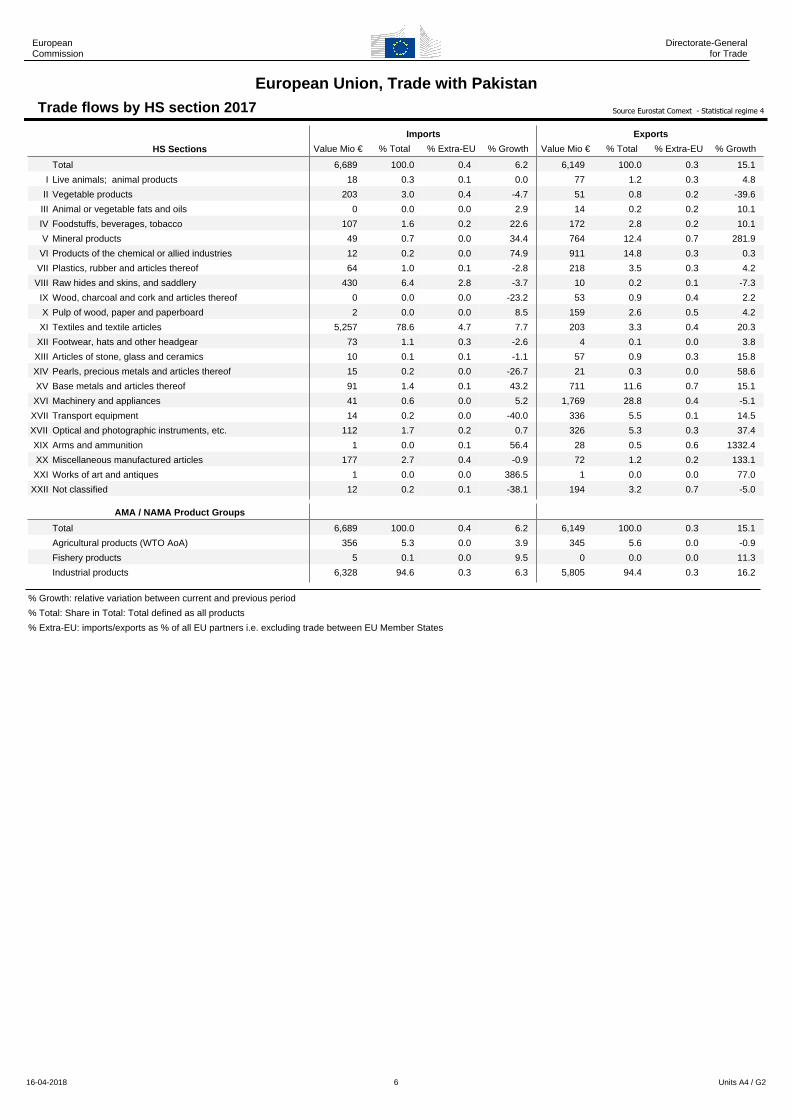
European Union, Trade with PakistanTrade flows by HS section 2017 Source Eurostat Comext - Statistical regime 4
Imports Exports
HS Sections Value Mio € % Total % Extra-EU % Growth Value Mio € % Total % Extra-EU % Growth
Total 6,689 100.0 0.4 6.2 6,149 100.0 0.3 15.1
I Live animals; animal products 18 0.3 0.1 0.0 77 1.2 0.3 4.8
II Vegetable products 203 3.0 0.4 -4.7 51 0.8 0.2 -39.6
III Animal or vegetable fats and oils 0 0.0 0.0 2.9 14 0.2 0.2 10.1
IV Foodstuffs, beverages, tobacco 107 1.6 0.2 22.6 172 2.8 0.2 10.1
V Mineral products 49 0.7 0.0 34.4 764 12.4 0.7 281.9
VI Products of the chemical or allied industries 12 0.2 0.0 74.9 911 14.8 0.3 0.3
VII Plastics, rubber and articles thereof 64 1.0 0.1 -2.8 218 3.5 0.3 4.2
VIII Raw hides and skins, and saddlery 430 6.4 2.8 -3.7 10 0.2 0.1 -7.3
IX Wood, charcoal and cork and articles thereof 0 0.0 0.0 -23.2 53 0.9 0.4 2.2
X Pulp of wood, paper and paperboard 2 0.0 0.0 8.5 159 2.6 0.5 4.2
XI Textiles and textile articles 5,257 78.6 4.7 7.7 203 3.3 0.4 20.3
XII Footwear, hats and other headgear 73 1.1 0.3 -2.6 4 0.1 0.0 3.8
XIII Articles of stone, glass and ceramics 10 0.1 0.1 -1.1 57 0.9 0.3 15.8
XIV Pearls, precious metals and articles thereof 15 0.2 0.0 -26.7 21 0.3 0.0 58.6
XV Base metals and articles thereof 91 1.4 0.1 43.2 711 11.6 0.7 15.1
XVI Machinery and appliances 41 0.6 0.0 5.2 1,769 28.8 0.4 -5.1
XVII Transport equipment 14 0.2 0.0 -40.0 336 5.5 0.1 14.5
XVIII Optical and photographic instruments, etc. 112 1.7 0.2 0.7 326 5.3 0.3 37.4
XIX Arms and ammunition 1 0.0 0.1 56.4 28 0.5 0.6 1332.4
XX Miscellaneous manufactured articles 177 2.7 0.4 -0.9 72 1.2 0.2 133.1
XXI Works of art and antiques 1 0.0 0.0 386.5 1 0.0 0.0 77.0
XXII Not classified 12 0.2 0.1 -38.1 194 3.2 0.7 -5.0
AMA / NAMA Product Groups
Total 6,689 100.0 0.4 6.2 6,149 100.0 0.3 15.1
Agricultural products (WTO AoA) 356 5.3 0.0 3.9 345 5.6 0.0 -0.9
Fishery products 5 0.1 0.0 9.5 0 0.0 0.0 11.3
Industrial products 6,328 94.6 0.3 6.3 5,805 94.4 0.3 16.2
% Growth: relative variation between current and previous period
% Total: Share in Total: Total defined as all products
% Extra-EU: imports/exports as % of all EU partners i.e. excluding trade between EU Member States

European Commission
Directorate-Generalfor Trade
16-04-2018 7 Units A4 / G2
European Union, Trade with PakistanTrade flows by HS section 2014 - 2017 Source Eurostat Comext - Statistical regime 4
Imports Exports
HS Sections Value Mio € Value Mio €
2014 2015 2016 2017 2014 2015 2016 2017
Total 5,514 6,088 6,298 6,689 4,094 4,435 5,343 6,149
I Live animals; animal products 31 23 18 18 61 85 73 77
II Vegetable products 304 259 213 203 137 33 85 51
III Animal or vegetable fats and oils 0 0 0 0 9 11 13 14
IV Foodstuffs, beverages, tobacco 85 53 88 107 106 139 157 172
V Mineral products 92 35 36 49 78 134 200 764
VI Products of the chemical or allied industries 5 9 7 12 770 848 908 911
VII Plastics, rubber and articles thereof 82 68 65 64 139 170 209 218
VIII Raw hides and skins, and saddlery 460 471 447 430 9 10 10 10
IX Wood, charcoal and cork and articles thereof 1 1 1 0 43 39 51 53
X Pulp of wood, paper and paperboard 2 3 2 2 121 138 152 159
XI Textiles and textile articles 3,900 4,585 4,880 5,257 158 165 168 203
XII Footwear, hats and other headgear 76 81 75 73 2 3 4 4
XIII Articles of stone, glass and ceramics 7 8 10 10 42 44 49 57
XIV Pearls, precious metals and articles thereof 24 30 21 15 19 21 13 21
XV Base metals and articles thereof 92 75 63 91 531 568 617 711
XVI Machinery and appliances 55 48 39 41 1,239 1,470 1,864 1,769
XVII Transport equipment 17 12 23 14 213 149 293 336
XVIII Optical and photographic instruments, etc. 99 114 111 112 206 211 237 326
XIX Arms and ammunition 0 1 0 1 2 3 2 28
XX Miscellaneous manufactured articles 164 176 179 177 32 31 31 72
XXI Works of art and antiques 1 0 0 1 0 0 0 1
XXII Not classified 17 36 19 12 176 162 204 194
AMA / NAMA Product Groups 2014 2015 2016 2017 2014 2015 2016 2017
Total 5,514 6,088 6,298 6,689 4,094 4,435 5,343 6,149
Agricultural products (WTO AoA) 451 362 343 356 328 285 348 345
Fishery products 3 4 5 5 0 0 0 0
Industrial products 5,059 5,722 5,950 6,328 3,766 4,151 4,995 5,805
European Commission
Directorate-Generalfor Trade
16-04-2018 8 Units A4 / G2
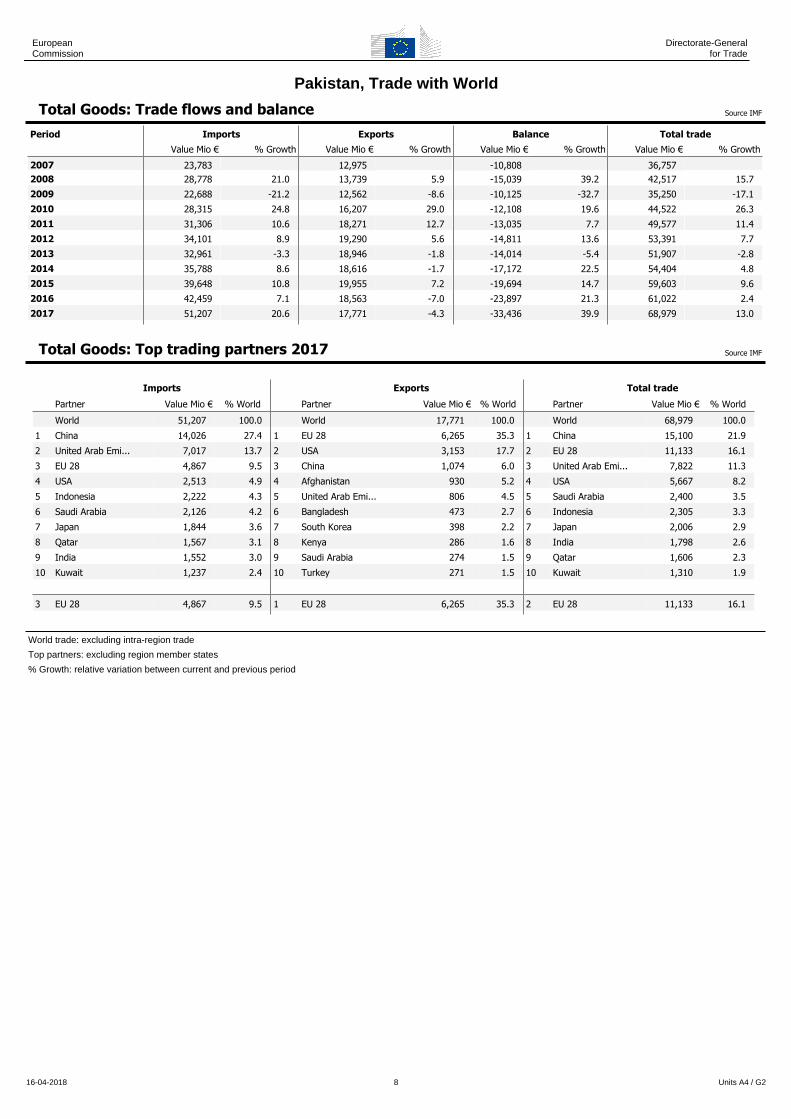
Pakistan, Trade with World
Total Goods: Trade flows and balance Source IMF
Period Imports Exports Balance Total trade
Value Mio € % Growth Value Mio € % Growth Value Mio € % Growth Value Mio € % Growth
2007 23,783 12,975 -10,808 36,757 2008 28,778 21.0 13,739 5.9 -15,039 39.2 42,517 15.7
2009 22,688 -21.2 12,562 -8.6 -10,125 -32.7 35,250 -17.1
2010 28,315 24.8 16,207 29.0 -12,108 19.6 44,522 26.3
2011 31,306 10.6 18,271 12.7 -13,035 7.7 49,577 11.4
2012 34,101 8.9 19,290 5.6 -14,811 13.6 53,391 7.7
2013 32,961 -3.3 18,946 -1.8 -14,014 -5.4 51,907 -2.8
2014 35,788 8.6 18,616 -1.7 -17,172 22.5 54,404 4.8
2015 39,648 10.8 19,955 7.2 -19,694 14.7 59,603 9.6
2016 42,459 7.1 18,563 -7.0 -23,897 21.3 61,022 2.4
2017 51,207 20.6 17,771 -4.3 -33,436 39.9 68,979 13.0
Total Goods: Top trading partners 2017 Source IMF
Imports Exports Total trade
Partner Value Mio € % World Partner Value Mio € % World Partner Value Mio € % World
World 51,207 100.0 World 17,771 100.0 World 68,979 100.0
1 China 14,026 27.4 1 EU 28 6,265 35.3 1 China 15,100 21.9
2 United Arab Emi... 7,017 13.7 2 USA 3,153 17.7 2 EU 28 11,133 16.1
3 EU 28 4,867 9.5 3 China 1,074 6.0 3 United Arab Emi... 7,822 11.3
4 USA 2,513 4.9 4 Afghanistan 930 5.2 4 USA 5,667 8.2
5 Indonesia 2,222 4.3 5 United Arab Emi... 806 4.5 5 Saudi Arabia 2,400 3.5
6 Saudi Arabia 2,126 4.2 6 Bangladesh 473 2.7 6 Indonesia 2,305 3.3
7 Japan 1,844 3.6 7 South Korea 398 2.2 7 Japan 2,006 2.9
8 Qatar 1,567 3.1 8 Kenya 286 1.6 8 India 1,798 2.6
9 India 1,552 3.0 9 Saudi Arabia 274 1.5 9 Qatar 1,606 2.3
10 Kuwait 1,237 2.4 10 Turkey 271 1.5 10 Kuwait 1,310 1.9
--- --- ---
3 EU 28 4,867 9.5 1 EU 28 6,265 35.3 2 EU 28 11,133 16.1
World trade: excluding intra-region trade
Top partners: excluding region member states
% Growth: relative variation between current and previous period
European Commission
Directorate-Generalfor Trade
16-04-2018 9 Units A4 / G2
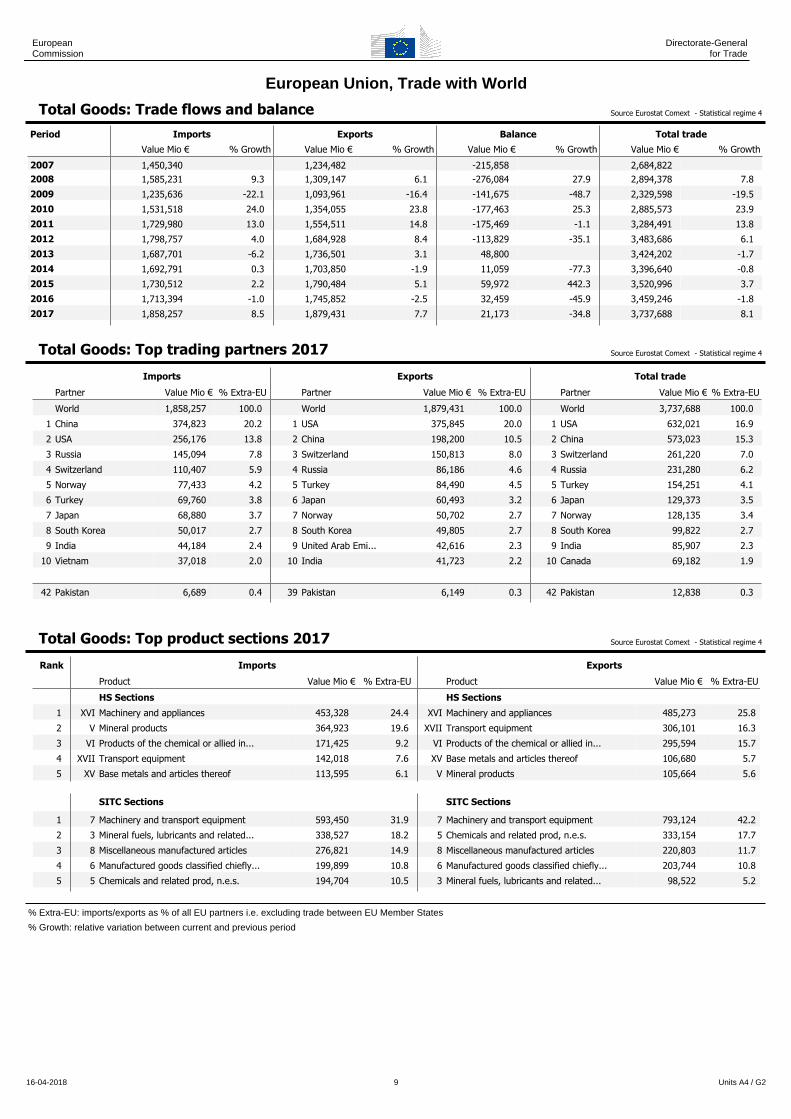
European Union, Trade with World
Total Goods: Trade flows and balance Source Eurostat Comext - Statistical regime 4
Period Imports Exports Balance Total trade
Value Mio € % Growth Value Mio € % Growth Value Mio € % Growth Value Mio € % Growth
2007 1,450,340 1,234,482 -215,858 2,684,822 2008 1,585,231 9.3 1,309,147 6.1 -276,084 27.9 2,894,378 7.8
2009 1,235,636 -22.1 1,093,961 -16.4 -141,675 -48.7 2,329,598 -19.5
2010 1,531,518 24.0 1,354,055 23.8 -177,463 25.3 2,885,573 23.9
2011 1,729,980 13.0 1,554,511 14.8 -175,469 -1.1 3,284,491 13.8
2012 1,798,757 4.0 1,684,928 8.4 -113,829 -35.1 3,483,686 6.1
2013 1,687,701 -6.2 1,736,501 3.1 48,800 3,424,202 -1.7
2014 1,692,791 0.3 1,703,850 -1.9 11,059 -77.3 3,396,640 -0.8
2015 1,730,512 2.2 1,790,484 5.1 59,972 442.3 3,520,996 3.7
2016 1,713,394 -1.0 1,745,852 -2.5 32,459 -45.9 3,459,246 -1.8
2017 1,858,257 8.5 1,879,431 7.7 21,173 -34.8 3,737,688 8.1
Total Goods: Top trading partners 2017 Source Eurostat Comext - Statistical regime 4
Imports Exports Total trade
Partner Value Mio € % Extra-EU Partner Value Mio € % Extra-EU Partner Value Mio € % Extra-EU
World 1,858,257 100.0 World 1,879,431 100.0 World 3,737,688 100.0
1 China 374,823 20.2 1 USA 375,845 20.0 1 USA 632,021 16.9
2 USA 256,176 13.8 2 China 198,200 10.5 2 China 573,023 15.3
3 Russia 145,094 7.8 3 Switzerland 150,813 8.0 3 Switzerland 261,220 7.0
4 Switzerland 110,407 5.9 4 Russia 86,186 4.6 4 Russia 231,280 6.2
5 Norway 77,433 4.2 5 Turkey 84,490 4.5 5 Turkey 154,251 4.1
6 Turkey 69,760 3.8 6 Japan 60,493 3.2 6 Japan 129,373 3.5
7 Japan 68,880 3.7 7 Norway 50,702 2.7 7 Norway 128,135 3.4
8 South Korea 50,017 2.7 8 South Korea 49,805 2.7 8 South Korea 99,822 2.7
9 India 44,184 2.4 9 United Arab Emi... 42,616 2.3 9 India 85,907 2.3
10 Vietnam 37,018 2.0 10 India 41,723 2.2 10 Canada 69,182 1.9
--- --- ---
42 Pakistan 6,689 0.4 39 Pakistan 6,149 0.3 42 Pakistan 12,838 0.3
Total Goods: Top product sections 2017 Source Eurostat Comext - Statistical regime 4
Rank Imports Exports
Product Value Mio € % Extra-EU Product Value Mio € % Extra-EU
HS Sections HS Sections
1 XVI Machinery and appliances 453,328 24.4 XVI Machinery and appliances 485,273 25.8
2 V Mineral products 364,923 19.6 XVII Transport equipment 306,101 16.3
3 VI Products of the chemical or allied in... 171,425 9.2 VI Products of the chemical or allied in... 295,594 15.7
4 XVII Transport equipment 142,018 7.6 XV Base metals and articles thereof 106,680 5.7
5 XV Base metals and articles thereof 113,595 6.1 V Mineral products 105,664 5.6
SITC Sections SITC Sections
1 7 Machinery and transport equipment 593,450 31.9 7 Machinery and transport equipment 793,124 42.2
2 3 Mineral fuels, lubricants and related... 338,527 18.2 5 Chemicals and related prod, n.e.s. 333,154 17.7
3 8 Miscellaneous manufactured articles 276,821 14.9 8 Miscellaneous manufactured articles 220,803 11.7
4 6 Manufactured goods classified chiefly... 199,899 10.8 6 Manufactured goods classified chiefly... 203,744 10.8
5 5 Chemicals and related prod, n.e.s. 194,704 10.5 3 Mineral fuels, lubricants and related... 98,522 5.2
% Extra-EU: imports/exports as % of all EU partners i.e. excluding trade between EU Member States
% Growth: relative variation between current and previous period
European Commission
Directorate-Generalfor Trade
16-04-2018 10 Units A4 / G2
Methodological Notes
HS Sections (Harmonized System)
Section HS range Label Section HS range Label
I Ch. 01 - 05 Live animals; animal products XII Ch. 64 - 67 Footwear, hats and other headgear
II Ch. 06 - 14 Vegetable products XIII Ch. 68 - 70 Articles of stone, glass and ceramics
III Ch. 15 Animal or vegetable fats and oils XIV Ch. 71 Pearls, precious metals and articles thereof
IV Ch. 16 - 24 Foodstuffs, beverages, tobacco XV Ch. 72 - 83 Base metals and articles thereof
V Ch. 25 - 27 Mineral products XVI Ch. 84 - 85 Machinery and appliances
VI Ch. 28 - 38 Products of the chemical or allied industries XVII Ch. 86 - 89 Transport equipment
VII Ch. 39 - 40 Plastics, rubber and articles thereof XVIII Ch. 90 - 92 Optical and photographic instruments, etc.
VIII Ch. 41 - 43 Raw hides and skins, and saddlery XIX Ch. 93 Arms and ammunition
IX Ch. 44 - 46 Wood, charcoal and cork and articles thereof XX Ch. 94 - 96 Miscellaneous manufactured articles
X Ch. 47 - 49 Pulp of wood, paper and paperboard XXI Ch. 97 Works of art and antiques
XI Ch. 50 - 63 Textiles and textile articles XXII Not classified
SITC SectionsSection label Section label
Total S5 Chemicals and related prod, n.e.s.
S0 Food and live animals S6 Manufactured goods classified chiefly by material
S1 Beverages and tobacco S7 Machinery and transport equipment
S2 Crude materials, inedible, except fuels S8 Miscellaneous manufactured articles
S3 Mineral fuels, lubricants and related materials S9 Commodities and transactions n.c.e.
S4 Animal and vegetable oils, fats and waxes Oth. Other
SITC (rev 3.) Product Groupings
Label SITC codes Label SITC codes
Primary products 0,1,2,3,4,68 - - Office and telecommunication equipment 75,76,776
- Agricultural products (Food (incl. Fish) & Raw Materials)
0,1,2,4,excl.27,excl.28 - - - Electronic data processing and office equipment 75
- - Food 0,1,22,4 - - - Telecommunications equipment 76
- - - Fish 03 - - - Integrated circuits and electronic components 776
- - - Other food products and live animals 0,1,22,4,excl.03 - - Transport equipment 713,7783,78,79
- - Raw materials 21,23,24,25,26,29 - - - Automotive products 7132,7783,781,782,783,784
- Fuels and mining products 27,28,3,68 - - - Other transport equipment 713,785,786,79,excl.7132
- - Ores and other minerals 27,28 - - Other machinery 71,72,73,74,77,excl.713,excl.776,excl.7783
- - Fuels 3 - - - Power generating machinery 71,excl.713
- - - Petroleum and petroleum products 33 - - - Non electrical machinery 72,73,74
- - - Other fuels 3,excl.33 - - - Electrical machinery 77,excl.776,excl.7783
- - Non ferrous metals 68 - Textiles 65
Manufactures 5,6,7,8,excl.68,excl.891
- Clothing 84
- Iron and steel 67 - Other manufactures 81,82,83,85,87,88,89,excl.891
- Chemicals 5 - - Personal and household goods 82,83,85
- - Pharmaceuticals 54 - - Scientific and controlling instruments 87
- - Plastics 57,58 - - Miscellaneous manufactures 81,88,89,excl.891
- - Other chemicals 51,52,53,55,56,59 Other products 891,9
- Other semi-manufactures 61,62,63,64,66,69 Other Total minus sum of other categories
Statistical Regime
Statistical Regime 4: Total trade including inward and outward processing