dg trade statistical - europatrade.ec.europa.eu/doclib/docs/2013/may/tradoc_151348.pdf · european...
TRANSCRIPT

DG TradeStatistical GuideJune 2017
Trade

EUROPEAN COMMISSION
DG TradeChief Economist and Trade Analysis Statistics Sector
E-mail: [email protected]

EUROPEAN COMMISSION
2017 Directorate‑General Trade
DG TradeStatistical GuideJune 2017

EUROPE DIRECT is a service to help you find answers to your questions about the European Union.
Freephone number (*):
00 800 6 7 8 9 10 11
(*) The information given is free, as are most calls (though some operators, phone boxes or hotels may charge you).
LEGAL NOTICE
Neither the European Commission nor any person acting on behalf of the Commission is responsible for the use which might be made of the following information.
The views expressed in this publication are the sole responsibility of the author and do not necessarily reflect the views of the European Commission.
More information on the European Union is available on the Internet (http://europa.eu).
Luxembourg: Publications Office of the European Union, 2016
Print ISBN 978‑92‑79‑68451‑7 ISSN 1977‑7949 DOI 10.2781/14107
PDF ISBN 978‑92‑79‑68452‑4 ISSN 1977‑7957 DOI 10.2781/229117
© European Union, 2017
Reproduction is authorised provided the source is acknowledged.
Printed in Luxembourg
PRINTED ON ELEMENTAL CHLORINE‑FREE BLEACHED PAPER (ECF)

IntroductionThis Trade Statistical Guide contains selected tables and graphs that outline the current state of and recent developments in the European Union’s (EU’s) foreign trade, i.e. its trade with the rest of the world. It has been compiled for the benefit of the Directorate‑General for Trade’s (DG Trade’s) policymakers..
Statistics on trade in goods, trade in services and foreign direct investment are key elements in any description of the trade performance of the EU with the rest of the world. These are published by the statistical office of the EU (Eurostat) and by international organisations such as the World Bank, the International Monetary Fund (IMF), the United Nations (UN) and the World Trade Organization (WTO). The most recently available statistics have been included but databases are updated daily and small discrepancies are inevitable. The statistics are presented in the form of tables and graphs, broken down by the main trading partners, product category and year. Additional supportive statistics such as gross domestic product (GDP), exchange rates and trade by Member State have also been added.
Further information about this booklet, its contents and the methodology used can be obtained from DG Trade’s Statistics desk (trade‑[email protected]).
Brussels, June 2017

Table of ContentsGlossary � � � � � � � � � � � � � � � � � � � � � � � � � � � � � � � � � � � � � � � � � � � � � � � � � � � � � � � � � � � � � � � � � � � � � � � � � � � � � � � � � � � � � � � � � � � � � � � � � � � � � � � � � � � � � � � � � � � � � � 7
SECTION 1 - WORLD TRADE � � � � � � � � � � � � � � � � � � � � � � � � � � � � � � � � � � � � � � � � � � � � � � � � � � � � � � � � � � � � � � � � � � � � � � � � � � � � 11
Global exports of goods (billion EUR) . . . . . . . . . . . . . . . . . . . . . . . . . . . . . . . . . . . . . . . . . . . . . . . . . . . . . . . . . . . . . . . . . . . . . . . . . . . . . . . . . . . . . . . . . . . . . . . . . . . . . . . . . . . . . . . . . . . . . . . . . . . . . . 12Global imports of goods (billion EUR) . . . . . . . . . . . . . . . . . . . . . . . . . . . . . . . . . . . . . . . . . . . . . . . . . . . . . . . . . . . . . . . . . . . . . . . . . . . . . . . . . . . . . . . . . . . . . . . . . . . . . . . . . . . . . . . . . . . . . . . . . . . . . . 13Global exports of services (billion EUR) . . . . . . . . . . . . . . . . . . . . . . . . . . . . . . . . . . . . . . . . . . . . . . . . . . . . . . . . . . . . . . . . . . . . . . . . . . . . . . . . . . . . . . . . . . . . . . . . . . . . . . . . . . . . . . . . . . . . . . . . . . . . . 14Global imports of services (billion EUR) . . . . . . . . . . . . . . . . . . . . . . . . . . . . . . . . . . . . . . . . . . . . . . . . . . . . . . . . . . . . . . . . . . . . . . . . . . . . . . . . . . . . . . . . . . . . . . . . . . . . . . . . . . . . . . . . . . . . . . . . . . . . 15Global external trade balances in goods and services (billion EUR) . . . . . . . . . . . . . . . . . . . . . . . . . . . . . . . . . . . . . . . . . . . . . . . . . . . . . . . . . . . . . . . . . . . . . . . . . . . . . . . . . . . . . . . . . . . . . . . . . . . . . . 16Merchandise trade 2016 ‑ Main trade partner by reporter . . . . . . . . . . . . . . . . . . . . . . . . . . . . . . . . . . . . . . . . . . . . . . . . . . . . . . . . . . . . . . . . . . . . . . . . . . . . . . . . . . . . . . . . . . . . . . . . . . . . . . . . . . . . . 17Trade in goods and services (% of GDP) . . . . . . . . . . . . . . . . . . . . . . . . . . . . . . . . . . . . . . . . . . . . . . . . . . . . . . . . . . . . . . . . . . . . . . . . . . . . . . . . . . . . . . . . . . . . . . . . . . . . . . . . . . . . . . . . . . . . . . . . . . . . 18Trade in goods and services in selected countries (% of GDP) . . . . . . . . . . . . . . . . . . . . . . . . . . . . . . . . . . . . . . . . . . . . . . . . . . . . . . . . . . . . . . . . . . . . . . . . . . . . . . . . . . . . . . . . . . . . . . . . . . . . . . . . . . 19Share in world trade in goods (%) . . . . . . . . . . . . . . . . . . . . . . . . . . . . . . . . . . . . . . . . . . . . . . . . . . . . . . . . . . . . . . . . . . . . . . . . . . . . . . . . . . . . . . . . . . . . . . . . . . . . . . . . . . . . . . . . . . . . . . . . . . . . . . . . . 20Share in world trade in goods in selected countries (%) . . . . . . . . . . . . . . . . . . . . . . . . . . . . . . . . . . . . . . . . . . . . . . . . . . . . . . . . . . . . . . . . . . . . . . . . . . . . . . . . . . . . . . . . . . . . . . . . . . . . . . . . . . . . . . . 21Share in world trade in services (%) . . . . . . . . . . . . . . . . . . . . . . . . . . . . . . . . . . . . . . . . . . . . . . . . . . . . . . . . . . . . . . . . . . . . . . . . . . . . . . . . . . . . . . . . . . . . . . . . . . . . . . . . . . . . . . . . . . . . . . . . . . . . . . . 22Share in world trade in services in selected countries (%) . . . . . . . . . . . . . . . . . . . . . . . . . . . . . . . . . . . . . . . . . . . . . . . . . . . . . . . . . . . . . . . . . . . . . . . . . . . . . . . . . . . . . . . . . . . . . . . . . . . . . . . . . . . . . 23Share in world trade in goods and services (%) . . . . . . . . . . . . . . . . . . . . . . . . . . . . . . . . . . . . . . . . . . . . . . . . . . . . . . . . . . . . . . . . . . . . . . . . . . . . . . . . . . . . . . . . . . . . . . . . . . . . . . . . . . . . . . . . . . . . . . 24Share in world trade in goods and services in selected countries (%) . . . . . . . . . . . . . . . . . . . . . . . . . . . . . . . . . . . . . . . . . . . . . . . . . . . . . . . . . . . . . . . . . . . . . . . . . . . . . . . . . . . . . . . . . . . . . . . . . . . . 25Current account balance (% of GDP) . . . . . . . . . . . . . . . . . . . . . . . . . . . . . . . . . . . . . . . . . . . . . . . . . . . . . . . . . . . . . . . . . . . . . . . . . . . . . . . . . . . . . . . . . . . . . . . . . . . . . . . . . . . . . . . . . . . . . . . . . . . . . . . 26
SECTION 2 - FOREIGN DIRECT INVESTMENT (FDI) AND FOREIGN AFFILIATES STATISTICS (FATS) � � � � � � � � � � � � � � � � � � � 27
Global FDI inflows (billion EUR) . . . . . . . . . . . . . . . . . . . . . . . . . . . . . . . . . . . . . . . . . . . . . . . . . . . . . . . . . . . . . . . . . . . . . . . . . . . . . . . . . . . . . . . . . . . . . . . . . . . . . . . . . . . . . . . . . . . . . . . . . . . . . . . . . . . 28Global FDI outflows (billion EUR) . . . . . . . . . . . . . . . . . . . . . . . . . . . . . . . . . . . . . . . . . . . . . . . . . . . . . . . . . . . . . . . . . . . . . . . . . . . . . . . . . . . . . . . . . . . . . . . . . . . . . . . . . . . . . . . . . . . . . . . . . . . . . . . . . . 29Global FDI inward stocks (billion EUR) . . . . . . . . . . . . . . . . . . . . . . . . . . . . . . . . . . . . . . . . . . . . . . . . . . . . . . . . . . . . . . . . . . . . . . . . . . . . . . . . . . . . . . . . . . . . . . . . . . . . . . . . . . . . . . . . . . . . . . . . . . . . . . 30Global FDI outward stocks (billion EUR) . . . . . . . . . . . . . . . . . . . . . . . . . . . . . . . . . . . . . . . . . . . . . . . . . . . . . . . . . . . . . . . . . . . . . . . . . . . . . . . . . . . . . . . . . . . . . . . . . . . . . . . . . . . . . . . . . . . . . . . . . . . . 31Inward FATS ‑ Foreign enterprises in the EU‑28 by controlling country (2013) . . . . . . . . . . . . . . . . . . . . . . . . . . . . . . . . . . . . . . . . . . . . . . . . . . . . . . . . . . . . . . . . . . . . . . . . . . . . . . . . . . . . . . . . . . . . 32Inward FATS ‑ Persons employed in the EU‑28 by controlling country (2013) . . . . . . . . . . . . . . . . . . . . . . . . . . . . . . . . . . . . . . . . . . . . . . . . . . . . . . . . . . . . . . . . . . . . . . . . . . . . . . . . . . . . . . . . . . . . . 33Outward FATS ‑ Foreign affiliates of EU enterprises by partner country (2014) . . . . . . . . . . . . . . . . . . . . . . . . . . . . . . . . . . . . . . . . . . . . . . . . . . . . . . . . . . . . . . . . . . . . . . . . . . . . . . . . . . . . . . . . . . . . 34Outward FATS ‑ Persons employed in foreign affiliates of EU enterprises by partner country (2014) . . . . . . . . . . . . . . . . . . . . . . . . . . . . . . . . . . . . . . . . . . . . . . . . . . . . . . . . . . . . . . . . . . . . . . . . . . 35EU‑28 FDI by leading partners, 2015 (billion EUR) . . . . . . . . . . . . . . . . . . . . . . . . . . . . . . . . . . . . . . . . . . . . . . . . . . . . . . . . . . . . . . . . . . . . . . . . . . . . . . . . . . . . . . . . . . . . . . . . . . . . . . . . . . . . . . . . . . . 36
SECTION 3 - EU TRADE � � � � � � � � � � � � � � � � � � � � � � � � � � � � � � � � � � � � � � � � � � � � � � � � � � � � � � � � � � � � � � � � � � � � � � � � � � � � � � � � 37
EU‑28 exports of goods to extra EU‑28 by sector (billion EUR) . . . . . . . . . . . . . . . . . . . . . . . . . . . . . . . . . . . . . . . . . . . . . . . . . . . . . . . . . . . . . . . . . . . . . . . . . . . . . . . . . . . . . . . . . . . . . . . . . . . . . . . . . 38EU‑28 imports of goods from extra EU‑28 by sector (billion EUR) . . . . . . . . . . . . . . . . . . . . . . . . . . . . . . . . . . . . . . . . . . . . . . . . . . . . . . . . . . . . . . . . . . . . . . . . . . . . . . . . . . . . . . . . . . . . . . . . . . . . . . 39EU‑28 exports of goods to extra EU‑28 by sector, 2016 shares (%) . . . . . . . . . . . . . . . . . . . . . . . . . . . . . . . . . . . . . . . . . . . . . . . . . . . . . . . . . . . . . . . . . . . . . . . . . . . . . . . . . . . . . . . . . . . . . . . . . . . . . 40EU‑28 imports of goods from extra EU‑28 by sector, 2016 shares (%) . . . . . . . . . . . . . . . . . . . . . . . . . . . . . . . . . . . . . . . . . . . . . . . . . . . . . . . . . . . . . . . . . . . . . . . . . . . . . . . . . . . . . . . . . . . . . . . . . . 41EU‑28 trade in goods with extra EU‑28 by sector (billion EUR, %) . . . . . . . . . . . . . . . . . . . . . . . . . . . . . . . . . . . . . . . . . . . . . . . . . . . . . . . . . . . . . . . . . . . . . . . . . . . . . . . . . . . . . . . . . . . . . . . . . . . . . . 42EU‑28 trade in goods by statistical regime ‑ top 10 partners, 2016 (billion EUR, %) . . . . . . . . . . . . . . . . . . . . . . . . . . . . . . . . . . . . . . . . . . . . . . . . . . . . . . . . . . . . . . . . . . . . . . . . . . . . . . . . . . . . . . . 43EU‑28 trade in goods with extra EU‑28, moving sums (billion EUR, %) . . . . . . . . . . . . . . . . . . . . . . . . . . . . . . . . . . . . . . . . . . . . . . . . . . . . . . . . . . . . . . . . . . . . . . . . . . . . . . . . . . . . . . . . . . . . . . . . . . 44EU‑28 trade in goods with extra EU‑28, year‑on‑year growth and 12‑month moving sums (billion EUR,%) . . . . . . . . . . . . . . . . . . . . . . . . . . . . . . . . . . . . . . . . . . . . . . . . . . . . . . . . . . . . . . . . . . . . 45Services trade by modes of supply . . . . . . . . . . . . . . . . . . . . . . . . . . . . . . . . . . . . . . . . . . . . . . . . . . . . . . . . . . . . . . . . . . . . . . . . . . . . . . . . . . . . . . . . . . . . . . . . . . . . . . . . . . . . . . . . . . . . . . . . . . . . . 46‑47EU‑28 exports of services to extra EU‑28 by type (billion EUR) . . . . . . . . . . . . . . . . . . . . . . . . . . . . . . . . . . . . . . . . . . . . . . . . . . . . . . . . . . . . . . . . . . . . . . . . . . . . . . . . . . . . . . . . . . . . . . . . . . . . . . . . . 48EU‑28 imports of services from extra EU‑28 by type (billion EUR) . . . . . . . . . . . . . . . . . . . . . . . . . . . . . . . . . . . . . . . . . . . . . . . . . . . . . . . . . . . . . . . . . . . . . . . . . . . . . . . . . . . . . . . . . . . . . . . . . . . . . . 49EU‑28 exports of services to extra EU‑28 by type, 2015 shares (%) . . . . . . . . . . . . . . . . . . . . . . . . . . . . . . . . . . . . . . . . . . . . . . . . . . . . . . . . . . . . . . . . . . . . . . . . . . . . . . . . . . . . . . . . . . . . . . . . . . . . 50EU‑28 imports of services from extra EU‑28 by type, 2015 shares (%) . . . . . . . . . . . . . . . . . . . . . . . . . . . . . . . . . . . . . . . . . . . . . . . . . . . . . . . . . . . . . . . . . . . . . . . . . . . . . . . . . . . . . . . . . . . . . . . . . . 51EU‑28 trade in services with extra EU‑28 by type (billion EUR, %) . . . . . . . . . . . . . . . . . . . . . . . . . . . . . . . . . . . . . . . . . . . . . . . . . . . . . . . . . . . . . . . . . . . . . . . . . . . . . . . . . . . . . . . . . . . . . . . . . . . . . . 52EU‑28 trade balance in goods by partner (billion EUR) . . . . . . . . . . . . . . . . . . . . . . . . . . . . . . . . . . . . . . . . . . . . . . . . . . . . . . . . . . . . . . . . . . . . . . . . . . . . . . . . . . . . . . . . . . . . . . . . . . . . . . . . . . . . . . . . 53EU‑28 trade balance in services by partner (billion EUR) . . . . . . . . . . . . . . . . . . . . . . . . . . . . . . . . . . . . . . . . . . . . . . . . . . . . . . . . . . . . . . . . . . . . . . . . . . . . . . . . . . . . . . . . . . . . . . . . . . . . . . . . . . . . . . 54EU‑28 trade balance in goods and services by partner (billion EUR) . . . . . . . . . . . . . . . . . . . . . . . . . . . . . . . . . . . . . . . . . . . . . . . . . . . . . . . . . . . . . . . . . . . . . . . . . . . . . . . . . . . . . . . . . . . . . . . . . . . . . 55EU‑28 trade in goods by FTA partner, 2016 (billion EUR, %) . . . . . . . . . . . . . . . . . . . . . . . . . . . . . . . . . . . . . . . . . . . . . . . . . . . . . . . . . . . . . . . . . . . . . . . . . . . . . . . . . . . . . . . . . . . . . . . . . . . . . . . . . . . 56EU‑28 FTA regions . . . . . . . . . . . . . . . . . . . . . . . . . . . . . . . . . . . . . . . . . . . . . . . . . . . . . . . . . . . . . . . . . . . . . . . . . . . . . . . . . . . . . . . . . . . . . . . . . . . . . . . . . . . . . . . . . . . . . . . . . . . . . . . . . . . . . . . . . . . . . 57EU‑28 trade in goods by leading trade partners, 2016 (billion EUR, %) . . . . . . . . . . . . . . . . . . . . . . . . . . . . . . . . . . . . . . . . . . . . . . . . . . . . . . . . . . . . . . . . . . . . . . . . . . . . . . . . . . . . . . . . . . . . . . . . . . 58EU‑28 trade in services by leading trade partners, 2015 (billion EUR, %) . . . . . . . . . . . . . . . . . . . . . . . . . . . . . . . . . . . . . . . . . . . . . . . . . . . . . . . . . . . . . . . . . . . . . . . . . . . . . . . . . . . . . . . . . . . . . . . . . 59TEC ‑ Total EU exporting enterprises and value and share of exporting SMEs to total, 2013 . . . . . . . . . . . . . . . . . . . . . . . . . . . . . . . . . . . . . . . . . . . . . . . . . . . . . . . . . . . . . . . . . . . . . . . . . . . . . . . . . 60
SECTION 4 - TRADE BY MEMBER STATE � � � � � � � � � � � � � � � � � � � � � � � � � � � � � � � � � � � � � � � � � � � � � � � � � � � � � � � � � � � � � � � � � � 61
EU‑28 trade in goods with extra EU‑28 by Member State (billion EUR) . . . . . . . . . . . . . . . . . . . . . . . . . . . . . . . . . . . . . . . . . . . . . . . . . . . . . . . . . . . . . . . . . . . . . . . . . . . . . . . . . . . . . . . . . . . . . . . . . . 62EU‑28 trade in services with extra EU‑28 by Member State (billion EUR) . . . . . . . . . . . . . . . . . . . . . . . . . . . . . . . . . . . . . . . . . . . . . . . . . . . . . . . . . . . . . . . . . . . . . . . . . . . . . . . . . . . . . . . . . . . . . . . . . 63Intra‑EU merchandise trade by Member State, 2016 (%) . . . . . . . . . . . . . . . . . . . . . . . . . . . . . . . . . . . . . . . . . . . . . . . . . . . . . . . . . . . . . . . . . . . . . . . . . . . . . . . . . . . . . . . . . . . . . . . . . . . . . . . . . . . . . . 64
SECTION 5 - SUPPORT STATISTICS � � � � � � � � � � � � � � � � � � � � � � � � � � � � � � � � � � � � � � � � � � � � � � � � � � � � � � � � � � � � � � � � � � � � � � 65
GDP (current price, billion EUR) . . . . . . . . . . . . . . . . . . . . . . . . . . . . . . . . . . . . . . . . . . . . . . . . . . . . . . . . . . . . . . . . . . . . . . . . . . . . . . . . . . . . . . . . . . . . . . . . . . . . . . . . . . . . . . . . . . . . . . . . . . . . . . . . . . . 66GDP per capita (PPP) . . . . . . . . . . . . . . . . . . . . . . . . . . . . . . . . . . . . . . . . . . . . . . . . . . . . . . . . . . . . . . . . . . . . . . . . . . . . . . . . . . . . . . . . . . . . . . . . . . . . . . . . . . . . . . . . . . . . . . . . . . . . . . . . . . . . . . . . . . . . 67Share in world GDP (PPP, %) . . . . . . . . . . . . . . . . . . . . . . . . . . . . . . . . . . . . . . . . . . . . . . . . . . . . . . . . . . . . . . . . . . . . . . . . . . . . . . . . . . . . . . . . . . . . . . . . . . . . . . . . . . . . . . . . . . . . . . . . . . . . . . . . . . . . . 68Share of world GDP of selected countries (PPP, %) . . . . . . . . . . . . . . . . . . . . . . . . . . . . . . . . . . . . . . . . . . . . . . . . . . . . . . . . . . . . . . . . . . . . . . . . . . . . . . . . . . . . . . . . . . . . . . . . . . . . . . . . . . . . . . . . . . . 69Euro exchange rates with main national currencies (units of national currency per euro) . . . . . . . . . . . . . . . . . . . . . . . . . . . . . . . . . . . . . . . . . . . . . . . . . . . . . . . . . . . . . . . . . . . . . . . . . . . . . . . . . . . 70Bound and applied import duties ‑ simple averages . . . . . . . . . . . . . . . . . . . . . . . . . . . . . . . . . . . . . . . . . . . . . . . . . . . . . . . . . . . . . . . . . . . . . . . . . . . . . . . . . . . . . . . . . . . . . . . . . . . . . . . . . . . . . . . . . . 71


7
GLOSSARY

8 Trade Statistical Guide - June 2017
BALANCE OF PAYMENTS (BOP)
The BoP is a statistical statement that systematically summarises, over a given period of time, all the transactions of an economy with the rest of the world. The BoP records all economic transactions undertaken between residents and non-residents of a country during a given period.
The BoP is broken down into three broad sub‑balances.
■■ ■Current accountThis shows the flow of goods, services, income and current transfers between resident and non‑resident units.
■■ ■Capital accountThis covers all transactions involving:
(a) the receipt or payment of capital transfers (debt forgiveness, migrant’s transfers, transfers of ownership of fixed assets, transfers linked to, or conditional on, the acquisition or disposal of fixed assets, etc.);
(b) the acquisition/disposal of non‑produced, non‑financial assets, which includes transactions associated with tangible assets (e.g. land and subsoil assets) and transactions associated with intangible assets (e.g. patents, copyrights, trademarks, franchises, etc.).
■ Financial account This covers all transactions associated with changes of ownership in the foreign financial assets and liabilities of an economy.
The methodological framework followed in the compilation of the Balance of Payments and International Investment Position is defined in the sixth edition of the International Monetary Fund Balance of Payments and International Investment Position Manual (BPM6), published in 2009. The Balance of Payments Manual fifth edition (BPM5), published in 1993, was the reference for the data produced by the EU Member States, EFTA and EU candidate countries, and published by Eurostat until 2014. Time series according to BPM5 continue to be disseminated in Eurostat database but are no longer revised.
SERVICES
Services are one of the categories of the current account. The main breakdown of services includes twelve categories. Two new categories were introduced with the change from BPM5 to BPM6 (“Manufacturing services on physical inputs owned by others” and “Maintenance and repair
services”), while previous categories were in most cases redefined according to new definitions and calculation methods. In this Guide, EU and Member States figures in section 1 are reported according to BPM5 to ensure consistency with WTO data. Also, BPM5 service categories and figures will be used to display a consistent series between 2004 and 2013.
FOREIGN DIRECT INVESTMENT (FDI)
FDI is the category of international investment made by an entity resident in one economy (direct investor) to acquire a lasting interest in an enterprise operating in another economy (direct investment enterprise). The lasting interest is deemed to exist if the direct investor acquires at least 10 % of the voting power of the direct investment enterprise.
Two main indicators are used:
1) FDI flows denote the new investment made during the period;
2) FDI stocks (or positions) denote the value of the investment at the end of the period.
For both of these, FDI statistics record separately:
1) the inward FDI (or FDI in the reporting economy), namely investment by foreigners in enterprises resident in the reporting economy;
2) the outward FDI (or FDI abroad), namely investment by resident entities in affiliated enterprises abroad.
The change to BPM6 from BPM5 implied the introduction of separate recording for some items, mainly reverse investment (although not in yearly statistics), FDI between fellow enterprises and FDI by resident special purpose entities (SPEs). These changes affect comparability, which will be limited for the series up to 2012 and from 2013. Following BPM6 Eurostat publishes data on FDI held by SPEs for selected partners and for the extra‑EU and offshore financial centres aggregates. SPEs are mainly financial holding companies, foreign‑owned, and principally engaged in cross‑border financial transactions, with no or negligible local activity in the Member State of residence.
SPECIAL PURPOSE ENTITY (SPE)
A special‑purpose entity (SPE) is a legal entity (an enterprise or sometimes a limited partnership or joint venture) formally registered with a national authority and subject to the fiscal and other legal obligations of the economy in which it is resident, established to perform specific functions
9GLOSSARY
limited in scope or time, with one or a few primary creditors, having no or few non‑financial assets and employees, little or no production or operations and sometimes no physical presence beyond a “brass plate” confirming its place of registration. The SPE is related to another corporation, often as a subsidiary and often resident in a territory other than the territory of residence of the related corporation (lacking any physical dimension, the residence of a SPE is determined by the economic territory under whose laws it is incorporated or registered). Its core business function consists of financing its group activities or holding assets and liabilities of its group, that is the channelling of funds from non‑residents to other non‑residents, and with only a minor role for managing and directing activities (source: Eurostat).
OFFSHORE FINANCIAL CENTRE (OFC)
An offshore financial centre (OFC) is “a country or jurisdiction that provides financial services to non‑residents on a scale that is incommensurate with the size and the financing of its domestic economy” (IMF definition). The aggregate defined by Eurostat includes 40 countries. As examples, it contains European financial centres, such as Liechtenstein, Guernsey, Jersey, the Isle of Man, the Faroe Islands, Andorra and Gibraltar; Central American OFC such as Panama and Caribbean islands like Bermuda, the Bahamas, the Cayman Islands and the Virgin Islands; and Asian OFC such as Bahrain, Hong Kong, Singapore and the Philippines.
FOREIGN AFFILIATES STATISTICS (FATS)
FATS measure the commercial presence through affiliates in foreign markets. Inward FATS describe the overall activity of foreign affiliates resident in the compiling economy. Outward FATS describes the activities of foreign affiliates abroad controlled by residents of the compiling country.
A foreign affiliate in inward FATS is an enterprise resident in the compiling country over which an institutional unit not resident in the compiling country has control. A foreign affiliate in outward FATS is instead an enterprise or branch not resident in the compiling country over which an institutional unit resident in the compiling country has direct or indirect control. Control is the ability to determine the general policy of the affiliate by appointing appropriate managers, if necessary. Most of the time, control is determined by taking into account the share of ownership, although other criteria might be relevant and used.
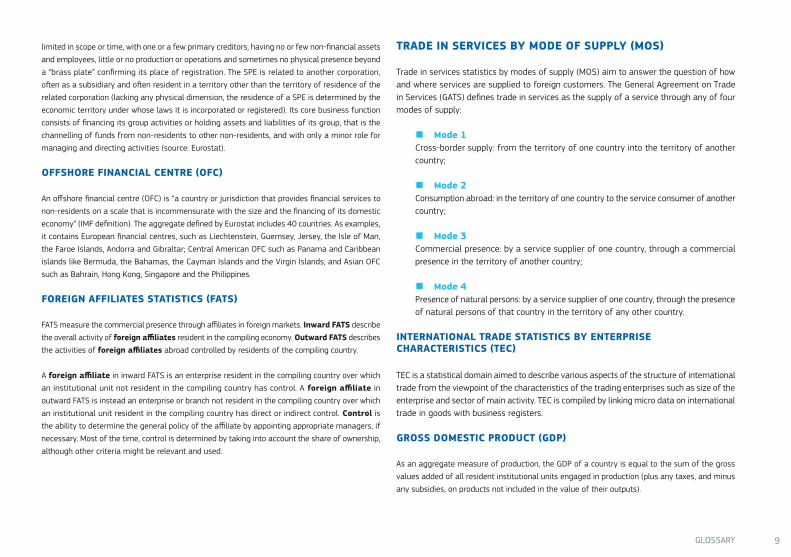
TRADE IN SERVICES BY MODE OF SUPPLY (MOS)
Trade in services statistics by modes of supply (MOS) aim to answer the question of how and where services are supplied to foreign customers. The General Agreement on Trade in Services (GATS) defines trade in services as the supply of a service through any of four modes of supply:
■ Mode 1 Cross‑border supply: from the territory of one country into the territory of another country;
■ Mode 2 Consumption abroad: in the territory of one country to the service consumer of another country;
■ Mode 3Commercial presence: by a service supplier of one country, through a commercial presence in the territory of another country;
■ Mode 4Presence of natural persons: by a service supplier of one country, through the presence of natural persons of that country in the territory of any other country.
INTERNATIONAL TRADE STATISTICS BY ENTERPRISE CHARACTERISTICS (TEC)
TEC is a statistical domain aimed to describe various aspects of the structure of international trade from the viewpoint of the characteristics of the trading enterprises such as size of the enterprise and sector of main activity. TEC is compiled by linking micro data on international trade in goods with business registers.
GROSS DOMESTIC PRODUCT (GDP)
As an aggregate measure of production, the GDP of a country is equal to the sum of the gross values added of all resident institutional units engaged in production (plus any taxes, and minus any subsidies, on products not included in the value of their outputs).

10 Trade Statistical Guide - June 2017
PURCHASING POWER PARITY (PPP)
Purchasing power parity (PPP) is an indicator of price level differences across countries. It measures the number of units of country B’s currency that are needed in country B to purchase the same quantity of an individual good or service, as one unit of country A’s currency will purchase in country A.
PPPs are therefore the rates of currency conversion that equalise the purchasing power of different currencies by eliminating the differences in price levels between countries.
TRADE IN GOODS: CLASSIFICATION SYSTEMS
■ Harmonized System (HS) The Harmonized Commodity Description and Coding System, more briefly known as the HS, is a multipurpose international product nomenclature developed by the World Customs Organization (WCO). The HS is organised into 21 sections and 96 chapters. It comprises around 5 000 commodity groups, each identified by a 6‑digit code.
■ Standard International Trade Classification (SITC)The SITC is a product classification of the UN used for external trade statistics (export and import values and volumes of goods). It is designed to provide the commodity aggregates for purposes of economic analysis and to facilitate international comparisons of trade‑by‑commodity data. It is divided into 10 basic sections.
TRADE IN GOODS: STATISTICAL REGIME
Merchandise trade statistics included in this booklet are based on the general trade system (also known as ‘Statistical regime 4’ or ‘Total trade’). In this system, the recorded aggregates include all goods entering or leaving the economic territory of a country with the exception of simple transit trade. In particular, all goods received into customs warehouses are recorded as imports, regardless of whether they subsequently go into free circulation in the Member State of receipt. Similarly, outgoing goods from customs warehouses are included in the general trade aggregates, at the time they leave the Member State.
This general system is the result of three other regimes, presented below.
■ Normal trade:goods are exported definitively, or imported and released into free circulation in the EU customs territory.
■ Trade under inward processing procedures:goods are imported temporarily (with an exemption from duties, levies or other checks) so that they can be further processed (assembled or transformed), and then all the resulting processed products are exported outside the EU.
■ Trade under outward processing procedures:intermediate goods are temporarily exported for further processing in a non‑EU country, and the processed products are re‑imported into the EU (with a full or partial exemption from custom duties and levies).
TRADE IN GOODS: INTRA-EU AND EXTRA-EU TRADE FLOWS
Outward flows from a Member State to a non‑member country (extra‑EU) are called ‘exports’; outward flows from one Member State to another (intra‑EU) are called ‘dispatches’. Inward flows into a Member State from a non‑member country are called ‘imports’. Inward flows into a Member State from another Member State are called ‘arrivals’.
For methodological reasons, international trade in goods statistics are accurate at EU level. At Member State level inaccuracies can arise because of the “Rotterdam effect”: a Member State receiving a good from a non‑EU country is not necessarily the Member State of final destination and a Member State sending a good to a non‑EU country is not necessarily the Member State of origin of the good.
When aggregating intra‑EU and extra‑EU trade, double counting may be introduced.
IMPORT DUTIES
■ Bound import dutiesThese are the legally bound commitments on customs duty rates, which act as ceilings on the tariffs that member governments can set (WTO).
■ Applied import dutiesThese are the rates that governments actually charge on imports, which can be lower than bound rates and have a direct impact on trade (WTO).
Whereas an applied duty cannot exceed a bound duty, average applied duties exceed in some cases average bound duties. This can occur if the averages are calculated over different tariff nomenclatures.
NOTE ON DATA PRESENTATION
Footnotes are provided under each table and figure to provide information on data sources and information on particular values or series. Data values in Italics are estimated or provisional.

11
WORLD TRADE

12 Trade Statistical Guide - June 2017
Global exports of goods (billion EUR)
Country 2006 2007 2008 2009 2010 2011 2012 2013 2014 2015 2016
World 7 027.6 7 428.9 8 156.3 6 639.1 8 827.4 10 161.1 11 325.3 11 169.4 11 147.0 11 679.5 11 213.2
Argentina 37.1 40.8 47.6 39.9 50.9 59.0 61.2 55.9 50.8 51.2 51.3
Australia 97.0 103.2 126.2 110.2 159.7 194.5 200.4 190.9 181.1 169.9 172.8
Brazil 110.2 114.6 134.6 108.0 152.3 183.9 188.5 182.0 169.4 172.3 166.7
Canada 309.3 306.7 310.3 226.6 292.3 324.2 354.3 345.1 357.3 368.0 352.0
China 772.0 888.8 971.5 861.8 1 190.6 1 364.4 1 595.7 1 664.5 1 763.8 2 055.5 1 930.3
India 96.0 112.2 120.8 118.4 168.2 220.6 231.4 237.3 239.2 239.9 236.6
Indonesia 80.3 83.3 93.2 83.5 119.0 146.2 147.9 137.5 132.7 135.6 130.3
Japan 515.1 521.2 531.7 416.3 580.7 590.9 621.6 538.1 519.5 563.1 582.6
Mexico 199.0 198.4 198.1 164.7 225.1 251.0 288.6 286.1 298.9 343.1 337.5
Russia 232.5 257.1 312.6 204.3 281.9 356.2 408.2 397.0 374.6 309.5 257.5
Saudi Arabia 157.5 154.0 208.9 125.4 174.8 242.5 285.1 269.3 255.5 182.3 153.3
South Africa 41.8 46.3 49.6 39.0 68.9 78.6 77.5 72.3 68.6 73.4 67.7
South Korea 259.2 271.1 286.9 260.6 351.8 399.0 426.4 421.4 431.1 474.8 448.0
Turkey 68.1 78.2 89.8 73.2 85.9 96.9 118.7 114.3 118.6 129.6 128.8
United States 826.0 848.4 884.0 757.8 963.6 1 065.0 1 203.1 1 188.5 1 219.8 1 356.1 1 313.3
EU-28 1 152.5 1 234.5 1 309.1 1 094.0 1 354.1 1 554.5 1 684.9 1 736.4 1 702.9 1 789.2 1 745.2
France 135.8 140.3 150.9 130.3 154.2 167.1 181.7 177.6 174.3 187.8 183.7
Germany 318.6 337.4 357.7 300.0 376.7 428.9 471.0 469.4 476.4 503.0 501.5
Italy 126.2 139.8 148.7 121.4 141.9 163.0 178.3 180.4 180.0 186.3 184.1
United Kingdom 134.0 135.7 142.5 114.4 148.1 181.2 183.0 229.8 198.2 230.5 194.4
Coverage: excluding intra-EU trade.
Sources : Eurostat (Comext, Statistical regime 4), IMF DOTS

13WORLD TRADE
Global imports of goods (billion EUR)
Country 2006 2007 2008 2009 2010 2011 2012 2013 2014 2015 2016
World 7 347.2 7 740.5 8 485.7 6 938.7 9 126.4 10 408.7 11 649.8 11 388.1 11 382.7 11 954.7 11 587.8
Argentina 27.2 32.6 39.1 27.8 42.4 52.8 53.3 55.7 49.1 53.9 50.3
Australia 112.1 122.0 137.7 120.9 154.4 178.6 206.8 185.8 181.7 191.9 182.2
Brazil 77.6 94.3 124.8 95.8 145.2 172.3 184.1 191.2 182.8 163.8 131.2
Canada 295.5 294.2 294.2 244.0 313.5 343.8 381.5 368.7 367.8 401.1 385.7
China 630.6 697.7 769.6 719.7 1 051.5 1 251.0 1 414.5 1 467.7 1 477.7 1 443.7 1 436.0
India 140.7 171.5 191.4 184.7 264.6 334.1 381.7 352.3 346.6 353.5 322.4
Indonesia 48.6 54.3 87.9 69.4 102.3 127.5 149.2 140.5 134.1 128.6 122.4
Japan 460.9 453.8 518.5 395.7 523.5 614.2 689.6 626.7 611.4 584.0 548.3
Mexico 215.1 217.1 221.4 178.1 241.1 267.0 305.9 304.3 319.1 377.6 370.2
Russia 105.5 145.5 181.5 115.3 164.0 212.2 246.6 237.2 215.2 164.4 164.5
Saudi Arabia 54.3 64.6 77.0 66.8 78.9 93.1 119.2 124.1 128.2 149.2 121.3
South Africa 57.3 66.2 65.2 51.0 66.3 78.2 85.9 82.6 79.7 81.6 71.8
South Korea 246.4 260.4 295.9 231.6 320.7 376.7 404.4 388.2 395.6 393.4 366.8
Turkey 111.1 124.0 137.3 101.0 140.0 173.0 184.1 189.5 182.3 186.8 179.4
United States 1 528.6 1 472.0 1 472.7 1 149.7 1 484.6 1 586.2 1 771.7 1 708.0 1 767.2 2 020.4 1 977.8
EU-28 1 368.3 1 450.3 1 585.2 1 235.6 1 531.5 1 730.0 1 798.8 1 687.4 1 692.2 1 729.2 1 708.3
France 132.8 140.2 154.9 123.2 145.4 168.7 172.9 165.4 164.7 163.0 159.8
Germany 261.2 271.8 292.2 234.6 292.1 329.0 327.6 314.3 313.8 326.0 320.6
Italy 148.0 156.5 171.9 125.4 164.5 184.2 177.5 160.8 153.0 153.1 144.2
United Kingdom 213.5 215.6 217.5 188.2 227.0 252.4 283.4 239.4 244.3 261.7 284.2
Coverage: excluding intra-EU trade.
Sources : Eurostat (Comext, Statistical regime 4), IMF DOTS

14 Trade Statistical Guide - June 2017
Global exports of services (billion EUR)
Country 2006 2007 2008 2009 2010 2011 2012 2013 2014 2015 2016
World 1 768.4 1 933.0 2 035.2 1 958.9 2 240.8 2 389.1 2 704.6 2 774.4 2 931.0 3 344.3 3 343.0
Argentina 6.2 7.4 8.1 7.7 10.1 11.0 11.7 11.0 10.3 12.6 11.2
Australia 26.3 29.5 29.3 28.6 35.2 37.8 41.7 40.0 40.7 44.2 48.1
Brazil 14.7 17.5 20.7 19.9 23.2 26.7 30.5 28.7 30.1 30.4 30.1
Canada 52.8 51.6 51.0 49.2 58.0 61.3 69.5 68.1 66.6 72.1 73.2
China 74.9 91.5 98.8 87.9 142.4 144.4 156.9 155.9 164.9 195.9 188.2
India 55.3 63.2 72.1 66.6 88.3 99.5 113.3 112.3 118.3 140.9 146.2
Indonesia 9.2 9.2 10.5 9.5 12.6 15.7 18.4 17.3 17.7 20.0 21.8
Japan 87.1 88.7 95.9 86.7 101.5 101.1 106.6 101.9 123.3 146.5 156.9
Mexico 12.7 12.6 12.0 10.6 11.5 11.2 12.6 15.2 15.9 20.6 21.8
Russia 28.4 32.0 38.8 32.8 37.1 41.7 48.5 52.8 49.5 46.6 45.2
Saudi Arabia 11.3 12.0 6.4 7.0 8.1 8.3 8.6 8.9 9.4 13.0 14.4
South Africa 10.4 10.8 9.5 9.5 12.1 12.5 13.7 12.7 12.7 13.6 13.0
South Korea 45.6 52.3 62.1 52.2 62.8 65.3 80.6 78.1 84.4 88.1 83.9
Turkey 20.8 21.9 25.2 25.7 27.5 29.6 33.9 36.3 39.0 42.3 34.0
United States 331.9 356.4 362.3 367.6 424.9 451.0 510.9 528.2 559.5 676.8 679.7
EU-28 452.4 506.1 525.3 512.2 568.7 b 615.2 684.9 721.3 772.5 831.5 819.8
France 47.3 51.1 54.3 68.8 67.2 73.5 b 82.2 84.0 92.8 98.0 96.1
Germany 68.9 76.2 82.8 80.0 81.7 b 86.6 96.4 100.5 107.6 120.5 126.4
Italy 30.3 30.0 32.6 28.9 31.7 b 34.2 39.5 39.4 39.3 39.3 39.6
United Kingdom 112.2 125.5 116.2 113.4 122.8 b 129.2 147.0 162.5 171.8 188.2 182.8
Coverage: excluding intra-EU trade.
(b) break in data continuity. Data beginning with the highlighted year do not form a consistent series with those from earlier years.
Sources : Eurostat (bop_its_tot; bop_its6_tot), WTO.

15WORLD TRADE
Global imports of services (billion EUR)
Country 2006 2007 2008 2009 2010 2011 2012 2013 2014 2015 2016
World 1 734.8 1 864.9 2 011.0 1 876.5 2 214.2 2 363.3 2 683.9 2 732.1 2 943.1 3 342.6 3 322.8
Argentina 6.7 7.8 9.0 8.7 11.0 12.5 14.0 13.8 12.6 16.1 17.7
Australia 26.5 30.6 33.3 30.3 39.0 45.0 52.0 51.1 48.3 52.0 51.4
Brazil 22.4 27.1 32.1 33.7 45.9 53.3 61.5 63.5 66.3 63.7 57.6
Canada 58.1 60.0 60.7 59.5 74.2 77.1 87.1 85.0 83.1 89.5 88.2
China 80.3 94.2 106.3 104.7 149.0 178.0 218.9 248.9 325.8 392.7 408.7
India 46.6 51.2 59.7 57.6 86.7 90.0 101.4 95.6 96.6 111.4 120.8
Indonesia 17.2 17.9 19.4 16.6 20.0 22.8 26.6 26.4 25.2 27.9 27.7
Japan 112.6 115.7 121.6 111.7 124.4 126.3 143.7 128.7 145.0 159.0 165.2
Mexico 18.8 18.2 17.4 18.0 19.5 21.8 23.5 23.5 25.2 28.9 28.8
Russia 36.9 44.2 52.7 45.5 56.8 65.7 84.8 96.7 91.1 79.9 67.1
Saudi Arabia 39.5 46.0 51.1 53.8 57.9 56.0 57.1 57.7 75.7 79.3 64.8
South Africa 11.3 11.9 11.6 11.0 14.8 15.0 14.7 13.6 12.8 14.0 13.5
South Korea 56.1 61.9 66.5 59.0 73.5 74.1 84.6 83.0 87.2 101.5 99.8
Turkey 9.7 11.6 12.4 12.3 14.9 15.1 16.3 18.5 18.9 20.4 20.1
United States 271.7 271.9 278.1 277.3 308.8 313.0 351.8 347.2 362.3 440.4 454.5
EU-28 381.4 419.1 454.0 429.1 460.5 b 480.5 520.0 543.5 602.2 685.7 689.4
France 43.0 44.6 46.0 53.5 53.9 61.4 b 63.0 65.9 73.6 78.7 80.3
Germany 76.7 81.2 85.4 77.4 84.2 b 89.8 99.4 106.2 108.5 118.0 117.3
Italy 30.1 33.4 38.4 32.6 33.9 b 33.5 34.0 33.4 33.4 33.5 34.3
United Kingdom 65.6 69.8 67.9 60.6 70.0 b 71.2 76.3 80.8 82.5 96.1 94.0
Coverage: excluding intra-EU trade.
(b) break in data continuity. Data beginning with the highlighted year do not form a consistent series with those from earlier years.
Sources : Eurostat (bop_its_tot; bop_its6_tot), WTO.

16 Trade Statistical Guide - June 2017
Global external trade balances in goods and services (billion EUR)
Country 2006 2007 2008 2009 2010 2011 2012 2013 2014 2015 2016
Argentina 9.4 7.8 7.6 11.1 7.5 4.7 5.5 − 2.6 − 0.7 − 6.2 − 5.5
Australia − 15.2 − 19.9 − 15.5 − 12.4 1.4 8.8 − 16.7 − 6.0 − 8.3 − 29.9 − 12.7
Brazil 24.9 10.7 − 1.5 − 1.6 − 15.5 − 14.9 − 26.6 − 44.1 − 49.5 − 24.8 8.1
Canada 8.5 4.1 6.4 − 27.7 − 37.5 − 35.4 − 44.8 − 40.5 − 26.9 − 50.5 − 48.7
China 136.0 188.4 194.4 125.3 132.6 79.8 119.1 103.7 125.3 415.0 273.8
India − 36.0 − 47.3 − 58.1 − 57.3 − 94.8 − 104.0 − 138.5 − 98.3 − 85.8 − 84.1 − 60.4
Indonesia 23.7 20.1 − 3.6 7.0 9.3 11.7 − 9.5 − 12.2 − 9.0 − 0.9 2.0
Japan 28.7 40.4 − 12.5 − 4.4 34.2 − 48.5 − 105.2 − 115.4 − 113.5 − 33.4 26.1
Mexico − 22.2 − 24.3 − 28.7 − 20.8 − 23.9 − 26.6 − 28.2 − 26.4 − 29.6 − 42.8 − 39.8
Russia 118.5 99.4 117.2 76.4 98.1 120.0 125.3 116.0 117.8 111.9 71.1
Saudi Arabia 74.9 55.3 87.1 11.9 46.0 101.6 117.5 96.4 61.1 − 33.2 − 18.4
South Africa − 16.4 − 20.9 − 17.6 − 13.5 − 0.1 − 2.1 − 9.4 − 11.3 − 11.2 − 8.6 − 4.7
South Korea 2.3 1.0 − 13.5 22.1 20.3 13.5 18.0 28.3 32.7 67.9 65.2
Turkey − 31.9 − 35.6 − 34.7 − 14.4 − 41.4 − 61.5 − 47.9 − 57.4 − 43.5 − 35.3 − 36.7
United States − 642.4 − 539.1 − 504.6 − 301.6 − 404.8 − 383.2 − 409.5 − 338.5 − 350.2 − 428.0 − 439.2
EU-28 − 144.8 − 128.8 − 204.8 − 58.6 − 69.3 b − 40.8 51.0 226.7 181.1 205.8 167.3
France 7.3 6.6 4.3 22.3 22.0 10.5 b 28.1 30.3 28.8 44.2 39.7
Germany 49.6 60.6 62.8 68.0 82.1 b 96.8 140.3 149.4 161.8 179.5 189.9
Italy − 21.6 − 20.1 − 29.0 − 7.6 − 24.8 b − 20.5 6.3 25.6 32.9 39.0 45.2
United Kingdom − 32.8 − 24.1 − 26.8 − 21.0 − 26.0 b − 13.2 − 29.8 72.1 43.2 60.8 − 0.9
Coverage: excluding intra-EU trade.
(b) break in data continuity. Data beginning with the highlighted year do not form a consistent series with those from earlier years.
Sources : Eurostat (Comext, Statistical regime 4), Eurostat (bop_its_tot; bop_its6_tot), IMF DOTS, WTO.

17WORLD TRADE
Merchandise trade 2016 - Main trade partner by reporter
Total trade i.e. exports + imports
Source : IMF DOTS.
EU-28 as first trade partner US as first trade partner China as first trade partner Brazil as first trade partner

18 Trade Statistical Guide - June 2017
Trade in goods and services (% of GDP)
Country 2006 2007 2008 2009 2010 2011 2012 2013 2014 2015 2016
World 43.6 44.8 47.8 40.3 45.1 48.2 49.0 48.7 48.1 45.3 43.3
Argentina 41.6 42.2 42.0 35.0 35.7 35.7 31.1 29.6 29.0 23.5 26.5
Australia 42.1 41.2 45.4 40.5 41.2 42.2 41.2 41.1 41.4 41.3 40.0
Brazil 25.5 24.9 27.1 21.5 22.0 23.2 24.2 25.0 24.3 26.5 23.7
Canada 68.3 66.7 68.0 58.9 60.6 62.8 62.9 62.5 64.8 66.5 65.1
China 70.5 68.0 62.2 48.3 55.4 54.4 50.8 48.8 47.1 40.4 39.1
India 44.8 44.0 53.3 43.7 47.2 56.8 58.2 57.0 52.3 44.9 40.5
Indonesia 49.2 48.0 55.5 43.2 44.6 48.7 47.8 46.6 46.2 40.2 35.9
Japan 32.6 35.8 37.0 26.9 30.9 32.4 32.3 35.9 38.3 36.8 32.6
Mexico 57.9 58.6 60.0 57.9 62.7 65.5 68.3 66.2 67.4 74.2 80.2
Russia 47.6 47.0 48.3 42.2 43.7 46.3 46.7 46.7 47.0 48.8 46.2
Saudi Arabia 87.6 91.2 97.2 82.2 80.4 82.9 82.1 81.8 82.3 72.1 61.2
South Africa 55.8 62.0 69.6 51.8 57.3 61.5 62.2 65.4 65.7 64.4 62.5
South Korea 75.3 78.8 104.4 93.3 98.0 105.9 104.7 98.7 94.0 84.9 78.3
Turkey 47.8 47.9 50.9 45.9 46.0 52.6 51.9 50.1 51.0 49.0 46.8
United States 26.8 27.9 29.9 24.7 28.2 30.6 30.5 30.0 29.9 27.6 26.4
EU-28 27.4 27.8 29.7 26.6 30.5 b 33.2 34.8 34.6 34.1 34.2 33.5
France 19.4 19.3 20.3 19.4 21.0 22.9 b 23.9 23.3 23.6 24.2 23.4
Germany 30.3 30.5 31.9 28.2 32.3 b 34.6 36.0 35.0 34.4 35.2 34.0
Italy 21.6 22.3 24.0 19.6 23.2 b 25.3 26.6 25.8 25.0 25.0 24.1
United Kingdom 24.6 24.4 27.6 28.0 31.0 b 33.8 33.4 34.8 30.8 30.1 31.8Coverage: excluding intra-EU trade.
(b) break in data continuity. Data beginning with the highlighted year do not form a consistent series with those from earlier years.
Ratio = (exports+imports) / GDP.
Sources : Eurostat (Comext, Statistical regime 4), Eurostat (bop_its_tot; bop_its6_tot), IMF DOTS, WTO, IMF World Economic Outlook (April 2017).

19WORLD TRADE
Trade in goods and services in selected countries (% of GDP)
70.5
39.1
27.4
33.5 32.6 32.6
26.8 26.4
0
10
20
30
40
50
60
70
80
2006 2007 2008 2009 2010 2011 2012 2013 2014 2015 2016
China EU-28 Japan United States
Coverage: excluding intra-EU trade. Ratio = (imports + exports) / GDP. Sources: Eurostat (Comext, Statistical regime 4), Eurostat (bop_its_tot; bop_its6_tot), IMF DOTS, WTO, IMF World Economic Outlook (April 2017).

20 Trade Statistical Guide - June 2017
Share in world trade in goods (%)
Country 2006 2007 2008 2009 2010 2011 2012 2013 2014 2015 2016
World 100.0 100.0 100.0 100.0 100.0 100.0 100.0 100.0 100.0 100.0 100.0
Argentina 0.4 0.5 0.5 0.5 0.5 0.5 0.5 0.5 0.4 0.4 0.4
Australia 1.5 1.5 1.6 1.7 1.7 1.8 1.8 1.7 1.6 1.5 1.6
Brazil 1.3 1.4 1.6 1.5 1.7 1.7 1.6 1.7 1.6 1.4 1.3
Canada 4.2 4.0 3.6 3.5 3.4 3.2 3.2 3.2 3.2 3.3 3.2
China 9.8 10.5 10.5 11.6 12.5 12.7 13.1 13.9 14.4 14.8 14.8
India 1.6 1.9 1.9 2.2 2.4 2.7 2.7 2.6 2.6 2.5 2.5
Indonesia 0.9 0.9 1.1 1.1 1.2 1.3 1.3 1.2 1.2 1.1 1.1
Japan 6.8 6.4 6.3 6.0 6.2 5.9 5.7 5.2 5.0 4.9 5.0
Mexico 2.9 2.7 2.5 2.5 2.6 2.5 2.6 2.6 2.7 3.0 3.1
Russia 2.4 2.7 3.0 2.4 2.5 2.8 2.9 2.8 2.6 2.0 1.9
Saudi Arabia 1.5 1.4 1.7 1.4 1.4 1.6 1.8 1.7 1.7 1.4 1.2
South Africa 0.7 0.7 0.7 0.7 0.8 0.8 0.7 0.7 0.7 0.7 0.6
South Korea 3.5 3.5 3.5 3.6 3.7 3.8 3.6 3.6 3.7 3.7 3.6
Turkey 1.2 1.3 1.4 1.3 1.3 1.3 1.3 1.3 1.3 1.3 1.4
United States 16.4 15.3 14.2 14.0 13.6 12.9 12.9 12.8 13.3 14.3 14.4
EU-28 17.5 17.7 17.4 17.2 16.1 16.0 15.2 15.2 15.1 14.9 15.1
France 1.9 1.8 1.8 1.9 1.7 1.6 1.5 1.5 1.5 1.5 1.5
Germany 4.0 4.0 3.9 3.9 3.7 3.7 3.5 3.5 3.5 3.5 3.6
Italy 1.9 2.0 1.9 1.8 1.7 1.7 1.5 1.5 1.5 1.4 1.4
United Kingdom 2.4 2.3 2.2 2.2 2.1 2.1 2.0 2.1 2.0 2.1 2.1
Coverage: excluding intra-EU trade.
Sources : Eurostat (Comext, Statistical regime 4), IMF DOTS.

21WORLD TRADE
Share in world trade in goods in selected countries (%)
9.8
14.8
17.5
15.1
6.8
5.0
16.4
14.4
0
5
10
15
20
2006 2007 2008 2009 2010 2011 2012 2013 2014 2015 2016
China EU-28 Japan United States
Coverage: excluding intra-EU trade. Sources: Eurostat (Comext, Statistical regime 4), IMF DOTS.

22 Trade Statistical Guide - June 2017
Share in world trade in services (%)
Country 2006 2007 2008 2009 2010 2011 2012 2013 2014 2015 2016
World 100.0 100.0 100.0 100.0 100.0 100.0 100.0 100.0 100.0 100.0 100.0
Argentina 0.4 0.4 0.4 0.4 0.5 0.5 0.5 0.4 0.4 0.4 0.4
Australia 1.5 1.6 1.5 1.5 1.7 1.7 1.7 1.7 1.5 1.4 1.5
Brazil 1.1 1.2 1.3 1.4 1.6 1.7 1.7 1.7 1.6 1.4 1.3
Canada 3.2 2.9 2.8 2.8 3.0 2.9 2.9 2.8 2.5 2.4 2.4
China 4.4 4.9 5.1 5.0 6.5 6.8 7.0 7.4 8.4 8.8 9.0
India 2.9 3.0 3.3 3.2 3.9 4.0 4.0 3.8 3.7 3.8 4.0
Indonesia 0.8 0.7 0.7 0.7 0.7 0.8 0.8 0.8 0.7 0.7 0.7
Japan 5.7 5.4 5.4 5.2 5.1 4.8 4.6 4.2 4.6 4.6 4.8
Mexico 0.9 0.8 0.7 0.7 0.7 0.7 0.7 0.7 0.7 0.7 0.8
Russia 1.9 2.0 2.3 2.0 2.1 2.3 2.5 2.7 2.4 1.9 1.7
Saudi Arabia 1.5 1.5 1.4 b 1.6 1.5 1.4 1.2 1.2 1.4 1.4 1.2
South Africa 0.6 0.6 0.5 0.5 0.6 0.6 0.5 0.5 0.4 0.4 0.4
South Korea 2.9 3.0 3.2 2.9 3.1 2.9 3.1 2.9 2.9 2.8 2.8
Turkey 0.9 0.9 0.9 1.0 1.0 0.9 0.9 1.0 1.0 0.9 0.8
United States 17.2 16.5 15.8 16.8 16.5 16.1 16.0 15.9 15.7 16.7 17.0
EU-28 23.8 24.4 24.2 24.5 23.1 b 23.1 22.4 23.0 23.4 22.7 22.6
France 2.6 2.5 2.5 3.2 2.7 2.8 b 2.7 2.7 2.8 2.6 2.6
Germany 4.2 4.1 4.2 4.1 3.7 b 3.7 3.6 3.8 3.7 3.6 3.7
Italy 1.7 1.7 1.8 1.6 1.5 b 1.4 1.4 1.3 1.2 1.1 1.1
United Kingdom 5.1 5.1 4.5 4.5 4.3 b 4.2 4.1 4.4 4.3 4.3 4.2
Coverage: excluding intra-EU trade.
(b) break in data continuity. Data beginning with the highlighted year do not form a consistent series with those from earlier years.
Sources : Eurostat (bop_its_tot; bop_its6_tot), WTO.

23WORLD TRADE
Share in world trade in services in selected countries (%)
4.4
9.0
23.8 22.6
5.7 4.8
17.2 17.0
0
5
10
15
20
25
30
2006 2007 2008 2009 2010 2011 2012 2013 2014 2015 2016
China EU-28 Japan United States
Coverage: shares in world trade excluding intra-EU trade. Sources: Eurostat (bop_its_tot; bop_its6_tot), WTO.
24 Trade Statistical Guide - June 2017
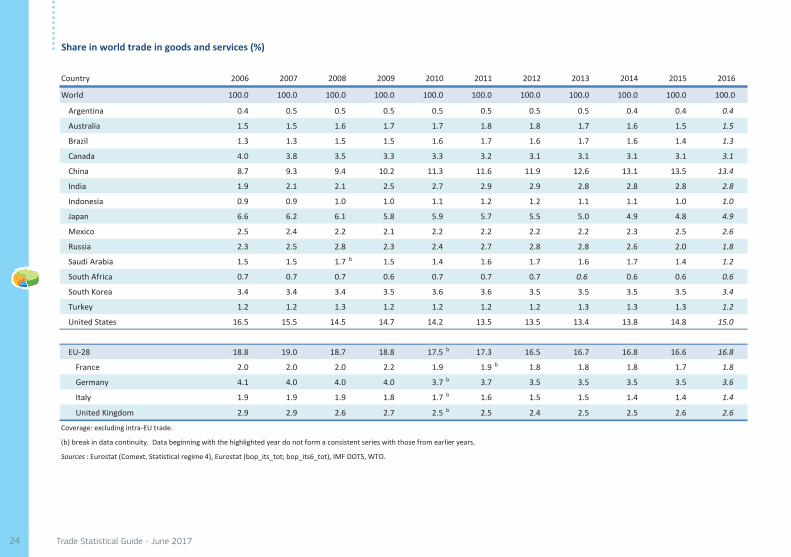
Share in world trade in goods and services (%)
Country 2006 2007 2008 2009 2010 2011 2012 2013 2014 2015 2016
World 100.0 100.0 100.0 100.0 100.0 100.0 100.0 100.0 100.0 100.0 100.0
Argentina 0.4 0.5 0.5 0.5 0.5 0.5 0.5 0.5 0.4 0.4 0.4
Australia 1.5 1.5 1.6 1.7 1.7 1.8 1.8 1.7 1.6 1.5 1.5
Brazil 1.3 1.3 1.5 1.5 1.6 1.7 1.6 1.7 1.6 1.4 1.3
Canada 4.0 3.8 3.5 3.3 3.3 3.2 3.1 3.1 3.1 3.1 3.1
China 8.7 9.3 9.4 10.2 11.3 11.6 11.9 12.6 13.1 13.5 13.4
India 1.9 2.1 2.1 2.5 2.7 2.9 2.9 2.8 2.8 2.8 2.8
Indonesia 0.9 0.9 1.0 1.0 1.1 1.2 1.2 1.1 1.1 1.0 1.0
Japan 6.6 6.2 6.1 5.8 5.9 5.7 5.5 5.0 4.9 4.8 4.9
Mexico 2.5 2.4 2.2 2.1 2.2 2.2 2.2 2.2 2.3 2.5 2.6
Russia 2.3 2.5 2.8 2.3 2.4 2.7 2.8 2.8 2.6 2.0 1.8
Saudi Arabia 1.5 1.5 1.7 b 1.5 1.4 1.6 1.7 1.6 1.7 1.4 1.2
South Africa 0.7 0.7 0.7 0.6 0.7 0.7 0.7 0.6 0.6 0.6 0.6
South Korea 3.4 3.4 3.4 3.5 3.6 3.6 3.5 3.5 3.5 3.5 3.4
Turkey 1.2 1.2 1.3 1.2 1.2 1.2 1.2 1.3 1.3 1.3 1.2
United States 16.5 15.5 14.5 14.7 14.2 13.5 13.5 13.4 13.8 14.8 15.0
EU-28 18.8 19.0 18.7 18.8 17.5 b 17.3 16.5 16.7 16.8 16.6 16.8
France 2.0 2.0 2.0 2.2 1.9 1.9 b 1.8 1.8 1.8 1.7 1.8
Germany 4.1 4.0 4.0 4.0 3.7 b 3.7 3.5 3.5 3.5 3.5 3.6
Italy 1.9 1.9 1.9 1.8 1.7 b 1.6 1.5 1.5 1.4 1.4 1.4
United Kingdom 2.9 2.9 2.6 2.7 2.5 b 2.5 2.4 2.5 2.5 2.6 2.6
Coverage: excluding intra-EU trade.
(b) break in data continuity. Data beginning with the highlighted year do not form a consistent series with those from earlier years.
Sources : Eurostat (Comext, Statistical regime 4), Eurostat (bop_its_tot; bop_its6_tot), IMF DOTS, WTO.

25WORLD TRADE
Share in world trade in goods and services in selected countries (%)
8.7
13.4
18.8
16.8
6.6
4.9
16.5
15.0
0
5
10
15
20
2006 2007 2008 2009 2010 2011 2012 2013 2014 2015 2016
China EU-28 Japan United States
Coverage: shares in world trade excluding intra-EU trade. Sources: Eurostat (Comext, Statistical regime 4), Eurostat (bop_its_tot; bop_its6_tot), IMF DOTS, WTO.

26 Trade Statistical Guide - June 2017
Current account balance (% of GDP)
Country 2006 2007 2008 2009 2010 2011 2012 2013 2014 2015 2016
Argentina 3.3 2.5 1.8 2.5 − 0.3 − 0.8 − 0.2 − 2.0 − 1.4 − 2.7 − 2.6
Australia − 5.8 − 6.7 − 4.9 − 4.6 − 3.6 − 3.0 − 4.1 − 3.2 − 2.9 − 4.7 − 2.6
Brazil 1.2 0.0 − 1.8 − 1.6 − 3.4 − 2.9 − 3.0 − 3.0 − 4.2 − 3.3 − 1.3
Canada 1.4 0.8 0.1 − 2.9 − 3.6 − 2.8 − 3.6 − 3.2 − 2.4 − 3.4 − 3.3
China 8.4 9.9 9.1 4.8 3.9 1.8 2.5 1.5 2.2 2.7 1.8
India − 1.0 − 1.3 − 2.3 − 2.8 − 2.8 − 4.3 − 4.8 − 1.7 − 1.3 − 1.1 − 0.9
Indonesia 2.4 1.4 0.0 1.8 0.7 0.2 − 2.7 − 3.2 − 3.1 − 2.0 − 1.8
Japan 3.9 4.7 2.8 2.8 3.9 2.1 1.0 0.9 0.8 3.1 3.9
Mexico − 0.8 − 1.4 − 1.9 − 1.0 − 0.5 − 1.2 − 1.4 − 2.5 − 2.0 − 2.9 − 2.7
Russia 8.7 5.2 5.8 3.8 4.1 4.8 3.3 1.5 2.8 5.1 1.7
Saudi Arabia 26.3 22.5 25.5 4.9 12.7 23.6 22.4 18.1 9.8 − 8.7 − 3.9
South Africa − 4.5 − 5.4 − 5.5 − 2.7 − 1.5 − 2.2 − 5.1 − 5.9 − 5.3 − 4.4 − 3.3
South Korea 0.4 1.1 0.3 3.7 2.6 1.6 4.2 6.2 6.0 7.7 7.0
Turkey − 5.7 − 5.5 − 5.2 − 1.8 − 5.8 − 8.9 − 5.5 − 6.7 − 4.7 − 3.7 − 3.8
United States − 5.8 − 5.0 − 4.7 − 2.7 − 3.0 − 3.0 − 2.8 − 2.2 − 2.3 − 2.6 − 2.6
EU-28 (*) − 0.1 − 0.5 − 1.3 − 0.1 0.0 0.4 1.2 1.7 1.7 2.2 2.4
France 0.5 0.1 − 0.9 − 0.8 − 0.8 − 1.0 − 1.2 − 0.9 − 1.1 − 0.2 − 1.1
Germany 5.7 6.8 5.6 5.7 5.6 6.1 7.0 6.7 7.3 8.3 8.5
Italy − 1.5 − 1.4 − 2.8 − 1.9 − 3.4 − 3.0 − 0.4 1.0 1.9 1.6 2.7
United Kingdom − 2.2 − 2.4 − 3.5 − 3.0 − 2.7 − 1.8 − 3.7 − 4.4 − 4.7 − 4.3 − 4.4
(*) EU-28, France, Germany, Italy, United Kingdom: current account with the rest of the world.
Source : IMF (World Economic Outlook, April 2017).
27
FOREIGN DIRECT INVESTMENT (FDI) and FOREIGN AFFILIATES STATISTICS (FATS)

28 Trade Statistical Guide - June 2017
Global FDI inflows (billion EUR)
Country 2005 2006 2007 2008 2009 2010 2011 2012 2013 b 2014 2015
World 283.9 614.2 732.3 614.7 608.0 788.5 639.9 979.7 726.1 708.8 1 263.0
Argentina 4.4 4.5 4.9 6.8 3.0 8.8 8.0 12.3 7.6 3.9 10.8
Australia − 23.9 22.0 31.8 33.4 23.8 28.8 44.2 48.0 44.8 31.1 20.9
Brazil 12.2 15.1 25.4 30.8 18.7 63.6 69.5 59.6 40.2 55.3 58.6
Canada 21.3 49.5 87.9 43.1 16.8 22.1 29.3 34.5 55.6 45.3 45.1
China 58.3 58.0 61.0 73.7 68.2 86.6 89.2 94.3 93.4 96.8 122.3
India 6.1 16.2 18.5 32.1 25.6 20.7 26.0 18.9 21.3 26.1 39.9
Indonesia 6.8 3.9 5.1 6.4 3.5 10.4 13.9 15.0 14.2 16.5 14.0
Japan 2.2 − 5.2 16.6 16.7 8.6 − 1.0 − 1.3 1.4 1.7 1.6 − 2.0
Mexico 21.1 17.0 23.9 20.0 13.0 20.1 17.1 16.1 34.8 19.5 27.5
Russia 11.7 30.1 40.4 52.0 20.1 24.1 26.7 23.7 40.5 22.1 8.9
Saudi Arabia 10.1 15.2 18.5 27.9 27.2 22.9 12.1 9.8 6.9 6.2 7.6
South Africa 5.5 0.3 4.9 6.4 5.5 2.8 3.1 3.6 6.4 4.4 1.6
South Korea 11.2 7.5 6.6 7.8 6.6 7.3 7.2 7.5 9.8 7.1 4.6
Turkey 8.2 16.4 16.4 13.7 6.3 7.0 11.8 10.5 9.4 9.3 15.1
United States 84.5 189.5 158.1 209.0 103.3 149.9 165.7 147.2 159.8 80.5 343.5
EU 129.7 231.2 432.1 182.2 b 274.6 224.5 424.7 309.8 506.8 98.7 466.5France 13.5 16.1 15.1 12.8 8.4 3.8 5.5 b 5.6 12.8 − 4.4 25.9Germany 4.7 24.3 12.3 − 1.2 3.0 17.3 18.7 b 16.9 13.9 9.2 0.3Italy 1.9 2.9 1.5 7.4 0.4 7.5 2.3 9.0 6.3 2.7 3.5
United Kingdom 37.7 54.5 78.6 31.1 26.1 45.1 12.9 22.2 : 27.9 :
Coverage: excluding intra-EU trade.
Including Special Purpose Entities.
(b) break in series.
(:) not available.
Sources : Eurostat (bop_fdi_main; bop_fdi6_flow), UNCTAD. Eurostat and UNCTAD cannot be directly compared because of methodological differences.

29FOREIGN DIRECT INVESTMENT (FDI) and FOREIGN AFFILIATES STATISTICS (FATS)
Global FDI outflows (billion EUR)
Country 2005 2006 2007 2008 2009 2010 2011 2012 2013 b 2014 2015
World 210.6 508.7 840.0 617.8 508.0 778.9 621.5 848.2 730.7 725.8 920.6
Argentina 1.1 2.0 1.1 1.0 0.5 0.7 1.1 0.8 0.7 1.5 1.1
Australia − 30.2 16.7 9.1 21.7 12.3 15.6 1.3 5.5 1.2 0.0 − 15.7
Brazil 2.0 22.6 5.2 14.0 − 7.3 16.7 8.0 − 4.2 − 0.9 1.7 2.8
Canada 22.8 38.0 48.6 55.6 29.3 27.0 38.6 44.8 42.5 43.1 62.3
China 9.9 14.1 19.4 38.1 40.6 52.0 53.7 68.4 81.3 92.8 115.1
India 2.4 11.4 12.6 14.4 11.5 12.0 9.0 6.6 1.3 8.9 6.8
Indonesia 2.5 2.2 3.4 4.0 1.6 2.0 5.6 4.2 5.0 5.4 5.7
Japan 37.1 40.4 54.1 87.8 54.0 42.8 77.9 96.2 103.1 86.2 116.9
Mexico 5.3 4.6 6.1 0.8 7.0 11.5 9.2 17.7 10.0 6.3 7.3
Russia 13.6 24.0 32.3 38.9 24.9 31.3 35.2 22.3 53.6 48.7 24.1
Saudi Arabia − 0.3 − 0.0 − 0.1 2.5 1.6 3.1 2.6 3.5 3.9 4.2 5.1
South Africa 0.8 5.0 2.2 − 2.2 0.8 − 0.1 − 0.2 2.4 5.1 5.9 4.9
South Korea 6.8 10.4 16.5 13.6 12.8 21.8 21.8 24.3 21.8 21.5 25.4
Turkey 0.9 0.7 1.6 1.8 1.1 1.1 1.7 3.2 2.7 5.1 4.4
United States 12.4 179.2 288.1 210.3 207.1 210.2 285.8 248.5 232.6 239.0 271.2
EU 239.9 317.7 564.2 379.0 b 329.7 303.4 470.1 317.4 546.8 58.3 537.2France 27.3 41.5 26.9 42.4 17.3 19.8 25.7 b 13.3 − 1.2 13.6 8.0Germany 17.2 36.0 46.8 4.1 13.3 36.0 22.7 b 10.9 36.2 26.0 31.4Italy 6.1 15.0 0.3 14.9 4.4 17.0 14.9 23.1 3.0 9.9 14.3
United Kingdom 45.5 62.9 130.5 65.3 36.1 18.3 51.7 43.8 : : − 59.5
Coverage: excluding intra-EU trade.
Including Special Purpose Entities.
(b) break in series.
(:) not available.
Sources : Eurostat (bop_fdi_main; bop_fdi6_flow), UNCTAD. Eurostat and UNCTAD cannot be directly compared because of methodological differences.

30 Trade Statistical Guide - June 2017
Global FDI inward stocks (billion EUR)
Country 2005 2006 2007 2008 2009 2010 2011 2012 2013 b 2014 2015
World 4 977.0 6 332.6 7 247.3 5 029.2 7 302.7 9 186.6 8 810.0 11 126.9 12 147.4 12 030.3 15 184.3
Argentina 45.5 49.2 50.6 53.7 58.7 67.7 72.8 80.0 72.2 63.3 86.6
Australia 209.0 252.3 299.5 219.1 329.5 415.5 416.4 499.2 446.1 441.6 504.6
Brazil 143.8 170.6 214.6 178.1 264.6 485.5 468.7 528.4 487.9 465.3 440.2
Canada 529.3 580.3 776.6 434.3 640.3 764.0 637.8 763.5 744.9 738.7 700.4
China 218.9 233.2 238.9 257.3 339.4 443.7 511.7 648.7 721.0 817.5 1 101.2
India 34.8 56.5 77.3 85.2 122.9 155.2 148.4 175.3 170.7 190.5 254.6
Indonesia 33.3 43.6 58.6 49.3 78.3 121.8 133.3 165.4 174.5 172.1 203.5
Japan 81.7 86.4 97.7 139.4 144.6 163.4 163.5 161.4 129.6 130.2 155.1
Mexico 189.9 215.1 219.6 171.6 221.2 276.8 245.6 295.3 299.6 295.7 381.5
Russia 144.6 211.7 358.8 145.8 265.3 352.6 295.8 343.5 357.5 215.4 234.5
Saudi Arabia 28.1 41.9 55.7 79.7 110.1 137.8 138.8 160.2 161.7 167.8 208.4
South Africa 79.4 86.9 98.2 58.0 101.5 138.1 116.7 129.7 116.7 106.5 114.7
South Korea 86.1 94.1 90.8 65.7 89.2 104.3 99.1 125.4 138.9 137.6 160.5
Turkey 58.2 76.9 114.9 55.5 104.6 143.1 99.5 150.0 114.3 135.5 132.8
United States 2 272.7 2 631.4 2 599.8 1 696.0 2 154.5 2 589.8 2 521.4 3 057.2 3 742.3 4 069.9 5 052.0
EU 1 835.1 2 022.7 2 415.4 2 497.0 b 2 784.8 3 145.1 3 720.3 3 905.9 4 130.3 4 758.5 5 744.9France 139.1 151.7 168.7 174.4 179.7 181.2 140.9 b 147.5 152.3 152.4 183.6Germany : : 178.3 170.3 166.8 180.5 188.9 197.9 171.1 168.3 195.9Italy 48.8 52.2 20.5 27.9 35.3 27.2 29.7 38.5 27.3 30.0 35.0
United Kingdom 355.8 417.6 424.7 341.0 358.7 432.0 503.7 575.8 542.0 691.2 707.3Coverage: excluding intra-EU trade.
Including Special Purpose Entities.
(b) break in series.
(:) not available.
Sources : Eurostat (bop_fdi_main; bop_fdi6_flow), UNCTAD. Eurostat and UNCTAD cannot be directly compared because of methodological differences.

31FOREIGN DIRECT INVESTMENT (FDI) and FOREIGN AFFILIATES STATISTICS (FATS)
Global FDI outward stocks (billion EUR)
Country 2005 2006 2007 2008 2009 2010 2011 2012 2013 b 2014 2015
World 5 527.3 7 264.3 8 130.6 5 215.1 7 763.6 9 379.9 8 536.6 10 730.6 11 838.9 11 337.4 14 359.3
Argentina 19.2 21.2 20.6 20.1 21.6 23.4 23.5 26.2 26.6 27.8 34.4
Australia 173.2 221.1 260.8 173.8 273.4 354.6 314.2 387.0 358.9 350.4 372.2
Brazil 61.3 85.1 91.5 89.3 96.2 113.2 115.4 159.8 154.5 132.9 164.3
Canada 573.8 641.9 715.2 451.6 658.7 775.3 659.1 778.3 853.6 867.2 999.0
China 46.0 59.8 86.1 125.2 176.3 239.5 305.4 414.3 497.7 664.9 911.2
India 7.8 21.6 32.2 43.1 58.0 73.2 78.7 92.0 90.3 99.1 125.4
Indonesia 0 0.8 2.3 1.9 2.8 5.1 4.5 9.7 14.6 19.2 27.3
Japan 313.2 360.9 399.0 466.2 535.4 631.8 697.1 814.0 848.5 874.0 1 114.3
Mexico 42.0 50.2 58.2 42.9 63.7 92.5 83.1 116.5 106.0 109.2 138.0
Russia 112.7 186.8 267.1 135.1 208.2 255.5 228.4 260.9 292.2 229.9 228.7
Saudi Arabia 6.3 0 12.9 14.4 16.8 20.7 22.3 27.7 30.6 34.7 58.8
South Africa 25.5 33.4 41.1 34.3 51.4 64.0 71.1 88.7 98.7 112.0 149.5
South Korea 31.8 40.0 55.7 68.0 88.7 110.9 126.4 161.1 183.4 204.0 255.9
Turkey 6.8 7.2 9.0 12.3 16.2 17.2 20.2 24.4 25.4 30.2 40.8
United States 2 934.0 3 572.1 3 861.6 2 116.2 3 108.7 3 639.6 3 253.3 4 077.9 4 751.9 4 745.8 5 408.9
EU 2 426.2 2 746.0 3 201.2 3 309.1 b 3 736.5 4 219.4 4 883.2 5 112.0 5 456.2 6 000.2 6 891.6France 295.7 303.2 328.2 351.8 378.9 426.5 414.9 b 422.8 388.7 424.9 463.9Germany : 295.1 314.2 302.1 295.2 346.1 382.7 387.1 405.2 457.7 525.9Italy 60.3 75.8 49.5 70.8 76.3 91.3 109.9 126.1 118.1 130.2 148.2
United Kingdom 520.1 635.4 687.6 588.0 567.2 588.3 669.3 704.0 740.5 784.5 821.5Coverage: excluding intra-EU trade.
Including Special Purpose Entities.
(b) break in series.
(:) not available.
Sources : Eurostat (bop_fdi_main; bop_fdi6_flow), UNCTAD. Eurostat and UNCTAD cannot be directly compared because of methodological differences.

32 Trade Statistical Guide - June 2017
Inward FATS - Foreign enterprises in the EU-28 by controlling country (2013)
Number of enterprises by controlling country:Extra EU-28 87 292United States 26 655Switzerland 13 500Offshore financial centres 11 000Japan 4 701Norway 4 129Russia 3 100China (except Hong Kong) 2 818Turkey 2 494Canada 2 000Israel 1 698Other countries 15 197
Source : Eurostat (fats_g1b_08).
United States 30.5%
Switzerland 15.5%
Offshore financial centres
12.6%
Japan 5.4%
Norway 4.7%
Russia 3.6%
China (except Hong Kong)
3.2%
Turkey 2.9%
Canada 2.3%
Israel 1.9% Other countries
17.4%

33FOREIGN DIRECT INVESTMENT (FDI) and FOREIGN AFFILIATES STATISTICS (FATS)
Inward FATS - Persons employed in the EU-28 by controlling country (2013)
Number of persons by controlling country:Extra EU-28 7 570 000United States 3 639 600Switzerland 1 200 000Offshore financial centres 861 713Japan 549 258Canada 213 220Norway 191 521India 152 093China (except Hong Kong) 90 080South Korea 89 650Australia 79 778Other countries 503 087
Source : Eurostat (fats_g1b_08).
United States 48.1%
Switzerland 15.9%
Offshore financial centres
11.4%
Japan 7.3%
Canada 2.8%
Norway 2.5%
India 2.0%
China (except Hong Kong)
1.2%
South Korea 1.2%
Australia 1.1%
Other countries
6.6%

34 Trade Statistical Guide - June 2017
Outward FATS - Foreign affiliates of EU enterprises by partner country (2014)
Number of enterprises by partner country:Extra EU-28 85 491China (except Hong Kong) 7 162Switzerland 4 337Brazil 3 810Australia 3 033Russia 3 011India 2 329Singapore 2 293Mexico 2 185South Africa 1 692Argentina 1 416Other countries (*) 54 223
(*) Data for some partners, including the United States, are confidential.
Source: Eurostat (fats_out2_r2).
China (except Hong Kong)
8.4%
Switzerland 5.1%
Brazil 4.5%
Australia 3.5%
Russia 3.5%
India 2.7%
Singapore 2.7%
Mexico 2.6%
South Africa 2.0% Argentina
1.7%
Other countries (*)
63.4%

35FOREIGN DIRECT INVESTMENT (FDI) and FOREIGN AFFILIATES STATISTICS (FATS)
Outward FATS - Persons employed in foreign affiliates of EU enterprises by partner country (2014)
Number of persons by partner country:Extra EU-28 14 402 332United States 3 226 797China (except Hong Kong) 1 593 906Brazil 1 282 285India 999 577Mexico 566 119Offshore financial centres 559 909Russia 544 369South Africa 359 503Canada 334 634Turkey 307 118Other countries 4 628 115
Source: Eurostat (fats_out2_r2).
United States 22.4%
China (except Hong Kong)
11.1%
Brazil 8.9%
India 6.9%
Mexico 3.9%
Offshore financial centres
3.9% Russia 3.8%
South Africa 2.5%
Canada 2.3%
Turkey 2.1%
Other countries 32.1%

36 Trade Statistical Guide - June 2017
EU-28 FDI by leading partners, 2015 (billion EUR)
Rank Leading sources Inflows Share Cumulative share Rank Leading destinations Outflows Share Cumulative share
Extra EU-28 466.5 100% 100% Extra EU-28 537.2 100% 100%
1 United States 252.4 54.1% 54.1% 1 United States 323.5 60.2% 60.2%2 Switzerland 78.3 16.8% 70.9% 2 Switzerland 48.8 9.1% 69.3%3 Canada 24.2 5.2% 76.1% 3 Brazil 28.9 5.4% 74.7%4 China 6.3 1.3% 77.4% 4 South Africa 24.5 4.6% 79.3%5 Japan 6.1 1.3% 78.7% 5 Mexico 18.3 3.4% 82.7%6 Qatar 6.0 1.3% 80.0% 6 Japan 10.9 2.0% 84.7%7 Bosnia-Herzegovina 5.6 1.2% 81.2% 7 Turkey 10.7 2.0% 86.7%8 Russia 4.5 1.0% 82.2% 8 Norway 7.0 1.3% 88.0%9 United Arab Emirates 3.3 0.7% 82.9% 9 India 6.2 1.2% 89.1%
10 Mexico 2.7 0.6% 83.5% 10 Nigeria 6.2 1.2% 90.3%
Offshore financial centres 83.0 17.8% Offshore financial centres 64.2 11.9%
Rank Leading sources Inward stocks Share Cumulative share Rank Leading destinations Outward stocks Share Cumulative share
Extra EU-28 5 744.9 100% 100% Extra EU-28 6 891.6 100% 100%
1 United States 2 380.9 41.4% 41.4% 1 United States 2 559.8 37.1% 37.1%2 Switzerland 619.3 10.8% 52.2% 2 Switzerland 821.8 11.9% 49.1%3 Canada 219.2 3.8% 56.0% 3 Brazil 329.9 4.8% 53.9%4 Japan 168.9 2.9% 59.0% 4 Canada 248.8 3.6% 57.5%5 Brazil 127.6 2.2% 61.2% 5 China 167.9 2.4% 59.9%6 Norway 76.8 1.3% 62.5% 6 Russia 162.2 2.4% 62.3%7 Russia 61.0 1.1% 63.6% 7 Mexico 161.6 2.3% 64.6%8 Israel 44.9 0.8% 64.4% 8 Australia 117.7 1.7% 66.3%9 United Arab Emirates 36.8 0.6% 65.0% 9 Japan 88.4 1.3% 67.6%
10 Mexico 36.5 0.6% 65.7% 10 Norway 82.6 1.2% 68.8%
Offshore financial centres 1 616.1 28.1% Offshore financial centres 1 083.2 15.7%Including Special Purpose Entities.
Source : Eurostat (bop_fdi6_flow; bop_fdi6_pos).

37
EU TRADE

38 Trade Statistical Guide - June 2017
EU-28 exports of goods to extra EU-28 by sector (billion EUR)
2006 2007 2008 2009 2010 2011 2012 2013 2014 2015 2016
1 152.0 1 234.5 1 309.1 1 094.0 1 354.1 1 554.5 1 684.9 1 736.4 1 702.9 1 789.2 1 745.2
SITC 0 Food and live animals 38.7 42.1 48.3 44.2 54.3 63.4 70.1 75.4 78.8 81.9 83.9
SITC 1 Beverages and tobacco 18.5 19.5 19.5 18.1 21.4 25.1 28.9 29.0 28.8 31.3 32.0
SITC 2 Crude materials, inedible, except fuels 25.8 27.7 29.0 25.4 34.6 41.2 42.9 40.7 39.0 38.5 37.4
SITC 3 Mineral fuels, lubricants and related materials
58.9 66.7 84.7 58.7 79.0 100.2 125.8 121.9 109.4 85.6 74.2
SITC 4 Animal and vegetable oils, fats and waxes
2.5 2.4 3.0 2.6 3.0 3.9 4.6 4.8 4.3 4.7 5.3
SITC 5 Chemicals and related products 183.4 196.8 197.6 195.6 232.7 254.9 275.5 273.3 278.8 315.2 313.8
SITC 6 Manufactured goods classified chiefly by material
162.6 174.5 177.7 138.7 170.1 195.2 203.5 201.0 198.8 199.0 189.9
SITC 7 Machinery and transport equipment 505.8 546.2 570.9 459.3 571.0 648.8 706.7 709.1 709.5 752.6 745.3
SITC 8 Miscellaneous manufactured articles 128.1 132.2 135.9 118.8 139.0 156.4 175.9 181.6 187.8 204.0 205.9
SITC 9 Commodities and transactions n.c.e. 27.9 26.5 42.4 32.9 48.9 65.6 51.1 99.6 67.7 76.4 57.6
AMA Agricultural Products 67.8 70.0 77.7 71.0 86.9 101.4 113.5 120.0 121.9 129.0 131.2
NAMA Non-Agricultural Products 1 084.2 1 164.5 1 231.4 1 022.9 1 267.2 1 453.1 1 571.4 1 616.3 1 581.1 1 660.1 1 614.1
AMA refers to all the products included in the WTO Uruguay Round Agreement on Agriculture. NAMA refers to all products not covered by this agreement.
n.c.e. = not classified elsewhere.
Source : Eurostat (Comext, Statistical regime 4).
TOTAL
SITC Rev.3
AMA/NAMA

39EU TRADE
EU-28 imports of goods from extra EU-28 by sector (billion EUR)
2006 2007 2008 2009 2010 2011 2012 2013 2014 2015 2016
1 368.0 1 450.3 1 585.2 1 235.6 1 531.5 1 730.0 1 798.8 1 687.4 1 692.2 1 729.2 1 708.3
SITC 0 Food and live animals 61.7 69.0 74.6 67.4 73.9 84.4 85.5 86.0 90.7 100.1 100.8
SITC 1 Beverages and tobacco 6.2 6.6 6.3 6.4 6.9 7.1 7.5 7.6 7.7 8.5 8.2
SITC 2 Crude materials, inedible, except fuels 57.5 64.4 67.4 41.7 64.1 76.8 71.5 67.5 64.4 62.8 59.1
SITC 3 Mineral fuels, lubricants and related materials
344.9 341.9 460.2 299.9 385.0 494.8 547.3 499.8 444.6 328.5 264.4
SITC 4 Animal and vegetable oils, fats and waxes
5.4 5.7 8.0 5.6 6.7 8.6 9.2 8.7 8.4 9.0 9.1
SITC 5 Chemicals and related products 109.2 120.7 124.3 112.5 137.3 155.3 163.4 157.9 165.4 185.5 184.7
SITC 6 Manufactured goods classified chiefly by material
160.5 189.1 178.3 115.5 157.8 185.0 168.3 164.7 172.7 183.9 181.4
SITC 7 Machinery and transport equipment 412.6 429.0 425.9 352.9 444.1 443.5 451.6 437.7 459.5 536.8 552.3
SITC 8 Miscellaneous manufactured articles 180.6 193.6 196.9 181.0 206.3 218.2 221.6 217.2 235.5 267.6 268.3
SITC 9 Commodities and transactions n.c.e. 29.7 30.4 43.5 52.7 49.5 56.3 72.9 40.4 43.2 46.4 80.0
AMA Agricultural Products 68.0 77.6 88.1 76.7 84.2 98.4 101.9 101.9 104.2 113.8 112.3
NAMA Non-Agricultural Products 1 300.0 1 372.7 1 497.1 1 158.9 1 447.3 1 631.6 1 696.8 1 585.6 1 588.0 1 615.4 1 596.0
AMA refers to all the products included in the WTO Uruguay Round Agreement on Agriculture. NAMA refers to all products not covered by this agreement.
n.c.e. = not classified elsewhere.
Source : Eurostat (Comext, Statistical regime 4).
TOTAL
SITC Rev.3
AMA/NAMA

40 Trade Statistical Guide - June 2017
EU-28 exports of goods to extra EU-28 by sector, 2016 shares (%)
SITC 0 Food and live animals 4.8%
SITC 1 Beverages and tobacco
1.8% SITC 2 Crude materials, inedible, except fuels
2.1%
SITC 3 Mineral fuels, lubricants and related materials
4.3%
SITC 4 Animal and vegetable oils, fats and waxes
0.3%
SITC 5 Chemicals and related products
18.0%
SITC 6 Manufactured goods classified chiefly by material
10.9%
SITC 7 Machinery and transport equipment
42.7%
SITC 8 Miscellaneous manufactured
articles 11.8%
SITC 9 Commodities and transactions n.c.e.
3.3%
Source: Eurostat (Comext, Statistical regime 4).

41EU TRADE
EU-28 imports of goods from extra EU-28 by sector, 2016 shares (%)
SITC 0 Food and live animals 5.9%
SITC 1 Beverages and tobacco 0.5%
SITC 2 Crude materials, inedible, except fuels
3.5%
SITC 3 Mineral fuels, lubricants and related materials
15.5%
SITC 4 Animal and vegetable oils, fats and waxes
0.5%
SITC 5 Chemicals and related products
10.8%
SITC 6 Manufactured goods classified chiefly by material
10.6%
SITC 7 Machinery and transport equipment
32.3%
SITC 8 Miscellaneous manufactured articles
15.7%
SITC 9 Commodities and transactions n.c.e.
4.7%
Source: Eurostat (Comext, Statistical regime 4).

42 Trade Statistical Guide - June 2017
EU-28 trade in goods with extra EU-28 by sector (billion EUR, %)
Trade balanceValue 2016
Share in total 2016
Variation 2015-2016
CAGR2006-2016
Value 2016
Share in total 2016
Variation 2015-2016
CAGR2006-2016
2016
1 745.2 100% − 2.5% 4.2% 1 708.3 100% − 1.2% 2.2% 36.9
SITC 0 Food and live animals 83.9 4.8% 2.4% 8.0% 100.8 5.9% 0.7% 5.0% − 16.9
SITC 1 Beverages and tobacco 32.0 1.8% 2.3% 5.6% 8.2 0.5% − 3.6% 2.9% 23.7
SITC 2 Crude materials, inedible, except fuels 37.4 2.1% − 2.8% 3.8% 59.1 3.5% − 6.0% 0.3% − 21.7
SITC 3 Mineral fuels, lubricants and related materials 74.2 4.3% − 13.3% 2.3% 264.4 15.5% − 19.5% -2.6% − 190.2
SITC 4 Animal and vegetable oils, fats and waxes 5.3 0.3% 12.3% 7.7% 9.1 0.5% 1.2% 5.3% − 3.8
SITC 5 Chemicals and related products 313.8 18.0% − 0.4% 5.5% 184.7 10.8% − 0.4% 5.4% 129.1
SITC 6 Manufactured goods classified chiefly by material 189.9 10.9% − 4.6% 1.6% 181.4 10.6% − 1.4% 1.2% 8.5
SITC 7 Machinery and transport equipment 745.3 42.7% − 1.0% 4.0% 552.3 32.3% 2.9% 3.0% 193.0
SITC 8 Miscellaneous manufactured articles 205.9 11.8% 0.9% 4.9% 268.3 15.7% 0.2% 4.0% − 62.4
SITC 9 Commodities and transactions n.c.e. 57.6 3.3% − 24.7% 7.5% 80.0 4.7% 72.7% 10.4% − 22.5
AMA Agricultural Products 131.2 7.5% 1.6% 6.8% 112.3 6.6% − 1.3% 5.1% 18.9
NAMA Non-Agricultural Products 1 614.1 92.5% − 2.8% 4.1% 1 596.0 93.4% − 1.2% 2.1% 18.1
AMA refers to all the products included in the Uruguay Round Agreement on Agriculture. NAMA refers to all products not covered by this agreement. WTO definitions.
n.c.e. = 'not classified elsewhere'.
CAGR (compound annual growth rate) is the rate at which the initial value had to grow every year in a time period to obtain the final value.
Source : Eurostat (Comext, Statistical regime 4).
Imports
AMA/NAMA
TOTAL
ExportsSITC Rev.3

43EU TRADE
EU-28 trade in goods by statistical regime, top 10 partners - 2016 (billion EUR, %)
All Statistical regimes
NormalInward
ProcessingOutward
processingAll Statistical
regimesNormal
Inward Processing
Outward processing
Extra EU-28 1 745.2 1 550.2 180.6 14.5 Extra EU-28 1 708.3 1 609.5 78.9 19.9USA 362.2 291.4 62.8 8.0 China 344.5 338.6 5.4 0.5China 170.1 146.7 23.0 0.4 USA 247.8 207.3 32.9 7.7Switzerland 142.5 136.8 5.3 0.3 Switzerland 121.7 116.6 4.9 0.2Turkey 78.0 76.8 1.1 0.1 Russia 118.8 114.6 4.0 0.2Russia 72.4 66.4 5.9 0.1 Turkey 66.7 65.7 0.8 0.2Japan 58.1 49.4 7.9 0.7 Japan 66.6 55.7 5.2 5.7Norway 48.4 45.1 3.2 0.1 Norway 63.0 61.9 1.0 0.0United Arab Emirates 45.9 42.4 3.4 0.1 South Korea 41.4 39.8 1.5 0.2South Korea 44.5 37.1 7.3 0.1 India 39.3 37.9 1.1 0.3
India 37.7 35.8 1.8 0.1 Vietnam 33.1 32.6 0.1 0.4
Extra EU-28 100.0 100.0 100.0 100.0 Extra EU-28 100.0 100.0 100.0 100.0
USA 20.8 18.8 34.8 55.2 China 20.2 21.0 6.8 2.6China 9.7 9.5 12.7 2.7 USA 14.5 12.9 41.7 38.4Switzerland 8.2 8.8 3.0 2.0 Switzerland 7.1 7.2 6.2 1.2Turkey 4.5 5.0 0.6 0.5 Russia 7.0 7.1 5.1 0.8Russia 4.1 4.3 3.3 0.6 Turkey 3.9 4.1 1.0 0.8Japan 3.3 3.2 4.4 5.1 Japan 3.9 3.5 6.6 28.6Norway 2.8 2.9 1.8 0.5 Norway 3.7 3.8 1.3 0.2United Arab Emirates 2.6 2.7 1.9 0.6 South Korea 2.4 2.5 1.9 0.8South Korea 2.6 2.4 4.0 0.8 India 2.3 2.4 1.4 1.3
India 2.2 2.3 1.0 0.7 Vietnam 1.9 2.0 0.1 1.9Source : Eurostat (Comext).
Partner share Partner share
Partners Partners
Exports Imports
Value Value

44 Trade Statistical Guide - June 2017
EU-28 trade in goods with extra EU-28, moving sums (billion EUR, %)
Exports Imports Balance Export growth Import growth
Jan 14 - Dec 14 1,702.9 1,692.2 10.7 -1.9% 0.3%
…
Jan 15 - Dec 15 1,789.2 1,729.2 59.9 5.1% 2.2%
Feb 15 - Jan 16 1,784.0 1,723.9 60.2 5.0% 2.3%
Mar 15 - Feb 16 1,783.3 1,721.8 61.4 4.8% 1.9%
Apr 15 - Mar 16 1,772.0 1,710.4 61.6 3.0% 0.2%
May 15 - Apr 16 1,763.5 1,705.0 58.6 1.5% -0.7%
Jun 15 - May16 1,760.6 1,702.3 58.3 1.0% -0.8%
Jun 15 - Jun 16 1,752.9 1,696.5 56.3 -0.5% -1.7%
Aug 15 - Jul 16 1,733.1 1,685.5 47.5 -2.2% -2.3%
Sep 15 - Aug 16 1,737.7 1,696.3 41.4 -2.4% -1.7%
Oct 15 - Sep 16 1,736.3 1,699.2 37.1 -2.4% -1.3%
Nov 15 - Oct 16 1,729.0 1,692.3 36.7 -2.6% -1.7%
Dec 15 - Nov 16 1,736.6 1,699.7 36.9 -2.4% -1.7%
Jan 16 - Dec 16 1,745.2 1,708.3 36.9 -2.5% -1.2%
Feb 16 - Jan 17 1,765.0 1,732.5 32.5 -1.1% 0.5%
Mar 16 - Feb 17 1,774.4 1,742.7 31.7 -0.5% 1.2%
(*) Compared to the same period 12 months earlier, e.g. Sep 15 - Aug 16 compared to Sep 14 - Aug 15.
Source : Eurostat (Comext).
Period EU-28 trade with extra EU-28 (billion EUR) Year-on-year growth (*)

45EU TRADE
EU trade in goods with extra-EU, year-on-year growth and 12-month moving sums (billion EUR, %)
Source : Eurostat (Comext).
-4.0%
-3.0%
-2.0%
-1.0%
0.0%
1.0%
2.0%
3.0%
4.0%
5.0%
6.0%
7.0%
1,620.0
1,640.0
1,660.0
1,680.0
1,700.0
1,720.0
1,740.0
1,760.0
1,780.0
1,800.0
Growth (%) Trade (billion EUR) Exports Imports Export growth Import growth

46 Trade Statistical Guide - June 2017
Services trade by modes of supply (MOS)
Trade in services statistics by modes of supply (MOS) aim to answer thequestion of how and where services are supplied to foreign customers.Services broken down by MOS take into account both international trade inservices statistics (ITSS) and foreign affiliates statistics (FATS).
The General Agreement on Trade in Services (GATS) defines trade in servicesas the supply of a service through any of four modes of supply:
- Mode 1: Cross-border supply: from the territory of one country into theterritory of another country;
- Mode 2: Consumption abroad: in the territory of one country to the serviceconsumer of another country;
- Mode 3: Commercial presence: by a service supplier of one country, througha commercial presence in the territory of another country (the FATSframework is designed to provide information on the activities of enterpriseslocated in foreign markets);
- Mode 4: Presence of natural persons: by a service supplier of one country,through the presence of natural persons of that country in the territory of anyother country.

47EU TRADE
Services trade by modes of supply (MOS)
http://ec.europa.eu/eurostat/statistics-explained/index.php/Services_trade_statistics_by_modes_of_supply
EU-28 ouward supply of services (2013)
EU-28 ouward supply of services (2013)Mode 1Mode 2Mode 3Mode 4
When considering total services traded, comprising both international trade in services exports and outward FATS,the pilot study (based on 2013 data) shows that two thirds of EU-28 total services are supplied by the affiliates inthe foreign country i.e. using mode 3. The same is true for imports, comprising two thirds of total services imports.Commercial presence is the most important mode for delivering e.g. the following services: finance, insurance,telecommunications and other business services (including R&D, accounting, legal and engineering services).
Other main findings of the study are available on:
0%10%20%30%40%50%60%70%80%90%
100%
Mode 1: Cross-border supply
Mode 2: Consumption abroad
Mode 3: Commercialpresence
Mode 4: Presence of naturalpersons
Mode 1, 21.0%
Mode 2, 6.2%
Mode 3, 68.8%
Mode 4, 4.1%

48 Trade Statistical Guide - June 2017
EU-28 exports of services to extra EU-28 by type (billion EUR)
2005 2006 2007 2008 2009 2010 2011 2012 2013 2014 2015
TOTAL 405.2 452.4 506.1 525.3 512.2 568.7 615.2 684.9 721.3 772.5 831.5
EBOPS
Manufacturing services on physical inputs owned by others
: : : : : 18.7 19.3 20.6 21.0 19.8 20.2
Maintenance and repair services n.i.e. : : : : : 4.6 5.5 7.2 9.2 10.4 11.7
Transport 104.5 113.8 123.6 135.9 109.9 124.4 134.4 143.7 140.5 140.5 143.6
Travel 65.7 71.8 75.1 74.0 69.3 80.5 85.2 95.5 103.8 109.0 112.5
Construction 12.2 13.9 16.3 17.6 19.7 9.4 10.4 11.1 13.0 13.8 13.3
Insurance and pension services 6.0 11.2 14.5 13.1 22.4 25.0 23.0 31.4 30.0 33.0 25.9
Financial services 35.3 42.2 53.9 50.5 43.3 59.5 69.2 73.6 76.7 79.9 87.4
Charges for the use of intellectual property n.i.e.
23.6 24.3 27.2 27.3 29.7 29.0 35.2 36.1 39.4 50.0 60.8
Telecommunications, computer, and information services
24.7 30.9 36.1 42.9 45.5 63.8 69.7 80.5 85.6 96.4 105.2
Other business services 120.5 131.2 144.5 150.4 159.5 140.2 149.1 167.0 183.9 204.4 235.0
Personal, cultural and recreational services
4.9 4.7 4.8 4.9 5.0 6.1 6.4 7.7 7.8 8.0 7.8
Government goods and services n.i.e. 7.6 8.3 8.4 7.6 7.5 7.2 7.3 8.6 8.6 7.3 7.6
Services not allocated 0.1 0.0 1.6 1.1 0.3 0.4 0.3 1.9 1.7 0.2 0.6
Commercial services 397.6 444.1 497.7 517.7 504.7 561.5 607.9 676.3 712.6 765.3 823.9
Until 2009: EU-27/BPM5. From 2010: EU-28/BPM6.
EBOPS: Extended Balance of Payments Services classification (2010).
n.i.e. = not included elsewhere.
Commercial services = services excluding government services n.i.e.
Source : Eurostat (bop_its_det; bop_its6_det).

49EU TRADE
EU-28 imports of services from extra EU-28 by type (billion EUR)
2005 2006 2007 2008 2009 2010 2011 2012 2013 2014 2015
TOTAL 351.9 381.4 419.1 454.0 429.1 460.5 480.5 520.0 543.5 602.2 685.7
EBOPS
Manufacturing services on physical inputs owned by others
: : : : : 4.5 5.0 7.5 7.5 7.2 8.5
Maintenance and repair services n.i.e. : : : : : 2.4 3.2 3.1 8.2 7.7 9.8
Transport 89.6 99.0 102.7 112.2 89.9 108.7 113.3 118.0 118.8 121.3 126.9
Travel 84.9 87.9 94.5 93.5 85.7 83.7 87.2 90.1 91.1 98.0 99.2
Construction 6.1 7.1 8.0 8.0 9.9 5.1 4.6 5.7 5.4 5.0 5.3
Insurance and pension services 8.2 7.7 8.0 8.6 10.8 12.1 10.8 11.2 11.2 13.2 14.4
Financial services 14.2 17.2 20.4 18.7 16.1 26.3 31.9 32.2 37.7 37.7 40.9
Charges for the use of intellectual property n.i.e.
32.9 31.4 34.6 41.8 42.6 40.0 41.9 44.0 45.8 69.5 98.0
Telecommunications, computer, and information services
16.6 19.7 22.1 25.3 27.0 40.0 39.2 43.3 48.1 55.1 59.4
Other business services 86.8 95.8 107.9 119.8 121.6 122.2 128.2 148.4 152.9 169.2 207.4
Personal, cultural and recreational services
6.3 7.2 6.0 6.0 5.1 8.2 8.5 9.1 9.8 11.6 10.7
Government goods and services n.i.e. 6.1 6.8 7.2 7.3 7.1 6.8 6.4 7.0 6.9 6.4 5.0
Services not allocated 0.1 1.5 7.6 12.9 13.4 0.6 0.4 0.3 0.2 0.1 0.2
Commercial services 345.8 374.6 411.9 446.8 422.0 453.8 474.1 513.0 536.6 595.8 680.6
Until 2009: EU-27/BPM5. From 2010: EU-28/BPM6.
EBOPS: Extended Balance of Payments Services classification (2010).
n.i.e. = not included elsewhere.
Commercial services = services excluding government services n.i.e.
Source : Eurostat (bop_its_det; bop_its6_det).

50 Trade Statistical Guide - June 2017
EU-28 exports of services to extra EU-28 by type, 2015 shares (billion euro, %)
n.i.e. = not included elsewhere.
Source : Eurostat (bop_its6_det).
Manufacturing services on physical inputs owned by others
2.4% Maintenance and repair services
n.i.e. 1.4%
Transport 17.3%
Travel 13.5%
Construction 1.6%
Insurance and pension services 3.1%
Financial services 10.5%
Charges for the use of intellectual property n.i.e.
7.3%
Telecommunications, computer, and information
services 12.7%
Other business services 28.3%
Personal, cultural and recreational services
0.9%
Government goods and services n.i.e. 0.9%

51EU TRADE
EU-28 imports of services from extra EU-28 by type, 2015 shares (billion euro, %)
n.i.e. = not included elsewhere.
Source : Eurostat (bop_its6_det).
Manufacturing services on physical inputs owned by others
1.2%
Maintenance and repair services n.i.e. 1.4%
Transport 18.5%
Travel 14.5%
Construction 0.8%
Insurance and pension services 2.1%
Financial services
6.0% Charges for the use of
intellectual property n.i.e. 14.3%
Telecommunications, computer, and information services
8.7%
Other business services 30.2%
Personal, cultural and recreational services
1.6%
Government goods and services n.i.e. 0.7%

52 Trade Statistical Guide - June 2017
EU-28 trade in services with extra EU-28 by type (billion EUR, %)
Trade balanceValue 2015
Share in total 2015
Variation 2014-2015
CAGR2011-2015
Value 2015
Share in total 2015
Variation 2014-2015
CAGR2011-2015
2015
TOTAL 831.5 100% 7.6% 7.8% 685.7 100% 13.9% 9.3% 145.9
Manufacturing services on physical inputs owned by others 20.2 2.4% 2.0% 1.1% 8.5 1.2% 18.4% 14.1% 11.6
Maintenance and repair services n.i.e. 11.7 1.4% 12.3% 20.6% 9.8 1.4% 26.2% 32.1% 1.9
Transport 143.6 17.3% 2.2% 1.7% 126.9 18.5% 4.6% 2.9% 16.7
Travel 112.5 13.5% 3.2% 7.2% 99.2 14.5% 1.3% 3.3% 13.2
Construction 13.3 1.6% − 3.8% 6.3% 5.3 0.8% 5.9% 3.3% 8.0
Insurance and pension services 25.9 3.1% − 21.4% 3.0% 14.4 2.1% 8.5% 7.3% 11.6
Financial services 87.4 10.5% 9.4% 6.0% 40.9 6.0% 8.5% 6.5% 46.4
Charges for the use of intellectual property n.i.e. 60.8 7.3% 21.7% 14.6% 98.0 14.3% 40.9% 23.7% − 37.1
Telecommunications, computer, and information services 105.2 12.7% 9.1% 10.8% 59.4 8.7% 7.8% 11.0% 45.8
Other business services 235.0 28.3% 15.0% 12.0% 207.4 30.2% 22.5% 12.8% 27.7
Personal, cultural and recreational services 7.8 0.9% − 1.9% 5.0% 10.7 1.6% − 7.6% 5.9% − 2.9
Government goods and services n.i.e. 7.6 0.9% 4.6% 1.0% 5.0 0.7% − 21.5% − 5.9% 2.6
Services not allocated 0.6 0.1% 183.3% 21.2% 0.2 0.0% 45.6% − 15.9% 0.4
Commercial services 823.9 99.1% 7.7% 7.9% 680.6 99.3% 14.2% 9.5% 143.3
EBOPS: Extended Balance of Payments Services classification.
n.i.e. = not included elsewhere.
Commercial services = services excluding government services n.i.e.
CAGR (compound annual growth rate) is the rate at which the initial value had to grow every year in a time period to obtain the final value.
Source : Eurostat (bop_its6_det).
Exports ImportsEBOPS

53EU TRADE
EU-28 trade balance in goods by partner (billion EUR)
Country 2006 2007 2008 2009 2010 2011 2012 2013 2014 2015 2016
Extra EU-28 − 215.8 − 215.9 − 276.1 − 141.7 − 177.5 − 175.5 − 113.8 48.9 10.7 59.9 36.9
Argentina − 2.5 − 2.6 − 4.6 − 3.4 − 1.9 − 2.4 − 1.4 1.9 0.5 1.0 0.3
Australia 8.7 10.4 12.9 12.0 14.5 16.2 19.4 21.9 20.4 21.9 19.3
Brazil − 9.6 − 11.6 − 9.7 − 4.5 − 2.3 − 4.2 1.7 6.6 5.7 3.4 1.5
Canada 5.4 1.1 0.4 2.6 2.0 − 0.8 1.1 4.3 4.2 6.8 6.1
China − 132.1 − 162.0 − 170.8 − 132.9 − 170.5 − 158.6 − 147.9 − 132.0 − 137.5 − 180.3 − 174.4
India 1.6 2.5 1.7 2.0 1.5 0.7 1.1 − 0.9 − 1.5 − 1.3 − 1.5
Indonesia − 7.3 − 7.4 − 7.7 − 6.5 − 7.6 − 8.9 − 5.8 − 4.7 − 4.9 − 5.4 − 4.2
Japan − 33.7 − 35.5 − 34.1 − 22.5 − 23.3 − 21.5 − 9.3 − 2.6 − 3.3 − 3.3 − 8.5
Mexico 8.6 8.8 8.0 5.8 7.6 6.9 8.4 9.9 10.4 14.1 14.1
Russia − 71.2 − 58.5 − 75.5 − 53.9 − 75.8 − 92.7 − 91.7 − 87.5 − 79.2 − 62.7 − 46.4
Saudi Arabia − 6.0 1.3 − 0.9 7.3 6.9 − 2.0 − 4.5 3.5 6.4 18.8 14.9
South Africa − 0.3 − 1.6 − 4.0 − 3.4 0.9 4.5 5.1 8.9 4.8 6.0 0.1
South Korea − 18.1 − 17.0 − 14.2 − 10.9 − 11.6 − 3.8 − 0.2 4.1 4.4 5.4 3.1
Turkey 8.1 5.5 8.2 8.0 18.9 24.5 26.7 27.0 20.3 17.3 11.3
United States 96.4 82.2 65.3 48.5 68.5 70.0 84.2 90.2 102.2 122.0 114.3
Source : Eurostat (Comext, Statistical regime 4).

54 Trade Statistical Guide - June 2017
EU-28 trade balance in services by partner (billion EUR)
Country 2005 2006 2007 2008 2009 2010 b 2011 2012 2013 2014 2015
Extra EU-28 53.3 71.0 87.0 71.3 83.0 108.2 134.6 164.9 177.7 170.4 145.9
Argentina 0.2 0.2 0.4 0.5 0.6 1.2 1.4 1.6 1.9 2.0 2.4
Australia 2.6 3.4 4.4 6.0 7.0 7.4 8.4 10.4 11.2 11.0 10.3
Brazil 0.7 0.9 2.0 3.8 3.5 8.5 9.9 8.9 8.7 7.9 6.9
Canada 1.6 2.1 2.2 2.5 4.2 4.8 5.2 5.7 6.0 5.1 5.9
China 2.6 2.0 2.6 5.1 4.9 2.2 3.9 5.5 6.4 6.8 10.9
India 0.3 1.6 1.5 0.8 1.8 − 0.8 − 2.6 − 1.2 − 0.9 0.7 0.8
Indonesia 0.1 0.4 0.9 0.8 1.0 1.4 1.5 1.5 1.9 1.9 1.9
Japan 7.2 5.6 6.0 3.4 5.3 5.0 4.7 9.2 9.6 11.1 12.1
Mexico 0.9 1.7 1.4 1.3 1.7 2.7 3.5 4.0 4.2 4.3 4.4
Russia 2.6 4.1 7.1 7.6 7.3 9.9 12.8 15.4 17.0 17.4 13.6
Saudi Arabia : 4.4 6.5 4.2 5.9 4.4 4.2 5.1 6.6 6.5 7.8
South Africa 1.0 1.3 1.9 1.9 1.9 2.3 3.0 3.1 2.8 2.7 2.7
South Korea 2.1 2.7 3.2 3.1 2.8 2.7 3.3 4.1 5.1 6.1 4.8
Turkey − 6.9 − 5.0 − 5.2 − 5.9 − 4.8 − 6.1 − 5.9 − 5.1 − 4.8 − 5.0 − 4.1
United States 5.2 8.6 9.2 0.0 − 2.1 − 2.4 7.1 14.3 17.5 9.9 13.0
(*) Until 2009: EU-27/BPM5. From 2010: EU-28/BPM6
Source : Eurostat (bop_its_tot, bop_its6_tot).

55EU TRADE
EU-28 trade balance in goods and services by partner (billion EUR)
Country 2006 2007 2008 2009 2010 2011 2012 2013 2014 2015
Extra EU-28 − 144.8 − 128.8 − 204.8 − 58.6 − 69.3 − 40.8 51.0 226.7 181.1 205.8
Argentina − 2.4 − 2.2 − 4.1 − 2.8 − 0.7 − 1.0 0.2 3.8 2.5 3.4
Australia 12.0 14.8 18.9 19.0 21.9 24.6 29.8 33.1 31.4 32.2
Brazil − 8.7 − 9.7 − 5.9 − 1.0 6.2 5.8 10.6 15.3 13.6 10.3
Canada 7.4 3.4 2.8 6.8 6.8 4.3 6.9 10.4 9.4 12.8
China − 130.1 − 159.4 − 165.7 − 128.0 − 168.2 − 154.7 − 142.4 − 125.6 − 130.8 − 169.3
India 3.2 4.0 2.5 3.8 0.7 − 1.8 − 0.1 − 1.8 − 0.8 − 0.6
Indonesia − 7.0 − 6.5 − 6.9 − 5.5 − 6.2 − 7.5 − 4.3 − 2.8 − 3.0 − 3.5
Japan − 28.0 − 29.5 − 30.7 − 17.2 − 18.3 − 16.8 − 0.1 7.0 7.8 8.8
Mexico 10.3 10.2 9.2 7.6 10.3 10.4 12.5 14.1 14.7 18.6
Russia − 67.1 − 51.5 − 67.9 − 46.6 − 65.8 − 79.9 − 76.3 − 70.5 − 61.8 − 49.1
Saudi Arabia : 7.8 3.3 13.2 11.3 2.1 0.5 10.1 12.8 26.6
South Africa 1.0 0.3 − 2.2 − 1.5 3.1 7.5 8.2 11.7 7.5 8.7
South Korea − 15.4 − 13.8 − 11.2 − 8.1 − 8.9 − 0.5 3.9 9.2 10.5 10.2
Turkey 3.1 0.2 2.3 3.2 12.8 18.6 21.6 22.2 15.3 13.2
United States 105.0 91.4 65.3 46.4 66.1 77.1 98.5 107.7 112.1 135.1
Until 2009: EU-27/BPM5. From 2010: EU-28/BPM6
(:) not available.
Sources : Eurostat (Comext, Statistical regime 4), Eurostat (bop_its_tot, bop_its6_tot).

56 Trade Statistical Guide - June 2017
EU-28 trade in goods by FTA partner, 2016 (billion EUR, %)
Value Share in EU exportsGrowth
2015-2016CAGR
2006-2016Value Share in EU imports
Growth2015-2016
CAGR2006-2016
FTA implemented 569.7 32.6% -1.6% 4.6% 478.2 28.0% 2.4% 1.9%Central America (*) 5.3 0.3% -7.8% 0.7% 5.4 0.3% 3.9% 0.5%Chile 8.6 0.5% 2.6% 7.2% 7.4 0.4% -10.2% -5.1%Colombia-Peru-Ecuador 10.7 0.6% -12.7% 8.0% 13.2 0.8% -7.8% 4.1%EFTA (*) 195.8 11.2% -3.6% 4.1% 188.6 11.0% 4.3% 1.9%EPAs (implemented) (*) 14.6 0.8% -5.4% 4.2% 18.5 1.1% -2.5% 0.8%EuroMed (*) 104.8 6.0% 2.9% 5.5% 60.4 3.5% -6.3% 0.0%Georgia 2.0 0.1% 6.7% 7.8% 0.6 0.0% -25.1% 1.5%Mexico 33.9 1.9% 0.9% 5.9% 19.8 1.2% 1.6% 6.5%Moldova 2.0 0.1% -2.1% 5.5% 1.3 0.1% 7.7% 9.7%South Africa 23.0 1.3% -9.7% 1.5% 22.9 1.3% 18.0% 1.3%South Korea 44.5 2.6% -6.9% 6.9% 41.4 2.4% -2.2% 0.1%Turkey 78.0 4.5% -1.2% 4.5% 66.7 3.9% 8.2% 4.8%Ukraine 16.5 0.9% 17.5% -1.0% 13.1 0.8% 2.0% 2.8%Western Balkans (*) 26.0 1.5% 6.0% 6.3% 17.7 1.0% 9.9% 9.2%Others implemented (*) 4.1 0.2% 4.4% 3.9% 1.2 0.1% 15.5% -5.5%
FTA concluded 100.4 5.8% -1.4% 27.0% 99.0 5.8% -3.8% 21.0%Canada 35.2 2.0% 0.2% 3.1% 29.1 1.7% 2.7% 3.5%Singapore 31.4 1.8% 5.9% 4.8% 19.5 1.1% 2.7% 0.1%Vietnam 9.3 0.5% 10.7% 14.6% 33.1 1.9% 10.3% 16.9%EPAs (concluded) (*) 24.4 1.4% -14.6% 4.4% 17.4 1.0% -32.1% 0.5%
FTA future 689.4 39.5% -3.7% 73.8% 515.6 30.2% -1.6% 20.6%
Angola 3.4 0.2% -30.2% 1.1% 4.2 0.2% -47.5% 6.9%Armenia 0.6 0.0% -4.6% 2.3% 0.3 0.0% 9.9% -0.1%Australia 32.4 1.9% 2.9% 4.1% 13.1 0.8% 36.6% 0.0%EPAs (future) (*) 9.3 0.5% -8.3% 4.6% 6.5 0.4% -24.8% 2.3%GCC (*) 100.8 5.8% -9.6% 6.3% 37.8 2.2% -13.8% 0.5%India 37.7 2.2% -1.0% 4.5% 39.3 2.3% -0.5% 5.7%Japan 58.1 3.3% 2.7% 2.6% 66.6 3.9% 11.2% -1.6%Lybia 3.4 0.2% -17.2% -0.7% 4.9 0.3% -35.2% -15.4%Malaysia 13.2 0.8% -1.1% 2.7% 22.2 1.3% -2.5% 2.2%Mercosur (*) 43.2 2.5% -12.2% 4.8% 41.7 2.4% -5.9% 0.0%Myanmar 0.6 0.0% 3.5% 21.5% 1.0 0.1% 46.0% 12.4%New Zealand 4.7 0.3% 1.4% 5.3% 3.4 0.2% -3.6% 1.2%Philippines 6.2 0.4% 0.6% 5.2% 6.6 0.4% -5.1% -0.3%Thailand 13.6 0.8% 1.8% 6.4% 20.3 1.2% 3.9% 3.2%United States 362.2 20.8% -2.5% 3.1% 247.8 14.5% -0.6% 3.8%
PartnersExports Imports

57EU TRADE
EU-28 FTA regions(*) Definition of regions or groups members: - Central America includes Costa Rica, El Salvador, Guatemala, Honduras, Nicaragua and Panama. - EFTA includes Iceland, Liechtenstein, Norway and Switzerland. - EPAs (implemented) includes :
• West Africa: Ghana and Ivory Coast; • Cariforum: Antigua and Barbuda, Bahamas, Barbados, Belize, Dominica, Dominican Republic, Grenada, Guyana, Haiti, Jamaica, Saint Christopher and Nevis, Saint
Lucia, Saint Vincent and the Grenadines, Suriname and Trinidad and Tobago; • Eastern and Southern Africa (ESA): Madagascar, Mauritius, Seychelles and Zimbabwe; • Pacific: Fiji and Papua New Guinea; • Southern African Development Community (SADC): Botswana, Lesotho, Namibia and Swaziland; • Central Africa: Cameroon.
- EuroMed includes Algeria, Egypt, Israel, Jordan, Lebanon, Morocco, Occupied Palestinian Territories, Syria and Tunisia. - Western Balkans includes Albania, Bosnia and Herzegovina, the former Yugoslav Republic of Macedonia, Montenegro, Serbia, Kosovo. - Others implemented includes: Andorra, Faroe Isles, Kyrgyz Republic, San Marino, Tadjikistan and Uzbekistan. - EPAs (concluded) includes :
• Cariforum: Haiti; • Eastern African Community (EAC): Burundi, Kenya, Rwanda, Tanzania and Uganda; • West Africa: Benin, Burkina Faso, Cape Verde, Gambia, Guinea, Guinea-Bissau, Liberia, Mali, Niger, Nigeria, Senegal, Sierra Leone, Togo and Mauritania; • SADC: Mozambique.
- EPAs (future) includes :
• Central Africa: Chad, Central African Republic, Equatorial Guinea, Sao Tome and Principe, Gabon, Congo and the Democratic Republic of Congo; • Eastern and Southern Africa: Comoros, Djibouti, Erithea, Ethiopia, Malawi, Sudan, Zambia; • Pacific: Cook Islands, Kiribati, Marshall Islands, Micronesia, Naura, Niue, Palau, Samoa, Solomon Islands, Tonga, Tuvalu, Vanuatu.
- Gulf Cooperation Council (GCC) includes Bahrain, Kuwait, Oman, Qatar, Saudi Arabia and United Arab Emirates. - Mercosur includes Argentina, Brazil, Paraguay, Uruguay and Venezuela. The FTA classification was carried out according to the documents "Overview of Economic Partnership Agreements" and "Overview of FTA and Other Trade Negotiations" available in DG Trade's extranet and to the document "Trade agreements in force and under negociation". CAGR (compound annual growth rate) is the rate at which the initial value had to grow every year in a time period to obtain the final value.
Source: Eurostat (Comext, statistical regime 4).
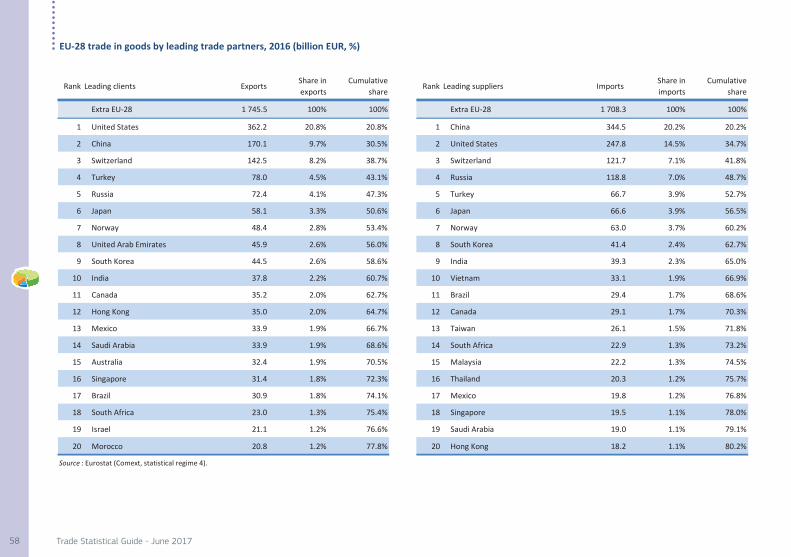
58 Trade Statistical Guide - June 2017
EU-28 trade in goods by leading trade partners, 2016 (billion EUR, %)
Rank Leading clients ExportsShare inexports
Cumulative share
Rank Leading suppliers Imports Share inimports
Cumulative share
Extra EU-28 1 745.5 100% 100% Extra EU-28 1 708.3 100% 100%
1 United States 362.2 20.8% 20.8% 1 China 344.5 20.2% 20.2%
2 China 170.1 9.7% 30.5% 2 United States 247.8 14.5% 34.7%
3 Switzerland 142.5 8.2% 38.7% 3 Switzerland 121.7 7.1% 41.8%
4 Turkey 78.0 4.5% 43.1% 4 Russia 118.8 7.0% 48.7%
5 Russia 72.4 4.1% 47.3% 5 Turkey 66.7 3.9% 52.7%
6 Japan 58.1 3.3% 50.6% 6 Japan 66.6 3.9% 56.5%
7 Norway 48.4 2.8% 53.4% 7 Norway 63.0 3.7% 60.2%
8 United Arab Emirates 45.9 2.6% 56.0% 8 South Korea 41.4 2.4% 62.7%
9 South Korea 44.5 2.6% 58.6% 9 India 39.3 2.3% 65.0%
10 India 37.8 2.2% 60.7% 10 Vietnam 33.1 1.9% 66.9%
11 Canada 35.2 2.0% 62.7% 11 Brazil 29.4 1.7% 68.6%
12 Hong Kong 35.0 2.0% 64.7% 12 Canada 29.1 1.7% 70.3%
13 Mexico 33.9 1.9% 66.7% 13 Taiwan 26.1 1.5% 71.8%
14 Saudi Arabia 33.9 1.9% 68.6% 14 South Africa 22.9 1.3% 73.2%
15 Australia 32.4 1.9% 70.5% 15 Malaysia 22.2 1.3% 74.5%
16 Singapore 31.4 1.8% 72.3% 16 Thailand 20.3 1.2% 75.7%
17 Brazil 30.9 1.8% 74.1% 17 Mexico 19.8 1.2% 76.8%
18 South Africa 23.0 1.3% 75.4% 18 Singapore 19.5 1.1% 78.0%
19 Israel 21.1 1.2% 76.6% 19 Saudi Arabia 19.0 1.1% 79.1%
20 Morocco 20.8 1.2% 77.8% 20 Hong Kong 18.2 1.1% 80.2%
Source : Eurostat (Comext, statistical regime 4).

59EU TRADE
EU-28 trade in services by leading trade partners, 2015 (billion EUR, %)
Rank Leading clients ExportsShare inexports
Cumulative share
Rank Leading suppliers Imports Share inimports
Cumulative share
Extra EU-28 831.5 100% 100% Extra EU-28 685.7 100% 100%
1 United States 225.8 27.2% 27.2% 1 United States 212.8 31.0% 31.0%
2 Switzerland 116.6 14.0% 41.2% 2 Switzerland 72.5 10.6% 41.6%
3 China 37.3 4.5% 45.7% 3 Bermuda 26.4 3.9% 45.5%
4 Norway 28.0 3.4% 49.0% 4 China 26.4 3.8% 49.3%
5 Japan 28.0 3.4% 52.4% 5 Singapore 21.5 3.1% 52.4%
6 Singapore 25.6 3.1% 55.5% 6 Bahamas 18.1 2.6% 55.1%
7 Russia 25.3 3.0% 58.5% 7 Turkey 16.4 2.4% 57.5%
8 Australia 19.8 2.4% 60.9% 8 Norway 16.2 2.4% 59.8%
9 Canada 18.0 2.2% 63.1% 9 Japan 15.8 2.3% 62.2%
10 Brazil 15.6 1.9% 65.0% 10 India 13.7 2.0% 64.1%
11 India 14.4 1.7% 66.7% 11 Canada 12.1 1.8% 65.9%
12 United Arab Emirates 13.7 1.6% 68.3% 12 United Arab Emirates 11.8 1.7% 67.6%
13 Turkey 12.2 1.5% 69.8% 13 Russia 11.7 1.7% 69.3%
14 Hong Kong 11.1 1.3% 71.1% 14 Hong Kong 11.6 1.7% 71.0%
15 South Korea 11.1 1.3% 72.5% 15 Australia 9.5 1.4% 72.4%
16 Saudi Arabia 10.7 1.3% 73.8% 16 Brazil 8.7 1.3% 73.7%
17 Mexico 9.4 1.1% 74.9% 17 Jersey 7.3 1.1% 74.7%
18 South Africa 7.8 0.9% 75.8% 18 Cayman Isles 6.8 1.0% 75.7%
19 Israel 7.3 0.9% 76.7% 19 South Korea 6.3 0.9% 76.6%
20 Jersey 7.3 0.9% 77.6% 20 Thailand 5.7 0.8% 77.5%
Offshore financial centres 79.0 9.5% Offshore financial centres 113.1 16.5%
Source : Eurostat (bop_its6_tot).

60 Trade Statistical Guide - June 2017
TEC - Total EU exporting (*) enterprises and value and share of exporting SMEs to total, 2013
Exporting enterprises('000)
Export Value(€ billion)
Exporting enterprises (%)
Export value (%)
Germany 143.2 469.4 54.6% 19.0%
Italy 139.3 180.4 89.5% 49.1%Spain 130.0 88.1 64.4% 39.4%France 91.8 172.4 94.2% 37.9%United Kingdom 68.9 229.7 91.9% 23.5%Poland 37.1 38.8 92.8% 27.5%Netherlands 29.2 121.4 96.7% 41.2%Sweden 28.3 53.3 93.8% 27.5%Portugal 23.8 14.0 87.0% 49.0%Slovenia 20.0 6.4 31.5% 34.5%Belgium 18.2 99.8 66.8% 36.5%Austria 16.1 39.5 94.9% 36.5%Denmark 15.5 30.6 85.9% 32.7%Czech Republic 14.9 30.1 69.6% 17.3%Greece 12.8 14.7 52.0% 29.1%Finland 9.7 24.4 88.7% 28.7%Lithuania 8.7 10.9 97.5% 34.2%Hungary 8.5 18.5 94.4% 44.5%Bulgaria 8.1 8.9 94.2% 36.0%Romania 7.5 15.1 84.2% 28.3%Croatia 6.1 3.7 95.0% 36.3%Estonia 3.9 3.6 79.7% 71.1%Latvia 3.4 2.6 83.1% 42.4%Slovakia 3.3 10.3 87.5% 25.2%Cyprus 1.4 0.6 65.7% 56.1%Luxembourg 1.1 2.5 76.9% 26.6%Malta 0.7 1.5 94.8% 38.0%Ireland : : : :
Total EU 851.4 1 691.5 78.3% 30.9%(*) extra-EU exports.
Source : Eurostat (International Trade in Goods Statistics by Enterprise Characteristics).
Member StateTotal exports Extra-EU
Share of exporting SMEs to total exporting enterprises

61
TRADE BY MEMBER STATE

62 Trade Statistical Guide - June 2017
EU-28 trade in goods with extra EU-28 by Member State (billion EUR)
Exports by Member State of dispatch Imports by Member State of arrival
Member State 2012 2013 2014 2015 2016 2012 2013 2014 2015 2016
EU-28 1 684.9 1 736.4 1 702.9 1 789.2 1 745.2 1 798.8 1 687.4 1 692.2 1 729.2 1 708.3
Austria 38.8 39.5 40.4 41.2 40.5 32.7 32.3 31.8 32.7 31.3Belgium 104.0 105.4 104.1 100.6 99.4 110.8 114.2 119.7 125.8 122.6Bulgaria 8.5 8.9 8.3 8.0 7.5 10.5 10.4 10.0 9.4 8.7Croatia 4.0 3.6 3.8 4.0 4.3 6.1 5.5 4.1 4.1 4.6Cyprus 0.5 0.6 0.6 0.8 0.9 1.7 1.4 1.5 1.3 1.6Czech Republic 22.8 23.1 23.4 23.8 24.0 27.1 25.2 26.3 29.0 26.7Denmark 30.2 30.3 30.4 33.3 33.0 21.2 21.8 22.9 23.6 22.2Estonia 4.3 3.6 3.4 2.9 3.1 3.1 2.5 2.5 2.4 2.5Finland 26.3 25.1 23.9 22.2 21.2 22.1 19.7 18.4 14.7 14.8France 181.7 177.6 174.3 187.8 183.7 172.9 165.4 164.7 163.0 159.8Germany 471.0 469.4 476.4 503.0 501.5 327.6 314.3 313.8 326.0 320.6Greece 15.3 14.4 14.0 11.9 11.1 26.7 24.8 25.0 20.5 19.9Hungary 18.2 17.9 16.7 16.6 17.2 21.7 21.3 19.6 19.4 18.9Ireland 37.7 37.5 41.3 52.4 57.1 19.4 17.8 20.4 23.4 22.8Italy 178.3 180.4 180.0 186.3 184.1 177.5 160.8 153.0 153.1 144.2Latvia 4.0 3.7 3.5 3.4 3.3 2.9 2.7 2.6 2.7 2.5Lithuania 9.1 10.9 11.0 8.9 8.9 10.5 10.4 8.9 8.2 7.3Luxembourg 3.1 2.6 2.5 2.5 2.5 4.9 4.2 4.0 5.8 4.5Malta 2.0 1.5 1.1 1.3 1.7 1.2 1.3 1.9 1.8 2.5Netherlands 123.7 123.1 122.1 124.7 125.9 249.2 238.4 240.3 250.1 241.9Poland 34.3 38.6 37.4 37.1 37.4 50.0 48.5 51.1 51.9 49.7Portugal 13.1 14.0 14.0 13.6 12.5 16.1 15.9 14.9 14.2 13.6Romania 13.3 15.1 15.2 14.4 14.3 14.4 13.4 14.4 14.4 15.4Slovakia 10.0 11.0 10.2 9.9 10.2 15.8 15.8 14.8 14.1 13.5Slovenia 6.3 6.4 6.7 6.9 7.3 7.0 7.5 7.9 8.1 8.0Spain 83.5 88.8 88.5 89.0 86.8 120.2 114.8 115.3 110.4 107.2Sweden 57.7 53.4 51.5 52.4 51.5 41.8 37.7 38.1 37.5 36.6United Kingdom 183.0 229.8 198.2 230.5 194.4 283.4 239.4 244.3 261.7 284.2
Source : Eurostat (Comext, Statistical regime 4).

63TRADE BY MEMBER STATE
EU-28 trade in services with extra EU-28 by Member State (billion EUR)
Exports Imports
Member State 2011 2012 2013 2014 2015 2011 2012 2013 2014 2015
EU-28 615.2 684.9 721.3 772.5 831.5 480.5 520.0 543.5 602.2 685.7
Austria : 11.0 11.5 12.2 12.7 : 7.9 8.6 8.9 9.0Belgium 24.9 27.5 27.2 30.0 32.3 17.2 19.0 19.1 21.9 24.4Bulgaria 1.7 2.0 2.3 2.5 2.6 0.9 1.1 1.1 1.4 1.4Croatia 1.9 2.2 2.8 2.8 3.1 0.8 1.0 1.7 1.7 1.8Cyprus 3.7 4.0 4.0 4.1 3.8 1.9 1.9 2.2 2.2 2.2Czech Republic 5.5 6.1 5.4 5.6 6.1 4.2 4.8 4.7 4.8 5.5Denmark 26.9 29.9 30.1 30.6 30.7 20.2 21.9 22.3 22.5 23.7Estonia 1.2 1.4 1.6 1.8 1.7 0.5 0.6 0.8 0.9 0.8Finland : : 11.1 10.4 10.7 : : 7.8 7.6 8.3France 73.5 82.2 84.0 92.8 98.0 61.4 63.0 65.9 73.6 78.7Germany 86.6 96.4 100.5 107.6 120.5 89.8 99.4 106.2 108.5 118.0Greece 13.6 13.2 12.6 13.3 10.3 5.9 5.0 5.2 5.1 4.2Hungary 4.5 4.7 5.0 5.4 5.8 3.6 3.5 3.6 3.7 3.7Ireland : 36.6 41.2 47.2 56.0 : 46.7 48.7 63.6 97.3Italy 34.2 39.5 39.4 39.3 39.3 33.5 34.0 33.4 33.4 33.5Latvia 1.8 1.9 2.0 1.8 1.7 0.8 0.9 0.9 0.7 0.7Lithuania 1.9 2.4 2.5 2.7 2.3 1.3 1.4 1.6 1.8 1.6Luxembourg 14.7 16.7 19.2 21.5 25.2 14.6 17.3 20.9 23.4 24.4Malta 5.6 6.1 6.4 5.8 6.0 5.2 5.8 6.0 5.6 5.6Netherlands 57.9 61.5 64.4 73.3 77.0 49.8 52.2 54.3 76.2 88.9Poland 8.5 9.6 10.3 11.3 12.4 5.3 5.5 5.7 6.1 6.4Portugal : : : : : : : : : :Romania : : 2.6 3.1 3.4 : : 1.8 1.9 2.2Slovakia : : 1.3 1.4 1.5 : : 1.2 1.1 1.1Slovenia 0.9 1.0 1.1 1.2 1.3 0.8 0.9 0.8 0.9 1.0Spain : : 34.6 37.2 39.4 0 : 16.6 18.2 19.5Sweden 22.6 25.0 27.5 28.1 31.4 13.4 14.6 15.0 17.9 19.6United Kingdom 129.2 147.0 162.5 171.8 188.2 71.2 76.3 80.8 82.5 96.1
(:) not available (confidential data).
Source : Eurostat (bop_its6_tot).

64 Trade Statistical Guide - June 2017
Intra-EU merchandise trade by Member State, 2016 (%)
Member StateShare of intra-EU imports
in total imports Share of intra-EU exports
in total exportsShare of MS
in total intra-EU imports Share of MS
in total intra-EU exportsAustria 78.0 70.5 3.7 3.1
Belgium 63.5 72.4 7.0 8.4
Bulgaria 66.6 67.9 0.6 0.5
Croatia 76.9 65.5 0.5 0.3
Cyprus 73.8 46.8 0.1 0.0
Czech Republic 79.3 83.7 3.4 4.0
Denmark 71.3 61.7 1.8 1.7
Estonia 81.7 73.9 0.4 0.3
Finland 73.0 59.1 1.3 1.0
France 69.1 59.4 11.8 8.6
Germany 66.4 58.5 20.8 22.8
Greece 54.7 56.3 0.8 0.5
Hungary 77.6 81.4 2.2 2.4
Ireland 67.3 50.9 1.5 1.9
Italy 60.5 55.9 7.3 7.5
Latvia 80.5 70.2 0.3 0.2
Lithuania 70.4 60.7 0.6 0.4
Luxembourg 77.1 82.8 0.5 0.4
Malta 54.5 39.1 0.1 0.0
Netherlands 46.9 75.5 7.1 12.5
Poland 72.1 79.6 4.2 4.7
Portugal 77.7 75.2 1.6 1.2
Romania 77.1 75.1 1.7 1.4
Slovakia 80.2 85.4 1.8 1.9
Slovenia 70.9 75.3 0.6 0.7
Spain 61.7 66.6 5.7 5.6
Sweden 71.2 59.2 3.0 2.4
United Kingdom 50.5 47.5 9.6 5.6Source : Eurostat (Comext, Statistical regime 4).

65
SUPPORT STATISTICS

66 Trade Statistical Guide - June 2017
GDP (current price, billion EUR)
Country 2006 2007 2008 2009 2010 2011 2012 2013 2014 2015 2016
World 40 982 42 358 43 276 43 217 49 709 52 503 57 937 57 570 59 104 66 874 68 008
Argentina 185 210 247 240 320 379 451 460 424 569 492
Australia 623 693 719 715 943 1 081 1 215 1 137 1 091 1 108 1 137
Brazil 882 1 019 1 153 1 197 1 666 1 878 1 918 1 861 1 849 1 624 1 625
Canada 1 048 1 069 1 053 983 1 217 1 285 1 420 1 387 1 350 1 400 1 382
China 2 210 2 606 3 130 3 672 4 576 5 404 6 671 7 255 7 930 10 118 10 135
India 756 904 832 979 1 289 1 310 1 423 1 398 1 531 1 882 2 038
Indonesia 316 343 380 414 570 641 715 690 671 776 842
Japan 3 608 3 295 3 425 3 751 4 300 4 423 4 828 3 882 3 650 3 950 4 462
Mexico 770 761 749 642 793 841 924 950 977 1 037 945
Russia 847 1 019 1 213 942 1 236 1 460 1 689 1 680 1 553 1 231 1 157
Saudi Arabia 300 303 353 308 397 482 573 562 569 587 578
South Africa 216 218 195 213 283 299 308 277 265 284 266
South Korea 806 819 681 647 826 864 952 983 1 062 1 246 1 275
Turkey 439 493 520 462 583 598 680 716 703 774 775
United States 11 035 10 564 10 007 10 337 11 288 11 148 12 574 12 568 13 092 16 257 16 776
EU-28 12 255 12 980 13 054 12 274 12 825 13 186 13 456 13 559 14 002 14 715 14 824
France 1 853 1 946 1 997 1 936 2 000 2 058 2 088 2 115 2 141 2 181 2 225
Germany 2 393 2 513 2 563 2 457 2 582 2 702 2 760 2 826 2 925 3 033 3 132
Italy 1 549 1 610 1 633 1 571 1 606 1 637 1 614 1 605 1 622 1 646 1 672
United Kingdom 2 136 2 236 1 971 1 704 1 834 1 876 2 067 2 049 2 260 2 581 2 375
Sources: IMF (World Economic Outlook, April 2017), EUR/USD exchange rate from Eurostat.

67SUPPORT STATISTICS
GDP per capita (PPP)
Country 2006 2007 2008 2009 2010 2011 2012 2013 2014 2015 2016
World 10 904 11 675 12 216 12 193 12 853 13 558 14 084 14 635 15 216 15 676 :
Argentina 15 457 17 129 17 995 16 893 18 529 19 817 19 750 20 322 19 946 20 472 20 047
Australia 37 457 39 432 40 372 40 648 41 513 42 825 44 404 45 354 46 785 47 769 48 899
Brazil 11 709 12 607 13 363 13 308 14 340 15 071 15 499 16 078 16 307 15 729 15 242
Canada 37 781 39 202 39 944 38 615 39 844 41 524 42 537 43 784 45 203 45 702 46 437
China 5 848 6 821 7 583 8 303 9 252 10 290 11 252 12 265 13 327 14 328 15 399
India 3 227 3 587 3 748 4 041 4 445 4 749 4 997 5 341 5 751 6 193 6 616
Indonesia 6 569 7 070 7 637 7 943 8 433 8 974 9 554 10 108 10 661 11 155 11 720
Japan 33 197 34 641 34 952 33 347 35 157 35 775 37 060 38 478 39 364 40 312 41 275
Mexico 14 727 15 399 15 704 14 872 15 629 16 392 17 161 17 475 17 991 18 463 18 938
Russia 19 247 21 469 23 048 21 406 22 639 24 032 25 323 26 046 26 691 26 208 26 490
Saudi Arabia 42 573 43 051 45 109 43 057 44 163 48 288 50 384 51 167 52 637 54 949 55 158
South Africa 10 578 11 289 11 717 11 463 11 786 12 244 12 557 12 880 13 127 13 230 13 225
South Korea 24 501 26 394 27 464 27 725 29 738 31 229 32 362 33 684 35 211 36 390 37 740
Turkey 15 284 16 280 16 522 15 636 16 900 18 909 19 939 21 683 22 904 24 227 24 912
United States 46 352 47 955 48 302 46 909 48 310 49 734 51 403 52 742 54 560 56 175 57 436
EU-28 29 754 31 497 32 917 32 148 33 275 34 704 35 241 36 478 37 563 38 704 :
France 35 173 36 725 37 313 36 297 37 284 38 657 39 251 39 912 40 675 41 431 42 314
Germany 36 992 39 345 40 559 38 726 40 849 43 249 44 265 45 123 46 470 47 255 48 111
Italy 34 701 36 050 36 105 34 183 35 071 35 896 35 509 35 286 35 309 35 961 36 833
United Kingdom 34 886 36 435 36 615 35 049 35 869 36 853 37 774 38 873 40 474 41 478 42 481
PPP: current international USD.
(:) not available
Sources: IMF (World Economic Outlook, April 2017), World Bank WDI.

68 Trade Statistical Guide - June 2017
Share in world GDP (PPP, %)
Country 2006 2007 2008 2009 2010 2011 2012 2013 2014 2015 2016
World 100.0 100.0 100.0 100.0 100.0 100.0 100.0 100.0 100.0 100.0 100.0
Argentina 0.8 0.8 0.9 0.8 0.8 0.9 0.8 0.8 0.8 0.8 0.7
Australia 1.1 1.0 1.0 1.1 1.0 1.0 1.0 1.0 1.0 1.0 1.0
Brazil 3.0 3.0 3.1 3.1 3.1 3.1 3.1 3.1 3.0 2.8 2.6
Canada 1.7 1.6 1.6 1.5 1.5 1.5 1.5 1.5 1.5 1.4 1.4
China 10.5 11.3 12.1 13.2 13.9 14.6 15.3 16.0 16.6 17.1 17.8
India 5.0 5.2 5.2 5.7 6.0 6.1 6.2 6.4 6.7 7.0 7.2
Indonesia 2.0 2.0 2.1 2.2 2.2 2.3 2.4 2.4 2.4 2.5 2.5
Japan 5.8 5.6 5.3 5.1 5.0 4.8 4.7 4.7 4.5 4.5 4.4
Mexico 2.2 2.1 2.1 2.0 2.0 2.0 2.0 2.0 2.0 1.9 1.9
Russia 3.8 3.9 4.0 3.7 3.6 3.6 3.6 3.6 3.5 3.3 3.2
Saudi Arabia 1.4 1.3 1.4 1.4 1.4 1.4 1.5 1.5 1.5 1.5 1.5
South Africa 0.7 0.7 0.7 0.7 0.7 0.7 0.7 0.7 0.6 0.6 0.6
South Korea 1.6 1.6 1.6 1.6 1.7 1.6 1.6 1.6 1.6 1.6 1.6
Turkey 1.5 1.4 1.4 1.4 1.4 1.5 1.5 1.6 1.6 1.7 1.7
United States 18.9 18.2 17.6 17.2 16.8 16.4 16.2 16.0 15.8 15.7 15.5
EU-28 21.2 20.8 20.3 19.5 18.9 18.5 17.8 17.3 17.0 16.9 16.7
France 2.9 2.9 2.8 2.7 2.6 2.6 2.5 2.4 2.4 2.3 2.3
Germany 4.1 4.0 3.9 3.7 3.7 3.7 3.6 3.5 3.4 3.4 3.3
Italy 2.7 2.6 2.5 2.4 2.3 2.2 2.1 2.0 2.0 1.9 1.9
United Kingdom 2.9 2.8 2.7 2.6 2.5 2.5 2.4 2.4 2.4 2.4 2.3
PPP: current international USD.
Source: IMF (World Economic Outlook, April 2017).

69SUPPORT STATISTICS
Share in world GDP of selected countries (PPP, %)
PPP: current international USD.
Source : IMF (World Economic Outlook, April 2017).
21.2% 18.5% 16.7%
18.9% 16.4%
15.5%
10.5% 14.6% 17.8%
5.8% 4.8% 4.4%
5.0% 6.1% 7.2%
38.8% 39.6% 38.5%
2006 2011 2016
Rest of the world
India
Japan
China
United States
EU-28

70 Trade Statistical Guide - June 2017
Euro exchange rates with main national currencies (units of national currency per euro)
Country 2006 2007 2008 2009 2010 2011 2012 2013 2014 2015 2016
Argentine peso 3.8632 4.2715 4.6398 5.2112 5.1856 5.7440 5.8382 7.2743 10.7670 10.2528 16.3401
Australian dollar 1.6668 1.6348 1.7416 1.7727 1.4423 1.3484 1.2407 1.3777 1.4719 1.4777 1.4883
Brazilian real 2.7333 2.6633 2.6737 2.7674 2.3314 2.3265 2.5084 2.8687 3.1211 3.7004 3.8561
Canadian dollar 1.4237 1.4678 1.5594 1.5850 1.3651 1.3761 1.2842 1.3684 1.4661 1.4186 1.4659
Chinese renminbi-yuan 10.0096 10.4178 10.2236 9.5277 8.9712 8.9960 8.1052 8.1646 8.1857 6.9733 7.3522
Indian rupee 56.8435 56.4186 63.6143 67.3611 60.5878 64.8859 68.5973 77.9300 81.0406 71.1956 74.3717
Japanese yen 146.0200 161.2500 152.4500 130.3400 116.2400 110.9600 102.4900 129.6600 140.3100 134.3100 120.2000
Mexican peso 13.6936 14.9743 16.2911 18.7989 16.7373 17.2877 16.9029 16.9641 17.6550 17.6157 20.6673
Pound sterling 0.6817 0.6843 0.7963 0.8909 0.8578 0.8679 0.8109 0.8493 0.8061 0.7258 0.8195
Russian rouble 34.1117 35.0183 36.4207 44.1376 40.2629 40.8846 39.9262 42.3370 50.9518 68.0720 74.1446
South African rand 8.5312 9.6596 12.0590 11.6737 9.6984 10.0970 10.5511 12.8330 14.4037 14.1723 16.2645
South Korean won 1 198.58 1 272.99 1 606.09 1 772.90 1 531.82 1 541.23 1 447.69 1 453.91 1 398.14 1 256.54 1 284.18
Swiss franc 1.5729 1.6427 1.5874 1.5100 1.3803 1.2326 1.2053 1.2311 1.2146 1.0679 1.0902
Turkish lira 1.8090 1.7865 1.9064 2.1631 1.9965 2.3378 2.3135 2.5335 2.9065 3.0255 3.3433
US dollar 1.2556 1.3705 1.4708 1.3948 1.3257 1.3920 1.2848 1.3281 1.3285 1.1095 1.1069
Source : Eurostat (ert_bil_eur_a).

71SUPPORT STATISTICS
Bound and applied import duties - simple averages
All products Agricultural products Non-agricultural products
Bound Applied Bound Applied Bound Applied
Argentina 31.8 13.6 32.3 10.4 31.7 14.2
Australia 9.9 2.5 3.4 1.2 11.0 2.7
Brazil 31.4 13.5 35.4 10.0 30.8 14.1
Canada 6.8 4.2 16.6 16.7 5.3 2.2
China 10.0 9.9 15.7 15.6 9.2 9.0
India 48.5 13.4 113.5 32.7 34.5 10.1
Indonesia 37.1 6.9 47.1 7.6 35.6 6.7
Japan 4.4 4.0 16.6 12.9 2.5 2.5
Mexico 36.2 7.1 45.0 15.6 34.8 5.7
Russia 7.6 7.8 11.0 10.8 7.1 7.3
Saudi Arabia 11.1 5.1 15.8 6.0 10.5 5.0
South Africa 19.0 7.6 40.4 8.5 15.7 7.5
South Korea 16.8 13.9 57.9 56.8 10.2 6.8
Turkey 28.6 10.8 61.0 42.7 17.0 5.5
United States 3.5 3.5 4.8 5.2 3.3 3.2
EU-28 4.8 5.1 10.9 10.7 3.9 4.2
Simple average of ad valorem duties or, where available, ad valorem equivalents (AVEs).
Applied tariffs: 2015.
Source : WTO Tariff Profiles.

HOW TO OBTAIN EU PUBLICATIONS
Free publications:• via EU Bookshop (http://bookshop.europa.eu);• at the European Union’s representations or delegations. You can obtain
their contact details on the Internet (http://ec.europa.eu) or by sending a fax to +352 2929-42758.
Priced publications:• via EU Bookshop (http://bookshop.europa.eu).
Priced subscriptions (e.g. annual series of the Official Journal of the European Union and reports of cases before the Court of Justice of the European Union):
• via one of the sales agents of the Publications Office of the European Union (http://publications.europa.eu/others/agents/index_en.htm).

This Trade Statistical Guide contains selected tables and graphs that outline the current state of and recent developments in the European Union’s (EU’s) foreign trade, i.e. its trade with the rest of the world. It has been compiled for the benefit of the Directorate-General for Trade’s (DG Trade’s) policymakers.
Trade
DOI 10.2781/229117ISBN 978-92-79-68452-4
NG
-AA-17-001-EN-N