european tissue outlook - confederation of european paper ... · european tissue market outlook...
TRANSCRIPT

European Tissue Market Outlook
Esko UutelaPrincipal, Tissue, RISI
CEPI European Paper Week, Brussels, BelgiumNovember 29, 2017
© Copyright 2017 RISI, Inc. | Proprietary Information

• Educational background in forestry, economics and business studies
• In consulting business and information services for the forest industry since 1976
• Cooperating with RISI since 2007• Developed global tissue databases and
forecasting models• Previous experience in graphic papers,
packaging papers and recovered paper• Assisted by RISI Asian, European and
American colleagues and consultants• Produced more than 200 single‐client and
multi‐client tissue studies
Principal, Tissue
Esko Uutela
© Copyright 2017 RISI, Inc. | Proprietary Information 2

Agenda• Europe in the Global Context
• Recent European Market Trends
• Demand Outlook for Europe
• Capacity Changes
• Demand/Supply Outlook
• Concluding Remarks
© Copyright 2017 RISI, Inc. | Proprietary Information 3

EUROPE IN THE GLOBAL CONTEXT
© Copyright 2017 RISI, Inc. | Proprietary Information 4

World Tissue Consumption by RegionChina has passed Western Europe in market size, while Asia Far East is—and Eastern Europe soon will be— larger than Japan. Europe accounts for about 24% of the global market.
N. America 25.0%
China21.3%
W. Europe18.3%
L. America11.1%
Asia Far East6.0%
Japan5.5%
E.Europe5.4%
N&M East4.1%
Africa2.1%
Oceania1.2%
Global Consumption: 36.4 Million Tonnes (2016)
© Copyright 2017 RISI, Inc. | Proprietary Information
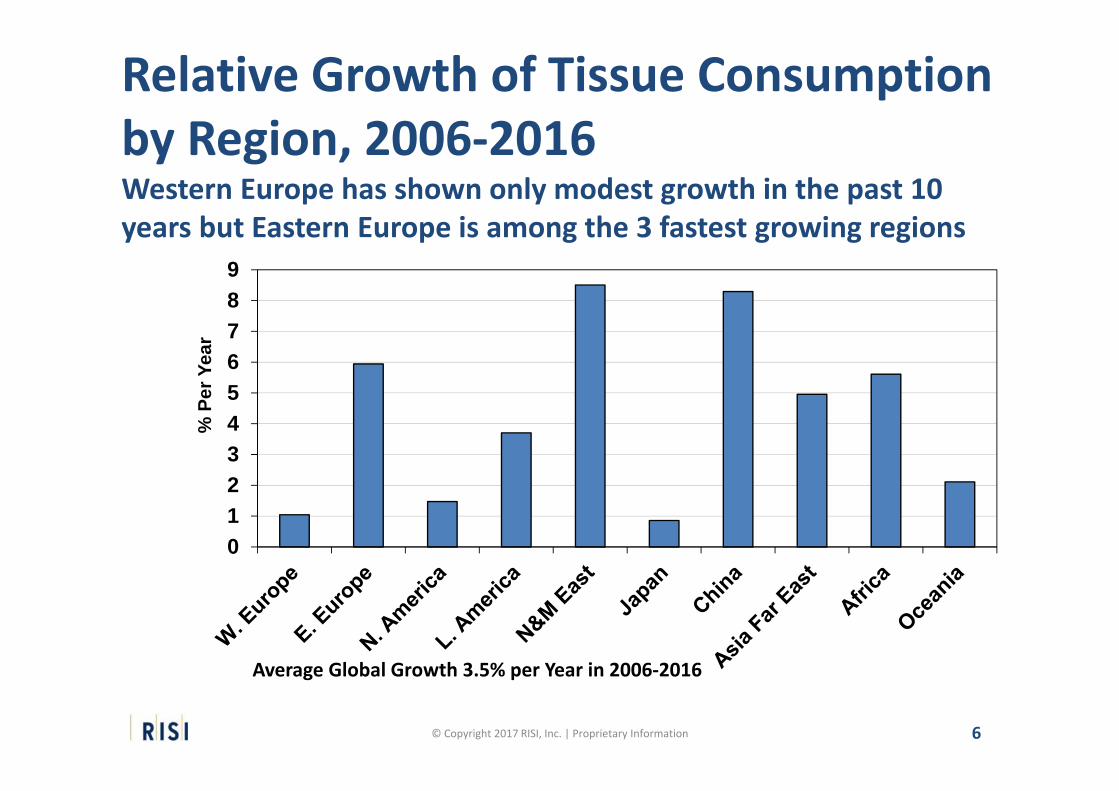
Relative Growth of Tissue Consumption by Region, 2006‐2016Western Europe has shown only modest growth in the past 10 years but Eastern Europe is among the 3 fastest growing regions
0123456789
% P
er Y
ear
Average Global Growth 3.5% per Year in 2006‐2016
© Copyright 2017 RISI, Inc. | Proprietary Information 6

Regional Volume Growth of Tissue Consumption, 2006‐2016China dominates the volume growth, European growth 1.5 million tonnes in the past 10 years
0
1 000
2 000
3 000
4 000
5 000
Thou
sand
Ton
nes
More than40% of global growth in China!
Total Global Growth: 10.5 Million Tonnes (1,048,000 Tonnes per Year) © Copyright 2017 RISI, Inc. | Proprietary Information 7
RECENT EUROPEAN MARKET TRENDS
© Copyright 2017 RISI, Inc. | Proprietary Information 8

Main European Tissue Markets, 2016The four largest markets account for half of European tissue consumption, only two Eastern countries on the top 10 list
Germany17%
UK13%
France10%
Iberian Peninsula
10%
Italy10%
Russia6%Poland
6%
Nordic Countries6%
Benelux5%
Greece2%
All Others15%
Total Market Size: 8.65 Million Tonnes © Copyright 2017 RISI, Inc. | Proprietary Information 9

Western European Tissue Market Showed Positive Recovery in 2015, 2016 DisappointingMajor variations in growth from year to year
-2.0
-1.5-1.0-0.5
0.00.51.0
1.52.0
2.53.03.5
4.0
Gro
wth
Rat
e, %
/a
Recession over but noconstant return to past
growth rates
© Copyright 2017 RISI, Inc. | Proprietary Information 10

Relative Growth of WE Tissue Markets by Main Country, 2006‐2016In the past 10 years, growth has been fastest in smaller markets Malta, Ireland and Austria and slowest in the large markets
-101234567
Gro
wth
, % P
er Y
ear
© Copyright 2016 RISI, Inc. | Proprietary Information11© Copyright 2017 RISI, Inc. | Proprietary Information

Volume Growth of WE Tissue Markets by Main Country, 2006‐2016In the past 10 years, growth has been strongest in Germany, followed by the UK and France
0
20
40
60
80
100
120
140
Thou
sand
Ton
nes
© Copyright 2016 RISI, Inc. | Proprietary Information12© Copyright 2017 RISI, Inc. | Proprietary Information
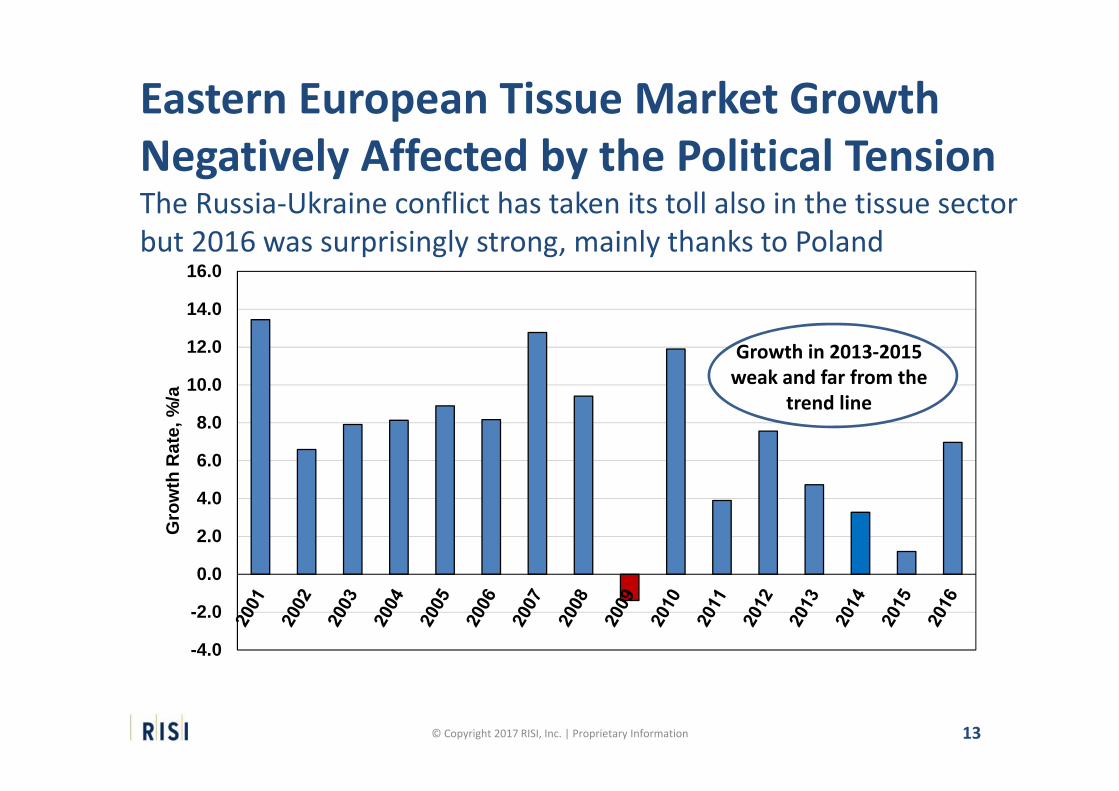
Eastern European Tissue Market Growth Negatively Affected by the Political TensionThe Russia‐Ukraine conflict has taken its toll also in the tissue sector but 2016 was surprisingly strong, mainly thanks to Poland
-4.0
-2.0
0.0
2.0
4.0
6.0
8.0
10.0
12.0
14.0
16.0
Gro
wth
Rat
e, %
/a
Growth in 2013‐2015 weak and far from the
trend line
© Copyright 2017 RISI, Inc. | Proprietary Information 13
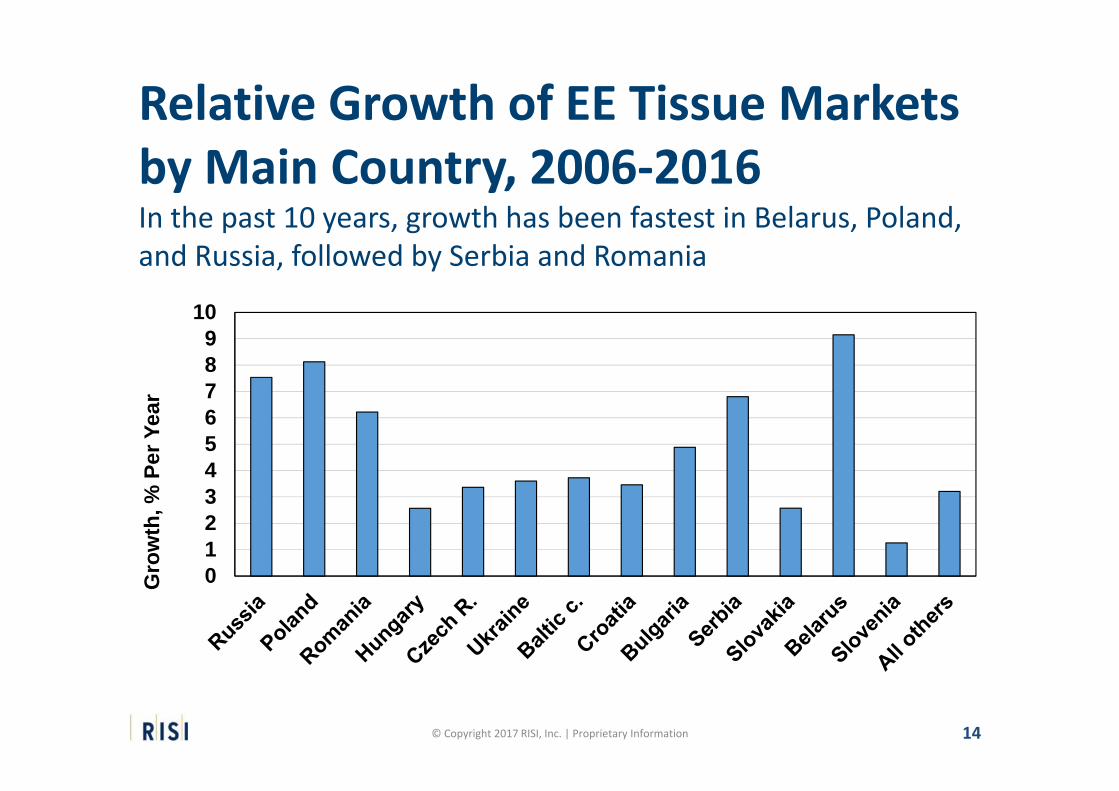
Relative Growth of EE Tissue Markets by Main Country, 2006‐2016In the past 10 years, growth has been fastest in Belarus, Poland, and Russia, followed by Serbia and Romania
0123456789
10
Gro
wth
, % P
er Y
ear
© Copyright 2016 RISI, Inc. | Proprietary Information14© Copyright 2017 RISI, Inc. | Proprietary Information

Volume Growth of EE Tissue Markets by Main Country, 2006‐2016In the past 10 years, Russia and Poland have clearly been driving the growth, followed by Romania and Ukraine but far behind
0
50
100
150
200
250
300
Thou
sand
Ton
nes
© Copyright 2016 RISI, Inc. | Proprietary Information15© Copyright 2017 RISI, Inc. | Proprietary Information

DEMAND OUTLOOK FOR EUROPE
© Copyright 2017 RISI, Inc. | Proprietary Information 16

Growth Rate of Western European Tissue Consumption, 2014‐2020We expect relatively slow growth to continue in the next years
0
0.5
1
1.5
2
2.5
3
2014 2015 2016 2017 2018 2019 2020
Forecast
17© Copyright 2017 RISI, Inc. | Proprietary Information

Volume Growth of WE Tissue Markets by Main Country, 2016‐2021In the next five years, volume growth will be largest in France, followed by the UK, Germany and Italy
0
20
40
60
80
100
120
Thou
sand
Ton
nes
© Copyright 2016 RISI, Inc. | Proprietary Information18© Copyright 2017 RISI, Inc. | Proprietary Information

Growth Rate of Eastern European Tissue Consumption, 2014‐2020The outlook is rather optimistic for tissue market growth in the next few years
0
1
2
3
4
5
6
7
8
2014 2015 2016 2017 2018 2019 2020
Forecast
19© Copyright 2017 RISI, Inc. | Proprietary Information

Volume Growth of EE Tissue Markets by Main Country, 2016‐2021In the next five years, volume growth will be largest in Russia, followed by Poland, Romania and Ukraine
020406080
100120140160180200
Thou
sand
Ton
nes
© Copyright 2016 RISI, Inc. | Proprietary Information20© Copyright 2017 RISI, Inc. | Proprietary Information

CAPACITY CHANGES
© Copyright 2017 RISI, Inc. | Proprietary Information 21

Major Capacity Changes (>10,000 t/a) in the WE Tissue Industry, 20152015:• Cominter Tisú, Hernani, Spain 22,000 t/a• Confidential 17,000 t/a• Cartiera della Basilica (Eurovast), Bagni di Lucca, Italy (25K‐9K) 16,000 t/a• Fortissue (SUAVECEL), Viano de Castelo, Portugal 30,000 t/a• Fourstones, Sapphire, Leslie, Scotland, UK 26,000 t/a• Viochartiki, Aspropyrgos, Greece ‐16,000 t/a • Cartiera Eurotec, Fabbriche di Vallico, Lucca, Italy ‐18,000 t/a• WEPA Group, Bousbecque, Lille, France 32,000 t/a• Athens Paper Mill, Athens ‐50,000 t/a• Papergroup, San Gennaro, Collodi, Lucca, Italy 26,000 t/a• SCA Hygiene Products, Stubbins, UK ‐35,000 t/a• AMS Paper (The Navigator Co.) , Vila Velho de Rodao, Portugal 32,000 t/a• SCA France, New Orléans, France ‐35,000 t/a• WEPA, Giershagen, Germany 32,000 t/a
79,000 t/a© Copyright 2014 RISI, Inc. All rights reserved.
22

Major Capacity Changes (>10,000 t/a) in the WE Tissue Industry, 2016‐20172016:• Cartiera del Borgo (Eurovast), Fabbriche di Vallico, Lucca, Italy 20,000 t/a• SCA Hygiene Products, Mediona, Spain ‐45,000 t/a• SCA France, Hondouville, France ‐21,000 t/a• Several Rebuilds by Different Companies 33,000 t/a
‐13,000 t/a2017:• Paper Prime (Trevipapel), Vila Velho de Rodao, Portugal 32,000 t/a• Renova, Torres Novas, Portugal (NTT) 35,000 t/a• Ariete, Cava de Tirreni, Salerno, Italy 25,000 t/a• Cartiere della Basilica, Botticino, Italy 15,000 t/a• SCA, Stubbins, UK ‐20,000 t/a
87,000 t/a
© Copyright 2014 RISI, Inc. All rights reserved.23© Copyright 2017 RISI, Inc. | Proprietary Information

Major Capacity Changes (>10,000 t/a) in the WE Tissue Industry, 2018‐20202018:• SCA, Chesterfield, UK (TAD PM rebuild and restart) 28,000 t/a• Goma‐Camps, Ejeo de Caballeros, Spain, Italy 34,000 t/a• The Navigator Company, Cacia, Aveiro, Portugal 70,000 t/a• Ibertissue (Sofidel), Bunuel, Spain 70,000 t/a• ICT Iberica, El Burgo del Ebro, Zaragoza, Spain 70,000 t/a
272,000 t/aPotential Projects (2019‐2020):• Accrol Paper, Blackburn, Lancashire, UK 60,000 t/a• Confidential, Central Europe 65,000 t/a• Delipapier, Ingrandes, France 60,000 t/a
185,000 t/a
© Copyright 2014 RISI, Inc. All rights reserved.24

Major Capacity Changes (>5,000 t/a) in the EE Tissue Industry, 2015
2015:• Interpaper, Munix, Belarus ‐6,000 t/a• AB Grigiskes, Traku, Vilnius, Lithuania (30K‐9K) 21,000 t/a• Claire’s, Nikopol, Bulgaria 16,000 t/a• Fabryka Papieru Kaczory, Margonin, Poland 21,000 t/a • GZP, Niedomeckie, Poland 6,000 t/a• LLC Pulp Invest, Kazan, Tatarstan, Russia 27,000 t/a• Fabryka Papieru i Textury Beskidy, Wadovice, Poland 17,000 t/a• Syassky, Syasstroy, Russia ‐20,000 t/a• ICT Poland, Kostrzyn, Poland 70,000 t/a• SC Metalplas Impex (MG Tec Group), Dej, Romania 30,000 t/a
182,000 t/a
© Copyright 2014 RISI, Inc. All rights reserved.25

Major Capacity Changes (>5,000 t/a) in the EE Tissue Industry, 2016‐20172016:• Firma W. Lewandovski, Wloclawek, Poland (20K‐15K) 5,000 t/a• Syassky, Syasstroy, Russia 38,000 t/a• Tissue Paper, Tbilisi, Georgia 7,000 t/a• JSC Kohavian Paper Factory, Gnezdytchiv, Ukraine 5,000 t/a
55,000 t/a2017:• Novak‐Papir, Peruc, Slavatien, Czech R. 10,000 t/a• Drenik, Belgrade, Serbia 10,000 t/a• Kostenets HHI, Kostenets, Bulgaria ‐26,000 t/a• Kuban‐Papir, Krasnodar, Russia 8,000 t/a• Pol‐Mak, Przemierovo, Poland 25,000 t/a• WEPA Professional, Piechowice, Poland 32,000 t/a• Delitissue (Sofidel), Ciechanow, Poland 70,000 t/a• Velvet CARE, Klucze, Poland 60,000 t/a
189,000 t/a
© Copyright 2014 RISI, Inc. All rights reserved.26

Major Capacity Changes (>5,000 t/a) in the EE Tissue Industry, 20182018:• Vajda Papier, Dunaföldvar, Hungary 32,000 t/a• Arkhbum Tissue Group, Vorsino, Kaluga, Russia 70,000 t/a• Drenik ND, Belgrade, Serbia 30,000 t/a• Hayat Kimya Group, Alabuga, Tatarstan, Russia 70,000 t/a
202,000 t/a
© Copyright 2014 RISI, Inc. All rights reserved.27

DEMAND/SUPPLY OUTLOOK
© Copyright 2017 RISI, Inc. | Proprietary Information 28

Net Capacity Change* and Tissue Capacity Utilization in Western Europe until 2021Capacity closures helped the industry in 2011‐2013 but new projects thereafter cut the trend, outlook is not promising for 2018‐2019
8485868788899091929394
-50
0
50
100
150
200
Cap
acity
Util
izat
ion,
Per
cent
Thou
sand
Ton
nes
Capacity ChangeCapacity Utilization
* Based on committed projects only
© Copyright 2017 RISI, Inc. | Proprietary Information 29

Net Capacity Change* and Tissue Capacity Utilization in Eastern Europe until 2021New investments from late 2014 onward and slowed demand growth turned capacity utilization into decline, which will continue in 2018‐2019
78
80
82
84
86
88
90
92
94
020406080
100120140160180200
Cap
acity
Util
izat
ion,
Per
cent
Thou
sand
Ton
nes
Capacity ChangeCapacity Utilization
* Based on committed projects only
© Copyright 2017 RISI, Inc. | Proprietary Information 30

Net Capacity Change* and Tissue Capacity Utilization in Europe until 2021European investments have pushed capacity utilization down since 2013 and the next three years will not change the situation much
8485868788899091929394
0
50
100
150
200
250
300
350
400
Cap
acity
Util
izat
ion,
Per
cent
Thou
sand
Ton
nes
Capacity ChangeCapacity Utilization
* Based on committed projects only
© Copyright 2017 RISI, Inc. | Proprietary Information 31

Concluding Remarks• The Western European tissue business is rather mature and
with limited population growth, growth will remain modest, with only some improvement in penetration degrees of products helping.
• The sub‐regional outlook is different in Western Europe: the Nordic region and Central Europe rather balanced but as ongoing investments concentrate on Iberian Peninsula in particular, overcapacity is obvious there.
• Eastern Europe has still a lot of potential to grow, and even though the Russian‐Ukrainian conflict in the Donbas region is everything else than solved yet, the overall outlook is improving. However, many investments are coming and more are reportedly planned so that no major improvement in capacity utilization can be expected in the next few years.
• Central Eastern Europe and the Balkan Peninsula are in a good move forward, recent growth in Poland has been extremely surprising, and a few other countries are likely to follow.
© Copyright 2017 RISI, Inc. | Proprietary Information 32

Thank you for your attention!For more information:
Outlook for World Tissue Businesswww.risi.com/OWTB
World Tissue Business Monitorwww.risi.com/WTBM
US Tissue Monthly Datawww.risi.com/USTM
© Copyright 2017 RISI, Inc. | Proprietary Information 33