european energy efficiency - odyssee-mure · however, as this can shift due to changes in economic...
TRANSCRIPT
European Energy Efficiency Analysis of ODYSSEE indicators
February 2012
European Energy Efficiency
2
Contents
European Energy Efficiency ............................................................................................................... 1
Analysis of ODYSSEE indicators ......................................................................................................... 1
Contents ........................................................................................................................................... 2
1. Introduction .................................................................................................................................. 3
Definition of energy efficiency ............................................................................................................... 3
ODYSSEE project ..................................................................................................................................... 3
ODYSSEE indicators ................................................................................................................................. 3
2. Household sector .......................................................................................................................... 4
Introduction ............................................................................................................................................ 4
Key points about data ............................................................................................................................. 4
Temperature adjustment to EU average climate ................................................................................... 5
Improvement in energy efficiency over time ......................................................................................... 7
Summary ................................................................................................................................................. 8
3. Service sector ................................................................................................................................ 9
Introduction ............................................................................................................................................ 9
Key points about data ............................................................................................................................. 9
Structure of UK Services Sector ............................................................................................................ 11
Improvement in energy efficiency over time ....................................................................................... 11
Summary ............................................................................................................................................... 12
4. Industrial sector .......................................................................................................................... 13
Introduction .......................................................................................................................................... 13
Key points about data ........................................................................................................................... 13
Structure of UK Industrial Sector .......................................................................................................... 16
Improvement in energy efficiency over time ....................................................................................... 17
Summary ............................................................................................................................................... 17
5. Road transport sector .................................................................................................................. 18
Introduction .......................................................................................................................................... 18
Key points about data ........................................................................................................................... 18
Improvement in energy efficiency over time ....................................................................................... 20
Summary ............................................................................................................................................... 21
Analysis of ODYSSEE indicators
3
1. Introduction Definition of energy efficiency In its purist sense the term “efficiency” refers to the ratio of inputs and outputs. Energy efficiency on a technical level is the relationship between the energy consumed and the output produced by that energy, often called “energy services”, for example the number of miles travelled for a gallon of fuel. Increasing energy efficiency means using either less energy to get the same level of energy services, or maintaining the same level of energy services, but using less energy.
The benefit of energy services can also be measured in terms of its economic value. At an economy-wide level this is the relationship between GDP and energy consumption: the energy intensity of GDP. However, as this can shift due to changes in economic structure, or recession, therefore looking at individual sectors of the economy (broadly defined as the energy sector, industry, services, domestic and transport) provides additional insights.
This paper is designed to compare how energy use and energy efficiency vary across European countries using a range of indicators for each sector. These indicators of energy efficiency are taken from the ODYSSEE database.
ODYSSEE project DECC is a Project Partner of the ODYSSEE project. This is an EU sponsored project to monitor energy efficiency in European countries. The project includes the 27 European Union countries plus Croatia and Norway. Project partners provide detailed data on energy use and activity data which enable ODYSSEE to produce a database of energy efficiency indicators covering the major final energy sectors: household; services; industry and transport. More information about the project can be found on the ODYSSEE website1
.
ODYSSEE indicators The ODYSSEE database uses a variety of energy use per activity indicators to highlight differences in energy efficiency between countries and trends. These include:
• Energy consumption per dwelling • Energy consumption per unit of Gross Value Added (GVA)2
• Energy consumption per employee
• Energy consumption per kilometre travelled
To aid comparison, the ODYSSEE data includes technical adjustments for key determinants of energy use in the different sectors (for example, adjustments for climate and structure of industry).
1 http://www.odyssee-indicators.org/ 2 Gross Value Added (GVA) is an economic measure of the value of goods and services produced in an area, or sector of the economy.

European Energy Efficiency
4
2. Household sector Introduction This analysis compares indicators of household energy efficiency levels of the UK with the other EU Member States. The indicator, energy consumption per permanently occupied dwelling (kWh/dwelling) is the direct ratio between household energy consumption and the number of dwellings. This has been calculated from official statistical sources in each country.
Key points about data • This indicator includes all fuels and end-uses of energy consumed by the household but excluding
energy used for transport.
• Changes in energy consumption per household can be affected by a number of behavioural and technical factors, such as the increase in household ownership of appliances, the intensity of their use and switching between different fuels.
• To enable better comparisons to be made between countries, data is also presented on consumption that has been adjusted to the average EU climate based on the requirement for space heating in each country.
Chart 2.1 presents the energy consumption per occupied dwelling in 2008 for all EU27 countries. The countries are ranked in order of increasing energy consumption per dwelling.
Chart 2.1: Household energy consumption per occupied dwelling - 2008
Using this indicator, the UK was in 18th position, consuming 10 per cent more energy per dwelling than the EU27 average of 17,747 kWh/dwelling. The average consumption per dwelling in the United Kingdom was 19,527 kWh/dwelling, higher than. The lowest consumption was 6,583 kWh/dwelling
Analysis of ODYSSEE indicators
5
observed in Malta, while the greatest energy use was reported in Luxembourg at 32,483 kWh/dwelling, almost double the EU27 average.
Not surprisingly many of the countries with low consumption per dwelling are those with warmer climates but there are other key factors, such as the amount of appliance use and efficiency of energy use.
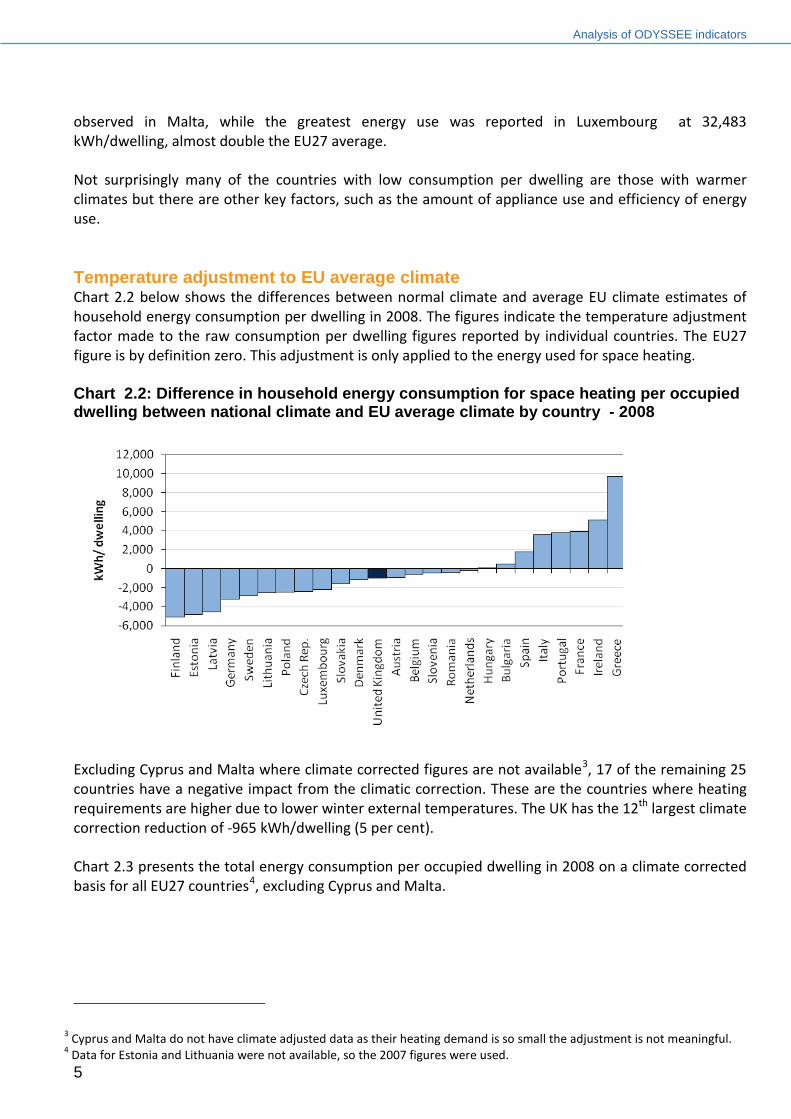
Temperature adjustment to EU average climate Chart 2.2 below shows the differences between normal climate and average EU climate estimates of household energy consumption per dwelling in 2008. The figures indicate the temperature adjustment factor made to the raw consumption per dwelling figures reported by individual countries. The EU27 figure is by definition zero. This adjustment is only applied to the energy used for space heating.
Chart 2.2: Difference in household energy consumption for space heating per occupied dwelling between national climate and EU average climate by country - 2008
Excluding Cyprus and Malta where climate corrected figures are not available3
Chart 2.3 presents the total energy consumption per occupied dwelling in 2008 on a climate corrected basis for all EU27 countries
, 17 of the remaining 25 countries have a negative impact from the climatic correction. These are the countries where heating requirements are higher due to lower winter external temperatures. The UK has the 12th largest climate correction reduction of -965 kWh/dwelling (5 per cent).
4
3 Cyprus and Malta do not have climate adjusted data as their heating demand is so small the adjustment is not meaningful.
, excluding Cyprus and Malta.
4 Data for Estonia and Lithuania were not available, so the 2007 figures were used.
European Energy Efficiency
6
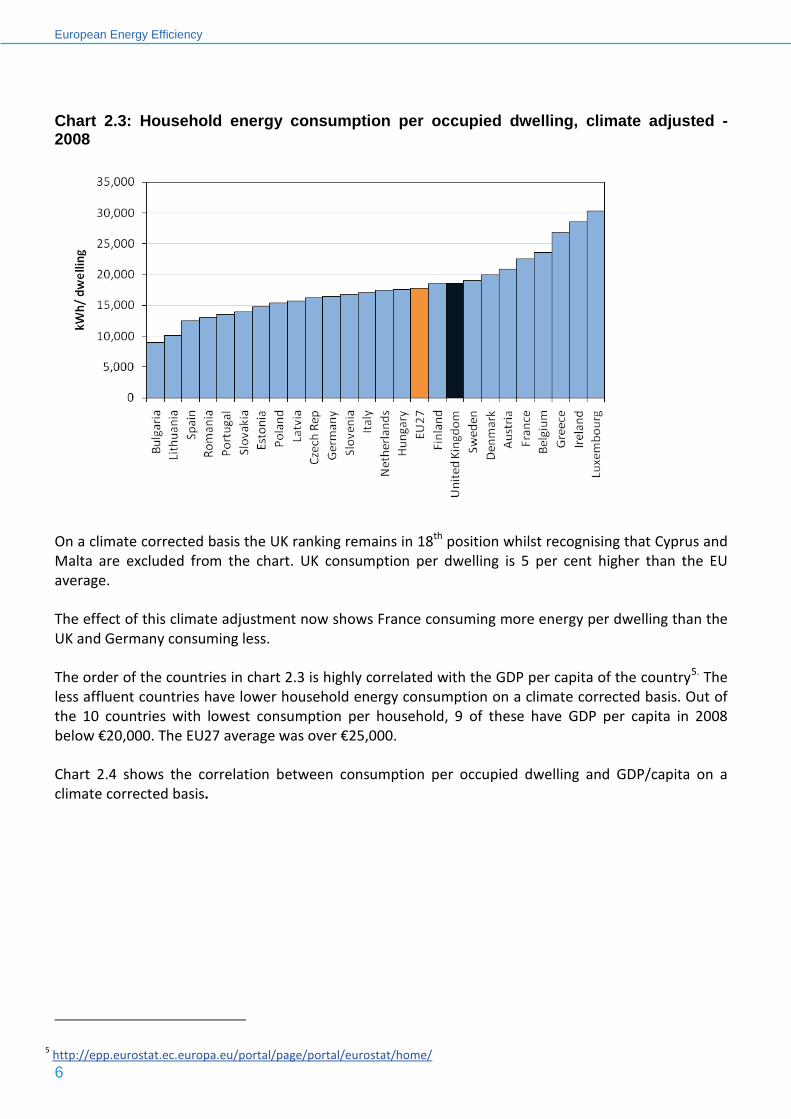
Chart 2.3: Household energy consumption per occupied dwelling, climate adjusted - 2008
On a climate corrected basis the UK ranking remains in 18th position whilst recognising that Cyprus and Malta are excluded from the chart. UK consumption per dwelling is 5 per cent higher than the EU average.
The effect of this climate adjustment now shows France consuming more energy per dwelling than the UK and Germany consuming less.
The order of the countries in chart 2.3 is highly correlated with the GDP per capita of the country5
Chart 2.4 shows the correlation between consumption per occupied dwelling and GDP/capita on a climate corrected basis.
. The less affluent countries have lower household energy consumption on a climate corrected basis. Out of the 10 countries with lowest consumption per household, 9 of these have GDP per capita in 2008 below €20,000. The EU27 average was over €25,000.
5 http://epp.eurostat.ec.europa.eu/portal/page/portal/eurostat/home/
Analysis of ODYSSEE indicators
7
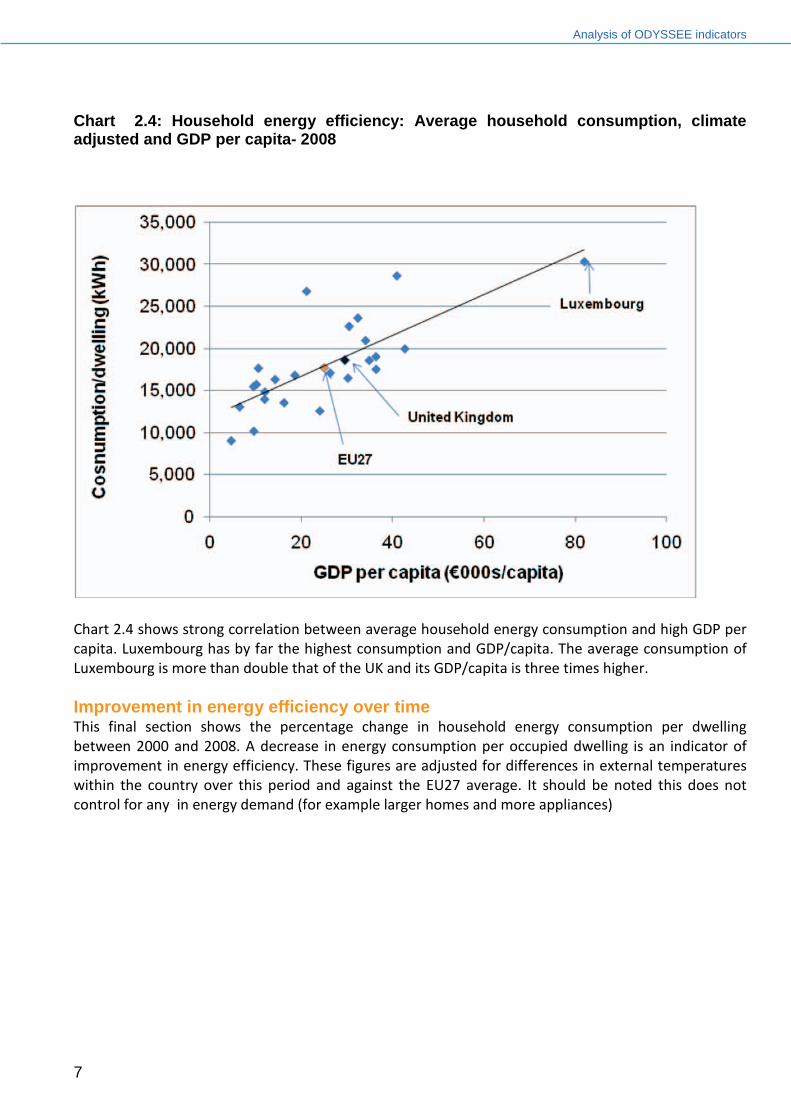
Chart 2.4: Household energy efficiency: Average household consumption, climate adjusted and GDP per capita- 2008
Chart 2.4 shows strong correlation between average household energy consumption and high GDP per capita. Luxembourg has by far the highest consumption and GDP/capita. The average consumption of Luxembourg is more than double that of the UK and its GDP/capita is three times higher.
Improvement in energy efficiency over time This final section shows the percentage change in household energy consumption per dwelling between 2000 and 2008. A decrease in energy consumption per occupied dwelling is an indicator of improvement in energy efficiency. These figures are adjusted for differences in external temperatures within the country over this period and against the EU27 average. It should be noted this does not control for any in energy demand (for example larger homes and more appliances)

European Energy Efficiency
8
Chart 2.56
: Changes in household energy consumption per dwelling between 2000 and adjusted to EU average climate - 2008
The overall UK energy consumption per dwelling reduced by 11 per cent since 2000 levels compared to the EU27 average which observed a decrease of 9 per cent over the same period. Energy consumption per dwelling has fallen in most countries but increased in five countries over this period. The greatest increase of 3,989 kWh/dwelling (18 per cent) was observed in Greece.
Summary On a climate corrected basis the UK energy consumption per dwelling is 5 per cent above the EU27 average with two-thirds of countries having lower consumption per dwelling in 2008. Since 2000 the UK has reduced energy consumption per dwelling by 11 per cent which places it in the top quarter of EU27 Member States.
6 Data for Cyprus and Malta are not available.
Analysis of ODYSSEE indicators
9
3. Service sector Introduction This analysis compares the energy efficiency of the service sector in the UK with other EU Member States. The service sector is very diverse and the makeup of this sector will explain a significant amount of the variation in energy consumption between countries, even within the European Union. Services have been broadly defined to include the following; catering & hotels, health & education services, wholesale & retail trade, offices and public administration.
Key points about data • The indicators used in this analysis are, energy consumption per unit of Gross Value Added (GVA)
and energy consumption per employee. GVA is an economic measure of the value of goods and services produced in sector of the economy. In both indicators the energy consumption data have been temperature corrected to the normal climate of the country but not to the EU average to smooth the effect of variation in external temperatures in the energy consumption. Climate corrected data is not available for this sector.
• The analysis includes all types and sources of energy consumption except transport. In most charts total energy consumption is presented but chart 3.2 shows the breakdown between electricity and other energy.
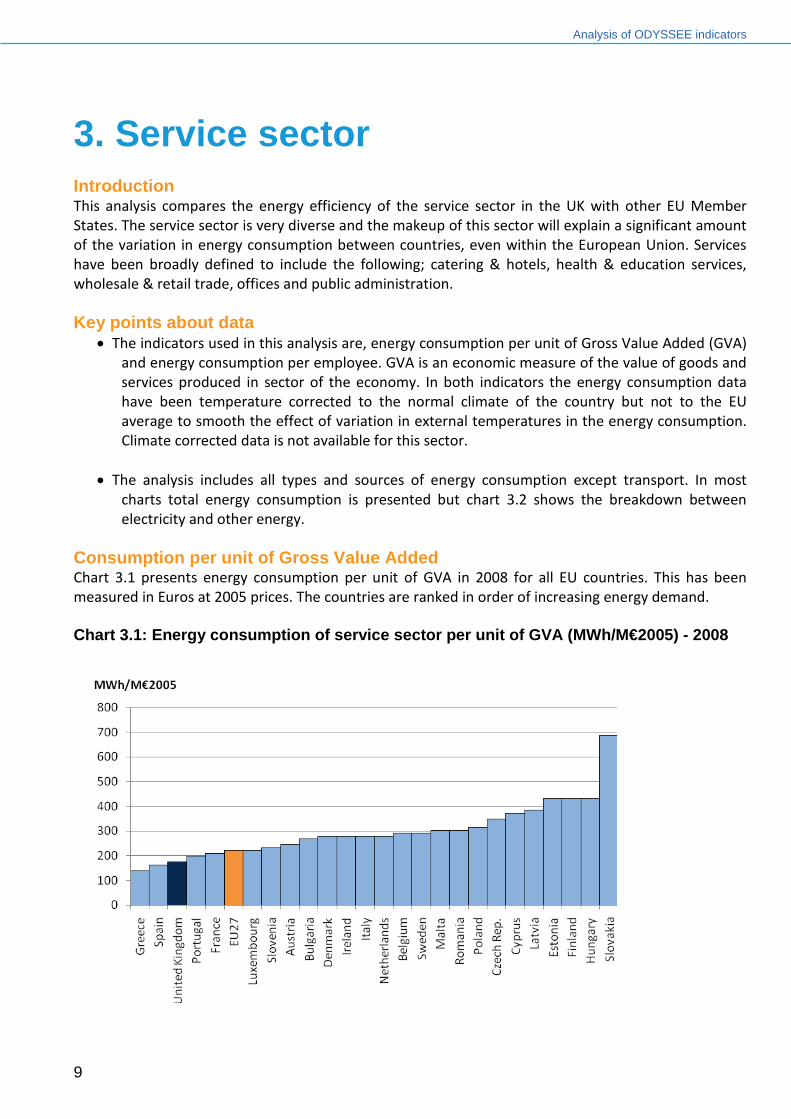
Consumption per unit of Gross Value Added Chart 3.1 presents energy consumption per unit of GVA in 2008 for all EU countries. This has been measured in Euros at 2005 prices. The countries are ranked in order of increasing energy demand.
Chart 3.1: Energy consumption of service sector per unit of GVA (MWh/M€2005) - 2008
European Energy Efficiency
10
Chart 3.1 shows that the UK is one of the lowest consuming countries in this sector relative to the economic output from it. The only countries with lower demand than the UK are in southern Europe where heating demand is lower due to the warmer climate. UK service sector energy consumption per unit of GVA was 21 per cent lower than the EU average.
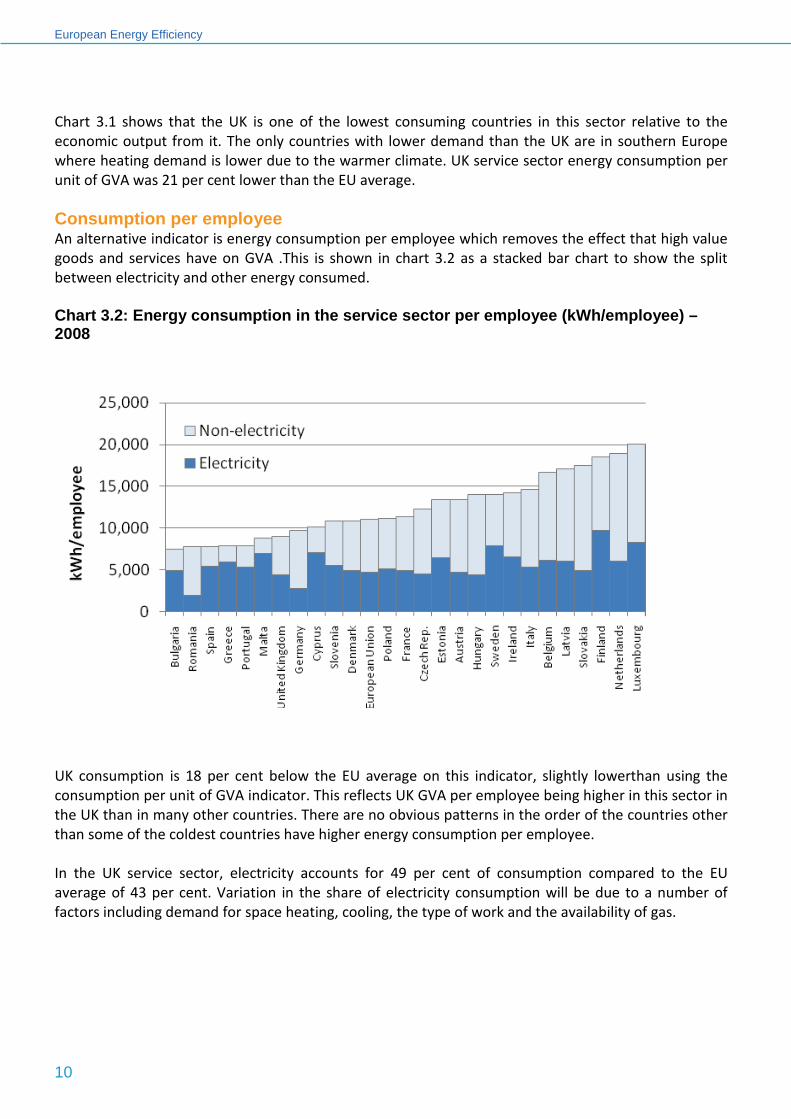
Consumption per employee An alternative indicator is energy consumption per employee which removes the effect that high value goods and services have on GVA .This is shown in chart 3.2 as a stacked bar chart to show the split between electricity and other energy consumed.
Chart 3.2: Energy consumption in the service sector per employee (kWh/employee) – 2008
UK consumption is 18 per cent below the EU average on this indicator, slightly lowerthan using the consumption per unit of GVA indicator. This reflects UK GVA per employee being higher in this sector in the UK than in many other countries. There are no obvious patterns in the order of the countries other than some of the coldest countries have higher energy consumption per employee.
In the UK service sector, electricity accounts for 49 per cent of consumption compared to the EU average of 43 per cent. Variation in the share of electricity consumption will be due to a number of factors including demand for space heating, cooling, the type of work and the availability of gas.
Analysis of ODYSSEE indicators
11
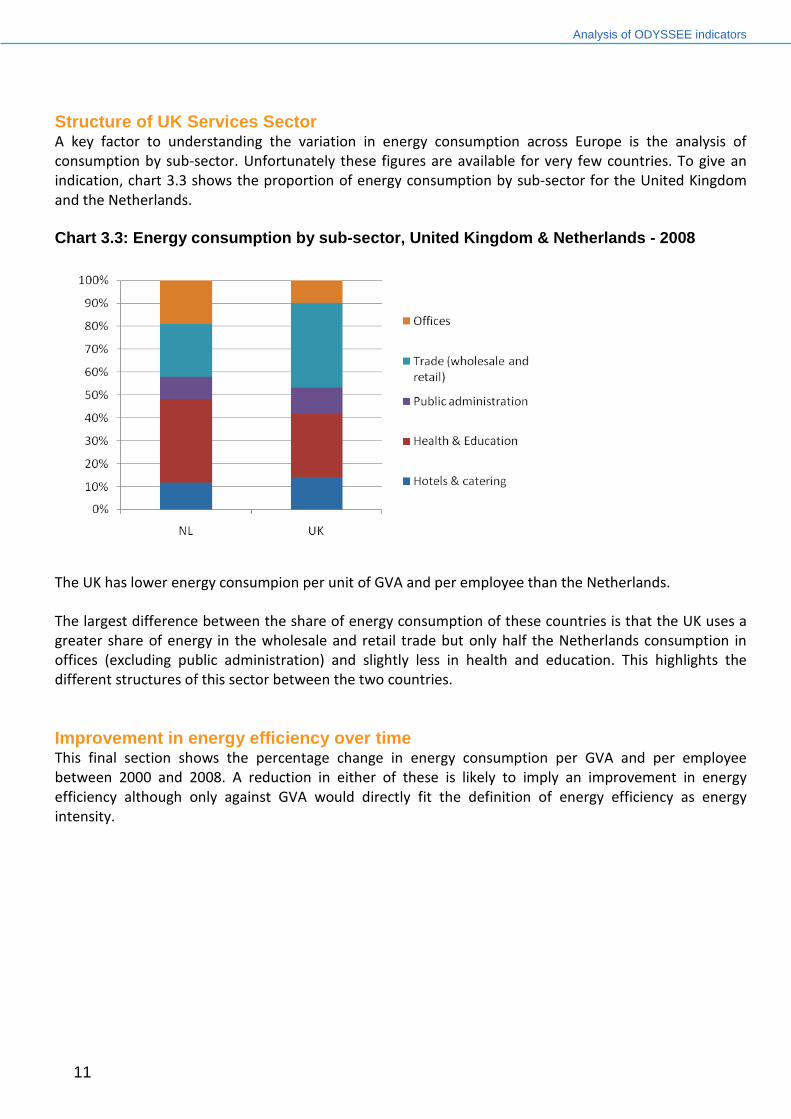
Structure of UK Services Sector A key factor to understanding the variation in energy consumption across Europe is the analysis of consumption by sub-sector. Unfortunately these figures are available for very few countries. To give an indication, chart 3.3 shows the proportion of energy consumption by sub-sector for the United Kingdom and the Netherlands.
Chart 3.3: Energy consumption by sub-sector, United Kingdom & Netherlands - 2008
The UK has lower energy consumpion per unit of GVA and per employee than the Netherlands.
The largest difference between the share of energy consumption of these countries is that the UK uses a greater share of energy in the wholesale and retail trade but only half the Netherlands consumption in offices (excluding public administration) and slightly less in health and education. This highlights the different structures of this sector between the two countries.
Improvement in energy efficiency over time This final section shows the percentage change in energy consumption per GVA and per employee between 2000 and 2008. A reduction in either of these is likely to imply an improvement in energy efficiency although only against GVA would directly fit the definition of energy efficiency as energy intensity.
European Energy Efficiency
12
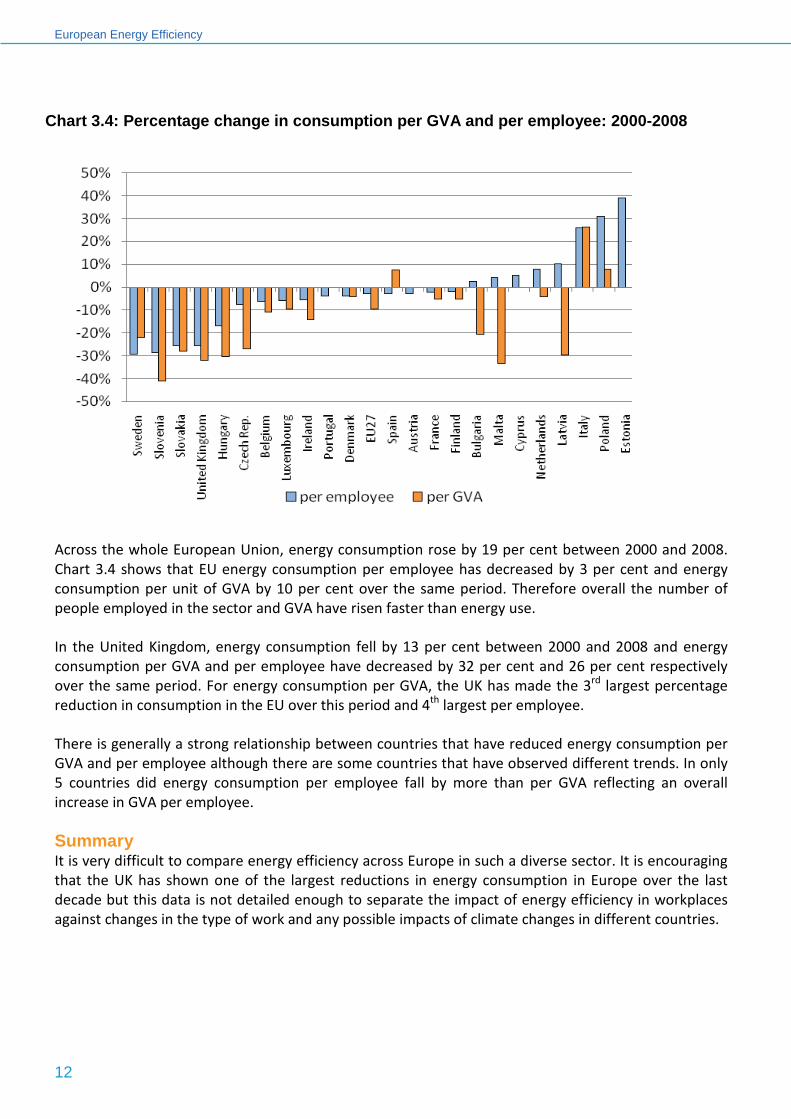
Chart 3.4: Percentage change in consumption per GVA and per employee: 2000-2008
Across the whole European Union, energy consumption rose by 19 per cent between 2000 and 2008. Chart 3.4 shows that EU energy consumption per employee has decreased by 3 per cent and energy consumption per unit of GVA by 10 per cent over the same period. Therefore overall the number of people employed in the sector and GVA have risen faster than energy use.
In the United Kingdom, energy consumption fell by 13 per cent between 2000 and 2008 and energy consumption per GVA and per employee have decreased by 32 per cent and 26 per cent respectively over the same period. For energy consumption per GVA, the UK has made the 3rd largest percentage reduction in consumption in the EU over this period and 4th largest per employee.
There is generally a strong relationship between countries that have reduced energy consumption per GVA and per employee although there are some countries that have observed different trends. In only 5 countries did energy consumption per employee fall by more than per GVA reflecting an overall increase in GVA per employee.
Summary It is very difficult to compare energy efficiency across Europe in such a diverse sector. It is encouraging that the UK has shown one of the largest reductions in energy consumption in Europe over the last decade but this data is not detailed enough to separate the impact of energy efficiency in workplaces against changes in the type of work and any possible impacts of climate changes in different countries.
Analysis of ODYSSEE indicators
13
4. Industrial sector Introduction This analysis compares industrial energy intensity levels of the UK with the other EU Member States. The type of industry across the EU varies and this section highlights these differences and makes a raw comparison and one having adjusted for structural differences.
Key points about data • This indicator includes all fuels and end-uses of energy consumed by the industrial sector,
excluding energy used for transport.
• Energy intensity changes can be affected by a number of behavioural and technical factors, such as the increase in number of factories, the intensity of their use and switching between fuels with different end-use efficiencies.
• To enable better comparisons to be made between countries, Purchasing Power Parity (PPP) has been used. PPP is an indicator which reflects the differences in the cost of purchasing comparable products/services between different countries.
• Manufacturing energy consumption per unit of GVA at standardised to the structure of industrial activity in the EU. This is a weighted measure of energy intensity, calculated by taking the actual energy intensity for each sector in the country and weighting them by the share of each manufacturing for the EU as a whole.
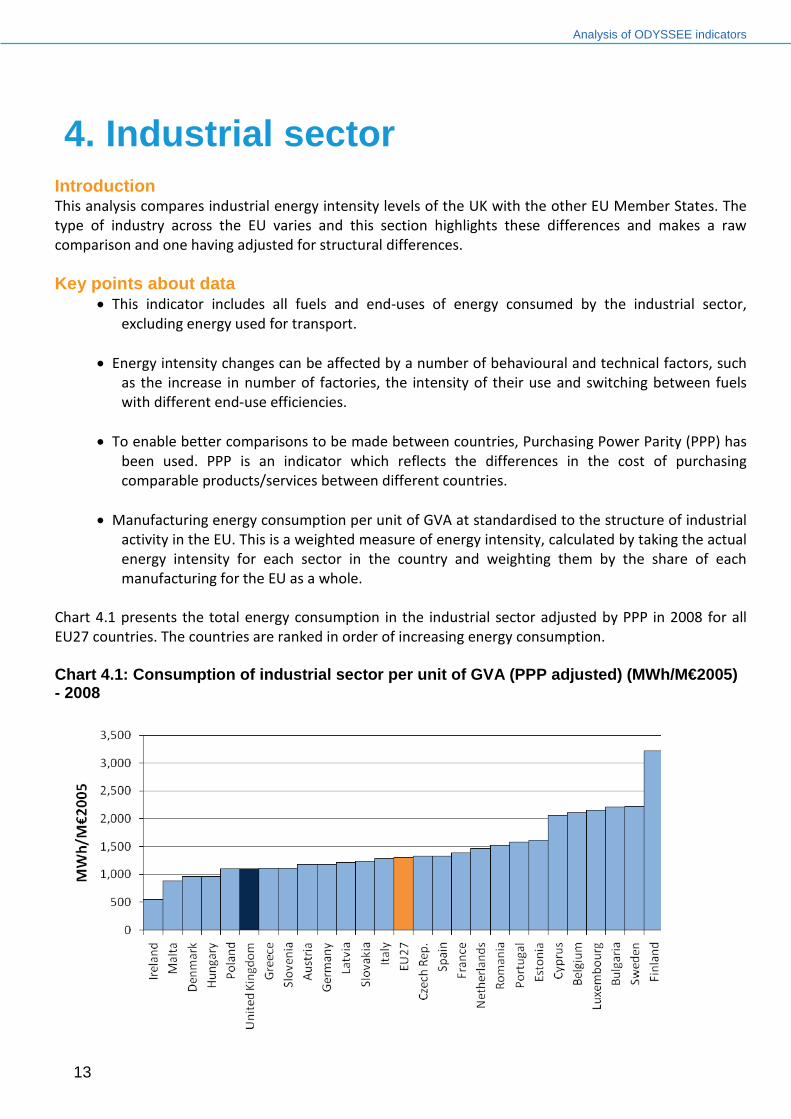
Chart 4.1 presents the total energy consumption in the industrial sector adjusted by PPP in 2008 for all EU27 countries. The countries are ranked in order of increasing energy consumption.
Chart 4.1: Consumption of industrial sector per unit of GVA (PPP adjusted) (MWh/M€2005) - 2008
European Energy Efficiency
14
In 2008, the energy intensity in the United Kingdom for the industrial sector was 1,105 MWh/M€2005, 15 per cent lower than the EU27 average. This was the 6th lowest consumption out of the EU27. The least energy intensive industrial sector was observed in Ireland, 547 MWh/M€2005, while the most energy intensive industrial sector was reported in Finland at 3,222 MWh/M€2005, more than double the EU27 average.
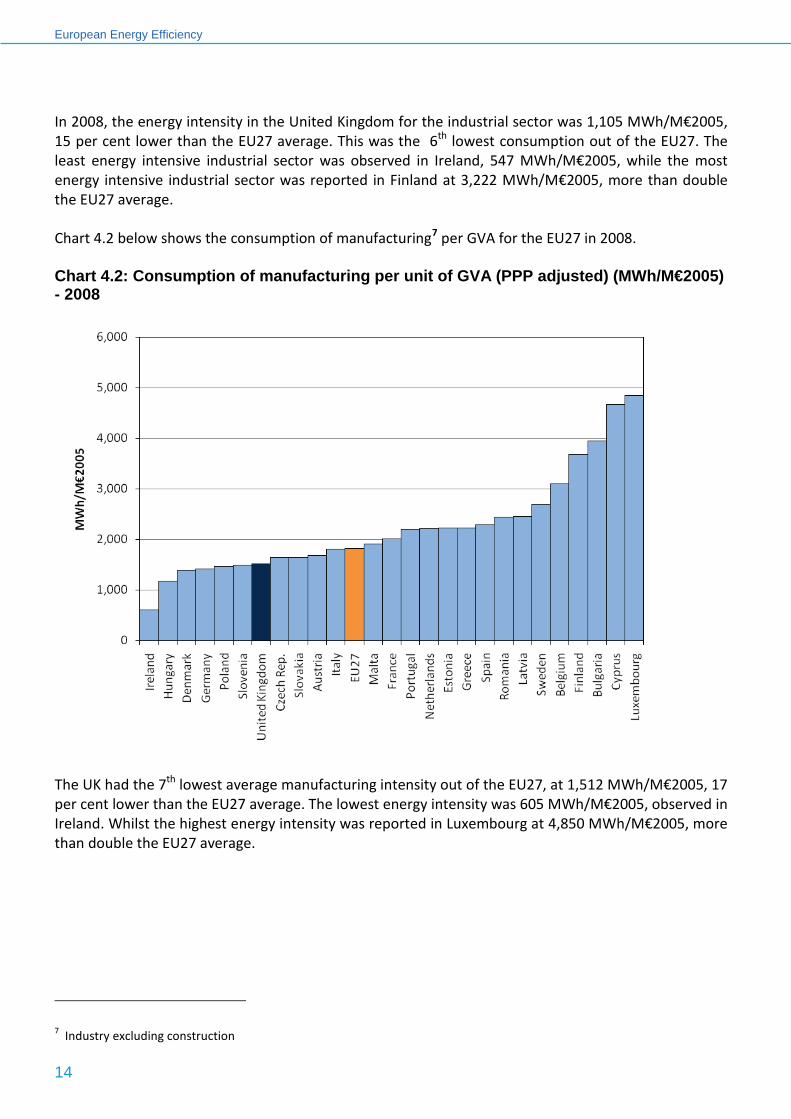
Chart 4.2 below shows the consumption of manufacturing7
Chart 4.2: Consumption of manufacturing per unit of GVA (PPP adjusted) (MWh/M€2005) - 2008
per GVA for the EU27 in 2008.
The UK had the 7th lowest average manufacturing intensity out of the EU27, at 1,512 MWh/M€2005, 17 per cent lower than the EU27 average. The lowest energy intensity was 605 MWh/M€2005, observed in Ireland. Whilst the highest energy intensity was reported in Luxembourg at 4,850 MWh/M€2005, more than double the EU27 average.
7 Industry excluding construction
Analysis of ODYSSEE indicators
15
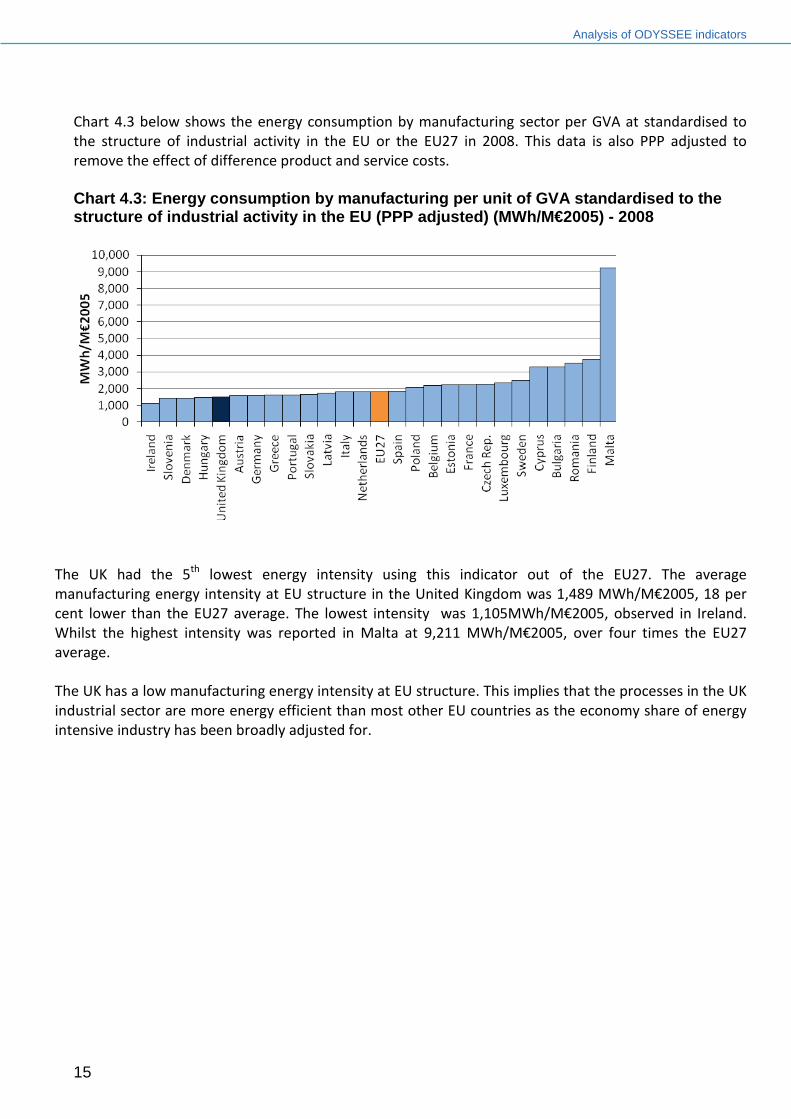
Chart 4.3 below shows the energy consumption by manufacturing sector per GVA at standardised to the structure of industrial activity in the EU or the EU27 in 2008. This data is also PPP adjusted to remove the effect of difference product and service costs.
Chart 4.3: Energy consumption by manufacturing per unit of GVA standardised to the structure of industrial activity in the EU (PPP adjusted) (MWh/M€2005) - 2008
The UK had the 5th lowest energy intensity using this indicator out of the EU27. The average manufacturing energy intensity at EU structure in the United Kingdom was 1,489 MWh/M€2005, 18 per cent lower than the EU27 average. The lowest intensity was 1,105MWh/M€2005, observed in Ireland. Whilst the highest intensity was reported in Malta at 9,211 MWh/M€2005, over four times the EU27 average.
The UK has a low manufacturing energy intensity at EU structure. This implies that the processes in the UK industrial sector are more energy efficient than most other EU countries as the economy share of energy intensive industry has been broadly adjusted for.
European Energy Efficiency
16
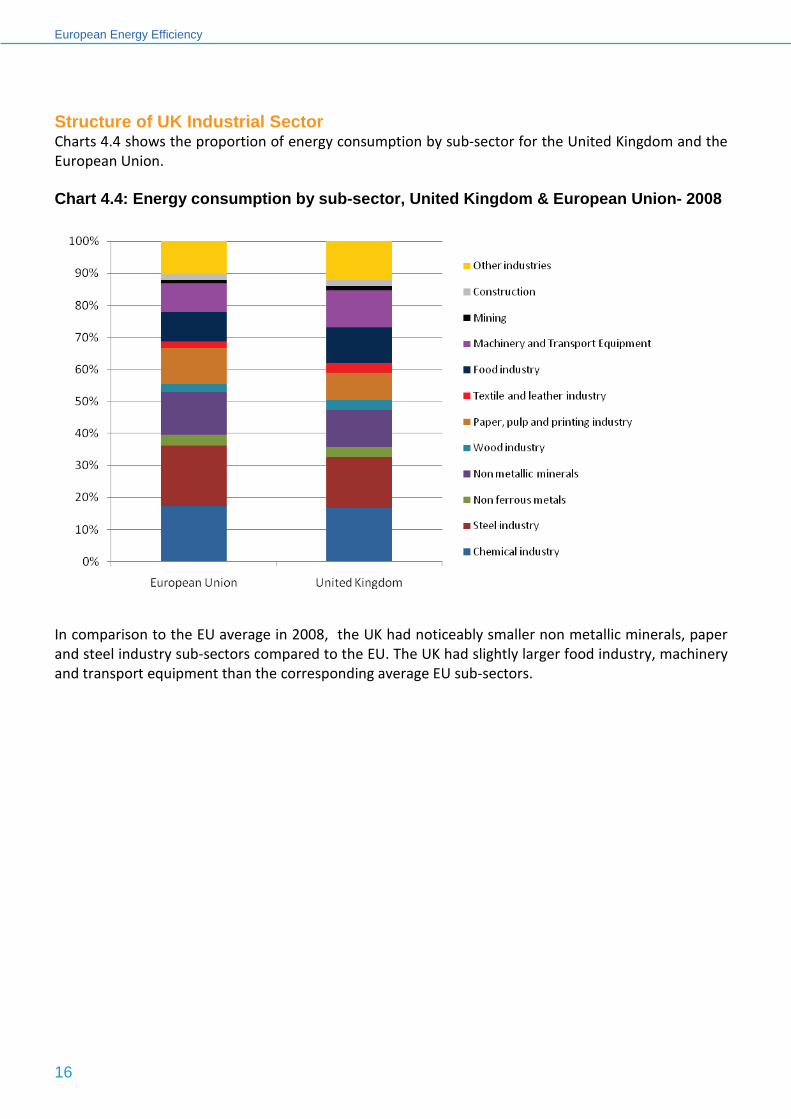
Structure of UK Industrial Sector Charts 4.4 shows the proportion of energy consumption by sub-sector for the United Kingdom and the European Union.
Chart 4.4: Energy consumption by sub-sector, United Kingdom & European Union- 2008
In comparison to the EU average in 2008, the UK had noticeably smaller non metallic minerals, paper and steel industry sub-sectors compared to the EU. The UK had slightly larger food industry, machinery and transport equipment than the corresponding average EU sub-sectors.
Analysis of ODYSSEE indicators
17
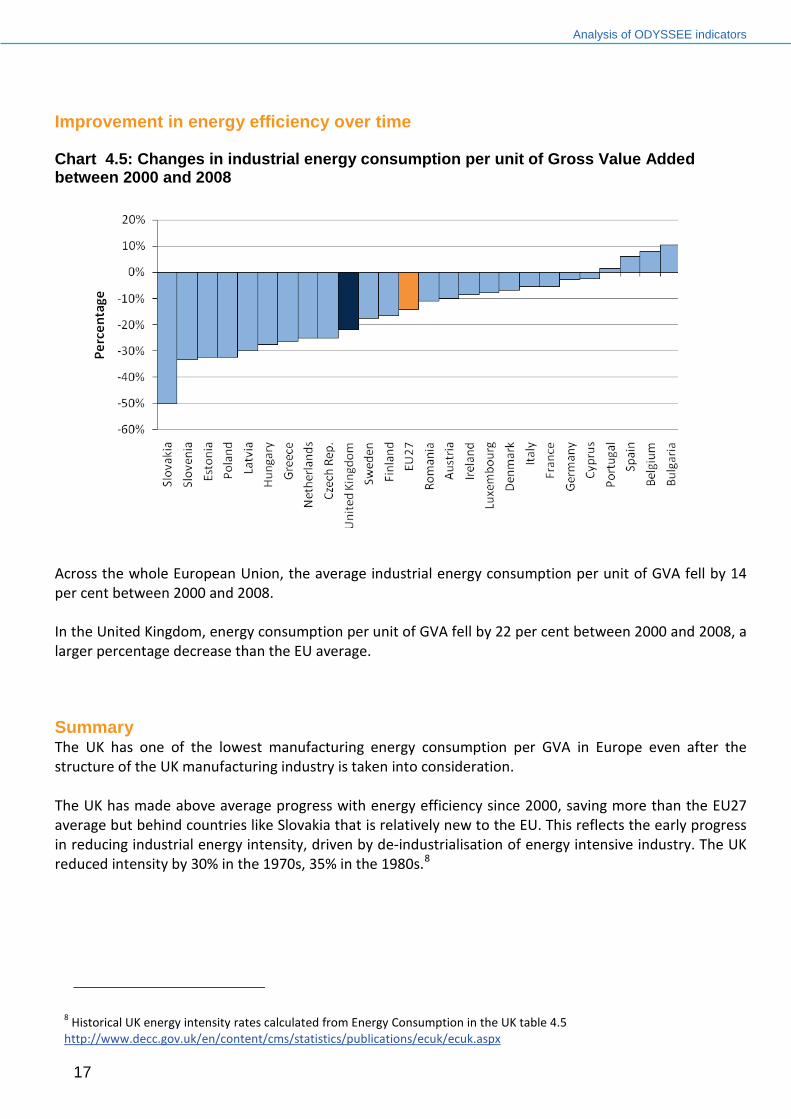
Improvement in energy efficiency over time Chart 4.5: Changes in industrial energy consumption per unit of Gross Value Added between 2000 and 2008
Across the whole European Union, the average industrial energy consumption per unit of GVA fell by 14 per cent between 2000 and 2008.
In the United Kingdom, energy consumption per unit of GVA fell by 22 per cent between 2000 and 2008, a larger percentage decrease than the EU average.
Summary The UK has one of the lowest manufacturing energy consumption per GVA in Europe even after the structure of the UK manufacturing industry is taken into consideration. The UK has made above average progress with energy efficiency since 2000, saving more than the EU27 average but behind countries like Slovakia that is relatively new to the EU. This reflects the early progress in reducing industrial energy intensity, driven by de-industrialisation of energy intensive industry. The UK reduced intensity by 30% in the 1970s, 35% in the 1980s.8
8 Historical UK energy intensity rates calculated from Energy Consumption in the UK table 4.5
http://www.decc.gov.uk/en/content/cms/statistics/publications/ecuk/ecuk.aspx
European Energy Efficiency
18
5. Road transport sector Introduction This analysis compares indicators of road transport energy efficiency levels for the UK with the other EU Member States. These have been calculated from official statistical sources.
Key points about data • The indicator, consumption per car equivalent (careq) standardises consumption based on the
technical efficiency of the fleet of vehicles in a particular country. This includes differences arising from the size and age of engines. Variation in consumption per car equivalent will be driven by the amount of use per vehicle rather than technical efficiency. For road transport fuels the preferred unit of measurement is tonnes of oil equivalent (toe). For comparison with earlier chapters, 1 toe =11,630 kWh.
• Specific energy consumption is the measured performance of vehicles (litres/100 km). This has been measured for new cars in each country and for the countries fleet.
• An indicator of the percentage share of public transport is included to give an estimate of the dependence on car transport in each country.
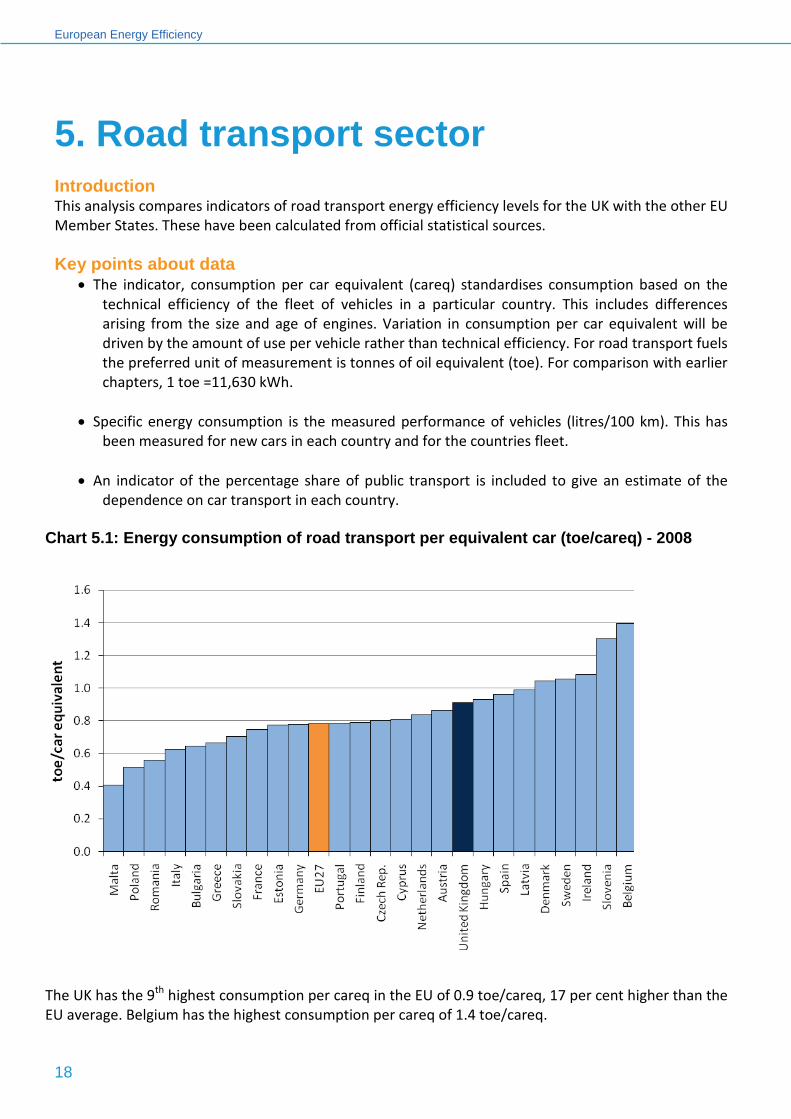
Chart 5.1: Energy consumption of road transport per equivalent car (toe/careq) - 2008
The UK has the 9th highest consumption per careq in the EU of 0.9 toe/careq, 17 per cent higher than the EU average. Belgium has the highest consumption per careq of 1.4 toe/careq.
Analysis of ODYSSEE indicators
19
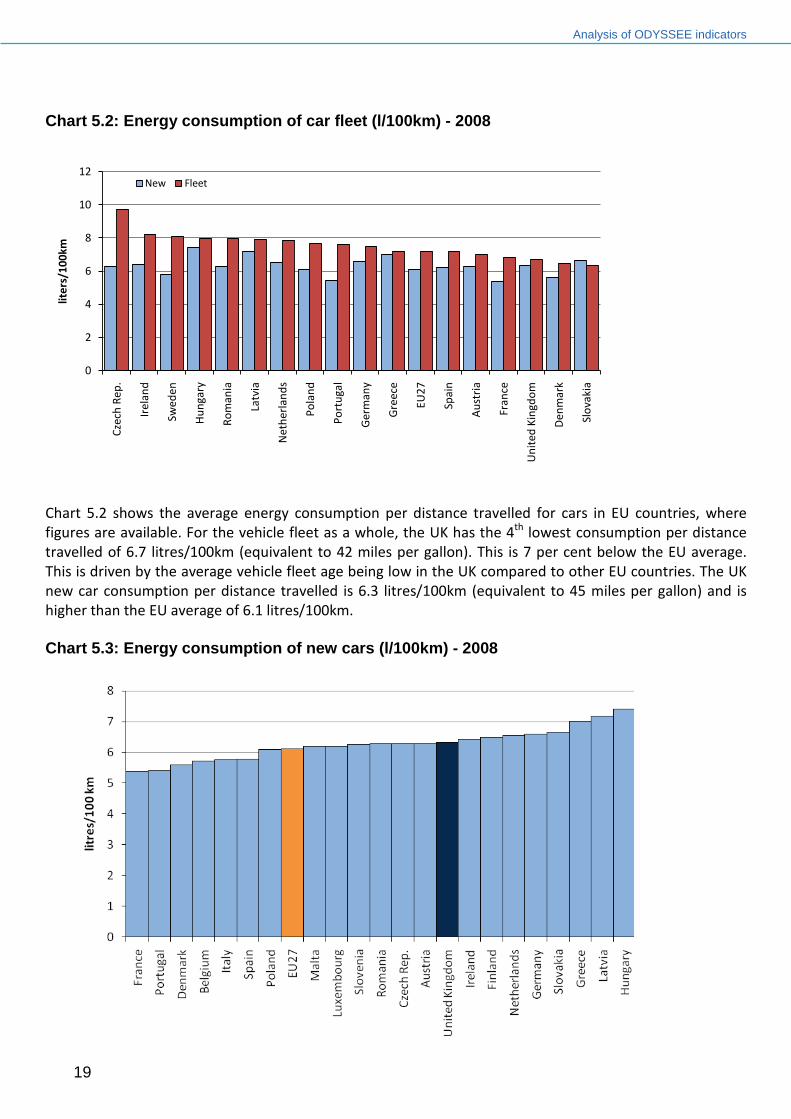
Chart 5.2: Energy consumption of car fleet (l/100km) - 2008
0
2
4
6
8
10
12
Czec
h Re
p.
Irel
and
Swed
en
Hun
gary
Rom
ania
Latv
ia
Net
herl
ands
Pola
nd
Port
ugal
Ger
man
y
Gre
ece
EU27
Spai
n
Aus
tria
Fran
ce
Uni
ted
King
dom
Den
mar
k
Slov
akia
liter
s/10
0km
New Fleet
Chart 5.2 shows the average energy consumption per distance travelled for cars in EU countries, where figures are available. For the vehicle fleet as a whole, the UK has the 4th lowest consumption per distance travelled of 6.7 litres/100km (equivalent to 42 miles per gallon). This is 7 per cent below the EU average. This is driven by the average vehicle fleet age being low in the UK compared to other EU countries. The UK new car consumption per distance travelled is 6.3 litres/100km (equivalent to 45 miles per gallon) and is higher than the EU average of 6.1 litres/100km.
Chart 5.3: Energy consumption of new cars (l/100km) - 2008
European Energy Efficiency
20
Of 18 countries that provided new car energy consumption factors, the UK has the 9th highest energy consumption per distance travelled for new cars of 6.3 litres/100km (equivalent to 45 miles per gallon). This is much higher than France where the average new car consumption is only 5.4 litres/100km and reflects the type of cars on UK roads, for example larger vehicles and larger engine capacities.
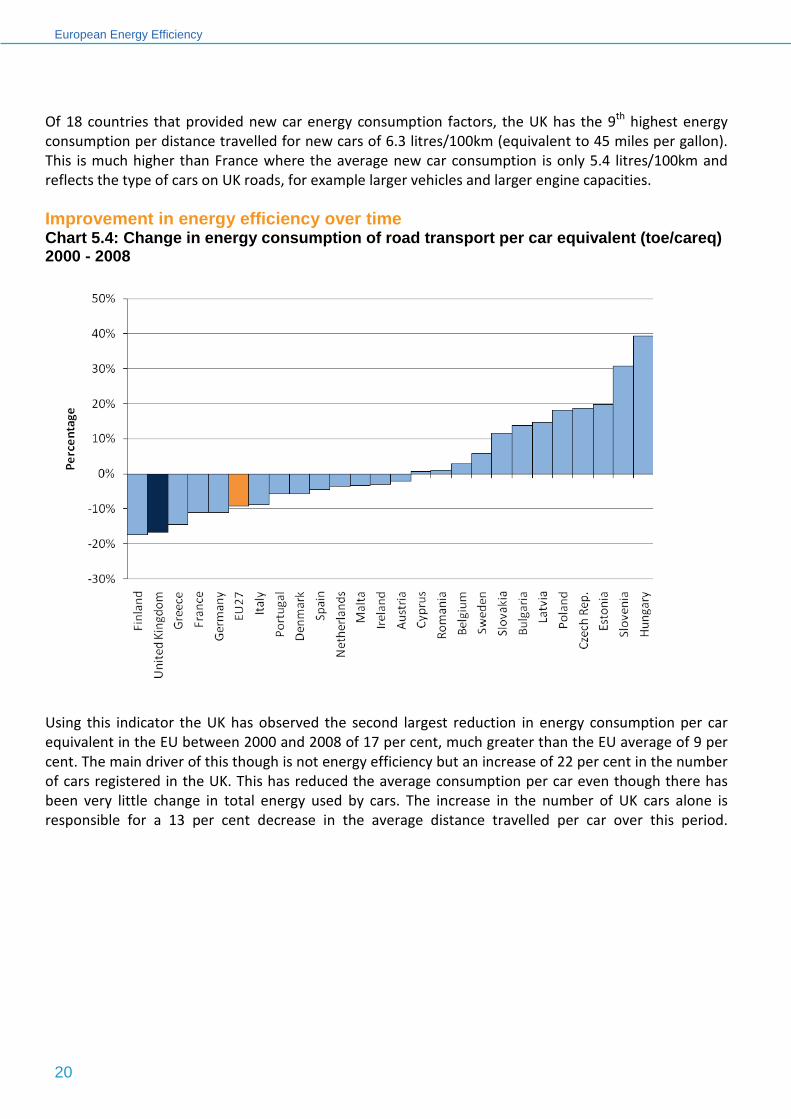
Improvement in energy efficiency over time Chart 5.4: Change in energy consumption of road transport per car equivalent (toe/careq) 2000 - 2008
Using this indicator the UK has observed the second largest reduction in energy consumption per car equivalent in the EU between 2000 and 2008 of 17 per cent, much greater than the EU average of 9 per cent. The main driver of this though is not energy efficiency but an increase of 22 per cent in the number of cars registered in the UK. This has reduced the average consumption per car even though there has been very little change in total energy used by cars. The increase in the number of UK cars alone is responsible for a 13 per cent decrease in the average distance travelled per car over this period.
Analysis of ODYSSEE indicators
21
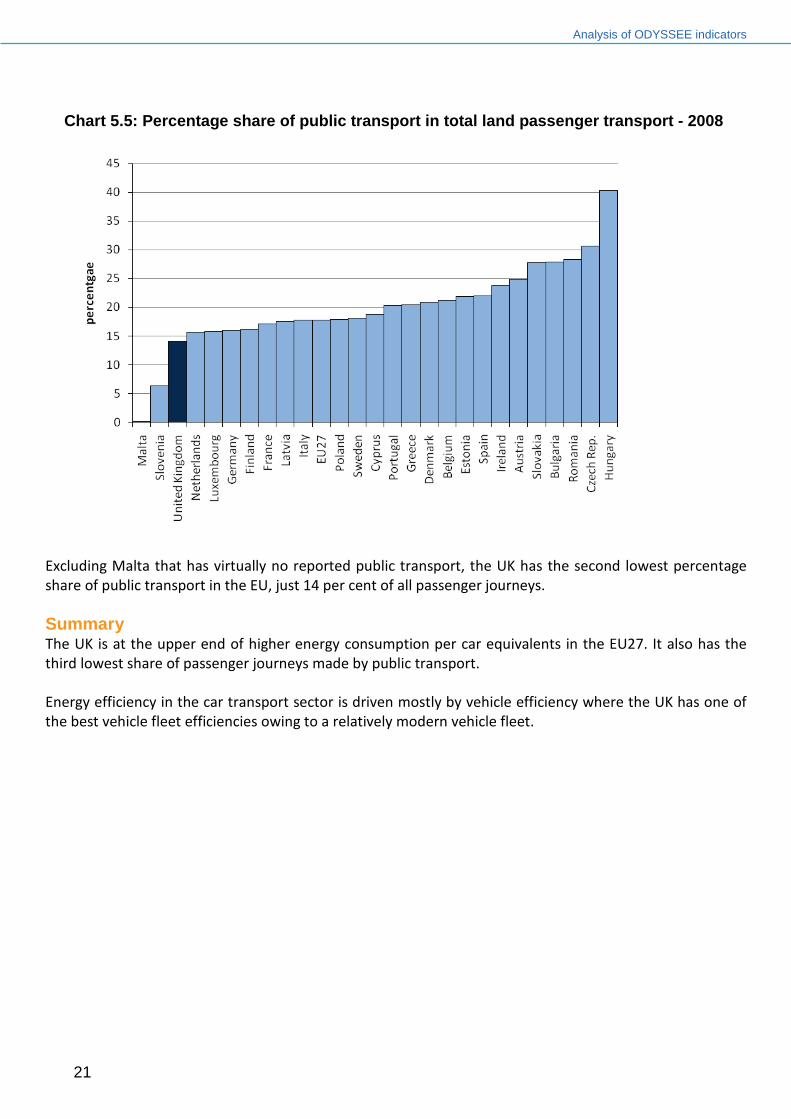
Chart 5.5: Percentage share of public transport in total land passenger transport - 2008
Excluding Malta that has virtually no reported public transport, the UK has the second lowest percentage share of public transport in the EU, just 14 per cent of all passenger journeys.
Summary The UK is at the upper end of higher energy consumption per car equivalents in the EU27. It also has the third lowest share of passenger journeys made by public transport.
Energy efficiency in the car transport sector is driven mostly by vehicle efficiency where the UK has one of the best vehicle fleet efficiencies owing to a relatively modern vehicle fleet.

© Crown copyright 2012 Department of Energy & Climate Change 3 Whitehall Place London SW1A 2AW www.decc.gov.uk URN12D/001