european commission, dg mare studies for carrying out … · · 2016-09-13summer, especially in...
TRANSCRIPT

European Commission, DG MARE
Studies for carrying out the Common Fisheries Policy:
Lot 3 Socio-economic dimensions in EU fisheries
Italy: Termini Imerese case study report
August 2013

ii
Contents 1. Methods ............................................................................................................................................ 1
1.1 Secondary data sources ............................................................................................................. 1
1.2 Interviews with focus groups ....................................................................................................... 1
1.3 Questionnaires........................................................................................................................... 2
2. Settings ............................................................................................................................................. 3
2.1 Description of case study sites .................................................................................................... 3
2.2 Demographics ........................................................................................................................... 4
2.3 Employment opportunities/sector overview ................................................................................... 6
2.4 Fisheries ................................................................................................................................... 9
2.4.1 Fleet segment 1: Polyvalent VL0006 ...................................................................................... 12
2.4.2 Fleet segment 2: Polyvalent VL0618 ...................................................................................... 20
2.4.3 Fleet segment 3: Bottom trawl VL1224 ................................................................................... 29
2.5 Summary of settings ................................................................................................................. 38
3. Linkages ......................................................................................................................................... 39
3.1 Inter-sectoral linkages............................................................................................................... 39
3.2 Intra-sectoral linkages............................................................................................................... 40
2.2.1 Between fleet segments ........................................................................................................... 40
2.2.2 Between subsectors ................................................................................................................. 40
3.3 Summary of linkages ................................................................................................................ 40
4. Role of fishing .................................................................................................................................. 41
4.1 Fisheries as an economic activity ............................................................................................... 41
4.1.1 Diversification and Adaptation ................................................................................................... 41
4.2 Future development of the community ........................................................................................ 42
5. Summary and conclusions ................................................................................................................ 43
iii
List of tables
Table 1. Employment by activity in Termini Imerese in 2001 ........................................................................... 8
Table 2. Termini Imerese fleet segments and fleet categories......................................................................... 9
Table 3. New vessels entered in the fleet of Termini Imerese ....................................................................... 10
Table 4. Fleet segments in Termini Imerese ............................................................................................... 11
Table 5. Demographics by employee type. Polyvalent VL0006 (n=5) ............................................................ 13
Table 6. Level of family involvement in business. Polyvalent VL0006 (n=5).................................................... 14
Table 7. Trend in gross value added for Polyvalent VL0006 ......................................................................... 14
Table 8. Remuneration type by vessel. Polyvalent VL0006 (n=5) .................................................................. 17
Table 9. Salary band by employee type (EUR). Polyvalent VL0006 (n=5) ...................................................... 18
Table 10. Demographics by employee type. Polyvalent VL0618 (n=8) ........................................................... 21
Table 11. Level of family involvement in business. Polyvalent VL0618 (n=8) .................................................. 22
Table 12. Trend in gross value added for Polyvalent VL0618 ....................................................................... 23
Table 13. Trend in number for DCF fleet segments included in polyvalent VL0618 ......................................... 25
Table 14. Remuneration type by vessel. Polyvalent VL0618 (n=8) ................................................................ 27
Table 15. Salary band by employee type (EUR). Polyvalent VL0618 (n=8) .................................................... 27
Table 16. Demographics by employee type. Bottom trawl VL1224 (n=8) ....................................................... 30
Table 17. Level of family involvement in business. Bottom trawl VL1224 (n=8) ............................................... 32
Table 18. Trend in gross value added for Bottom trawl VL1224 .................................................................... 32
Table 19. Remuneration type by vessel. Bottom trawl VL1224 (n=8) ............................................................. 35
Table 20. Salary band by employee type (EUR). Bottom trawl VL1224 (n=8) ................................................. 36
Table 21. Summary of settings .................................................................................................................. 39
Table 22. SWOT analysis ......................................................................................................................... 42

iv
List of figures
Figure 1. Map of Termini Imerese ................................................................................................................ 3
Figure 2. Trends in population of Termini Imerese over the period 2002-2011 .................................................. 4
Figure 3. Age structure of the population of Termini Imerese over the period 2002-2011 ................................... 5
Figure 4. Origin of the population of Termini Imerese for the year 2011 ........................................................... 5
Figure 5. Trends in migration in and out of Termini Imerese over the period 2002-2010 .................................... 6
Figure 6. Trends in life expectancy of Palermo province over the period 2002-2011 ......................................... 6
Figure 7. Number of firms operating in Termini Imerese by economic activity over 2005-2011 .......................... 8
Figure 8. Demographics of business within the Polyvalent VL0006 (n=5) ....................................................... 13
Figure 9 Trends in landings volume for Polyvalent VL0006 .......................................................................... 15
Figure 10 Trends in landings value for Polyvalent VL0006 ........................................................................... 15
Figure 11 Trends in landings prices of main species for Polyvalent VL0006 ................................................... 16
Figure 12 Trends in number of vessels for Polyvalent VL0006 ...................................................................... 16
Figure 13 Trends in engine power for Polyvalent VL0006 ............................................................................. 17
Figure 14 Trends in gross tonnage for Polyvalent VL0006 ............................................................................ 17
Figure 15. Education level of fishermen employed in Polyvalent VL0006 (n=6) .............................................. 19
Figure 16. Demographics of business within the Polyvalent VL0618 (n=8) ..................................................... 22
Figure 17 Trends in landings volume for Polyvalent VL0618 ......................................................................... 23
Figure 18 Trends in landings value for Polyvalent VL0618 ........................................................................... 24
Figure 19 Trends in landings prices of main species for Polyvalent VL0618 ................................................... 24
Figure 20 Trends in number of vessels for Polyvalent VL0618 ...................................................................... 26
Figure 21 Trends in engine power for Polyvalent VL0618 ............................................................................. 26
Figure 22 Trends in gross tonnage for Polyvalent VL0618 ............................................................................ 26
Figure 23. Education level of fishermen employed in Polyvalent VL0618 (n=8) .............................................. 28
Figure 24. Demographics of business within the Bottom trawl VL1224 (n=8) .................................................. 31
Figure 25 Trends in landings volume for Bottom trawl VL1224 ...................................................................... 33
Figure 26 Trends in landings value for Bottom trawl VL1224 ........................................................................ 33

v
Figure 27 Trends in landings prices of main species for Bottom trawl VL1224 ................................................ 34
Figure 28 Trends in number of vessels for Bottom trawl VL1224 ................................................................... 34
Figure 29 Trends in engine power for Bottom trawl VL1224 .......................................................................... 35
Figure 30 Trends in gross tonnage for Bottom trawl VL1224 ........................................................................ 35
Figure 31. Education level of fishermen employed in Bottom trawl VL1224 (n=8) ........................................... 37
vi
List of abbreviations and acronyms
LOA: Landings and revenues and added value
GSA: Geographical Sub-Area
GVA: Gross value Added
nm: nautical miles
n: Number of questionnaires
DTS: bottom trawlers
PGP: vessels using polyvalent passive gears only
PMP: vessels using active and passive gears
PS: Purse seiners
GRUND: Italian National Group for Demersal Resource Evaluation
MEDITS: International bottom trawl survey in the Mediterranean
FMSY: Fishing mortality associated with MSY
MSY: Maximum sustainable yield

1
1. Methods
1.1 Secondary data sources The secondary data used in this report, mainly related to fisheries, were collected by IREPA and reworked to provide estimates relevant at the local level. IREPA’s database consists of annual landings data by species and fleet stratum as well as cost data by fleet stratum per year. The level of geographical aggregation of these data (fleet stratum) are represented for the northern coast of Sicily, while the “technical” aggregation level is focussed on the predominant fishing gear (as for DCF) and length class.
For each fleet stratum, data per unit of LOA (landings and revenues and added value) or per vessel (number of employees) have been estimated. The values for the fleet segments of Termini Imerese have been calculated by multiplying the unitary data by the total LOA, or number of vessels of that fleet segment. The level of reliability of this data has not been not calculated, however, data collected by IREPA has an acceptable level of reliability at GSA level (the geographical level requested by the DCF). At a higher level of resolution, for example for the local community analysed, the data cannot be considered to be as reliable and it needs to be confirmed by local stakeholders.
Data on the number of vessels, gross tonnage, LOA and engine power per year have been collected through the Italian fishing fleet register and analysed by IREPA. Beyond the fisheries sector, data on the number of firms (active) have been collected through the Provincia di Palermo, which has produced a study of data from the Chamber of Commerce. These data have been further analysed to assure homogeneity across the period.
Some additional information on the main features and problems in the area have been obtained from the local management plan for the management unit “Palermo east – gulf of Termini Imerese”. This was prepared by the CO.GE.PA “Golfo di Termini Imerese – Palermo Est” in collaboration with IREPA Onlus. This information was discussed and revised with local stakeholders during the focus group sessions.
1.2 Interviews with focus groups A meeting with local stakeholders and fishermen of Termini Imerese and Cefalù was held at the Termini Imerese port in the office of a fishing cooperative in Santa Anna square. The meeting was held on 17th April, 2013, at 17:00. The group of participants for the first meeting was selected with the aim of including representatives of all fleet segments (vessels owners) -who were also representative of the different fishing cooperatives operating in Termini Imerese and Cefalù - and representatives of fishermen employed on vessels using Termini Imerese or Cefalù as their base port. The meeting was attended by 22 people covering all fleet segments active in the two ports. Even though other people were invited, some of them could not participate because of their fishing activities. Managing the meeting was very difficult because of the impacts of current economic difficulties on local fishing communities. Local people were more interested in expressing their problems and their concerns over regulations imposed at European level, and the very stringent controls on formal violations, than discussing the specific issues of the project.

2
1.3 Questionnaires The sample of people interviewed for both group B (vessels owners) and group C (people employed on vessels) is larger than the number of people involved in the focus groups. However, problems were encountered in interviewing fishermen employed on vessels shorter than 6m, other than the owner or skipper (self-employed), as there are so few working in this category.
A total of 65 questionnaires were submitted to the local fishermen. Of these, 21 questionnaires were compiled for vessels owners (5 for polyvalent lower than 6m, 8 for polyvalent over 6m and 8 for bottom trawlers) and 34 questionnaires were compiled for crew members (5 for self-employed fishermen working on polyvalent lower 6m, 16 for polyvalent over 6m (8 for skippers and 8 for other crew members), and 13 for bottom trawlers (8 for skippers and 5 for other crew members)). Most of the tables reported below are based on questionnaires submitted to vessels owners, while the other questionnaires are used to complete the information and the qualitative description of the local social context.

3
2. Settings
2.1 Description of case study sites Termini Imerese is a single local administrative unit of level 2 (LAU2) located in the province of Palermo (NUTS3: ITG12) in Sicily (NUTS2: ITG1). Sicily is both an Italian region and the largest island in the Mediterranean Sea. Termini Imerese covers an area of 77.58 km2 at latitude 37° 59’ 20’’ N and longitude 13° 41’ 56’’ E. Its population of 27,702 lives at a density of 357.08 people per km2. The nearest administrative centre is the Municipality of Termini Imerese (Comune di Termini Imerese). The distance from Termini Imerese to Palermo, the capital of Sicily, is 36 km.
Figure 1. Map of Termini Imerese Source: Google Maps.
Termini Imerese has a temperate, Mediterranean, climate, with warm and dry summers and cool and rainy winters. Spring and autumn temperatures are mild and pleasant. It is well aired by sea breezes in summer, especially in July and August, and also experiences dry Scirocco winds blowing from North Africa. Average temperatures in the coldest month, January, range between 9°C (minimum) and 14°C (maximum), and in the warmest month, August, between 22°C and 30°C. An average of about 741 mm of rain falls annually. The wettest period is from October to February, with a monthly average of about 100 mm, while the driest month is July with 6 mm. Days on average last 12 hours and 15 minutes, extending to a maximum in June (14 hours and 48 minutes) and a minimum in December (9 hours and 38 minutes).

4
The site where the oldest part of the city is located has been inhabited since prehistoric times. After the destruction of Himera (original name of the city) by the Carthaginians in 409 BC, the settlement was rebuilt two years later (407 BC) 12 km to the west, where Termini Imerese lies today. Its original name, Thermai Himeraìai (from Latin Thermae Himerae), reflects the presence of hot springs which are still used as spas. In 260 BC, during the First Punic War, the Romans suffered a harsh defeat at the city, but in 253 BC they succeeded in conquering it. The city remained faithful to Rome and was among those subject to its taxation. With the fall of the Roman Empire, the town fell into decline. Termini was a bishopric until the twelfth century. During a period of Norman domination, it became a royal city and later it was part of the demesne cities. From the Middle Ages up to the nineteenth century, Termini was one of the most important centres for the collection and shipment of grain and other foodstuffs stored locally and subjected to levy in special warehouses (Royal Loader). The presence of the warehouse made the fortune of the town and it became one of the largest ports in Sicily. It had extensive commercial relations with the maritime republics of Genoa, Pisa and Venice, with the major Mediterranean ports (Marseille, Barcelona, etc.), and, in the sixteenth century, also with Atlantic ports. In the nineteenth century, the closing of the wheat loader was the beginning of a deep economic crisis, which was mitigated at the end of the century by the development of proto-industrial and craft activities.
2.2 Demographics As reported in Figure 2, the population of Termini Imerese rose from 27,000 people in 2002 to 27,700 people in 2011. However, the increase was not homogeneous over the period; the population was quite stable before and after 2006, with a significant increase from year onwards linked to immigration registered in 2005. From 2002 to 2011, Termini Imerese’s population rose by 2.7 %, exceeding the 1.7 % rate for wider in Sicily but lagging behind the 6.4 % overall rise for Italy.
26.0
26.5
27.0
27.5
28.0
2002
2003
2004
2005
2006
2007
2008
2009
2010
2011Population (thousands)
Figure 2. Trends in population of Termini Imerese over the period 2002-2011 Source: Italian National Statistical Institute (ISTAT).
The age structure of Termini Imerese population is typical of developed countries with older populations arising from increasing life expectancy and falling birth and death rates. In terms of its age structure, Termini Imerese’s population is very similar to that of Sicily and slightly younger than the national average. Over the last 10 years, the population of Termini Imerese has become older, as it has in Sicily

5
and Italy. The fastest growing age groups are the 41-65 and over 65s, which grew by 16 % in the period under review, while the younger age groups shrank by 8 %.
0.0
10.0
20.0
30.02002
2003
2004
2005
2006
2007
2008
2009
2010
2011number (thousands)
0‐18 19‐40 41‐65 >65
Figure 3. Age structure of the population of Termini Imerese over the period 2002-2011 Source: Italian National Statistical Institute (ISTAT).
More than 99% of the Termini Imerese population are Italian, while just 0.5% are from other EU countries and 0.4% from non-EU countries. Unfortunately, official statistics on the place of birth of Termini Imerese inhabitants are not available as secondary data preventing this report providing a distinction between locals (less than 30 km far from the community) and other nationals. However, qualitative information collected during the focus groups, from local stakeholders and fishermen, indicated that most of the population are indeed local.
national
EU
other
Figure 4. Origin of the population of Termini Imerese for the year 2011 Source: Italian National Statistical Institute (ISTAT).
Figure 5 shows that the number of immigrants is very similar to the number of emigrants with the exception of 2005, when the number of immigrants was more than double that for emigrants, leading to the population situation described above. There is no obvious explanation for this trend which might simply be due to technical adjustments.

6
0
200
400
600
800
1000
1200
2002
2003
2004
2005
2006
2007
2008
2009
2010
Immigration/emigration
coming in leaving
Figure 5. Trends in migration in and out of Termini Imerese over the period 2002-2010 Source: Italian National Statistical Institute (ISTAT).
Data on life expectancy at birth was not available at the local level, so Figure 6 shows the data for the province of Palermo. This data, almost identical in pattern to the data for Sicily as a whole, shows a life expectancy slightly lower than that estimated nationally.
72
74
76
78
80
82
84
2001
2002
2003
2004
2005
2006
2007
2008
2009
Life expectan
cy (years)
Males Females
Figure 6. Trends in life expectancy of Palermo province over the period 2002-2011 Source: Italian Statistical Institute (ISTAT).
2.3 Employment opportunities/sector overview The economic structure of Termini Imerese is mainly industrial. The production structure is strongly influenced by the presence of an important industrial area. Factories of various sizes and for different activities are located in this area, but these are generally not related to the economy and employment in the city. The main exceptions are two larger companies, FIAT Automobiles and ENEL electric utility, which employ the most local people. The rest consists of small industries with fragmented production structures, and some companies working within the orbit of FIAT’s activities. Another important sector is represented by the Public Administration and public services, such as education and welfare services. The fishing sector is very marginal in the local economy, representing less than 2 % of the total number of employees. In 2001, as reported in Table 1, just 137 people were employed in this sector and this did not change significantly in subsequent years. Indeed, a number of 141 fishermen has been estimated by IREPA in 2011. Unfortunately, the only information on the relevance of different economic sectors at municipality level is provided through the census carried out by ISTAT (Italian national statistical

7
institute) every 10 years. Although the last census was carried out in 2011, the data are still not yet available. Based on the ISTAT census in 2001 more than 3,000 people, accounting for 35 % of total employees, were employed in the manufacturing sector, which represents the most important sector in the area. Public Administration and other public services, like education and welfare, accounted for around 27 % of total employees, while 13 % were employed in commerce. Employment in hotels and restaurants represented just 2 % of the total, a sign of low development of the tourism sector. The importance of manufacturing is significantly higher in Termini Imerese than at provincial or regional level. This is due to there being a significant proportion of employees in manufacturing, and with more than 65 % of these in the subsector of vehicle production falling within the orbit of FIAT industries and associated companies. FIAT is the company with the largest number of employees, employing 1,947 employees in 2001 which represented 22.1 % of the total workforce at local level. However, Termini Imerese and its industrial area are undergoing the most critical period of their short life as the Termini Imerese FIAT plant has ceased activity and is going to be closed. From an economic point of view, the history of Termini Imerese is strictly related to the history of the local FIAT plant. That plant was opened in 1970 through an agreement between FIAT and the Sicilian Region, who owned 40 % of the new company SicilFiat. The period between 1970 and the first half of the 1980s was characterized by strong growth in the number of employees. Initially, the number of employees was approximately 350, but increased suddenly to exceed 1,500 units in 1978 and reached 3,200 units in the mid-1980s. During that period, the suppliers network of FIAT employed around 1,200 people. Subsequently, the number of FIAT employees started to fall. In 1993, the first corporate restructuring occurred. The number of employees decreased to 2,810 in 1997 and 2,681 in 1999. In 2001, employees fell below 2,000 people. In July 2002, there was a second corporate restructuring which resulted in the expulsion of 223 people from the plant and since 2003, the number of employees has fallen below 1,500. Overall, between 1991 and 2005, the number of workers employed by the FIAT Termini Imerese plant fell by more than 50%, from 3,081 to 1,478. In 2006 a question mark arose over the future of the plant until a final decision to close it was taken in 2009. The last day of production was 24 November, 2011, when 1,340 workers were laid off with a vague hope of re-employment if the site is re-industrialized, however nothing has happened. Hundreds of others in FIAT and its supplier network also face potential loss of jobs. As reported above, the economic context is critical for all sectors in the local economy. The loss of jobs due to the closure of the FIAT plant and the consequent reduction in local household incomes are also affecting other economic sectors, including the fishing sector. Recent data provided by the Chambers of Commerce and analysed by the statistical office of the Province of Palermo on the number of active firms by economic sector are reported in Figure 7. Even though the number of firms cannot be considered a reliable indicator of the relevance of an economic sector, the decreasing trend in manufacturing related to FIAT is highlighted by these data. Furthermore, Figure 7 also shows an increase in the number of active firms in the touristic sector, hotels, and restaurants. This could indicate an attempt to diversify the economic structure of Termini Imerese.

8
Table 1. Employment by activity in Termini Imerese in 2001
Economic sector Employees 2001 %
Fishery and related sectors 137 2%
Manufacture sector 3091 35%
Production and distribution of energy, gas and water 130 1%
Building sector 411 5%
Commerce 1124 13%
Hotel and restaurant 194 2%
Transport 436 5%
Financial services 195 2%
Other private services 460 5%
Public Administration 811 9%
Education 1027 12%
Welfare services 563 6%
Other public services 234 3%
Total 8813 100% Source: Italian National Statistical Institute (ISTAT)
0
200
400
600
800
1000
1200
1400
1600
2005 2006 2007 2008 2009 2010 2011
Number of firm
s by sector
Other public services
Welfare services
Education
Other services
Financial services
Transport
Hotel and restaurant
Commerce
Building sector
Production and distributionof energy, gas and waterManufacture sector
Mineral extraction
Agriculture, silviculture andfishery
Figure 7. Number of firms operating in Termini Imerese by economic activity over 2005-2011 Source: Elaborations on Chamber of Commerce data

9
2.4 Fisheries Fishing in Termini Imerese, as in the majority of Italian coastal areas, is predominantly artisanal. This is evidenced by the extreme polyvalence of fishing activities and the multi-species landings composition, which reflects the high biological diversity of fish populations. Indeed, almost all vessels use a multitude of fishing systems and gears, and switch from one to another in the different periods of the year, adapting their fishing strategies to the features of the target species.
The fishing activities are mainly aimed at catching large pelagic species such as swordfish and common dolphinfish using longliners, demersal species with static gears (trammel net, gill net) and bottom longliners, and small pelagic species by seining. Even though the main bottom trawl fleet operating in the Northern coast of Sicily is located in Porticello, a small number of bottom trawlers are also present in the port of Termini Imerese.
In 2011, 75 vessels were registered in the maritime district office of Termini Imerese. Based on the DCF fleet segmentation criteria (LOA and predominant fishing gear), these are classified in Table 2.
Table 2. Termini Imerese fleet segments and fleet categories DCF fleet segment Number Fleet category
DTS VL1218 6 Bottom trawlers VL1224
PGP VL0006 17 Polyvalent VL0006
PGP VL0612 43 Polyvalent VL0618
PGP VL1218 1 Polyvalent VL0618
PMP VL0612 3 Polyvalent VL0618
PMP VL1218 3 Polyvalent VL0618
PS VL1218 2 excluded
The table above reports the number of vessels, the average length over all and the fleet category selected for reporting in this study. The two vessels classified as purse seiners (PS) have been excluded from the analysis due to their limited effect on the local fisheries community and for confidentiality reasons. Each of the remaining fleet segments has been analysed with respect to the landings composition. Regarding polyvalent vessels, significant differences arose between vessels smaller and larger than 6 m in length. As a consequence, two fleet categories have been defined, “Polyvalent VL0006” and “Polyvalent VL0618”. The combination of 4 DCF fleet segments in the fleet category “Polyvalent VL0618” is due to there being a small number of vessels longer than 12 m (4 vessels) and it is also justified by similarities in fishing gears used and the main species landed. No significant differences between vessels classified as PGP (vessels using polyvalent passive gears only) and PMP (vessels using active and passive gears) have been identified in terms of landings composition. Furthermore, even though vessels belong to different length classes, their LOA is not

10
dissimilar. The average length of vessels over 12 m is 13.2 m with a maximum of 14.1 m for a vessel belonging to the fleet segment PMP VL1218. The final list of fleet segments analysed in this report are: Polyvalent VL0006, Polyvalent VL0618 and Bottom trawlers VL1224.
Table 3 shows the number of new constructions in Termini Imerese in the period 2006-2011. Data is based on the construction year of the vessels belonging to the Italian fleet at 31/12/2011 as provided by the Italian managing authorities and included in the IREPA database. During this period, six new vessels entered the local fleet: all polyvalent vessels between 6 and 12 m (5 PGP VL0612 and 1 PMP VL0612). No vessels were constructed using public funds.
Table 3. New vessels entering the fleet of Termini Imerese
Termini Imerese 2006 2007 2008 2009 2010 2011
New constructions 1 1 1 3
Total fleet 75 72 75 75 75 75
% of new entrants 0.0% 1.4% 0.0% 1.3% 1.3% 4.0% Source: IREPA database
Vessels classified as polyvalent represent the majority of the fleet, accounting for 67 units, 50 over 6 m and 17 under 6 m. These vessels use both active and passive gears, but none of these can be identified as predominant. As a consequence, the landings composition is characterized by the presence of both demersal and pelagic species. The bigger vessels in this category also fish for large pelagic species, like swordfish and albacore. The other 6 vessels are classified as bottom trawlers given the predominant fishing gear used during the year, although these use also other fishing gears in some periods. Demersal species represent the main target for this fleet segment.
In 2011, Termini fleet landed around 460 tonnes, equivalent to more than EUR 13 million in value, registering a reduction of 47 % in volume and over 50 % in value when compared with 2006 production. The large reduction in landings was accompanied by a decline in the prices of some important species determining an even more relevant reduction in revenues. Furthermore, the increase in fuel price registered since 2008 has represented an additional negative factor to the economic performance of the feet.
Polyvalent VL0618 represents the most important fleet segment in terms of landings accounting for more than an half of the total production, while purse seine accounts for 30 % and bottom trawl VL1224 around 10 %. A remaining 6 % is landed by vessels smaller than 6 m. In terms of revenues, the highest contribution to local production is provided by Polyvalent VL0618 (more than 60 %), while bottom trawl VL1224 represents around 20 % of total revenues and polyvalent VL0006 less than 10 %. The remaining revenues are produced by the two purse seiners not included in the analysis.
Most of the vessels of Termini are active in the GSA 10 and within the 12 nautical miles. However, some vessels using drifting longlines fish also outside the 12 nm in other GSAs in some periods of the year. Generally, with the exception of vessels using drifting longlines for specific periods, trips lengths are generally one or two days for all the fleet segments.

11
Table 4. Fleet segments in Termini Imerese
Segment (length class)
Number of vessels
Main gears used Number of crew (average)
Main species fished (list at least 3 and up to 5 for all fleet types)
Main fishing locations (ICES areas)
Trip length (average days)
Polyvalent VL0006
17 Passive and active gears: trammel net, gill net, hooks, trawl, etc.
1.3 Squids, Common octopus, Greater amberjack, European hake, Common cuttlefish
GSA 10 1
Polyvalent VL0618
50 Passive and active gears: trammel net, gill net, hooks, trawl, etc.
2.0 Swordfish, Common dolphinfish, European hake, Albacore, Squids
GSA 10 1-2
Bottom trawlers VL1224
6 Bottom otter trawl, drifting longlines, set longlines
2.9 Giant red shrimp, Deep-water rose shrimp, Common octopus, Norway lobster, Common cuttlefish
GSA 10 1-2
As reported above, the area is characterised by a great variety of stocks. Statistical data on landings and prices are collected for more than 60 species. However, the main five species in terms of landings value are swordfish, European anchovy, common dolphinfish, giant red shrimp and European hake, accounting for almost 50% of total revenues. Unfortunately, biological data for these stocks are very limited. Recent assessments of Mediterranean stocks of swordfish (Xiphias gladius) carried out by ICCAT using mainly Spanish, Greek and Italian data, indicate that the rate and the level of current exploitation are not sustainable in either the short and long term. Furthermore, the same assessments show a high presence in the capture of juveniles which have never reproduced (about 50-70% of the total catch) and a very small number of large individuals. Regarding European hake (Merluccius merluccius), survey indices provided through the GRUND (Italian National Group for Demersal Resource Evaluation) and MEDITS (International bottom trawl survey in the Mediterranean) programmes indicate a variable pattern of abundance and biomass with no clear trends. As reported in STECF-12-03, “EWG 11-20 proposes F ≤ 0.2 as limit management reference point (basis F0.1 as a proxy of FMSY) consistent with high long-term yields. Given the results of the present analysis, the stock appeared to be subject to overfishing in 2006-2010, as the estimated fishing mortality was 0.63 in 2010. Regardless of the growth, a pattern considerable reduction is needed to approach the FMSY reference point (Factor; ~65-70% of the current F-value, depending on the year). However, considering the high productivity in terms of incoming year classes, this stock has the potential to recover fast if F is reduced towards FMSY”.

12
The reduction in fishing mortality proposed by the EWG 11-20 is related to the entire fleet operating in GSA 10 fishing areas. These mean that these reductions are not expected necessarily by the fleet of Termini Imerese or the fleets registered in the province of Palermo, which represent just a part of the total fleet operating in GSA 10. More details on stock assessments for these stocks can be found in the “Report of the Scientific, Technical and Economic Committee for Fisheries on Assessment of Mediterranean Sea stocks (STECF-12-03)”.
The port of Termini Imerese is the largest structure in this area, since expansion of the old harbour. It has a long outer breakwater and an inner breakwater which provide a good shelter to the boats. The site is well-sheltered from the winds of the northern quadrants, while the south wind (scirocco) creates a significant undertow inside the harbour, which complicate ferry operations including embarcation and disembarcation. The port is mainly used for cargo and freight movements in support of the adjacent industrial area. The portion intended for the mooring of fishing vessels is therefore insufficient for the number of vessels, which can use only a pier protected by boulders breakwater. A petrol station is located on the dock, while some shipyards are on the sandy shore inside the port. The shipyard area is also equipped with a basin of hauling boats up to 60 tonnes. There is also an ice factory in the port area.
2.4.1 Fleet segment 1: Polyvalent VL0006 The fleet segment Polyvalent VL0006 consists of vessels longer over all lower than 6 m, with 1 GT and 4 kW on average. Given the small size of these vessels, crew generally include only a single fisherman. As he is generally the vessel owner, the skipper and the crew, his employee-type is here defined as self-employed. These vessels use both active and passive fishing gears, like trammel nets, gillnets, hooks and trawls. The main target species are squids, common octopus, greater amberjack, European hake and common cuttlefish.
A declining trend in the volume and value of landings has been recorded over the last 10 years. The number of vessels is stable. The reduction in revenues and the increase in operating costs (fuel costs in particular) have caused a decline in the profitability of these vessels.
Fleet segment as a whole As reported above, vessels in this fleet segment are generally managed by a single fisherman, who owns a single vessel and brings together the roles of manager, skipper and crew. Of five questionnaires submitted to vessels owners in this fleet segment, the presence of a crew member other than the owner has been registered in only one case, where the owner also delegated the management of the vessel to the other fisherman. Given the constraints associated with the vessel size, the average number of employees has not changed over time and the total number of employees has remained quite stable in the last few years following the trend in the number of vessels. Regarding the role of women, the stakeholder focus group stated that women do not have any direct role in fishing activities. However, in some cases, given the long absence of fishermen from the mainland, their wives carry out an administrative role on behalf of the husbands. Furthermore, the absence of fishermen from the mainland determines also a central role of their spouses or partners in family decisions and child care. The decision-making processes related to the fishing activities is totally
13
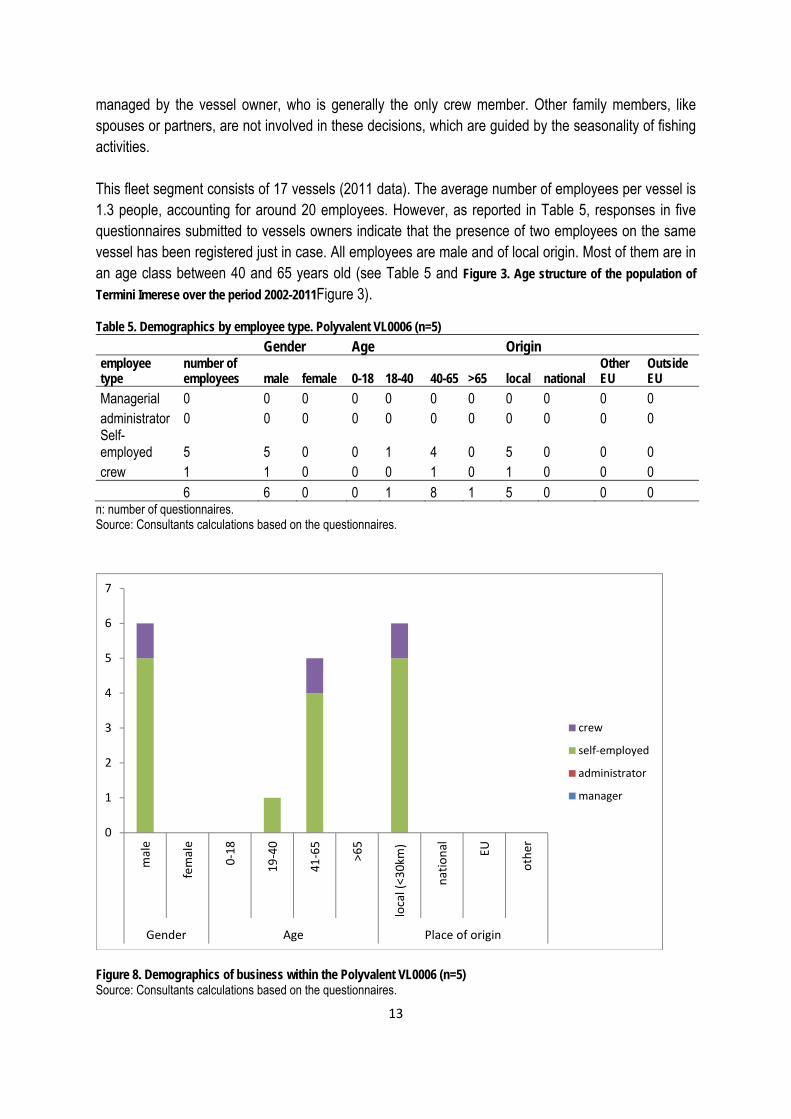
managed by the vessel owner, who is generally the only crew member. Other family members, like spouses or partners, are not involved in these decisions, which are guided by the seasonality of fishing activities. This fleet segment consists of 17 vessels (2011 data). The average number of employees per vessel is 1.3 people, accounting for around 20 employees. However, as reported in Table 5, responses in five questionnaires submitted to vessels owners indicate that the presence of two employees on the same vessel has been registered just in case. All employees are male and of local origin. Most of them are in an age class between 40 and 65 years old (see Table 5 and Figure 3. Age structure of the population of
Termini Imerese over the period 2002-2011Figure 3).
Table 5. Demographics by employee type. Polyvalent VL0006 (n=5)
Gender Age Origin employee type
number of employees male female 0-18 18-40 40-65 >65 local national
Other EU
Outside EU
Managerial 0 0 0 0 0 0 0 0 0 0 0 administrator 0 0 0 0 0 0 0 0 0 0 0 Self-employed 5 5 0 0 1 4 0 5 0 0 0 crew 1 1 0 0 0 1 0 1 0 0 0 6 6 0 0 1 8 1 5 0 0 0
n: number of questionnaires. Source: Consultants calculations based on the questionnaires.
0
1
2
3
4
5
6
7
male
female
0‐18
19‐40
41‐65
>65
local (<30km
)
national EU
other
Gender Age Place of origin
crew
self‐employed
administrator
manager
Figure 8. Demographics of business within the Polyvalent VL0006 (n=5) Source: Consultants calculations based on the questionnaires.

14
The questionnaires submitted to fishermen show that their families consist of 3.6 people on average, the householder, his wife and one or two sons (or daughters). Wives and daughters are not involved in the fisheries sector. They are housewives or defined as unemployed, while sons are students or unemployed. Table 6 shows that the number of employees recorded through questionnaires is divided between family and non-family members. As employees generally coincide with the householders, all of them are reported as family members. As reported above, the only non-family employee registered by questionnaires also has a management role. Table 6. Level of family involvement in business. Polyvalent VL0006 (n=5)
number number in management roles
family employees 5 4
non-family employees 1 1
total 6 5
n: number of questionnaires. Source: Consultants calculations based on the questionnaires. Elaborations on data provided by IREPA show a total GVA for the fleet segment equal to EUR 133,000 in 2011. This is equivalent to a GVA per vessel of almost EUR 8,000 per year. From 2006 to 2011, GVA per vessel has seen a reduction of almost 50 %. This is the result of a reduction in total revenues of 25 % and the increase in fuel price, which started in 2008. Most of the stakeholders have recognized this information as roughly representative of the local situation.
Table 7. Trend in gross value added for Polyvalent VL0006
Variable (Euro) 2006 2007 2008 2009 2010 2011
GVA 226354 206394 103088 192344 76806 133478
GVA/vessel 15090 12900 6064 11314 4267 7852 Source: Elaborations on IREPA data
Landings of this fleet segment are mainly composed by demersal species, which represent almost 85 % of the total. Squids and common octopus represent more than 30 % of total landings. The remaining landings are mainly composed of pelagic species, led by greater amberjack. From 2006 to 2011, the total landings volume has fallen by 30 %. Landings of demersal and pelagic species have been reduced by 23 % and 52 % respectively.

15
0
10
20
30
40
2006
2007
2008
2009
2010
2011
Landings volume (tonnes)
demersal pelagic shellfish
Figure 9 Trends in landings volume for Polyvalent VL0006 Source: Elaborations on IREPA data
In terms of landings value, demersal species represent 85 % of the total revenues. Squids and common octopus represent more than 35 % of total revenues for this fleet segment. The remaining 15 % of revenues is mainly due to pelagic species, where greater amberjack represents the most important species (around 10 % of total revenues). From 2006 to 2011, the reduction in landings volume has also caused an estimated 25 % reduction in revenues. Demersal species have seen a significant decrease in price while on the contrary, the reduction in landings for pelagic species has been partially counterbalanced by an increase in market price.
0
100
200
300
2006
2007
2008
2009
2010
2011
Landings value (million
EUR)
demersal pelagic shellfish
Figure 10 Trends in landings value for Polyvalent VL0006 Source: Elaborations on IREPA data Figure 11 shows the trends in prices for the main species (or groups of species) landed by vessels classified as polyvalent lower than 6 m. Marine fishes (this group includes all fishes not classified elsewhere) and squids represent the main target species in terms of revenues accounting for more than 45 % of the total. Both species have reduced by 18 % during the period under analysis. The price of common octopus, which represents 13 % of total landings value, has shown a stable trend. The other two main species, greater amberjack and European hake have registered an increase in price by 16 % and 23 % respectively.

16
0.00
2.00
4.00
6.00
8.00
10.00
12.00
14.00
16.00
2006
2007
2008
2009
2010
2011
Landed
price (EU
R/kg)
Marine fishes nei Squids Common octopus
Greater amberjack European hake
Figure 11 Trends in landings prices of main species for Polyvalent VL0006 Source: Elaborations on IREPA data
The number of vessels shows a stable trend, as well as gross tonnage and engine power. The vessels have increased by only 2 units from 2006 to 2011, moving from 15 to 17 boats.
13141516171819
2006
2007
2008
2009
2010
2011
Number of vessels
Polyvalent VL0006
Figure 12 Trends in number of vessels for Polyvalent VL0006 Source: Elaborations on IREPA data

17
0
20
40
60
80
2006
2007
2008
2009
2010
2011
Segm
ent power (kW)
Polyvalent VL0006
Figure 13 Trends in engine power for Polyvalent VL0006 Source: Elaborations on IREPA data
16.5
17
17.5
18
18.5
2006
2007
2008
2009
2010
2011Se
gment tonnage (GT)
Polyvalent VL0006
Figure 14 Trends in gross tonnage for Polyvalent VL0006 Source: Elaborations on IREPA data Remuneration type is based on a share-contract system. The difference between revenues and operating costs is divided into two parts, one directed to remuneration of crew and another the ship owner. This type of contract dominates in Mediterranean fisheries. Even though a minimum salary is established by the Italian laws, this is used only for calculating and paying social security contributions.
Table 8. Remuneration type by vessel. Polyvalent VL0006 (n=5)
Remuneration type no. people piece 0 share 6 wage 0
n= number of questionnaires. Source: Consultants calculations based on the questionnaires. As reported above, the economic performance of the fleet segment is negative. The reduction in revenues combined with increases in fuel costs have resulted in a significant decline in gross value added. The stakeholders interviewed have identified the European and international regulations as the main factors influencing this situation. These regulations have limited the possibilities for larger vessels

18
to fish tuna and swordfish (which represented the most important target species of larger vessels in the past) forcing them to compete for the same species as the smaller vessels. This has increased the fishing effort on these species and reduced their biomass. Furthermore, limiting the fishery for large pelagics is also affecting the biomass of small pelagic fish as a consequence of the strong increase in tunas and the associated predation effects.
Employees within segment For all employee-types, pensions are the only benefit provided by businesses. There are no additional benefits beyond regular salaries and pensions. Almost all fishermen employed in this fleet segment declared their income was below EUR 10,000 with only the self-employed component declaring a salary between EUR 20,000 and 29,000.
Table 9. Salary band by employee type (EUR). Polyvalent VL0006 (n=5) employee type <10 000 10 000-19 000 20 000-29 000 total Managerial 0 0 0 0 administrator 0 0 0 0 self-employed 4 0 1 5 crew 1 0 0 1
n= number of questionnaires. Source: Consultants calculations based on the questionnaires. Fishers are characterised by being male, in good health and member of a family involved in the fisheries sector. There appear to be no formal barriers to entry, as the only qualification typically declared by the fishers interviewed is represented by the seaman certificate (libretto di navigazione). There are three different categories associated with the registration of this certificate, and all fishers in this segment are registered as third categories (specific for coastal fishing). However, the registration to the first or third category does not need any specific attribute or skill, just requiring an administrative document needed to be employed on a vessel. Fishers could obtain other qualifications based on their experience or attending specific training courses. However, given the family-based organization of the local fishing sector, they do not need additional qualifications to work. Most of the fishers interviewed have a primary education level (Figure 15), however, there are also cases of people with a more advanced education level. All fishers interviewed had no previous experience in other sectors as fishing was the first form of employment they had obtained. Most are not satisfied with their jobs and the majority are considering changing jobs in the future to something beyond the fishing sector.
In the past, some fishermen left their jobs for employment at the vehicle-producing FIAT plant and its supplier network. With the crisis of the local plant of FIAT, some fishers are returning to the fishing sector, in some cases informally.

19
0
1
2
3
4
5
6Number of employees
None Primary school Secondary (16) Secondary (18) Bachelor degree
Figure 15. Education level of fishermen employed in Polyvalent VL0006 (n=6) Source: Consultants calculations based on the questionnaires. The level of transferability of skills in the fishing sector was high within the family in the past. Questionnaires show that the fathers of most of the fishermen interviewed were fishermen or port workers. However, new generations are not interested in the fishing sector and their fathers would like a different job for them. The transferability of skills was carried out by the direct involvement of sons in the fishing activities since their young age. Currently, this is no longer feasible both because their involvement needs too many formal requirements and because fishing activity has lost its attractiveness among the next generation as a consequence of the declining economic performance of the fishing sector. Fishermen told that when they were children, they were proud to go fishing with their fathers and there was a sort of competition among fishermen sons to go fishing before the others. Nowadays, this is not possible as the minimum legal working age is 16 years old and the presence of younger people on the vessel can be seen as child labour. Even though Italian law on the legal working age was established in 1967 (minimum age at 15 years old, increased to 16 years old in 2007), there were no particular controls in the past. Furthermore, the presence of people older than 16 years on the vessel can be subject to control and fines if they are not registered as fishermen. One fishermen described the case of his father, a retired fisherman, who was requested by his son to board his vessel to check the malfunctioning of the vessel engine. Stopped by the Coast Guard, they risked a fine because his father is no longer an active fisherman and was not allowed to be on board the vessel.

20
Fishers’ perception of their own wealth is low, and this is consistent across whole fishing sector. Their level of wealth has fallen in recent years; believed to be due to economic conditions in the local fishing sector which have changed since the introduction of EU regulations which did not take into account local specificities and have negatively affected the sector. Fishers do not feel they are represented by European, national or local institutions, nor by organizations like labour unions. They complain of a complete lack of representation of their interests and economic situation. The only organizations available are represented by the fishing cooperatives, which can only provide administrative support. Regarding the negative economic performance of the fleet segment, fisher behaviour has been quite static. Besides attempts to modify the composition of landings by switching among the different target species and fishing gears available under their fishing licenses, they are not able to carry out any significant initiatives to modify their status. This is due to the lack of institutions and/or organizations able to defend their interests and propose solutions. Furthermore, the low education level of the people involved in this business and the lack of alternative employment opportunities represent strong constraints to the possibility of adaptation.
2.4.2 Fleet segment 2: Polyvalent VL0618 The fleet segment Polyvalent VL0618 consists of vessels longer than 6 m, with 3 GT and 40 kW on average. Employees generally consist of two fishermen, the skipper and a crew member. However, as well as for the Polyvalent VL0006, some vessels are managed by a single person. In these cases, these are defined as self-employed owner operators. Therefore, three employment types are defined for this fleet segment: self-employed, skipper and crew. These vessels use both active and passive fishing gears, like bottom longlines, trammel nets, gillnets, hooks, trawl. The main target species are swordfish, common dolphinfish, albacore, European hake and squids. A declining trend in the volume and value of landings was recorded over the last six years while the number of vessels classified as polyvalent over 6 m has increased. The reduction in revenues and the increase in operating costs (fuel costs in particular) have caused a decline in the profitability of these vessels.
Fleet segment as a whole As reported above, vessels in this fleet segment are generally managed by two fishers. The skipper is generally also the vessel owner, who usually owns a single vessel. The number of employees does not change over time; of eight vessels owners interviewed in this fleet segment, only one stated he changes the number of people employed as a consequence of the seasonality of the fishing methods adopted. Most of the crew members are selected within the family (usually sons) while only one third of the crew are not related to the vessel owner. The average number of employees has slightly decreased over time, and so the total number of employees has also declined, even if partially counterbalanced by the increase in the number of vessels classified as polyvalent.

21
Regarding the role of women, the stakeholder focus group stated that women do not have any direct role in fishing activities. However, in some cases, given the long absence of fishermen from the mainland, their wives carry out an administrative role on behalf of the husbands. Furthermore, the absence of fishermen from the mainland determines also a central role of their spouses or partners in family decisions and child care.
The decision-making process related to fishing activities is totally managed by the vessel owner, who is generally also the skipper. Other family members, like spouses or partners, are not involved in these decisions, which are guided by the seasonality of fishing activities. This fleet segment consists of 50 vessels (2011 data). The average number of employees per vessel is calculated as two people, accounting for around 100 employees. All employees are male and of local origin. Employees are concentrated in the age band of 40-65 years and a minority is aged between 18 and 40 (see Table 10 and Figure 16).
Table 10. Demographics by employee type. Polyvalent VL0618 (n=8)
Gender Age Origin employee type
number of employees male female 0-18 18-40 40-65 >65 local national EU Outside EU
Managerial 0 0 0 0 0 0 0 0 0 0 0 Self-employed 4 4 0 0 1 3 0 4 0 0 0 Skipper 4 4 0 0 1 3 0 4 0 0 0 crew 3 3 0 0 1 2 0 3 0 0 0 11 11 0 0 3 8 0 11 0 0 0
n: number of questionnaires. Source: Consultants calculations based on the questionnaires.

22
0
2
4
6
8
10
12
male
female
0‐18
19‐40
41‐65
>65
local (<30km
)
national EU
other
Gender Age Place of origin
crew
skipper
self‐employed
manager
Figure 16. Demographics of business within the Polyvalent VL0618 (n=8) Source: Consultants calculations based on the questionnaires. The questionnaires submitted to fishermen show that their families consist of three people on average for crew members and four people for skippers. Generally, these are the fisher, his wife and one or two sons (or daughters). However, in a few cases, crew members still live with their parents and siblings. The women in the family are not involved in the fisheries sector, but are usually housewives (mothers and wives) or students (daughters). Few cases of wives employed in sectors other than fisheries have been also recorded. Generally, sons are students and are not involved in the fishing sector but a number of the daughters have been registered as unemployed. Table 11 shows the number of employees registered through questionnaires divided into family and non-family members. As reported above, just one third of the crew members are different to the vessel owner (six cases) and have no family relationship with him. The participation of family members, such as sons and brothers, in the fishing activity of the householder is due to the traditional nature of the fishing activities - which are passed down from father to son – combined with a lack of alternative employment opportunities. Table 11. Level of family involvement in business. Polyvalent VL0618 (n=8)
Number Number in management roles
Family employees 9 7
Non-family employees 2 1
Total 11 8
n: number of questionnaires. Source: Consultants calculations based on the questionnaires.

23
Data provided by IREPA show a total GVA for the fleet segment equal to EUR 850,000 in 2011. This is equivalent to a GVA per vessel of around EUR 17,000 annually. From 2006 to 2011, GVA per vessel has registered a reduction of around 65 %. This is the result of a reduction in total revenues of almost 50 % and the increasing fuel price, which started in 2008. Data showed to stakeholders seem to be realistic as most of them have recognized that this information is roughly representative of the local situation.
Table 12. Trend in gross value added for Polyvalent VL0618
Variable (Euro) 2006 2007 2008 2009 2010 2011
GVA 2395886 1576351 654918 1422636 943259 859920
GVA/vessel 50976 33539 13366 29033 19250 17198 Source: Elaborations on IREPA data
Landings of this fleet segment are mainly composed by pelagic species, which represent more than 60 % of the total. The main stock is swordfish, which represents more than 20 % of total landings. Another 30 % consists of common dolphinfish (17 %) and albacore (13 %). The most important demersal species is European hake, which represents 5 % of total landings, followed by squid and silver scabbardfish. From 2006 to 2011, total landings volume has been reduced by 60 %. Landings of demersal and pelagic species have been reduced by 36 % and 68 % respectively. However, a sharp reduction in the landings of pelagic species occurred from 2006 to 2007.
0
200
400
600
2006
2007
2008
2009
2010
2011
Landings volume (tonnes)
demersal pelagic shellfish
Figure 17 Trends in landings volume for Polyvalent VL0618 Source: Elaborations on IREPA data In terms of landings value, pelagic species represent almost 60 % of the total revenues. The main stock is swordfish, which represents 30 % of total revenues, followed by common dolphinfish which accounts for 10 % of landings in value. The most important demersal species is European hake, which represents 8 % of total revenues. From 2006 to 2011, the reduction in landings volume has determined also a reduction in revenues estimated in almost 50 %. This reduction is due to both demersal and pelagic species. However, the reduction in landings for pelagic species has been partially

24
counterbalanced by an increase in market price, while prices for demersal species have declined during the period analysed.
0
500
1000
1500
2000
25002006
2007
2008
2009
2010
2011
Landings value (million
EUR)
demersal pelagic shellfish
Figure 18 Trends in landings value for Polyvalent VL0618 Source: Elaborations on IREPA data Figure 19 shows the trends in prices for the main species (or groups of species) landed by vessels classified as polyvalent higher than 6 m. The price of swordfish has remained almost stable while other pelagic species such as albacore and common dolphinfish, have increased significantly. In contrast, demersal species including European hake and the group of Marine fishes (this group includes all fishes not classified elsewhere), have declined in price during the period under analysis.
0.00
2.00
4.00
6.00
8.00
10.00
12.00
14.00
2006
2007
2008
2009
2010
2011
Landed price (EU
R/kg)
Swordfish Marine fishes nei Common dolphinfish
European hake Albacore
Figure 19 Trends in landings prices of main species for Polyvalent VL0618 Source: Elaborations on IREPA data

25
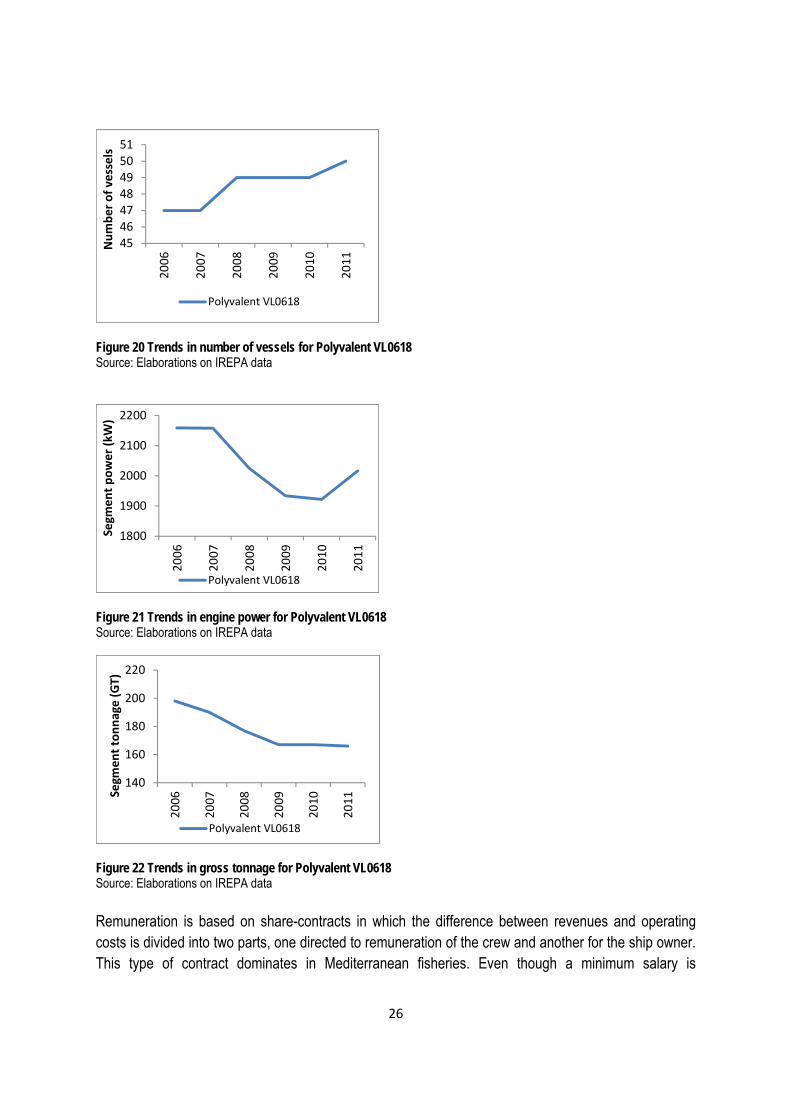
The number of vessels shows an increasing trend from 2006 to 2011. The total number of vessels classified in this fleet segment has increased of three units from 47 in 2006 to 50 in 2011, whereas engine power and gross tonnage show a declining trend. This would suggest a significant reduction in the average size and power of the vessels classified as polyvalent.
An increase in the number of vessels even when economic performance is declining is not necessarily surprising as the decline in economic performance of the fisheries is common to the entire area of Northern Sicily as well as other Sicilian coastal areas. Each year a number of vessels move from one port to another (generally along the same coast) changing the maritime district where they are registered. The balance between these administrative variations can result in an increase in the number of vessels even in a situation of economic crisis.
Between 2008 and 2011, 9 vessels entered this fleet segment and 8 vessels left resulting in an increase of a unit. The Fleet Register shows that four of the vessels that entered the fleet segment were from other ports (Patti Marina, Sant’Agata di Militello, Isola delle Femmine and Lipari) and 5 vessels were new constructions. In the same period, 5 vessels moved to other ports (Palermo, Siracusa, Scoglitti and Terrasini) and 3 vessels were retired (a vessel scrapped with public aid).
As reported above, the fleet segment “Polyvalent VL0618” consists of DCF fleet segments PGP VL0612, PGP VL1218, PMP VL0612 and PMP VL1218. Most vessels in “Polyvalent VL0618” are smaller than 12 m. In 2011, just 4 vessels (of a total of 500 were longer than 12 m. The increasing trend was due to the DCF fleet segment PGP VL0612, which increased from 37 to 43 vessels in the period 2006-2011. In contrast PGP 1218 remained almost stable.
Vessels classified as PMP VL1218 show a particularly strong reduction in 2009. However, this is partially due to a change in vessels classification. Indeed, for statistical reasons three of the vessels classified as PMP VL0612 in 2009 and 2010 were included in the DCF fleet segment PMP VL1218 in previous years (even though LOA is lower than 12 m)1. The effective reduction in PMP VL1218 can be estimated as 3 units in the period under analysis.
Table 13. Trend in number for DCF fleet segments included in polyvalent VL0618
Fishing technique LOA 2006 2007 2008 2009 2010 2011
PGP VL0612 37 37 39 41 41 43
PGP VL1218 1 2 2 1 1 1
PMP VL0612 3 4 3
PMP VL1218 9 8 8 4 3 3
polyvalent VL0618 47 47 49 49 49 50
Source: IREPA database
1 As foreseen by EU Decision 93/2010, when a DCF fleet segment has less than 10 vessels (this should be the case of PMP VL0612), clustering may be necessary in order to design the sampling plan.
26
45464748495051
2006
2007
2008
2009
2010
2011
Number of vessels
Polyvalent VL0618
Figure 20 Trends in number of vessels for Polyvalent VL0618 Source: Elaborations on IREPA data
1800
1900
2000
2100
2200
2006
2007
2008
2009
2010
2011
Segm
ent power (kW)
Polyvalent VL0618
Figure 21 Trends in engine power for Polyvalent VL0618 Source: Elaborations on IREPA data
140
160
180
200
220
2006
2007
2008
2009
2010
2011Se
gment tonnage (GT)
Polyvalent VL0618
Figure 22 Trends in gross tonnage for Polyvalent VL0618 Source: Elaborations on IREPA data Remuneration is based on share-contracts in which the difference between revenues and operating costs is divided into two parts, one directed to remuneration of the crew and another for the ship owner. This type of contract dominates in Mediterranean fisheries. Even though a minimum salary is

27
established by the Italian laws, this is used only for calculating and paying the social security contributions.
Table 14. Remuneration type by vessel. Polyvalent VL0618 (n=8)
Remuneration type no. people piece 0
share 11
wage 0
n= number of questionnaires. Source: Consultants calculations based on the questionnaires. As reported above, the economic performance of the fleet segment is negative. The reduction in revenues and the increase in fuel costs have determined a significant decline of the gross value added. The stakeholders interviewed identified the main reasons for this situation as being European and international regulations. These regulations have limited the possibilities for vessels classified in this fleet segment to fish for tuna and swordfish (which represented the most important target species of larger vessels in the past). Indeed, the strong reduction in landings is mainly related to species like swordfish and albacore.
Employees within segment For all employee-types, pensions are the only benefits provided by the business with no additional benefits. All fishers employed in this fleet segment declared an annual salary below EUR 10,000.
Table 15. Salary band by employee type (EUR). Polyvalent VL0618 (n=8) employee type <10 000 10 000-19 000 20 000-29 000 total Managerial 0 0 0 0 Self-employed 4 0 0 4 skipper 4 0 0 4 crew 3 0 0 3
n= number of questionnaires. Source: Consultants calculations based on the questionnaires. Entering the fleet segment does not require any specific attribute other than to be male, in good health and member of a family involved in the fisheries sector. Generally, the only qualification declared by the fishermen interviewed is the seaman certificate (libretto di navigazione). There are three different categories associated with the registration of this certificate and the local fishermen are generally registered in the third category (specific for coastal fishing). However, the registration to first or third category does not need any specific attribute or skill; it is simply administrative document needed to be

28
employed on a vessel. Fishermen may obtain other qualifications based on their experience or attending specific training courses, however, they do not need additional qualifications to work. Almost all the fishermen interviewed received a primary education level (Figure 23). Of 11 employees in the sample, only a self-employed person and a crew member had a more advanced education level. Fishing was the first form of employment for all fishers, although they are generally not satisfied with their job. Skippers declared a level of satisfaction higher than for crew, having never looked for a different job and showing no interesting in changing jobs, while almost all crew members have looked for a new job in last year and would like to work beyond the fisheries section in the future. In the past, some fishermen left the fisheries for employment in vehicle production at the FIAT plant and its supplier network. But with the crisis of the local FIAT plant, some are now returning to the fishing sector. There is no labour mobility between fleet segments in the sense that no fishermen leave a fleet segment to work in another one.
0
0.5
1
1.5
2
2.5
3
3.5
4
4.5
Number of employees
None Primary school Secondary (16) Secondary (18) Bachelor degree
Figure 23. Education level of fishermen employed in Polyvalent VL0618 (n=8) Source: Consultants calculations based on the questionnaires. The level of transferability of skills in the fishing sector is high within the family in terms of being passed down from generation to generation. Questionnaire results indicate that the fathers of almost all the fishers interviewed were fishermen. The transferability of skills was carried out by the direct involvement of sons in the fishing activities from a young age. Currently, this is no longer feasible because their involvement needs too many formal requirements (for instance, they should be registered as fishermen

29
even if this is not their main job) and because fishing activity has lost its attractiveness among the younger generation as a consequence of the declining economic performance of the sector. The perception of their own wealth is low for all employees, particularly for crew members rather than the self-employed and skippers. Their level of wealth has reduced in the last 10 years, thought to be due to the economic impact of certain EU regulations which did not account for local specificities and had negatively affected the sector. Fishers do not feel they are represented by European, national and local institutions, nor by organizations such as labour unions. They complain of a complete lack of representation of their interests and economic situation. The only organizations available are the fishing cooperatives, which can provide only administrative support. Regarding the negative economic performance of the fleet segment, fisher behaviour has been quite static. Besides attempts to modify the composition of landings by switching among the different target species and fishing gears available in their fishing licenses, they are not able to carry out any significant initiative to modify their status. This is due to a lack of institutions and/or organizations able to defend their interests and propose solutions. Furthermore, the low education level of the people involved in this business and the lack of alternative employment opportunities represent strong constraints to the possibility of adaptation.
2.4.3 Fleet segment 3: Bottom trawl VL1224 The fleet segment Bottom trawl VL1224 consists of vessels with a length over all between 12 and 24m, with 18 GT and 137 kW on average. Employees generally consist of 3 people including the skipper, who is usually also the vessel owner. These vessels use bottom otter trawls as the dominant fishing gear, although other fishing gears are also used. The main target species are giant red shrimp, deep-water rose shrimp, common octopus, Norway lobster and common cuttlefish.
A declining trend in the volume and value of landings has been recorded over the last six years and the number of vessels has decreased in the same period (2006-2011). The reduction in revenues and the increase in operating costs (fuel costs in particular) have resulted in a decline in the profitability of these vessels.
Fleet segment as a whole As reported above, vessels in this fleet segment are generally managed by 3 fishermen. The skipper is generally also the vessel owner, who normally owns just one vessel. Of the eight vessel owners interviewed in this fleet segment, two declared more than one vessel (2 vessels) and only person stated that the number of employees varied in the year as a consequence of the seasonality of the fishing methods adopted. Around two thirds of crew members had been recruited from within the family, generally being fathers and/or brothers of the vessel owner. There were also a few cases of female vessel ownership, where husbands were employed as skippers. The average number of employees

30
increased between 2006 and 2010, with a sharp reduction in the last year of data available (year 2011), while the total number of employees declined, linked to the falling number of vessels. Regarding the role of women, the stakeholder focus group stated that women do not have any direct role in fishing activities. However, in some cases, given the long absence of fishermen from the mainland, their wives carry out administrative roles on behalf of the husband and in some cases, to simplify the administrative process, the ownership of the vessel is assigned to the wife. Furthermore, the absence of fishermen from the mainland determines also a central role of their spouses or partners in family decisions and child care. The decision-making processes related to fishing activities is totally managed by the vessel owner or skipper (when the vessel owner is a woman, which suggests this type of ownership is purely administrative and does not denote female responsibility). Other family members, such as spouses or partners, are not involved in these decisions, which are guided by the seasonality of fishing activities. This fleet segment consists of six vessels (2011 data). The average number of employees per vessel is three people, accounting for around 18 employees. All employees are male and of local origin. They are equally distributed between the age classes 18-40 and 40-65, with skippers predominating in the age class 40-65 and crew in the 18-40 category (see Table 16 and Figure 24).
Table 16. Demographics by employee type. Bottom trawl VL1224 (n=8)
Gender Age Origin employee type
number of employees male female 0-18 18-40 40-65 >65 local National
Other EU
Outside EU
Managerial 0 0 0 0 0 0 0 0 0 0 0 administrator 0 0 0 0 0 0 0 0 0 0 0 Skipper 7 7 0 0 2 5 0 7 0 0 0 crew 10 10 0 0 7 3 0 10 0 0 0 17 17 0 0 9 8 0 17 0 0 0
n: number of questionnaires. Source: Consultants calculations based on the questionnaires.

31
0
2
4
6
8
10
12
14
16
18
male
female
0‐18
19‐40
41‐65
>65
local (<30km
)
national EU
other
Gender Age Place of origin
crew
skipper
administrator
manager
Figure 24. Demographics of business within the Bottom trawl VL1224 (n=8) Source: Consultants calculations based on the questionnaires. The questionnaires submitted to fishers show that their families consist of three people on average, whether crew or skippers. Generally, these are the householder, his wife and a son (or daughter). The women in the family are not involved in the fisheries sector but are generally housewives (mothers and wives) or students (daughters). Sons are usually students or fishers with only one example of a son working in another sector. When they are involved in the fisheries sector, this is in the same fleet segment as their fathers. In these cases, they are regularly employed as crew with a permanent position and paid through a share-contract. Table 17 shows the number of employees registered through questionnaires divided between family and non-family members. As reported above, around one third of crew members are not related to the vessel owner. The participation of family members, such as sons and brothers, in the fishing activity of the household is due to the traditional nature of the fishing activities, which are passed down from father to son, and the lack of alternative employment opportunities.

32
Table 17. Level of family involvement in business. Bottom trawl VL1224 (n=8)
number number in management roles
family employees 11 7
non-family employees 6 0
total 17 7
n: number of questionnaires. Source: Consultants calculations based on the questionnaires. Data provided by IREPA show a total GVA for the fleet segment of around EUR 100,000 in 2011. This is equivalent to a GVA per vessel of around EUR 17,000 per year. There is no clear trend in the data; GVA is declining in the first three years, increasing in 2009 and 2010, and shows a strong reduction in 2011. This reduction was due to a reduction in total revenues of more than 20 % and an increase in operating costs. Data showed to stakeholders was not regarded as representative, particularly, the strong difference in the values for 2009 and 2010 with the 2011 value. However, they confirmed a declining trend in profitability. Unfortunately, alternative data is not available. GVA per vessel can be estimated indirectly by using the declarations of local fishermen of their current wage. Table 20 shows that wages for employees in this fleet segment are lower than EUR 10,000. Taking into account that 3 people are employed on average on these vessels and that wages represent around 50% (as salary is based on the share contract) of the monte, i.e. the difference between total revenues and variable costs, monte per vessel should be lower than EUR 60,000. GVA per vessel can be calculated by subtracting fixed costs from monte. As fixed costs represent around 18% of GVA (this percentage is derived from AER data on Italian DTS fleet segments), GVA per vessel is expected to be lower than EUR 50,000 (Table 18).
Table 18. Trend in gross value added for Bottom trawl VL1224
Variable (Euro) 2006 2007 2008 2009 2010 2011
GVA 956737 378447 93048 591913 445261 103385
GVA/vessel 86976 47306 13293 84559 74210 17231 Source: Elaborations on IREPA data
Landings of this fleet segment are mainly composed of demersal species and shellfish, which represent more than 90 % of the total. The shellfish species deep-water rose shrimp and giant red shrimp are the most important, accounting for 25 % and 15 % of total landings respectively. The most important demersal species are common octopus and horned octopus. A strong reduction in landings was recorded from 2006 to 2007 with a subsequent decline beginning in 2009. From 2007 to 2011 the total volume of landings decreased by 33 % while landings of demersal and shellfish species have reduced by 45 % and 17 % respectively.

33
0
20
40
60
80
2006
2007
2008
2009
2010
2011
Landings volume (tonnes)
demersal pelagic shellfish
Figure 25 Trends in landings volume for Bottom trawl VL1224 Source: Elaborations on IREPA data
In terms of landings value, shellfish species represent around 70 % of total revenues, while demersal species account for 30 % of revenues. Giant red shrimp and deep-water rose shrimp represent more than 60 % of total revenues, while the other 40 % consists of a relevant number of demersal and shellfish species. A strong reduction in landings is registered from 2006 to 2007, however, the trend was also negative in the following period. From 2007 to 2011, the reduction in landings volume led to a reduction in revenues of around 40 %. This reduction was due to both shellfish and demersal species, which have registered a significant decrease in price.
0
500
1000
1500
2006
2007
2008
2009
2010
2011
Landings value (million
EUR)
demersal pelagic shellfish
Figure 26 Trends in landings value for Bottom trawl VL1224 Source: Elaborations on IREPA data Figure 27 shows the trend in prices for the main species landed by vessels classified as bottom trawlers larger than 12 m. With the exception of giant red shrimp, all these species show a reduction in price from 2006 to 2011, however, there is no clear trend. Between 2008 and 2010 prices showed a general increase, but were followed by a reduction in 2011.

34
0.00
5.00
10.00
15.00
20.00
25.00
30.00
35.00
40.00
45.00
2006
2007
2008
2009
2010
2011
Landed price (EU
R/kg)
Giant red shrimp Deep‐water rose shrimp
Common octopus Norway lobster
Common cuttlefish
Figure 27 Trends in landings prices of main species for Bottom trawl VL1224 Source: Elaborations on IREPA data
The number of vessels fell from 11 vessels in 2006 to six vessels in 2011. The gross tonnage and the engine power followed a similar negative trend.
024681012
2006
2007
2008
2009
2010
2011
Number of vessels
Bottom trawlers VL1224
Figure 28 Trends in number of vessels for Bottom trawl VL1224 Source: Elaborations on IREPA data

35
0
500
1000
1500
2000
2006
2007
2008
2009
2010
2011
Segm
ent power (kW)
Bottom trawlers VL1224
Figure 29 Trends in engine power for Bottom trawl VL1224 Source: Elaborations on IREPA data
0
100
200
300
2006
2007
2008
2009
2010
2011Se
gment tonnage (GT)
Bottom trawlers VL1224
Figure 30 Trends in gross tonnage for Bottom trawl VL1224 Source: Elaborations on IREPA data Remuneration is based on share-contract. The difference between revenues and operating costs is divided into two parts, one directed at remunerating the crew and the other the ship owner. This type of contract is the dominant one in the Mediterranean fisheries sector. Even though a minimum salary is established by the Italian laws, this is used only for calculating and paying the social security contributions.
Table 19. Remuneration type by vessel. Bottom trawl VL1224 (n=8)
Remuneration type No. people piece 0
share 17
wage 0
n= number of questionnaires. Source: Consultants calculations based on the questionnaires. As reported above, the economic performance of the fleet segment is negative. The reduction in revenues and the increase in fuel costs have caused a significant decline in the GVA. The stakeholders

36
interviewed identified the European and international regulations as the main factors driving this situation. They recognise that demersal stocks are overexploited and there is a decline in their biomass. From their point of view, this is due to regulations that have restricted larger vessels fishing tuna and swordfish (which represented the most important target species of larger vessels in the past) forcing them to compete for the same demersal and shellfish species targeted by bottom trawlers. This has increased the fishing effort on these species and reduced their biomass. Furthermore, the increase in fuel price has forced trawlers to fish closer to the coast in order to saving fuel.
Employees within segment For all employee-types, pensions are the only benefits provided with no additional benefits provided beyond the regular salary and the pension. All fishermen employed in this fleet segment declare a salary lower than EUR 10,000 per year.
Table 20. Salary band by employee type (EUR). Bottom trawl VL1224 (n=8)
employee type <10 000 10 000-19 000 20 000-29 000 total Managerial 0 0 0 0 administrator 0 0 0 0 skipper 7 0 0 7 crew 10 0 0 10
n= number of questionnaires. Source: Consultants calculations based on the questionnaires. Entering the fleet segment does not require any specific attribute other than to be male, in good health and member of a family involved in the fisheries sector. Generally, the only qualification declared by the fishermen interviewed is the seaman’s certificate (libretto di navigazione). There are three different categories associated with the registration of this certificate and the local fishermen are registered as the third category (specific for coastal fishing). However, the registration to these categories does not need any specific attribute or skill, simply representing an administrative document required for employment on a vessel. Fishermen could obtain other qualifications based on their experience or attending specific training courses. However, given the family-based organization of the local fishing sector, they do not need additional qualifications to work. All fishermen interviewed have a primary education level (Figure 31). All of them got their first job in the sector, but expressed general dissatisfaction with their job. Skippers declared a level of satisfaction higher than amongst the crew, having never looked for another job and are not interesting in alternatives, while most of the crew members have looked for a new job in last years and would like to change their job in future. They were not able to indicate which alternative job they would be interested in, but they stated that this should be outside the fishing sector. There is no labour mobility between fleet segments in the sense that there are no fishermen that leave a fleet segment to work in another one.

37
0
2
4
6
8
10
12Number of employees
None Primary school Secondary (16) Secondary (18) Bachelor degree
Figure 31. Education level of fishermen employed in Bottom trawl VL1224 (n=8) Source: Consultants calculations based on the questionnaires. The level of transferability of skills in the fishing sector is very high, within the family. Questionnaires show that the fathers of all the fishermen interviewed were fishermen. The transferability of skills was carried out by the direct involvement of sons in the fishing activities from a young age. Currently, this is no longer feasible both because their involvement needs too many formal requirements (they should be registered as fishermen even if this is not their main job) and because fishing activities have lost their attractiveness to sons of fishers as a consequence of the negative economic performance of the sector. The perception of their own wealth across all fleet segments is very low. Their level of wealth has fallen in the last 10 years, thought to be due to the economic impact of EU regulations which did not take into account local specificities and have negatively affected the sector. Fishers do not feel they are adequately represented by European, national and local institutions, nor by organizations such as labour unions. They complain of a complete lack of representation of their interests and economic situation. The only organizations available are fishing cooperatives, providing administrative support. Regarding the negative economic performance of the fleet segment, fisher behaviour has been quite static in response. Besides attempts to modify the composition of landings by switching between the different target species and fishing gears available in their fishing licenses, they are not able to carry out any significant initiatives to improve their status. This is due to the lack of institutions and/or organizations able to defend their interests and propose solutions. Furthermore, the low education level of the people involved in this business and the lack of alternative employment opportunities represent

38
further constraints to potential adaptation. If the development of the industrial area with the opening of the FIAT plant allowed some fishermen to leave their job, and to be employed as worker in the manufacture sector, then the current crisis is producing the opposite effect.
2.5 Summary of settings The economic performance of vessels located in the port of Termini Imerese is negative. All fleet segments show a declining trend in landings and revenues and the increase in fuel price which began in 2008, even with fluctuations, has increased operating costs. This has mainly affected vessels with high fuel consumption, such as bottom trawlers. Data obtained for these fleets from IREPA databases are not always representative of the real local situation. But the negative trend in landings and revenues, especially for demersal species, is confirmed by the local stakeholders. Fishers are of the opinion that these trends are the consequence of European regulations which do not take into account the specificities of local fisheries communities. In particular, these regulations have limited the fishing of tuna and swordfish by larger vessels (which represented important target species of larger vessels in the past) forcing them to compete for the main target species of smaller vessels, demersal species. This has increased the fishing pressure on these species and reduced their biomass. Furthermore, increased effort on demersal and shellfish stocks has been caused by the increase in fuel prices, which have pushed bottom trawlers to operate closer to the coast. The difference between EU regulations and the reality of local fisheries are related also to a number of technical measures regarding the dimensions and positions of equipment they are obliged to take on board. In many cases, given the small dimensions of the vessels, it is very difficult to comply with these regulations. Furthermore, these regulations do not take into account the low education level of local fishermen. The negative performance of the fisheries has not affected the fleet dimension. The number of vessels registered in Termini Imerese has been stable for a long time and the reduction in bottom trawlers has been counterbalanced by an increase in polyvalent vessels. This is due to a lack of alternative employment opportunities. The possibility of working in the manufacturing sector or other industrial sectors has been greatly reduced with the recurrent crises in vehicle production subsectors and satellite activities. The current economic crisis and the low level of education of people employed in the fishing sector represent constraints to changing jobs. The business structure in the fishing sector is generally family-based and only a limited number of people employed on these vessels are not related to the vessel owner. Family members involved in fishing activities are generally brothers and sons, however, the fisheries sector is not particularly attractive to younger generations. All crew members are male with the majority aged between 40 and 65 years old. Only the employees on bottom trawlers are equally distributed between age classes 19-40 and 40-65.

39
Regarding the role of women, the stakeholder focus group stated that women do not have any direct role in fishing activities. However, in some cases, given the long absence of fishermen from the mainland, their wives carry out an administrative role on behalf of their husbands. In some cases, to simplify the administrative process, the ownership of the vessel is assigned to the wife. Furthermore, the absence of fishermen from the mainland determines also a central role of their spouses or partners in family decisions and child care. The education level is generally very low. Almost all people involved in fishing activities have a primary level. As reported above, this represents a relevant handicap for the adaptability to the changes occurred in the sector. The average annual income is lower than EUR 10,000 for almost all people interviewed. Generally, this salary of is the only source of income for the household (wives are usually housewives). The family income is only higher if more than one family member is involved in the fishing sector.
Table 21. Summary of settings
Polyvalent VL0006 Polyvalent VL0618 Bottom trawl VL1224
Target species status Decreasing Unknown Decreasing
Fleet evolution Stable Increasing Decreasing
Business type Family Family Family
Demographics Age class 40-65 Age class 40-65 Age classes 19-40 and 40-65 equally distributed
Average annual income (EUR) <10,000 <10,000 <10,000
Main education level Primary school Primary school Primary school
Highlights Negative economic performance
Low adaptability
Low education level
Negative economic performance
Low adaptability
Low education level
Negative economic performance
Low adaptability
Low education level
Key points Negative view of EU Regulations
Negative view of EU Regulations
Negative view of EU Regulations
3. Linkages
3.1 Inter-sectoral linkages The interviewed stakeholders did not highlight any particular competition for space between fishing activities and other economic sectors. The only problem for fishing vessels, and bottom trawlers in particular, is the presence of bulky waste and pollutants on the seabed, which hinders the activities and often ruins the product. The area is affected by various human activities that impact directly and indirectly with the fishing sector. The sewer and wastewater system is largely incomplete and

40
insufficient. Nautical tourism is often not respectful of the needs of the environment and fisheries. In some areas, there are discharges of industrial nature which poison the marine environment and pose a danger to the health of workers and consumers. One of the most serious problems encountered by vessels of Termini Imerese and other coastal areas in the North of Sicily is recreational fishing. This definition includes amateur anglers and pseudo-sport fishermen, who are sometimes disguising what is in reality a professional fishing activity. Although the global phenomenon is not yet quantified, fishermen have estimated that the pleasure craft involved in the phenomenon are several hundred with various type of tonnage and engine, and equipped with specific equipment, sometimes very sophisticated. The amateur anglers generally operate a seasonal and occasional activity, concentrated mainly during summer holidays and public holidays, while the pseudo-sport fishermen operate throughout the year in an intensive way without complying with the regulations. They also sell the fish, presenting competition with professional fishermen which is seen as unfair as they cannot compete with the prices offered by the illegal fishermen. There is almost total absence of control, which leads professional fishermen to leave the legal activity and engage in this more profitable but abusive activity, using the same tools as professional fishers.
3.2 Intra-sectoral linkages
2.2.1 Between fleet segments The increase in fuel prices from 2008 has raised operating costs for all vessels operating in Termini Imerese. The fleet segment affected the most by the increase in fuel price is bottom trawl VL1224, as around 50 % of its operating costs are due to fuel consumption. This situation has forced bottom trawlers to temporarily stop their activity in some cases or to operate in areas closer to the shore. In these cases, trawlers exploit the same fishing areas as the small scale fisheries (vessels under 6 m), creating conflict and increasing the fishing effort on the same resources.
2.2.2 Between subsectors The fishing sector in Termini Imerese is mainly catching and commerce. With regard to fish commerce, fishermen highlight a lack of local selling points self-managed by fishermen associations. Landings are currently sold to dealers and wholesalers outside the control of a fish market with no guarantee for a fair price and very often without invoicing. Fishermen highlighted the need to organize the direct sales of the product by a consortium of cooperatives, through the provision of suitable, self-managed selling points.
3.3 Summary of linkages The main linkages with other economic sectors are related to the environmental pollution produced by the industrial activities carried out in Termini Imerese. The industrial discharges and the inefficiency of the sewer and wastewater system poison the marine environment and pose a danger to the health of workers and consumers. Other conflicts highlighted by stakeholders are related to so-called

41
‘recreational fishing’ where this is in fact professional but illegal fishing, and the lack of respect for the environment, the fisheries and nautical tourism.
Regarding the linkages among fleet segments, the only conflict discussed during the stakeholder focus groups is related to the concurrence of bottom trawler vessels shorter than 6 m for the exploitation of the same fishing areas and the same resources. Regarding the conflicts among fishery sub-sectors, the main problems is fish commerce, which is actually managed by wholesalers who decide the price and leave the risks of unsold product to fishermen.
4. Role of fishing
4.1 Fisheries as an economic activity
4.1.1 Diversification and Adaptation As reported above, an important industrial area has developed in Termini Imerese over the last four decades. This area is mainly dependent on the manufacturing sector represented by FIAT automobiles and the satellite network. Other important sectors in terms of people employed are represented by the Public Administration and public services, like education and welfare services, and commerce. Fishing is a marginal sector in the local economy and tourism is not very developed. In the 1980s, when the number of jobs increased in the manufacturing sector as a consequence of FIAT investments, the prospective of a secure job in a big company attracted many people and also some local fishermen. In contrast, the recurrent economic crises that have affected the vehicles production sector in the subsequent years have led the people expelled from that sector to seek alternative sources of income in other areas, including fishing. This has further increased fishing effort and worsened the state of local fisheries. In the fish catching sub-sector there are no signs of diversification into tourism activities or other coastal activities by local fishermen. This is mainly due to the low level of education and the lack of alternative employment opportunities. Within the catching sub-sector, diversification can be associated with decisions regarding the target species, the fishing gears used and the exploited fishing areas. From this point of view, the presence of a high number of fishing methods in the area has allowed fishermen to diversify the landings composition to adapt to the decrease in abundance of demersal species and, in some cases, to adapt to the increase in fuel price by changing fishing location. Nevertheless, it seems that a career change is not a possibility for the majority of crew, even though most would prefer to leave the fishing sector and find an alternative employment. This does not appear to be an issue for skippers and vessels owners who are not interested in leaving fisheries. Younger generations perceive the fish catching sub-sector to be increasingly unattractive, given the increase in the average age of people working in the catching sub-sector. Over the last 10 years the capacity of fishers to adapt to changes has been very low. Notwithstanding the economic crisis affecting almost all fleet segments, fishers have largely remained in the same jobs.

42
This decision has been constrained by a number of factors. The most important is the lack of alternative employment opportunities that, combined with a very low education level, does not allow local people to leave the sector. Furthermore, the level of solidarity is high within the family and low outside. Sometimes there are conflicts among different families associated with conflicts among vessels belonging to different fleet segments. This situation does not encourage the organization of fishermen into associations which could defend their interests and propose solutions to the various problems described above. Local fishermen feel they are not supported by local, regional or national institutions. Among the list of social indicators proposed to local fishermen for evaluation in terms of their importance in influencing the local community well-being, “unemployment and income support rates” was the most important, scoring 4.24 on average. Other important indicators were “level of income” and “level of debts”, which scored the same value of 3.91 on average, followed by “level of education” with 3.82 and “health” with 3.53. The “unemployment and income support rates” was the most important indicator for both polyvalent VL0006 and polyvalent VL0618, and the second most important for bottom trawlers after the “level of education”.
4.2 Future development of the community The future of the fishing sector in Termini Imerese is viewed highly negatively by local fishermen. They think that the current condition of the sector is not sustainable and that the sector will probably decline until all fishing activities cease. However, they hope that something can change, particularly as the present study and their involvement has provided a way for them to communicate with the European institutions and highlight their concerns regarding EU regulations, which are considered to be the main reason this critical situation has arisen.
Local fishermen would like to go back to the situation prior to implementation of EU regulations, when they had more flexibility in the management of the local fishing activities. Other points they would like to achieve in the future include the possibility to work all year round by changing their fishing methods based on the season, the implementation of local or regional self-management, a change in fishery regulations with rules more relevant to the specificities of the local fisheries, a greater involvement of fishermen in setting the market policies and the organization of self-managed selling-points. Table 22 shows the results of a SWOT analysis performed with the local stakeholders.
Table 22. SWOT analysis
Strengths Weaknesses Threats Opportunities High level of professional experience
Reduction in landings (especially demersal species)
Gradual increase in illegal fishing.
Introduction of a self-management system.
Artisanal fisheries High presence of illegal fishing
Increased fishing effort and deterioration of stocks
Introduction of national and local management plans.
Use of a multitude of fishing gears
Conflicts between bottom trawlers and other fleet segments
Increased operating costs. Introduction of socio-economic measures associated to reductions of fishing effort.
High quality level of production (high value of
Low education level which does not allow for
Exit of employees from the sector
Diversification of fishing activities towards fishing

43
species) alternative employment possibilities.
tourism.
A significant number of species landed
Lack of self-managed local selling-points
Reduction in salaries as a consequence of the increase in operating costs.
Establishment of a Producers Organizations.
Cultural and historic tradition in the fishing sector
Low capacity to develop alternative business activities.
Low participation of younger generations in the fishing sector with an average age of fishermen becoming older and older.
Development of training courses for fishermen to improve their skills and education level.
Source: Consultation with local stakeholders and fishermen.
5. Summary and conclusions The economic structure of Termini Imerese is mainly industrial. The production structure is strongly influenced by the presence of an important industrial area, where factories of various sizes and for different activities are located. The two larger companies, FIAT Automobiles and ENEL electric utility, absorb most of the local employees. In 2001, people working for the local FIAT plant accounted for around 22 % of total employment of the city. The remaining firms consist of small industries with fragmented production structures and some companies working in the FIAT satellite activities. In 2011, FIAT’s Termini Imerese plant ceased activity and it is now going to be closed. Another important sector is represented by the Public Administration and public services, such as education and welfare services. The fishing sector is very marginal in the local economy, representing less than 2 % of the total number of employees, while tourism is not very developed. Fishing in Termini Imerese is predominantly artisanal. This is evidenced by the extreme polyvalence of fishing activities and the multi-species landings composition of almost all 77 vessels active in the area. Indeed, with the exception of a few bottom trawlers and two purse seiners, all vessels use a multitude of fishing systems and gears and switch from one to another in the different periods of the year, adapting fishing strategies to the features and seasonality of the target species. The fishing activities are mainly aimed at catching large pelagic species such as swordfish and common dolphinfish through longliners, demersal species through static gears (trammel net, gill net) and bottom longliners, and small pelagic species through seines. Even though the main bottom trawl fleet operating in the Northern coast of Sicily is located in Porticello, six bottom trawlers are also present in the port of Termini Imerese. The local fleet can be split into three fleet segments: Polyvalent VL0006, Polyvalent VL0618 and Bottom trawlers VL1224. The purse seiners (two vessels) are not included in the analysis at fleet segment level for confidentiality reasons. Vessels classified as polyvalent represent the majority of the fleet accounting for 64 units, 50 over 6m and 17 under 6 m. Polyvalent VL0618 represents the most important fleet segment in terms of landings accounting for more than an half of the total production, while purse seiners account for 30 % (mainly European anchovy landings) and Bottom trawl VL1224 for around 10 %. A remaining 6 % is landed by vessels lower than 6m. In terms of revenues, the higher contribution to local production is provided by Polyvalent VL0618 (more than 60 %), while Bottom trawl VL1224 represents around 20 % of total revenues and Polyvalent VL0006 less than 10 %. The remaining revenues are produced by the two purse seiners. The first five species in terms of landings value are swordfish, European anchovy, common dolphinfish, giant red shrimp and European hake, which account for almost 50 % of total revenues.

44
The business structure is generally family-based. People employed on these vessels are generally members of the vessel owner family, even if cases of crew members not family-related to the vessel owner are present. The decision-making processes related to the fishing activities is totally managed by the skipper, who is generally the vessel owner. Family members involved in the fishing activities are generally sons and brothers of the vessel owner. All crew members are male with the majority aged between 40 and 65 years. Only the employees on bottom trawlers are equally distributed between age classes 19-40 and 40-65. Women do not have any direct role in fishing activities, however, in some cases, given the long absence of fishermen from the mainland, wives carry out an administrative role on behalf of their husbands. In a few cases, to simplify the administrative process, the ownership of the vessel is assigned to the wife. Furthermore, the absence of fishermen from the mainland determines also a central role of their spouses in family decisions and child care. Salaries are very low for both skippers and crew. Almost all fishermen declared to earn less than EUR 10,000 per year. Generally, the salary of the household is the only income for the family (wives are usually housewives). The education level is generally very low; almost all people involved in fishing activities have a primary level. The economic performance of vessels located in the port of Termini Imerese is declining. All fleet segments show a negative trend in landings and revenues. Furthermore, the increase in fuel price starting in 2008, even with fluctuations, has increased operative costs. This has mainly affected vessels with an important consumption of fuel, like bottom trawlers. Local fishermen think that these negative trends are the consequence of EU regulations which do not take into account the specificities of the local fishing communities. These regulations have limited the potential for larger vessels to fish tuna and swordfish (which represented the most important target species of larger vessels in the past) forcing them to compete for the same species of smaller vessels, mainly demersal species. This has increased the fishing effort on these species and reduced stock biomass. The negative performance of the fisheries has not affected the fleet dimension; the number of vessels registered in Termini Imerese has been stable for a long time. The reduction in bottom trawlers has been counterbalanced by an increase in polyvalent vessels due to a lack of alternative employment opportunities. The possibility of working in the manufacturing sector or other industrial sectors has been greatly reduced with the recurrent crises in vehicle production and related satellite activities. The current economic crisis and the low level of education of people employed in the fishing sector represent relevant constraints to the possibility of changing jobs. Adaptive capacity among fishers is low. Notwithstanding the reduced profitability of the fishing sector, fishermen have remained in the same job. In the 1980s, when the number of jobs increased in the manufacturing sector as a consequence of FIAT investments, the prospect of a secure job in a big company attracted many people and also some local fishermen. In contrast, the recurrent economic crises affecting vehicle production in the subsequent years have led people from that sector to seek alternative sources of income in other areas, including illegal fishing. This has further increased the fishing effort and worsened the condition of local fisheries.

45
There are no signs of diversification into tourism or other coastal activities by local fishermen. This is mainly due to the low levels of education and the local economic crisis affecting all economic sectors. Furthermore, the level of solidarity is high within the family but low among different families and sometimes there are conflicts among different families associated with the conflicts among vessels belonging to different fleet segments. This situation does not encourage the organization of fishermen in associations. Local fishermen feel they are not supported by local, regional or national institutions. The fishing sector is also characterized by a number of conflicts among fleet segments, between the catching sector and fish commerce, and between fishing sector and recreational fishery. One of the main problems seems to be the presence of a noticeable number of illegal fishermen hidden under the definition of recreational fishing, who are in competition with legal fishermen for both the exploitation of marine resources and the selling of the product. The increase in regulations and control of the fishing activities from one side and the absence of controls on the illegal fishing are pushing professional fishermen to leave their jobs and continue the activity in an illegal way hidden under the definition of recreational fishery.