eu trade policy: outline international framework benefits of free trade benefits of protectionism...
Post on 20-Dec-2015
219 views
TRANSCRIPT

EU Trade Policy: outline
• International framework
• Benefits of free trade
• Benefits of protectionism
• Some facts on EU trade & aid policy
• Preferential trade liberalization
EU Trade Policy
Common Commercial Policy - Article 113 of the Treaty of Rome:
1. Community tariff regime
2. Common trade agreement with third countries (trade in goods, service and intellectual property)

International framework• GATT (1948)• WTO (1995) functions:
– Regulations for conduct of international trade– Settlements of disputes– Negotiations to liberalize world trade
• Latest negotiations rounds:– 1986-94: Uruguay round– 2001-?: Doha round

GATT / WTO principles
• Tariff reductions• Reciprocity• Non-discrimination

Benefits of free trade: theory
• Technological differences; comparative advantage (Ricardo)
• Difference in endowments (Heckscher-Ohlin)• Economies of scale• Economies of scale and product varieties (Krugman,
New Trade Theory; intra-industry trade)

Comparative advantage: example
• In two hours, France could produce 6 kg of bread and 4 liters of wine• Assume trade becomes possible at 6 kg of bread for 6 liters of wine• France produces 12 kg of bread, and trades 6 kg of bread for 6 liters
of wine. They end up with 6 kg of bread and 6 liters of wine• Similar reasoning for Italy; both countries better off with trade• Lower wages in Italy• Relative world price is between relative autarky prices
Technology France Italy
Bread (kg produced in a man-hour) 6 1
Wine (liters produced in a man-hour) 4 2

Heckscher-Ohlin
• A country will export the commodity whose production is intensive of the factor in which the country is relatively abundant
• Assume same technology in both countries

Heckscher-Ohlin
• Assume the production of bread is capital intensive and the production of wine is labor intensive
• Assume France has a relative abundance of capital and Italy has a relative abundance of labor
• This shows up in the production possibility frontiers

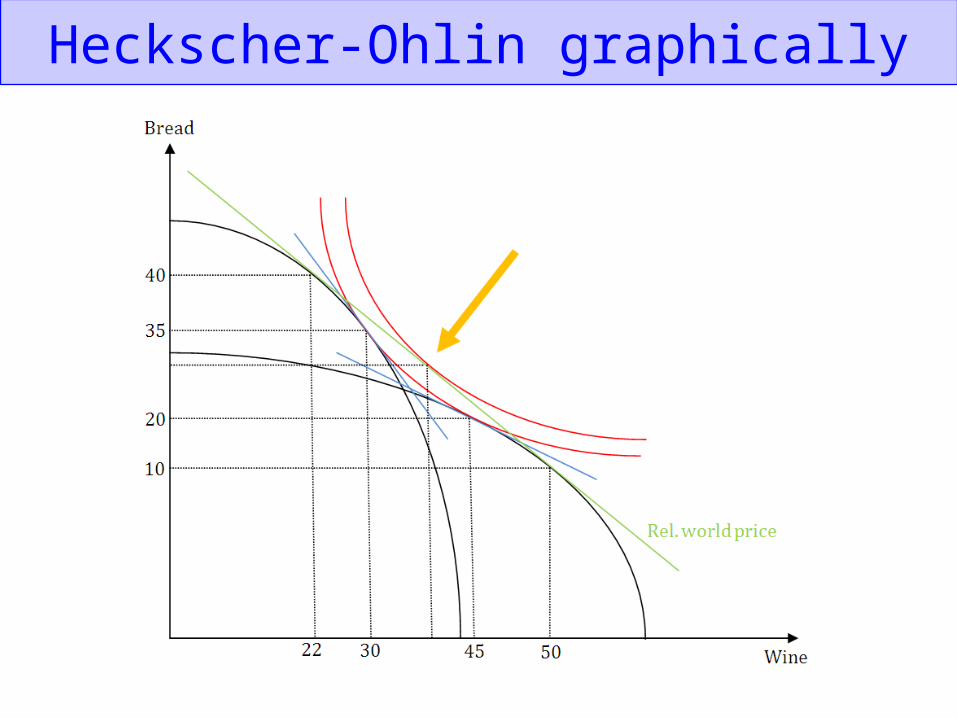
Heckscher-Ohlin graphically

Heckscher-Ohlin graphically
• Indifference curves shows combinations of wine and bread consumption that give the same level of satisfaction
• Assume same preferences in both countries (so same indifference curves)
• Higher indifference curve means higher level of satisfaction (higher utility level)

Heckscher-Ohlin graphically

Heckscher-Ohlin graphically
• Relative price is
the price of wine / the price of bread
• Slope of the blue lines in the next figure

Heckscher-Ohlin graphically

Heckscher-Ohlin graphically
• For trade to occur, relative world price must be between relative autarky prices:
Rel. p(France) > Rel. world price > Rel. p(Italy)
• World price is slope of green line in next figure
Heckscher-Ohlin graphically

Heckscher-Ohlin graphically
• Because of trade, both countries end up on a higher indifference curve and are therefore better off
• Both countries specialize
• Points outside of production possibility frontier become possible

Benefits of protection
• Protect specific groups in society• Diversify production (uncertainty)• Strategic independence (e.g. food, energy)• Protect employment• Protect infant industry• Strategic argument (terms-of-trade)• Avoid social dumping

EXPORTS
IMPORTS

EU25 exports, 2003
EU2567%
EFTA4%
Turkey1%
CIS2% Other Europe
1%
Other24%
North America9%
Asia7%
Latin America2%
Africa3%
RoW1%
Middle East3%
EU25 Imports, 2003
EFTA4%
Turkey1%
CIS3%
Other Europe1%
Other25%EU25
67%
Asia12%
North America
6%
Latin America2%
Africa3%
Middle East1%
Source: Eurostat. The latest data can be downloaded from Eurostat’s new user-friendly service europa.eu.int/comm/eurostat/
Pattern of Trade EU25 (2003)
EXPORTS
IMPORTS

0% 10% 20% 30% 40% 50% 60% 70% 80% 90% 100%
LatviaLithuaniaSlovakia
AustriaFinlandEstonia
SloveniaPoland
SwedenDenmarkGermany
Czech Rep.Hungary
ItalyGreece
EU25-AvgFrance
PortugalCyprus
SpainNetherlands
UKBelgium
MaltaIreland
Luxembour
NonEU Europe N. Amer. Africa Latin Amer. Asia RoW
Differences among Member States, imports 2003
Food & live animals
Other raw materials
Fuel products
Chemical products
Other manufactured
Machinery, transport equipment
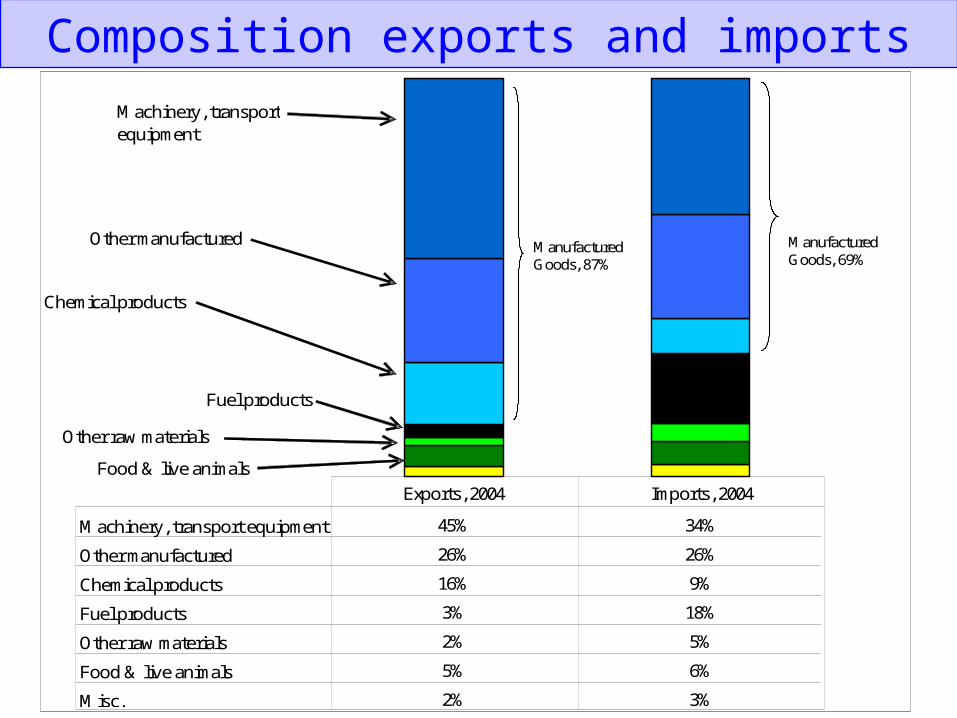
Machinery, transport equipment 45% 34%
Other manufactured 26% 26%
Chemical products 16% 9%
Fuel products 3% 18%
Other raw materials 2% 5%
Food & live animals 5% 6%
Misc. 2% 3%
Exports, 2004 Imports, 2004
Manufactured Goods, 87%
Manufactured Goods, 69%
Composition exports and imports

What with whom?

Institutions•Trade policy is an exclusive competency of EU.
–Customs Union requires COORDINATION.
•Trade in goods: •Commission has responsibility for negotiating, Council of
Ministers sets “Directives for Negotiation.” –Karel De Gucht (Trade Commissioner).–Council accepts/rejects final deal by Qualified Majority Vote.
•Commission in charge of surveillance and enforcement of 3rd nation commitments to EU.
–Trade disputes with US, China, etc.
European Parliament has no explicit powers. It’s only informed.

QUALIFIED MAJORITY VOTE
Each member state has a fixed number of votes roughly determined by its population, but progressively weighted in favour of smaller countries.
To pass a vote by QMV, all three of the following conditions must apply:
1. the proposal must be supported by 255 votes from a total of 345 - about 74% of the votes;
2. the proposal must be backed by a majority of member states;
3. the countries supporting the proposal must represent at least 62% of the total EU population.
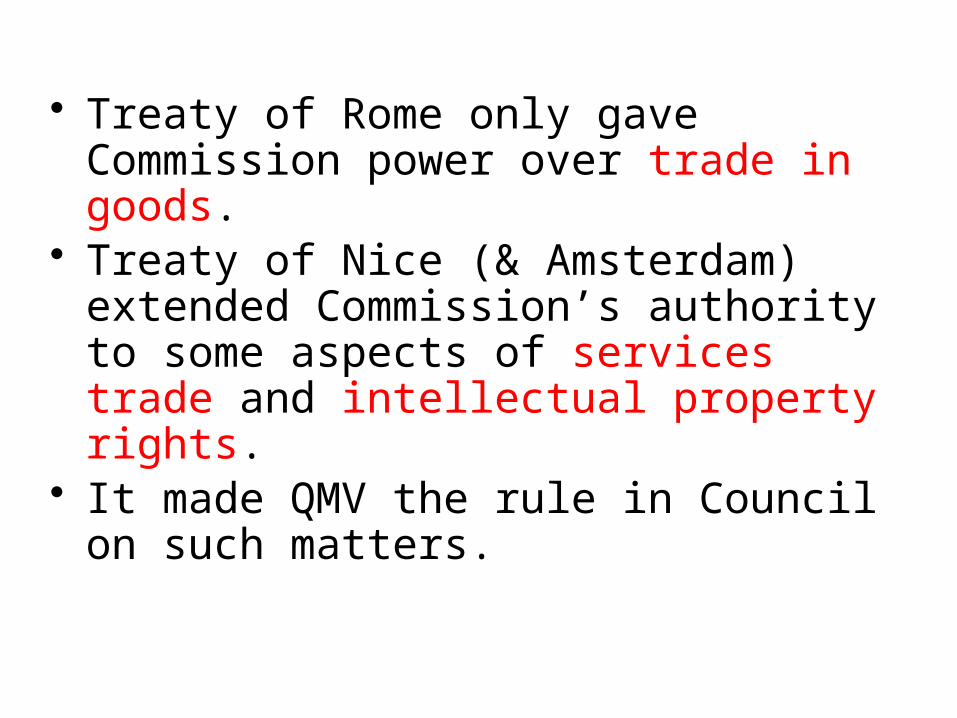
• Treaty of Rome only gave Commission power over trade in goods.
• Treaty of Nice (& Amsterdam) extended Commission’s authority to some aspects of services trade and intellectual property rights.
• It made QMV the rule in Council on such matters.

Contingent Protection (anti-dumping&anti-subsidy)
WTO allows members to raise tariffs to (does not violate WTO):1. Counter ‘unfair’ trade practices, e.g.
– Antidumping (often)– Anti-subsidy
2. Provide temporary protection “safeguards.”(Iron, steel, consumer electronics, chemicals)
The various WTO articles on these require a procedure; in EU the Commission is in charge of these procedures, but the final decision is subject to QMV approval of the Council.
• Tariffs and preferably price undertaking (avoid complaints on EU’s protection).
• Trade-off between consumer welfare and producer welfare.

Distributional consequences: Home

EU External Trade Policy• Complex• Has preferential trade agreements with all but nine
of the WTO’s 148 members.• Each free trade agreement can contain hundreds of
pages of exceptions and technical rules.• Has general agreement on trade, but also has
separate sectoral agreement• See http://ec.europa.eu/trade for updating details.

EU External Trade Policy• EU has special deals with 139 nations; often more than one per partner.
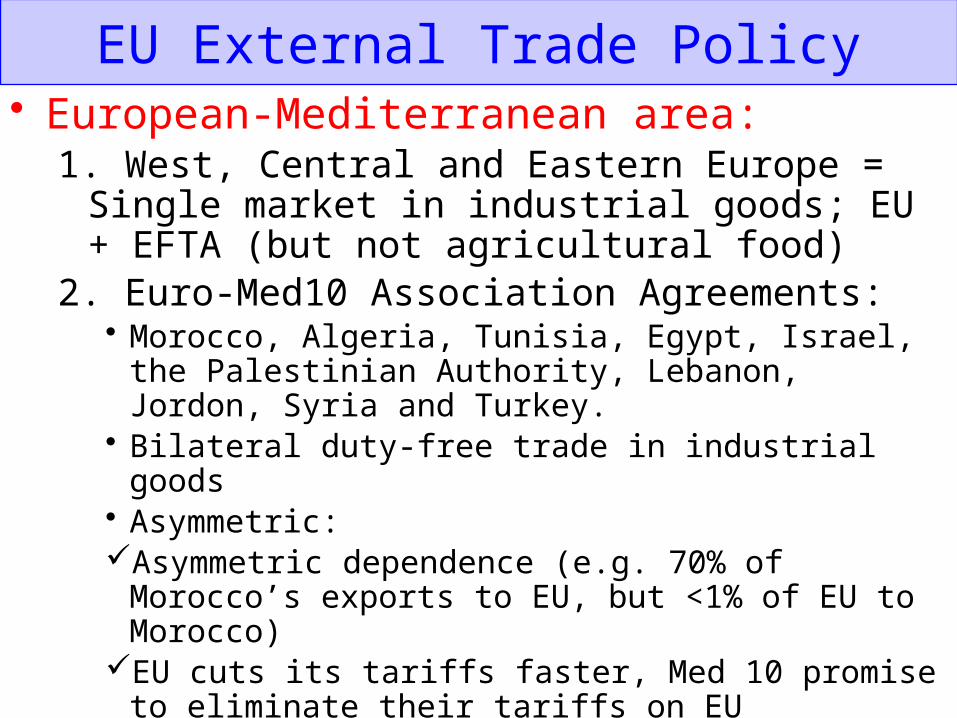
EU External Trade Policy• European-Mediterranean area:
1. West, Central and Eastern Europe = Single market in industrial goods; EU + EFTA (but not agricultural food)
2. Euro-Med10 Association Agreements:• Morocco, Algeria, Tunisia, Egypt, Israel, the Palestinian
Authority, Lebanon, Jordon, Syria and Turkey.• Bilateral duty-free trade in industrial goods• Asymmetric:Asymmetric dependence (e.g. 70% of Morocco’s exports to
EU, but <1% of EU to Morocco)EU cuts its tariffs faster, Med 10 promise to eliminate their
tariffs on EU industrial goods by 2010

EU External Trade Policy• European-Mediterranean area:
• Turkey uses EU’s common external tariff for industrial imports
• EFTA nations sign similar agreements with Med-10

EU External Trade Policy• Former Soviet republics & Western Balkans
1. Partnership and Cooperation Agreements (PCAs).– Generalised System of Preference - GSP plus.– Russia, Ukraine, Georgia, Belarus, Armenia, Azerbaijan,
Kazakhstan, Kyrgyzstan, Moldova and Uzbekistan.
2. Stabilisation and Association Agreements (SAAs).– Former Yugoslavian states.– Croatia has started membership; others likely to follow.These are all GSP (Generalized System of Preference), a WTO rule
allows rich nations to charge lower tariffs on imports from poor nations. (Asymmetric)
Preferential arrangements with former colonies • Colonial preferences conflicted with Common External
Tariff.– EU made exception for these nations to avoid imposing new
tariffs; signed “unilateral PTAs”• Yaoundé Convention and Arusha Agreement
– When UK joined 1974 extended to many Commonwealth nations.• “ACP nations” (Africa, Caribbean & Pacific); the new agreement = Lomé
Convention. • Duty-free but subject to quota for sensitive items (sugar, banana, etc.).
• These didn’t help the ACP nations to industrialize.• When Lomé Convention renewed in 2000, the EU and the
ACP nations agreed to modernise the deal. • Cotonou Agreement; eventually reciprocal free trade.

Regional groups, ACP nationsWest Africa Central
AfricaEast South
AfricaSouthern
AfricaCaribbean Pacific
BeninBurkina FasoCaper Verde Cote d’IvoireGambia Ghana GuineaGuinea Biss.LiberiaMaliMauritaniaNigerNigeriaSenegalSierra LeonaTogo
CameroonCentral AfricaChadCongoEquat. GuineaGabonSao Tome e Principe
BurundiComoros Congo (Rep Dem)DjiboutiEritreaEthiopiaKenyaMalawiMauritiusMadagascarRwandaSeychellesSudanUgandaZambiaZimbabwe
AngolaBotswanaLesothoMozambiqueNamibiaSwazilandTanzania
AntiguaBahamasBarbadosBelizeDominicaDomin RepGrenadaGuyanaHaitiJamaicaSta LuciaSt VincentSt Ch and NevisSurinamTrinidad and Tobago
Cook IsFed MicronFijiKiribatiMarshall IslNauruNiuePalauPapua NGSamoaSolomon IsTongaTuvaluVanuatu

Preferences for poor nations: GSP• 1971 GATT provision.• EU grants GSP-generalised system of tariff preferences- to almost all
poor nations.1. General GSP (to all developing countries).2. “Super-GSP” more generous on market access :‘Everything but Arms’
for least developed nations.On paper, EBA grants zero-tariff access to all goods, except arms and
munitions. – Goods in which these nations are most competitive are in fact excluded from the
deal. – Tariffs on bananas, rice and sugar – products where these poor nations could
easily expand their EU sales – are to come down only in the future. – Moreover, even though all tariffs on these items will be gone by 2009, the
exports quantities are limited by bilateral quotas.
49 nations qualify for EBA in principle in 2005.

Non-regional free trade agreements
• Mexico, Chile, and South Africa, done.• Ongoing with Mercosur, & the Gulf Cooperation
Council (Bahrain, Kuwait, Oman, Qatar, Saudi Arabia and United Arab Emirates).
No more agreements until DOHA ROUND is concluded.
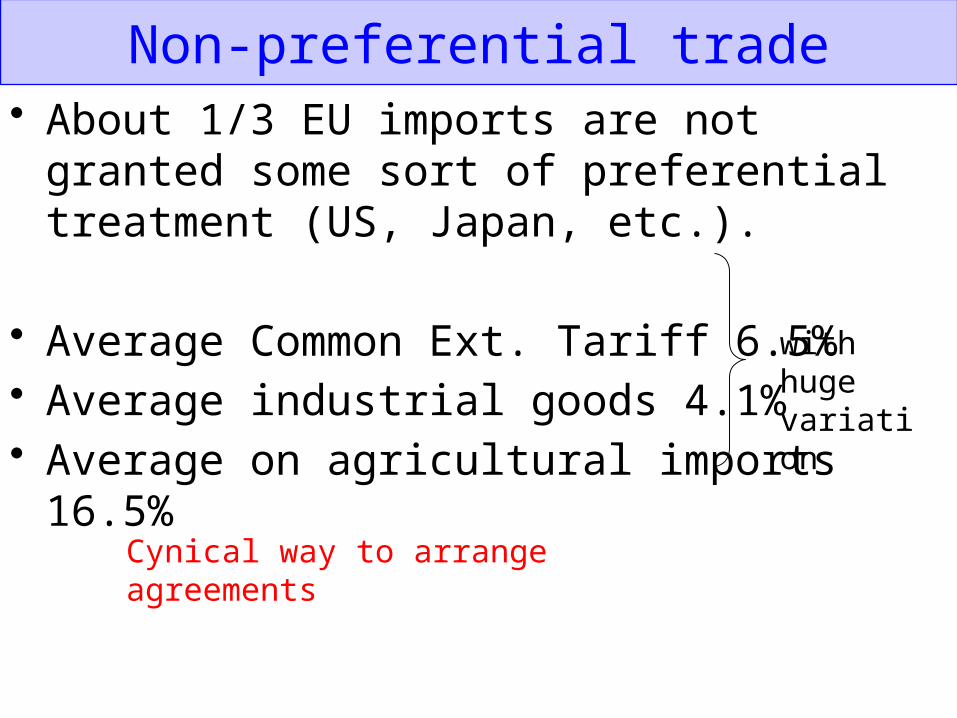
Non-preferential trade• About 1/3 EU imports are not granted some sort of
preferential treatment (US, Japan, etc.).
• Average Common Ext. Tariff 6.5%• Average industrial goods 4.1%• Average on agricultural imports 16.5%
with huge variation
Cynical way to arrange agreements

EU Common external tariff
12
22
17
23
14
14
12
10
10
10
210
101
192
75
114
150
71
26
76
76
19
0 50 100 150 200 250
Textiles and clothing
Transport and equipment
Leather, rubber, shoes and travel …
chemical and photographic supplies
electric machinery
non agricultural articles
mineral products, precious stones
metals
non electric machinery
Wood, pulp, paper and furniture
dairy products
grains
live animals and products thereof
Tobaco
Coffee and tea, cocoa, sugar, etc
fruit and vegetables
beverages and spirits
Fish and fishery products
oil seeds, fats, oils and their products
other agricultural products
Cut flowers and plants
High
Average
Agricultural products have much higher tariff than others!

Current facts…• “Traditionally, there has been a divide between
northern liberal countries, such as Britain and Sweden, and protectionist founder members, such as France and Italy”. The Economist Dec 2006
• USA and EU blaming each other for failure in trade negotiations.
“What they're saying is that for every dollar that they strip out of their trade-distorting farm subsidies they want to be given a dollar's worth of market access in developing country markets," Commissioner Mandelson said. "That is not acceptable to developing countries and it's a principle that I on Europe's behalf certainly couldn't sign up to either." US trade representative Susan Schwab insisted
the US remained "fully committed to multilateral trading system”.

Some remarks on poverty• World Trade policies are fundamental to diminish
poverty and inequality.• Poverty is the main cause of violence• Disparities in trade policies increase the gap among
countries.• Globalization and technology progress make more
difficult the migration control. Restrictive policies are not the solution… eliminating miserable conditions from certain areas in the world is.
• But how to really help poor developing countries to industrialize?

Aid policyInstruments:
• Trade preferences• Development finance• Humanitarian aid
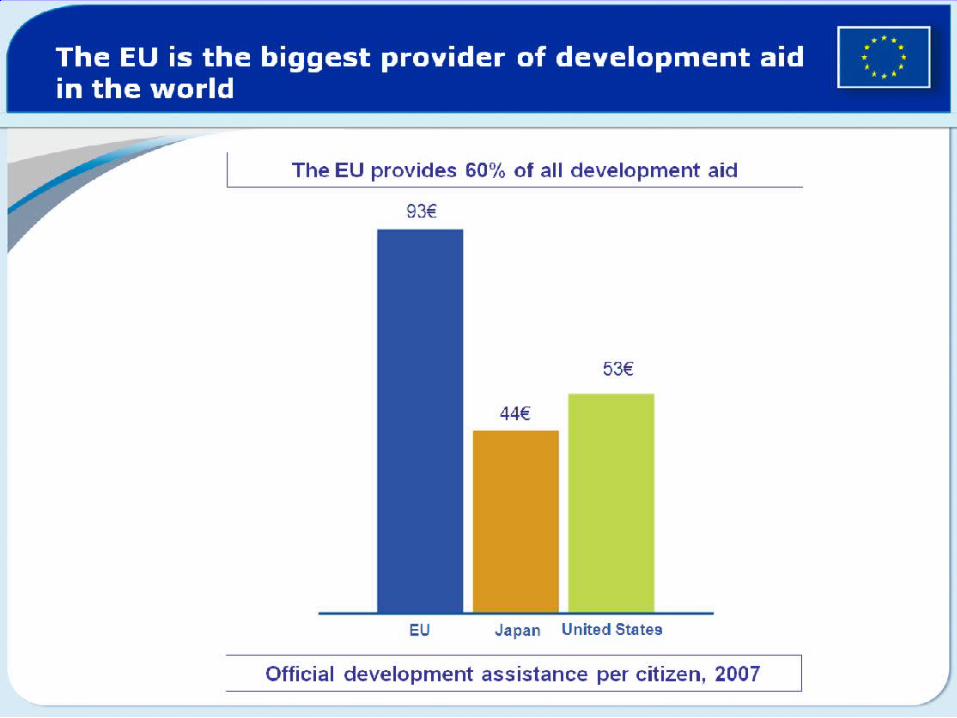
Aid policy

EU-US trade and investment• Disputes over issues as varied as bananas, beef, trade
legislation and subsidies to aircrafts.
• EU and US are the most important world traders. EU share in goods trade is 22.8% and 27.3% in services. US shares are 19.1% and 20.2% respectively.
• Each other’s largest trading partner: US accounts for 17.7% (24.2%) of EU15 total imports (exports) of goods. While EU accounts for 24.2% of total US trade of goods.

Trade disputes EU - USA
• A lot of press attention• But most disputes only touched a minimal % of
trade• Agriculture: USA objected to EU variable levies,
domestic support and export subsidies

Share in EU15 FDI flows 1998-2001
EFTA; 9,8
USA; 61,9
Japan; 3
China mainland;
0,1
ROW; 25,5
EFTA; 11,1
USA; 52,4Japan; 2,4
China mainland;
0,6
ROW; 33,5Outflows
Inflows
Preferential trade liberalization
• Early literature (Viner, 1953) focused on static effects of integration on welfare:
• Trade creation
• Trade diversion

Trade creation
• Benefit of liberalization: domestic production is replaced by cheaper imports from a partner country

Trade diversion
• Negative effect of preferential liberalization: more expensive imports from a partner country replace low-cost imports from suppliers in third country

Implications for the Global Trading System
• Questions:– Can PTA expansion lead to global free trade? – Do PTAs make multilateral liberalization less
likely?– Do PTAs lead to a rise in trade barriers against
non-members? – What kind of trade regimes are we likely to have
with criss-crossing PTAs (Spaghetti-Bowl Phenomenon)?
– WTO-illegal policies in PTAs?

Can PTA Expansion Lead to Global Free Trade?
• Baldwin’s “Domino Theory of Regionalism”– Economic incentives for outside countries to seek entry into an
existing PTA– Unless there are sufficiently strong non-economic factors that
counter these incentives, as the PTA expands, eventually all countries want to enter the PTA
• Limitations of Baldwin’s analysis– Trade barriers are seen as transport costs, thus the tariff revenue
aspect is not taken into account– Assumption that “insiders” have no incentive to block the entry

Do PTAs Make Multilateral Liberalization Less Likely?
Building or stumbling blocks? (Bhagwati)
Building blocks? • Multilateral negotiations will move more rapidly if
the number of negotiators is reduced to a handful of blocs– However, if blocs take the form of FTAs, there is no effect
on the number of participants– One voice in EU or too occupied with internal problems?
• PTAs may serve as a bargaining threat

Do PTAs Make Multilateral Liberalization Less Likely? - ctd.
Stumbling blocks?
• PTAs are mostly between developed and developing countries
• Such PTAs are associated in public mind (in developed countries) with large inflows of L-intensive goods and reduced wages for the unskilled
• This can energize and unify protectionist lobbies, generating obstacles against multilateral liberalization
• Multilateral negotiations, by contrast, involve both developed and developing countries and draw less attention of protectionist lobbies

• 53
Do PTAs Lead to a Rise in Trade Barriers against Non-Members?
1. FTA can lead to a reduction in tariffs on inputs:– Assume a pre-PTA equilibrium a union member faces lower tariffs
on final goods and higher tariffs on intermediate inputs, relative to its potential partner in some sectors
– Final goods producers are in disadvantage and lobby to reduce the external tariff on the input
> Counter arguments:– Reduction in the tariff on inputs increases the effective protection
on final goods– Lobbying by final goods producers might also result in an
increased tariff on final goods– It assumes that producers of intermediate goods do not lobby

Do PTAs Lead to a Rise in Trade Barriers against Non-Members? - ctd.
2. Tariff-revenue objective: – If a country is dependent on tariffs for revenue purposes
(e.g. Africa), it may be forced to raise the external tariff to maintain the fiscal balance
– The more the country imports from the FTA partner, the larger the loss of revenue, the greater possibility of an increase in the external tariff and greater the trade diversion

Do PTAs Lead to a Rise in Trade Barriers against Non-Members? - ctd.
3. Political economy: – when producers play the central role in determining trade
policies, liberalization through FTA is likely to be replaced by increased protection against outside countries
4. Considerable empirical evidence of increases in outside tariffs following the implementation of PTAs

The Spaghetti-Bowl Phenomenon
• To avoid trade deflection, FTA agreements usually include rules of origin
• Criss-crossing FTAs leads a “Spaghetti Bowl” whereby tariffs vary according to origin of the product
• See Fig. 3:– Each FTA has its own rules of origin which vary across products
and transition phase– For a given product, there are several different tariff rates
depending on what origin is assigned to it

Spaghetti Bowl

WTO-illegal policies in PTAs
• PTAs can undermine the global trading system by introducing arrangements measures which are WTO inconsistent
• Example: – Anti-Dumping provisions in the EU Czech
association agreement – trade-balancing requirement within Mercosur (an
Argentine company operating in Brazil must export as much Brazilian goods to Argentina as it imports)
• These practices are not widespread