eu renewableenergy policies analysis of historicdevelopments · eu renewableenergy policies –...
TRANSCRIPT

EU Renewable Energy Policies
–
Analysis of historic developments
Transatlantic Climate Bridge
Carleton University, Ottawa (Canada), May 20th 2009
Patrick Lamers, Ecofys, [email protected]

EU Renewable Energy Policies – Patrick Lamers, Ottawa, May 20th, 2009
9.5%14.2%
10.2%
17.8%
29.5%
24.0%
35.3%
36.7%
15.5%
7.3%
0%
10%
20%
30%
40%
50%
60%
70%
80%
90%
100%
Canada EU-27
Renewables
Mineral oil
Natural gas
Coal
Nuclear Energy
270 Mtoe 1,822 Mtoe
42 Mtoe 134 Mtoe
Energy Supply total, 2006 (OECD data)

EU Renewable Energy Policies – Patrick Lamers, Ottawa, May 20th, 2009
28.6%
56%
71.0%
28%
1%
8%
1%
6%0.5%
0%
10%
20%
30%
40%
50%
60%
70%
80%
90%
100%
Canada EU-27
Others
Biofuels
Geothermal
Wind
Solar
Hydropower
Biomass / waste
31 Mtoe 103 Mtoe
16.5 Mtoe
Energy Supply RES, 2006 (OECD data)

EU Renewable Energy Policies – Patrick Lamers, Ottawa, May 20th, 2009
Outline
1. Overview: EU RES policies and markets
2. Case studies for RES-E development in EU
– Germany: FITS
– Spain: FIPS & FITS
– UK: quota obligation
3. Evaluation: effectiveness and efficiency
indicators for RES-E
4. Conclusions

EU Renewable Energy Policies – Patrick Lamers, Ottawa, May 20th, 2009
1. Policies and Markets
EU Renewable Energy Policies – Patrick Lamers, Ottawa, May 20th, 2009
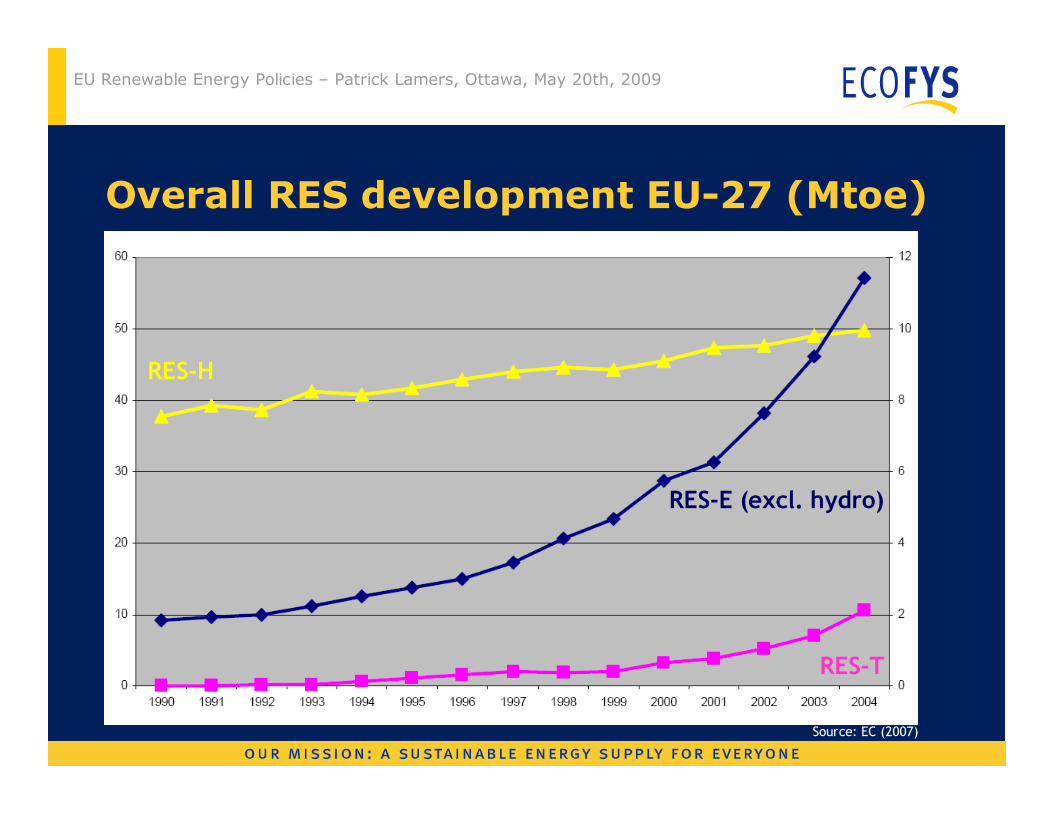
Overall RES development EU-27 (Mtoe)
RES-E (excl. hydro)
RES-T
RES-H
Source: EC (2007)

EU Renewable Energy Policies – Patrick Lamers, Ottawa, May 20th, 2009
Policy development
2001: Adoption of the EU Directive on the promotion of RES-E:
EU-wide RES-E target of 22 % (gross electricity consumption)
by 2010. (2001/77/EC)
2003: Adoption of the EU Biofuels Directive: 2 % and 5 % reference
value for market shares of biofuels in 2005 and 2010
respectively. (2003/30/EC)
2007: EC presents its ‘Renewable Energy Roadmap‘
EU Council agrees on 20 % binding RES share until 2020
2008: EU Climate Energy Package for 2020
Directive for the promotion of RES (2008/16/EC)

EU Renewable Energy Policies – Patrick Lamers, Ottawa, May 20th, 2009
RES Directive (2008/16/EC)
• Part of the Climate Energy Package: 20-20-20 in 2020
• 20 % RES share in final energy consumption (whole sector)
• 10 % minimum target for RES-T
• Individual targets for EU member states
• Option for Guarantee of Origin Trade (green certificates)
• Introduction of flexibility mechanisms
– Statistical transfer
– Joint projects
– Joint support schemes

EU Renewable Energy Policies – Patrick Lamers, Ottawa, May 20th, 2009
0%
10%
20%
30%
40%
50%
60%
Rom
ania
Bul
garia
The
Cze
ch R
epubl
ic
Eston
ia
The S
lova
k R
epubl
icLat
via
Pol
and
Lith
uani
a H
unga
ry
Slove
nia
Swed
en
Finla
nd
Mal
ta
Luxem
bourg
C
ypru
s P
ortu
gal
Austr
ia
Belgiu
m
Gre
ece
Spai
n
The
Net
herla
nds
Italy
G
erman
y Fr
ance
Ire
land
D
enm
ark
Uni
ted
Kingd
om
RE
S s
ha
re in
gro
ss
fin
al e
nerg
y c
on
su
mp
tio
n
Gap towards 2020
2005 level
Source: Lamers et al. (2009)

EU Renewable Energy Policies – Patrick Lamers, Ottawa, May 20th, 2009
RES-E support instruments
ExampleSupport level
Quota obligations, tradable green
certificates, tender schemes, etc.
Quantity based
Feed-in schemes, tender schemes,
tax exemptions, etc.
Price basedOperating
support
Soft loans, capital grants, tax
exemptions, reductions on the
purchase of goods, etc.
Investment support
� Additional measures: R&D, information campaigns, etc.

EU Renewable Energy Policies – Patrick Lamers, Ottawa, May 20th, 2009
Short comparison of quotas & FIS
Quota obligations based on Tradable Green Certificates
– Volume set by the government (e.g. in MWh or % of sales)
– TGC price determined by the market
– Not necessarily technology specific
� High risk premium (full market exposure)
Feed-in schemes
– Price set by the government
– Volume determined by the market
– Allow technology specific support at cost level if premiums ortariffs are determined correctly
� Low risk premium (limited market exposure)

EU Renewable Energy Policies – Patrick Lamers, Ottawa, May 20th, 2009
RES-E support schemes in EU-27
• FIS is most
common
• 6 MS use quota
obligations with
TGC
Source: Klein et al. (2008)
EU Renewable Energy Policies – Patrick Lamers, Ottawa, May 20th, 2009
2. Case studies
a. Germany: Feed-in tariff scheme
b. Spain: Feed-in premium / tariff scheme
c. UK: quota obligation
EU Renewable Energy Policies – Patrick Lamers, Ottawa, May 20th, 2009
German FIT scheme
• Technology-specific FIT-system (20 years) with declining
remuneration rates
• Remuneration payment chain (typical for FIS):
RES plant <> DNO <> TSO <> DNO <...> power customer
• Long-term policy framework allowed strong RES-E growth
with broad technology portfolio
• FIT had proven positive impact on domestic industry and
employment
• FIT legislation is reviewed and adapted periodically
(2000, 2004, 2008/2009)

EU Renewable Energy Policies – Patrick Lamers, Ottawa, May 20th, 2009
Overall RES-E development
Source: BMU (2008)

EU Renewable Energy Policies – Patrick Lamers, Ottawa, May 20th, 2009
0
500
1000
1500
2000
2500
3000
3500
4000
4500
1999 2000 2001 2002 2003 2004 2005 2006 2007 2008
Nu
mb
er
of
bio
ga
s p
lan
ts
0
200
400
600
800
1000
1200
1400
1600
Ele
ctr
ic c
ap
ac
ity
# Increase
# Past year
Average plant size [kWe]
Increase electric capacity [MWe]
Installed el. capacity [MWe]
FIT adaptation – e.g. biogas
Source: Lamers & Hofmann (2009)

EU Renewable Energy Policies – Patrick Lamers, Ottawa, May 20th, 2009
Spanish FIT/FIP scheme
• Very effective for wind
energy
• Changes in policy
have created
uncertainty among
investors (e.g.
reduction of PV-tariffs
by 30 %)
• Annual FIP or FIT option for lifetime of RES-E system
• Floor and cap prices set a fixed range of the overall
remuneration (since 2007)

EU Renewable Energy Policies – Patrick Lamers, Ottawa, May 20th, 2009
FIP wind on-shoreProgression of the remuneration level for wind onshore within the market option
Source: Held et al. (2008)
floor
cap

EU Renewable Energy Policies – Patrick Lamers, Ottawa, May 20th, 2009
UK ROC scheme
• Renewable obligations for electricity providers (6.7 % in 2007)
• Proof through certificates (ROC) issued by the regulator:
1 ROC = 1 MWh
• So far no technology banding i.e.
1 MWh of any technology = 1 ROC (might change in 2009)
• Penalty for non-comliance (adjusted annually)
• Penalty is stacked in a buy-out fund
• Fund is recycled annually to electricity providers in proportion
to the ROCs surrendered during the compliance period
� ROC value = buy-out price + recycle payment
• So far the scheme has not been effective

EU Renewable Energy Policies – Patrick Lamers, Ottawa, May 20th, 2009
3. Evaluating RES-E policies
EU Renewable Energy Policies – Patrick Lamers, Ottawa, May 20th, 2009
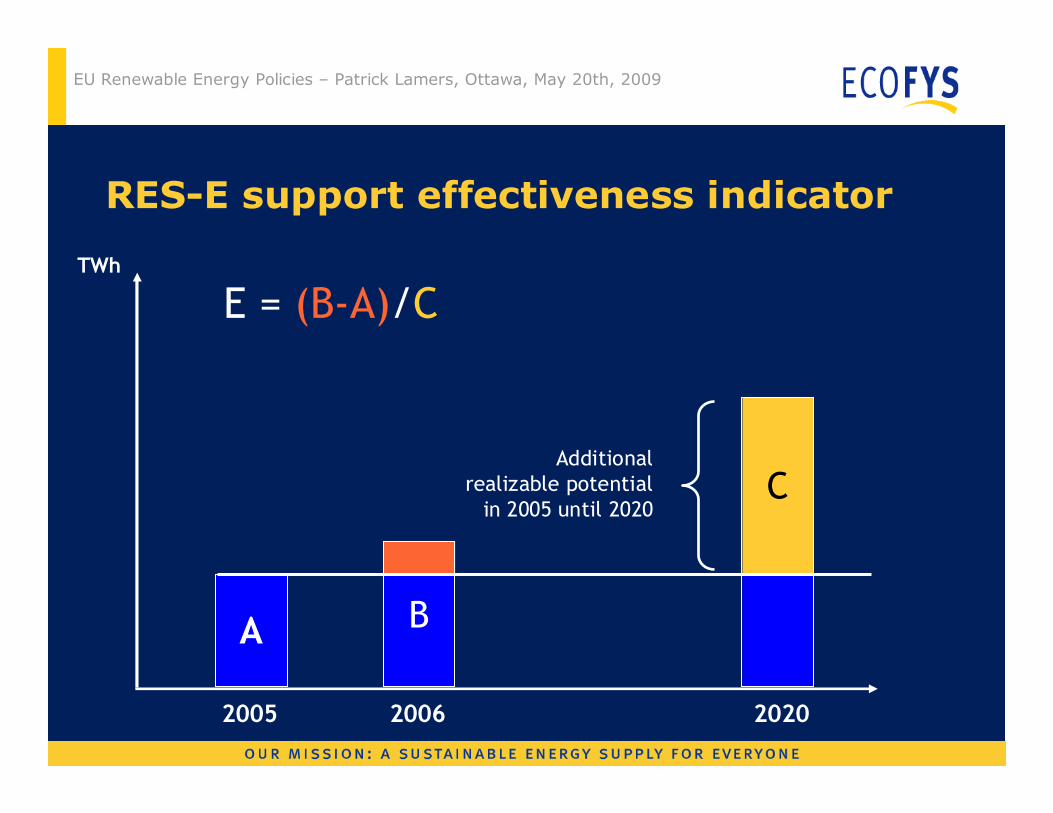
RES-E support effectiveness indicator
A B
C
2005 2006 2020
E = (B-A)/C
Additional
realizable potential
in 2005 until 2020
TWh

EU Renewable Energy Policies – Patrick Lamers, Ottawa, May 20th, 2009
RES-E support effectiveness indicator
Absolute growth of normalised RES-E generation
compared to the additional realisable mid-term
potential to 2020 for a specific technology*
* The realisable potential represents the maximum achievable potential assuming that all existing barriers can be overcome
and all driving forces are active.Source: Ragwitz et al. (2007)

EU Renewable Energy Policies – Patrick Lamers, Ottawa, May 20th, 2009
Effectiveness of on-shore wind energy
development 1998-2006 across EU-27
Source: Ragwitz et al. (2007)
EU Renewable Energy Policies – Patrick Lamers, Ottawa, May 20th, 2009
RES-E efficiency indicator
• Basis: expected profit from RES-E installation
• Economic efficiency of a RES-E support
instrument: levelised profit of the investment
– Investor's perspective
– Duration of support
– Country specific cost-resource conditions
– Interest rate in different countries

EU Renewable Energy Policies – Patrick Lamers, Ottawa, May 20th, 2009
Methodology: marginal costs & country
specific support level
• Long run marginal costs
• Different support levels in different countries: normalised to
a uniform duration of the instrument given by the lifetime

EU Renewable Energy Policies – Patrick Lamers, Ottawa, May 20th, 2009
Generation costs vs. support levels for
on-shore wind across the EU-27
Source: Ragwitz et al. (2007)

EU Renewable Energy Policies – Patrick Lamers, Ottawa, May 20th, 2009
Efficiency & Effectiveness for on-shore
wind energy in 2006 across the EU-27
Source: Ragwitz et al. (2007)

EU Renewable Energy Policies – Patrick Lamers, Ottawa, May 20th, 2009
4. Conclusions (1)
• Current policy frameworks define the future market for RES
– RES require long term policy framework– low risk for new investments (i.e. long-term price guarantees)
• Indicators show that there is no optimum or „one fits all solution“ i.e. over all countries and technologies
• Important for effectiveness of RES-E deployment
– Low administrative barriers combined with– high investment security
• Effective instruments for RES-E support are frequently also economically efficient

EU Renewable Energy Policies – Patrick Lamers, Ottawa, May 20th, 2009
4. Conclusions (2)
• Effectiveness for wind, biogas, and solar PV RES-E has been
highest in countries using FIS as main support instrument
• Low cost RES-E technologies grow particularly strong in
countries with non-technology specific support schemes
• Combination of investment grants and tax rebates has
proven to be successful in countries with high taxation rates
• Technology specific seem superior to technology neutral
instruments (larger technology portfolio, economic benefits)

EU Renewable Energy Policies – Patrick Lamers, Ottawa, May 20th, 2009
Thank you for your attention!
Patrick Lamers
Ecofys Germany GmbH
Stralauer Platz 34, 10243 Berlin
Tel. +49 (0) 30 29773579 25
www.ecofys.com

EU Renewable Energy Policies – Patrick Lamers, Ottawa, May 20th, 2009
Literature (1)
• Bundesministerium für Umwelt, Naturschutz und Reaktorsicherheit [BMU] (2008). Erneuerbare Energien in Zahlen. Available online: http://www.erneuerbare-energien.de [May 14th, 2009]
• Coenraads, Rogier; G. Reece, M. Voogt, M. Ragwitz, A. Held, G. Resch, T. Faber, R. Haas, I. Konstantinaviciute, J. Krivosik, T. Chadim (2008). Progress – Promotion and growth of renewable energy sources and systems; Final report of the research project PROGRESS, with support from the European Commission, DGTREN under the Sustainable Energy Europe - Programme (Contract No. TREN/D1/42-2005/S07.56988), Utrecht, March 2008. Available online: http://www.res-progress.eu/file.php?fileId=51 [April 24th, 2009]
• European Commission [EC] (2007). Communication - Renewable Energy Road Map -Renewable energies in the 21st century: building a more sustainable future. Available online: http://ec.europa.eu/energy/energy_policy/doc/03_renewable_energy_roadmap_en.p
df [April 22th, 2009]
• Held, Anne; M. Ragwitz, C. Huber, G. Resch, T. Faber, K. Vertin (2008). Feed-In Systems in Germany, Spain and Slovenia - A comparison. Working Paper of the International Feed-in Cooperation, Available online: http://www.feed-in-cooperation.org/images/files/ific_comparison_of_fit-systems_de_es_sl.pdf [May 14th, 2009].

EU Renewable Energy Policies – Patrick Lamers, Ottawa, May 20th, 2009
Literature (2)
• Klein, Arne; B. Pfluger, A. Held, M. Ragwitz, G. Resch, T. Faber. (2008). Evaluation of different feed-in tariff design options – Best practice paper for the International Feed-In Cooperation. 2nd edition, Fraunhofer ISI and EEG. Available online: http://www.feed-in-cooperation.org/images/files/best_practice_paper_2nd_edition_final.pdf [April 24th, 2009]
• Lamers, Patrick; F. Hofmann (2009). Die Entwicklung des Biogasmarkts in Deutschland und zu erwartende Auswirkungen der EEG-Novelle 2009 [The German biogas market – an analysis of historic and expected future developments]. Euro Heat & Power 6, forthcoming.
• Lamers, Patrick; C. Klessmann, G. Resch (2009). Renewable energy policies and technologies in the EU – an analysis of historic and expected future developments.European Environmental Agency, Working Paper.
• Ragwitz, Mario; A. Held, G. Resch, T. Faber, R. Haas, C. Huber, P.E. Morthorst, S.G. Jensen, R. Coenraads, M. Voogt, G. Reece, I. Konstantinaviciute, B. Heyder (2007): OPTRES – Assessment and optimisation of renewable energy support measures in the European electricity market; Final report of the research project OPTRES, with support from the European Commission, DGTREN under the Intelligent Energy for Europe - Programme (Contract No. EIE/04/073/S07.38567), Karlsruhe, Germany, 2007. Available online: http://www.optres.fhg.de/OPTRES_FINAL_REPORT.pdf [April 24th, 2009]