expenditure policies toward eu accession
TRANSCRIPT
WORLD BANK TECHNICAL PAPER NO. 533
- - ,\ Europe and Central Asia Poverty Reduction and Economic-- , wManagement Series
THE WORLD BANK WTP533Work In progress If or pubicdi,scussion January 2003
Expenditure PoliciesToward EU Accession
K.
, .
Edited byBernard Funck
Pub
lic D
iscl
osur
e A
utho
rized
Pub
lic D
iscl
osur
e A
utho
rized
Pub
lic D
iscl
osur
e A
utho
rized
Pub
lic D
iscl
osur
e A
utho
rized
Recent World Bank Technical Papers
No 428 C Mark Blackden and Clutra Bhanu, Gender, Grozwth, and Poverty Reductiow- Special Prograni of Assistancefor Africa, 1998 Statuis Report on Poverty in Sub-Saharan Africa
No 429 Gary McMahon, Jose Luis Evia, Alberto Pasc6f-Font, and Jose Miguel Sanchez, An Environnmental Study ofArtisanal, SiSiall, and Mediinni Mtining in Bolivia, Chile, and Peru
No 430 Maria Dakou,,C, Coturt Performnance arouind the World A Comnparative Perspective
No 431 Severin Kodderitzsch, Retfornis in Albanian Agricultutre Assessing a Sectoi in Transition
No 432 Lutz Gabriel Azevedo, Musa Asad, and Larry D. Simpson, Managellment of Water Resources. Bulk WaterPricin7g in Brazil
No 433 Malcolm Rowat and Jose Astigarraga, Latin Anmerican Inisolvenicy Systemls A Comzparative Assessnient
No. 434 Csaba Csaki and John Nash, eds., Regional aiid International Trade Policy Lessons for the ELI Accession iii theRural Sector-World Bank/FAO Workshop, Jiune 20-23, 1998
No 435 lam Begg, ELI Investnment Grants Review
No 436 Roy Prosterman and Tim Hanstad, ed., Legal Inipedinuents to Effective Rural Land Relations in Easterii Eutropeand Central Asia A Conuparative Perspective
No 437 Csaba Csaki, Michel Dabatisse, and Oskar Honisch, Food and Agricultutre in the Czech Repiblic Froln a'Velvet" Transition to the Challenges of ELI Access iou
No 438 George J Borjas, Econoniuc Research on1 the Determrinants of Imnuigration Lessons for the European Uniion
No 439 Mustapha Nabli, Financial litegration, Vtilniabilities to Crisis, aiid EU Accessioi ini Five Central EuropeaiiCoiiii tries
No 440 Robert Bruce, loannis Kessides, and Lothar Kneifel, Overconuumug Obstacles to Liberalizatiomi of the TelecomnSector in Estoiiia, Polnrid, the Czech Repuiblic, Slovenia, amid Huni,gany An Overview of Key Policy Concernis atidPotential Initiatives to Faciltate the Trauisition Process
No 441 Bartlomiej Kaminski, H-lungary Foreigui Trade lssiues in the Conitext of Accession to the EU
No 442 Bartlomiej Kaminski, The Role of Foreigmi Direct Investnuient and Trade Policy in Poland's Accession to theEuiropean Uuiiomi
No 443 Luc Lecuit, Jolhu Elder, Christian Hurtado, Fran,ois Rantrua, Kamal Siblini, and Maurizia Tovo,DeMlStlfyiiig MIS Guideliniesfor Managenment Informantitton Systenus in Social Fuinds
No 444 Robert F Townsend, Agriciiltiial Incentives in Suib-Saharan Africa Policy Challenges
No 445 Ian Hill, Forest Managenuent in Nepal Ecoiiouiiics of Ecology
No 446 Gordon Hulighes and Magda Loveu, Econoniic Reform annd Envurouunuientuil Perforinlaiice tii Tramisitioni Ecotnioiies
No 447 R Maria Saleth and Ariel Dinar, Evaluatitng Water Institiitions anid Water Sector Perform1ance
No 449 Keith Oblitas and J Raymond Peter in association with Gautam Pingle, Halla M Qaddumi, and JayanthaPerera, Traiiisfe-rinilg Irrigatioii Manageniment to Farinieis iii Andhra Pradeslh, lidia
No 450 Andres Rigo Sureda and Waleed Haider Malik, eds, Juidicial Challenges in the New Millentti int Proceediugsof the Second Sutintint of the Ibero-Anierucan Suiprenlue Couirts
No 451 World Bank, Privatizationi of the Power and Natuiral Gas Iuidiistries tii Hiiiigary and Kazak/istali
No 452 Lev Freinkman, Damel Treisman, and Stephen Titov, Subnattonal Buidgetiuig in Russia Preemnpting aPotential Crisis
No 453 Bartlomle Kaminski and Ibchelle Riboud, Foreigni Investuiient and Restructuring The Evidencefroimi Hi1iugary
No 454 Gordon Hughes and Julia Bucknall, Poland Comlplying w7ith EU Environnmental Legislature
No 455 Dale F Gray, Assessineiit of Corporate Sector Valiue amid Vullnerability. Links to Exchange Rate aiid FiliauicialCrises
No 456 Salman M A Salman, ed , Groundwater Legil and Policy Perspectives Proceedings of a World Bank Seinunar
No 457 Mary Canning, Peter Moock, and Timoth-y Helermak, Reforninlllg Education in the Regions of Ruissia
No 458 John Gray, Kazakhstan A Review of Farni Restructutring
No 459 Zvi Lerman and Csaba Csaki, Llkramne Reviewo of Fnirm Restructuring Experiences
No. 460 Gloria La Cava and Rafaella Y. Nanetti, Albania Filliuug the Vulnerabuluiy Gap
No 461 Ayse Kudat, Stan Peabody, and Caglar Keyder, eds., Social Assessm1ent aiid Agricultural Reforni in CentralAsia anrd Turkey
No 462 T Rand, J Haukohl, and U Marxen, MunIicipal Solid Waste Incinerationi Requirenuenits for a Successfiul Project
(List continues on the inside back cover)
WORLD BANK TECHNICAL PAPER NO. 533
Europe and CentralAsia Poverty Reduction and EconomicManagement Series
Expenditure PoliciesToward EU Accession
Edited byBernard Funck
The World BankWashington, D.C.

© 2002 The International Bank for Reconstruction and Development / The World Bank1818 H Street, NWWashington, DC 20433
All rights reserved.
1234050403
Technical Papers are published to communicate the results of the Bank's work to the development com-munity with the least possible delay. The typescript of this paper therefore has not been prepared in accor-dance with the procedures appropriate to formal printed texts, and the World Bank accepts noresponsibility for errors. Some sources cited in this paper may be informal documents that are not readilyavailable.
The findings, interpretations, and conclusions expressed here are those of the author(s) and do notnecessarily reflect the views of the Board of Executive Directors of the World Bank or the governmentsthey represent.
The World Bank cannot guarantee the accuracy of the data included in this work. The boundaries,colors, denominations, and other information shown on any map in this work do not imply on the part ofthe World Bank any judgment of the legal status of any territory or the endorsement or acceptance of suchboundaries.
Rights and PermissionsThe material in this work is copyrighted. No part of tiis work may be reproduced or transmitted in
any form or by any means, electronic or mechanical, including photocopying, recording, or inclusion inany information storage and retrieval system, without the prior written permission of the World Bank.The World Bank encourages dissemination of its work and will normally grant permission promptly.
For permission to photocopy or reprint, please send a request with complete information to the Copy-right Clearance Center, Inc., 222 Rosewood Drive, Danvers, MA 01923, USA, telephone 978-750-8400, fax978-750-4470, www.copyright.com.
All other queries on rights and licenses, including subsidiary rights, should be addressed to the Officeof the Publisher, World Bank, 1818 H Street NW, Washington, DC 20433, USA, fax 202-522-2422, [email protected].
ISBN: 0-8213-5368-3ISSN: 0253-7494
Bernard Funck is Lead Economist in the Europe and Central Asia Region at the World Bank.
Library of Congress Cataloging-in-Publication Data has been requested
Contents
Foreword .............................................. viAbstract .............................................. viiAcknowledgments .............................................. viiiExecutive Summary .............................................. ix
1. Expenditure Trends and Challenges ............................................... 1Fiscal Objectives of the CEECs .............................................. 1Recent Trends in General Government Expenditure ............................................... 3Differences in Expenditure Composition ............................................... 7Conclusions .............................................. 14
2. Liquidating the Legacy of the Past .............................................. 15Restructuring Banks .............................................. 15Restructuring Enterprises .............................................. 22Conclusions .............................................. 30
3. Successfully Integrating with the European Union ......................................... 31Upgrading Skills .............................................. 31Upgrading Environmental Standards .............................................. 49Upgrading Transport Networks .............................................. 58Conclusions .............................................. 68
4. Ensuring Social Protection .............................................. 71Reforming Public Pension Systems .............................................. 71Reforming Health Care .............................................. 84
5. An Expenditure Strategy for Growth and Convergence .............................................. 99
List of Tables
Table 1.1 Pre-Accession Fiscal Programs of the CEECs, 2000-04 .2Table 1.2 Fiscal Cost of EU Accession and Sources of Financing: National Estimates . 2Table 1.3 Consolidated General Government Expenditure (Excluding Net Lending), 1995-2000 .3Table 1.4 Central Government Debt and Interest Payments .4Table 1.5 Consolidated General Government Primary Expenditure, 1995-2000 .5Table 1.6 Consolidated General Government Expenditure (Excluding Net Lending) by
Economic Type, 1995-2000 .8Table 1.7 General Government Expenditure (Excluding Net Lending) by Function, 1995-2000 .9Table 1.8 Government Employment and Expenditure on Wages and Salaries, 1996-2000 .11Table 1.9 Growth of the Age 0-14 Population. 11Table 1.10 Poverty Incidence and Welfare Payments, 1995-2000 .14Table 2.1 Shares of Nonperforming Loans .15Table 2.2 Total Fiscal Costs of Bank Restructuring in Selected CEECs, 1991-98 .17
iii

Table 2.3 Assets of Majority Foreign-Owned Banks .................................................................. 18Table 2.4 Banking Sector Reform and Financial Regulations .................................................................. 21Table 2.5 Key Elements of the Banking Institutional Framework ............................................................. 22Table 2.6 Enterprise Priva tizatio n and Restructuring, 2001 .................................................................. 24Table 2.7 Rail Transport Volumes and Labor Productivity, 1999 ........................................................... 26Table 2.8 Operating Deficits of Selected CEEC Railways, 1997 ................................................................. 27Table 3.1 School-Age Population, 1990-2015 .................................................................. 32Table 3.2 Enrollment Ratios through the Transition .................................................................. 33Table 3.3 Bulgaria: Rates of School Attendance by Level, 1995, 1997, and 2001 ..................................... 34Table 3.4 Public Expenditures on Education, 1990-2000 .................................................................. 35Table 3.5 Changes in Student/Teacher Ratios .................................................................. 36Table 3.6 TIMSS Eighth Grade Student Assessment Results for Science and Math for Eight
CEECs, 1995 and 1999 ............................................................... 37Table 3.7 PISA Student Assessment Results for Literacy for 15-Year Olds for Four CEECs, 2000 ....... 38Table 3.8 A Composite Formula for Education Finance ............................................................... 41Table 3.9 Total Benefits over the Period 2005-20 ............................................................... 49Table 3.10 Estimated Costs of Environmental Acquis for the CEEC ............................................................ 50Table 3.11 Ratio of Benefits to Costs of Complying with Environmental Directives ................................ 52Table 3.12 Alternative Estimates of Investment Costs for Compliance ..................................................... 53Table 3.13 Replacement Value of Main Road Network, 1999 ............................................................... 59Table 3.14 Internal Rate of Return oun Road Projects: Best Practices ........................................................... 60Table 3.15 Tolls and Vignettes in the CEECs ............................................................... 63Table 3.16 Earmarking of Road User Revenues ("Road Fund") in the CEECs .......................................... 65Table 3.17 Road Fund SWOT ............................................................... 67Table 4.1 Deficit/Surplus of Public Pension Systems in the CEEC, 1991-2000 ........................................ 72Table 4.2 Expenditures of Public Pension Expenditures in the CEECs, 1991-2000 ................................. 72Table 4.3 Basic Characteristics of Mandatory Pension Systems in CEEC Countries Following
Transition Periods .76Table 4.4 Projected Financial Performance of the Public Pillar following Reforms approved
through End-2001 .................................................................. 80Table 4.5 Public Pension Expenditures in EU Member Countries: 2000-50 ........................................... 84Table 4.6 Trends in Health Care Expenditures in the CEECs, 1990-99 ..................................................... 86Table 4.7 Comparison of Health Status Indicators between the CEECs and the EU .............................. 87Table 4.8 Share of Social Health Insurance and Taxation in Public Spending on Health ....................... 88Table 4.9 Social Insurance Contribution Rate for Health .................................................................. 90Table 4.10 Paying Health Care Providers .................................................................. 91Table 4.11 Hospital Beds, Physician, and U tiliz ation Patterns .................................................................. 92
List of Figures
Figure 1.1 General Government Expenditure and Income per Capita in the EU and the CEEC, 1999 ....6Figure 1.2 Consolidated General Government Outlays in the CEECs and the OECD 1995-2000 ............ 7Figure 1.3 Government Wage Bill and Perception of Corruption ............................................................... 12Figure 3.1 Condition of Road Network, 1999 .................................................................. 59Figure 3.2 Average Daily Traffic Density on Motorways and Two-Lane Major Roads ........................... 60Figure 4.1 Demographic and Pension System Dependency Ratio .............................................................. 73Figure 4.2 Number of Beneficiaries from Public Pension Systems, 1991-2000 ......................................... 74Figure 4.3 Number of Contributors to the Public Pension System, 1991-2000 .......................................... 75Figure 4.4 Demographic Dependency Ratio, 1995-2040 (population above 60/Population 20-60) ........ 77Figure 4.5 Health Care Expenditure in the CEECs, 1990-99 .................................................................. 85
iv
List of Boxes
Box 2.1 Restructuring the Polish Coal Mines ......................................... 25Box 2.2 Restructuring Polish Railways ......................................... 28Box 2.3 Restructuring the Energy Sector in Romania ......................................... 29Box 3.1 Bank Experience with Water Utilities in the Baltic States ......................................... 54Box 3.2 Hungary Ml / M15 Motorway Concession Project ......................................... 62Box 3.3 Road User Charges in the CEECs .......................................... 4Box 3.4 Key Features of the Latvian Road Fund ......................................... 66Box 4.1 Indebtedness in the Health Systems ......................... ..................................... 96
v

FOREWORD
The Poverty Reduction and Economic Management Unit in the World Bank's Europeand Central Asia Region has been undertaking a series of analytical works on the issuespertinent to the economies in the region. These issues indude transition issues, issues ofeconomic integration pertinent for the Central and Eastern European countries that arecandidates for accession to the European Union; poverty issues, decentralization issues, andother economic management issues. The analytical work has been conducted by staff of theunit and other bank staff, as well as specialists outside of the bank.
This technical paper series was launched to promote wider dissemination of thisanalytical work, with the objective of generating further discussions of the issues. The studiespublished in the series should therefore be viewed as work in the progress.
The findings, interpretations, and conclusions are the authors' own and should not beattributed to the World Bank, its Executive Board of Directors, or any of its member countries.
Cheryl GraySector Director
Poverty Reduction andEconomic Management Unit
Europe and Central Asia Region
vi
ABSTRACT
This report forms part of a larger project that is entitled, "EU Accession-Developing FiscalPolicy Frameworks for Sustainable Growth," the theme of a conference organized by theEuropean Commission (and cosponsored by the World Bank and the International MonetaryFund) in Brussels on May 13-14, 2002.
The purpose of this report is to discuss the set of public expenditure policies that might beconducive to rapid growth and convergence among the Central and Eastern Europeancountries. It was left to others- complementary contributions to discuss two other keydimensions of expenditure reforms: the overall macroeconomic framework in which they take placeand to which they contribute and the institutional and political economy conditions under whichsuccessful reform strategies can be designed, find political support, and be implemented.
In this report, we seek to take stock of the countries' own public expenditure policy objectivesand to distill the best practices and lessons learned in designing of expenditure reforms withinthose countries. It is obviously impossible within the limits of a report such as this one toaddress every expenditure program. The option was thus taken to focus on some of the largestor most sensitive expenditure items, as well as those most affected by the European Unionaccession process.
We conclude that the general thrust of the expenditure strategies candidate countries have putforward in their pre-accession economic programs appears both appropriate and at leasttheoretically feasible. A primary tool for curbing expenditure should be to rein in subsidies andtransfers. The report also highlights ways in which key expenditure programs (such as oneducation, transport and the environment) could be redirected to be more fully supportive ofgrowth objectives. Factors related to a country's political economy and to the institutionalframework of public resource management will undoubtedly play a determining role inframing what actual policy choices will eventually be made.1.1
vii

ACKNOWLEDGMENTS
This study has been prepared by a team led by Bernard Funck. The team comprised MukeshChawla, Elena Kastlerova, Esperanza Lasagabaster, Anil Markandya, Michael Mertaugh, EvaMolnar, Helena Tang, Giedre Taburniene, and Louis Thompson. The team also received usefuladvice, input, and comments from Jean Jacques Dethier, Armin Fidler, Roger Grawe, CherylGray, Franz Kaps, Maureen Lewis, Catalin Pauna, Kyle Peters, and Michal Rutkowski.The report was processed by Anita Correa.
viii
EXECUTIVE SUMMARY
In their pre-accession economic programs (PEPs), most Central and Eastern Europeancountries (CEECs) have put forward medium-term fiscal strategies to improve budget balancesand cut back taxation levels. The corollary is a need to bring down public expenditure by anaverage of 2.5 percent of gross domestic product (GDP) over the period 2000-2004. TheNational Programs for the Adoption of the Acquis (NPAA), on the other hand, consider thataccession may entail additional expenditures to the tune of 3.5 percent of GDP on average.
These two conflicting sets of objectives can be reconciled only through deep cuts inregular expenditure prograrns. Unfortunately, there is little evidence that would demonstrate acommon resolve to bring this about: on average, the levels of primary expenditures (that is, netof interest payments) remained essentially unchanged as a percent of GDP between 1995 and2000. With a few exceptions, this general observation is also valid at the individual countrylevel.
Are these objectives therefore out of reach? Perhaps not. First, there is evidence that atleast some countries have managed to curb their expenditure levels in the recent past. Second,as this report will point out, there is sufficient variation across the expenditures of CEECs bytypes of expenditure to underpin the notion that expenditure reform is at least theoreticallyfeasible, even though it is politically difficult.
The purpose of this report is to take stock of that experience and of the measure ofupcoming challenges and then to distill the lessons that emerge from the early efforts of theCEECs to reform their expenditure policies. Examples of best practices will emerge along theway.
We will review recent trends in comparative aggregate expenditure levels, and then shiftto a more disaggregated approach to search out the flexibility to affect these trends. On thisbasis, the subsequent parts of this paper examine the ways in which CEECs are dealing with thethree major expenditure challenges confronting them:
* Liquidating the legacy of transition (that is, recognizing, containin& and financingthe costs of bank and enterprise restructuring).
* Helping economies rise to the challenges of European integration by upgradingskills levels, environmental standards, and transport networks.
* Providing social protection to an aging population in an affordable manner,particularly in the two key areas of pensions and health.
ix
Expenditure Levels and Trends
While CEECs have often made some progress in bringing down total governmentoutlays, the record of curbing primary expenditure is at best mixed. The only major examplesare those of Estonia (which compressed spending on goods and services) and Hungary and theSlovak Republic (which managed to cut back current transfers). On average, however, primaryexpenditure remained steady at about 38 percent of GDP over the period.
This level is about the same level as that of the cohesion countries (Greece, Ireland,Portugal, and Spain). A closer look at the data reveals, however, (a) that the traditional positivestatistical correlation between income and government size is actually inverted in the case of thecohesion countries and (b) that the country in which government is the smallest-Ireland-isalso the country in which income per capita has risen the most rapidly since the mid-1980s. Tothe extent that a causal link exists in these relationships, it is Ireland's experience that theCEECs should naturally be tempted to replicate.
Indeed, the general trend of government expenditure across the Organization forEconomic Cooperation and Development (OECD) has been downward: The trend has beenmost pronounced within the European Union (EU) where general government outlays shrankby five percentage points of GDP between 1995 and 2000. The relative decline was perhaps lessoutside of Continental Europe, but the starting point was also considerably lower, bringing intoeven sharper contrast the relative performance of the CEECs. By 2000, general governmentoutlays in the CEECs exceeded the levels observed among non-Continental European membersof the OECD by a full seven percentage points of GDP.
The variation in expenditure levels across CEECs lends support to the view that, farfrom being pre-ordained, expenditure levels are subject to a fair degree of policy discretion. In2000, primary expenditure varied between around 43 percent of GDP in the Czech Republic andSlovenia to slightly more than 30 percent in Lithuania and Romania. This observation standseven after controlling for differences in income level. An even greater variation can be observedwhen government expenditure is broken down into economic and functional categories. Forjust about any particular item of the Governance Finance Statistics (GFS) classification, thelevels of expenditure (relative to GDP) vary by at least a factor of two, and the differences rangeall the way up to a factor of twelve in the case of enterprise subsidies. Such variations seem toprovide evidence that scope exists to carry out the type of expenditure reform implicit in theCEECs' Pre-Accession Economic Programs.
A closer inspection of the expenditure categories gives a first set of clues as to where themain opportunities for reform might be. Such a closer look shows that the CEECs:
r Spend less than member countries on wages and salaries; their social sectors,however, are often overstaffed.
o Are already catching up with (and sometime exceeding) the high levels of publicinvestment observed amnong cohesion countries, which raises concerns about thequality of the project pipeline and the possible displacement of operations andmaintenance expenditure.
x

* Devote the lion's share of their public resources to funding transfers and subsidies.Early reformers are beginning to see the benefits of their efforts, but pressures aremounting on the later reformers.
* In some cases, have not yet managed to rein in subsidies for enterprises (broadlyspeaking), in part because of the ongoing cost of bank restructuring.
How to bring reform about in practice is a different matter. To answer that question, weturn to the real-life experience of the CEECs in dealing with the three key expenditurechallenges mentioned previously, bank and enterprise restructuring; upgrading of skills,environmental standards, and transport networks; and provision of social protection.
Liquidating the Legacy of the Past
The inability of most CEECs to enforce financial discipline on enterprises at thebeginning of transition has left -a painful and burdensome legacy. Banking problemsconstituted only one manifestation of the underlying enterprise problems. In addition to "soft"loans from the banking sector, unviable enterprises were kept afloat through arrears to the state(most prominently tax arrears and arrears in social security contributions) as well as arrears toother enterprises (most prominently public utilities). For many CEECs, liquidating this legacyremains at the top of the list of fiscal priorities.
Banking Sector Restructuring
A key issue facing the CEEC governnents is how to minimize fiscal costs whileliquidating their liabilities. These costs can be very high. For the period 1991-98, the total fiscalcosts of such crises for some of the CEECs ranged from 2 percent of GDP for Estonia to 42percent for Bulgaria. The bulk of the fiscal costs have been direct costs incurred by thegovernment to recapitalize banks. The following broad lessons emerge:
* The earlier that portfolio problems are openly recognized and addressed the better.One main reason why the Slovak and Czech bailout operations were so muchcostlier than the Estonia bailout is that in the Slovak Republic and the CzechRepublic the underlying bad loan problems were left to fester for a long timebefore being addressed frontally.
* Successful bank restructuring ultimately requires bank privatization, preferably tostrategic investors. Foreign banks in particular have played a central role inbreaking up the "old boys' club" that used to bind banks to their borrowers andthat proved fatal to the banks. The now massive presence of foreign banks (theycontrol more than two-thirds of bank credit in most CEECs) should help thebanking industry grow on a sounder basis.
* Banks need to be fully recapitalized first for bank privatization to be successful.Otherwise the risk is high that the banking regulator will show excessiveregulatory forbearance, or that the new private owners will see no better optionthan to engage in the same type of reckless behavior as their predecessors, sowing
xi

the seeds of continued banking problems (as the examples of Hungary, Bulgaria,and the Czech Republic have shown).
The generally healthier-looking balance sheets of commercial banks today provide aclear sign of how much progress has been made. This does not mean that the bad loan problemhas vanished. In many countries, the reason the numbers look smaller is that nonperformingportfolios have been carved out and transferred to a specialized debt recovery agency.
Thus, how to dispose of these bad loans remains a key issue. Two approaches (onecentralized and the other decentralized) have been tried, without clear evidence that one issuperior to the other in terms of recovery rate or enterprise restructuring. In the circumstances,an eclectic, multi-track approach may actually bring about the best results. Hungary, forinstance, was quite successful with its mixed private sector/state strategy involving bothcentralized and decentralized approaches. The Slovak Republic has recently adopted a similarmulti-track approach involving sales of pools of loans to private investors, auctioning ofindividual loans to smaller investors, outsourcing of collection through asset/legalmanagement contracts, and selective writing off of noncollectible claims.
No matter which approach is adopted, effective creditor rights are essential, in terms ofrecoveries under bankruptcy and also in terms of incentives for both debtors and creditors tosettle to avoid bankruptcy. Unfortunately, building a full-blown bankruptcy system has oftentaken a painfully long time. For this reason, the Czech Republic and the Slovak Republic areboth focusing first on improving liquidation, promoting out-of-court restructuring mechanisms,and introducing a fast restructuring or reorganization track.
Enterprise Restructuring
Restructuring enterprises is the other side of the coin. One important route throughwhich budget constraints have been hardened is privatization. While almost all of the CEECshave reached industrialized market economy standards in terms of small-scale privatization(with only Bulgaria and Romania lagging slightly behind), progress has been slower for largerfirms: by 2001, fewer than 50 percent of the large-scale enterprises had been privatized in fiveout of ten CEECs.
In cases involving large externalities, governments may need to incur fiscal costs in theshort term to deal with the social consequences of restructuring large-scale enterprises in orderto reap the longer-run benefits that privatization would ultimately bring. The restructuring ofcoal mines provides an example of what such a task entails: The cost of the (to date largelysuccessful) Polish program (1998-2002) is amounting to around US$2 billion (equivalent to 1.3percent of GDP), mainly for social measures.
Railways are another case in point. In most CEECs, railways have suffered from adecline in the demand for rail transport (linked to the shift from transport-intensive heavyindustries toward a more service-based economy and the emergence of more competitivemodes of transport-trucks for freights and cars and airlines for passengers-without acorresponding reduction in staffing). Massive restructuring and labor shedding will often berequired to halt the resulting drain on public budgets. Such large-scale restructuring (also
xii

mandated by the adoption of the acquis communautaire) will be costly, particularly for laborredundancy reduction. Restructuring the entire Polish railway system, for example, mayeventually require a 50 percent reduction in employment, totaling about 300,000 jobs, andUS$1.5 billion (0.9 percent of GDP). This is a matter of mere survival, however, and, as in thecase of coal, footing the bill early will bring about much larger fiscal benefits later.
A final major factor in softening the budget constraints on enterprises in some CEECs isarrears to other enterprises, in particular to state-owned public utility companies. Here, again,the adoption of the acquis communautaire is helping, because it encourages such measures as theunbundling of utilities, the restructuring of tariffs and the elimination of cross-subsidies, andopen access to networks. Lithuania's power sector, for example, completed this process inJanuary 2002.
Going beyond the acquis communautaire, however, many CEECs are now activelymobilizing the private sector to participate in the provision of infrastructure services.Telecommunications, gas, and power utilities have been or will soon be privatized in countriessuch as Lithuania, the Czech Republic, Hungary, and the Slovak Republic. It is too early toassess the results of these recent privatizations. If the experience of other countries around theworld is any guide, then private sector participation in the provision of infrastructure services,if well developed, can boost efficiency and ease the strain on public finances, while increasingthe coverage of such services.
Successfully Integrating with the European Union
As the burden of the legacy of the early transition period is reduced, governmentsaround the region are facing new expenditure demands-generally legitimate but oftenoverwhelming-to support their countries' integration into the EU, and beyond, into the globaleconomy. Many of these demands relate to the need to upgrade skills, environmentalstandards, and transport networks.
The nature of the fiscal challenges involved differs from one case to another. There isgenerally a clear need for countries to invest in environmaent and transport. Some countries arealready investing heavily. Governments will need to be all the more vigilant in that some ofthese demands come supported by financing, sometimes on very attractive terms. Even inthose cases the issue is still to ensure that higher priority claims on public resources are notdisplaced and that the programs being financed are sustainable beyond the initial investment.In the case of education, however, the issue is the more difficult one of redirecting expendituresfrom yesterday's priorities to those of today and tomorrow. That is, while the benefits ofexpanding parts of the education system may be evident, shrinking other parts of the systemmight be politically crippling.
Upgrading Skills
Human capital has been and will remain a key asset for securing the benefits ofEuropean and global integration. Together with supportive macroeconomic and financialpolicies and infrastructure investments, education will continue to play a key role in supporting
xiii
the transformation of the CEECs from low-income, resourced-based economies to high-income,knowledge-based economies.
In the last decade, the demand for education was affected by two major changes:
* There was a sea change in the demand for skills that rendered the skills of manymanufacturing and mining workers irrelevant to the new needs and created ademand for other skills, particularly in the service sector. Furthermore, thedecompression of wages that accompanied the transition boosted the impliedreturns on education, hence the demand for education.
* There was a contraction in the school age population at rates formerly seen only incases of war, famine, or pestilence. By the year 2015, the school age cohort in theCEECs will be from one-third to one-half smaller than it was in 1990, and about 25percent smaller than it was in 2000.
The result has been that enrollment rates rose at all levels except secondary education,while enrollment numbers below tertiary levels shrank markedly.
These developments call for vocational secondary education to teach more generic skills,higher education to expand and become more flexible, and the legal and fiscal environment toencourage employers and local governments to develop lifelong learning programs to meetlocal (and global) skill needs.
The needed redirection of education systems took place in a context of limited resources.The levels of public expenditure on education have remained broadly stable (relative to GDP) in1995-2000. Of course, governments typically sought to secure additional resources foreducation, and sought to diversify financing sources through such actions as: (a) decentralizingeducation responsibilities to regional and local governments, (b) requiring parents to purchasetextbooks and other educational materials, and (c) expanding private education. But theresources available to the sector generally remained limited. Under the circumstances, thesuccess of the strategy for redirecting education just outlined was predicated on the capacity ofgovernments to redirect resources from lower to higher levels of education, in part bydownsizing staff and facilities in many primary and secondary education programs whilereorienting them, improving their quality, and improving the salaries of the remaining teachers.
The supply side, however, was slower to react to these new conditions. Indeed, theresponse of education managers throughout the CEECs has more often than not focused onmaintaining the jobs of teachers and other educational staff. Student/teacher ratios (alreadybelow OECD levels at the start of the decade) fell further, and teacher workloads dropped towell below OECD standards (for example, an average 583 hours per year in primary school inHungary compared to 788 hours in the OECD as a whole). One of two outcomes (or acombination of both) typically resulted in: (a) falling teacher salaries leading to a seriousproblem with teacher morale and motivation (as well as to growing problems of corruption insome of the CEECs); and/or (b) outlays for salaries and benefits rising as a share of otherrecurrent education expenditures and displacing expenditures vital to maintain and updateteaching, learning materials and school infrastructure.
xiv

The feeble incentive for efficiency conveyed by the prevailing input-based financingformula and, in many countries, by the small size of the local jurisdictions in charge of schools,have further hindered the necessary restructuring.
Partly as a result of these problems, both quality and access have begun to show signs oferoding, although from levels that are still relatively high. With a few notable exceptions(including Hungary and Latvia), student scores on the international TIMSS tests havedeteriorated. In addition, PISA tests indicate a growing variation in quality between schools,and perhaps more worrisome, a relatively poor mastery by CEEC students of the higher-orderskills needed for most of the fastest-growing jobs in the global economy.
Furthermore, while the regional averages are encouraging, the detailed data revealconsistently lower quality and attendance in rural areas, among ethnic minorities, and amongchildren from poor households. The data also show declining secondary education coverage infive countries (Bulgaria, the Czech Republic, Latvia, Lithuania, and, especially, Romania). Mostof this decline has occurred in vocational and technical education. The decline in secondaryenrollments reflects the perception that vocational education no longer ensures employment forgraduates. It may also reflect pressures for some students to enter the labor market in order toaugment falling household incomes and, in the poorest of the CEECs, the impact of the shiftingof financing responsibilities to households for textbooks and other educational inputs, or ofprohibitive "informal" payments.
In response to these quality and equity concerns, new policy patterns are emerging insome countries that emphasize
* Uniform nationwide education financing based on capitation formulas. Althoughthey are difficult to calibrate, composite formulas that reflect cost differencesamong different programs, place-specific cost factors, or cost differences arisingfrom special learning needs of students seem to be the way of the future.
* Assignment of education matters to larger jurisdictions, or inducements for smallerjurisdictions to cooperate in the direction of economies of scale.
The disappointing results on standardized international aptitude tests have also calledattention to the need to upgrade education systems to the requirements of the global knowledgeeconomy. National governments will need to
* Exercise greater leadership in bringing about curriculum reform (as in Slovenia).
* Consolidate vocational education programs into fewer specializations for clustersof kindred occupations (Hungary provides a good example).
* Define appropriate mechanisms to finance the quality higher education that isneeded to support the CEECs' move to innovation-driven growth. This mayinvolve concentrating state budget financing on either the most capableinstitutions or the most capable students, and letting (duly accredited) privateinstitutions and tuition payments look after the rest of the sector.
xv

Upgrading Environmental Standards
In seeking to join the EU, the CEECs are also binding themselves to much higherenvironmental standards. Meeting the environmental acquis will bring considerableimprovement to the quality of life. According to recent studies, the expected benefits frommeeting air standards are generally the highest, followed by the benefits arising from stricterwater standards.
These benefits will unfortunately come at a cost. Indeed, discussions on theenvironmental acquis often revolve around the cost of meeting the environmental requirementsfor accession. The initial calculations made by the European Commission in 1997 suggestedthat the CEECs would have to devote on average about 5 percent of GDP to environmental-related expenditures (investment and operations and maintenance). This would be more thandouble the levels of such expenditures in the CEECs in recent years.
While benefits are generally expected to exceed costs, this is not always the case. Inparticular, the benefits of the waste directive are generally below costs.
Each individual investment will therefore need to be subjected to thorough cost/benefitanalysis. While the acquis communautaire is prescriptive on environmental standards, it leavesconsiderable latitude on how to meet these standards. The price of complying variesaccordingly. For instance, more detailed or recent studies, such as the ISPA (Structural PolicyInstrument for Pre-Accession) strategy for Lithuania, come up with cost figures that are asmuch as 75 percent lower than the earlier calculations. For Bulgaria, the World Bank estimatescosts at about half those of an earlier European Commission study.
A number of measures can indeed be taken to improve the cost-benefit tradeoffs,induding adopting least-cost investment solutions (especially for energy-related investments),opening up procurement to international tender, and phasing in compliance measures overtime, starting with those that willbring the most immediate benefits to the populations andscheduling the more expensive items later in time.
Funding environmental investments, however, is not merely a matter of increasingexpenditure commitments. Rather, there is a need for administrative changes in budgetimplementation to make funding more efficient (for example, consolidation of small ecologicalfunds). Commercialization could potentially be helpful but still entails some budgetary burden.A more effective means of furthering EU compliance is likely to be through privatization ofsome of the larger and more polluting industries in CEEC countries. A clear understanding ofthe environmental liabilities of past damages is necessary, and a legal agreement with thegovernment explaining the new owner's responsibilities is crucial to attracting credibleinternational investors.
Upgrading Transport Networks
To spur growth, the CEECs are also called upon to upgrade and redirect their transportnetworks to the requirements of European integration. This report will focus on roads and
xvi
motorways because combined they take the lion's share of the investment programs. Keychallenges include:
* A rapid increase in motorization and a drastic shift in mode. Over the past decade thedemand for road transport has grown radically, owing to the sharp decline of railtransport and the unprecedented growth of passenger car ownership. The numberof vehicles in the CEECs increased on average between 70 and 120 percent inrecent years. The supply side, however, has not kept pace. The road sector hasbeen a victim of underinvestment in maintenance and modernization. As a result,the roads are mostly congested, slow, polluted, and unsafe.
* European integration challenges. The most important EU accession challenges arisefrom the liberalization of international trucking, the increase in axle loads to thehigher EU standards (11.5 ton/axle), and the accelerated corridor developmentprograms under the Trans-European Network program.
Although in most countries the roads needed to stimulate domestic economic growthare largely the same as those needed for international transit traffic, the attempts to expand themotorway network too rapidly and to standards that are not always economically justified havealready diverted funds from maintenance and development. Indeed, even in the main corridorsthe rapidly increasing volume of heavy truck transport has not been matched by acorresponding expansion of capacity or strengthening of the pavement.
While it is true that potential investors might be deterred by the current poor roadaccessibility, the CEECs increasingly recognize that the motorway construction program mustbe sustainable. When the construction and financing of the motorway section is planned itssocioeconomic impact should be compared to investing in the equivalent amount in thepreservation and improvement of existing road assets or investing in transport services oreducation or health. Road investments-whether to preserve the existing road assets (deferredmaintenance and routine and periodic maintenance) or to add capacity to the basic network orto expand the motorway network-need to compete for limited funds.
At present, few motorway sections have sufficient level of traffic to justify theinvestments. In contrast, returns tend to be very high on maintenance expenditure, followed byrehabilitation and pavement strengthening. It is therefore the rehabilitation and pavementstrengthening that ought to be prioritized, if countries are serious about growth andconvergence.
Ensuring Social Protection
Parallel with the broad consensus that exists in favor of market economics andintegration with Europe and the rest of the world, there remains a widespread demand forgovernments to protect people against the major risks of life. Health and old age are twoparticularly sensitive areas. Since the early days of transition, however, governments have hadto contend with the rising costs of extending such social protection. In a bid to curb these costs,one country after another has revisited the old Bismarckian model of social policy and has triedto define a new role and new models for the concept of social insurance that lies at its heart.
xvii

Reformning Public Pension Systemns
Pension systems came under serious strains during the 1990s, and, despite variousattempts at reform, pension schemes were still displaying deficits in most CEEC countries at theend of the decade. The causes of these deficits varied between essentially two groups ofcountries.
Pressures emerged either on the expenditure side or the revenue side (or both), asbeneficiaries expanded and/or the contribution base shrank. In most countries (particularlyRomania, Lithuania, and Poland), the expansion in the number of pensioners exceeded theunderlying growth in the elderly population, as early retirement, occupational privileges, anddisability claims surged.
Some countries suffered an even more damaging erosion of their tax base, particularly inthe early transition years, as the labor force participation shrank and unemployment soared.While a few countries (for example, Poland, the Czech Republic, and Slovenia) were able tomaintain a comparatively stable contribution base, and while Hungary, Latvia, and Lithuanialargely stabilized their contribution base by the end of the decade, the contribution base hascontinued to fall sharply in Bulgaria and Romania through the second half of the decade. Thesetwo countries had increased contribution rates to cope with financial deficits and further risinglabor costs and increasing incentives to remain in the informal market.
Reflecting these pressures, system dependency ratios (the ratio of pensioners tocontributors) fell throughout the region. The degree at which system dependency ratiosdeteriorated varied across countries, rising all the way up to 100 percent in Romania andBulgaria.
Accordingly, the CEECs fall into two broad clusters:
* A first cluster of countries (including Bulgaria, Estonia, Latvia, Hungary, andPoland), where the resulting financial pressure was more keenly felt, undertooksystemic reforms. In reforming their public pillar, they have basically pursued oneof the following two approaches. In some countries, while the structure of benefitswas changed, the defined benefit principle was preserved. In a second subgroupof countries (Latvia and Poland), the public pillar was transformed into a notionaldefined contribution scheme, a new pay as you go paradigm developed in Europein the 1990s. Beyond reforming their public pillars, a number of CEECs alsoproceeded to establish second, funded, pillars, the size of which (as well theswitching strategy) has generally been defined in consideration of the "transitioncosts" that reforms would generate.
* Another duster (including the Czech Republic, the Slovak Republic, and Slovenia),where pressure to reform was initially less intense since system dependency ratiosdid not initially deteriorate as severely, limited their actions to more incrementalparametric changes.
xviii
The outcome of these diverging policy courses is already quite visible in the aggregatedata. In 1995, the CEECs were essentially polarized in two groups with a group of highspenders (Hungary, Poland, and Slovenia) devoting 18-20 percent to social welfare and the restthat were spending around 10 percent of GDP. By 2000, the picture had changed with twogroups of countries converging toward the middle of the range as early reformers (Hungary,Poland) were set on a downward expenditure trajectory while spending was drifting upwardamong some of the former low spenders (the Czech Republic, Bulgaria, and, to a lesser extent,Estonia and Lithuania).
Furthermore, actuarial projections presented in this report show that the pensionschemes in countries belonging to the first cluster (Bulgaria, Estonia, Hungary, and Latvia) arebetter prepared, as a result of these reforms, in confronting the aging demographics (eventhough some additional reforms may still be necessary in attaining a balanced position in thelong term). In contrast, while limited parametric changes at first succeeded in keeping thepension finances of countries within the second cluster within bounds, there is now a growingrealization that, left unattended, their pension system deficits are set to expand at a rapid pace.
The future policy agenda varies accordingly between those countries facing thechallenge of consolidating recent reforms and those that still need to define a feasible approachto reform. The first cluster (Bulgaria, Estonia, Latvia, Hungary, and Poland) will have to resolvethree key issues: enhancing coverage and compliance, consolidating the reformed public pillar,and promoting the safe development of private pension plans.
Countries in the second cluster (including Lithuania, the Czech Republic, the SlovakRepublic, and Slovenia) are now grappling with reform options. The new wave of reformsshould seek to restore long-term sustainability, and not only to contain deficits temporarily. Toachieve this, some form of systemic action of the sort adopted in the first group will be required,because there is a risk that continued incremental parametric measures would eventually erodetrust in the public pillar.
Those who are turning their attention to reform have a rich body of experience to drawupon. They can also draw strength from the fact that early reformers are now emerging withsystems that are better placed to face the challenge of the aging demographics, and are on astronger long-term financial footing than pension schemes in many EU countries.
Refortning Health Care
Following a decade of escalation in the cost of health care, almost all the CEECs have bynow transformed the basic setup of their health care system in a bid to raise additionalresources for the sector and to curb costs through efficiency gains. These objectives would beachieved through the separation of financing from provision of health care, the introduction ofsocial health insurance, the establishment of new provider payment mechanisms,decentralization, and competition among providers and greater choice for patients.
In many countries the reforms are too recent to assess. A few tentative observationsnevertheless emerge. While countries have been experimenting with various provider paymentarrangements, there is little sign as yet that health costs have been successfully contained.
xix

Measured in dollar terms (at purchasing power parity), health expenditure per capita surged bymore than 50 percent during the past decade. This compares to a 25 percent increase onaverage among the cohesion countries. The only countries to escape this upward trend wereBulgaria, Lithuania, and Romania. Difficulties in collecting social insurance contributionssometimes exacerbate the resulting financial strains.
Health care may have become more costly, but the CEECs stand out among transitioncountries for having maintained or even improved the health status of their population. Lifeexpectancy has improved to between 70.2 and 75.8 years, and so has infant mortality. However,infant mortality remains very high in countries where health spending per capita is lowest(Bulgaria, Latvia, and Romania). The same countries are also exhibiting high death rates fromcardiovascular and cerebro-vascular ailments.
One important change since the mid-1990s is that the further rise in health costs hasgenerally been associated with higher (formal or informal) out-of-pocket payments on the partof patients, rather than with additional public spending.
Indeed, public spending on health has broadly stabilized (relative to GDP) since themid-1990s. The levels of public spending, however, remain comparatively high in a number ofcountries (including, for example, the Czech Republic), and the health contribution rates leviedto finance them (generally around 13-14 percent of wages) are uniformly high in comparisonwith those in the EU.
The need for efficiency gains remains, therefore, as pressing as ever. Despite sweepingchanges to the design of health systems, there is as yet little sign of the expected efficiencygains. In some cases this is because, despite the talk of separating the financing and provisionof health services, introducing competition in service provision, and covering the populationwith mandatory health insurance, there has been considerably less change in the way the sectoractually operates. In addition, countries are still struggling to define appropriate paymentformula to tie their general practitioners, specialists, and hospitals into an appropriateframework of efficiency-enhancing incentives.
In this context, a number of recent developments look promising, including inparticular, the effective separation of service providers from ministries of health (beyond a corenumber of public health and last resort institutions), and their incorporation into various formsof ownership; the spread of mixed provider payment formulas and the first experimentationwith diagnosis related groups schemes for the payment of hospitals; the merger of healthinsurance collection with that of other social security contributions; and the regularization ofprivate payments into a system of well-regulated patient co-payments.
An Expenditure Strategy for Growth and Convergence
Expenditure policies can make a decisive contribution to the CEECs' objective of growthand convergence with the EU. In keeping with the trends observed within the EU (includingwithin the cohesion group) as well as the OECD at large, a first element of such a strategywould be to curb aggregate expenditure levels, as most countries have indeed suggested in
xx
their PEPs. A first rationale for such an approach is to leave more resources in the hands of amore efficient private sector and attain a more rapid factor productivity growth.
Of equal importance, such a strategy would create the fiscal space needed to reduce theburden of labor taxation, thereby activating resources (that is, labor) that are currently sittingidle. At present, the burden of labor taxation in the CEECs (at about 75 percent of wages)exceeds even the high levels that saddle EU labor (at an average rate of 53 percent) and is evenfurther out of line with the levels observed in the broader OECD. It is difficult to see how theCEECs could live up to the aspirations of the Lisbon Strategy that they have recently espoused,of turning the enlarged EU into "the most competitive economy in the world with socialcohesion and full employment of the 70 percent of the adult population" without bringing thosetax wedges down.
A primary tool for curbing expenditure should be to rein in subsidies and transfers.Currently, this category of expenditure makes up as much as 60 percent of total primaryexpenditure in the Czech Republic and the Slovak Republic, as compared to 40 percent ofprimary expenditure in the EU. Even at the other end of the range, Lithuania still devotesrelatively more of its expenditure envelope to subsidies and transfers (38 percent) than theaverage cohesion country (35 percent).
Indeed, despite years of progress in tightening budget constraints, considerable scoperemains in a number of countries to cut back on enterprise subsidies. This is the case with theCzech Republic and the Slovak Republic where enterprise subsidies account for more than 12percent of GDP, but even Estonia, Hungary, Latvia, and Romania still spend more than twice asmuch relative to GDP (about 4 percent of GDP) as the average EU country (1.5 percent of GDP)on subsidizing various categories of enterprises. Part of the answer lies in completing bankrestructuring and expediting large-scale enterprise privatization. In some cases (for example,coal mines) the initial restructuring costs may be high. Provided the restructuring strategies arewell tailored to the ultimate privatization of the enterprises, such up-front costs are likely to beworth paying, for the sake of the longer-term fiscal benefits that would arise from taking ailingfirms off of the public books. A second source of fiscal relief would come from theimplementation of the acquis communautaire in sectors such as power, gas, and transport to theextent that it protects government from the ever-present temptation to provide state aid.
Similarly, much more could also be done to curtail social transfers. In Bulgaria, theCzech Republic, and Hungary, social transfers exceed the levels observed in the cohesioncountries; in Slovenia and Poland, they are even higher (relative to GDP) than among EUmembers. Some of the CEECs are acting, apparently successfully, to address this problem(witness the 2-3 percentage points of GDP reduction in social transfers in Poland and Hungarybetween 1995 and 2000). In the absence of systemic action, the upward trend appearsinexorable in the Czech Republic (where spending on social transfers rose by more than threepercentage points of GDP between 1995 and 2000), and the Slovak Republic might soon followsuit. Therefore, the time has come even for those countries that have avoided any pensionsystem crisis to move ahead with more systemic reform if they wish to secure old-ageprotection over the long run while improving labor market incentives in the short run.
xxi
Health care reform is another way of pursuing the latter objective. To make up forpersisting inefficiencies in the sector, current health insurance contribution rates are set farhigher than those prevailing within the EU. Above and beyond the direct benefits it wouldbring to the sector, more decisive action on health care reform, by creating room for cuttingback the payroll tax, would therefore also contribute indirectly to the overarching growth andconvergence the CEECs have set out for themselves.
We have highlighted ways in which key expenditure programs could be redirectedtoward growth objectives. The education sector, for instance, could make a better contributionto CEECS' integration into the global knowledge economy if countries took advantage of thepassing of a "baby bust" wave to downsize the staffing and facilities of basic and vocationaleducation and shift the resources toward other educational inputs as well as higher or moregeneric levels of education.
Transport networks can also play a key role in facilitating growth. But their impact willbe more powerfully felt if investmient decisions are guided by economic rather than by otherconsiderations. In practice, for many countries this would imply prioritizing maintenanceexpenditures and phasing in new motorway construction only as the underlying traffic justifies.
Similarly, the rates of return on environmental programs can vary within a considerablemargin. In some cases, they can actually be quite high. Estimates presented in this reportsuggest that clean air (and to a lesser extent clean water) measures would yield the highesteconomic benefits in relation to costs, but they raise questions about the amount of investmentin waste management that would be economically viable. These indications are still tentative,and the merit of each individual project will need to be ascertained on a case-by-case basis. Butthe cause of growth and convergence will be better served if those projects showing the highestreturn receive first priority.
In conclusion, the general thrust of expenditure strategies put forward in the PEPsappears both appropriate and at least theoretically feasible. Factors related to a country'spolitical economy and to the institutional framework of public resource management willundoubtedly play a determining role in framing actual policy choices.
xxii
1. EXPENDITURE TRENDS AND CHALLENGES
In their Pre-Accession Economic Programs (PEPs) most Central and Eastern Europeancountries (CEECs) are putting forward medium-term fiscal strategies to improve budgetbalances and cut back taxation levels. The corollary is a need to bring down public expenditureby an average of 2.5 percent of gross domestic product (GDP) over the period 2000-2004. TheNational Programs for the Adoption of the Acquis, on the other hand, figure that accession mayentail additional expenditures averaging 3.5 percent of GDP. Reconciling these two sets ofobjectives can only be done through deep cuts in regular expenditure programs.
In this chapter we will seek to identify the scope for such public expenditurerestructuring. We will discuss the fiscal objectives the CEECs have set for themselves in variousofficial documents and will compare those objectives to recent trends in public expenditureaggregates across CEECs. At an aggregate level, it appears at first that there is little room forpublic expenditure restructuring and rationalization.
This observation motivates a further inquiry into the detailed composition ofexpenditure across the European Union (EU) accession group and in selected comparatorcountries. The picture that emerges from this closer look is that instead of the initial impressionof inertia and uniformity, there is actually considerable variation in spending levels acrosscandidate countries, and that this variation provides prima facie evidence (contrary to the spiritof inevitability that often pervades policy debates on expenditure reform) that different policyoptions are at least conceivable.
FISCAL OBJECTIVES OF THE CEECS
Most PEPs plan to reduce overall budget spending in the medium term (except those ofthe Czech Republic and Romania, which envisage only containing the growth of publicexpenditure relative to GDP) (table 1.1). The planned public expenditure cuts vary fromcountry to country (ranging from about 1 percent of GDP between 2000 and 2004 in Slovenia toabout 4 percent of GDP in Bulgaria), but the objective is the same: to make room for taxreduction while progressing toward the fiscal objectives of the EU's Stability and Growth Pact.PEPs are, however, often less explicit as to how expenditure cuts would be achieved.
- 1 -
Expenditure Policies Toward EU Accession
Table 1.1 Pre-Accession Fiscal Programs of the CEECs, 2000-04(percent of GDP)
Revenue Expenditure Balance2000 2004 2000 2004 2000 2004
Bulgaria 43.5 38.9 44.5 40.4 -1.0 -1.5Czech Republic 40.6 41.3 43.8 45.6 -3.2 -4.3Estonia 38.9 37.7 39.6 38.1 -0.7 -0.4Hungary 45.9 43.1 48.9 45.1 -3.0 -2.0Latvia 30.0 27.0 32.7 27.7 -2.7 -0.7Romania 31.5 34.0 35.5 37.0 -4.0 -3.0Lithuania 30.2 28.7 33.0 30.1 -2.8 -1.4Poland 39.6 36.9 42.7 40.5 -3.1 -3.6Slovak Republic 35.3 29.3 38.7 31.8 -3.4 -2.5Slovenia 42.8 42.8 44.1 43.2 -1.3 -0.4
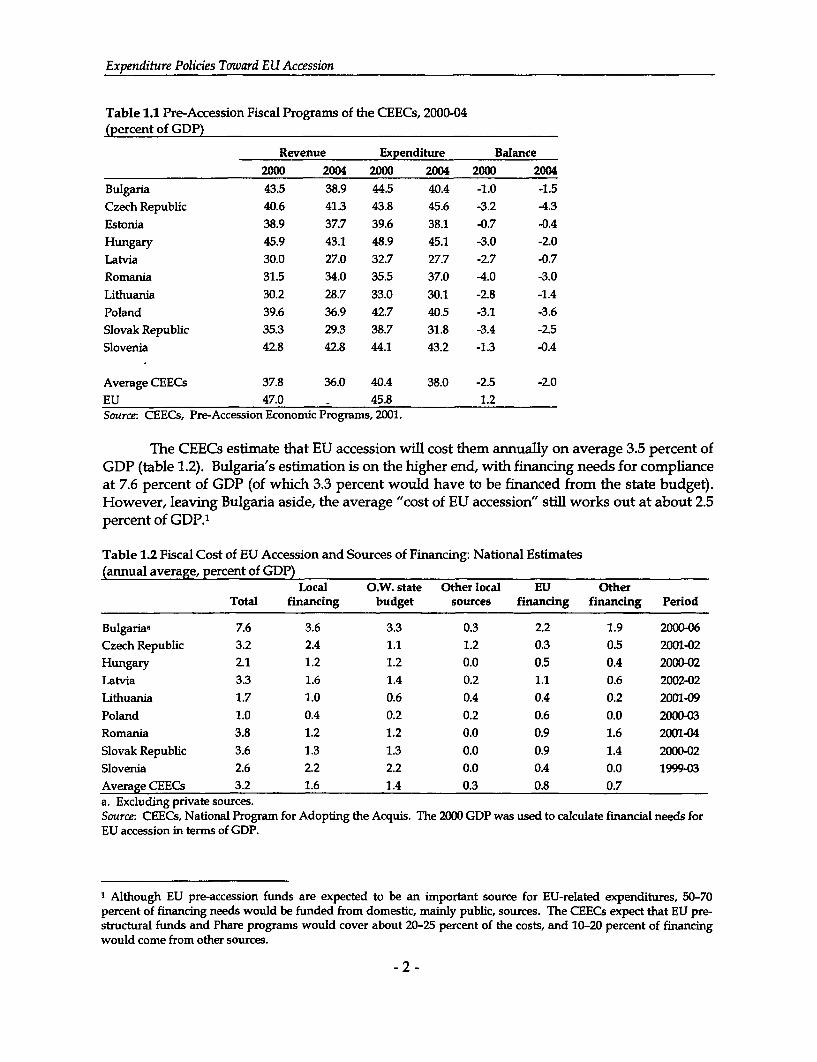
Average CEECs 37.8 36.0 40.4 38.0 -2.5 -2.0EU 47.0 45.8 1.2Source: CEECs, Pre-Accession Economic Programs, 2001.
The CEECs estimate that EU accession will cost them annually on average 3.5 percent ofGDP (table 1.2). Bulgaria's estimation is on the higher end, with financing needs for complianceat 7.6 percent of GDP (of which 3.3 percent would have to be financed from the state budget).However, leaving Bulgaria aside, the average "cost of EU accession" still works out at about 2.5percent of GDP.'
Table 1.2 Fiscal Cost of EU Accession and Sources of Financing: National Estimates(annual average, percent of GDP)
Local O.W. state Other local EU OtherTotal financing budget sources financing financing Period
Bulgariaa 7.6 3.6 3.3 0.3 2.2 1.9 2000-06Czech Republic 3.2 2.4 1.1 1.2 0.3 0.5 2001-02Hungary 2.1 1.2 1.2 0.0 0.5 0.4 2000-02Latvia 3.3 1.6 1.4 0.2 1.1 0.6 2002-02Lithuania 1.7 1.0 0.6 0.4 0.4 0.2 2001-09Poland 1.0 0.4 0.2 0.2 0.6 0.0 2000-03Romania 3.8 1.2 1.2 0.0 0.9 1.6 2001-04Slovak Republic 3.6 1.3 1.3 0.0 0.9 1.4 2000-02Slovenia 2.6 2.2 2.2 0.0 0.4 0.0 1999-03Average CEECs 3.2 1.6 1.4 0.3 0.8 0.7a. Excluding private sources.Source: CEECs, National Program for Adopting the Acquis. The 2000 GDP was used to calculate financial needs forEU accession in terms of GDP.
I Although EU pre-accession funds are expected to be an important source for EU-related expenditures, 50-70percent of financing needs would be funded from domestic, mainly public, sources. The CEECs expect that EU pre-structural funds and Phare programs would cover about 20-25 percent of the costs, and 10-20 percent of financingwould come from other sources.
-2-
Expenditure Trends and Challenges
Taken at face value, these figures would imply that the CEECs are contemplating cuts intheir regular expenditure programs on the order of'5.5 percent of GDP on average, and eventwice as much in countries such as Bulgaria and the Slovak Republic. Of course, the figurespresented in table 1.2 may well have an upward bias.2 But even assuming that EU accessioncosts would be only half as high, the implied expenditure adjustment would still be quitesizable (at 4.2 percent of GDP, on average).
RECENT TRENDS IN GENERAL GOVERNMENT EXPENDrTURE
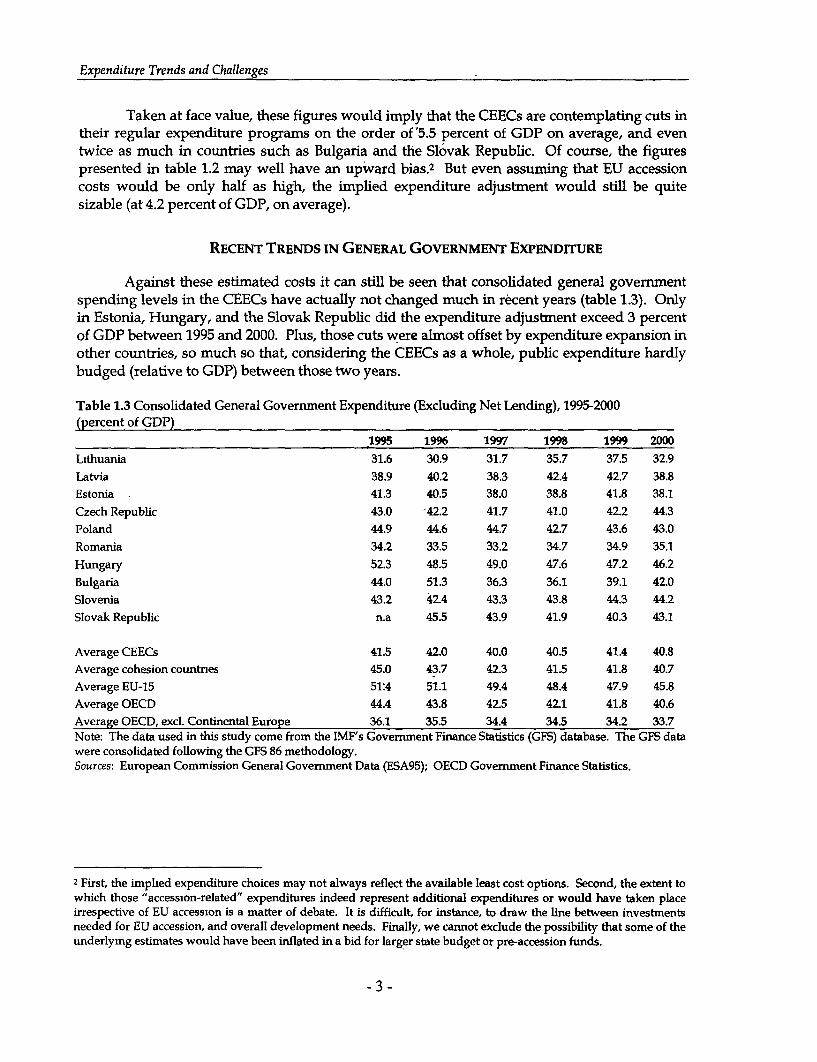
Against these estimated costs it can still be seen that consolidated general governmentspending levels in the CEECs have actually not changed much in recent years (table 1.3). Ordyin Estonia, Hungary, and the Slovak Republic did the expenditure adjustment exceed 3 percentof GDP between 1995 and 2000. Plus, those cuts were almost offset by expenditure expansion inother countries, so much so that, considering the CEECs as a whole, public expenditure hardlybudged (relative to GDP) between those two years.
Table 1.3 Consolidated General Govermnent Expenditure (Excluding Net Lending), 1995-2000(percent of GDP)
1995 1996 1997 1998 1999 2000Lithuania 31.6 30.9 31.7 35.7 37.5 32.9Latvia 38.9 40.2 38.3 42.4 42.7 38.8Estonia 41.3 40.5 38.0 38.8 41.8 38.1Czech Republic 43.0 -42.2 41.7 41.0 42.2 44.3Poland 44.9 44.6 44.7 42.7 43.6 43.0Romania 34.2 33.5 33.2 34.7 34.9 35.1Hungary 52.3 48.5 49.0 47.6 47.2 46.2Bulgaria 44.0 51.3 36.3 36.1 39.1 42.0Slovenia 43.2 42.4 43.3 43.8 44.3 44.2Slovak Republic n.a 45.5 43.9 41.9 40.3 43.1
Average CEECs 41.5 42.0 40.0 40.5 41.4 40.8Average cohesion countrnes 45.0 43.7 42.3 41.5 41.8 40.7Average EU-15 51.4 51.1 49.4 48.4 47.9 45.8Average OECD 44.4 43.8 42.5 42.1 41.8 40.6Average OECD, excl. Continental Europe 36.1 35.5 34.4 34.5 34.2 33.7Note: The data used in this study come from the IMF's Government Finance Statistics (GFS) database. The GFS datawere consolidated following the GFS 86 methodology.Sources: European Commission General Government Data (ESA95); OECD Government Finance Statistics.
2 First, the implhed expenditure choices may not always reflect the available least cost options. Second, the extent towhich those "accession-related" expenditures indeed represent additional expenditures or would have taken placeirrespective of EU accession is a matter of debate. It is difficult, for instance, to draw the line between investmentsneeded for EU accession, and overall development needs. Finally, we cannot exdude the possibility that some of theunderlymg estimates would have been inflated in a bid for larger state budget or pre-accession funds.
- 3 -
Expenditure Policies Toward EU Accession
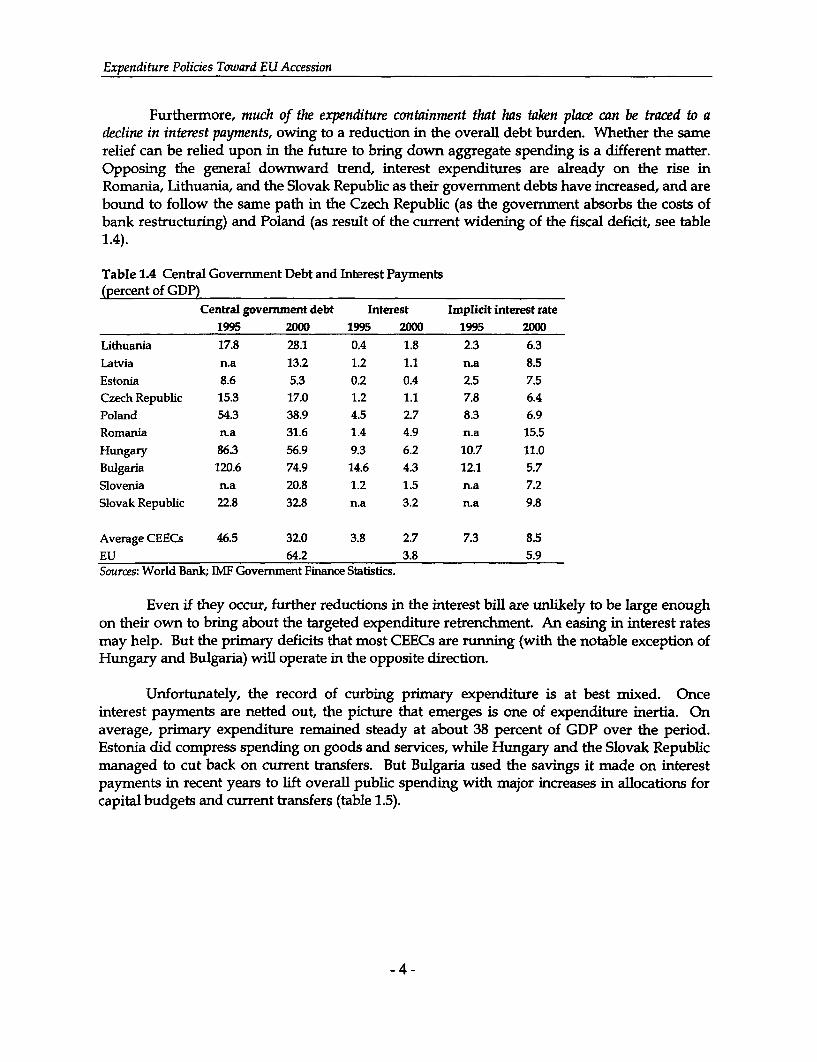
Furthermore, much of the expenditure containment that has taken place can be traced to adecline in interest payments, owing to a reduction in the overall debt burden. Whether the samerelief can be relied upon in the future to bring down aggregate spending is a different matter.Opposing the general downward trend, interest expenditures are already on the rise inRomania, Lithuania, and the Slovak Republic as their govermment debts have increased, and arebound to follow the same path in the Czech Republic (as the government absorbs the costs ofbank restructuring) and Poland (as result of the current widening of the fiscal deficit, see table1.4).
Table 1.4 Central Government Debt and Interest Payments(percent of GDP)
Central government debt Interest Implicit interest rate
1995 2000 1995 2000 1995 2000
Lithuania 17.8 28.1 0.4 1.8 2.3 6.3
Latvia n.a 13.2 1.2 1.1 n.a 8.5
Estonia 8.6 5.3 0.2 0.4 2.5 7.5
Czech Republic 15.3 17.0 1.2 1.1 7.8 6.4
Poland 54.3 38.9 4.5 2.7 8.3 6.9
Romania n.a 31.6 1.4 4.9 n.a 15.5
Hungary 86.3 56.9 9.3 6.2 10.7 11.0
Bulgaria 120.6 74.9 14.6 4.3 12.1 5.7
Slovenia n.a 20.8 1.2 1.5 n.a 7.2
Slovak Republic 22.8 32.8 n.a 3.2 n.a 9.8
Average CEECs 46.5 32.0 3.8 2.7 7.3 8.5
EU 64.2 3.8 5.9Sources: World Bank; IMF Government Finance Statistics.
Even if they occur, further reductions in the interest bill are unlikely to be large enoughon their own to bring about the targeted expenditure retrenchment. An easing in interest ratesmay help. But the primary deficits that most CEECs are running (with the notable exception ofHungary and Bulgaria) will operate in the opposite direction.
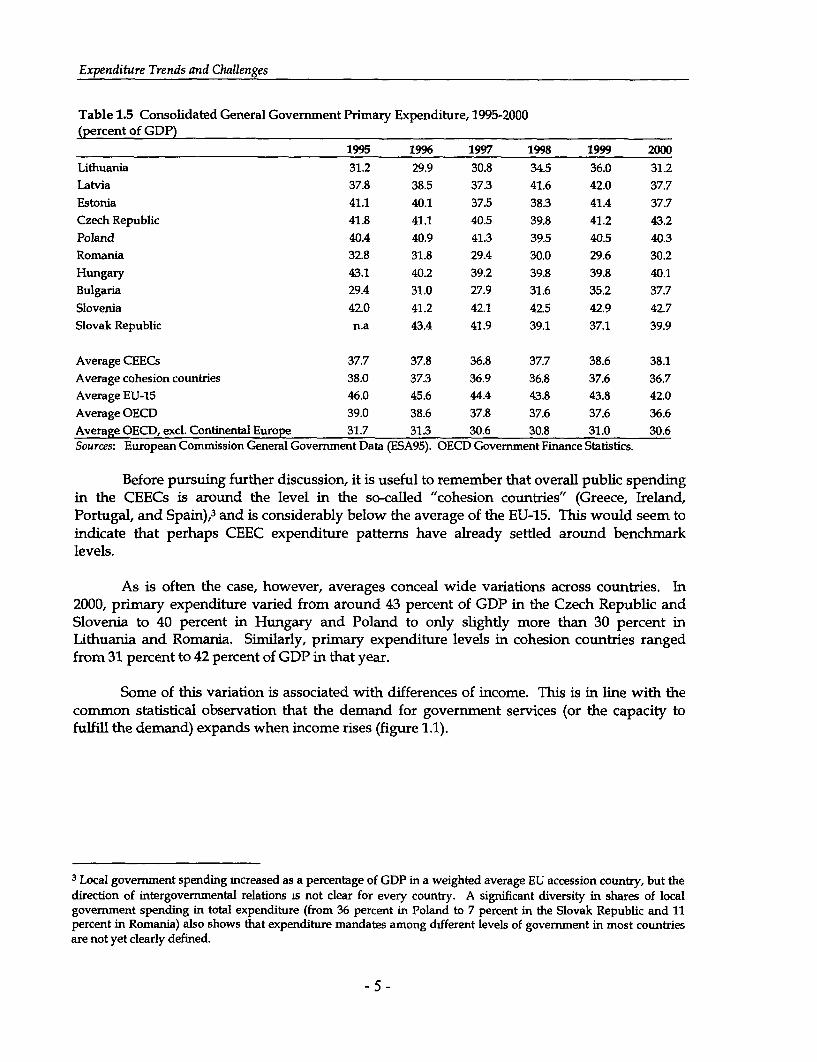
Unfortunately, the record of curbing primary expenditure is at best mixed. Onceinterest payments are netted out, the picture that emerges is one of expenditure inertia. Onaverage, primary expenditure remained steady at about 38 percent of GDP over the period.Estonia did compress spending on goods and services, while Hungary and the Slovak Republicmanaged to cut back on current transfers. But Bulgaria used the savings it made on interestpayments in recent years to lift overall public spending with major increases in allocations forcapital budgets and current transfers (table 1.5).
-4 -
Expenditure Trends and Challenges
Table 1.5 Consolidated General Government Primary Expenditure, 1995-2000(percent of GDP)
1995 1996 1997 1998 1999 2000Lithuania 31.2 29.9 30.8 34.5 36.0 31.2Latvia 37.8 38.5 37.3 41.6 42.0 37.7Estonia 41.1 40.1 37.5 38.3 41.4 37.7Czech Republic 41.8 41.1 40.5 39.8 41.2 43.2Poland 40.4 40.9 41.3 39.5 40.5 40.3Romania 32.8 31.8 29.4 30.0 29.6 30.2Hungary 43.1 40.2 39.2 39.8 39.8 40.1Bulgaria 29.4 31.0 27.9 31.6 35.2 37.7Slovenia 42.0 41.2 42.1 425 42.9 42.7Slovak Republic n.a 43.4 41.9 39.1 37.1 39.9
Average CEECs 37.7 37.8 36.8 37.7 38.6 38.1Average cohesion countries 38.0 37.3 36.9 36.8 37.6 36.7Average EU-15 46.0 45.6 44.4 43.8 43.8 42.0Average OECD 39.0 38.6 37.8 37.6 37.6 36.6Average OECD, excl. Continental Europe 31.7 31.3 30.6 30.8 31.0 30.6Sources: European Comnission General Govermment Data (ESA95). OECD Governmnent Finance Statistics.
Before pursuing further discussion, it is useful to remember that overall public spendingin the CEECs is around the level in the so-called "cohesion countries" (Greece, Ireland,Portugal, and Spain),3 and is considerably below the average of the EU-15. This would seem toindicate that perhaps CEEC expenditure patterns have already settled around benchmarklevels.
As is often the case, however, averages conceal wide variations across countries. In2000, primary expenditure varied from around 43 percent of GDP in the Czech Republic andSlovenia to 40 percent in Hungary and Poland to only slightly more than 30 percent inLithuania and Romania. Similarly, primary expenditure levels in cohesion countries rangedfrom 31 percent to 42 percent of GDP in that year.
Some of this variation is associated with differences of income. This is in line with thecommon statistical observation that the demand for government services (or the capacity tofulfill the demand) expands when income rises (figure 1.1).
3 Local government spending mncreased as a percentage of GDP in a weighted average EU accession country, but thedirection of intergovermnental relations is not clear for every country. A significant diversity in shares of localgovernment spending in total expenditure (from 36 percent in Poland to 7 percent in the Slovak Republic and 11percent in Romania) also shows that expenditure mandates among different levels of government in most countriesare not yet clearly defined.
5-

Expenditure Policies Toward EU Accession
Figure 1.1 General Government Expenditure and Income per Capita in the EU and the CEECs, 1999
65-
0 60 *Sweden0 Denmark
55 - Austria * France
w~~~~~~~~~~~~~~ *Germance50 -kl ~ Iir
_ ~~~~~~~~*HungaryGemn= 45 -Greece p% Netheriandi45-
aa Latvia * SlovenbIU * !Dceh Rep.*
40 - _ pain *United K6gdom
Bulgaria 4+omania Slovak RepC0 Lithuania teland
35- , , , , a,
0 5000 10000 15000 20000 25000 30000
GNI per capita at PPP
Source: World Bank.
As Figure 1.1 shows, however, there is considerable variation around that trend line.Countries with similar levels of income per capita sometimes have very different levels ofgovernment expenditure relative to their GDP: the Czech Republic (42 percent of GDP) andHungary (47 percent of GDP), for instance, or Italy (49 percent of GDP) and the UnitedKingdom (40 percent of GDP).
A statistical observation is not the same thing as a policy rule. When designing theirfiscal strategies, the CEECs may have noted that the normal relationship between income andgovernment size is actually inverted in the case of the cohesion countries and that the country inwhich government is the smallest-Ireland-is also the one in which income per capita hasrisen most rapidly since the mid-1980s.
Indeed, the general trend of government expenditure across the Organization forEconomic Cooperation and Development (OECD) has been downward (figure 1.2). The trendhas been most pronounced within the EU (where general government outlays shrank by 5percentage points of GDP between 1995 and 2000). The relative decline was perhaps lessoutside of continental Europe, but the starting point was also considerably lower, bringing intoeven sharper contrast the relative performance of the CEECs. By 2000 general governmentoutlays in the CEECs exceeded the levels observed among non-continental European membersof the OECD by a full six percentage points of GDP.
-6-

Expenditure Trends and Challenges
Figure 1.2 Consolidated General Government Outlays in the CEECs and the OECD, 1995-2000(percent of GDP)
50.0
45.0 = = = = = =
40.0-
35.0-
30.0 -1995 1996 1997 1998 1999 2000
CEEC EU - -OECD - OECD non-continental Europe
Note: OECD non-continental Europe comprises of Australia, Canada, Iceland, Ireland,Japan, Korea, New Zealand, United Kingdom and United States.Source: OECD.
DIFFERENCES IN EXPENDrrURE COMPOSITION
An even greater variation can be observed when government expenditure is brokendown into economic and functional categories (tables 1.6 and 1.7), confirming the view that farfrom being preordained, expenditure levels and the mix of expenditures are subject to a fairdegree of policy discretion. For any particular item of the Government Finance Statistics (GFS)classification, the levels of expenditures (relative to GDP)4 vary by at least a factor of two.5
Current expenditures, for instance, differ by as much as 12 percent of GDP between the top andthe bottom ends of the range (table 1.6).
The case of defense expenditure is particularly telling (table 1.7). All concernedcountries are either preparing for integration into NATO and/or have recently joined it. Still,despite this similarity of circumstances, defense spending varied in the range of 0.8 percent ofGDP in Latvia and 3 percent of GDP in Bulgaria in 2000 (this compares with an EU average of 2percent of GDP).
4 Average over the period 1995-2000.5 Except for expenditures on general public services and on public order, which vary only by a factor of 1.5 and 1.8,respectively.
-7 -

Table 1.6 Consolidated General Government Expenditure (Excluding Net Lending) by Economic Type, 1995-2000(percent of GDP)
Other SubsidiesExpenditure Wages purchases of and other
Total Current on goods and goods and current Capital Capitalexpenditure expenditure and services salaries services Interest transfers Expenditure Investment transfer
Lithuania 33.4 29.8 17.7 7.8 10.0 1.1 10.9 3.6 3.0 0.6Latvia 40.2 37.0 16.8 7.7 9.0 1.1 19.1 3.3 1.6 1.7Estonia 39.8 35.5 20.1 5.4 10.8 0.4 14.9 4.3 4.1 0.2Czech Republic 42.4 36.5 19.3 7.7 11.6 1.1 16.1 5.9 3.9 2.0Poland 43.9 40.7 15.8 7.4 8.4 3.4 21.5 3.2 2.8 0.4Romania 34.3 30.1 11.8 5.5 6.3 3.4 14.7 4.1 2.5 1.6Hungary 48.5 42.6 15.1 7.6 7.5 8.1 19.4 5.9 4.1 1.8Bulgaria 41.5 38.1 15.3 4.9 7.5 9.3 13.5 3.3 3.0 0.3Slovenia 43.5 39.0 17.9 9.4 8.5 1.3 19.8 4.5 2.7 1.8Slovak Republic 42.9 37.3 16.6 9.6 7.0 2.6 18.0 5.6 4.0 2.2
Average CEECs 41.0 36.7 16.6 7.3 8.7 3.2 16.8 4.4 3.2 1.4Average Cohesion countries 42.5 37.3 16.7 11.3 5.4 5.3 13.7 5.2 3.4 1.8Average EU-15 49.0 45.0 20.3 10.7 9.6 4.7 18.3 4.0 2.3 1.7Average OECD 42.3 40.0 18.5 10.8 7.8 4.7 16.8 3.2 3.2 0.0Av. OECD, excl. Cont Europe 34.7 32.6 16.9 9.6 7.3 3.8 11.6 3.4 3.2 0.2Sources: IMF Government Finance Statistics; European Commission General Govermnent Data (ESA95). OECD Government Finance Statistics.
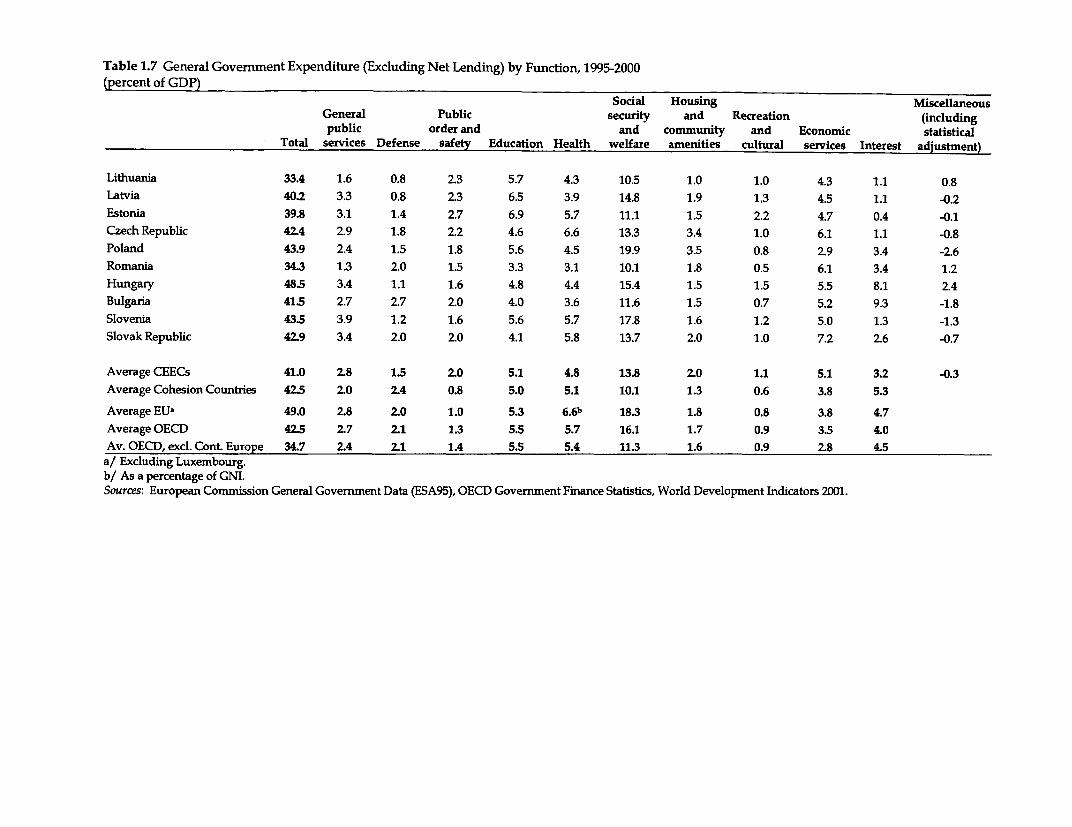
Table 1.7 General Govermnent Expenditure (Excluding Net Lending) by Function, 1995-2000(percent of GDP)
Social Housing MiscellaneousGeneral Public security and Recreation (includingpublic order and and community and Economic statistical
Total services Defense safety Education Health welfare amenities cultural services Interest adjustment)
Lithuania 33.4 1.6 0.8 2.3 5.7 4.3 10.5 1.0 1.0 4.3 1.1 0.8Latvia 40.2 3.3 0.8 2.3 6.5 3.9 14.8 1.9 1.3 4.5 1.1 -0.2Estonia 39.8 3.1 1.4 2.7 6.9 5.7 11.1 1.5 2.2 4.7 0.4 -0.1Czech Republic 42.4 2.9 1.8 2.2 4.6 6.6 13.3 3.4 1.0 6.1 1.1 -0.8
Poland 43.9 2.4 1.5 1.8 5.6 4.5 19.9 3.5 0.8 2.9 3.4 -2.6Romania 34.3 1.3 2.0 1.5 3.3 3.1 10.1 1.8 0.5 6.1 3.4 1.2Hungary 48.5 3.4 1.1 1.6 4.8 4.4 15.4 1.5 1.5 5.5 8.1 2.4Bulgaria 41.5 2.7 2.7 2.0 4.0 3.6 11.6 1.5 0.7 5.2 9.3 -1.8
Slovenia 43.5 3.9 1.2 1.6 5.6 5.7 17.8 1.6 1.2 5.0 1.3 -1.3Slovak Republic 42.9 3.4 2.0 2.0 4.1 5.8 13.7 2.0 1.0 7.2 2.6 -0.7
Average CEECs 41.0 2.8 1.5 2.0 5.1 4.8 13.8 2.0 1.1 5.1 3.2 -0.3Average Cohesion Countries 42.5 2.0 2.4 0.8 5.0 5.1 10.1 1.3 0.6 3.8 5.3
Average EUa 49.0 2.8 2.0 1.0 5.3 6.6b 18.3 1.8 0.8 3.8 4.7
Average OECD 42.5 2.7 2.1 1.3 5.5 5.7 16.1 1.7 0.9 3.5 4.0Av. OECD, excl. Cont. Europe 34.7 2.4 2.1 1.4 5.5 5.4 11.3 1.6 0.9 2.8 4.5a/ Excluding Luxembourg.b/ As a percentage of GNI.Sources: European Commission General Government Data (ESA95), OECD Goverrument Finance Statistics, World Development Indicators 2001.

Expenditure Policies towards EU Accession
A closer inspection of these expenditure categories reveals a number of interesting, andsometimes counterintuitive observations, including the following:
* The CEECs spend less than member countries on wages and salaries; their socialsectors, however, are often overstaffed.
* The CEECs are already catching up with (and sometimes exceeding) the highlevels of public investment observed among cohesion countries, raising concernsabout the quality of the project pipeline and the possible displacement ofoperations and maintenance expenditure.
* The CEECs are devoting the larger share of their public resources to fundingtransfers and subsidies. Early reformers are beginning to see the benefits of theirefforts to reduce this kind of spending, but pressures are mounting for the laterreformers.
* The CEECs have, in some cases, not yet managed to rein in state aid (broadlyspeaking), in part because of the ongoing cost of bank restructuring.
Wages and Salaries
The CEEC governments do not appear to spend excessively on wages and salaries. The figuresvary considerably from country to country, but CEECs typically spend less on wages andsalaries than cohesion countries (or the EU in general), though a number of the candidatecountries have a larger number of government employees than the cohesion countries; none ofthe candidates matches the EU average in terms of government employment (table 1.8).
The social sectors, however, are generally overstaffed. Candidate countries typically maintainsmaller central and local bureaucracies than member countries but employ larger numbers ofeducation and health personnel than countries in the cohesion group (and the EU in general).Education systems in most CEECs have failed to adjust to the secular decline in their school agepopulation (table 1.9) and still have a long way to go to restructure their health systems.6 Thus,in 2000 education and health expenditures were relatively higher in a number of CEECs (theBaltics, Poland, and Slovenia; the Czech Republic, Estonia, the Slovak Republic, and Slovenia,respectively) than among cohesion countries. Other CEECs have merely managed to compresswage levels, sometimes to such an extent as to trigger the spread of "informal payments" forsocial services.
6 In a country such as the Slovak Republic the number of teachers expanded through the 1990s even as the school agepopulation contracted, and the numbers of doctors and nurses, though already comparatively higher than in theOECD, continued to rise.
- 10-
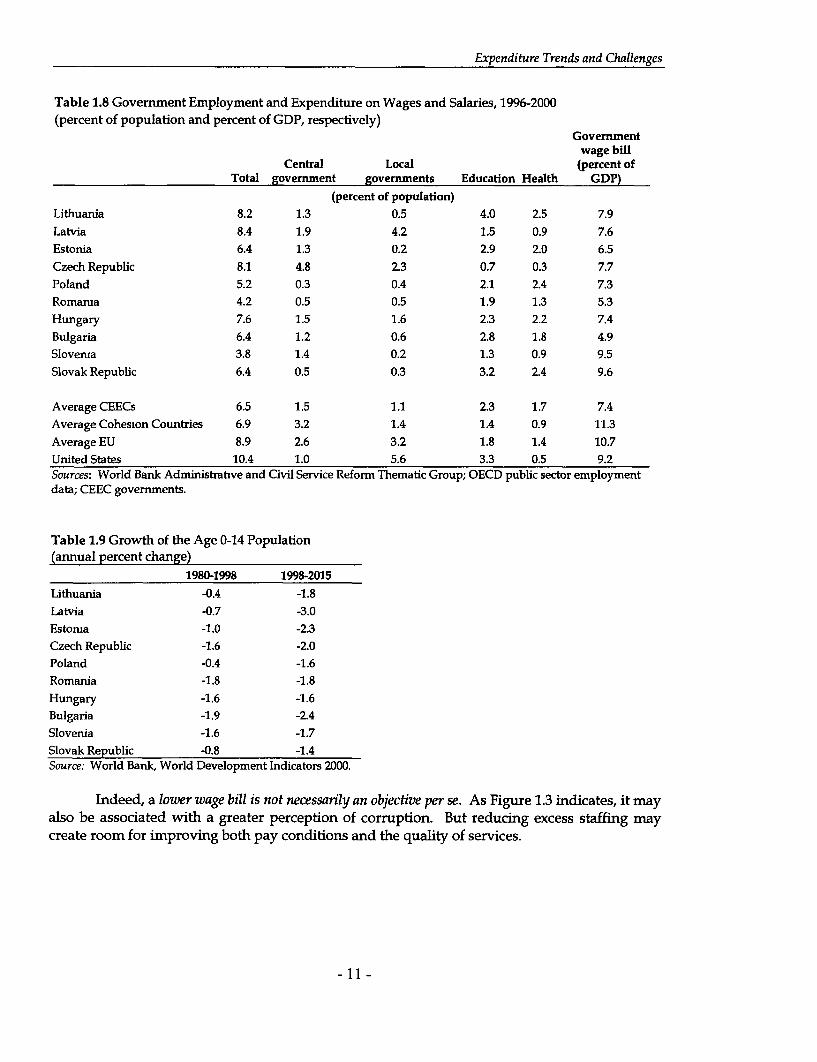
Expenditure Trends and Challenges
Table 1.8 Government Employment and Expenditure on Wages and Salaries, 1996-2000(percent of population and percent of GDP, respectively)
Governmentwage bill
Central Local (percent ofTotal government governments Education Health GDP)
(percent of population)Lithuania 8.2 1.3 0.5 4.0 2.5 7.9Latvia 8.4 1.9 4.2 1.5 0.9 7.6Estonia 6.4 1.3 0.2 2.9 2.0 6.5Czech Republic 8.1 4.8 2.3 0.7 0.3 7.7Poland 5.2 0.3 0.4 2.1 2.4 7.3Romanua 4.2 0.5 0.5 1.9 1.3 5.3Hungary 7.6 1.5 1.6 2.3 2.2 7.4Bulgaria 6.4 1.2 0.6 2.8 1.8 4.9Sloverua 3.8 1.4 0.2 1.3 0.9 9.5Slovak Republic 6.4 0.5 0.3 3.2 2.4 9.6
Average CEECs 6.5 1.5 1.1 2.3 1.7 7.4Average Cohesion Countries 6.9 3.2 1.4 1.4 0.9 11.3Average EU 8.9 2.6 3.2 1.8 1.4 10.7United States 10.4 1.0 5.6 3.3 0.5 9.2Sources: World Bank Administrative and Civil Service Reform Thematic Group; OECD public sector employmentdata; CEEC governments.
Table 1.9 Growth of the Age 0-14 Population(annual percent change)
1980-1998 1998-2015Lithuania -0.4 -1.8Latvia -0.7 -3.0Estonua -1.0 -2.3Czech Republic -1.6 -2.0Poland -0.4 -1.6Romania -1.8 -1.8Hungary -1.6 -1.6Bulgaria -1.9 -2.4Slovenia -1.6 -1.7Slovak Republic -0.8 -1.4Source: World Bank, World Development Indicators 2000.
Indeed, a lower wage bill is not necessarily an objective per se. As Figure 1.3 indicates, it mayalso be associated with a greater perception of corruption. But reducing excess staffing maycreate room for improving both pay conditions and the quality of services.
- 11 -

Expenditure Policies Toward EU Accession
Figure 1.3 Govermnent Wage Bill and Perception of Corruption
2.0-
3.0-
o 4.0-
0.
06.70-
07.0
0
LI 8.0
9.0
10.02 2.5 3 3.5 4 4.5 5 5.5 6
Wage Bill
Note: Corruption Index indicates perception of corruption where I is greatestperception of corruption and 1o is least perception of corruption. Consolidated GeneralGovernment Wage Bill as percentage of GDP.Sources: IMF Government Finance Statistics; Transparency International.
Public Investnent
Taken as a group, the CEECs do not appear to be affected by any underinvestment inpublic infrastructure. At over 4 percent of GDP on average, the level of capital expenditure in theCEEC is close to that in the EU as well as to the levels recorded in the cohesion countries in the early1990s. Poland, Lithuania, and Romania might be on the low side (at 2.5-3 percent of GDP). Butby 2000, countries such as the Czech and Slovak Republics (about 6 percent of GDP) andHungary (about 7 percent of GDP) were spending relatively more on capital expenditure thanthe levels of any of the cohesion countries, even though the cohesion countries had the supportof the EU structural funds, and Bulgaria and Slovenia had caught up with the lower end of thecohesion country range (Spain's 4.6 percent of GDP). Clearly, for these countries the keyquestion was becoming not how much but how good that capital expenditure was.
Operations and Maintenance
A related concern is that the same countries that are spending more on capital expenditure arealso devoting comparatively less to operations and maintenance (witness, for instance, the 5 percent ofGDP spent on operations and management (O&M) in the Czech and Slovak Republics), whichraises questions of whether their overall expenditure mix is appropriate.
Nevertheless, it remains the case that the average spending on O&M in the EU accessiongroup is high when compared with the levels observed within the cohesion group.Unfortunately, this should not necessarily be interpreted as a sign that public services are betterrun. Higher spending may also reflect an inefficient consumption of inputs (for example,energy consumption in low energy-efficiency facilities) or higher unit prices resulting from
- 12 -
Expenditure Trends and Challenges
insufficiently competitive public procurement. These different factors unfortunately cannot beseparated on the basis of aggregate data.
Subsidies and Transfers
Overall subsidies and transfers continue to account for the lion's share of governmentexpenditure in the CEECs. The peaks are reached in the Czech and Slovak Republics where theyabsorbed 60 and 66 percent of primary expenditure in 2000, respectively. Only in Lithuania wasthat ratio less than 40 percent. Taken as a whole, candidates spend about the same percentageof GDP on subsidies transfers as the member countries, although they spend substantially more(an average of nearly five percent of GDP) than the cohesion countries.
Averages are, however, somewhat misleading. Take, for instance, welfare payments. In1995 the CEECs were essentially polarized in two groups, with a group of high spenders(Hungary, Poland, and Slovenia) on the one hand devoting 18-20 percent to social welfare, andthe rest spending around 10 percent of GDP. By 2000, the picture had changed with two groupsof countries converging toward the middle of the range as high spenders (Hungary, Poland)were beginning to experience the benefits of pension reform while spending was driftingupward among some of the former low spenders (the Czech Republic, Bulgaria, and, to a lesserextent, Estonia and Lithuania). Only the Slovak Republic and Slovenia appeared to succeed inkeeping a lid over their social transfers.
The differences in social transfers, however, do not necessarily reflect the countries'living standards. Poland is saddled with a similarly high poverty rate despite spending almosttwice as much as Estonia on social security and welfare programs as a percent of GDP.Conversely, the Slovak Republic has two-and-a-half times the unemployment rate of Hungary,and spends two-thirds as much on social security and welfare, but has only half the poverty rateof Hungary.
In contrast to what was observed regarding welfare payments, governments appear tohave been unable to affect the levels of state aid.7 By 2000 current and capital subsidies to enterprisesstill exceeded the 1995 levels across the region, indicating the continued struggle to break with thepast. This is not for the lack of available options: These levels ranged all the way from 0.6percent of GDP in Lithuania to 7.3 percent of GDP in the Slovak Republic, the widest cross-country variation in any expenditure item.
7 Estimated as the difference between "Current Subsidies and Transfers" plus "Capital Transfers" (table 1.6) and"Social Security and Welfare" (table 1.7).
- 13 -

Expenditure Policies Toward EU Accession
Table 1.10 Poverty Incidence and Welfare Payments, 1995-2000Poverty incidence (percent of Expenditure on social security andpopulation at US$4.30/day) welfare (percent of GDP)
Lithuania 22.5 10.5Latvia 34.8 14.8Estonia 19.3 10.9Czech Republic 0.8 13.2Poland 18.4 19.8Romania 44.5 10.1Hungary 15.4 15.4Bulgaria 18.2 11.6Slovenia 0.7 17.8Slovak Republic 8.6 10.7
Average CEECs 18.3 13.5Sources: Poverty incidence (latest available date) from Revenga, A, et al. 2000. Making Transition WorkforEveryone. Washington, D.C.: World Bank; fiscal data: IMF Government Finance Statistics, except for Hungary andRomania, national data.
CONCLUSIONS
There is evidence that the scope exists to carry out the type of expenditure reformimplicit in the CEECs' PEPs. How to bring it about is a different matter. We now turn to thepractical experience of dealing with the three key expenditure challenges confronting thecandidates: (a) liquidating the legacy of transition, (b) facilitating the countries' successfulintegration into the EU, and (c) finding new ways to ensure social protection.
- 14-
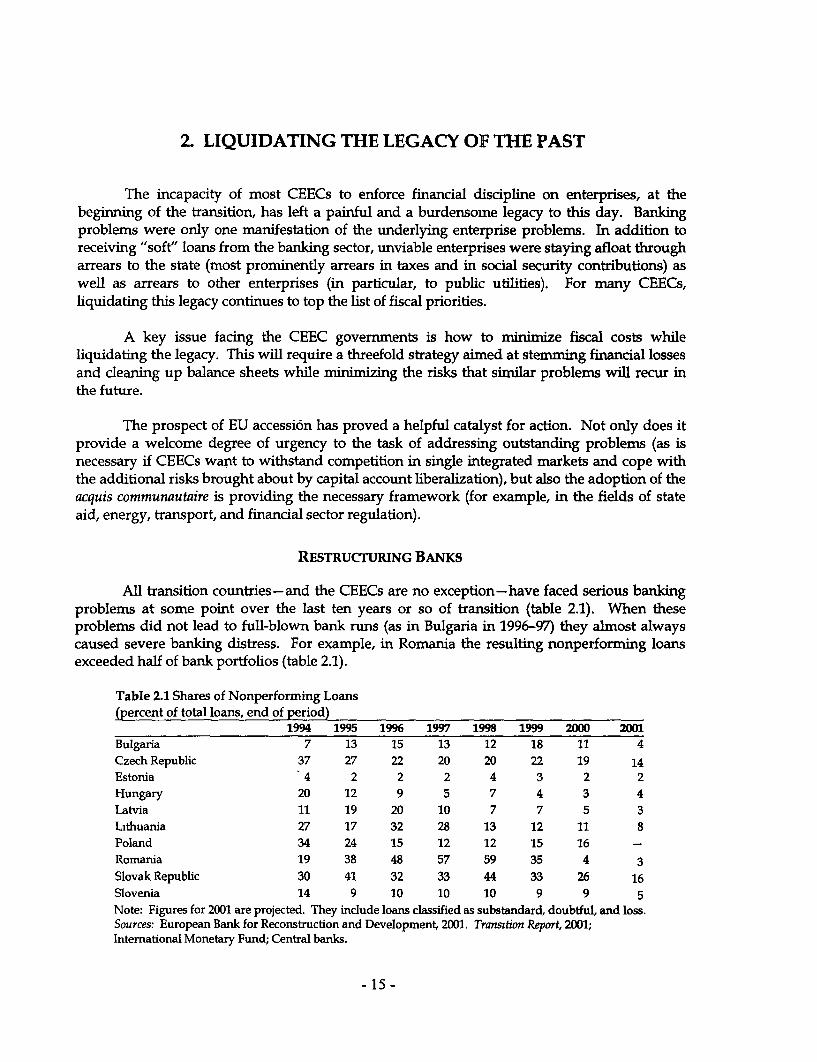
2. LIQUIDATING THE LEGACY OF THE PAST
The incapacity of most CEECs to enforce financial discipline on enterprises, at thebeginning of the transition, has left a painful and a burdensome legacy to this day. Bankingproblems were only one manifestation of the underlying enterprise problems. In addition toreceiving "soft" loans from the banking sector, unviable enterprises were staying afloat througharrears to the state (most prominently arrears in taxes and in social security contributions) aswell as arrears to other enterprises (in particular, to public utilities). For many CEECs,liquidating this legacy continues to top the list of fiscal priorities.
A key issue facing the CEEC governments is how to minimize fiscal costs whileliquidating the legacy. This will require a threefold strategy aimed at stemming financial lossesand cleaning up balance sheets while minimizing the risks that similar problems will recur inthe future.
The prospect of EU accession has proved a helpful catalyst for action. Not only does itprovide a welcome degree of urgency to the task of addressing outstanding problems (as isnecessary if CEECs want to withstand competition in single integrated markets and cope withthe additional risks brought about by capital account liberalization), but also the adoption of theacquis communautaire is providing the necessary framework (for example, in the fields of stateaid, energy, transport, and financial sector regulation).
RESTRUCTURING BANKS
All transition countries-and the CEECs are no exception-have faced serious bankingproblems at some point over the last ten years or so of transition (table 2.1). When theseproblems did not lead to full-blown bank runs (as in Bulgaria in 1996-97) they almost alwayscaused severe banking distress. For example, in Romania the resulting nonperforming loansexceeded half of bank portfolios (table 2.1).
Table 2.1 Shares of Nonperforniing Loans(percent of total loans, end of period)
1994 1995 1996 1997 1998 1999 2000 2001Bulgaria 7 13 15 13 12 18 11 4Czech Republic 37 27 22 20 20 22 19 14Estonia 4 2 2 2 4 3 2 2Hungary 20 12 9 5 7 4 3 4Latvia 11 19 20 10 7 7 5 3Lithuania 27 17 32 28 13 12 11 8Poland 34 24 15 12 12 15 16 -
Romania 19 38 48 57 59 35 4 3Slovak Republic 30 41 32 33 44 33 26 16Slovenia 14 9 10 10 10 9 9 5Note: Figures for 2001 are projected. They include loans classified as substandard, doubtful, and loss.Sources: European Bank for Reconstruction and Development, 2001. Transition Report, 2001;International Monetary Fund; Central banks.
- 15 -
Expenditure Policies Toward EU Accession
The CEECs have generally made progress in cleaning up bank balance sheets, as can beseen from the generally declining trends of nonperforming loans (table 2.1). While bad loanportfolios still appear large in the Czech Republic, the problem is less severe than it seemsbecause most of the related loans are either "ring-fenced" or fully provisioned.
Despite this, the problem has not disappeared. In many countries the numbers onlyappear smaller because nonperforming portfolios have been carved out and transferred to aspecialized debt recovery agency. For instance, bad loans in Czech Republic with a face valuein excess of 20 percent of GDP are now within the purview of Konsolidacni Agentura (includingloans ring-fenced in the balance sheet of commercial banks).8 How to dispose of them remains akey issue.
Before turning to this issue, it is necessary to take stock of how to bring about bankrestructuring. What follows are the broad lessons learned:
* The earlier the portfolio problems are openly recognized and dealt with, the betterthe outcome will be.
* Successful bank restructuring ultimately requires bank privatization, preferably tostrategic investors.
* Banks need to be fully recapitalized first9 for bank privatization to be successful.
Portfolio Restructuring
The experience of the CEECs shows that adequate recapitalization is important not onlyfor successful privatization but for successful bank restructuring in general. Otherwise, there isa high risk that the banking regulator will show excessive regulatory forbearance, or that thenew private owners will see no better option than to engage in the same type of recklessbehavior as their predecessors. Hungary provides an example in this regard. The first bankrestructuring program in 1992-93 did not adequately recapitalize the banks, and a secondround of recapitalization was necessary in 1993-94. Another example is Bulgaria, where the1991-94 operation to clean bank portfolios from bad credits did not provide adequatecapitalization so that banking problems worsened, culminating in a crisis in 1996-97. Similarly,in the Czech Republic the initial privatization of an unrestructured bank led to so severe afailure that the bank had to be taken over and re-privatized again (restructured, in this case).
Quite apart from the economic costs (in extreme cases financial intermediation can bedisrupted and economic growth undermined) banking problems are fiscally costly. Recentestimates indicate, for example, that the restructuring of Czech banks may cost as much as 10percent of GDP for the period 2001-04. One study that looked at banking crises in the transitioneconomies found that for the period 1991-98 the total fiscal costs of such crises for some CEECs
8 World Bank, 2001, Czech Republic: Enhancing the Prospectsfor Growth with Fiscal Stability. Washington, D.C.9 World Bank, 2001, World Development Report: Building Institutionsfor Markets. New York: Oxford University Press.
- 16-
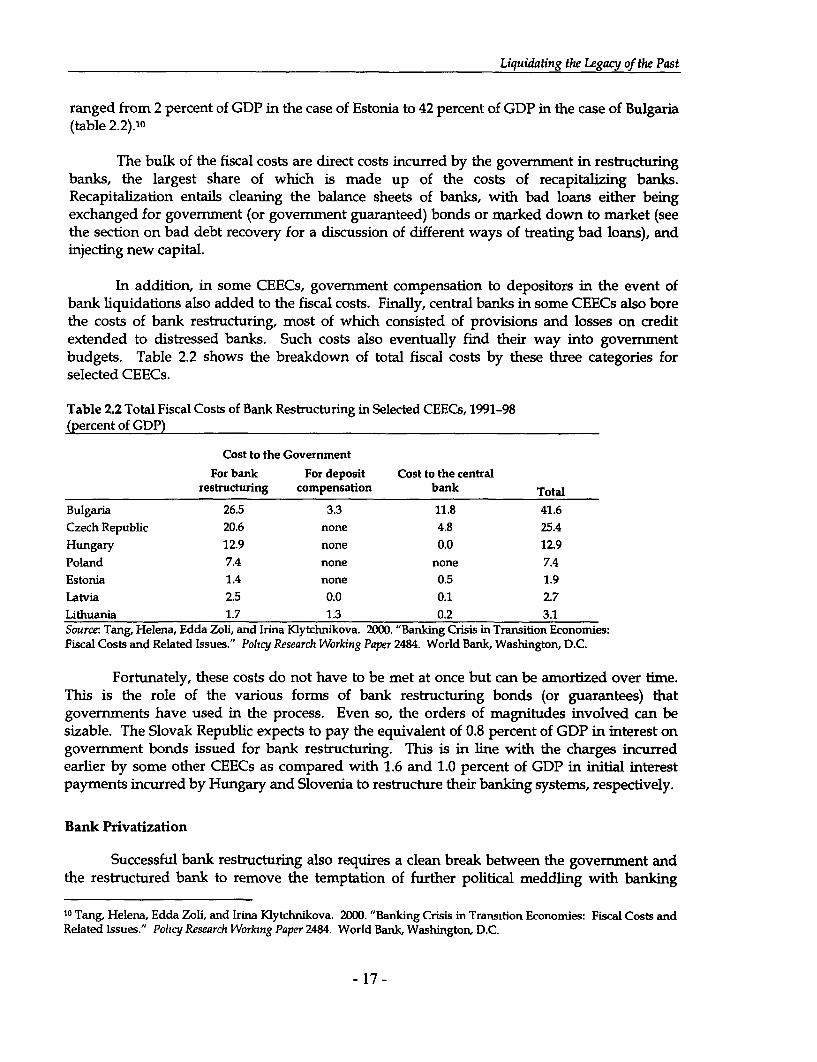
Liquidating the Legacy of the Past
ranged from 2 percent of GDP in the case of Estonia to 42 percent of GDP in the case of Bulgaria(table 2.2).10
The bulk of the fiscal costs are direct costs incurred by the government in restructuringbanks, the largest share of which is made up of the costs of recapitalizing banks.Recapitalization entails cleaning the balance sheets of banks, with bad loans either beingexchanged for government (or government guaranteed) bonds or marked down to market (seethe section on bad debt recovery for a discussion of different ways of treating bad loans), andinjecting new capital.
In addition, in some CEECs, government compensation to depositors in the event ofbank liquidations also added to the fiscal costs. Finally, central banks in some CEECs also borethe costs of bank restructuring, most of which consisted of provisions and losses on creditextended to distressed banks. Such costs also eventually find their way into governmentbudgets. Table 2.2 shows the breakdown of total fiscal costs by these three categories forselected CEECs.
Table 2.2 Total Fiscal Costs of Bank Restructuring in Selected CEECs, 1991-98(percent of GDP)
Cost to the Government
For bank For deposit Cost to the centralrestructuring compensation bank Total
Bulgaria 26.5 3.3 11.8 41.6Czech Republic 20.6 none 4.8 25.4Hungary 12.9 none 0.0 12.9Poland 7.4 none none 7.4Estonia 1.4 none 0.5 1.9Latvia 2.5 0.0 0.1 2.7Lithuania 1.7 1.3 0.2 3.1Source: Tang, Helena, Edda Zoli, and Irina Klytchnikova. 2000. "Banking Crisis in Transition Economies:Fiscal Costs and Related Issues." Policy Research Working Paper 2484. World Bank, Washington, D.C.
Fortunately, these costs do not have to be met at once but can be amortized over time.This is the role of the various forms of bank restructuring bonds (or guarantees) thatgovernments have used in the process. Even so, the orders of magnitudes involved can besizable. The Slovak Republic expects to pay the equivalent of 0.8 percent of GDP in interest ongovernment bonds issued for bank restructuring. This is in line with the charges incurredearlier by some other CEECs as compared with 1.6 and 1.0 percent of GDP in initial interestpayments incurred by Hungary and Slovenia to restructure their banking systems, respectively.
Bank Privatization
Successful bank restructuring also requires a clean break between the government andthe restructured bank to remove the temptation of further political meddling with banking
10 Tang, Helena, Edda Zoli, and Irina Klytchnikova. 2000. "Banking Crisis in Transition Economies: Fiscal Costs andRelated Issues." Policy Research Working Paper 2484. World Bank, Washington, D.C.
- 17-
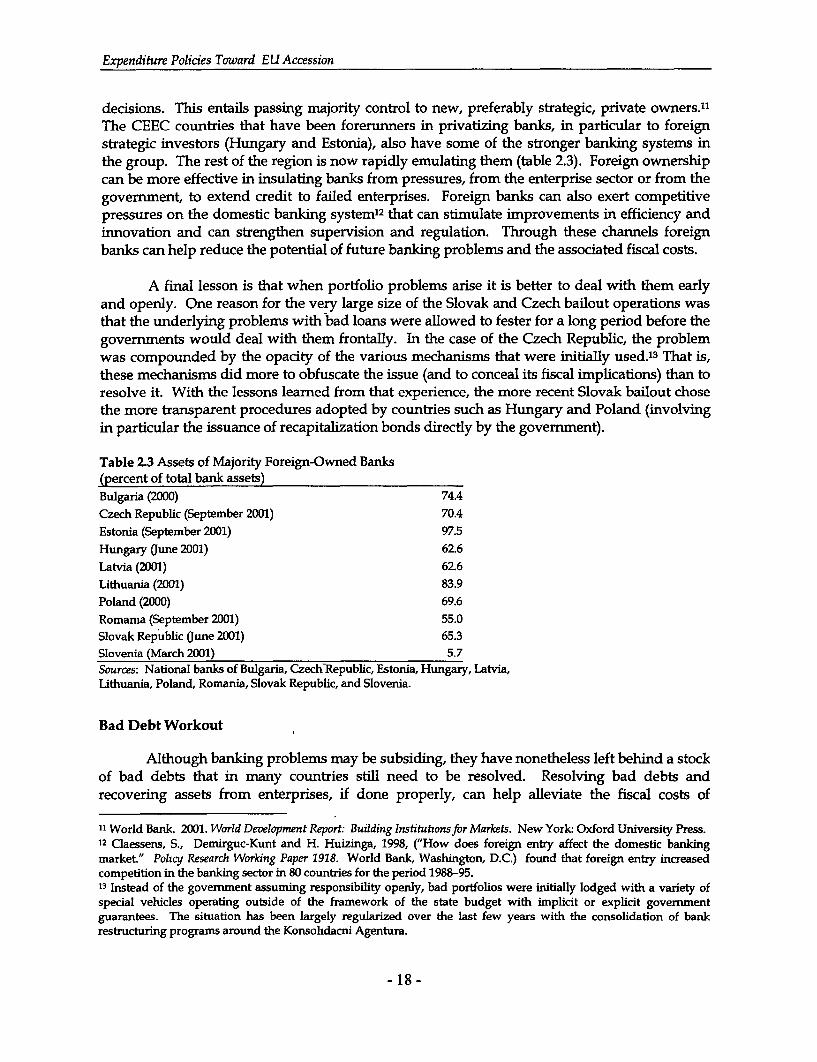
Expenditure Policies Toward EU Accession
decisions. This entails passing majority control to new, preferably strategic, private owners."The CEEC countries that have been forerunners in privatizing banks, in particular to foreignstrategic investors (Hungary and Estonia), also have some of the stronger banking systems inthe group. The rest of the region is now rapidly emulating them (table 2.3). Foreign ownershipcan be more effective in insulating banks from pressures, from the enterprise sector or from thegovernment, to extend credit to failed enterprises. Foreign banks can also exert competitivepressures on the domestic banking system12 that can stimulate improvements in efficiency andinnovation and can strengthen supervision and regulation. Through these channels foreignbanks can help reduce the potential of future banking problems and the associated fiscal costs.
A final lesson is that when portfolio problems arise it is better to deal with them earlyand openly. One reason for the very large size of the Slovak and Czech bailout operations wasthat the underlying problems with bad loans were allowed to fester for a long period before thegovernments would deal with them frontally. In the case of the Czech Republic, the problemwas compounded by the opacity of the various mechanisms that were initially used.' 3 That is,these mechanisms did more to obfuscate the issue (and to conceal its fiscal implications) than toresolve it. With the lessons learned from that experience, the more recent Slovak bailout chosethe more transparent procedures adopted by countries such as Hungary and Poland (involvingin particular the issuance of recapitalization bonds directly by the government).
Table 2.3 Assets of Majority Foreign-Owned Banks(percent of total bank assets)Bulgaria (2000) 74.4Czech Republic (September 2001) 70.4Estonia (September 2001) 97.5Hungary (une 2001) 62.6Latvia (2001) 62.6Lithuania (2001) 83.9Poland (2000) 69.6Romanma (September 2001) 55.0Slovak Republic (une 2001) 65.3Slovenia (March 2001) 5.7Sources: National banks of Bulgaria, CzechlRepublic, Estonia, Hungary, Latvia,Lithuania, Poland, Romania, Slovak Republic, and Slovenia.
Bad Debt Workout
Although banking problems may be subsiding, they have nonetheless left behind a stockof bad debts that in many countries still need to be resolved. Resolving bad debts andrecovering assets from enterprises, if done properly, can help alleviate the fiscal costs of
11 World Bank. 2001. World Development Report: Building Institutionsfor Markets. New York: Oxford University Press.12 Claessens, S., Demirguc-Kunt and H. Huizinga, 1998, ("How does foreign entry affect the domestic bankingmarket." Poltcy Research Working Paper 1918. World Bank, Washington, D.C.) found that foreign entry increasedcompetition in the banking sector in 80 countries for the period 1988-95.13 Instead of the government assuming responsibility openly, bad portfolios were initially lodged with a variety ofspecial vehicles operating outside of the framework of the state budget with implicit or explicit governmentguarantees. The situation has been largely regularized over the last few years with the consolidation of bankrestructuring programs around the Konsolidacni Agentura.
- 18-
Liquidating the Legacy of the Past
banking problems and can also spur enterprise restructuring and reduce moral hazard.Therefore, the likelihood of future problems in these sectors, problems that could lead to greaterfiscal costs down the road, can be reduced.
Two main approaches have been tried in the region to collect bad debt. The firstapproach, the so-called "centralized" approach, involves removing nonperforming loans frombanks and transferring them to an asset management company (AMC) or a bank liquidationagency, which then pursues the recovery of the bad loans. In most countries AMCs are stateowned for two main reasons. First, it can be difficult to find private investors interested inassuming large amounts of bad assets without government guarantees. Second, from thegovernment's perspective it can be preferable to own such assets rather than to provideguarantees, since the government can benefit from any upward price movements of suchassets.' 4 The second approach, the so-called "decentralized" approach, entails leavingnonperforming loans on the banks' books and creating workout units within the banks topursue the recovery of these loans.
Both approaches have their advantages and disadvantages.' 5 A study covering theCEECs found no clear superiority of one approach over the other in terms of recovery of baddebt.16 Countries that adopted the centralized approach and created AMCs had recovery rates(loans recovered/total face value of bad loans) of 3-5 percent in the Czech Republic, 5 percentin Lithuania, and 16 percent in Hungary. Poland was the only country among those studiedthat had some success with the decentralized approach, with a bad loan recovery rate of 17percent.
There is as yet no cross-country evidence on the efficacy of the centralized versus thedecentralized approach with respect to enterprise restructuring. A recent study that studiesseven AMCs around the world found that AMCs have not been effective in spurring enterpriserestructuring but have been more effective in resolving insolvent and unviable financialinstitutions and selling their assets. However, even achieving the latter objective requirescertain conditions such as "an easily liquefiable asset (like real estate), professionalmanagement, political independence, a skilled resource base, appropriate funding, adequatebankruptcy and foreclosure laws, good information and management systems, andtransparency in operations and processes."'7
In these circumstances, an eclectic, multi-track approach may actually have the bestresults. In the CEECs, Hungary has successfully addressed its workout problems with a mnixedprivate sector/state strategy involving both centralized and decentralized approaches.' 8 Thisstrategy calls for the use of a centralized state workout institution to manage some large and
14 Klingebiel, Daniela. 2000. "The Use of Asset Management Companies in the Resolution of Banking Crisis: CrossCountry Experiences." Policy Research Working Paper 2284. World Bank, Washington, D.C..15 Klingebiel, Daniela. 2000. "The Use of Asset Management Companies in the Resolution of Banking Crisis: CrossCountry Expenences." Policy Research Working Paper 2284. World Bank, Washington, D.C..16 Tang, Helena, Edda Zolh, and Irma Klytchnikova. 2000. "Banking Crisis in Transition Economies: Fiscal Costs andRelated Issues." Policy Research Workhing Paper 2484. World Bank, Washington, D.C.17 Klingebiel, Daniela. 2000. "The Use of Asset Management Companies in the Resolution of Banking Crisis: CrossCountry Experiences." Policy Research Working Paper 2284. World Bank, Washington, D.C.18 World Bank. 2000. Czech Republic: Completing the Transformation of Banks and Enterprises. New York: OxfordUniversity Press.
- 19 -
Expenditure Policies Toward EU Accession
complex cases (generally heavy industrial enterprises), and for the same institution to manageadditional assets through contracts with private sector asset managers.
In addition, the strategy entails having banks work out a certain proportion of badassets, and having additional assets sold to the private sector on an individual asset or poolbasis. The Slovak Republic has recently pursued a similar multi-track approach involving thesale of pools of loans to private investors, the auctioning of individual loans to smnallerinvestors, the outsourcing of collection through asset/legal management contracts, and, whereappropriate after suitable due diligence, the writing off of noncollectible claims.
Certain key elements are necessary for successful workouts if an AMC is used. First, fora state-owned AMC it is important that there is a predetermined time limit for its operations.Otherwise, there is a disincentive for an AMC to be successful in collecting bad debt, becausethat would bring the AMC closer to its date of dissolution. For this reason, a limited life spanwas introduced for the state-owned bad debt recovery agency in the Czech Republic, the formerKonsolidacni Banka (KoB) (recently renamed Konsolidacni Agentura), during its recentrestructuring. A self-perpetuating AMC also creates a moral hazard for continuing bankingproblems, because it provides banks with a dumping ground for future bad loans.
Second, the AMC should be given a clear and limited mandate. The Czech case againprovides a good example. In addition to being a debt recovery agency, KoB was also initiallysupposed to serve as a development bank, and a vehicle through which the government couldpursue industrial ventures. KoB was also allowed commercial banking and deposit-takingfunctions, but its high share of bad assets created a tremendous moral hazard for theundertaking of risky activities. For these reasons the recent restructuring of KoB entailed thespinning off of its development banking activities and associated staff, as well as the removal ofits banking license.
Enhancing the Institutional Framework of Banking Operations
Finally, no matter which approach is adopted, strong creditor rights induding effectiveinsolvency (that is, bankruptcy) and collateral systems are important for successful work outs,in terms of recoveries under bankruptcy and also in terms of enhancing the incentives fordebtors to negotiate out of court to avoid bankruptcy. However, building an effectivebankruptcy system is taking time in many of the CEECs. Thus, the Slovak Republic is focusingfirst on improving the liquidation mechanisms under the bankruptcy system to speed up theresolution of unviable enterprises and to promote out-of-court restructurings (the latter becauseof a more credible bankruptcy threat). The Slovak Republic is also working on improving theefficiency of court-led restructuring mechanisms, a more long-term endeavor.19 For similarreasons the Czedc Republic is focusing its attention on improving liquidation procedures andintroducing a fast restructuring or reorganization track. 2 0
19 Drawn from World Bank 2001. "Report and Recommendation of the President on an Enterprise and FinancialSector Adjustment Loan to the Slovak Republic." Report Washington, D.C..20 For details, see World Bank. 2000. Czech Republic: Completng the Transformation of Banks and Enterprises. New York:Oxford Umversity Press.. A key feature of the fast track procedure is that the opinion of the majority of creditors canbe implemented over the objections of the minority class of creditors. This fast track is still subject to approval by thecourt, and in lhght of the low average development of the judiciary, will initially be restrictive (access to the track will
- 20 -
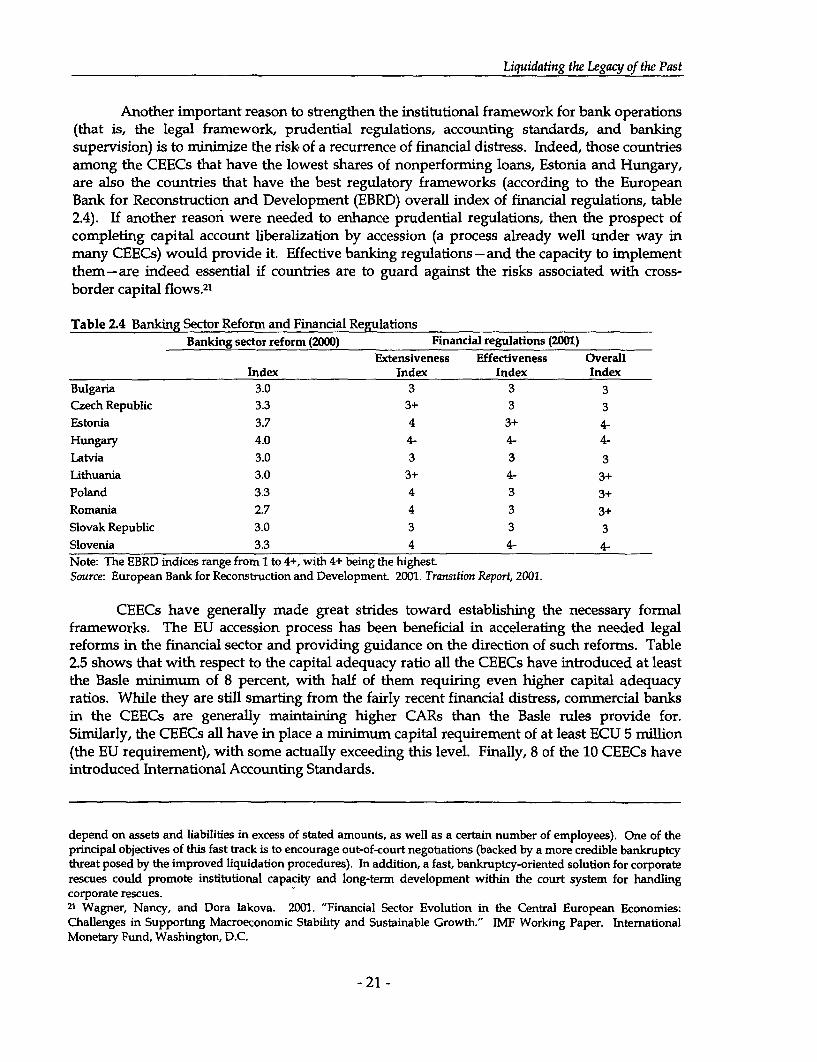
Liquidating the Legacy of the Past
Another important reason to strengthen the institutional framework for bank operations(that is, the legal framework, prudential regulations, accounting standards, and bankingsupervision) is to minimize the risk of a recurrence of financial distress. Indeed, those countriesamong the CEECs that have the lowest shares of nonperforming loans, Estonia and Hungary,are also the countries that have the best regulatory frameworks (according to the EuropeanBank for Reconstruction and Development (EBRD) overall index of financial regulations, table2.4). If another reason were needed to enhance prudential regulations, then the prospect ofcompleting capital account liberalization by accession (a process already well under way inmany CEECs) would provide it. Effective banking regulations -and the capacity to implementthem-are indeed essential if countries are to guard against the risks associated with cross-border capital flows.2 '
Table 2.4 Banking Sector Reform and Financial RegulationsBanking sector reform (2000) Financial regulations (2001)
Extensiveness Effectiveness OverallIndex Index Index Index
Bulgaria 3.0 3 3 3Czech Republic 3.3 3+ 3 3Estonia 3.7 4 3+ 4-Hungary 4.0 4- 4- 4-Latvia 3.0 3 3 3Lithuania 3.0 3+ 4- 3+Poland 3.3 4 3 3+Romania 2.7 4 3 3+Slovak Republic 3.0 3 3 3Slovenia 3.3 4 4- 4.Note: The EBRD indices range from 1 to 4+, with 4+ being the highest.Source: European Bank for Reconstruction and Development. 2001. Transttion Report, 2001.
CEECs have generally made great strides toward establishing the necessary formalframeworks. The EU accession process has been beneficial in accelerating the needed legalreforms in the financial sector and providing guidance on the direction of such reforms. Table2.5 shows that with respect to the capital adequacy ratio all the CEECs have introduced at leastthe Basle minimum of 8 percent, with half of them requiring even higher capital adequacyratios. While they are still smarting from the fairly recent financial distress, commercial banksin the CEECs are generally maintaining higher CARs than the Basle rules provide for.Similarly, the CEECs all have in place a minimum capital requirement of at least ECU 5 million(the EU requirement), with some actually exceeding this level. Finally, 8 of the 10 CEECs haveintroduced International Accounting Standards.
depend on assets and liabilities in excess of stated amounts, as well as a certain number of employees). One of theprincipal objectives of this fast track is to encourage out-of-court negotiations (backed by a more credible bankruptcythreat posed by the improved liquidation procedures). In addition, a fast, bankruptcy-oriented solution for corporaterescues could promote institutional capacity and long-term development within the court system for handlingcorporate rescues.21 Wagner, Nancy, and Dora lakova. 2001. "Financial Sector Evolution in the Central European Economies:Challenges in Supporttng Macroeconomic Stability and Sustainable Growth." IMF Working Paper. InternationalMonetary Pund, Washington, D.C.
- 21 -
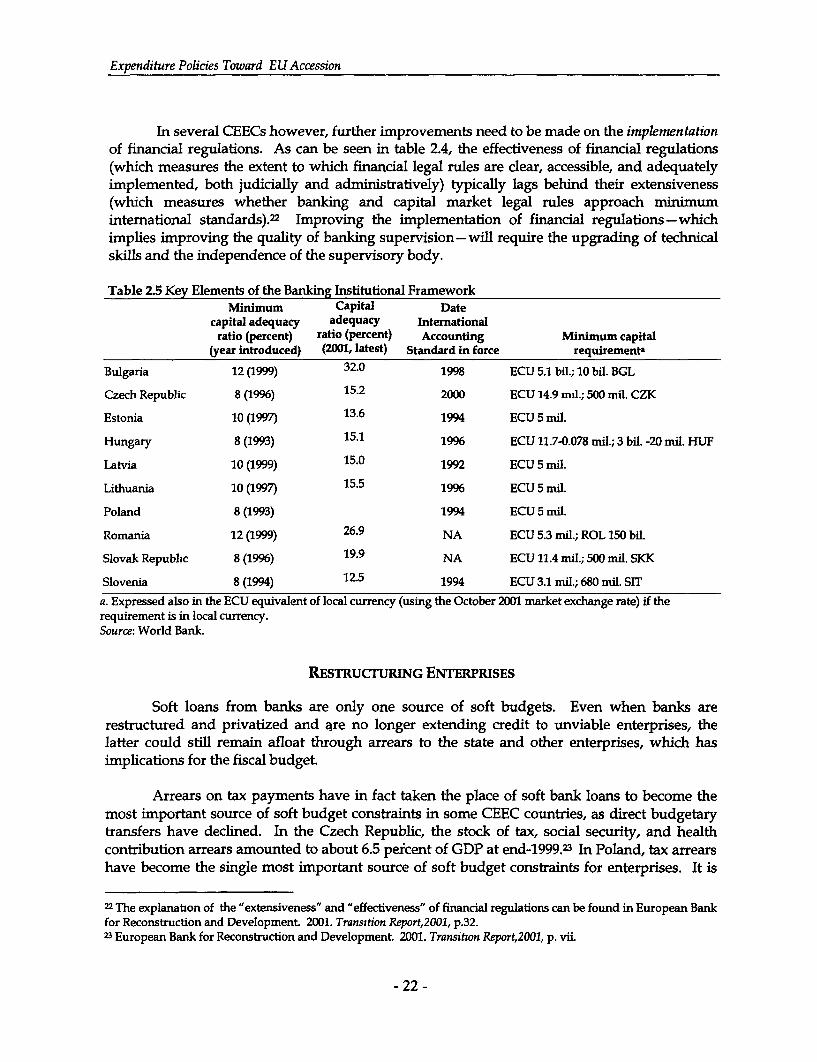
Expenditure Policies Toward EU Accession
In several CEECs however, further improvements need to be made on the implementationof financial regulations. As can be seen in table 2.4, the effectiveness of financial regulations(which measures the extent to which financial legal rules are clear, accessible, and adequatelyimplemented, both judicially and administratively) typically lags behind their extensiveness(which measures whether banking and capital market legal rules approach minimuminternational standards). 22 Improving the implementation of financial regulations-whichimplies improving the quality of banking supervision-will require the upgrading of technicalskills and the independence of the supervisory body.
Table 2.5 Key Elements of the Banking Institutional FrameworkMinimum Capital Date
capital adequacy adequacy Internationalratio (percent) ratio (percent) Accounting Minimum capital
(year introduced) (2001, latest) Standard in force requirementa
Bulgaria 12(1999) 32.0 1998 ECU 5.1 bil.; 10 bil. BGL
Czech Republic 8 (1996) 15.2 2000 ECU 14.9 mil.; 500 mil. CZK
Estonia 10 (1997) 13.6 1994 ECU 5 mil.
Hungary 8 (1993) 15.1 1996 ECU 11.7-0.078 mil.; 3 bil. -20 mil. HUF
Latvia 10 (1999) 15.0 1992 ECU 5 mil.
Lithuania 10 (1997) 15.5 1996 ECU 5 mil.
Poland 8 (1993) 1994 ECU 5 mil.
Romania 12 (1999) 26.9 NA ECU 5.3 mil.; ROL 150 bil.
Slovak Republic 8 (1996) 19.9 NA ECU 11.4 mil.; 500 mil. SKK
Slovenia 8 (1994) 12.5 1994 ECU 3.1 mil.; 680 mil. SIT
a. Expressed also in the ECU equivalent of local currency (using the October 2001 market exchange rate) if therequirement is in local currency.Source: World Bank.
RESTRUCTURING ENTERPRISES
Soft loans from banks are only one source of soft budgets. Even when banks arerestructured and privatized and are no longer extending credit to unviable enterprises, thelatter could still remain afloat through arrears to the state and other enterprises, which hasimplications for the fiscal budget.
Arrears on tax payments have in fact taken the place of soft bank loans to become themost important source of soft budget constraints in some CEEC countries, as direct budgetarytransfers have declined. In the Czech Republic, the stock of tax, social security, and healthcontribution arrears amounted to about 6.5 percent of GDP at end-1999.2 3 In Poland, tax arrearshave become the single most important source of soft budget constraints for enterprises. It is
X The explanation of the "extensiveness" and "effectiveness" of financial regulations can be found in European Bankfor Reconstruction and Development 2001. Transition Report,2001, p.32.23 European Bank for Reconstruction and Development 2001. Transihton Report,2001, p. vii.
- 22 -
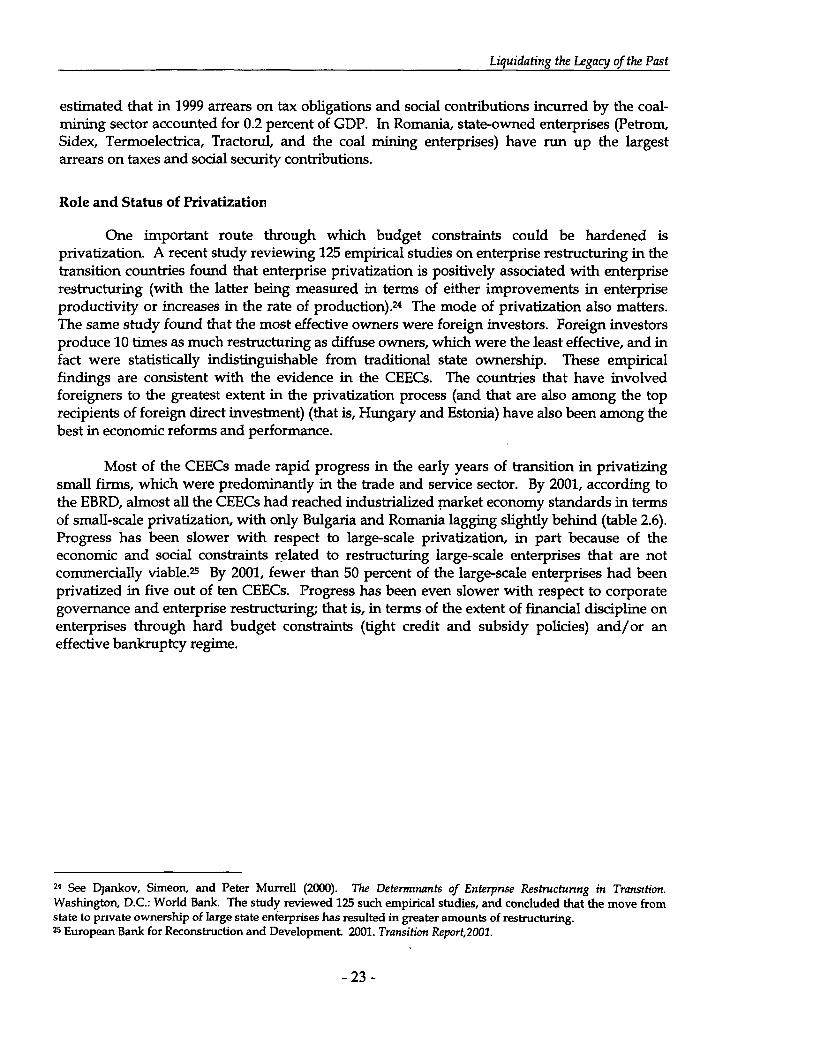
Liquidating the Legacy of the Past
estimated that in 1999 arrears on tax obligations and social contributions incurred by the coal-mining sector accounted for 0.2 percent of GDP. In Romania, state-owned enterprises (Petrom,Sidex, Termoelectrica, Tractorul, and the coal mining enterprises) have run up the largestarrears on taxes and social security contributions.
Role and Status of Privatization
One important route through which budget constraints could be hardened isprivatization. A recent study reviewing 125 empirical studies on enterprise restructuring in thetransition countries found that enterprise privatization is positively associated with enterpriserestructuring (with the latter being measured in terms of either improvements in enterpriseproductivity or increases in the rate of production).2 4 The mode of privatization also matters.The same study found that the most effective owners were foreign investors. Foreign investorsproduce 10 times as much restructuring as diffuse owners, which were the least effective, and infact were statistically indistinguishable from traditional state ownership. These empiricalfindings are consistent with the evidence in the CEECs. The countries that have involvedforeigners to the greatest extent in the privatization process (and that are also among the toprecipients of foreign direct investment) (that is, Hungary and Estonia) have also been among thebest in economic reforms and performance.
Most of the CEECs made rapid progress in the early years of transition in privatizingsmall firms, which were predominantly in the trade and service sector. By 2001, according tothe EBRD, almost all the CEECs had reached industrialized market economy standards in termsof small-scale privatization, with only Bulgaria and Romania lagging slightly behind (table 2.6).Progress has been slower with respect to large-scale privatization, in part because of theeconomic and social constraints related to restructuring large-scale enterprises that are notcommercially viable.25 By 2001, fewer than 50 percent of the large-scale enterprises had beenprivatized in five out of ten CEECs. Progress has been even slower with respect to corporategovernance and enterprise restructuring; that is, in terms of the extent of financial discipline onenterprises through hard budget constraints (tight credit and subsidy policies) and/or aneffective bankruptcy regimne.
24 See Djankov, Simeon, and Peter Murrell (2000). The Determinants of Enterpnse Restructurnng in Transition.Washington, D.C.: World Bank. The study reviewed 125 such empirical studies, and concluded that the move fromstate to private ownership of large state enterprises has resulted in greater amounts of restructuring.25 European Bank for Reconstruction and Development. 2001. Transition Report,2001.
- 23 -
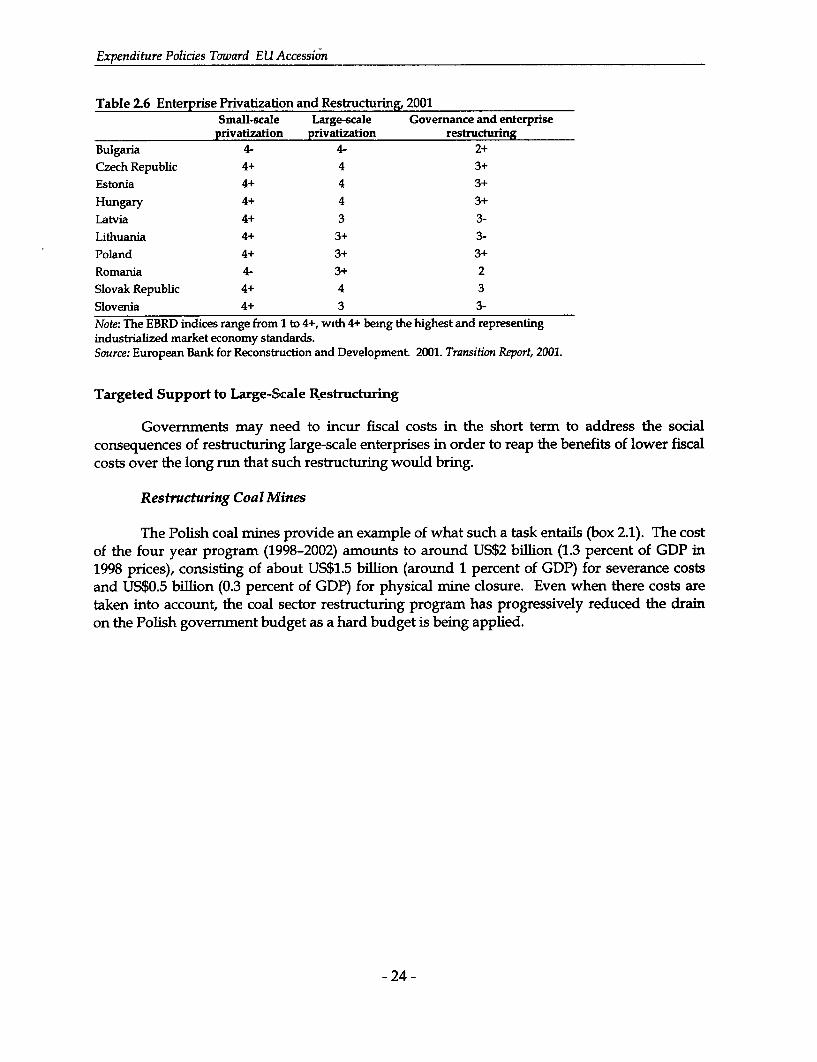
Expenditure Policies Toward EU Accession
Table 2.6 Enterprise Privatization and Restructuring, 2001Small-scale Large-scale Govemance and enterprise
privatization privatization restructuringBulgaria 4- 4- 2+Czech Republic 4+ 4 3+Estonia 4+ 4 3+Hungary 4+ 4 3+Latvia 4+ 3 3-Lithuania 4+ 3+ 3-Poland 4+ 3+ 3+Romania 4- 3+ 2Slovak Republic 4+ 4 3Slovenia 4+ 3 3-Note: The EBRD indices range from 1 to 4+, with 4+ bemg the highest and representingindustrialized market economy standards.Source: European Bank for Reconstruction and Development. 2001. Transition Report, 2001.
Targeted Support to Large-Scale Restructuring
Governments may need to incur fiscal costs in the short term to address the socialconsequences of restructuring large-scale enterprises in order to reap the benefits of lower fiscalcosts over the long run that such restructuring would bring.
Restructuring Coal Mines
The Polish coal mines provide an example of what such a task entails (box 2.1). The costof the four year program (1998-2002) amounts to around US$2 billion (1.3 percent of GDP in1998 prices), consisting of about US$1.5 billion (around 1 percent of GDP) for severance costsand US$0.5 billion (0.3 percent of GDP) for physical mine dosure. Even when there costs aretaken into account, the coal sector restructuring program has progressively reduced the drainon the Polish government budget as a hard budget is being applied.
- 24 -
Liquidating the Legacy of the Past
Box 2.1 Restructuring the Polish Coal Mines
The Polish coal mining sector-accounting for about 4 percent of GDP in Poland-has been experiencmgincreasing difficulties over the last two decades. Between the early 1980s and 1998 the sales of Polish coal werenearly halved owmg to ongoing changes in energy efficiency and substitution (gas for coal) on the domestic frontand a depressed global coal market and declme in export competitiveness on the external front. The miningcompanies failed to adjust to the fall in demand and, saddled with obsolete equipment, made mcreasmg lossesand had to be kept afloat through arrears on various government obligations, including taxes, social security, andenvironmental fees and fines. By 1998, the cumulative total of such liabilities had reached around 3 percent ofGDP.
The government introduced a hard coal sector restructuring program in 1998 aimed at reversing the losses of thecoal minng companies and preparing them for privatization while at the same time putting in place a safety netfor those coal miners who would become unemployed as a result of the restructuring. Specifically, the programinvolves four elements: closure of mines, rescheduling or forgiveness of liabilities to the government andgovernment institutions, the use of incentive-based management contracts (which are fixed term and includedismissal of management in the case of poor performance), and financial support to encourage voluntaryretirement and active labor market programs to assist in the redeployment of coal workers.
By end-2000, the program had resulted in employment cuts of 36 percent and a reduction m production capacityof 20 percent. Employment downsizing and labor cost reductions exceeded expectations. More than half of theworkers that had left the industry have reached retirement age, while most of the rest have been reabsorbed intothe local labor market. However, the financial performance of the coal mining companies continued to be poorbecause of poor management and the companies were not able to pay all their taxes and fees to governmententities in 1999 and 2000. In response, the government introduced revisions to the program in 1999 to provide foradditional capacity and employment reduction, to strengthen company management, and to delay the meeting ofprofitability expectations by one year to end-2001. The industry has started to achieve a profit on coal sales in2001 although it is still making losses overall due to high financial charges and non-coal operating costs.
A recent evaluation of the program indicates that extensions of the revised program will be needed to prepare thecoal mines for privahzation. These extensions include further employment restructuring and mine closure aswell as additional financial support to encourage workers to leave the sector.
Sources: World Bank (1999) Report and Recommendation of the President on a proposed Hard Coal Sector Adjustment Loan to theRepublic of Poland, May 18; World Bank (2001(d) Implementation Completion Report on a Hard Coal Sector Adjustment Loan tothe Republic of Poland, June 2Z and World Bank (2001(e) Report and Recommendation of the President on a proposed SecondHard Coal Sector Adjustment Loan to the Republic of Poland, June 26.
Some of the key lessons from the Polish experience, as well as from the experience ofother countries that have undertaken similar large-scale industrial restructurings, are worthnoting.
* Such a task is extremely difficult and takes many years to accomplish. This meansthat a high level of commitment by the government is necessary. The Polish coalmining restructuring program that is currently being implemented is the fourthsuch program that has been put forward over the last decade, and the first one thathas actually been implemented.
* It is important to involve the affected workers in designing the program. One ofthe key elements in the success of the Polish program is the intensive dialoguebetween the government and the trade unions in the design of this program.
* There is a need for adequate measures, including the funding of such measures, toaddress the social consequences of restructuring. In Poland, fast-acting and
- 25 -
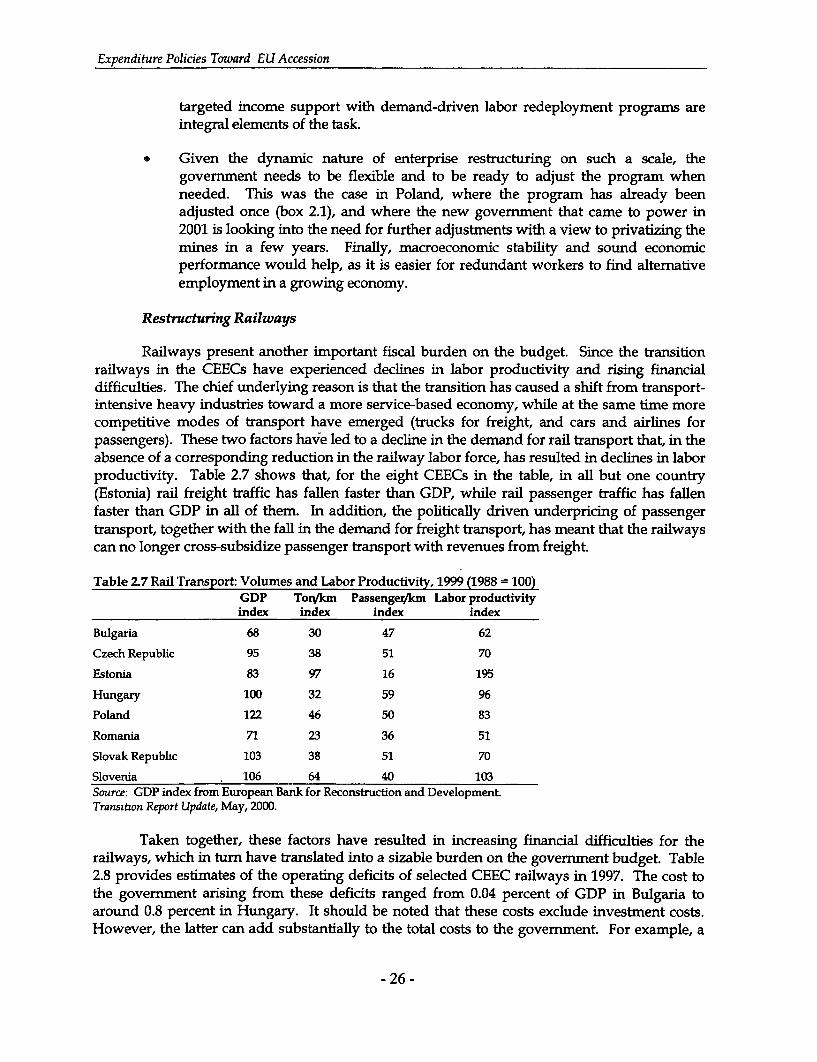
Expenditure Policies Toward EU Accession
targeted income support with demand-driven labor redeployment programs areintegral elements of the task.
* Given the dynamic nature of enterprise restructuring on such a scale, thegovernment needs to be flexible and to be ready to adjust the program whenneeded. This was the case in Poland, where the program has already beenadjusted once (box 2.1), and where the new government that came to power in2001 is looking into the need for further adjustments with a view to privatizing themines in a few years. Finally, macroeconomic stability and sound economicperformance would help, as it is easier for redundant workers to find alternativeemployment in a growing economy.
Restructuring Railways
Railways present another important fiscal burden on the budget. Since the transitionrailways in the CEECs have experienced declines in labor productivity and rising financialdifficulties. The chief underlying reason is that the transition has caused a shift from transport-intensive heavy industries toward a more service-based economy, while at the same time morecompetitive modes of transport have emerged (trucks for freight, and cars and airlines forpassengers). These two factors hav~e led to a decline in the demand for rail transport that, in theabsence of a corresponding reduction in the railway labor force, has resulted in declines in laborproductivity. Table 2.7 shows that, for the eight CEECs in the table, in all but one country(Estonia) rail freight traffic has fallen faster than GDP, while rail passenger traffic has fallenfaster than GDP in all of them. In addition, the politically driven underpricing of passengertransport, together with the fall in the demand for freight transport, has meant that the railwayscan no longer cross-subsidize passenger transport with revenues from freight.
Table 2.7 Rail Transport: Volumes and Labor Productivity, 1999 (1988 = 100)GDP Toni/km Passenger/km Labor productivityindex index index index
Bulgaria 68 30 47 62
Czech Repubhc 95 38 51 70
Estonia 83 97 16 195
Hungary 100 32 59 96
Poland 122 46 50 83
Romarnia 71 23 36 51
Slovak Republhc 103 38 51 70
Slovenia 106 64 40 103Source: GDP index from European Bank for Reconstruction and Development.Transitton Report Update, May, 2000.
Taken together, these factors have resulted in increasing financial difficulties for therailways, which in turn have translated into a sizable burden on the government budget. Table2.8 provides estimates of the operating deficits of selected CEEC railways in 1997. The cost tothe government arising from these deficits ranged from 0.04 percent of GDP in Bulgaria toaround 0.8 percent in Hungary. It should be noted that these costs exclude investment costs.However, the latter can add substantially to the total costs to the government. For example, a
- 26 -

Liquidating the Legacy of the Past
separate estimate of the cost of railways to the government in the Czech Republic indicates thatit amounted to 1.6 percent of GDP in 1998, inclusive of investment costs. Despite the sizabledrain on the budget of these costs, the railways are in poor shape because of inadequatemaintenance.
Table 2.8 Operating Deficits of Selected CEEC Railways, 1997(percent of GDP)
Bulgaria 0.04
Czech Republic 0.62Estonia 0.19
Hungary 0.77
Poland 0.46
Romania 0.52Slovak Republic 0.62
Slovenia 0.69Source: International Railways Union.
Fundamental reforms in the way the CEEC railways are organized and operated isneeded to address the problems of poor finances and low productivity, and to halt theircontinued drain on the budget. Fortunately, the organizational and financial changes requiredare the same as those mandated by the adoption of the acquis communautaire. Key steps includeseparation of the infrastructure costs (and perhaps the actual infrastructure institution) from theoperating functions of the railways, separation of the accounts for passenger services from thosefor freight, and separation of the accounts for social services from those for commercial servicesas well as prohibition of subsidies to commercial services. In addition, CEEC governments willneed to introduce competition into railways. They will need to establish regulatory regimes toensure nondiscriminatory access to the infrastructure for all licensed operators, and to developsystems of access prices that generate adequate earnings for the infrastructure operator whilereturning appropriate signals to the operators.
Such large-scale restructuring is costly. For coal, however, there will be much largerbenefits of lower fiscal costs over the long run. By far the largest need for financial supportwould be assistance for the redundancy reduction of labor. For example, just the first stage ofrailway restructuring in Poland (box 2.2) required a 25 percent reduction in the labor force(about 40,000 jobs) at a cost of around US$200 million (0.1 percent of GDP). Restructuring theentire Polish railway system may eventually require a 50 percent reduction in employment,totaling about 300,000 jobs, and US$1.5 billion (0.9 percent of GDP). In addition, there will bethe costs of rehabilitating and upgrading facilities, although such investments should only bemade when the future traffic flows are known with reasonable likelihood, and the railwaysthemselves should be able to absorb such costs.
- 27 -
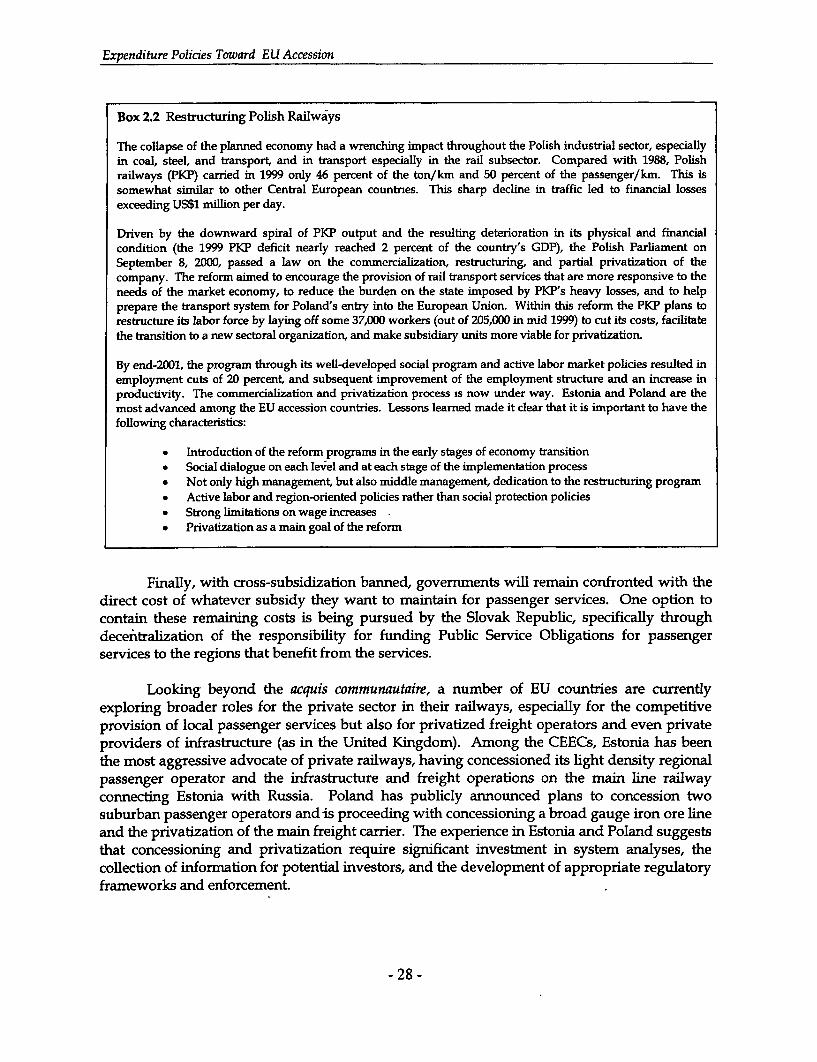
Expenditure Policies Toward EU Accession
Box 2.2 Restructuring Polish Railways
The collapse of the planned economy had a wrenching impact throughout the Polish industrial sector, especiallyin coal, steel, and transport, and in transport especially in the rail subsector. Compared with 1988, Polishrailways (PKP) carried in 1999 only 46 percent of the ton/km and 50 percent of the passenger/km. This issomewhat similar to other Central European countries. This sharp decline in traffic led to financial lossesexceeding US$1 million per day.
Driven by the downward spiral of PKP output and the resulting deterioration in its physical and financialcondition (the 1999 PKP deficit nearly reached 2 percent of the country's GDP), the Polish Parliament onSeptember 8, 2000, passed a law on the commercialization, restructuring, and partial privatization of thecompany. The reform aimed to encourage the provision of rail transport services that are more responsive to theneeds of the market economy, to reduce the burden on the state imposed by PKPs heavy losses, and to helpprepare the transport system for Poland's entry into the European Union. Within this reform the PKP plans torestructure its labor force by laying off some 37,000 workers (out of 205,000 in mid 1999) to cut its costs, facilitatethe transition to a new sectoral organization, and make subsidiary units more viable for privatization.
By end-2001, the program through its well-developed social program and active labor market policies resulted inemployment cuts of 20 percent, and subsequent improvement of the employment structure and an increase inproductivity. The commercialization and privatization process is now under way. Estonia and Poland are themost advanced among the EU accession countries. Lessons leamed made it clear that it is important to have thefollowing characteristics:
* Introduction of the reform programs in the early stages of economy transition* Social dialogue on each level and at each stage of the implementation process* Not only high management, but also middle management, dedication to the restructuring program* Active labor and region-oriented policies rather than social protection policies* Strong limitations on wage increases* Privatization as a main goal of the reform
Finally, with cross-subsidization banned, governments will remain confronted with thedirect cost of whatever subsidy they want to maintain for passenger services. One option tocontain these remaining costs is being pursued by the Slovak Republic, specifically throughdecentralization of the responsibility for funding Public Service Obligations for passengerservices to the regions that benefit from the services.
Looking beyond the acquis communautaire, a number of EU countries are currentlyexploring broader roles for the private sector in their railways, especially for the competitiveprovision of local passenger services but also for privatized freight operators and even privateproviders of infrastructure (as in the United Kingdom). Among the CEECs, Estonia has beenthe most aggressive advocate of private railways, having concessioned its light density regionalpassenger operator and the infrastructure and freight operations on the main line railwayconnecting Estonia with Russia. Poland has publicly announced plans to concession twosuburban passenger operators and is proceeding with concessioning a broad gauge iron ore lineand the privatization of the main freight carrier. The experience in Estonia and Poland suggeststhat concessioning and privatization require significant investment in system analyses, thecollection of information for potential investors, and the development of appropriate regulatoryframeworks and enforcement.
- 28 -
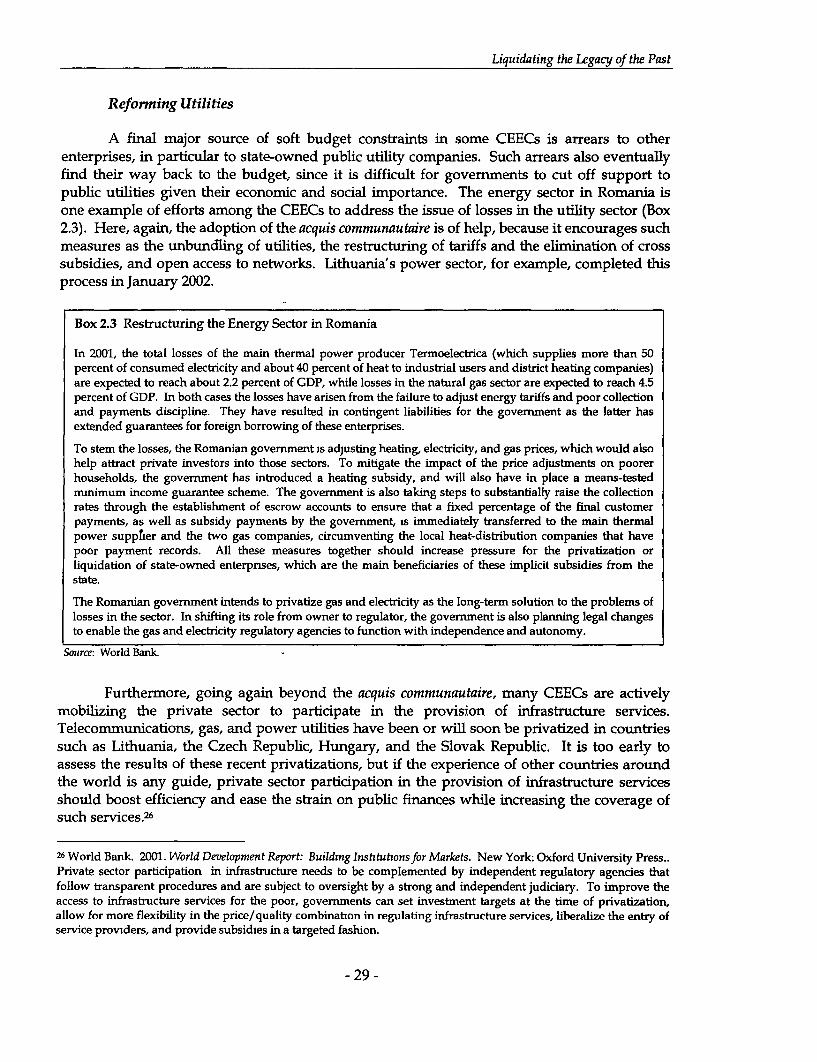
Liquidating the Legacy of the Past
Reforning Utilities
A final major source of soft budget constraints in some CEECs is arrears to otherenterprises, in particular to state-owned public utility companies. Such arrears also eventuallyfind their way back to the budget, since it is difficult for governments to cut off support topublic utilities given their economic and social importance. The energy sector in Romania isone example of efforts among the CEECs to address the issue of losses in the utility sector (Box2.3). Here, again, the adoption of the acquis communautaire is of help, because it encourages suchmeasures as the unbundling of utilities, the restructuring of tariffs and the elimination of crosssubsidies, and open access to networks. Lithuania's power sector, for example, completed thisprocess in January 2002.
Box 2.3 Restructuring the Energy Sector in Romania
In 2001, the total losses of the main thermal power producer Termoelectrica (which supplies more than 50percent of consumed electricity and about 40 percent of heat to industrial users and district heating companies)are expected to reach about 2.2 percent of GDP, while losses in the natural gas sector are expected to reach 4.5percent of GDP. In both cases the losses have arisen from the failure to adjust energy tariffs and poor collectionand payments discipline. They have resulted in contingent liabilities for the government as the latter hasextended guarantees for foreign borrowing of these enterprises.
To stem the losses, the Romanian government is adjusting heating, electricity, and gas prices, which would alsohelp attract private investors into those sectors. To mitigate the impact of the price adjustments on poorerhouseholds, the government has introduced a heating subsidy, and will also have in place a means-testedmmnimum income guarantee scheme. The government is also taking steps to substantially raise the collectionrates through the establishment of escrow accounts to ensure that a fixed percentage of the final customerpayments, as well as subsidy payments by the government, is immediately transferred to the main thermalpower suppfer and the two gas companies, circumventing the local heat-distribution companies that havepoor payment records. All these measures together should increase pressure for the privatization orliquidation of state-owned enterprises, which are the main beneficiaries of these implicit subsidies from thestate.
The Romanian government intends to privatize gas and electricity as the long-term solution to the problems oflosses in the sector. In shifting its role from owner to regulator, the government is also planning legal changesto enable the gas and electricity regulatory agencies to function with independence and autonomy.
Souirce: World Bank.
Furthermore, going again beyond the acquis communautaire, many CEECs are activelymobilizing the private sector to participate in the provision of infrastructure services.Telecommunications, gas, and power utilities have been or will soon be privatized in countriessuch as Lithuania, the Czech Republic, Hungary, and the Slovak Republic. It is too early toassess the results of these recent privatizations, but if the experience of other countries aroundthe world is any guide, private sector participation in the provision of infrastructure servicesshould boost efficiency and ease the strain on public finances while increasing the coverage ofsuch services.2 6
26 World Bank. 2001. World Development Report: Building Institutionsfor Markets. New York: Oxford University Press..Private sector participation in infrastructure needs to be complemented by independent regulatory agencies thatfollow transparent procedures and are subject to oversight by a strong and independent judiciary. To improve theaccess to infrastructure services for the poor, governments can set investment targets at the time of privatization,allow for more flexibility in the price/quality combination in regulating infrastructure services, liberalize the entry ofservice providers, and provide subsidies in a targeted fashion.
- 29 -

Expenditure Policies Toward EU Accession
CONCLUSIONS
Liquidating the legacy of a profligate past can be an expensive proposition. Even whencapitalized and amortized over time the fallout of bank restructuring has often hovered aroundan annual 1-2 percent of GDP. The costs associated with downsizing mines or railways can besimilarly daunting, and the conclusions drawn are significant.
* It is better to recognize problems early, to see them for what they are, and to tacklethem. One reason why the cost of bank restructuring was so much lower inEstonia than, for example, in the Slovak Republic, is that Estonia nipped bankingdistress in the bud, while the Slovak Republic let the situation fester for years. Inanother area, one reason why Poland was able to downsize its coal sector is that itrecognized the sector's problem as a social one and dealt with it as such. The samewould apply in many cases of railway restructuring.
* While the costs may be high, it pays to face them up front. In about every CEEC,cleaning up bank portfolios proved key to the resumption of growth. Similarly,restructuring infrastructural enterprises is essential if they are to modernize andprovide the services that economies require to compete within Europe. More oftenthan not, financing instruments are available from domestic or foreign sources tostretch the related charges over longer periods.
* No blueprint has as yet emerged of the best way to deal with bad debt recovery.Recovering debt is important, perhaps even more for the principle (avoiding moralhazard) than for the amounts involved (nowhere in the region have actualrecoveries exceeded 20 percent of the amounts due). In the circumstances, aneclectic mix of centralized and decentralized approaches would seem torecommend itself.
* The key role played by foreign investment. Foreign banks in particular haveplayed a central role in breaking up the "old boys' club" that used to bind banks totheir borrowers and that proved fatal to the banks. Perhaps the now massivepresence of foreign banks (they control more than two-thirds of the bank credit inmost CEECs) will help the banking industry grow on a sound basis.
Indeed, now that the stresses are subsiding, attention needs to shift from resolution toprevention. Many future crises and their attendant fiscal costs will be avoided if CEECscontinue to enhance the implementation of their regulatory apparatus and the effectiveness oftheir debt-resolution procedures.
- 30 -
3. SUCCESSFULLY INTEGRATINGWITH THE EUROPEAN UNION
The future, as much as the past, is a source of expenditure challenges of its own, and thefuture for the CEECs is to make a success of their ongoing integration into the Europeaneconomy. To achieve this, these countries will need to upgrade the skills of their labor forces,the levels of their environmental standards, and the quality and extent of their transportnetworks.
The nature of the fiscal challenges involved differs from one case to another. Forinstance, there is a clear need for countries to invest in environment and transport. As seen inchapter 1 some countries are already investing heavily. However, the question is to investjudiciously; that is, in a manner that maximizes the trade off between costs and benefits. In thecase of skills and education, in contrast, the issue is a more difficult one of redirectingexpenditures from yesterday's priorities to those of today and tomorrow. While the benefits ofexpanding parts of the education system may be evident, the problems associated withshrinking other parts may often be politically crippling.
We will examine education, environment, and transport in turn. It should be kept inmind that, although expenditure policies will generally be discussed in pecuniary terms, theirbenefits extend well beyond narrowly defined financial gains. Indeed, for the man on the street,their impact may be more immediately felt in terms of broader access to knowledge, increasedmobility, and cleaner water and air.
UPGRADING SKILLS
Human capital has been and will remain a key asset for securing the benefits ofEuropean. and global integration. Together with supportive macroeconomic and financialpolicies and infrastructure investments, education will continue to play a key role in supportingthe transformation of the CEECs from low-income, resource-based economies to high-income,knowledge-based economies. In the last decade the demand for education was affected by twomajor changes: a collapse in the school age population and a sea change in the demand forskills.
The supply side, however, was slow to react to these new conditions. As a result,teacher/student ratios in basic education, already low by international standards, fell further,while education systems struggled to keep up quality. The sluggishness of the supply responsehas much to do with built-in rigidities in financial allocation formulas, as well as in the politico-institutional frameworks that govern the sector. How well the CEECs reorient their educationsystems to the needs of the new regional and global economy will have major implications fortheir competitiveness in the future.
- 31 -
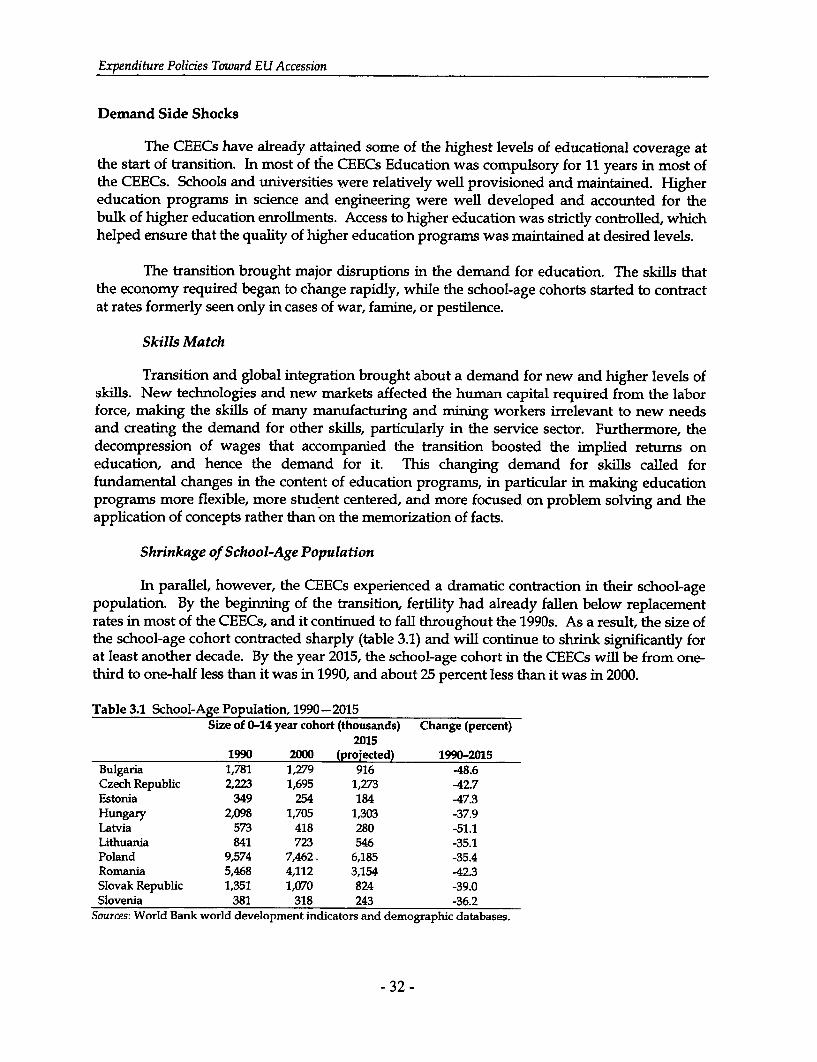
Expenditure Policies Toward EU Accession
Demand Side Shocks
The CEECs have already attained some of the highest levels of educational coverage atthe start of transition. In most of the CEECs Education was compulsory for 11 years in most ofthe CEECs. Schools and universities were relatively well provisioned and maintained. Highereducation programs in science and engineering were well developed and accounted for thebulk of higher education enrollments. Access to higher education was strictly controlled, whichhelped ensure that the quality of higher education programs was maintained at desired levels.
The transition brought major disruptions in the demand for education. The skills thatthe economy required began to change rapidly, while the school-age cohorts started to contractat rates formerly seen only in cases of war, famine, or pestilence.
Skills Match
Transition and global integration brought about a demand for new and higher levels ofskills. New technologies and new markets affected the human capital required from the laborforce, making the skills of many manufacturing and mining workers irrelevant to new needsand creating the demand for other skills, particularly in the service sector. Furthermore, thedecompression of wages that accompanied the transition boosted the implied returns oneducation, and hence the demand for it. This changing demand for skills called forfundamental changes in the content of education programs, in particular in making educationprograms more flexible, more student centered, and more focused on problem solving and theapplication of concepts rather than on the memorization of facts.
Shrinkage of School-Age Population
In parallel, however, the CEECs experienced a dramatic contraction in their school-agepopulation. By the beginning of the transition, fertility had already fallen below replacementrates in most of the CEECs, and it continued to fall throughout the 1990s. As a result, the size ofthe school-age cohort contracted sharply (table 3.1) and will continue to shrink significantly forat least another decade. By the year 2015, the school-age cohort in the CEECs will be from one-third to one-half less than it was in 1990, and about 25 percent less than it was in 2000.
Table 3.1 School-Age Population, 1990 -2015Size of 0-14 year cohort (thousands) Change (percent)
20151990 2000 (projected) 1990-2015
Bulgaria 1,781 1,279 916 -48.6Czech Republic 2,223 1,695 1,273 -42.7Estonia 349 254 184 -47.3Hungary 2,098 1,705 1,303 -37.9Latvia 573 418 280 -51.1Lithuania 841 723 546 -35.1Poland 9,574 7,462- 6,185 -35.4Romania 5,468 4,112 3,154 -42.3Slovak Republic 1,351 1,070 824 -39.0Slovenia 381 318 243 -36.2
Sources: World Bank world development indicators and demographic databases.
- 32 -

Successfully Integrating with the European Union
Enrollments
In spite of the difficulties experienced by the accession countries during the 1990s,official data on school enrollments show improved coverage of preschool, primary, and,especially, higher education-expressed as a percentage of the relevant age group enrolled inschool-in most of the accession countries (table 3.2). However, registered enrollments actuallydeclined as a percentage of the age group in two countries at the preschool level (Lithuania andSlovakia), in four countries at the primary level (Bulgaria, the Czech Republic, Hungary, andLatvia), and in five countries at the secondary level (Bulgaria, the Czech Republic, Latvia,Lithuania, and, especially, Romania).
Table 3.2 Enrollment Ratios through the TransitionPreschool net Primary gross Secondary gross University gross
enrollment ratio enrollment ratio enrollment ratio enrollment ratio(percent) (percent) (percent) (percent)
1990 1999 1990 1999 1990 1999 1990 1999Bulgaria 65.5 66.4 98.6 95.1 77.0 75.6 26.2 34.7Czech Repubhc 75.2 85.4 98.6 97.7 78.7 75.9 17.2 26.0Estoma 67.4 73.5 94.9 97.5 57.0 71.9 34.4 45.0Hungary 85.3 87.3 98.8 98.7 73.3 98.8 12.1 28.9Latvia 44.8 61.0 94.9 92.3 70.2 68.5 20.5 46.5Lithuania 55.9 51.6 92.5 95.5 70.0 64.8 26.5 39.2Poland 47.1 49.9 97.5 98.3 89.3 99.5 17.0 42.8Romania 53.3 66.2 92.5 98.5 89.9 70.2 9.2 23.4Slovak Republic 72.0 69.5 98.1 107.5 78.2 80.0 14.3 22.5Slovenia 55.7 70.2 95.3 97.4 n.a. 93.3 22.9 51.0
Note: Figures shown are gross enrollment ratios, which tend to overstate actual coverage because they includeoverage students in the numerator but not in the denominator.Source: UNICEF, 2001, A Decade of Transition: The MONEE Project. CEE/CIS/Baltics, Innocenti Research Center.
Most of the registered decline in secondary enrollments occurred in vocational andtechnical education. In Romania, for example, the enrollment in secondary vocational andtechnical education declined from 78.4 percent of the age group in 1990 to 43.9 percent in 1999,while the enrollment in general secondary education increased from 11.5 percent of the agegroup to 26.3 percent in 1999.27 The decline in secondary enrollments reflects a perception thatsecondary education-especially secondary vocational education-no longer ensuresemployment for graduates. (Many- of the enterprises that had traditionally recruited secondaryvocational students at the completion of their training closed or reduced their staffing, and nolonger recruited graduating students.) It may also reflect the pressure for some students toenter the labor market in order to augment falling household income. In the poorest of theCEECs, the shifting of financing responsibilities to households for textbooks and othereducational tools that were formerly provided free led to financial hardship for somehouseholds. This may have contributed to the declines in coverage that were observed forprimary and secondary education in Bulgaria and for secondary education in Romania.
27 Data provided by Romanian Ministry of National Education.
- 33 -

Expenditure Policies Toward EU Accession
School Attendance
Although the official enrollment data show a generally improving coverage ofeducation, household survey data often show that actual school attendance is well belowregistered enrollments and is declining, and reveal significant gaps in attendance in rural areas,in areas with ethnic minorities, and among the poor. In Bulgaria, for example, schoolattendance rates are lower for the rural population than for the urban population, especially forsecondary education (where remoteness of schools is often a constraint); school attendance ratesfor the poor are much lower than for the non-poor at all levels of education; and Roma havemuch lower rates of school attendance than either ethnic Bulgarians or Bulgarian ethnic Turksfor all levels of education (table 3.3).
Table 3.3 Bulgaria: Rates of School Attendance by Level, 1995,1997, and 2001Preschool education Primary education Secondary education
1995 1997 2001 1995 1997 2001 1995 1997 2001
Total population 44 14 22 87 88 90 47 55 46Males 42 12 21 88 88 90 49 54 46Females 46 15 24 85 88 89 45 56 46Urban 46 13 24 88 90 92 52 63 53Rural 40 14 20 83 84 84 31 32 22Non-Poor 47 16 26 89 93 94 49 60 52Poor 8 11 10 54 81 70 20 46 13Bulgarians 44 15 26 90 93 94 55 66 56Turks 53 10 19 88 93 90 10 30 34Roma 25 5 16 55 58 71 3 5 6Source: Bulgaria Integrated Household Survey, 1995,1997,2001 data.
Policy Responses
The situation just described suggests that the following actions should be pursued:
* Education at the secondary level should provide more generic skills for a fewbroad families of occupational specializations rather than highly specific skills for alarge number of narrow occupations.
* Vocational education should place more emphasis on developing numeracy skills,problem-solving skills, communication skills (including foreign languageproficiency), and teamwork skills, and should give less emphasis to job-specificskills.
* Higher education should expand and become more flexible at entry and shouldalso offer easier transfer opportunities across programs and faculties, and shouldalso provide stronger performance incentives to students and faculty.
* The legal and fiscal environment should change so as to encourage employers andlocal governments to develop lifelong learning programs to meet local (and global)skill needs.
- 34 -
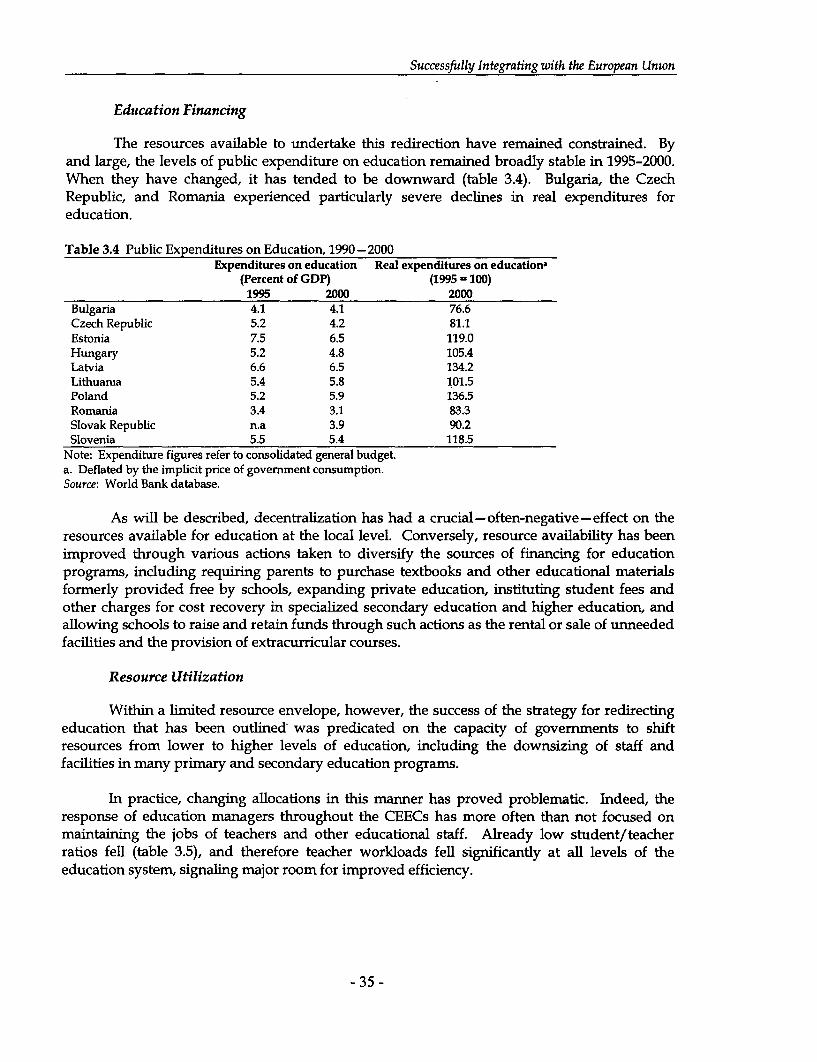
Successfully Integrating with the European Union
Education Financing
The resources available to undertake this redirection have remained constrained. Byand large, the levels of public expenditure on education remained broadly stable in 1995-2000.When they have changed, it has tended to be downward (table 3.4). Bulgaria, the CzechRepublic, and Romania experienced particularly severe declines in real expenditures foreducation.
Table 3.4 Public Expenditures on Education, 1990-2000Expenditures on education Real expenditures on educationa
(Percent of GDP) (1995 = 100)1995 2000 2000
Bulgaria 4.1 4.1 76.6Czech Republic 5.2 4.2 81.1Estonia 7.5 6.5 119.0Hungary 5.2 4.8 105.4Latvia 6.6 6.5 134.2Lithuama 5.4 5.8 101.5Poland 5.2 5.9 136.5Romania 3.4 3.1 83.3Slovak Republic n.a 3.9 90.2Slovenia 5.5 5.4 118.5
Note: Expenditure figures refer to consolidated general budget.a. Deflated by the implicit price of government consumption.Source: World Bank database.
As will be described, decentralization has had a crucial-often-negative-effect on theresources available for education at the local level. Conversely, resource availability has beenimproved through various actions taken to diversify the sources of financing for educationprograms, including requiring parents to purchase textbooks and other educational materialsformerly provided free by schools, expanding private education, instituting student fees andother charges for cost recovery in specialized secondary education and higher education, andallowing schools to raise and retain funds through such actions as the rental or sale of unneededfacilities and the provision of extracurricular courses.
Resource Utilization
Within a limited resource envelope, however, the success of the strategy for redirectingeducation that has been outlined was predicated on the capacity of governments to shiftresources from lower to higher levels of education, including the downsizing of staff andfacilities in many primary and secondary education programs.
In practice, changing allocations in this manner has proved problematic. Indeed, theresponse of education managers throughout the CEECs has more often than not focused onmaintaining the jobs of teachers and other educational staff. Already low student/teacherratios fell (table 3.5), and therefore teacher workloads fell significantly at all levels of theeducation system, signaling major room for improved efficiency.
- 35 -
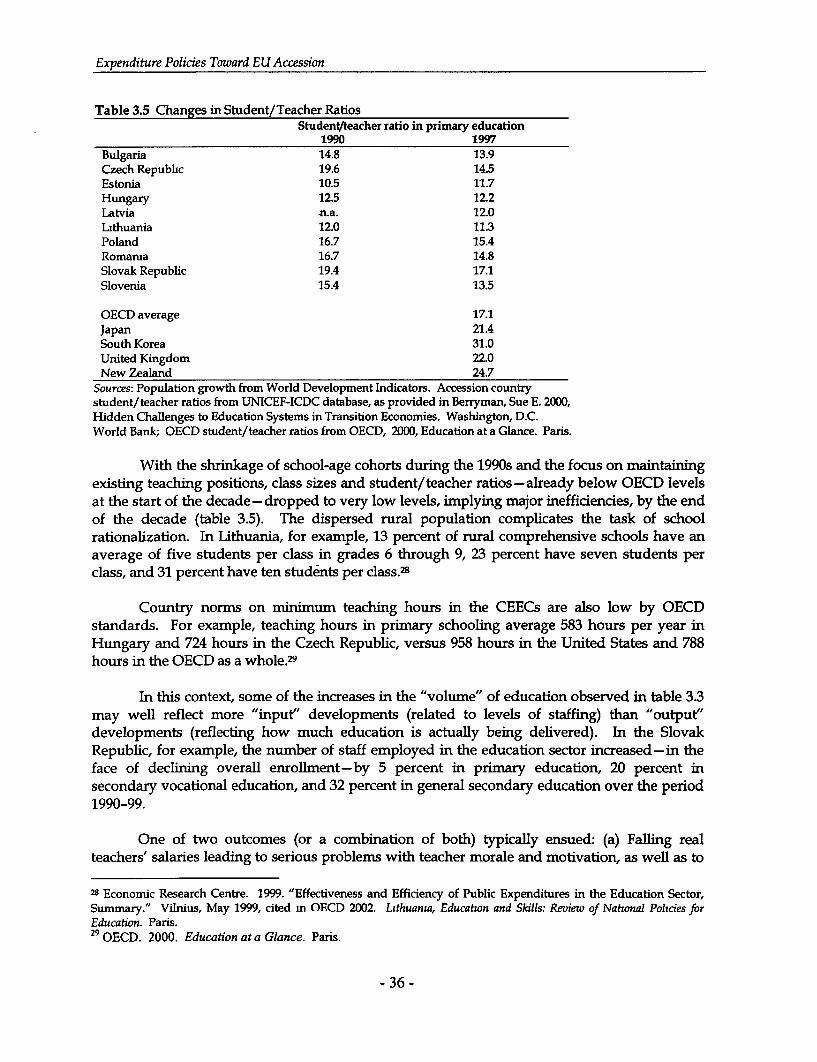
Expenditure Policies Toward EU Accession
Table 3.5 Changes in Student/Teacher RatiosStudenVtteacher ratio in primary education
1990 1997Bulgaria 14.8 13.9Czech Republic 19.6 14.5Estonia 10.5 11.7Hungary 12.5 12.2Latvia -n.a. 12.0Lithuania 12.0 11.3Poland 16.7 15.4Romania 16.7 14.8Slovak Republic 19.4 17.1Slovenia 15.4 13.5
OECD average 17.1Japan 21.4South Korea 31.0United Kingdom 22.0New Zealand 24.7
Sources: Population growth from World Development Indicators. Accession countrystudent/teacher ratios from UNICEF-ICDC database, as provided in Berryman, Sue E. 2000,Hidden Challenges to Education Systems in Transition Economies. Washington, D.C.World Bank; OECD student/teacher ratios from OECD, 2000, Education at a Glance. Paris.
With the shrinkage of school-age cohorts during the 1990s and the focus on maintainingexisting teaching positions, class sizes and student/teacher ratios-already below OECD levelsat the start of the decade -dropped to very low levels, implying major inefficiencies, by the endof the decade (table 3.5). The dispersed rural population complicates the task of schoolrationalization. In Lithuania, for example, 13 percent of rural comprehensive schools have anaverage of five students per class in grades 6 through 9, 23 percent have seven students perclass, and 31 percent have ten students per class.28
Country norms on minimum teaching hours in the CEECs are also low by OECDstandards. For example, teaching hours in primary schooling average 583 hours per year inHungary and 724 hours in the Czech Republic, versus 958 hours in the United States and 788hours in the OECD as a whole. 2 9
In this context, some of the increases in the "volume" of education observed in table 3.3may well reflect more "input" developments (related to levels of staffing) than "output"developments (reflecting how much education is actually being delivered). In the SlovakRepublic, for example, the number of staff employed in the education sector increased-in theface of declining overall enrollment-by 5 percent in primary education, 20 percent insecondary vocational education, and 32 percent in general secondary education over the period1990-99.
One of two outcomes (or a combination of both) typically ensued: (a) Falling realteachers' salaries leading to serious problems with teacher morale and motivation, as well as to
28 Economic Research Centre. 1999. "Effectiveness and Efficiency of Public Expenditures in the Education Sector,Summary." Vilnius, May 1999, cited m OECD 2002. Lithuania, Education and Skills: Reuiew of National Policies forEducation. Paris.29 OECD. 2000. Education at a Glance. Paris.
- 36 -

Successfully Integrating with the European Union
growing problems of corruption in some of the CEECs (with students paying for good grades orentrance into the most desirable programs) and (b) outlays for salaries and benefits rising as ashare of recurrent education expenditures and in the process displacing vital expenditures tomaintain and update teaching, learning materials and school infrastructure.
Impact
Partly as a result of these conditions, both the quality of and access to education, whilestill high, are beginning to show signs of eroding.
Changes in Quality
For the CEECs, the most inclusive source of internationally comparable data on whatstudents learn is the TIMSS international science and math assessment.30 Eight CEECs -Latvia,
Lithuania, Hungary, Bulgaria, Romania, the Slovak Republic, Slovenia, and the CzechRepublic-participated in the 1995 and 1999 surveys. As shown in table 3.6, five of the CEECs(the Czech Republic, Slovakia, Slovenia, Hungary, and Bulgaria) had mean math and sciencescores above the international average in 1995. Latvia, Romania, and Lithuania all scored wellbelow the average.
Table 3.6 TIMSS Eighth Grade Student Assessment Results for Science and Math for Eight CEECs,1995 and 1999
Mathematics Science1995 mean score 1999 mean score 1995 mean score 1999 mean score
Czech Republic 546 (4.5) 520 (4.2) 555 (4.5) 539 (4.2)Slovak Republic 534 (3.1) 534 (4.0) 532 (3.3) 535 (3.3)Sloverua 531 (2.8) 530 (2.8) 541 (2.8) 533 (3.2)Hungary 527 (3.2) 532(3.7) 537 (3.1) 552 (3.7)Bulgaria 527 (5.8) 511 (5.8) 545 (5.2) 518 (5.4)International average . 519 (0.9) 521 (0.9) 518 (0.9) 521 (0.9)Latvia 488 (3.6) 505 (3.4) 476 (3.3) 503 (4.8)Romama 474 (4.6) 472(5.8) 471 (5.1) 472(5.8)Lithuania 472(4.1) 482 (4.3) 464 (4.0) 488 (4.1)
Note: Standard errors are in parentheses.Sources: International Association for the Evaluation of International Achievement, 2000, TIMSS. 1999: InternationalMathematics Report, December; International Association for the Evaluation of International Achievement, 2000,TIMSS 1999: International Scwnce Report, December.
The Czech Republic's average math and science scores dropped sharply in 1995, butremained well above the international average, and Slovenia's fell slightly. Bulgaria's averagescores in both tests fell very sharply, in both cases falling below the international average.Latvia and Lithuania's average math and science scores improved significantly in 1999, but notenough to take them above the international average. Only Hungary initially succeeded intaking its scores further above the international average (more recent test assessments notreported here show similar signs of quality deterioration).
30 The survey was carried out for a nationally representattve sample of eighth-grade students in 24 countries m 1995and 39 countries in 1999.
- 37 -
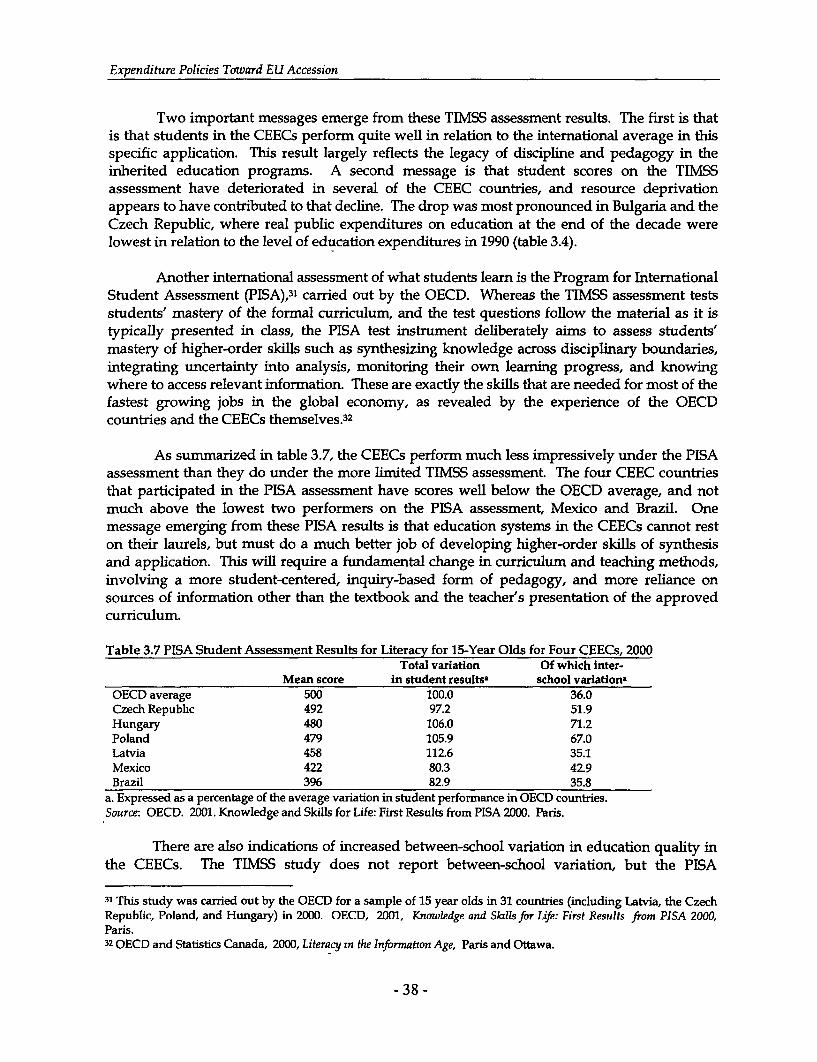
Expenditure Policies Toward EU Accession
Two important messages emerge from these TIMSS assessment results. The first is thatis that students in the CEECs perform quite well in relation to the international average in thisspecific application. This result largely reflects the legacy of discipline and pedagogy in theinherited education programs. A second message is that student scores on the TIMSSassessment have deteriorated in several of the CEEC countries, and resource deprivationappears to have contributed to that decline. The drop was most pronounced in Bulgaria and theCzech Republic, where real public expenditures on education at the end of the decade werelowest in relation to the level of education expenditures in 1990 (table 3.4).
Another international assessment of what students learn is the Program for InternationalStudent Assessment (PISA),31 carried out by the OECD. Whereas the TIMSS assessment testsstudents' mastery of the formal curriculum, and the test questions follow the material as it istypically presented in class, the PISA test instrument deliberately aims to assess students'mastery of higher-order skills such as synthesizing knowledge across disciplinary boundaries,integrating uncertainty into analysis, monitoring their own learning progress, and knowingwhere to access relevant information. These are exactly the skills that are needed for most of thefastest growing jobs in the global economy, as revealed by the experience of the OECDcountries and the CEECs themselves.32
As summarized in table 3.7, the CEECs perform much less impressively under the PISAassessment than they do under the more limited TIMSS assessment. The four CEEC countriesthat participated in the PISA assessment have scores well below the OECD average, and notmuch above the lowest two performers on the PISA assessment, Mexico and Brazil. Onemessage emerging from these PISA results is that education systems in the CEECs cannot reston their laurels, but must do a much better job of developing higher-order skills of synthesisand application. This will require a fundamental change in curriculum and teaching methods,involving a more student-centered, inquiry-based form of pedagogy, and more reliance onsources of information other than the textbook and the teacher's presentation of the approvedcurriculum.
Table 3.7 PISA Student Assessment Results for Literacy for 15-Year Olds for Four CEECs, 2000Total variation Of which inter-
Mean score in student resultsa school variationaOECD average 500 100.0 36.0Czech Republhc 492 97.2 51.9Hungary 480 106.0 71.2Poland 479 105.9 67.0Latvia 458 112.6 35.1Mexico 422 80.3 42.9Brazil 396 82.9 35.8
a. Expressed as a percentage of the average variation in student performance in OECD countries.Source: OECD. 2001. Knowledge and Skills for Life: First Results from PISA 2000. Paris.
There are also indications of increased between-school variation in education quality inthe CEECs. The TIMSS study does not report between-school variation, but the PISA
31 This study was carried out by the OECD for a sample of 15 year olds in 31 countries (including Latvia, the CzechRepublic, Poland, and Hungary) in 2000. OECD, 2001, Knowledge and Slls for Life: First Results from PISA 2000,Paris.32 OECD and Statistics Canada, 2000, Literacy in the Information Age, Paris and Ottawa.
- 38 -

Successfully Integrating with the European Union
assessment does. As shown in table 3.7, there is a greater dispersion of student assessmentresults for three of the four CEECs than for the OECD average. And in three CEECs-not thesame three-much more of the variation in student assessment results is explained by between-school differences than is the case for the OECD average. These greater between-schooldifferences in Hungary, Latvia, and the Czech Republic may reflect the impact ofdecentralization policies that reduced the uniformity in resource provision and content acrossschools that had existed prior to the transition.3 3
None of the internationally comparable student assessments covers higher education.But the quality of higher education has unquestionably suffered in many specializations duringthe 1990s as restrictions on access to higher education were relaxed in response to an enormouspublic demand. In all of the CEECs, enrollments in public institutions have grown much fasterthan budget allocations. As at other levels of education, priority has been given to maintainingteaching positions. Limited budget resources have been available to maintain essential teachingand learning inputs, including laboratory materials and library collections. The few resourcesthat have been available for these purposes in higher education have tended to be used for theacquisition of (IT) hardware and software.
Policy Agenda
Falling secondary coverage in Bulgaria, the Czech Republic, Latvia, Lithuania, andRomania and shrinking expenditures for education in Lithuania, the Slovak Republic, and,especially, Bulgaria present serious risks of "deskilling" the labor force and undermining laborforce productivity and flexibility in the future, as does the thinning of resources for highereducation and research in all of the CEECs. Although there is a need for a more intensive use ofstaff in higher education, as at other levels of education, there is also a conspicuous need formore non-salary recurrent resources to finance educational materials, including laboratory andlibrary materials.
In general, resources need to be redirected and financing and management mechanismschanged to ensure the availability of quality education to the poorest households and localities,and to raise the quality of education at all levels. Some of the necessary resources should comefrom improved efficiency within education systems, particularly in the form of the moreintensive use of teaching staff and the shedding of redundant teachers at all levels. The savingsfrom these efficiency improvements should be used to increase quality. Increased teacherremuneration for a streamlined teaching corps can play a role in inducing improved motivationand teaching effectiveness.
Financing Fornula
Input-based financing formulas are the main reason why the rationalization of schoolnetworks has not made more progress in the transition countries. The current educationfinancing formula in most of the accession countries finances educational inputs; that is,teachers, and sometimes textbooks, other educational materials, and in-service teacher training.
33 Unfortunately, there are no time series data that would allow us to track changes in these variables over time. Butwhatever their time trends and their causes, these sizable between-school differences in what students learn shouldbe a cause for concern in countries that aspire to educate all students to international standards.
- 39 -

Expenditure Policies Toward EU Accession
This financing model provides few efficiency incentives. It ensures financing for all currentschools and teachers, as long as the class size and minimum teaching hour standardsestablished by the education ministry are met. Furthermore, these statutory minimum classsizes and minimum teaching hours are well below OECD norms. In addition, educationministry inspectors can, and often do, provide exceptions that do not meet even these lowstandards.
Not surprisingly, little school optimnization or system rationalization has been carriedout in the CEECs under this model. The little system rationalization that has occurred-as inthe Czech Republic 3 4 -has tended to take place only within schools and not across schools.Organized opposition can easily thwart local governments' attempts to carry outrationalization, as it did in the Czech Republic.
A preferred method for financing education is capitation-based financing, whichdetermines the amount of a local government's educational subsidy based on the number ofstudents it is educating at each level, and differentiated to reflect different costs of differentprograms of education and possibly other sources of cost variation. This approach -used in theCzech Republic and Lithuania-is preferred for two reasons: first, because the basis offinancing-enrolled students-is much doser to the educational objective than are inputs suchas numbers of classrooms and teachers and, second, because it provides an incentive forproviders to rearrange inputs in order to provide education more efficiently.
The capitation approach is not perfect. It does not, by itself, provide safeguards toensure education quality or teaching effectiveness. Neither does it reflect cost differencesamong different programs, place-specific cost factors, or cost differences arising from the speciallearning needs of students. Finally, it does not provide for improvements in curriculum,teaching materials, and teaching practices, all of which are needed in the CEECs.
A composite financing formula (as in table 3.8) may provide for all of these needs.35
Among the CEECs the Czech Republic, the Slovak Republic, and Lithuania have moved fartherin that direction. They finance primary and secondary education through capitation formulaswith some of the elements shown in table 3.8 to reflect cost variations. The Czech Republic alsouses a capitation formula to finance lifelong learning courses offered by universities. Romaniaand Bulgaria calculate per student costs, but do so ex post, and the financing formula remainstherefore essentially input-based and carries the related drawbacks.
34 The Czech school rationalization program successfully consolidated 159 schools and reduced 4,000 jobs, but wassuspended due to the opposition of teachers and local communities.35 Ross, Kenneth, and Rosalind Levacic, eds. 1999. Needs-Based Resource Allocation in Education via FormulaFunding of Schools. International Institute for Education Planning, UNESCO, Paris. Some of the most advancedapplications of this approach are in the Anglo-Saxon countries: the United States, Canada, England, Wales,Australia, and New Zealand.
- 40 -
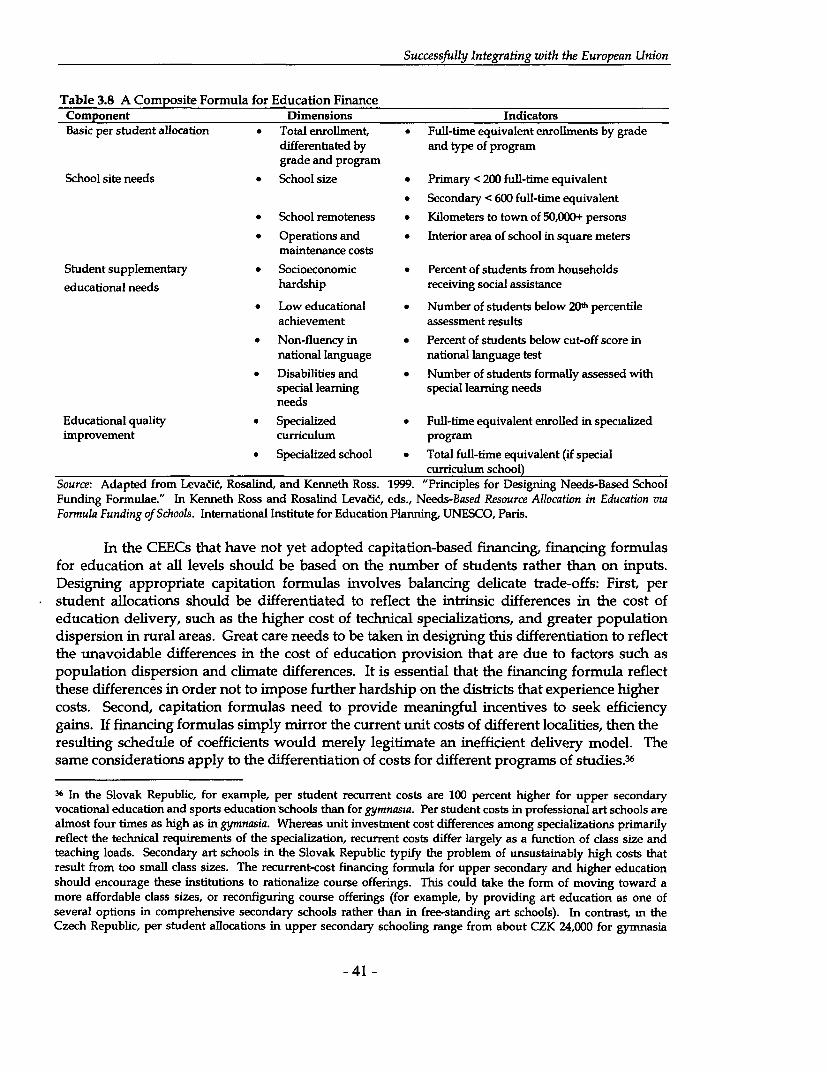
Successfully Integrating with the European Union
Table 3.8 A Composite Formula for Education FinanceComponent Dimensions IndicatorsBasic per student allocation * Total enrollment, * Full-time equivalent enrollments by grade
differentiated by and type of programgrade and program
School site needs * School size * Primary < 200 full-time equivalent
* Secondary < 600 full-time equivalent
* School remoteness * Kilometers to town of 50,000+ persons
* Operations and * Interior area of school in square metersmaintenance costs
Student supplementary * Socioeconomic * Percent of students from householdseducational needs hardship receiving social assistance
* Low educational * Number of students below 20th percentileachievement assessment results
* Non-fluency in * Percent of students below cut-off score innational language national language test
* Disabilities and * Number of students formaly assessed withspecial learning special learning needsneeds
Educational quality * Specialized * Full-time equivalent enroUed in specializedimprovement curriculum program
* Specialized school * Total full-time equivalent (if specialcurriculum school)
Source: Adapted from Levaci, Rosalind, and Kenneth Ross. 1999. "Principles for Designing Needs-Based SchoolFunding Formulae." In Kenneth Ross and Rosalind Levaeic, eds., Needs-Based Resource Allocation in Education viaFormula Funding of Schools. International Institute for Education Planning, UNESCO, Paris.
In the CEECs that have not yet adopted capitation-based financing, financing formulasfor education at all levels should be based on the number of students rather than on inputs.Designing appropriate capitation formulas involves balancing delicate trade-offs: First, perstudent allocations should be differentiated to reflect the intrinsic differences in the cost ofeducation delivery, such as the higher cost of technical specializations, and greater populationdispersion in rural areas. Great care needs to be taken in designing this differentiation to reflectthe unavoidable differences in the cost of education provision that are due to factors such aspopulation dispersion and climate differences. It is essential that the financing formula reflectthese differences in order not to impose further hardship on the districts that experience highercosts. Second, capitation formulas need to provide meaningful incentives to seek efficiencygains. If financing formulas simply mirror the current unit costs of different localities, then theresulting schedule of coefficients would merely legitimate an inefficient delivery model. Thesame considerations apply to the differentiation of costs for different programs of studies. 36
36 In the Slovak Republic, for example, per student recurrent costs are 100 percent higher for upper secondaryvocational education and sports education schools than for gymnasia. Per student costs in professional art schools arealmost four times as high as in gymnasia. Whereas unit investment cost differences among specializations primarilyreflect the technical requirements of the specialization, recurrent costs differ largely as a function of class size andteaching loads. Secondary art schools in the Slovak Republic typify the problem of unsustainably high costs thatresult from too small class sizes. The recurrent-cost financing formula for upper secondary and higher educationshould encourage these institutions to rationalize course offerings. This could take the form of moving toward amore affordable class sizes, or reconfiguring course offerings (for example, by providing art education as one ofseveral options in comprehensive secondary schools rather than in free-standing art schools). In contrast, m theCzech Republic, per student allocations in upper secondary schooling range from about CZK 24,000 for gymnasia
- 41 -

Expenditure Policies Toward EU Accession
A still more advanced approach to formula financing of education is to financeeducational results rather than enrollments. Some of the charter school contracts in the UrLitedStates, for example, condition the payment to private education providers on the achievementof agreed educational targets in terms of learning achievement. The Czech model forsubsidizing private education embodies the same approach. It finances a higher proportion ofrecurrent costs for schools that meet higher quality standards. This approach is likely to growin use as the tools for assessing school performance improve.
Decentralization and Education Finance
Decentralization of education finance in the CEECs has typically involved financingteacher salaries from the state budget but devolving responsibility for school maintenance andthe provision of educational materials (and sometimes even teacher training) to localgovernments. In principle, the decentralization of responsibilities for education finance andmanagement to local governments offers the potential to make the management of educationmore efficient and the content of education more responsive to local needs. It could alsoencourage the mobilization of additional resources for education.
In practice, however, inconsistencies between responsibilities and resources of localgovernments have often frustrated the potential benefits of decentralized educationmanagement in all of the CEECs. In all of the CEECs, local governments are meant to beaccountable to the local community for managing basic education effectively and efficiently.But they sometimes lack the authority to do so because the bulk of financing-for teachers'salaries and benefits-remains centrally controlled in all the CEECs, and because ministries ofeducation retain control over key decisions affecting education delivery. Ministries ofeducation in the CEECs are responsible for curricula, recruitment, evaluation, training, andpromotion of school principals and teachers, and for the establishment of norms governingminimum and maximum class size and teaching hours. These constraints make it impossiblefor local governments to carry out actions that will improve efficiency-such as schoolconsolidation-unless the ministry of education agrees. In most of the CEECs, the ministry ofeducation must approve any proposals for teacher dismissals, school closure, or schoolconsolidation.
In this setting, the actions taken by the CEECs to decentralize education finance andmanagement and to diversify sources of financing have yielded little of the expected benefits,but have led to increased inequality in access and, particularly, in educational quality betweenrich communities and poor communities,3 7 and between rich households and poor households.
and business academies to about CZK 29,000 for technical schools. This relatively narrow spread encourages moreefficient de'avery of technical education. Because any additional costs would need to be financed from local sources,it also encourages local authorities to consider carefully whether technical education programs that cost more thanthis amount are providmg good value to the local community.37 The most systematic differences in education quality in the CEECs are the differences in education qualitybetween urban and rural schools. This gap reflects not only the poorer resource endowment of rural schools, butalso the generally lower qualifications and experience of teachers in rural areas, the poverty of rural households,which makes it hard for them to afford education-related purchases, the lower educational status of rural parents, andthe relative lack of educational stimuli in rural households. Cost differences exacerbate the resource differencesbetween urban and rural areas. Costs of education are higher in rural areas than in urban areas because dispersion of
- 42 -

Successfully Integrating with the European Union
In relying more heavily on financing from households and local communities, they haveaccentuated the pre-existing differences in quality of education and access to education betweenricher and poorer areas. Local governments vary widely in their capacity to mobilize resourcesfrom local taxes and other sources (including parental contributions). Thus, the shifting offinancing responsibilities to local communities and to parents has meant that many householdsare not able to afford textbooks and other essential educational materials for their children, andmany communities are not able to provide essential teaching and learning materials in theirschools, or maintain their schools.
There is a widespread perception in the CEECs that central budget financing of thesalary costs of basic education is a temporary expedient which will eventually be replaced bylocal governments' assuming full responsibility for at least the recurrent costs of primary andsecondary education. There is a major risk that such a move to complete reliance on localfinancing for basic education will lead to very negative consequences for poorer communities -including dosure of schools and the emergence of unacceptable quality differences ineducation. For these reasons, it appears preferable to maintain the central financing of teachersalaries and benefits and other essential recurrent costs of primary and secondary education,including textbooks and teacher training, rather than delegating these to local governments.
The policy adopted in all of the CEECs essentially involves a weak version of thisapproach. This involves identifying a minimum set of essential educational inputs andfinancing them uniformly for all schools from central government resources. For primary andsecondary education, recurrent costs (or at least teacher salaries and benefits) are financed bythe state budget through tied central government grants to local governments that provide nodiscretion in how funds are spent. This formula varies in detail across the CEECs. In general,the financing formula provides for central budget financing of more educational inputs in themore prosperous CEECs than in the less prosperous CEECs. In the Czech Republic, the SlovakRepublic, and Lithuania, for example, the central government budget finances not onlyteachers' salaries but also for school utilities, textbooks, in-service training for teachers, andteacher salaries and benefits for private schools that meet stipulated quality standards. Thisbroad universal financing helps reduce, but does not eliminate, inequality in education.3 8
The risks of inequality in education are greater in those countries that finance onlyteachers' salaries from the central budget and leave other input to local governments or parents.In Bulgaria, for example, the poorest of the CEECs, parents are required to purchase textbooks.This clearly leads to differences in learning and may also affect school attendance. Specializedsecondary education, higher education (apart from the retained income from student fees andother sources), and education for children with special needs is financed centrally in most of theCEECs, as are capital investments for schools. Universal central financing is more effective in
the population leads to small class sizes, large transport costs, or both. Heating and utility costs also tend to behigher for rural schools. Because these intrinsic sources of higher unit costs of education are most prevalent in areaswith the smallest revenue bases, they tend to reinforce the mequality m revenue capacity among localities.
38 For example, Lithuania provides a textbook allocation of LTL 20 (e 5.55) per student, but the actual cost ofsecondary textbooks is about LTL 150 (E 41.60) per year. OECD. 2002. Lithuania, Education and Skills: Revwew ofNational Policiesfor Education. Paris.
- 43 -

Expenditure Policies Toward EU Accession
ensuring that schools continue to operate at the compulsory level despite differences in localcapacity. But to be fully effective, it should be extended to cover textbooks and othereducational materials that are essential to effective education.
Most of the CEECs in principle rely upon local resources to finance essential educationalinputs, and provide compensatory support through targeted subsidies to localities that couldnot otherwise afford to provide education of an acceptable quality. This targeting approach isalso used in the United States, where the investment and recurrent costs of primary andsecondary education are essentially locally financed, but state and federal subsidies areprovided to communities with limited revenues and communities that face unusually high costsof education for children with disabilities or special learning needs.
To some extent, equalization grants serve this purpose in the CEECs. But equalizationgrants are effective in ensuring that basic educational needs are met because they are untied,and thus can be used by local governments for other purposes. Tied grants would be moreeffective in ensuring that basic educational needs of poor communities are met. But thispurpose could more logically be met by the tied (categorical) grants that are provided to localgovernments for specific education expenditures.
The Problem of Excessively Small Local Governments
The small size of local government jurisdictions is leading to serious problems in themanagement of education in the CEECs. Many local governments are too small to supportschools that provide a reasonable critical mass and economies of scale, and too small to carryout effective system rationalization through school consolidation and school closure. Romaniahas 263 towns and municipalities and 2,688 communa that are eligible to receive centralgovernment transfers under the country's decentralization program. Hungary is the mostfragmented of the CEECs, with 3,147 local governments, of which 2,443 operate schools. Somelocal governments in Hungary find it difficult to maintain primary schools, and some haveclosed their schools since the enactment of the Law on Local Self-Government. 3 9
To address the problems of economies of scale of very small municipalities, the CzechRepublic is in the process of establishing regional-level management for schools. This approachcould help rationalize the allocation and use of education resources in the other CEECs withlocal governments that are too small to capture the efficiency gains of larger management units.Per student financing can also help address this problem, since the allocation can easily betransferred with students who attend schools in other jurisdictions. This is being done inLithuania, for example, where a new financing formula provides for a "student basket" ofinputs for each type of program, which can be transferred when students attend schools outsidetheir own locality.
39 In principle, county governments are responsible for managing secondary schools in Hungary, but localgovernments may also run secondary schools. In 1993, the Hungarian Ministry of Education established eightRegional Educational Directorates. These Regional Directorates were expected to oversee educational programs atthe regional level, but the Law on Local Self-Government gives such primacy to local governments that it provedimpossible to give these regional bodies a substantive role. They were subsequently dissolved.
- 44 -

Successfully Integrating with the European Union
Reorienting Education to Global Knowledge Needs
Finally, the disappointing PISA assessment results for four of the more advanced CEECsindicate a problem regarding how students learn and what students learn. A fundamentalchange in the orientation of education is needed in order to support global competitiveness inthe CEECs. A recent presentation to the OECD Governing Board described the nature of thosechanges. 40 Effective education systems will need to teach the following:
* Meta-cognitive abilities and skills; that is, thinking about how to think andlearning how to learn.
* The ability to integrate formal and informal learning, declarative knowledge (orknowing that) and procedural knowledge (or knowing how).
* The ability to access, select, and evaluate knowledge in an information-rich world.
* The ability to develop and apply diverse forms of intelligence.
* The ability to learn and work effectively in teams.
* The ability to create, transpose, and transpose knowledge.
* The ability to cope with ambiguous situations, unpredictable problems, andunforeseen circumstances.
* The ability to cope with multiple careers; that is, learning how to "redesign"oneself, locate oneself in a job market, and choose and fashion the relevanteducation and training for oneself.
All the CEECs have stated an intention to reform their education systems to improve thequality and relevance of education programs. This is a long-term endeavor, requiringfundamental changes in all educational inputs, including developing improved curricula,textbooks, and teacher training programs; using student assessment as a tool of performanceevaluation; developing streamlined vocational training prograrns, lifelong learning programs,and the accreditation of higher education institutions and programs; improving universityentrance examinations; and providing more supportive role for the inspectorate. Althoughthere has been some progress, it will be several years before these educational reforms bearfruit.
Currticulum
The financing and decentralization measures that have been implemented in the CEECsduring the past decade are making it harder to bring about reforms in education programs. InHungary, for example, curriculum formulation has been highly decentralized, which makes itdifficult to assess or replicate the gains of innovation introduced at the local level.41 Slovenia
40 Presentation by Professor David Hargreaves, Cambridge University, to the OECD CERI Governing Board, March24, 2000.41 Halasz, Gabor. 2000. "System Regulation in School Education in Hungary." Report. National Institute of PublicEducation, Budapest
- 45 -

Expenditure Policies Toward ELU Accession
alone among the transition countries is reforming its curriculum under a centralized process,42
which should facilitate the introduction of reforms.
Central governments in the CEECs will need to play an active role in promoting themodernization of education systems. One approach is to provide a specific allocation infunding formulas, such as the allocation for research and development in the Czech financingformula for higher education institutions. This method is prone to waste, however, because itdoes not require the recipient institution to demonstrate the relevance of the action. A preferredapproach is a competitive process that requires each institution to demonstrate the relevance ofthe proposed innovation. An example is Romania's central program for supporting curriculuminnovation in higher education. This competitive approach is also the main method used forallocating federal financing for scientific research in the United States.
Reforn of Vocational Education and Developing Lifelong Learning
Vocational education in the-CEECs is in crisis; that is, struggling to cope with dwindlingenrollments, increasingly irrelevant curricula, and a major loss of enterprises that are able toprovide on-the-job training to students. The reform of vocational education needs to accelerate.The increasing share of secondary general education should be welcomed rather than resisted,since general education provides greater flexibility than specialized vocational education andsince many of the skills provided in good programs of general education (such as foreignlanguage skills, math, science, problem-solving, and teamwork) are exactly the skills mostneeded in the global economy. Governments should not attempt to predetermine the shares ofstudents opting for general secondary education and vocational secondary education, butshould provide parents and students with better information about the career implications ofthese choices, and should adjust the capacity of these programs to accommodate publicpreferences.
At the same time, the existing programs of vocational education need to be restructuredinto fewer specializations for clusters of kindred occupations that draw upon the same basiccompetencies. Some of the CEECs have made a strong start in transforming their vocationaleducation systems in this direction. Hungary's reform of vocational education provides a goodexample of how this might be carried out. It involves reducing the number of vocationalspecializations, increasing their science and mathematics content, developing new vocationalcurricula based on prevailing industry practice, and developing lifelong learning programsoffered in a new network of Regional Labor Development and Training Centers.43
Another approach is to encourage the provision of lifelong learning opportunitiesthrough employer-provided or privately provided training as in the French vocational traininglevy. This method can mobilize significant financing, but it entails the disadvantage of raisingemployer costs and thus discouraging job creation. A less interventionist and more
42 Halasz, Gabor, and Herbert Altrtchter. 1999. "Comparative Analysis of Decentralization Policies and Their Resultsin Central European Countries." National Institute of Public Education, Budapest43 These centers were developed under the Ministry of Labor with the intention that they would become self-managed and self-financing. This goal has not been fully achieved. With the dissolution of the Hungarian Ministryof Labor in 1998, these centers were temporarily assigned to the Ministry of Education. This move entails a risk ofcompromising the centers' close links with employers.
-46 -

Successfully Integrating with the European Union
employment-friendly approach is the Anglo-Saxon model of tax incentives for employer-provided training. This model works well in the United States, where employers invest heavilyin training in order to remain competitive.
Financing Quality Higher Education
Higher education needs to continue to develop in order to meet the needs forinvestment-driven growth and to support the CEECs' move toward innovation-driven growth.For this purpose, higher education programs need serious investments to improve quality.Improved laboratories and stocks of materials play an important role in quality improvementfor the sciences. More generally, major investments are needed to update and restockuniversity library facilities with up-to-date journal collections and computer-based researchtools. These investments to diversify sources of information are crucial if higher educationsystems in the CEECs are to gain access to the latest developments in knowledge and to supporta more inquiry-based form of teaching and learnuing. These investments are also costly.
In a situation of constrained budgets, how can the CEECs afford to make theseimprovements while enrollments continue to expand? The first candidate for action is moreintensive use of teaching staff through increasing minimum teaching hours so that they aremore consistent with standards in the OECD countries. Another simple measure, adopted byall the CEECs, is to allow higher education institutions to generate and retain income throughthe provision of professional services. This can help develop links between academia and theeconomy, but it needs to be implemented judiciously in each institution order to prevent theincome-earning role from displacing the roles of education and research.
Another measure to mobilize financing is cost recovery in the form of student fees.There are widely varying approaches to the collection of student fees in higher education. TheCzech Republic has resisted imposing student fees in higher education, and the Slovak Republicallows student fees only for part-time courses (highly demanded in new areas such as IT).
A basically different approach is to restrict state budget financing to either the mostcapable institutions or the most capable students. A number of CEECs (including Estonia,Latvia, Romania, and Bulgaria) have selectively applied student cost recovery under whichstudents who score highest on the university entrance examinations are financed by the statebudget, while students who receive lower scores (but still high enough to gain entry to theirpreferred institutions) are admitted as "contract" students, and pay fees intended to recover thefull cost of their education. This system of cost recovery for contract students is equivalent tooperating lower-quality private universities within public universities. Where the number ofcontract students is large enough, it sometimes takes the form of separate classes for contractstudents.
Cost recovery through student fees tends to discourage attendance by capable studentsfrom poor households. This problem can be mitigated, but not eliminated, by combiningstudent fees with a means-tested scholarship scheme or a student loan scheme. But in order toperform this role effectively, student loan schemes need either budget-financed interestsubsidies or effective linkage to future earning streams (as attempted by Hungary). Neither ofthese approaches addresses the bias that results from the fact that students from higher-income
- 47 -
Expenditure Policies Toward EU Accession
families are more able to afford private tutoring and the informal fees to attend better schools,and thus to obtain higher scores on their university entrance examinations and free admissionto the higher education programs of their choice.
An alternative is to apply budget selectivity at the institution level. This amounts totriage: Public budget financing is restricted to the leading universities that are financed amplyas centers of excellence, with other institutions of higher education finding their own financingand establishing their own standards of quality. This can be an effective approach, as the U.S.model of parallel public and private higher education institutions demonstrates, but an effectiveaccreditation system is necessary for this model to function without creating false expectationson the part of the public.
Accreditation should play a key role in monitoring quality and establishingaccountability for higher education institutions. Accreditation provides the metric by whichstudents, parents, and the institutions themselves can judge their performance. Most of theCEECs aspire to develop an accreditation capacity as an instrument of quality assurance forboth public and private higher edtucation institutions. This work is at an early stage in most ofthe CEECs. Romania has recently developed accreditation standards for higher educationinstitutions that led to the closure of a number of the private universities that had been createdduring the 1990s.
Concluding Remarks
The CEECs need to speed up the redeployment of expenditure in response to thedemand for structural changes in education arising from the passage of the "baby bust" and thenew skills requirements of the global economy. The feeble incentive for efficiency conveyed bythe prevailing input-based financing formula and, in many countries, the small size of localjurisdictions in charge of schools have hindered the process. As a result, both the generally highquality and the accessibility of education are beginning to slip away. New policy patterns areemerging, however, that emphasize composite capitation formulas for school financing at thenational level and the assignment of education management to larger jurisdictions.
Disappointing results on standardized international aptitude tests have also calledattention to the need for education systems to better develop the higher order of skills neededfor most of the fastest growing jobs in the global economy. National governments will need toexercise greater leadership in bringing about curriculum reform (as in Slovenia), to consolidateprograms of vocational education into fewer specializations for dusters of kindred occupations(Hungary providing a good example), and to define appropriate mechanisms to finance thequality higher education that is needed to support the CEECs' move to innovation-drivengrowth. This may involve concentrating state budget financing on either the most capableinstitutions or the most capable students, and letting (duly accredited) private institutions,financed through tuition payments, look after the rest of the sector.
- 48 -
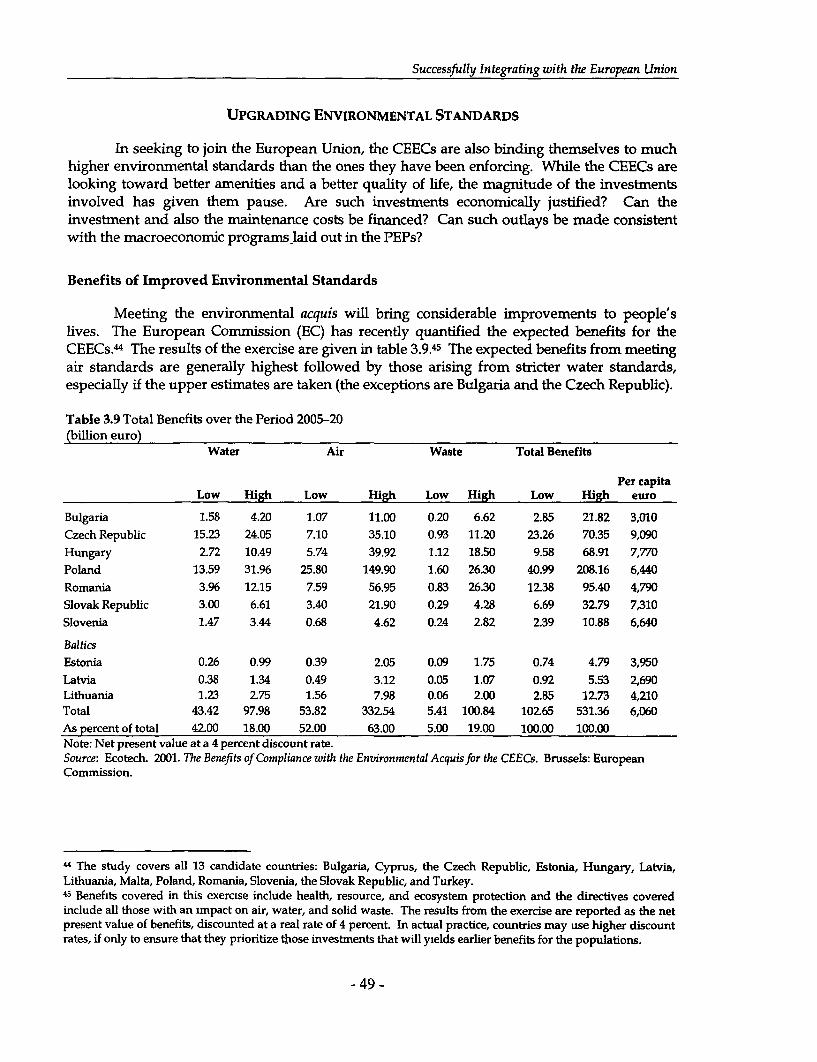
Successfully Integrating with the European Union
UPGRADING ENVIRONMENTAL STANDARDS
In seeking to join the European Union, the CEECs are also binding themselves to muchhigher environmental standards than the ones they have been enforcing. While the CEECs arelooking toward better amenities and a better quality of life, the magnitude of the investmentsinvolved has given them pause. Are such investments economically justified? Can theinvestment and also the maintenance costs be financed? Can such outlays be made consistentwith the macroeconomic programs-laid out in the PEPs?
Benefits of Improved Environmental Standards
Meeting the enviromnental acquis will bring considerable improvements to people'slives. The European Commission (EC) has recently quantified the expected benefits for theCEECs.44 The results of the exercise are given in table 3.9.45 The expected benefits from meetingair standards are generally highest followed by those arising from stricter water standards,especially if the upper estimates are taken (the exceptions are Bulgaria and the Czech Republic).
Table 3.9 Total Benefits over the Period 2005-20(billion euro)
Water Air Waste Total Benefits
Per capitaLow High Low High Low High Low High euro
Bulgaria 1.58 4.20 1.07 11.00 0.20 6.62 2.85 21.82 3,010Czech Republic 15.23 24.05 7.10 35.10 0.93 11.20 23.26 70.35 9,090Hungary 2.72 10.49 5.74 39.92 1.12 18.50 9.58 68.91 7,770Poland 13.59 31.96 25.80 149.90 1.60 26.30 40.99 208.16 6,440Romaria 3.96 12.15 7.59 56.95 0.83 26.30 12.38 95.40 4,790Slovak Republic 3.00 6.61 3.40 21.90 0.29 4.28 6.69 32.79 7,310Slovenia 1.47 3.44 0.68 4.62 0.24 2.82 2.39 10.88 6,640
BalticsEstonia 0.26 0.99 0.39 2.05 0.09 1.75 0.74 4.79 3,950Latvia 0.38 1.34 0.49 3.12 0.05 1.07 0.92 5.53 2,690Lithuania 1.23 2.75 1.56 7.98 0.06 2.00 2.85 12.73 4,210Total 43.42 97.98 53.82 332.54 5.41 100.84 102.65 531.36 6,060As percent of total 42.00 18.00 52.00 63.00 5.00 19.00 100.00 100.00Note: Net present value at a 4 percent discount rate.Source: Ecotech. 2001. The Benefits of Compliance vith the Environmental Acquisjfr the CEECs. Brussels: EuropeanCommission.
44 The study covers all 13 candidate countries: Bulgaria, Cyprus, the Czech Republic, Estonia, Hungary, Latvia,Lithuania, Malta, Poland, Romania, Slovenia, the Slovak Republic, and Turkey.45 Benefits covered in this exercise include health, resource, and ecosystem protection and the directives coveredinclude al those with an Impact on air, water, and solid waste. The results from the exercise are reported as the netpresent value of benefits, discounted at a real rate of 4 percent. In actual practice, countries may use higher discountrates, if only to ensure that they prioritize those investments that wiU yields earlier benefits for the populations.
- 49 -
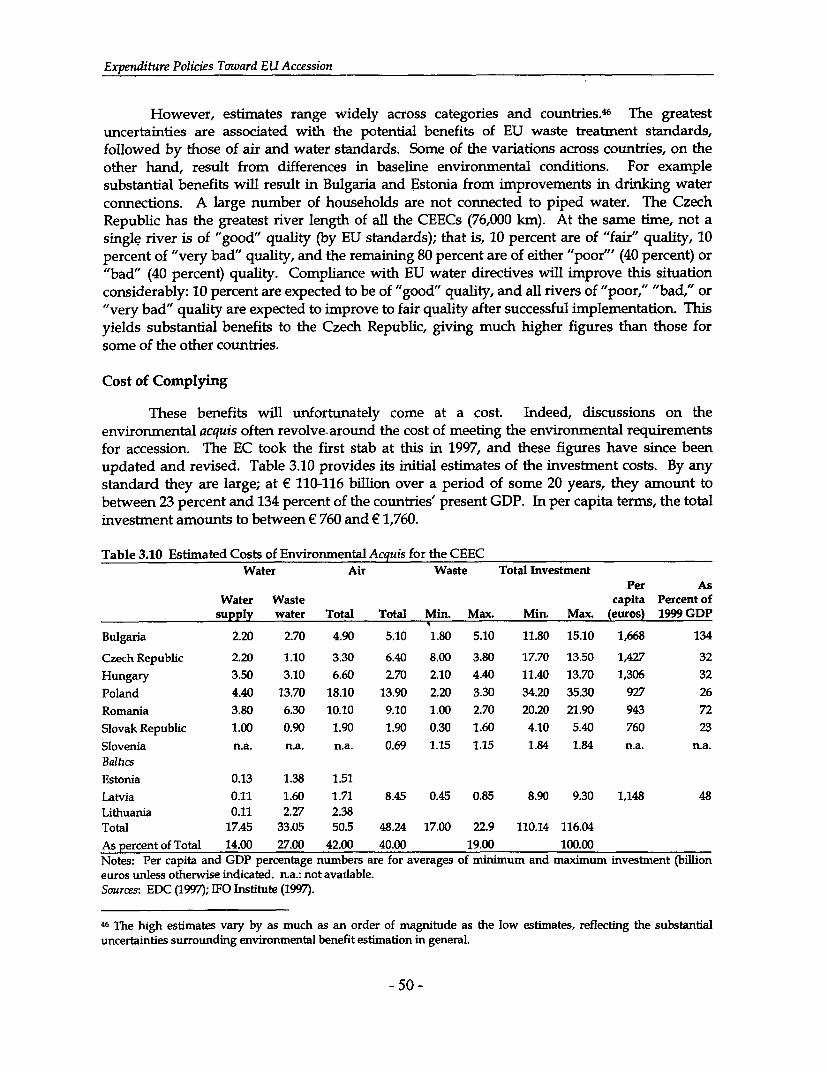
Expenditure Policies Toward EU Accession
However, estimates range widely across categories and countries.46 The greatestuncertainties are associated with the potential benefits of EU waste treatment standards,followed by those of air and water standards. Some of the variations across countries, on theother hand, result from differences in baseline environmental conditions. For examplesubstantial benefits will result in Bulgaria and Estonia from improvements in drinking waterconnections. A large number of households are not connected to piped water. The CzechRepublic has the greatest river length of all the CEECs (76,000 km). At the same time, not asingle river is of "good" quality (by EU standards); that is, 10 percent are of "fair" quality, 10percent of "very bad" quality, and the remaining 80 percent are of either "poor"' (40 percent) or"bad" (40 percent) quality. Compliance with EU water directives will improve this situationconsiderably: 10 percent are expected to be of "good" quality, and all rivers of "poor," "bad," or"very bad" quality are expected to improve to fair quality after successful implementation. Thisyields substantial benefits to the Czech Republic, giving much higher figures than those forsome of the other countries.
Cost of Complying
These benefits will unfortunately come at a cost. Indeed, discussions on theenvironmental acquis often revolve-around the cost of meeting the environmental requirementsfor accession. The EC took the first stab at this in 1997, and these figures have since beenupdated and revised. Table 3.10 provides its initial estimates of the investment costs. By anystandard they are large; at f 110-116 billion over a period of some 20 years, they amount tobetween 23 percent and 134 percent of the countries' present GDP. In per capita terms, the totalinvestment amounts to between e 760 and £ 1,760.
Table 3.10 Estimated Costs of Environmental Acquis for the CEECWater Air Waste Total Investment
Per AsWater Waste capita Percent of
supply water Total Total Min. Max. Min. Max. (euros) 1999 GDP
Bulgaria 2.20 2.70 4.90 5.10 1.80 5.10 11.80 15.10 1,668 134
Czech Republic 2.20 1.10 3.30 6.40 8.00 3.80 17.70 13.50 1,427 32Hungary 3.50 3.10 6.60 2.70 2.10 4.40 11.40 13.70 1,306 32Poland 4.40 13.70 18.10 13.90 2.20 3.30 34.20 35.30 927 26Romania 3.80 6.30 10.10 9.10 1.00 2.70 20.20 21.90 943 72Slovak Republic 1.00 0.90 1.90 1.90 0.30 1.60 4.10 5.40 760 23Slovenia n.a. n.a. n.a. 0.69 1.15 1.15 1.84 1.84 n.a. n.a.BaltzcsEstonia 0.13 1.38 1.51Latvia 0.11 1.60 1.71 8.45 0.45 0.85 8.90 9.30 1,148 48Lithuania 0.11 2.27 2.38Total 17.45 33.05 50.5 48.24 17.00 22.9 110.14 116.04As percent of Total 14.00 27.00 42.00 40.00 19.00 100.00Notes: Per capita and GDP percentage numbers are for averages of minimum and maximum investment (billioneuros unless otherwise indicated. n.a.: not avallable.Sources: EDC (1997); IFO Institute (1997).
46 The high estimates vary by as much as an order of magnitude as the low estimnates, reflecting the substantialuncertainties surrounding environmental benefit estimation in general.
- 50 -
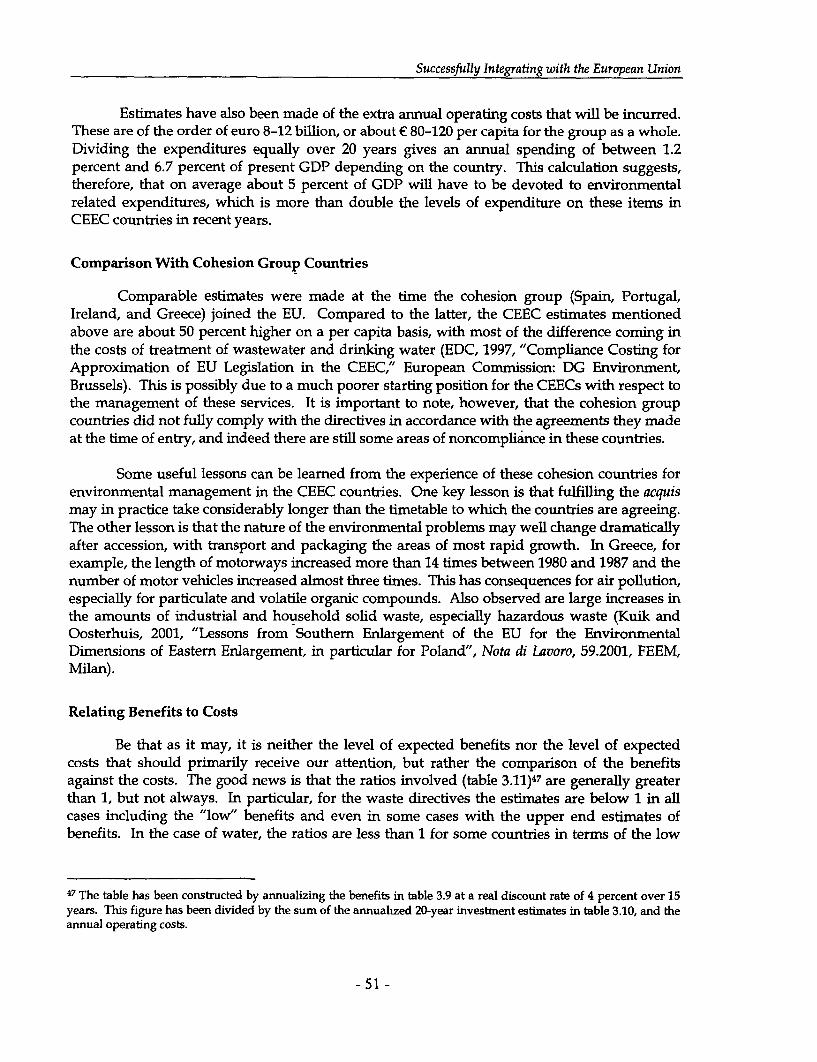
Successftdly Integrating with the European Union
Estimates have also been made of the extra annual operating costs that will be incurred.These are of the order of euro 8-12 billion, or about e 80-120 per capita for the group as a whole.Dividing the expenditures equally over 20 years gives an annual spending of between 1.2percent and 6.7 percent of present GDP depending on the country. This calculation suggests,therefore, that on average about 5 percent of GDP will have to be devoted to environmentalrelated expenditures, which is more than double the levels of expenditure on these items inCEEC countries in recent years.
Comparison With Cohesion Group Countries
Comparable estimates were made at the time the cohesion group (Spain, Portugal,Ireland, and Greece) joined the EU. Compared to the latter, the CEEC estimates mentionedabove are about 50 percent higher on a per capita basis, with most of the difference coming inthe costs of treatment of wastewater and drinking water (EDC, 1997, "Compliance Costing forApproximation of EU Legislation in the CEEC," European Commission: DG Environment,Brussels). This is possibly due to a much poorer starting position for the CEECs with respect tothe management of these services. It is important to note, however, that the cohesion groupcountries did not fully comply with the directives in accordance with the agreements they madeat the time of entry, and indeed there are still some areas of noncompliance in these countries.
Some useful lessons can be learned from the experience of these cohesion countries forenvironmental management in the CEEC countries. One key lesson is that fulfilling the acquismay in practice take considerably longer than the timetable to which the countries are agreeing.The other lesson is that the nature of the environmental problems may well change dramaticallyafter accession, with transport and packaging the areas of most rapid growth. In Greece, forexample, the length of motorways increased more than 14 times between 1980 and 1987 and thenumber of motor vehicles increased almost three times. This has consequences for air pollution,especially for particulate and volatile organic compounds. Also observed are large increases inthe amounts of industrial and household solid waste, especially hazardous waste (Kuik andOosterhuis, 2001, "Lessons from Southern Enlargement of the EU for the EnvironmentalDimensions of Eastern Enlargement, in particular for Poland", Nota di Lavoro, 59.2001, FEEM,Milan).
Relating Benefits to Costs
Be that as it may, it is neither the level of expected benefits nor the level of expectedcosts that should primarily receive our attention, but rather the comparison of the benefitsagainst the costs. The good news is that the ratios involved (table 3.11)47 are generally greaterthan 1, but not always. In particular, for the waste directives the estimates are below 1 in allcases including the "low" benefits and even in some cases with the upper end estimates ofbenefits. In the case of water, the ratios are less than 1 for some countries in terms of the low
47 The table has been constructed by annualizing the benefits in table 3.9 at a real discount rate of 4 percent over 15years. This figure has been divided by the sum of the annualhzed 20-year investment estimates in table 3.10, and theannual operating costs.
- 51 -

Expenditure Policies Toward EU Accession
benefits (Bulgaria, Hungary, Romania, Estonia, and Latvia). In the case of the air directivesthere is only one case of benefits below 1 (Bulgaria).
These estimates must, however, be interpreted with some care. First, an overall ratio ofgreater than one does not imply that (a) the net benefits of all projects will be greater than one,(b) the ratio cannot be increased by delaying the implementation of some of the directives insome places, and (c) the distributional and social costs of implementing the directives mayoutweigh the assessment based on the ratios presented. Indeed, for the reasons given in thisnote, that is likely to be so in a number of cases. It does point, therefore, to the need to carry outa careful benefit/cost analysis of the implementationfur each investment.
Table 3.11 Ratio of Benefits to Costs of Complying with Environmental DirectivesWater Air Waste Total Benefits
Low High Low High Low High Low High
Bulgarna 0.73 1.94 0.26 2.64 0.08 0.40 0.20 0.85Czech Republic 10.43 16.48 1.36 6.70 0.08 0.91 1.06 2.92Hungary 0.93 3.59 2.60 18.07 0.36 1.30 0.63 9.16Poland 1.70 3.99 2.27 13.18 0.49 2.46 0.98 13.12Romania 0.89 2.72 1.02 7.65 0.56 3.01 0.51 9.11Slovak Republic 3.57 7.87 2.19 14.09 0.66 0.83 1.37 10.55Slovenia n.a. n.a. 1.20 8.18 0.14 0.76 1.06 4.45
Balhcs
Estonia 0.39 1.48Latvia 0.50 1.77 8.08 49.71 0.30 3.85 0.28 1.27Lithuania 1.17 2.61Total 1.94 4.39 2.41 14.89 2.67 13.51 0.73 3.23Source: Own calculations based on previous tables.
How Trade-Offs Can Be Improved
The total cost figure is valuable only to give some idea of the overall size of the task.What is more important for the countries is to prepare detailed plans, covering periods of threeto five years, that ensure compliance with the agreements arrived at under the environmentalchapter and to do so in a way that minimnizes the costs as well as ensuring that the underlyingfinancing arrangements are sustainable.
Indeed, while the acquis communautaire is prescriptive on environmental standards, itleaves considerable latitude on how to meet them. The price of complying varies accordingly.By way of illustration, table 3.12 gives some more recent alternative estimates, partly based onthe World Bank's work and partly on the firming up of estimates by other parties that areconsiderably lower than the earlier ones. The more detailed studies such as the ISPA strategyfor Lithuania come up with figures that are as much as 75 percent lower than the earliercalculations. The World Bank's Bulgaria study gives figures about half those of the earlier ECstudy.
- 52 -
Successftlly Integrating with the European Union
Table 3.12 Alternative Estimates of Investment Costs for Compliance(billion euros)
Country EC 1997 estimate Other estimatesBulgariaa 11.8-15.1 5.5-8.0Polandb 34.2-35.3 17.0; 19.0-39.0Lithuamac 2.38 0.64
a. Based on Bucknall, Cestti and Damianova, 2001, "Bulgaria: The Challengesof Complying with EU Enviromnental Directives," ECSSD Working Paper 30, World Bank.b. Euro 17 billion is from a second EC study, TME (Institute for Applied Environmental Economics),Cost of Compliance with EU Environmental Directives in Poland: Paper for Seminar 10-3-1999 atthe Polhsh Ministry of Environmental Protection, March 1999. Range of euro is from World Bankstudy (Gordon, Hughes, and Julia Bucknall. 1999. "Poland: Complying with EU Legislation."ECSSD Working Paper 14, World Bank, Washington, D.C.).c. Estimate is only for water. "Other estimate" is based on Lithuania National ISPA strategy (2001).
Savings can be achieved in a number of ways:48
* Following a least-cost investment plan, especially in energy-related investments.This in turn can be promoted by the use of economic instruments such as bubblesand permit trading.
* Efficiency with which municipalities make investment decisions. Opening upprocurement to international tender and undertaking careful project appraisal inevaluating the design of the schemes will reduce costs significantly.
* Designing the investments to take account of the lower demand for some serviceswhen future service charges will have to recover capital and operating costs. TheWorld Bank has had stark experience of this in the wastewater projects it funded inthe Baltic states, where the level of capacity is turning out to be substantially inexcess of demand as a result of the large increase in volume based charges (box3.1).
48 Total costs may also fall over time, as manufacturers drop their prices for capital equipment in response to largerlevel of production (Hager, 2000, 'Environmental Investment in the CEEC preparing for Accession", mimeo, WorldBank).
- 53 -

Expenditure Policies Toward EU Accession
Box 3.1 Bank Experience with Water Utilities in the Baltic States
The World Bank has provided financing for five water and wastewater projects in the Baltics: one in Estonia,two in Latvia, and two in Lithuania, with a total cost of US$134 million. The upgraded plants are now inoperation and the wastewater meets Helsinki Commission standards (HELCOM protects the Baltic marineenvironment as mandated under the Helsinki Convention) and the drinking water meets the highest standards.While the projects have been successful with respect to many criteria, one of the most serious problems hasbeen the drop in demand for water and the generation of wastewater. The projects were planned assumingthat the demand would stabilize at a moderate level of consumption similar to that experienced in othercomparable countries. In fact this has not materialized and the actual level has been as much as 50 percentlower than anticipated. This extreme decline in demand has led to:
* Over dimensioning of systems• Over investment in systemso Higher than optional O&M cost• Water quality problems in potable water networks
The key lesson learned is that, while drafting the financial and economic projections, the project teams shouldbe conservative in their assumptions of critical variables, which have the highest impact on revenues and costs.These tend to be too optimistic, and in the long run the projects are likely to experience lower than anticipatedeconomic and financial rates of return. Project appraisal should ensure that the assumptions are realistic andthat contingency plans are drawn for coping with deviations from the most likely outcomes. The range ofpossible outcomes with their respective probabilities, although subjective, should be listed in the appraisaldocument.
Price escalations also tend to be greater than expected (in real terms) owing to elimination of existing marketdistortions and price disequilibria, which were present in the economies during the early transition process.ThLs is also an important reason for the dramatic reduction in water sales. Tariffs have had to increase morethan anticipated.
* New investments are likely to reduce total operating costs, because the operationand maintenance costs of new equipment will be lower than that of the equipmentit replaces. This gain has not been fully accounted for in the above figures.
* Present value of total costs will fall if the more expensive items are scheduledfurther away in time. This approach would be all the more justifiable when theensuing benefits are comparatively low.
* Environmental mitigation costs may not expand at the same pace as income. Withgrowth and convergence, countries should therefore be better able to meet theacquis. The demand for services such as energy and transport, and the relatedcosts, are likely to rise in tandem, but the demand for services such as water maynot increase proportionately. The resulting increase in total costs may thereforewell be less than the growth in national income.
* Relaxing statutory standards (particularly for water treatment), if it can be shownthat the investment is seriously uneconomic (for example, if the community servedwill decline dramatically in the next few years) and that the savings in costs byreducing the attainment level by a small percentage will allow more plants to be
- 54 -

Successfully Integrating with the European Unwon
built and a higher overall contribution made to meeting the ambientenvironmental goals.49
Negotiations on the Envirornment Chapter
Those countries that have closed the environment chapter have made commitments tocomplying with the acquis by agreed dates. The highest priority in all cases has been given tolegal approximation, ensuring that the national legal framework is consistent with the EUlegislation. Next in priority has been the institutional strengthening of supervisory bodies andenvironmental agencies. All this is expected to be completed before accession. The investmentprogram necessary for compliance has a completion date of around 2015, with interim targetsfor key directives. For example, in the case of Lithuania the directive on the sulfur content ofpetrol and diesel has to be complied with by 2005, the Large Urban Wastewater Directive by2010, and so on. At the start of the negotiations the country asked for eight transitional periods,but in the course of negotiations it withdrew its request for five of them and shortened the otherthree.
Even with these transitory periods, the agreed schedules may be difficult to implement.This is principally because a large part of the accession negotiation took place before, orconcurrent with, the implementation of the benefit assessment study mentioned above. Therewas also probably a feeling that the environment chapter could be renegotiated later. In thatevent, a more careful assessment of the costs and benefits as outlined here could play a usefulrole.
Funding Environrental Investments
Although a number of CEECs have now concluded the environmental chapter of thenegotiations, it is fair to say that they have not fully established how these investments will befunded. Indeed, there are ongoing concerns in the front line CEEC countries about theavailability of co-financing from the national budget to match the EU accession funds availableunder ISPA, PHARE (Assistance for Economic Reconstruction), and SAPARD (SpecialAccession Program for Agriculture and Rural Development). Indeed, the slow rate ofdevelopment of projects for such funding can be partly attributed to this factor (as well as to thelack of administrative capacity to implement the acquis).
The problem that many countries are having in meeting the local cost share ofinvestments is unlikely to be solved merely by increasing the allocation from the public budgetfor the environment. Other solutions must also be found.
In most of the CEECs one source of public sector finance for the environment has beenthrough a number of environmental funds. These funds receive their payments from pollutionfees and charges, including payments for noncompliance. The funds are used to pay forenvironmental services (such as monitoring and research and development) as well as for someinvestment in pollution abatement at the enterprise and municipal level. While they have
49 Marginal costs of standards rise with the standards themselves, and it holds par excellence in the areas ofwastewater treatment.
- 55 -

Expenditure Policies Toward EU Accession
played an important role in some countries in the post-transition period, there have been somedoubts as to the efficiency with which funds are allocated, and the future does not lookpromising for them as a vehide for environmental finance. Principally, this is because theirconsistency with the EU institutions is not clear.
Poland, which has closed the environmental chapter in its negotiations, is looking intoenvironmental funds carefully. The concern is that enterprises will seek legal exemption frompayment of "pollution charges" if the same changes are not imposed on their competitors in theEU. If this challenge is successful, then the revenue source of the fund will disappear. Sinceearmarking of this kind is not favored as a means of financing public expenditures (with theexception of payments for specific services, such as monitoring) and is rarely used in the EU,further difficulties can be expected with its continued existence in the CEECs.50
The scope for moving some items out of the public budget is also quite large.51 As far asinvestment in the manufacturing industry is concerned, the more of the sector that is privatized,the less will be the burden of the acquis on the public budget. In this regard, experience hasshown that successful privatization of some of the larger and more polluting industries requiresa clear understanding of the liability for past environmental damages, through aninternationally acceptable audit, accompanied by a legal agreement with the government as tothe new owner's responsibility for clean-up.
If internationally credible investors are to be attracted into bidding for such enterprisesthen these issues have to be addressed. Furthermore, the state's responsibilities have to bebacked by a credible program of investment in remediation. Otherwise the uncertainty on theprivate party's side will result in a failure-to bid, or in an offer that reflects the increased risk.This illustrates a situation in which it may pay for the state to undertake investment inremediation with a view to making the privatization effort more successful and generatinghigher revenues from the sale of state assets.
The same is true to a large extent of public utilities and infrastructure. A Czech studyshowed that as much as half the big-ticket items could be shifted out of the public budget undercertain assumptions. 52 To date, however, the detailed national plans for the adoption of theacquis paid limited attention to the role of the private sector, and there has been mixed progresson the ground. Hungary has totally transferred power generation to the private sector, whilePoland moved 9 of its 27 generation stations into private hands, and other countries movednone.53 Fortunately, as noted in chapter 1, the movement is gathering pace.
50 From the perspective of the international financial institutions, extrabudgetary earmarked funds are notencouraged. The IMF and the World Bank have almost always asked for the eco-fund to be part of the consolidatedbudget.51 The increased level of private sector activity implies a greater effort by the state to ensure compliance. This in turnrequires mvestment in capital equipment for monitoring and testing, etc. Funding for this can be obtained fromISPA, if the demands can be bundled to meet the 65 million threshold.52 Czech Republic, "Towards the Accession", Main Report, A World Bank Country Study, The World Bank,Washington, DC. 1999.53 A comprehensive status of privatization in the energy and utility sectors for the CEEC countries does not appear tobe available and is being prepared by the Bank.
- 56-

Successfully Integrating with the European Union
Privatization is not, however, the only way of sharing the burden of upgradingenvironmental standards. Another is to commercialize the enterprises even when they arenominally state-owned, and to raise the finance for the investment through commercial loans.This strategy is being followed widely in all the CEEC countries. It was successfully adopted,for example, by Poland in the power generation sector. Even before the privatization of thenine units referred to above, the financing for investing in pollution control equipment camefrom commercial loans, backed by power purchasing agreements between the commercializedgenerating units and the state electricity authority. The same strategy has been adopted inmunicipalities dealing with water supply and wastewater in a number of countries, includingthe Baltic states.
Although it is successful in taking the direct investment cost off the budget, thisapproach suffers from the problem that the borrowing is, invariably, guaranteed by thegovernment and therefore forms part of the consolidated national debt. There is also the issuein such cases, however, of subsidies to these enterprises through working capital and loansfrom state-owned banks, given at below commercial rates. To the extent that these practicesprevail (and they are still quite common), the institutional mechanism of commercialization fortaking environmental costs off budget will still leave some budgetary burden.
The commercialization of utilities has, however, opened the door to raising charges fortheir services to a level at which at least the costs of the new investments are recovered. Thiswill result in reduced levels of demand, thus saving the budget the cost of the subsidies theyreceive on ongoing operations. It will also reduce the size of the investment needed (box 3.1).54Another way in which commercialization can save costs is through a rationalization ofprovision, as many utilities are currently too small to make cost-effective investments ormanage operations in an efficient manner.
Concluding Remarks
Complying with the environmental acquis will generate high benefits (the expectedbenefits of meeting air standards are highest, followed by those associated with waterstandards). The costs involved, however, can be high. While benefits are generally expected toexceed costs, this is not always the case. Each individual investment will therefore need to besubjected to a thorough cost/benefit analysis. A number of measures can be taken to improvethe related trade-offs. These nieasures include adopting least-cost investment solutions(especially for energy-related investments), opening up procurement to international tender,and phasing in the more expensive compliance measures over time.
Funding the local cost of environmental investments is not merely a matter of increasingexpenditure commitments. Rather, there is a need for administrative changes in budgetimplementation to make funding more efficient (for example, consolidation of small ecologicalfunds). Commercialization could potentially be helpful, but it still entails some budgetaryburden. A more effective means of furthering EU compliance is likely to be through the
s4 The constraints on raising charges, however, are real and raise issues of affordability for the poorer customers.Most countries adopt some lifeline rates to get round this, although this tends to be done in an ad hoc fashion and isnot based on a careful assessment of a structure that meets specified targets at least cost.
- 57 -
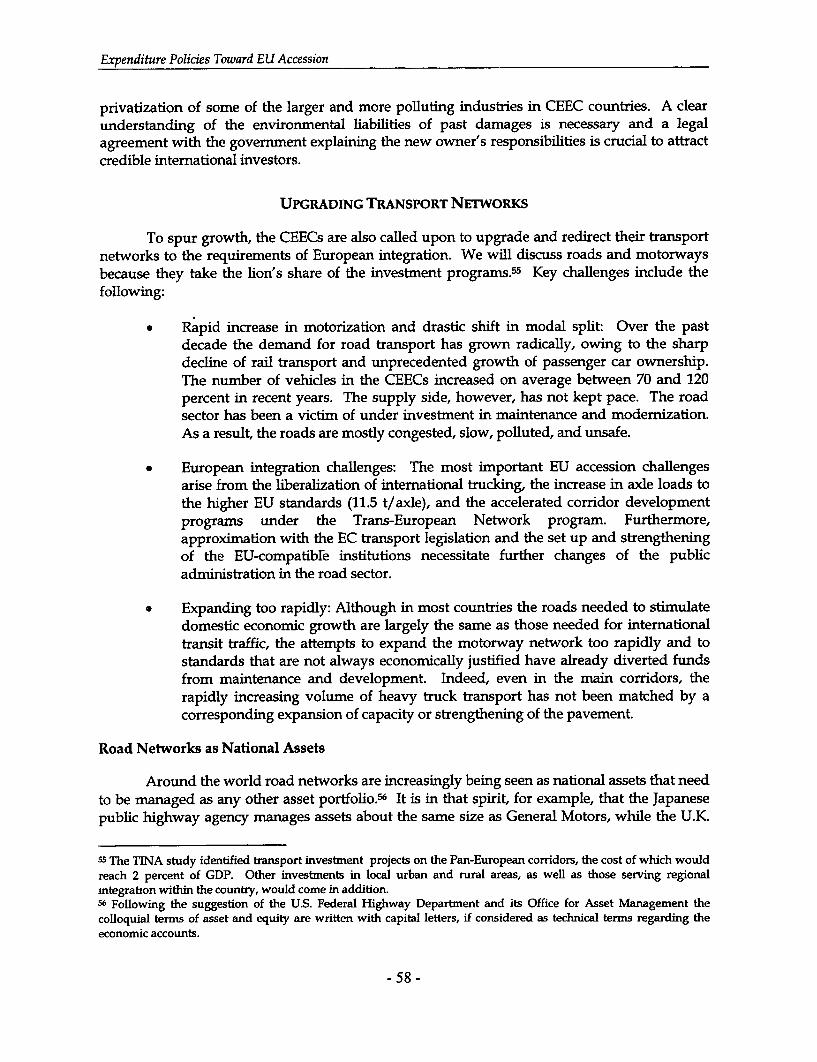
Expenditure Policies Toward EU Accession
privatization of some of the larger and more polluting industries in CEEC countries. A clearunderstanding of the environmental liabilities of past damages is necessary and a legalagreement with the government explaining the new owner's responsibilities is crucial to attractcredible international investors.
UPGRADING TRANSPORT NETWORKS
To spur growth, the CEECs are also called upon to upgrade and redirect their transportnetworks to the requirements of European integration. We will discuss roads and motorwaysbecause they take the lion's share of the investment programs.5 5 Key challenges include thefollowing:
* Rapid increase in motorization and drastic shift in modal split Over the pastdecade the demand for road transport has grown radically, owing to the sharpdecline of rail transport and unprecedented growth of passenger car ownership.The number of vehicles in the CEECs increased on average between 70 and 120percent in recent years. The supply side, however, has not kept pace. The roadsector has been a victim of under investment in maintenance and modernization.As a result, the roads are mostly congested, slow, polluted, and unsafe.
* European integration challenges: The most important EU accession challengesarise from the liberalization of international trucking, the increase in axle loads tothe higher EU standards (11.5 t/axle), and the accelerated corridor developmentprograms under the Trans-European Network program. Furthermore,approximation with the EC transport legislation and the set up and strengtheningof the EU-compatibre institutions necessitate further changes of the publicadministration in the road sector.
* Expanding too rapidly: Although in most countries the roads needed to stimulatedomestic economic growth are largely the same as those needed for internationaltransit traffic, the attempts to expand the motorway network too rapidly and tostandards that are not always economically justified have already diverted fundsfrom maintenance and development. Indeed, even in the main corridors, therapidly increasing volume of heavy truck transport has not been matched by acorresponding expansion of capacity or strengthening of the pavement.
Road Networks as National Assets
Around the world road networks are increasingly being seen as national assets that needto be managed as any other asset portfolio.6 It is in that spirit, for example, that the Japanesepublic highway agency manages assets about the same size as General Motors, while the U.K.
55The TINA study identified transport investnent projects on the Pan-European corridors, the cost of which wouldreach 2 percent of GDP. Other investments in local urban and rural areas, as well as those serving regionalmtegration within the country, would come in addition.56 Following the suggestion of the U.S. Federal Highway Department and its Office for Asset Management thecolloquial terms of asset and equity are written with capital letters, if considered as technical terms regarding theeconomic accounts.
- 58 -
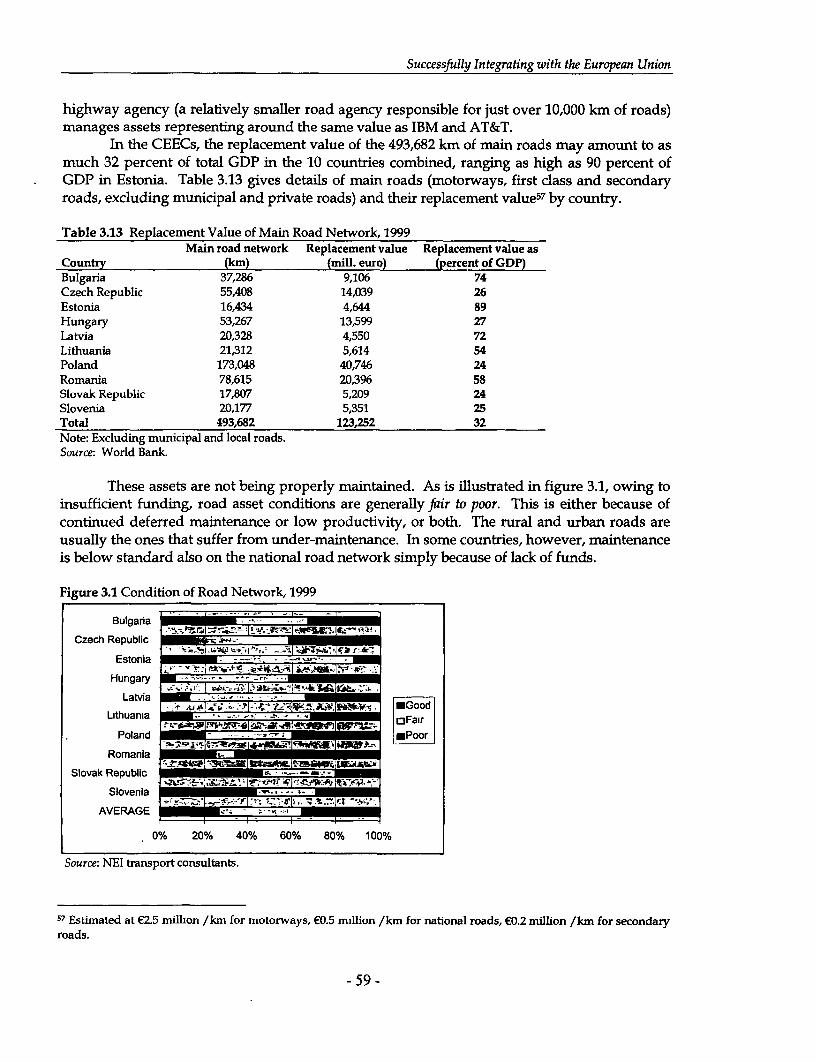
Successfully Integrating with the European Union
highway agency (a relatively smaller road agency responsible for just over 10,000 km of roads)manages assets representing around the same value as IBM and AT&T.
In the CEECs, the replacement value of the 493,682 km of main roads may amount to asmuch 32 percent of total GDP in the 10 countries combined, ranging as high as 90 percent ofGDP in Estonia. Table 3.13 gives details of main roads (motorways, first class and secondaryroads, excluding municipal and private roads) and their replacement value57 by country.
Table 3.13 Replacement Value of Main Road Network, 1999Main road network Replacement value Replacement value as
Country (km) (mill. euro) (percent of GDP)Bulgaria 37,286 9,106 74Czech Republic 55,408 14,039 26Estonia 16,434 4,644 89Hungary 53,267 13,599 27Latvia 20,328 4,550 72Lithuania 21,312 5,614 54Poland 173,048 40,746 24Romania 78,615 20,396 58Slovak Republic 17,807 5,209 24Slovenia 20,177 5,351 25Total 493,682 123,252 32Note: Excluding municipal and local roads.Source: World Bank.
These assets are not being properly maintained. As is illustrated in figure 3.1, owing toinsufficient funding, road asset conditions are generally fair to poor. This is either because ofcontinued deferred maintenance or low productivity, or both. The rural and urban roads areusually the ones that suffer from under-maintenance. In some countries, however, maintenanceis below standard also on the national road network simply because of lack of funds.
Figure 3.1 Condition of Road Network, 1999
Bulgana
Czech Republic _ i_
Estonia
Hungary _. _rr _
Latvia , .
Lithuania ir,.: . - -Fir
Poland .-*- . *Poor
Romania _
Slovak Republic
Slovenia _
AVERAGE - ,
0% 20% 40% 60% 80% 100%
Source: NEI transport consultants.
57 Estimated at E2.5 million /km for motorways, e0.5 milion /km for national roads, E0.2 mnillion /km for secondaryroads.
-59 -

Expenditure Policies Toward EU Accession
In addition to the poor conditions of the existing roads, their throughput capacity cannotcope with the sudden increase in traffic. Selective network upgrading as well as newconstructions over time are warranted.
Mostly driven by a desire to join the EU and generate business for domestic contractors,all CEECs initiated an ambitious program to develop their road and particularly motorwaynetworks too quickly at comparatively high costs. Few motorway sections have sufficient levelof traffic to justify the investments. As seen in figure 3.2, few countries have average dailytraffic densities (AATD) approaching the average 12,000-15,000 benchmark typically requiredto justify motorway construction (on flat land). By comparison, the AATD on Spanishmotorways is about 30,000.
Fige 3.2 Average Daily Traffic Density on Motorwa s and Two-Lane Major Roads
25000.,c =
20000.,
15000 '
5000 i
Bulgaria Czech Hungary Lithuania Poland Romania Slovak Ukraine SpainRepublic Republic
| OMotorway 8 2-lane major road
Source: OECD, 2000, " Road Strengthening in Central and Eastern European Countries," Report, Paris.
As a result, the attempt to expand the existing network in a relatively short period oftime (see below) is displacing higher priority maintenance expenditure. As a result, actualexpenditure on average falls short by 1.5-2 times below normative maintenance costs.
In a portfolio approach, road expenditure should be prioritizes according to economicprinciple. A general guideline is to compare the rate of return of the different road works bothwithin the same category of works and among the different investments. Table 3.14 presentssome benchmark numbers in this respect.5 8
Table 3.14 Internal Rate of Return on Road Projects: Best PracticesAverage
Type of road project Denomination internal rate of return
Road niaintenance projects "Blackfield projects" 40 percent and more (depending onstate of road deterioration)
Road rehabilitation projects on "Brownfield projects" 20 percentexisting roads
New road construction projects 'Greenfield projects" 10 percent (World Bank requirementis often 12 percent or above)
Source: World Bank.
58 "Contribution to the IRF: Seminar for the-Transition Countries," Bucharest, 2001.
- 60 -

Successfully Integrating with the European Union
This implies that from an economic point of view, the following rules of thumbgenerally apply: (a) execute maintenance projects first, (b) undertake the rehabilitation andupgrading projects (in the CEECs they are needed to convert the road network to the bearingcapacity for the heavier HVGs with higher gross weight and axle load factors), and (c) considernew construction projects.
Where new construction is required to build missing links and to align the road networkwith the requirements of European and subregional integration and of the restructureddomestic production, we could argue for staged construction, because such roads often neednot be up to the highest road standards (for example, a mnissing road link may better beestablished as a two lane road at first and not as a four lane motorway or expressway).
The Slovak Republic has embraced such an approach. The country had originallyembarked on an over-ambitious motorway program shortly after 1993. The length of theproposed motorway network took no account of the cost feasibility or of the scale of the benefitsthat might be achieved. Since the budget did not have the required resources, the governmenttook many long-term, but also short-term, loans, which increased its contingent liabilities. Thepresent administration has substantially revised the motorway program, bringing it more inline with what is financially feasible, mostly by reducing the design standards, slowing downthe rate of construction, building in short sections that have acceptable economic rates of return,and building most new sections as a single carriageway (stage construction).
Financing Road Investments
The CEECs have followed one, or both, of the following financing models: involvementof private sector financing through concessioning and/or traditional public budget financing.
Private Sector Concessions
While the first option holds much promise, the early experience with concessioning hasunfortunately not been encouraging. Hungary and Poland were among the first countries tofund motorway construction through public-private partnerships (concessioning). In Hungary,the private motorway concessionaire that won the first "Build-Operate-Transfer" contract in theregion went nearly bankrupt, forcing the Hungarian government to "purchase" back themotorway (Box 3.2). The experience in Poland has hardly been more encouraging.
- 61 -
Expenditure Policies Toward EU Accession
Box 3.2 Hungary M1/M15 Motorway Concession Project
The M1/M15 project was the first toll motorway project tendered and implemented in Central Europe. Followinga successful tender and financing, construction was largely completed on time and within budget even though theconstruction period was ambitious and Hungary underwent a period of high inflation.
Ml traffic at opening and traffic growth during the first three years was substantially below expectations, resultingin the impossibility of servicing debt. The level of toll rates turned out to be politically unacceptable, and a courtcase made the financial situation untenable. Attempts to restructure company finances, starting with the issue ofletters of credit by the government and shareholders, remained unfruitful. The government and lenders agreed ona substitution process after three years of operation.
The government brought this vital piece of infrastructure back into Hungarian state ownership while acceptingpart of the debt Tolls were reduced (and abolished) and a vignette system prepared. Taking on the Ml debt alsomeant that the motorway construction budget for at least one year was completely exhausted. In addition, privatefunding sources for the road sector seem to have become more cautious.. Of the ambitious motorway program ofHungary outlined in 1991, only parts were realized by the end of the century and the early completion of otherparts remains doubtful.
The M1/M15 experience shows that sound traffic projections and prudent economic evaluation of projects areessentiaL While the lack of adequate traffic was the key reason for the private concessionaire's failure, thecomplexity of the issues and the confidence lost made the Hungarian government decide against trying to find aviable PPP solution. With the benefit of hindsight a positive lesson from the first BOT (Build-Operate-Transfer)project in the region is:
* Construction was completed on time and within budget* Operation and maintenance during the short period thereafter were effective and on highest standard.* During the critical economic period following its opening to the west, Hungary benefited from the Ml
while not contributing to its financing.
Many potential factors that can cause private funding to fail include very weakinstitutions, almost nonexistent regulatory capacity and local financial market capacity, ajudicial system in the process of transformation to a market economy, and generally unstableeconomic situations and as result high perceived risks. In addition, the equity share of theoperator is usually very low, which will not ensure that the concessionaire/operator would besufficiently committed to the contract dauses. Paying tolls is a new phenomenon for the peoplein the CEECs. As a result, when the level of the toll is too high, public acceptance is criticallylow.
In the experience of Hungary and Poland, the main cause of initial failures was the lackof realism of the underlying traffic forecasts. In the case of the "re-nationalization" of the M-1motorway in Hungary the forecasted increase in traffic never materialized. In some cases,however, the government is willing to cover the difference between the toll level acceptable tothe public and the one required by the concessionaire to cover for operating costs.Undoubtedly, this system of "shadow tolling" can raise further doubts about the financialsustainability of the approach.
In both Poland and Hungary, the revised motorway expansion programs deserve creditfor showing the ability to learn from the recent lessons (box 3.2).
- 62 -

Successfully Integrating with the European Union
The "Other' Option Public (Budget) Financing
Most of the CEECs continue to finance their motorway expansion programs from publicresources. They typically spend 0.5-1.5 percent of GDP on roads; this compares to 1-2 percentof GDP in the EU.59 As noted above, a high proportion of the road expenditure (around 0.9percent of GDP) goes to the national roads (motorways, expressways, and the rest of thenational road network), leaving regional, rural, and urban road networks behind and less thanhalf (on average 40 percent) of the total road budget is used for maintenance. Directly orindirectly, road users fund these expenditures.
Road User Charges
While the structure of road user charges in the CEECs generally corresponds to thepractices of the EU countries (table 3.15 and box 3.3), the level of taxes, particularly the fuel andvehicle taxes is nevertheless lower. Fuel taxes are around two-thirds of the EU on average. Fueltaxes in Slovenia, Hungary, and the Czech Republic6 0 are above the EU minimum, 61 whereas thelowest fuel taxes are in Romania, Lithuania, and Bulgaria. With regard to vehicle registrationtaxes, the Czech Republic, Slovenia, and the Slovak Republic represent higher taxes than the EUminimum, while Romania, Lithuania, and Bulgaria are lower.
Table 3.15 Tolls and Vignettes in the CEECs
Toll roads Vignettes and transit charges
Bulgaria No toll roads, Transit charge for some non-EU foreign trucks and buses have to pay atexcept for bridges borders for use of motorways and three-quarter lane roads: EO.1-0.4/kmto Romania
Czech Republic - Vtgnette for use of motorways and expressways annual fee is time related(10 days, month, year) since 1999.
Estonia - But the Baltic vignette has been under considerationHungary Toll roads: 3 of 4 Vignette system can be used as alternative for paying tolls for a period
motorways are (day, week, month, year).tolled
Latvia - But the Baltic vignette has been under consideration.Lithuania - But the Baltic vignette has been under consideration.Poland - Vignette for trucks and buses carrying out international transport
minimum of E3.35 /day up to a maximum of E1255 /yearRomania No toll roads, Transit charge for some non-EU foreign trucks and buses: eo,026 /gross
except for bridges ton-km, also other taxes apply.to Bulgaria
Slovak Republic - Vignette for use of motorways and expressways; foreign commercialvehicles also have to pay a time-related road tax.
Slovenia Toll roads Transit chargesSource: NEI transport consultants, 1999.
59 Phare study on road user charges, 1999.60 Based on 1998 prices and taxes.61 Which is 0,245 E/ liter of diesel.
- 63 -

Expenditure Policies Toward EU Accession
Box 3.3 Road User Charges in the CEECs
All CEECs have a system that corresponds to the EU principles [Council and Parliament Directive 99/62/EC onthe charging of heavy goods vehicles for the use of certain infrastructures; Council Directive 92/81/EEC of 19October 1992 on the harmonization of the structures of excise duties on mineral oils; Council Directive 92/82 of 19October 1992 on the approximation of the rates of excise duties on mineral oils; Council Directive 88/77/EEC ofDecember 1987 on the approximation of laws of Member Sates relating to the measures to be taken againstemission of gaseous and particulate pollutants for diesel engines for use in vehicles [Euro I and Euro II vehicles];White Paper on Fair Payment for Infrastructure Use of 1998). Fuel taxes typically give around 60-80 percent of totalroad revenues. Vehicle taxes (first registration fee and annual ownership tax) have the advantage over fuel taxes asthey have the ability to differentiate among the vehicles (environmental friendliness and weight). On the otherhand, their major handicap is that they are not at all related to the use of the road, or to the traffic volume. Overall,however, vehicle tax revenues are small (10-30 percent of total revenues).
Several EU members and CEECs have moved away from the inherited transit fee system and introduced vignettes.In some cases they are limited to trucks; in some other countries all motor vehicles are subject to the vtgnette. TheEuro-vngnette, for example (Germany, the Benelux countries, and Denmark), is required only on the motorways.This solution is hardly acceptable to the CEECs where most of the international corridors are stll not up to themotorway standards. A major concern with this type of road user charge is its loose relationship to the actualusage of the road. When they are at least time bound we can assume that once the vignettes are bought, they willbe used. In addition, the revenues collected through the vignette system are rather small. Still, vignettes can servethe purpose of the transition toward more accurate user fees.
Very few CEECs have introduced tolls on a network scale and m cases of private concessions the experience hasnot been encouraging (see earlier). Tolls levied on bridges or tunnels are much more common and meet with lessresistance on the part of the users. While tolls have the closest relationshup to the actual use of infrastructure, theyare often outside of the public road expenditure since as a rule they should be calculated and used to cover themaintenance and usually also the construction costs of that specific infrastructure section. Should they be used ona network scale, cross-subsidization could become possible among the different corridors.
A new approach now being promoted by the EU White Paper is to bring road user charges closer to the actual useof infrastructure and at the same time to apply an integrated transport principle in which the environmental,social, safety (on average road accidents cost about 2 percent of the GDP of any, developed or developing country),etc., impacts of transport is reflected. In this way a level playing field among the modes can also be achieved.Therefore, the marginal social cost principle is recommended as the bases of road user charges
The harmonized charging system for Heavy Goods Vehicles (HGVs) based on marginal social costs is planned tobe mandatory from 2004, the date of the first likely EU accession treaties. The vignette system may prove to be anintermediate step toward distance and time based network tolling according to the EU recommendations.However, considerable research on the methodologies and several piloting projects are needed before thisapproach becomes fully operational.
As the accession date approaches, these tax gaps will need to be filled,62 generatingadditional resources to be used potentially for the sector. A fuel price increase would hitprivate car users as particularly hard, because the price/wage ratio in the CEECs is on averagetwice that of the EU countries. Because governments will have to take action and increase taxesin the near future, the growth in private car usage may slow down. The impact of fuel andvehicle tax increases on commercial road transport operators may not be as severe as on thegeneral public, because of the operator's current comparative advantage in their lower laborcosts. However, this advantage is temporary, as the harmonization with EU working
62 Unless a derogation is agreed during negotiations, as in the case of the vehicle taxes in Hungary.
- 64 -

Successfully Integrating with the European Union
conditions (obligatory rest and drive periods) will jump labor costs. In this way any other costincreases will contribute to the erosion of the international competitiveness of the roadtransport operators in the CEECs. This explains the demand emanating from the road transportindustry that the resources generated by the transport related taxes and charges largely fail tobe channeled back to visible infrastructure improvement.
Road Funds Versus General Funding
There has been a long debate as to whether such expenditure should be funded out ofgeneral public resources or through the earmarking of revenues raised from road. The varietyof solutions for earmarking or leaving the decision to the annual budget allocations (table 3.16)reflects the underlying dilemmna, as well as the different bargaining powers and confidence infair treatment among various parts of the governments).
Table 3.16 Earmarking of Road User Revenues ("Road Fund") in the CEECsCountry State of earmarking road user revenues Road fund
Bulgaria * Fuel tax: partly earmarked Yes* Foreign vehicle charges: 100 percent earnarked* Local vehicle tax: not earmarked
Czech Republic * No earmarking No road fund, but transport fund is* Ministry of Finance decides on yearly budgets under discussion
Estonia * Fuel tax: 55 percent (75 percent in future) earmarked No road fund, but it is in discussion
Hungary * No, considering earmarked transport fund No road fund, abolished in 1998;however the HungarianDevelopment Bank acts as if a firstgeneration road fund
Latvia * Fuel tax: 50 percent earmarked Yes, global best practice* Vehicle tax: 100 percent earmarked
Lithuania * Fuel tax: 100 percent earmarked Abolished* Vehicle tax: 100 percent earmarked
Poland * Fuel tax: 30 percent earmarkeda Yes, infrastructure fund* International traffic charges: 100 percent earmarked
Romania * fuel tax: - 50-75 percent YesVehicle sales tax: 100 percentc
Slovak Republic * Fuel tax: No earmarking No road fund, abolished in 2000* Vehicle tax: 70 percent earmarked* The other 30 percent of vehicle tax to municipalities
Slovenia * Fuel tax: -25 percent earmarked ("petrol tolar") No road fund, but commerciallymanaged motorway agency andinnovative maintenance concession
a. Fuel taxis transferred to state budget, but at least 30 percent must be used for roads.b. Roughly 25 percent of the wholesale price.c. Vehicle sales tax is levied at roughly 10 percent of the wholesale price or value at customs.Source: World Bank.
- 65 -

Expenditure Policies Toward EU Accession
Road funds are often criticized for their extrabudgetary character. However, not all roadfunds are beyond the control of the ministries of finance and the legislative branch. Even incases where a road fund behaved as a typical off-budget institution and became indebted, it wasoften with the "blessing" (if not the encouragement) of the finance ministries. Typical examplesare the Slovak and the Hungarian road funds. To simplify both cases can be characterized bythe overly ambitious political will to build motorways without full attention to the costincurred. In Hungary, the approach intended when the road fund was initially abolished wasto operate through the budget in a transparent and competitive manner. Unfortunately, thefollowing government reverted to less transparent arrangements than those of the previousroad fund.
The Hungarian Development Bank (MDF) has become the primary agent of the roaddevelopment program. It has been exempted from prudent banking principles. Oversight bythe government, the road experts, or the public has not been enforced. As a result, itsindebtedness brought about by large-scale road investments is huge. At the same time, resultsremain to be seen in terms of costs, length, or schedule. MDF, for instance, managed to escapepublic procurement rules, and investment contracts have been granted through nontransparentnegotiations, inevitably leading to higher construction costs. Encouragingly, however,following recent elections, the incoming coalition has stated its intent to put an end to thisunfortunate episode.
On the other hand, a positive example for the institutional solution is the Latvian roadfund. This is considered by the international road community as globally best practice. TheLatvian model is exemplary and is currently one of the very few in the CEECs that can growinto a much more user-fee-related commercial road management as foreseen in the EU WhitePaper on fair transport pricing (box 3.4). Despite the good structure, however, the roadexpenditure in Latvia is not adequate to fund all the needs inherited from the past and inaddition created by the European integration.
Box 3.4 Key Features of the Latvian Road Fund
. Revenue comes from vehicle license fees and a levy added to the price of fuel. The Ministry of Fmancemade sure that the levy remained budget neutral (if the road fund levy was increased by 2 cents/liter,the general tax on fuel was increased by 2 cents/liter). General taxes therefore increased, rather thanbeing diverted to the road fund.
. The fund has a broad-based oversight board with advisory status. It has 13 members and a chairman(the Minister): 6 represent central government, 2 represent local government, and 6 civil society. Thecentral government members are ex officio, while the rest are nominated by the organizations theyrepresent
. The road fund finances both national and municipal roads (about 30 percent to the municipalities).There are transparent and well thought out formulas for dividing the funds between differentmunicipalities (m many respects better than U.S. Federal Highways Trust Fund formulas).
. The fund is being rigorously audited. Extensive checks are in place to make sure that the funds arebeing spent on an approved program and that the work has been carried out according to thespecifications.
-66 -

Successfully Integrating with the European Union
Table 3.17 summarizes the arguments for and against road funds. It must be noted that theweaknesses usually occur in the case of the "first generation" road fumds and the strengths arecharacteristic mostly of the "second generation" road funds (for example, the Latvian RoadFund).
Table 3.17 Road Fund SWOTStrengths Weaknesses
* Recognized utility function through road fee / * Can be captured by "local powers."road user charges. Users' ownership and * Limits the government's fiscal re-distributionoversight, transparency and accountability, less function and can limit expenditure management.corruption. Multi-annual predictability, multi- * May "over-bozTow" if it loses itsyear investment planning. Ma "oe-row if t lss iscreditworthiness, eventually the burden falls back
* Can borrow directly agamist future revenues. on the government, which will have to bail it out.
* Cannot be easily mfluenced by political * Difficult to design its re-allocation functions topressure and thus can stick to economic make them flexible, but not abusive to regionalanalysis based planning and investments, and local governments if all road user charges go
* Prudent financial management, procurement, to the road fund.and road expertise. * Road management and fund management can
have contradictory agendas.
Opportunities Threats* Can grow into a national road utility that can be * Not appropriately established road fund can be a
commercially managed. target of political and public dissatisfaction.
* Offers more opportunities for publhc-private * The off-budget status may narrow/limit thepartnership and eventually for the pnvate mterest of the government to provide for roads assector. part of public goods.
* With a well designed road fund accelerated * Lack of proper over-sight can lead toroad development can be implemented with mismanagement of the road fund and trigger losslower costs than with central budgeting due to of confidence in the road sector specialists.the risk factor attached to multi-year * Poor road fund management can have a backlashpredictability. and can brmg the sector back to central plannmng
solutions.
* National roads have too much emphasis at thecost of regional, rural, and urban roads.
Managing Road Programs
Progress has also been made in reforming the road administrations (introduction of aroad data bank, pavement and bridge management systems, HDM, etc.), improving their roadstatistics (again, a number of traffic censuses have been funded by the EU), and converting theroad agencies from vertically integrated construction firms with sector management functionsto road managers concentrating on contract management and not on implementation. Thislatter reform started well before the politico-economic changes. Several CEECs had a well-developed construction sector as early as the 1980s, although contractors were still state owned.In Hungary, for example, the privatization of the construction sector took place before oraround late 1980s early 1990s. By now, all CEECs have institutionalized the principle ofcontracting out road works. Most of the countries have done so with all types of works,including routine maintenance.
- 67 -
Expenditure Policies Toward EU Accession
Not enough progress has as yet been made in making the road administrations leaner;that is, concentrating only on the national roads while regional and local authorities could takeover the lower category roads. This delay is due to the lower pace of fiscal and institutionaldecentralization to the regions and municipalities partly to delays in the reclassification ofroads, and mostly to the unsolved financing issues.
Concluding Remarks
While it is true that potential investors might be deterred by the poor road accessibility,the CEECs increasingly recognize that the motorway construction program has to besustainable. When the construction and financing of the motorway section is being planned, itssocioeconomic impact should be compared to investing in the equivalent amount in thepreservation and improvement of existing road assets or investing in transport services, oreducation or health. Road investments, whether to preserve existing road assets (deferredmaintenance and routine and periodic maintenance) or to add capacity to the basic network andto expand the motorway network, need to compete for limited funds, with maintenance havingthe highest priority and new construction having the lowest. The limited budget resourcesshould therefore be allocated to the preservation of the existing assets, and appropriate businessconditions should be created for public-private partnership.
CONCLUSIONS
As the burden of the legacy of the early transition period is reduced, governmentsaround the regions are being faced with new expenditure demands - generally legitimate butoften overwhelming-to support their countries' integration into the European Union, andbeyond, into the global economy. Many of these demands relate to the need to upgrade skills,environmental standards, and transport networks. Clearly not all can be accommodated withinthe fiscal frameworks of the PEPs. Governments will need to be all the more vigilant to see thatsome of these demands come supported by financing on sometimes very attractive terms. Evenin those cases, the issue remains to ensure that higher priority claims on public resources are notbeing displaced and that the programs being financed are sustainable beyond the initialinvestment.
In the education sector, we highlighted the possibility of taking advantage of the ongoingdemographic trough (a) to redirect resources from lower to higher levels of education(including by downsizing staff and facilities in many primary and secondary educationprograms), (b) to focus secondary education on teaching more generic skills for a few broadfamilies of occupational specializations rather than highly specific skills for a large number ofnarrow occupations, and (c) to expand quality tertiary education, perhaps by concentratingstate budget financing on either the most capable institutions or the most capable students, andencouraging accredited private institutions and tuition payments to look after the rest of thesector.
As to environmnental protection, the undoubted benefits it will bring will come at a cost.Whether this cost is worth paying for will need to be established on a case-by-case basis. Herewe highlighted a number of ways in which the trade-off could be improved by adopting least-
- 68 -
Successfully Integrating with the European Union
cost investment solutions (especially for energy-related investments); opening up procurementto international tender; and phasing compliance measures over time, starting with those thatwill bring the most immediate benefits to the populations and scheduling the more expensiveitems later in time.
As to transport netwvorks, we highlighted the importance of the following actions: (a)reviewing the road user charges system (considering tax and fee increases, as well as socialmarginal cost-based road pricing); (b) improving efficiency in spending and in road works(contracting out, many performance based contracts); (c) further reforming roadadministrations (quasi-utility functions, independent auditing, staff development); (d) basinginvestment decisions on economnic criteria (maintenance should receive first priority); and (e)reviewing, and if need be reclassifying, the road network.
- 69 -

4. ENSURING SOCIAL PROTECTION
Alongside the broad consensus that exists in favor of market economics and integrationwith Europe and the rest of the world, there remains a widespread demand for governments toprotect people against the major areas of vulnerability. Health and old age are two particularlysensitive areas. Since early in the transition, however, governments have had to contend withthe rising cost of extending such social protection. In a bid to curb this cost, one country afteranother has revisited the old Bismarckian model of social policy and tried to define a new roleand new models for the concept of social insurance that lies at its heart.
Here we will discuss the following areas: (a) pensions, where a reassertion of theinsurance principle has paved the way for restoring the financial sustainability of publicpension schemes, and in some countries for diversifying the forms of old-age coverage intomulti-pillar systems; and (b) health, where the focus of government action has generally shiftedfrom providing health care to providing health protection.
As is made clear, progress is far more advanced in the area of public pension systems,with patterns of best practices now emerging clearly among CEECs (including progress incomparison with EU members). Health care and insurance reform is as yet at an earlier stage,with most countries still experimenting with various innovations, and the conclusions drawnwill accordingly be more tentative.
REFORMING PUBLIC PENSION SYSTEMS
Pension systems came under serious strain during the 1990s, and, despite variousattempts at reform, pension schemes were still displaying deficits in most CEEC countries at theend of the decade (table 4.1). The causes of these deficits varied between two groups ofcountries: In one group (including Bulgaria, Estonia, Latvia, Hungary, and Poland) pensionexpenditure had, at the outset, been unsustainably high (table 4.2). These countries undertooksystemic reforms and, as a result, are now experiencing transition deficits approaching long-term sustainability. In the other group (including the Czech Republic, the Slovak Republic, andSlovenia) pressures were not felt immediately (or was more successfully contained), but arenow increasing.63
63 In the case of Romania, pressures-though always high-were never successfully addressed. Lithuania, havingapparently succeeded in stabilizing its first public pillar, is now moving toward establishing a second funded pillar.
- 71 -
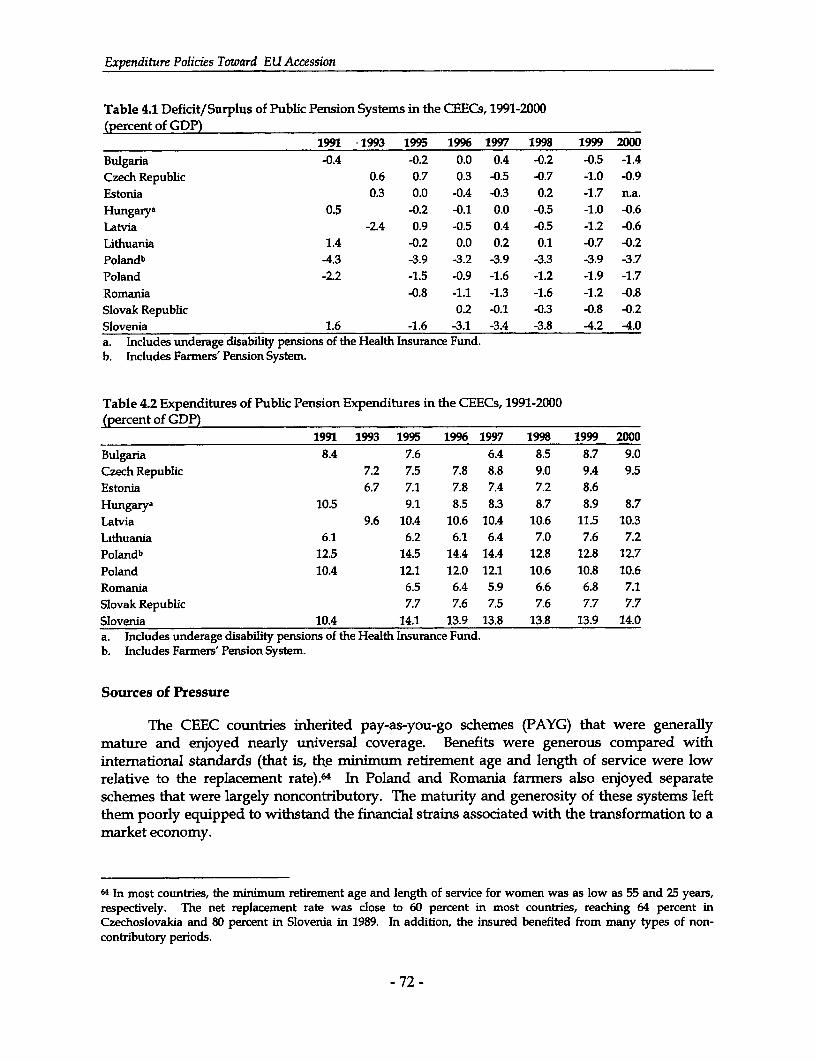
Expenditure Policies Toward EU Accession
Table 4.1 Deficit/Surplus of Public Pension Systems in the CEECs, 1991-2000(percent of GDP)
1991 1993 1995 1996 1997 1998 1999 2000Bulgaria -0.4 -0.2 0.0 0.4 -0.2 -0.5 -1.4Czech Republic 0.6 0.7 0.3 -0.5 -0.7 -1.0 -0.9Estonia 0.3 0.0 -0.4 -0.3 0.2 -1.7 n.a.Hungarya 0.5 -0.2 -0.1 0.0 -0.5 -1.0 -0.6Latvia -2.4 0.9 -0.5 0.4 -0.5 -1.2 -0.6Lithuania 1.4 -0.2 0.0 0.2 0.1 -0.7 -0.2Polandb -4.3 -3.9 -3.2 -3.9 -3.3 -3.9 -3.7Poland -2.2 -1.5 -0.9 -1.6 -1.2 -1.9 -1.7Romania -0.8 -1.1 -1.3 -1.6 -1.2 -0.8Slovak Republic 0.2 -0.1 -0.3 -0.8 -0.2Slovenia 1.6 -1.6 -3.1 -3.4 -3.8 -4.2 -4.0a. Includes underage disability pensions of the Health Insurance Fund.b. Includes Farmers' Pension System.
Table 4.2 Expenditures of Public Pension Expenditures in the CEECs, 1991-2000(percent of GDP)
1991 1993 1995 1996 1997 1998 1999 2000Bulgaria 8.4 7.6 6.4 8.5 8.7 9.0Czech Republic 7.2 7.5 7.8 8.8 9.0 9.4 9.5Estonia 6.7 7.1 7.8 7.4 7.2 8.6Hungarya 10.5 9.1 8.5 8.3 8.7 8.9 8.7Latvia 9.6 10.4 10.6 10.4 10.6 11.5 10.3Lithuania 6.1 6.2 6.1 6.4 7.0 7.6 7.2Polandb 12.5 14.5 14.4 14.4 12.8 12.8 12.7Poland 10A 12.1 12.0 12.1 10.6 10.8 10.6Romania 6.5 6.4 5.9 6.6 6.8 7.1Slovak Republic 7.7 7.6 7.5 7.6 7.7 7.7Slovenia 10.4 14.1 13.9 13.8 13.8 13.9 14.0a. Includes underage disability pensions of the Health Insurance Fund.b. Includes Farmers' Pension System.
Sources of Pressure
The CEEC countries inherited pay-as-you-go schemes (PAYG) that were generallymature and enjoyed nearly universal coverage. Benefits were generous compared withinternational standards (that is, the minimum retirement age and length of service were lowrelative to the replacement rate).64 In Poland and Romania farmers also enjoyed separateschemes that were largely noncontributory. The maturity and generosity of these systems leftthem poorly equipped to withstand the financial strains associated with the transformation to amarket economy.
64 In most countries, the minimum retirement age and length of service for women was as low as 55 and 25 years,respectively. The net replacement rate was close to 60 percent in most countries, reaching 64 percent inCzechoslovakia and 80 percent in Slovenia in 1989. In addition, the insured benefited from many types of non-contributory periods.
- 72 -
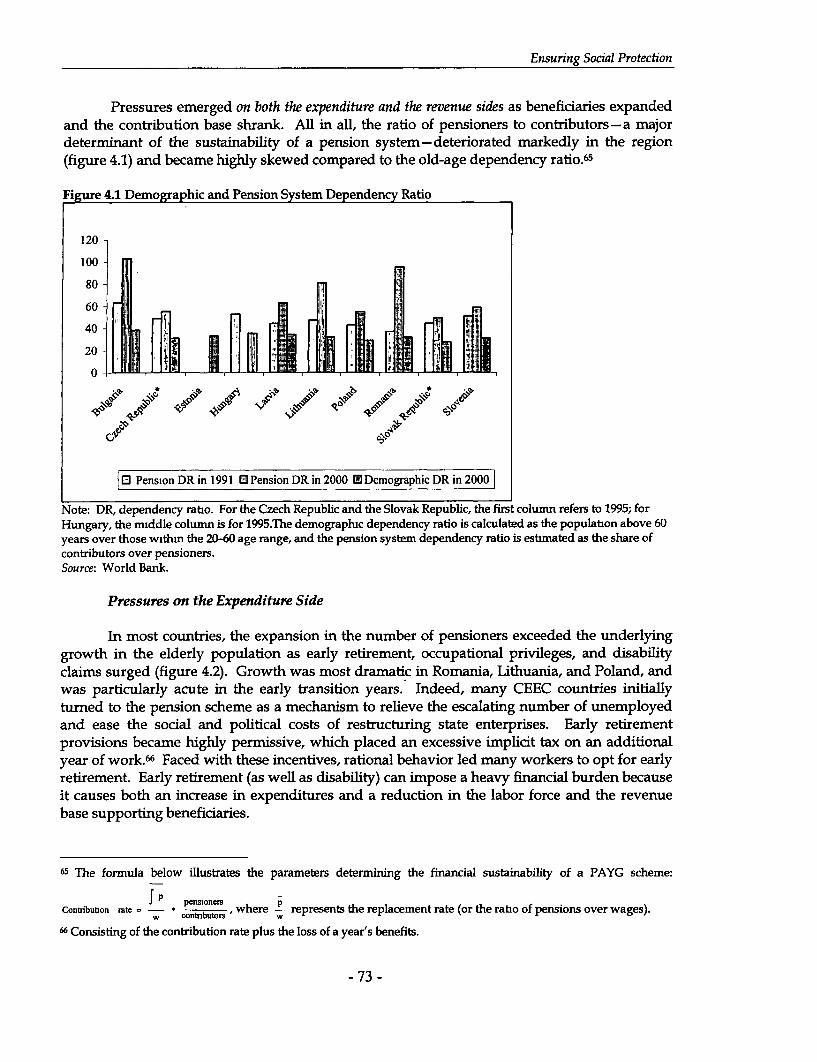
Ensuring Social Protection
Pressures emerged on both the expenditure and the revenue sides as beneficiaries expandedand the contribution base shrank. All in all, the ratio of pensioners to contributors-a majordeterminant of the sustainability of a pension system-deteriorated markedly in the region(figure 4.1) and became highly skewed compared to the old-age dependency ratio.65
Figure 4.1 Demographic and Pension System Dependency Ratio
120-
100
80 -.
60
40-
20 -
0 -
| Pension DR in 1991 a Pension DR in 2000 E Demographic DR in 2000
Note: DR, dependency ratio. For the Czech Republic and the Slovak Republic, the first column refers to 1995; forHungary, the middle column is for 1995.The demographlc dependency ratio is calculated as the population above 60years over those withm the 20-60 age range, and the pension system dependency ratio is estimated as the share ofcontributors over pensioners.Source: World Bank.
Pressures on the Expenditure Side
In most countries, the expansion in the number of pensioners exceeded the underlyinggrowth in the elderly population as early retirement, occupational privileges, and disabilityclaims surged (figure 4.2). Growth was most dramatic in Romania, Lithuania, and Poland, andwas particularly acute in the early transition years. Indeed, many CEEC countries initiallyturned to the pension scheme as a mechanism to relieve the escalating number of unemployedand ease the social and political costs of restructuring state enterprises. Early retirementprovisions became highly permissive, which placed an excessive implicit tax on an additionalyear of work. 66 Faced with these incentives, rational behavior led many workers to opt for earlyretirement. Early retirement (as well as disability) can impose a heavy financial burden becauseit causes both an increase in expenditures and a reduction in the labor force and the revenuebase supporting beneficiaries.
65 The formula below illustrates the parameters determining the financial sustainability of a PAYG scheme:
f P penslonerspContsi-ton ofte =- S where - represents the replacement rate (or the ratio of pensions over wages).w contnbutors ' w
66 Consisting of the contribution rate plus the loss of a year's benefits.
- 73 -

Expenditure Policies Toward EU Accession
Figure 4.2 Number of Beneficiaries from Public Pension Systems,1991-2000(1995 = 100)
130 -120-7
810 -
80 -~~ ~~~~~~~~~~
1Ol991 a 1995 012000
Source: World Bank.
Among CEEC countries, Romania and Bulgaria presently confront the worstdependency ratios, having reached or surpassed 100 percent, a level at which each contributingworker needs to support one beneficiary. These ratios are highly adverse by any internationalstandards.6 7 In parallel, many countries suffered a dramatic expansion of occupationalprivileges with access to early retirement, an inheritance from the planned economy era.68
Criteria for granting disability also became more lax in many of the CEEC economies. Workersnot eligible for retirement frequently resorted to disability as an alternative means to escape thehighly unstable labor market environment. This problem became particularly acute in Poland,where the number of disabled rose by more than 20 percent during the transition decade.
Pressures on the Revenue Side
Broadly speaking, developments in the contribution base were even more unfavorablethan on the expenditure side (figure 4.3). Most countries suffered an important erosion of their taxbase, particularly in the early transition years, as the labor force participation shrank and unemploymentsoared. In Hungary, for example, the labor force participation rate fell from 85 to 76 percentbetween 1990 and 1994, and unemployment rose to about 10 percent. The composition of thelabor force also underwent a dramatic transformation with a growing number of self-employedoperating in the informal market and evading the system.69
67 In Romania, for example, new provisions became effective in 1990 permittmg early retirement up to five years withfull benefits for workers satisfying the minimum length of service. Thus, the number of retirees surged by more than30 percent m a single year. In Bulgaria, policies also permitted early retirement to workers laid off by restructuringfirms, prompting the number of pensioners to swell in response. Although this policy was swiftly reversed in 1993,slowmg down the inflow of new retirees, it left the pension system saddled with a greatly expanded beneficiary roll.68 In Bulgaria and Romania, the number of workers eligible for early retirement reached 20 and 30 percent,respectively. In Poland, approximately 24 percent of the workforce enjoyed sectoral privileges, the cost of which wasestimated at 12 percentage points of the 45 percent contribution rate (Chlon, Gora, and Rutkowski, 1999, "ShapingPension Reform in Poland: Security through Diversity", Social Protection Discussion Paper No. 9805, World Bank,Washington, D.C.).69 In Romania, for example, the self-employed grew from a very low base to more than 20 percent by 2000. Thepension scheme became voluntary for the self-employed and most of them preferred not to join.
- 74 -
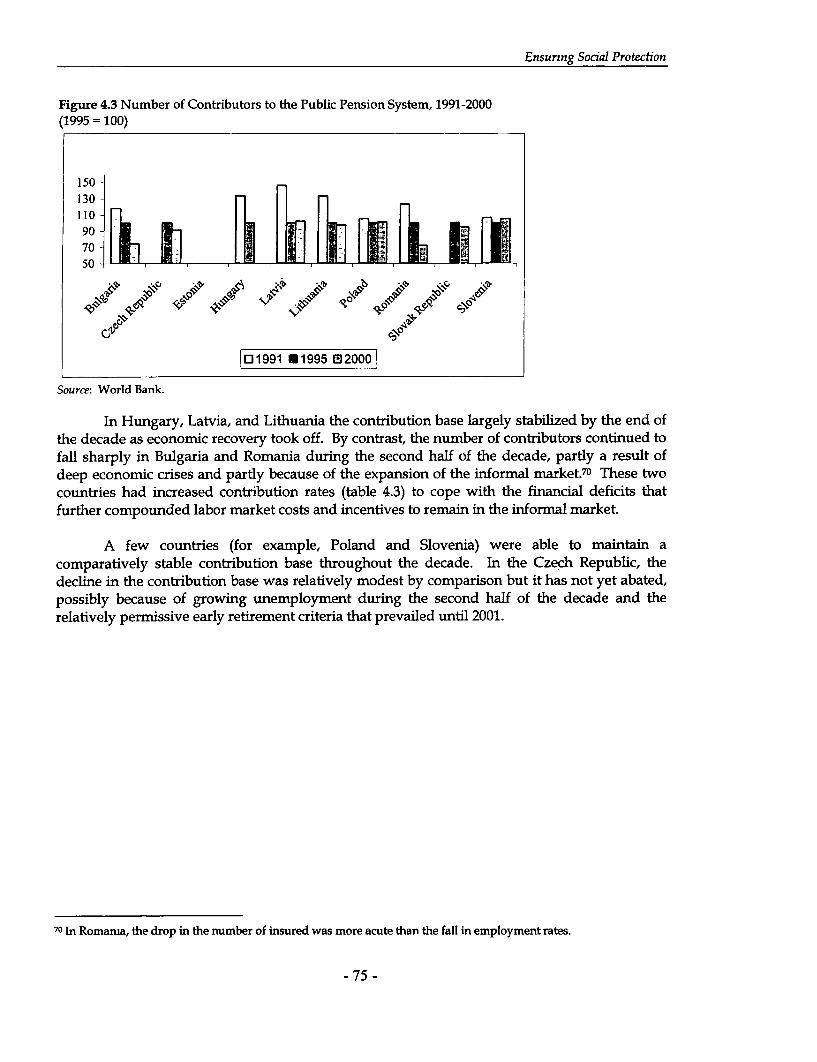
Ensurng Social Protection
Figure 4.3 Number of Contributors to the Public Pension System, 1991-2000(1995 = 100)
150-130-110 90 -70- l ~ F iXmri;;50
0z1991 141995 Ei2000|
Source: World Bank.
In Hungary, Latvia, and Lithuania the contribution base largely stabilized by the end ofthe decade as economnic recovery took off. By contrast, the number of contributors continued tofall sharply in Bulgaria and Romania during the second half of the decade, partly a result ofdeep economic crises and partly because of the expansion of the informal market.70 These twocountries had increased contribution rates (table 4.3) to cope with the financial deficits thatfurther compounded labor market costs and incentives to remain in the informal market.
A few countries (for example, Poland and Slovenia) were able to maintain acomparatively stable contribution base throughout the decade. In the Czech Republic, thedecline in the contribution base was relatively modest by comparison but it has not yet abated,possibly because of growing unemployment during the second half of the decade and therelatively permissive early retirement criteria that prevailed until 2001.
70 In Romania, the drop in the number of insured was more acute than the fall in employment rates.
- 75 -
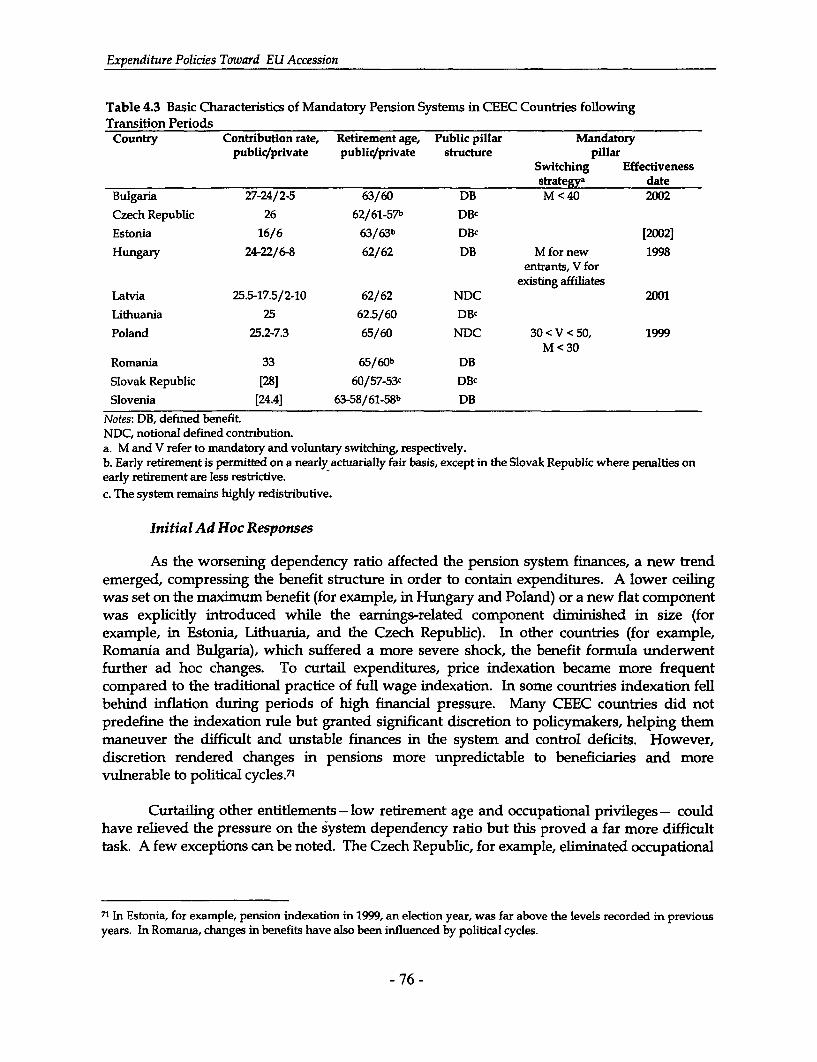
Expenditure Policies Toward EU Accession
Table 4.3 Basic Characteristics of Mandatory Pension Systems in CEEC Countries followingTransition Periods
Country Contribution rate, Retirement age, Public pillar Mandatorypublic/private public/private structure pillar
Switching Effectivenessstrategya date
Bulgaria 27-24/2-5 63/60 DB M <40 2002
Czech Republic 26 62/61-57b DBcEstonia 16/6 63/63b DBc [20021
Hungary 24-22/6-8 62/62 DB M for new 1998entrants, V for
existing affiliatesLatvia 25.5-17.5/2-10 62/62 NDC 2001
Lithuania 25 62.5/60 DBc
Poland 25.2-7.3 65/60 NDC 30 < V < 50, 1999M<30
Romania 33 65/60b DB
Slovak Republic [28] 60/57-53c DBcSlovenia [24.4] 63-58/61-58b DB
Notes: DB, defined benefitNDC, notional defined contribution.a. M and V refer to mandatory and voluntary switching, respectively.b. Early retirement is permitted on a nearly actuarially fair basis, except in the Slovak Republic where penalties onearly retirement are less restrictive.c. The system remains highly redistributive.
Initial Ad Hoc Responses
As the worsening dependency ratio affected the pension system finances, a new trendemerged, compressing the benefit structure in order to contain expenditures. A lower ceilingwas set on the maximum benefit (for example, in Hungary and Poland) or a new flat componentwas explicitly introduced while the earnings-related component diminished in size (forexample, in Estonia, Lithuania, and the Czech Republic). In other countries (for example,Romania and Bulgaria), which suffered a more severe shock, the benefit formula underwentfurther ad hoc changes. To curtail expenditures, price indexation became more frequentcompared to the traditional practice of full wage indexation. In some countries indexation fellbehind inflation during periods of high financial pressure. Many CEEC countries did notpredefine the indexation rule but granted significant discretion to policymakers, helping themmaneuver the difficult and unstable finances in the system and control deficits. However,discretion rendered changes in pensions more unpredictable to beneficiaries and morevulnerable to political cycles.7
Curtailing other entitlements -low retirement age and occupational privileges - couldhave relieved the pressure on the system dependency ratio but this proved a far more difficulttask. A few exceptions can be noted. The Czech Republic, for example, eliminated occupational
71 In Estonia, for example, pension indexation in 1999, an election year, was far above the levels recorded in previousyears. In Romanua, changes in benefits have also been influenced by political cycles.
- 76 -
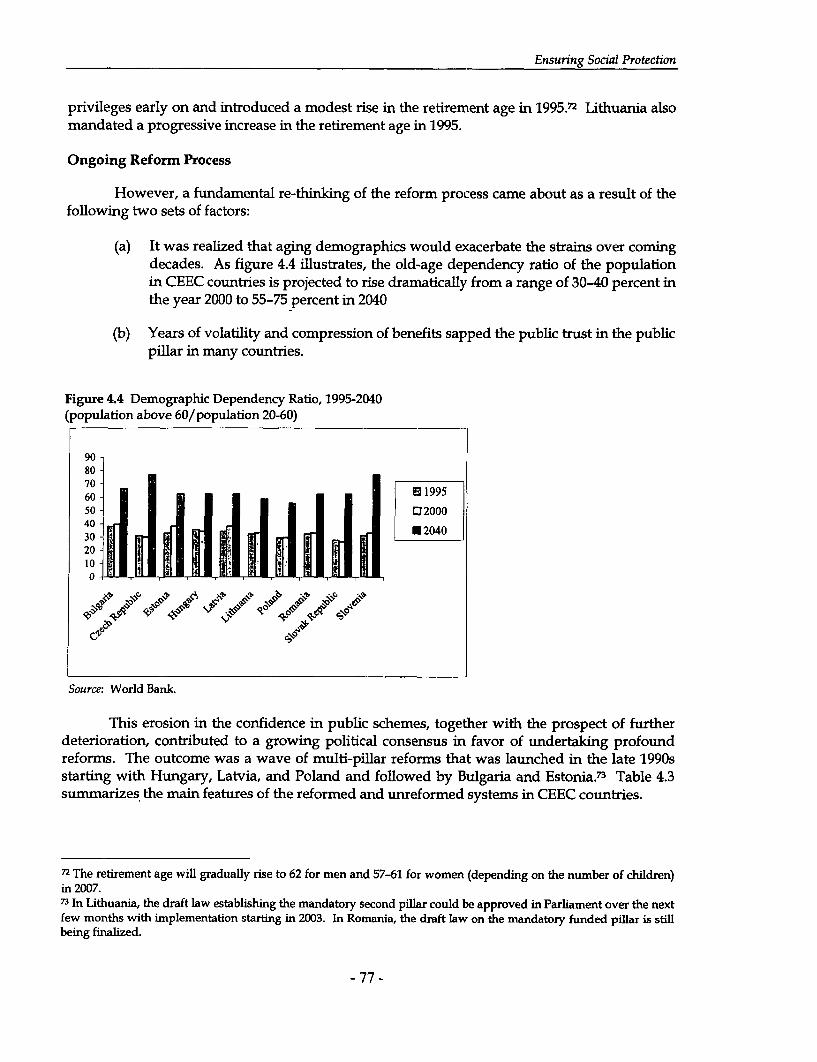
Ensuring Social Protection
privileges early on and introduced a modest rise in the retirement age in 1995.72 Lithuania alsomandated a progressive increase in the retirement age in 1995.
Ongoing Reform Process
However, a fundamental re-thinking of the reform process came about as a result of thefollowing two sets of factors:
(a) It was realized that aging demographics would exacerbate the strains over comingdecades. As figure 4.4 illustrates, the old-age dependency ratio of the populationin CEEC countries is projected to rise dramatically from a range of 30-40 percent inthe year 2000 to 55-75 percent in 2040
(b) Years of volatility and compression of benefits sapped the public trust in the publicpillar in many countries.
Figure 4.4 Demographic Dependency Ratio, 1995-2040(population above 60/population 20-60)
908070 EU 19956050 02000
40 0~~- 2040302010-0
Source: World Bank.
This erosion in the confidence in public schemes, together with the prospect of furtherdeterioration, contributed to a growing political consensus in favor of undertaking profoundreforms. The outcome was a wave of multi-pillar reforms that was launched in the late 1990sstarting with Hungary, Latvia, and Poland and followed by Bulgaria and Estonia.73 Table 4.3summarizes the main features of the reformed and unreformed systems in CEEC countries.
72 The retirement age will gradually rise to 62 for men and 57-61 for women (depending on the number of children)in 2007.73 In Lithuania, the draft law establishing the mandatory second pillar could be approved in Parliament over the nextfew months with implementation starting in 2003. In Romania, the draft law on the mandatory funded pillar is stillbeing finalized.
- 77 -
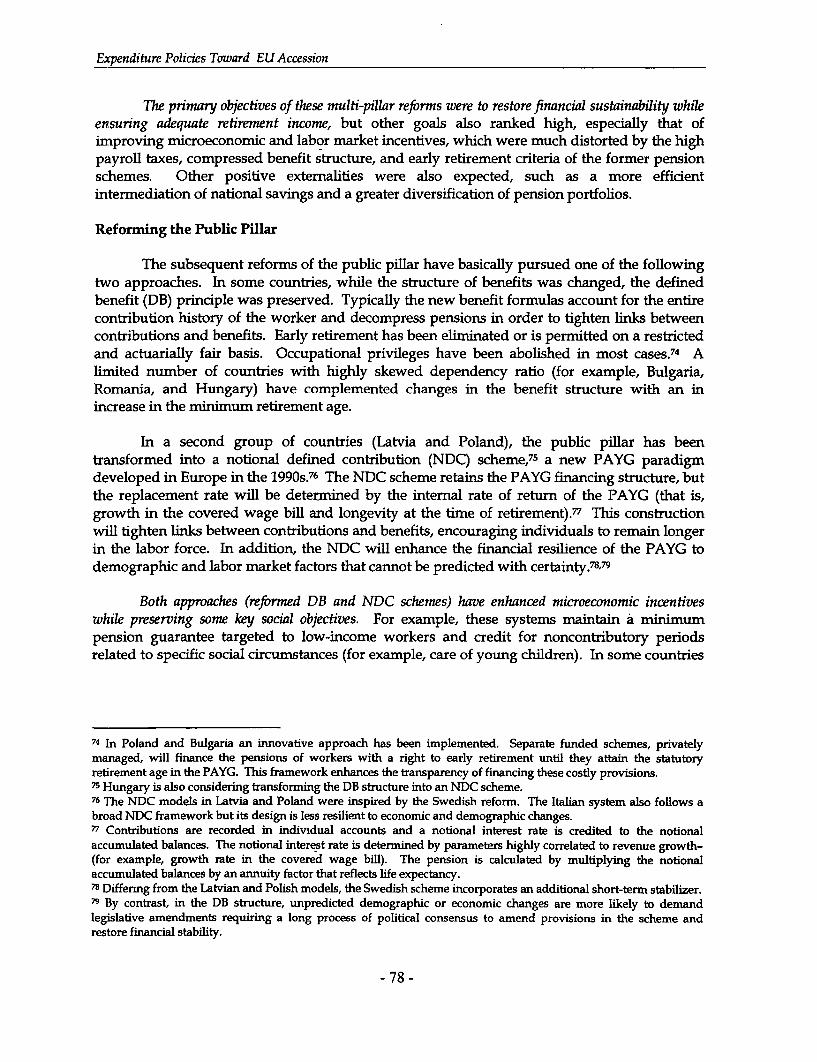
Expenditure Policies Toward EU Accession
The primary objectives of these multi-pillar reforms were to restore financial sustainability whileensuring adequate retirement income, but other goals also ranked high, especially that ofimproving microeconomic and labor market incentives, which were much distorted by the highpayroll taxes, compressed benefit structure, and early retirement criteria of the former pensionschemes. Other positive externalities were also expected, such as a more efficientintermediation of national savings and a greater diversification of pension portfolios.
Reforming the Public Pillar
The subsequent reforms of the public pillar have basically pursued one of the followingtwo approaches. In some countries, while the structure of benefits was changed, the definedbenefit (DB) principle was preserved. Typically the new benefit formulas account for the entirecontribution history of the worker and decompress pensions in order to tighten links betweencontributions and benefits. Early retirement has been eliminated or is permitted on a restrictedand actuarially fair basis. Occupational privileges have been abolished in most cases.74 Alimited number of countries with highly skewed dependency ratio (for example, Bulgaria,Romania, and Hungary) have complemented changes in the benefit structure with an inincrease in the minimum retirement age.
In a second group of countries (Latvia and Poland), the public pillar has beentransformed into a notional defined contribution (NDC) scheme,7 5 a new PAYG paradigmdeveloped in Europe in the 1990s.76 The NDC scheme retains the PAYG financing structure, butthe replacement rate will be determined by the internal rate of return of the PAYG (that is,growth in the covered wage bill and longevity at the time of retirement). 77 This constructionwill tighten links between contributions and benefits, encouraging individuals to remain longerin the labor force. In addition, the NDC will enhance the financial resilience of the PAYG todemographic and labor market factors that cannot be predicted with certainty.78 ,79
Both approaches (reformed DB and NDC schemes) have enhanced microeconomic incentiveswhile preserving some key social objectives. For example, these systems maintain a minimumpension guarantee targeted to low-income workers and credit for noncontributory periodsrelated to specific social circumstances (for example, care of young children). In some countries
74 In Poland and Bulgaria an innovative approach has been implemented. Separate funded schemes, privatelymanaged, will finance the pensions of workers with a right to early retirement until they attain the statutoryretirement age in the PAYG. This framework enhances the transparency of financing these costly provisions.75 Hungary is also considering transforming the DB structure into an NDC scheme.76 The NDC models in Latvia and Poland were inspired by the Swedish reform. The Italian system also follows abroad NDC framework but its design is less resilient to economic and demographic changes.77 Contributions are recorded in individual accounts and a notional interest rate is credited to the notionalaccumulated balances. The notional interest rate is determined by parameters highly correlated to revenue growth-(for example, growth rate in the covered wage bill). The pension is calculated by multiplying the notionalaccumulated balances by an annuity factor that reflects life expectancy.78 Differng from the Latvian and Polish models, the Swedish scheme incorporates an additional short-term stabilizer.79 By contrast, in the DB structure, unpredicted demographic or economic changes are more likely to demandlegislative amendments requiring a long process of political consensus to amend provisions in the scheme andrestore financial stability.
- 78 -
Ensuring Socal Protection
these benefits are now covered by the state budget, allowing greater transparency to thefinancing of special social programns. 80
Establishing Mandatory Funded Schemes
Beyond reforming their public pillars, a number of CEECs have established second,funded pillars. Although funded pillars present many variants across countries (table 4.3), theyalso share important common features, including the following:
* Assets are to be privately managed and workers are to freely select the assetmanager to prevent inappropriate political interference.
* In most countries the private sector not only manages pension assets but alsoadministers the related pension accounts.
* To minimize private sector risks, there is to be a clear legal separation between theproperty rights of fund managers and those of affiliates to prevent any siphoningof resources from workers to the fund administrator.
* The funded pillars typically follow a defined contribution (DC) structure that iseasier to supervise.81
The size of the second pillar as well the switching strategy (that is, the share of workersallowed to enter the new system) have generally been defined in consideration of the "transitioncosts" that reforms would generate. The latter occur on the public books because the secondpillar is financed by diverting a share of contributions from the PAYG, exposing in the processthe existing stock of implicit liabilities within the PAYG. Contributions to the second pillar areplanned to range from 5 to 10 percent of wages but can start at lower levels in some countries(such as 2 percent in Latvia and Bulgaria) to ease transition costs. Only Estonia will finance ashare of the second pillar by raising the contribution rate of switchers ,to the funded pillar.Other countries have felt that social insurance contribution rates were already burdensomeenough.
For reasons of fiscal stability and intergenerational equity, CEEC countriesimplementing multi-pillar reforms have spread the transition costs among differentgenerations. Existing pensioners are the generation least affected by the introduction of thesecond pillar, as their entitlements have been largely protected, excluding changes in benefitindexation. In some countries, older workers will bear some of the adjustment through areduction in replacement rates and increases in the minimum retirement age. Other transitioncosts will be financed through a combination of privatization revenues, fiscal adjustment, andborrowing, transferring some of existing pension debt to future generations.
80 Noncontributory periods have generally been much rationalized in CEEC countries, and nonpriority programs (forexample, credit for students), have been eliminated.81 Over the last two decades, DC plans have been growing at a faster pace than DB plans, mostly offered throughoccupational schemes, in OECD countries. There is also an increasing tendency for new occupational schemes tofollow a DC construction.
- 79 -

Fxpenditure Policies Toward EU Accession
Sustainability Prospects
The multi-pillar reforms described have considerably enhanced the long-term financialsustainability of pension schemes in most CEEC countries that undertook reforms (table 4.4).As a result of these reforms, the pension schemes in Bulgaria, Estonia, Hungary, and Latvia arebetter prepared to confront the aging demographics, even though some additional reformsmight still be necessary to attain a balanced position in the long term. In Hungary, for example,the reform was able to narrow the long-term deficit (2050) in the public pillar from nearly 6percent of GDP to only 0.5 percent. Table 4.4 shows that Lithuania's public pillar is also on asounder financial footing.
Table 4.4 Projected Financial Performance of the Public Pillar Following Reforms Approvedthrough End of 2001(percent of GDP)
2000 2005 2010 2020 2030 2040 2050
Bulgariaa -1.4 -1.3 0.1 0.3 1.4 0.6 0.6
Czech Republic -0.9 -0.9 -1.3 -3.0 -4.7 -7.6 -8.7
Estonia n.a. 0.4 1.6 1.9 2.2 2.8 2.9
Hungaryb -0.4 0.6 0.0 -0.3 0.0 -0.3 -0.4
Lithuania -0.2 0.5 1.3 1.4 0.6 0.1 -0.9
Polandc -2.3 -2.2 -1.2 -2.5 -2.2 -1.8 -2.2
Romania -0.8 -0.7 0.3 1.0 0.6 -0.1 -0.3
Slovak Republic -0.2 -0.4 -0.6 -2.2
Sloveniaa. Preliminary.b. Excludes underage disability pensions of the Health Insurance Fund.c. Excludes the cost of the Farmers' Pension Program.
In the medium term, some of these countries will continue to register a deficit ascontributions are diverted from the PAYG to the funded pillar,82 calling attention to the need forfurther reform. In Poland, the reforms have diminished deficits in the public pillar from 7.5percent to 2.2 percent of GDP in 2050, yet disability remains a burden in the public system andthe cause of remaining imbalances.
In comparison, however, the group of CEEC countries (the Czech Republic, the SlovakRepublic, and Slovenia) that adopted a more gradual approach toward pension reform standson a much weaker financial footing (table 4.4). Pressure to reform in this group of countrieswas initially less intense since their system dependency ratios did not deteriorate as severely(Figure 4.4). While in other CEEC economies sharper reductions in benefits had served todiscredit public schemes, these three countries were thus able continue to index pensions closeto wages. Under the circumstances, a political consensus to undertake anything more thanparametric reforms has proven evasive.
82The initial transition costs will be as high as 1.5 percent of GDP in countries with a larger pillar.
- 80 -

Ensunng Social Protection
Faced with a heightened dependence on budgetary transfers, Slovenia approved areform of the PAYG in 1999,83 and a new package of parametric reforms is being discussed. TheCzech Republic also approved a series of parametric reforms during the second half of the lastdecade, the most important of which is the 1995 Law. Yet there is a growing realization that,left unattended, deficits are set to expand at a rapid pace.
If the more limited parametric changes have occasionally succeeded in narrowingfinancial gaps, then they have fallen short of building sustainable systems. Thus, while theperformance of public pillars in most other CEEC countries will improve over the coming years,financial pressures are mounting in the public schemes of this group of countries.
As regards Romania, the figures presented in table 4.4 only suggest that financialviability in the public pillar could potentially be restored if the government used the discretionthe pension law provides to set a prudent replacement rate and indexation rule. In practice,however, this discretion has already been used to dissipate some of the early benefits ofreform,84 putting the country back onto unsustainable grounds.
Challenges Ahead
Two broad clusters can therefore be identified: those facing the challenge ofconsolidating recent reforms and those that still need to define a feasible approach to reform.The first group of countries (Bulgaria, Estonia, Latvia, Hungary, and Poland) will have toaddress three key issues: (a) enhancing coverage and compliance, (b) consolidating thereformed public pillar, and (c) promoting the safe development of private pension plans. Thecoverage of pension schemes was greatly diminished during the transition decade in mostCEEC countries, and these countries must now rebuild much of the lost contribution bases.Expanding coverage and enhancing compliance will improve the finances of the public pensionscheme in the short and medium term and might even permit a modest decline in the heftycontribution rate with a positive labor market impact. If coverage is not reestablished, then asecond negative outcome will arise in the long term, because many workers could be leftwithout adequate retirement income, facing the risk of poverty during their old age or imposingan additional cost on the public safety net.
Within this first group the minimum retirement age, particularly that of women,remains low compared to levels prevalent in OECD countries (closer to 65 years). In addition togender inequities, the prevailing low retirement age for women imposes a cost burden on theDB-PAYG, especially since life expectancy of women is higher. In the NDC schemes, benefits
83 This reform package inter alia increased the pensionable age for women and established a system of penalties andbonuses for early and delayed retirement, and decreased the accrual rate. This reform was complemented by theintroduction of new fiscal incentives in the voluntary pillar. The amendments to the retirement age and the partialcuts in the accrual rate, albeit a positive step, were not sufficient to attam long-term sustainability (table 4.4).84The projections for Romania assume that the point value is set at 35 percent of the average wage and pensions areindexed to prices not wages. The new public pillar law, however, stipulates a broad range (30-50 percent of theaverage wage) withm which the replacement rate can vary and defines no principles for determining it Thegovernment has not yet defined what the point value will be in the medium term. This loosely defined benefitstructure renders the system highly vulnerable to political interference. If indexation of benefits is not de-linked fromthe point values system, the deficit will grow to reach 5 percent of GDP by 2050.
- 81 -

Expenditure Policies Toward EU Accession
will vary according to the retirement age, and women face the risk of receiving inadequatelylow pensions during their old age. For this reason, Latvia is eliminating the gender gap andincreasing the retirement age to 62 years for both genders.
Similar concerns are emerging in Poland, where the retirement age for women is 60years. Disability insurance remains a potential source of rising expenditures within the publicschemes, particularly as older workers might claim this benefit in response to tighter eligibilityrequirements for old age benefits.85 The matter is especially critical in Poland, which hasinherited a large stock of disabled pensioners. Poland also faces the challenge of revising theFarmers' Pension Scheme, a largely noncontributory scheme costing 2 percent of GDP.8 6
The safe development of private pension plans will also be of paramount importance ifthe multi-pillar reform is to reach its ultimate goal of providing adequate retirement. Theinstitutional capacity for supervising the newly established pension plans, which will quicklybecome the most important institutional investors, needs to be strengthened considerably inmost CEEC countries. The assets of pension plans in Hungary and Poland will surpass 20percent of GDP by 2020. In some cases, a guarantee has been built into the mandatory secondpillar through a minimum pension or other mechanism.87 Even without an explicit guarantee,the state will still bear an implicit liability in cases of poor performance owing to the pensionplans' mandatory nature.
Rigorous provisions have been set for the investment regime of these plans, includingquantitative restrictions on asset classes (for example, equity, private fixed-income and foreigninvestment) to reduce portfolio risks given the early development of capital markets in mostCEEC countries. By contrast, investment restrictions in EU countries are largely limited toceilings on a single issuer or an affiliated party. These tight provisions will need to beprogressively relaxed as the experience of pension funds increases and the supervisory capacitymatures allowing pension funds to benefit from full integration with EU capital markets. Anexcessively tight regime will constrain diversification and opportunities to attain a higherreturn.
A second group of countries (including Lithuania, the Czech Republic, the SlovakRepublic, and Slovenia) is in the midst of approving further reforms or finding a reform path.In Lithuania, the long-term finances of the public pillar appear sound (table 4.4). And theestablishment of the proposed mandatory second pillar should move forward, paving the wayfor greater diversification of retirement income sources and strengthening the connection
85 In Lithuania, for example, the number of old age pensioners stabilized following the rise in the retirement age. Intum, the number of disabled has been rising at a fast pace.86 Various approaches have been considered in the past, including the partition of the system in two. Higher-incomefarmers would be switched to the contributory scheme available to other workers, and lower-income farmers wouldremain in the non-contributory one. But the current capacity to assess farmers' income is weak.87 In some countries (for example, Poland and Hungary), the second pillar also carries a relative rate of returnguarantee, an attempt to protect workers against poorly performing funds. The guarantee is financed from a specialreserve created by the pension fund manager from his assets. In the case of Hungary, this guarantee is more looselyconstructed allowing for some discretion. In addition, there is a guarantee fund in Poland and Hungary in case theasset manager fails to cover this reserve. In Hungary, the guarantee fund will also cover any shortfall in the secondpillar benefit below 25 percent of the value of the first pillar pension. These guarantee funds are financed by pensionfund administrators. A shortfall of reserves in these funds could potentially lead to a state liability.
- 82-

Ensunng Social Protection
between overall contributions and benefits, given the relatively flat structure of the public pillar.If the size of the funded pillar remains modest, then it might be desirable to further enhance theearnings-related component of the public pillar to attain a closer link between contributions andbenefits.
In the Czech Republic, the Slovak Republic, and Slovenia, the quest for a moresustainable reform has proven difficult. New parametric reforms are being discussed in theSlovak Republic and Slovenia, and the pension reform debate is also intensifying in the CzechRepublic. The new wave of reforms should seek to restore long-term sustainability, not only totemporarily contain deficits. Continued small parametric reforms will eventually erode trust in thepublic pillar. The Slovak Republic and the Czech Republic are also seeking to further promotethe voluntary pillar, inter alia through occupational schemes, to compensate for the foreseen cutin the public pillar replacement rate. But, the voluntary pillar might not reach the desiredcoverage of younger workers. Policymakers might also want to explore the diversion of a smallshare of contributions to the privately funded system as an additional option to enhance overalrisk diversification within the pension system.
Romania is a case apart. As noted above, its pension system experienced the mostsevere stress during the transition decade, with the system dependency ratio rising to 95percent by 2000. A new public pillar law became effective in mid-2001 as part of a broadereffort to establish a multi-pillar pension system. The public pillar law introduced some positivesteps but retained excessive discretion in the determination of benefits, which could jeopardizeits financial sustainability. Moreover, the macroeconomic framework is not yet stable, whichcould impair the growth of safe financial instruments and the government's capacity to financetransition costs in the public pillar.
The elimination of excessive discretion in the public pillar law and identification of aviable replacement rate, increased efforts to improve compliance, and a strongermacroeconomic framework are essential pre-conditions for the successful introduction of amandatory funded pillar. The country now needs to accelerate the increase in the retirementage and eliminate the retirement age gender gap to further dent the excessive dependency ratioand possibly permit a small decline in social insurance contribution rates, which are the highestamong CEEC countries placing Romania at a serious competitive disadvantage.
Concluding Remarks
The transition decade imposed a severe shock in the PAYG schemes inherited from thecentrally planned era. But many of the candidates have emerged with systems that are betterplaced to face the challenge of the aging demographics, and those that are turning theirattention to reform now have a rich body of experience from which to draw. Indeed, many ofthese systems are now on a stronger long-term financial footing than pension schemes in many EUcountries that have not yet found a sustainable reform path. As table 4.5 illustrates, public pensionexpenditures will rise by more than four percentage points of GDP in at least nine of the EU-15countries over the next four decades, and in three of them the rise will surpass 6 percent ofGDP.
- 83 -
Expenditure Policies Toward EU Accession
Table 4.5 Public Pension Expenditures in EU Member Countries: 2000-50(percent of GDP)
Peaka2000 2010 2020 2030 2040 2050 change
Belgium 10.0 9.9 11.4 13.3 13.7 13.3 3.7Denmarkb 10.5 12.5 13.8 14.5 14.0 13.3 4.1Germanyc 11.8 11.2 12.6 15.5 16.6 16.9 5.0Greece 12.6 12.6 15.4 19.6 23.8 24.8 12.2Spain 9.4 8.9 9.9 12.6 16.0 17.3 7.9France 12.1 13.1 15.0 16.0 15.8 4.0Ireland d 4.6 5.0 6.7 7.6 8.3 9.0 4.4Italy 13.8 13.9 14.8 15.7 15.7 14.1 2.1Luxembourg 7.4 7.5 8.2 9.2 9.5 9.3 2.2Netherlands 7.9 9.1 11.1 13.1 14.1 13.6 6.2Austria 14.5 14.9 16.0 18.1 18.3 17.0 4.2Portugal 9.8 11.8 13.1 13.6 13.8 13.2 4.1Finland 11.3 11.6 12.9 14.9 16.0 15.9 4.7Sweden 9.0 9.6 10.7 11.4 11.4 10.7 2.6United Kingdom 5.5 5.1 4.9 5.2 5.0 4.4 -1.1
EU-15 10.4 10.4 11.5 13.0 13.6 13.3 3.2a. Calculated from five-year interval data. Includes all replacement revenues to peopleover age 55, before taxes.b. For Denmark, the results indude the semi-funded labor market pension (ATP). If theAT? were excluded, the peak increase would be 2.7 percent of GDP.c. Germany's projections do not incorporate the impact of the 1991 reform.d. Results for Ireland are expressed as a percentage of GNP.Source: Oksanen, "Building a Sustainable Pension System", Paper presented at theConference on Building a Sustainable Pension System, Prague, November 2001.
REFORMING HEALTH CARE
Following a decade of escalation in the cost of health care, almost all the CEECs havenow transformed the basic setup of their health care system in a bid to raise additionalresources for the sector and to curb costs through efficiency gains. These objectives would beachieved through the separation of financing the provision of health care, the introduction ofsocial health insurance, the establishment of new provider payment mechanisms,decentralization, and competition among providers and greater choice for patients.
Although in many countries the reforms are too recent to judge, a few tentativeobservations may be made:
* While countries have been experimenting with various provider paymentarrangements there is little sign as yet that health costs would have beensuccessfully contained. Difficulties in collecting social insurance contributionssometimes exacerbate the resulting financial strains.
- 84 -
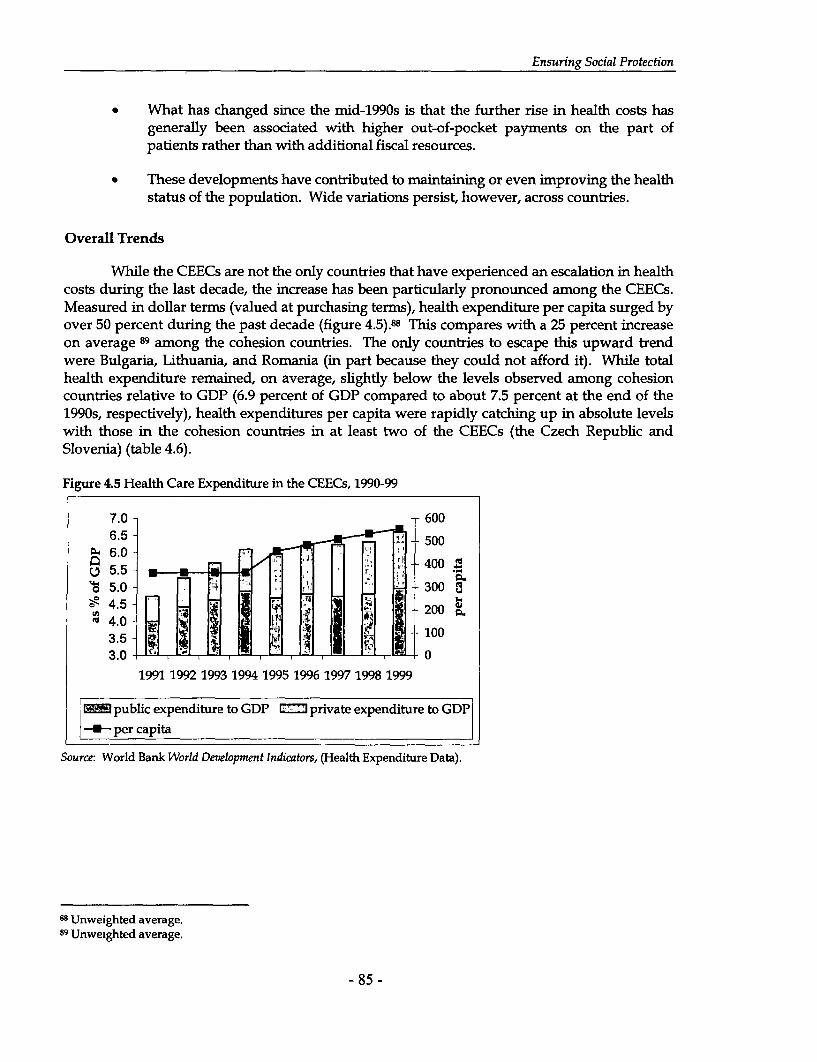
Ensuring Social Protection
* What has changed since the mid-1990s is that the further rise in health costs hasgenerally been associated with higher out-of-pocket payments on the part ofpatients rather than with additional fiscal resources.
* These developments have contributed to maintaining or even improving the healthstatus of the population. Wide variations persist, however, across countries.
Overall Trends
While the CEECs are not the only countries that have experienced an escalation in healthcosts during the last decade, the increase has been particularly pronounced among the CEECs.Measured in dollar terms (valued at purchasing terms), health expenditure per capita surged byover 50 percent during the past decade (figure 4.5).88 This compares with a 25 percent increaseon average 89 among the cohesion countries. The only countries to escape this upward trendwere Bulgaria, Lithuania, and Romania (in part because they could not afford it). While totalhealth expenditure remained, on average, slightly below the levels observed among cohesioncountries relative to GDP (6.9 percent of GDP compared to about 7.5 percent at the end of the1990s, respectively), health expenditures per capita were rapidly catching up in absolute levelswith those in the cohesion countries in at least two of the CEECs (the Czech Republic andSlovenia) (table 4.6).
Figure 4.5 Health Care Expenditure in the CEECs, 1990-99
7.0 - 6006.5 -
t60- M _ 2 30'S50 ~ ~ ~ ~ ~~~~~~~~0
3.0 - 300
1991 1992 1993 1994 1995 1996 1997 1998 1999
sqpublic expenditure to GDP private expenditure to GDP
-U per capita
Source: World Bank World Development Indicators, (Health Expenditure Data).
B8 Unweighted average.89 Unweighted average.
-85 -
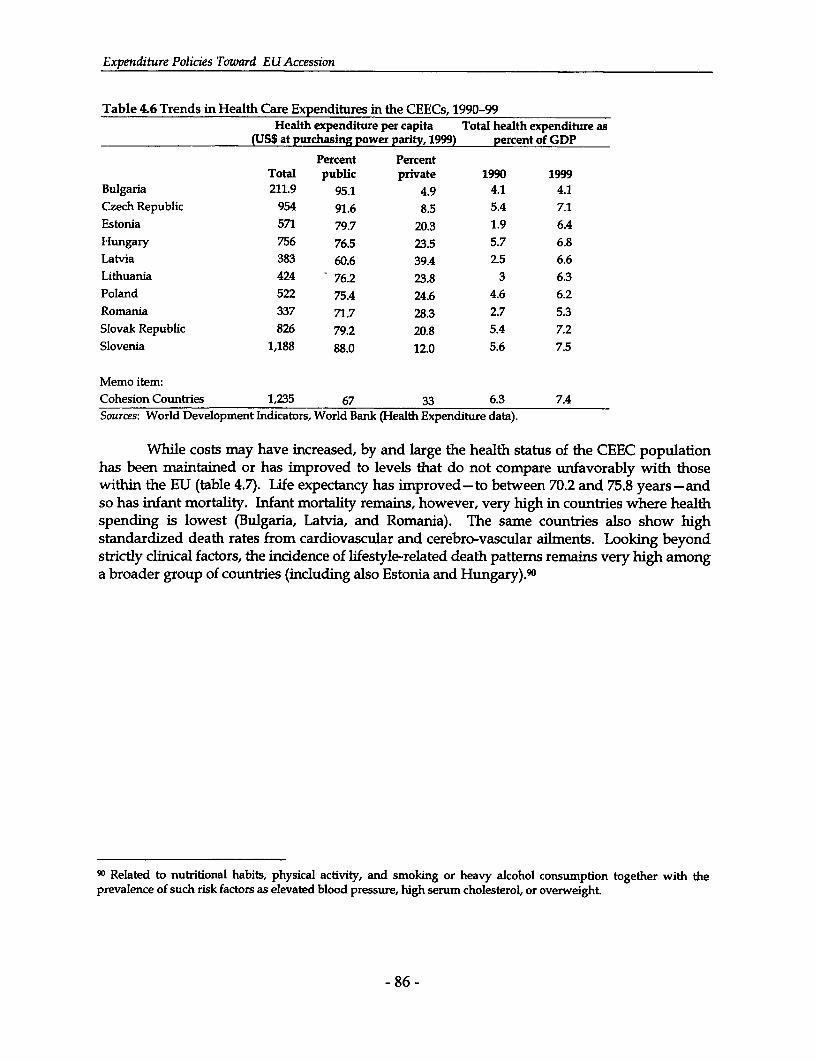
Expenditure Policies Toward EUAccession
Table 4.6 Trends in Health Care Expenditures in the CEECs, 1990-99Health expenditure per capita Total health expenditure as
(US$ at purchasing power parity, 1999) percent of GDP
Percent PercentTotal public private 1990 1999
Bulgaria 211.9 95.1 4.9 4.1 4.1Czech Republic 954 91.6 8.5 5.4 7.1Estonia 571 79.7 20.3 1.9 6.4Hungary 756 76.5 23.5 5.7 6.8Latvia 383 60.6 39.4 2.5 6.6Lithuania 424 - 76.2 23.8 3 6.3Poland 522 75.4 24.6 4.6 6.2Romania 337 71.7 28.3 2.7 5.3Slovak Republic 826 79.2 20.8 5.4 7.2Slovenia 1,188 88.0 12.0 5.6 7.5
Memo item:Cohesion Countries 1,235 67 33 6.3 7.4Sources: World Development Indicators, World Bank (Health Expenditure data).
While costs may have increased, by and large the health status of the CEEC populationhas been maintained or has improved to levels that do not compare unfavorably with thosewithin the EU (table 4.7). Life expectancy has improved-to between 70.2 and 75.8 years-andso has infant mortality. Infant mortality remains, however, very high in countries where healthspending is lowest (Bulgaria, Latvia, and Romania). The same countries also show highstandardized death rates from cardiovascular and cerebro-vascular ailments. Looking beyondstrictly clinical factors, the incidence of lifestyle-related death patterns remains very high amonga broader group of countries (including also Estonia and Hungary).90
90 Related to nutritional habits, physical activity, and smoking or heavy alcohol consumption together with theprevalence of such risk factors as elevated blood pressure, high serum cholesterol, or overweight.
- 86 -
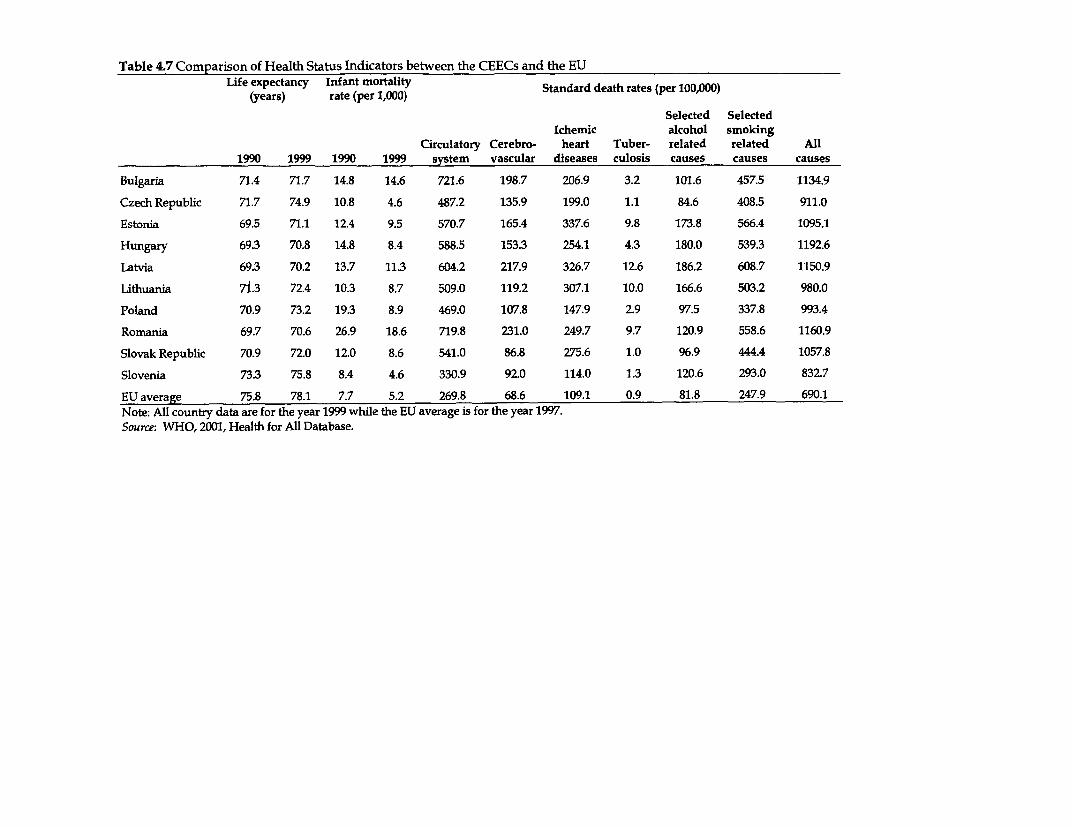
Table 4.7 Comparison of Health Status Indicators between the CEECs and the EULife expectancy Infant mortality Standard death rates (per 100,000)
(years) rate (per 1,000)
Selected SelectedIchemic alcohol smoking
Circulatory Cerebro- heart Tuber- related related All1990 1999 1990 1999 system vascular diseases culosis causes causes causes
Bulgaria 71.4 71.7 14.8 14.6 721.6 198.7 206.9 3.2 101.6 457.5 1134.9Czech Republic 71.7 74.9 10.8 4.6 487.2 135.9 199.0 1.1 84.6 408.5 911.0Estonia 69.5 71.1 12.4 9.5 570.7 165.4 337.6 9.8 173.8 566.4 1095.1Hungary 69.3 70.8 14.8 8.4 588.5 153.3 254.1 4.3 180.0 539.3 1192.6Latvia 69.3 70.2 13.7 11.3 604.2 217.9 326.7 12.6 186.2 608.7 1150.9Lithuania 7i.3 72.4 10.3 8.7 509.0 119.2 307.1 10.0 166.6 503.2 980.0Poland 70.9 73.2 19.3 8.9 469.0 107.8 147.9 2.9 97.5 337.8 993.4Romania 69.7 70.6 26.9 18.6 719.8 231.0 249.7 9.7 120.9 558.6 1160.9Slovak Republic 70.9 72.0 12.0 8.6 541.0 86.8 275.6 1.0 96.9 444.4 1057.8Slovenia 73.3 75.8 8.4 4.6 330.9 92.0 114.0 1.3 120.6 293.0 832.7EU average 75.8 78.1 7.7 5.2 269.8 68.6 109.1 0.9 81.8 247.9 690.1Note: All country data are for the year 1999 while the EU average is for the year 1997.Source: WHO, 2001, Health for All Database.
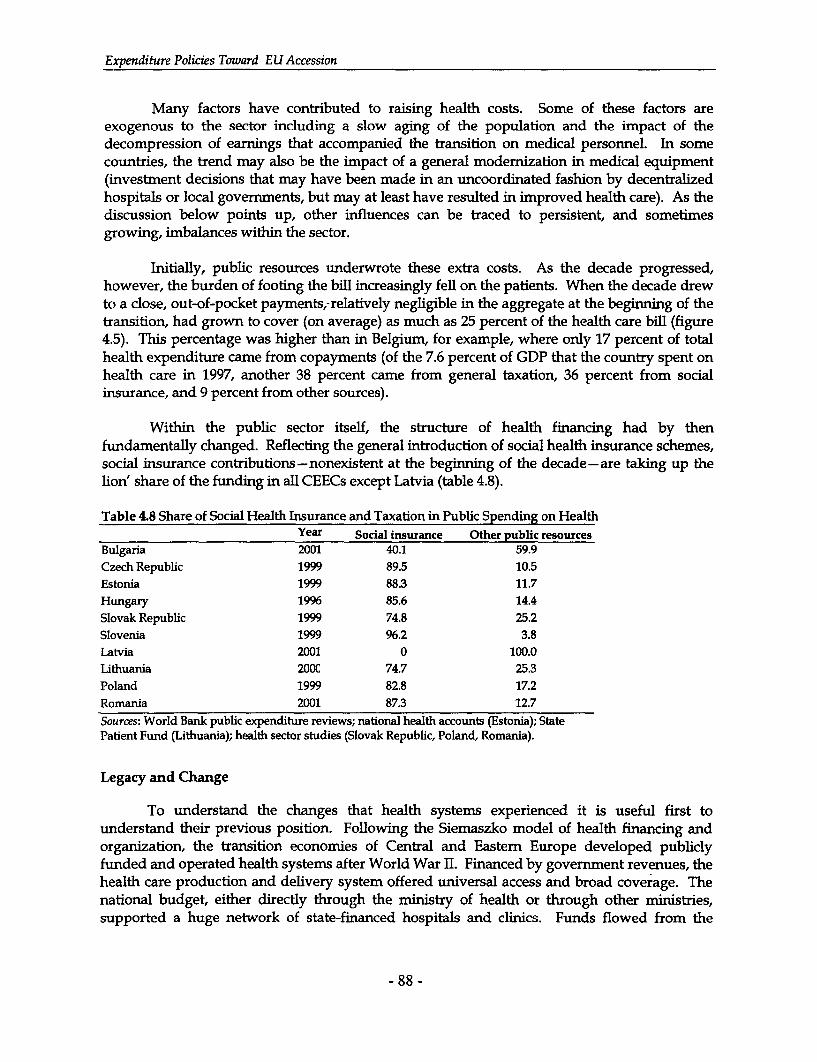
Expenditure Policies Toward EU Accession
Many factors have contributed to raising health costs. Some of these factors areexogenous to the sector including a slow aging of the population and the impact of thedecompression of earnings that accompanied the transition on medical personnel. In somecountries, the trend may also be the impact of a general modernization in medical equipment(investment decisions that may have been made in an uncoordinated fashion by decentralizedhospitals or local governments, but may at least have resulted in improved health care). As thediscussion below points up, other influences can be traced to persistent, and sometimesgrowing, imbalances within the sector.
Initially, public resources underwrote these extra costs. As the decade progressed,however, the burden of footing the bill increasingly fell on the patients. When the decade drewto a close, out-of-pocket payments,-relatively negligible in the aggregate at the beginning of thetransition, had grown to cover (on average) as much as 25 percent of the health care bill (figure4.5). This percentage was higher than in Belgium, for example, where only 17 percent of totalhealth expenditure came from copayments (of the 7.6 percent of GDP that the country spent onhealth care in 1997, another 38 percent came from general taxation, 36 percent from socialinsurance, and 9 percent from other sources).
Within the public sector itself, the structure of health financing had by thenfundamentally changed. Reflecting the general introduction of social health insurance schemes,social insurance contributions -nonexistent at the beginning of the decade - are taking up thelion' share of the funding in all CEECs except Latvia (table 4.8).
Table 4.8 Share of Social Health Insurance and Taxation in Public Spending on HealthYear Social insurance Other public resources
Bulgaria 2001 40.1 59.9Czech Republic 1999 89.5 10.5Estonia 1999 88.3 11.7Hungary 1996 85.6 14.4Slovak Republic 1999 74.8 25.2Slovenia 1999 96.2 3.8Latvia 2001 0 100.0Lithuania 200C 74.7 25.3Poland 1999 82.8 17.2Romania 2001 87.3 12.7Sources: World Bank public expenditure reviews; national health accounts (Estonia); StatePatient Fund (Lithuania); health sector studies (Slovak Republic, Poland, Romania).
Legacy and Change
To understand the changes that health systems experienced it is useful first tounderstand their previous position. Following the Siemaszko model of health financing andorganization, the transition economies of Central and Eastem Europe developed publiclyfunded and operated health systems after World War II. Financed by government revenues, thehealth care production and delivery system offered universal access and broad coverage. Thenational budget, either directly through the ministry of health or through other ministries,supported a huge network of state-financed hospitals and clinics. Funds flowed from the
- 88 -
Ensuring Social Protection
central ministries to provincial and municipal governments that, in turn, allocated funds tohealth providers.
By and large, the allocation of funds was made on a historical basis, with someadjustments for inflation and epidemiology, and in some cases the allocation was based onpopulation demographics. Outpatient and primary health services were generally provided inregional and county clinics or health centers at the places of employment. Secondary serviceswere provided mainly in provincial hospitals, while specialized services were provided inuniversity hospitals, medical academies, and science and research institutes. Most healthproviders were state employees and were paid on a salary basis.
While the socialist health systems succeeded in providing risk protection and equityacross the population, technical and allocative inefficiencies were commonplace and clinicalquality was low, largely owing to the inherent system of incentives and a system of practice inresponse to these incentives. First, given the nature of the allocation of funds, most healthproviders had no incentives to develop fiscal and strategic planning functions. Thepredictability of budgetary allocations undermined the need to improve managerial andorganizational capacity, which effectively slowed the process of innovation and the ability torespond to changes. Second, paying health care providers on the basis of salaries underminedthe importance of effort and productivity. As a consequence, there was little effort to improveefficiency and the quality of care, as a result of which patients faced erratic service. Third, thereorganization and restructuring of the public sector was slow, as a result of which the publichealth care system came to be characterized by overstaffing, misallocation of resources,underutilization of capacity in some areas and under-supply in others, and shortages of drugsand medical supplies.
The transition brought into the open a widespread dissatisfaction with the healthsystem. Patients were dissatisfied with the quality of care, with restrictions in the choice ofprovider, and with increasing unofficial payments. Medical personnel were dissatisfied withlow compensation levels. Cost inflation, new technology, and rising consumer expectationsfurther exacerbated the situation. The loss of fiscal resources that most CEECs experienced atthe beginning of the transition made the entire arrangements increasingly unsustainable.
Therefore, in a bid to maintain earlier levels of coverage, governments around the regionsought to raise nonbudgetary sources of revenues for the sector, while instigatingimprovements in the use of existing resources. In doing this, many countries of in the region,invoking the principles of solidarity, moved to the Bismarckian model of predominantly socialinsurance-based financing. Hungary opened the way in 1990 and the other CEECs followed.By the turn of the millennium, only Latvia still ran a (reformed) single payer system (table 4.9).
- 89 -
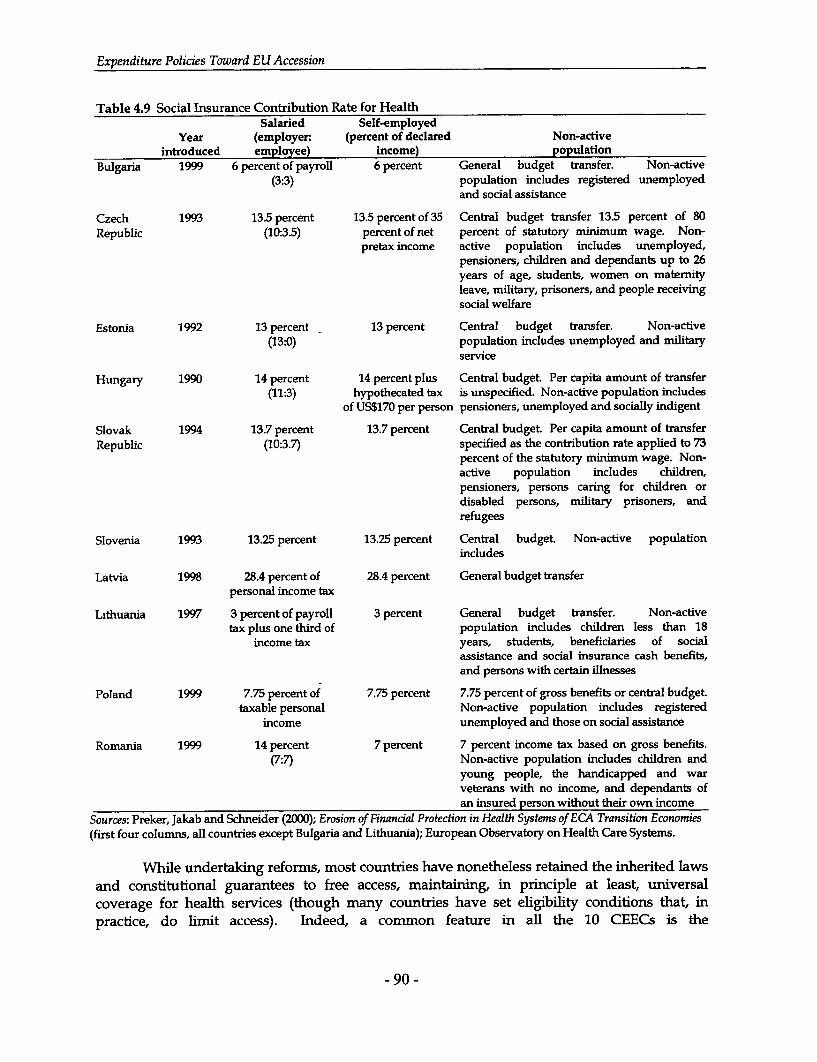
Expenditure Policies Toward EU Accession
Table 4.9 Social Insurance Contribution Rate for HealthSalaried Self-employed
Year (employer (percent of declared Non-activeintroduced employee) income) population
Bulgaria 1999 6 percent of payroll 6 percent General budget transfer. Non-active(3:3) population includes registered unemployed
and social assistance
Czech 1993 13.5 percent 13.5 percent of 35 Central budget transfer 13.5 percent of 80Republic (10:3.5) percent of net percent of statutory minimum wage. Non-
pretax income active population includes unemployed,pensioners, children and dependants up to 26years of age, students, women on maternityleave, military, prisoners, and people receivingsocial welfare
Estonia 1992 13 percent 13 percent Central budget transfer. Non-active(13:0) population includes unemployed and military
service
Hungary 1990 14 percent 14 percent plus Central budget. Per capita amount of transfer(11:3) hypothecated tax is unspecified. Non-active population includes
of US$170 per person pensioners, unemployed and sociaUy indigent
Slovak 1994 13.7 percent 13.7 percent Central budget. Per capita amount of transferRepublic (10:3.7) specified as the contribution rate applied to 73
percent of the statutory minimum wage. Non-active population includes children,pensioners, persons caring for children ordisabled persons, military prisoners, andrefugees
Slovenia 1993 13.25 percent 13.25 percent Central budget. Non-active populationincludes
Latvia 1998 28.4 percent of 28.4 percent General budget transferpersonal income tax
Lithuania 1997 3 percent of payroll 3 percent General budget transfer. Non-activetax plus one third of population includes children less than 18
income tax years, students, beneficiaries of socialassistance and social insurance cash benefits,and persons with certain illnesses
Poland 1999 7.75 percent of 7.75 percent 7.75 percent of gross benefits or central budgettaxable personal Non-active population includes registered
income unemployed and those on social assistance
Romania 1999 14 percent 7 percent 7 percent income tax based on gross benefits.(7:7) Non-active population includes children and
young people, the handicapped and warveterans with no income, and dependants ofan insured person without their own income
Sources: Preker, Jakab and Schneider (2000); Erosion of Financial Protection in Health Systems of ECA Transition Economies(first four columns, all countries except Bulgaria and Lithuania); European Observatory on Health Care Systems.
While undertaking reforms, most countries have nonetheless retained the inherited lawsand constitutional guarantees to free access, maintaining, in principle at least, universalcoverage for health services (though many countries have set eligibility conditions that, inpractice, do limit access). Indeed, a common feature in all the 10 CEECs is the
- 90 -
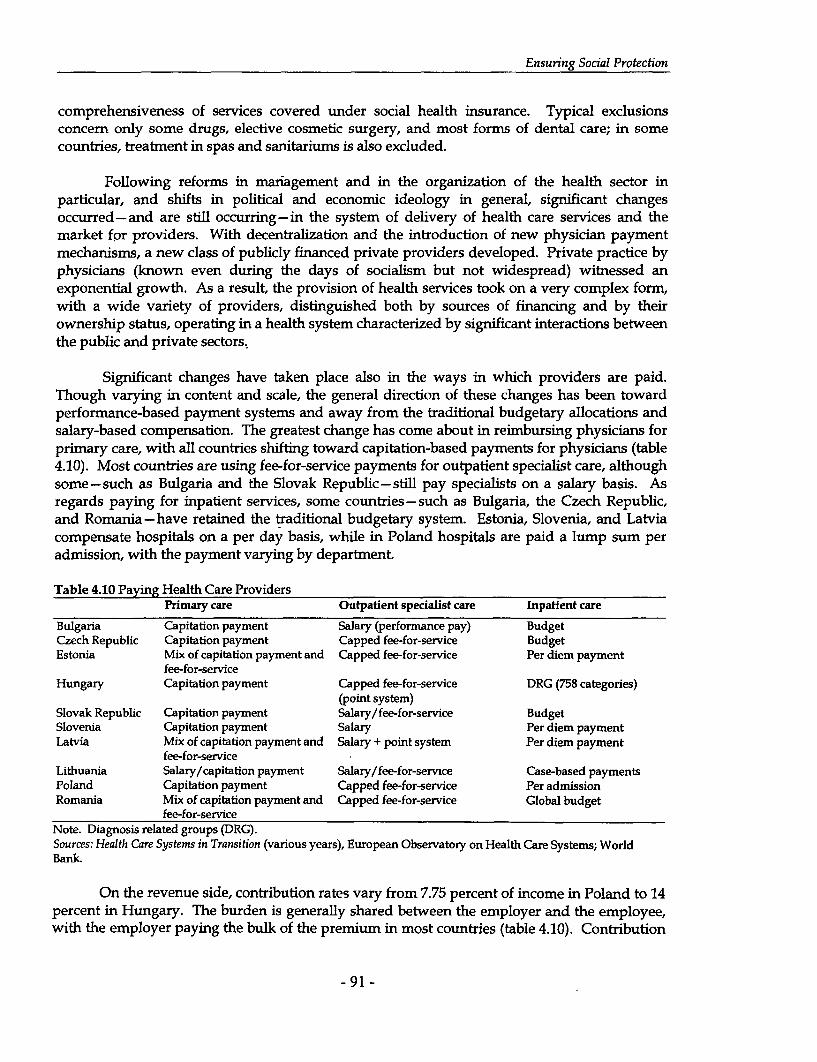
Ensuring Social Protection
comprehensiveness of services covered under social health insurance. Typical exclusionsconcern only some drugs, elective cosmetic surgery, and most forms of dental care; in somecountries, treatment in spas and sanitariums is also excluded.
Following reforms in maniagement and in the organization of the health sector inparticular, and shifts in political and economic ideology in general, significant changesoccurred - and are still occurring - in the system of delivery of health care services and themarket for providers. With decentralization and the introduction of new physician paymentmechanisms, a new class of publicly financed private providers developed. Private practice byphysicians (known even during the days of socialism but not widespread) witnessed anexponential growth. As a result, the provision of health services took on a very complex form,with a wide variety of providers, distinguished both by sources of financing and by theirownership status, operating in a health system characterized by significant interactions betweenthe public and private sectors.
Significant changes have taken place also in the ways in which providers are paid.Though varying in content and scale, the general direction of these changes has been towardperformance-based payment systems and away from the traditional budgetary allocations andsalary-based compensation. The greatest change has come about in reirnbursing physicians forprimary care, with all countries shifting toward capitation-based payments for physicians (table4.10). Most countries are using fee-for-service payments for outpatient specialist care, althoughsome-such as Bulgaria and the Slovak Republic-still pay specialists on a salary basis. Asregards paying for inpatient services, some countries -such as Bulgaria, the Czech Republic,and Romania -have retained the traditional budgetary system. Estonia, Slovenia, and Latviacompensate hospitals on a per day basis, while in Poland hospitals are paid a lump sum peradmission, with the payment varying by department.
Table 4.10 Paying Health Care ProvidersPrimary care Outpatient specialist care Inpatient care
Bulgaria Capitation payment Salary (performance pay) BudgetCzech Republic Capitation payment Capped fee-for-service BudgetEstonia Mix of capitation payment and Capped fee-for-service Per diem payment
fee-for-serviceHungary Capitation payment Capped fee-for-service DRG (758 categories)
(point system)Slovak Republic Capitation payment Salary/fee-for-service BudgetSlovenia Capitation payment Salary Per diem paymentLatvia Mix of capitation payment and Salary + point system Per diem payment
fee-for-serviceLithuania Salary/capitation payment Salary/fee-for-service Case-based paymentsPoland Capitation payment Capped fee-for-service Per admissionRomania Mix of capitation payment and Capped fee-for-service Global budget
fee-for-serviceNote. Diagnosis related groups (DRG).Sources: Health Care Systems in Transition (various years), European Observatory on Health Care Systems; WorldBank.
On the revenue side, contribution rates vary from 7.75 percent of income in Poland to 14percent in Hungary. The burden is generally shared between the employer and the employee,with the employer paying the bulk of the premium in most countries (table 4.10). Contribution
- 91 -

Expenditure Policies Toward EU Accession
rates for the self-employed are the same in many countries, although most countries haveintroduced minimum and maximum contributions. The non-active population-the definitionof which varies across countries but generally includes pensioners, registered unemployed, thepoor, and in some cases children and family dependants -is covered by explicit transfers fromthe central budget.
Fiscal Impacts
The various reforms have been successful in at least two of their objectives: maintaininghealth coverage and raising nonbudgetary resources for the sector (although these resourcesmay not be additional). Many countries, however, are still struggling to secure the expectedefficiency gains from the reforms and to put the new arrangements on a firm financial footing.These two outstanding issues will now be examined in turn.
Cost Containment
Despite the reforms, little progress has been made in correcting the prevailinginefficiencies in the supply of health services and in containing health costs. On the contrary,the huge infrastructure of hospitals, hospital beds, polyclinics, health centers, and healthpersonnel inherited from the communist days continues to drain public resources. In someareas, the imbalances have actually worsened. While all the CEECs succeeded in bringingabout significant reductions in the number of hospital beds following the transition, only afew-such as Latvia and Estonia-also succeeded in reducing the number of physicians overtime (table 4.11). The demands of maintaining a large physical infrastructure alone requiresignificant outlays of health expenditures, effectively reducing the available resources for drugs,equipment, and consumables. Similarly, many of these countries were unable to reorientservice provision from the relatively expensive acute hospital sector to lower levels of care. Asa result, hospital admission rates increased in almost all countries while outpatient visits fellsubstantially in 6 of the 10 countries.
Table 4.11 Hospital Beds, Physician, and Utilization PatternsHospital beds Physicians per Hospital admission Outpatient consultations
per 1,000 100,000 rates per 100 per person(percent change, (percent change, (percent change, (percent change,
1990-99) 1990-99) 1990-99) 1990-99)Bulgaria -23.3 8.52 -16.82 -18.18Czech Republic -22.44 11.81 7.07 4.32Estonia -37.94 -12.03 6.36 -20.25Hungary -14.74 12.62 16.47 25.81Slovak Republic -9.50 18.46 17.99 20.37Slovema -8.11 4.88 5.99 13.23Latvia -36.75 -23.84 -1.69 -39.51Lithuania -24.60 -1.75 31.42 -15.38Poland -22.73 5.61 30.19 -10.00Romania -18.05 6.11 3.08 -22.89
Source: World Bank
Part of this syndrome can be attributed to persistent organizational inflexibility, evenafter the reforms, but it also reflects the uneven progress in actually separating health care
- 92 -
.Ensunng Social Protecton
financing and provision and in establishing hard budget constraints and competition amongproviders and the difficulties countries have encountered in designing. incentive-compatibleprovider payment systems as part of the financing reforms.
Separation of Financing and Provision. The central thrust of the reforms was to createquasi-market situations in which decentralized health care providers compete to attract patientsand insurance companies to purchase their services. In practice, however, the reality is that, inmost countries under review, the health insurance companies still perform little in the way ofinsurance functions, be they claims adjustments or quality control-not to mention the settingof premiums and the management of risk exposures (as indemnity insurance would do). Untilrecently, in the Slovak Republic, for example, insurance companies largely served as passiveconduits to channel insurance contributions to hospitals, based on input-driven, ex ante budgetsrather than on competition for actual services. These insurance companies are now shiftingtoward a more active "structural contracting" for bulk purchases from hospitals.
Furthermore, despite the presence of multiple health insurance companies in somecountries, there is often neither scope for meaningful competition (see below) nor incentives forinsurance companies to economize or to be selective in their purchase of health services.Similarly, insurance contribution rates, health service prices, and benefit packages are all strictlyand uniformly regulated. Under the circumstances, there might be very few positive benefits tooffset the fragmentation and administrative inefficiencies introduced in the contributioncollection processes.
There also continues to be considerable ambiguity in many countries regarding capitaland investment funding, as a result of which health facilities keep postponing repair andmaintenance until they become critical (and more expensive). Clear capital and investmentpolicies need to be laid out in order to ensure a sustainable long-run capital investment andreplacement regime.
Competition among Providers. The scope is for meaningful competition among providersvaries across countries and health practices. While competitive private practices are now thenorm among CEECs, in countries like the Slovak Republic, for example, hospitals haveremained, for all practical purposes, essentially government departments with limitedaccountability and incentives to compete (this should change under the recently approvedtransfer of ownership program). Even if such incentives existed, hospitals might not react tothem in the absence of hard budget constraints. In contrast, one reason why the Czech Republichas made good progress with the new system, is that it succeeded early on in incorporating,privatizing, or otherwise decentralizing hospitals away from the former ministry of health.
Provider Payment Mechanisms. While the reform concept of mimicking competitivemarket arrangements has considerable intellectual appeal, defining the provider paymentformulas that would make it work has often proved to be a challenge. Some of the dilemmasare as follows. For outpatient care, physicians in most countries are paid on the basis of a fixedcapitation fee per enrollee for all outpatient services, regardless of the extent and nature of thetreatment sought. Physicians participating in this scheme bear most of the risk of treating apatient, and to this extent are likely to be conservative in the amount of health care theyprovide. Physicians on capitation payment are thus more likely to err on the side of over
- 93 -
Expenditure Policies Toward EU Accession
referring patients to specialists. This often becomes a beneficial arrangement for the physicianand for the patients, who prefer specialist care even if the primary care physician can equallywell provide the required treatment. However, this increases the costs to the health systemsince specialist care is relatively more expensive.
To compound the problem, apparently more market-driven arrangements can open theway to fee escalation. This has been the experience with the recent provider payment reformsin Bulgaria (under the guise of performance-based pay). It is to avoid such situations that mostCEECs now rely on regulated fee-for-service arrangements for specialists.
Similarly, prevailing systems of reimbursing hospitals often leave loopholes whereproviders can escape pressures to contain costs. Paying separately for each service renderedencourages increased use of interventions whose costs can be reimbursed. Paying per bed-dayencourages longer hospital stays because the days cost less toward the end of a stay.Reimbursing hospitals for all inputs used leaves the facility managers with no incentives tocontain costs.
In an effort to reach more satisfactory outcomes, a number of countries are nowexperimenting with some success with mixed payments systems (table 4.9) combining multiplerewards and penalties to deal with the multiple forms and opportunities for performances andabuses. This is the case with Romania, Estonia, and Latvia for general practitioners and withLatvia, Lithuania, and the Slovak Republic for specialists. Hungary and Lithuania have alsomoved toward case-mix based payment systems for inpatient services.
In the hospital sector, the prospective payment methods based on diagnosis relatedgroups (DRGs) also show a growing appeal. Under such a mechanism, hospitals are paid basedon an ex ante estimate of the "reasonable" costs that could be expected given the patient'scondition upon presentation, rather than as reimbursed for "actual costs incurred."Successfully implemented in Austria, this system seems to reduce the temptation for hospitalsto turn expensive patients away if the hospitals were assured of being paid relatively more (aswith a fixed budget), while providing a strong inducement to control costs. Hungary has beenpioneering this approach, and some features of it are being incorporated in the providerpayment system of Bulgaria. The Czech Republic regards its current fixed-budget system as atransitory step toward a DRG-type of arrangement that it is currently testing with a group ofhospitals.
Resource Mobilization
A number of countries have faced difficulties in collecting health insurancecontributions. To some extent, this is part of a more general phenomenon of noncompliancethat affects not only taxes and social insurance, but also other dues to utilities, suppliers, andbanks.
Other factors, more specific to health insurance, have also played a role. First,contribution rates are typically high in comparison with those applicable in EU countries,reaching 13-14 percent of salaries in the largest number of countries (table 4.8). Such rates areparticularly onerous given that dependants are often not covered by direct insurance payments.
- 94 -
Ensuring Social Protection
In Austria, in contrast, contribution rates (2000) vary from 6.4 percent for farmers to 9.1 percentfor the self-employed and internationals. White-collar employees contribute 6.9 percent ofwages (employers pay 51 percent), blue-collar employees contribute 7.9 percent (employers pay50 percent), and civil servants pay 7.1 percent (employers pay 45 percent). In Belgium, thecontribution rate (1997) is 7.35 percent for salaried persons, with the employer paying 52percent, and 3.2 percent of gross earnings for the self-employed.91
Furthermore, incentives for voluntary compliance are decidedly weakened when, as isgenerally the case, delinquency has no bearing on coverage. This blurs the distinction betweena social insurance contribution and a tax. Thus, it can be hard to avoid "free rider" behaviors onthe part of potential contributors (or their employers).
Finally, in a number of countries, the responsibility for collecting health contributions isleft with the insurance companies themselves. The insurance companies may have littleexperience in the matter, and little effectiveness in pressing claims perceived to have lowerseniority than, for example, taxes or pension contributions. The solution adopted by Poland ofassigning a single body to collect both pension and health insurance contributions seems in thisrespect to have considerable merit. This is also the plan in the Slovak Republic.
Illiquidity
One symptom of the divergence between revenue and cost containment performanceshas been the emergence in a number of countries mounting debts in the health systems (box4.1).
Out-of-Pocket Paymnents
One symptom of this divergence has been the spread of out-of-pocket payments on thepart of patients. As noted in figure 4.5, such payments have emerged as a major source ofhealth care financing. Out-of-pocket payments traditionally take two forms: formal copaymentsand informal out-of-pocket payments. Payments for pharmaceuticals generally account for thelargest part. Although hard numbers are lacking to substantiate this assertion, informalpayments may well account for the next largest item.
91 In Italy (1999), 90 percent of the regional tax collected under IRAP (zmposta regionale attiznta sulle produttive) isearmarked for health care. IRAP is levied at the rate of 9.6 percent of the first E20,660 salary for public sectoremployees and 3.8 percent on the next Euro 56,820, with the employer paying all the tax. For others, a 4.25 percentvalue-added tax is imposed on companies, corporations, and the self-employed. In addition, a piggyback tax (IRPEF)of 0.5 percent of gross incomes is levied, with 100 percent of the collections under this tax going for health care.
- 95 -
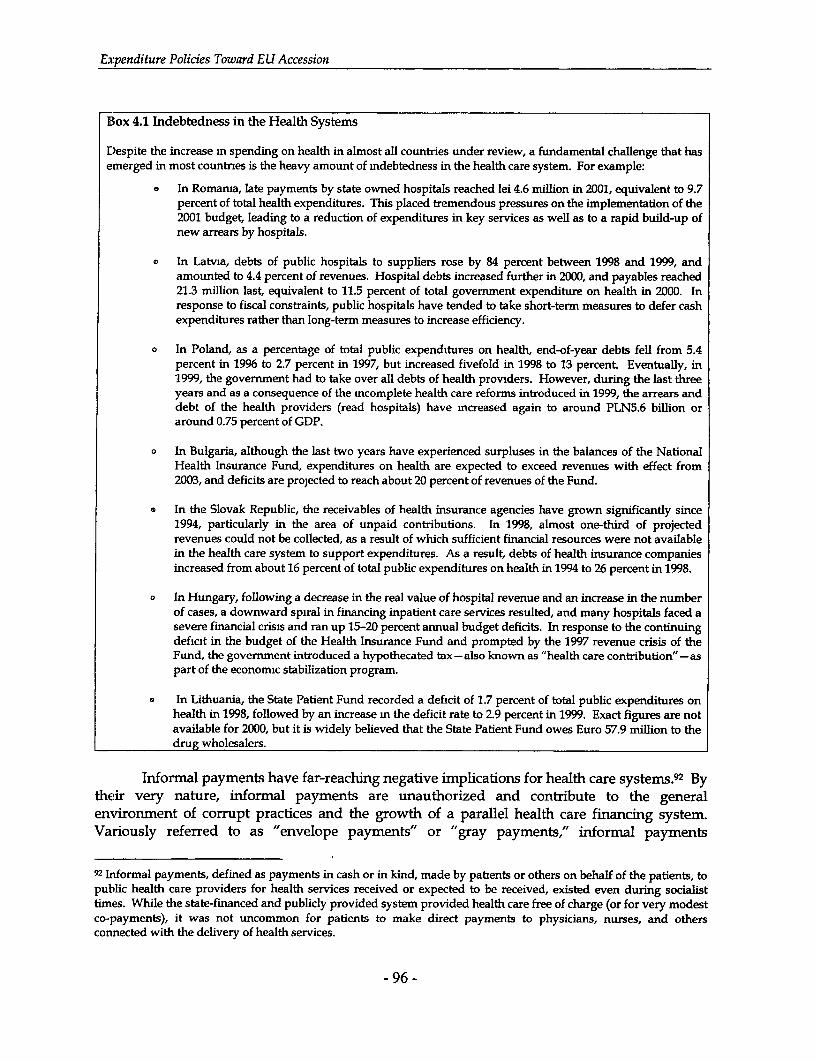
Expenditure Policies Toward EU Accession
Box 4.1 Indebtedness in the Health Systems
Despite the increase m spending on health in almost all countries under review, a fundamental challenge that hasemerged in most countries is the heavy amount of mdebtedness in the health care system. For example:
• In Romarua, late payments by state owned hospitals reached lei 4.6 million in 2001, equivalent to 9.7percent of total health expenditures. This placed tremendous pressures on the implementation of the2001 budget, leading to a reduction of expenditures in key services as well as to a rapid build-up ofnew arrears by hospitals.
o In Latvia, debts of public hospitals to suppliers rose by 84 percent between 1998 and 1999, andamounted to 4.4 percent of revenues. Hospital debts increased further in 2000, and payables reached21.3 million last, equivalent to 11.5 percent of total government expenditure on health in 2000. Inresponse to fiscal constraints, public hospitals have tended to take short-term measures to defer cashexpenditures rather than long-term measures to increase efficiency.
o In Poland, as a percentage of total public expenditures on health, end-of-year debts fell from 5.4percent in 1996 to 2.7 percent in 1997, but increased fivefold in 1998 to 13 percent. Eventually, in1999, the government had to take over all debts of health providers. However, during the last threeyears and as a consequence of the mcomplete health care reforms introduced in 1999, the arrears anddebt of the health providers (read hospitals) have mcreased again to around PLN5.6 billion oraround 0.75 percent of GDP.
o In Bulgaria, although the last two years have experienced surpluses in the balances of the NationalHealth Insurance Fund, expenditures on health are expected to exceed revenues with effect from2003, and deficits are projected to reach about 20 percent of revenues of the Fund.
* In the Slovak Republic, the receivables of health insurance agencies have grown significantly since1994, particularly in the area of unpaid contributions. In 1998, almost one-third of projectedrevenues could not be collected, as a result of which sufficient financial resources were not availablein the health care system to support expenditures. As a result, debts of health insurance companiesincreased from about 16 percent of total public expenditures on health in 1994 to 26 percent in 1998.
o In Hungary, following a decrease in the real value of hospital revenue and an increase in the numberof cases, a downward spiral in financing inpatient care services resulted, and many hospitals faced asevere financial crisLs and ran up 15-20 percent annual budget deficits. In response to the continuingdeficit in the budget of the Health Insurance Fund and prompted by the 1997 revenue crisis of theFund, the government introduced a hypothecated tax - also known as "health care contribution" - aspart of the economic stabilization program.
* In Lithuania, the State Patient Fund recorded a deficit of 1.7 percent of total public expenditures onhealth in 1998, followed by an increase m the deficit rate to 2.9 percent in 1999. Exact figures are notavailable for 2000, but it is widely believed that the State Patient Fund owes Euro 57.9 million to thedrug wholesalers.
Informal payments have far-reaching negative implications for health care systems.92 Bytheir very nature, informal payments are unauthorized and contribute to the generalenvironment of corrupt practices and the growth of a parallel health care financing system.Variously referred to as "envelope payments" or "gray payments," informal payments
92 Informal payments, defined as payments in cash or in kind, made by patients or others on behalf of the patients, topublic health care providers for health services received or expected to be received, existed even during socialisttimes. While the state-financed and publicly provided system provided health care free of charge (or for very modestco-payments), it was not uncommon for patients to make direct payments to physicians, nurses, and othersconnected with the delivery of health services.
- 96 -

Ensuring Social Protection
introduce perverse incentives in the health system and compromise governments' efforts toimprove efficiency, accountability, and equity in the public sector. The nontransparent anddiscretionary nature of informal payments adversely affects equity and access to health care,with the more vulnerable segments of the population having to pay disproportionately largeamounts for the health services that should otherwise be available free of charge.
To some extent, however, informal payments may be seen merely as a manifestation ofthe underlying excess demand for (purportedly free) health care. It would be preferable to dealwith such an excess demand in an open and transparent fashion, even if it meant shedding theillusion of free health care for all citizens. This would imply a greater use of formal, regulatedcopayments. In recent years, however, many countries have introduced official copayments,typically applied to dental care covered by health insurance, pharmaceuticals, and medicalprosthesis; over time, such official payments have assumed significant proportions. A WorldBank survey carried out in Poland in 1998 found, for example, that over 50 percent of all healthexpenditures on ambulatory care were out-of-pocket, the bulk of these expenditures going tothe purchase of pharmaceuticals.
Concluding Remarks
There is no doubt that many positive achievements have been recorded in the yearsfollowing the transition in the health reforms in most of the countries being reviewed. If healthcosts have risen, then so has the health status of the population; and after the mid-1990s, thegrowth of public spending on health has generally been arrested, albeit at very different levelsacross countries.
Despite sweeping changes to the design of health systems, there is as yet little sign of theexpected efficiency gains. This may be because considerably less change has taken place in theway the sector actually operates. In addition, countries are still struggling to define a paymentformula to tie their general practitioners, specialists, and hospitals into an appropriateframework of efficiency-enhancing incentives.
In this context, a number of recent developments appear to hold the promise of success,including, in particular, the following developments:
* Separation of providers from ministries of health (beyond a core number of publichealth and last resort institutions) and the incorporation of these providers intovarious forms of ownership
* Spread of mixed provider payment formulas and the first experimentation withDRG schemes for the payment of hospitals
* Merger of health insurance collection with that of other social securitycontributions
* Regularization of private payments into systems of well-regulated patientcopayments.
- 97 -


5. AN EXPENDITURE STRATEGY FORGROWTH AND CONVERGENCE
Expenditure policies can make a decisive contribution to the CEECs' objective of growthand convergence with the EU. From what we have discussed, the outline of what such anexpenditure strategy might involve begins to emerge.
In keeping with the trends observed within the EU (including within the cohesiongroup) as well as the OECD at large, a first element of such strategy would be to curb aggregateexpenditure levels, as most countries have indeed suggested in their PEPs. A first rationale forsuch an approach is to leave more resources in the hands of a more efficient private sector andthus achieve a more rapid factor productivity growth.
With equal importance, such a strategy would create the fiscal space needed to reducethe burden of labor taxation, thereby activating resources (that is, labor) that are currentlysitting idle. At present, the burden of labor taxation in the CEECs (at about 75 percent of wages)exceeds even the high levels that saddle EU labor (at an average rate of 53 percent) and is evenfurther out of line with the levels observed in the broader OECD).93 It is hard to see how theCEECs could to live up to the aspirations of the "Lisbon Strategy" they have recently espousedof turning the enlarged EU into "the most competitive economy in the world with socialcohesion and full employment of the 70 percent of the adult population" without bringing thesetax rates down.
A primary tool for curbing expenditure should be to rein in subsidies and transfers.Currently, transfers make up as much as 60 percent of total primary expenditure in the CzechRepublic and the Slovak Republic, as compared to 40 percent of primary expenditure in the EU.Even at other end of the range, Lithuania still devotes relatively more of its expenditureenvelope to subsidies and transfers (38 percent) than the average cohesion country (35 percent).
Indeed, despite years of progress in tightening budget constraints, considerable scoperemains in a number of countries to cut back on enterprise subsidies. This is the case of Hungary,Latvia, and the Slovak Republic, where enterprise subsidies (current and capital) account forabout 7 percent of GDP. But even Bulgaria, the Czech Republic, Estonia, Romania, and Sloveniastill spend more than twice as much relative to GDP (about 4 percent of GDP) as the average EUcountry on subsidizing various categories of enterprises.
As noted, part of the answer lies in completing bank restructuring and expediting large-scale enterprise privatization. In some cases (for example, coal mines) the initial restructuringcosts may be high. Provided the restructuring strategies are well tailored to the ultimateprivatization of the enterprises, such up front costs are likely to be worthwhile for the sake ofthe longer term fiscal benefits that will arise from getting ailing firms off of the public books.
93 See Funck, Bernard, and Lodovico Pizzati, 2002, Labor, Employment, and Social Policies in the EU Enlargement Process,World Bank, Washington, D.C.
- 99-

Expenditure Policies Toward EU Accession
A second source of fiscal relief will come from the implementation of the acquiscommunautaire in sectors such as power, gas, and transport, because it protects governmentfrom the ever-present temptation of providing state aid.
Similarly, much more could be done to curtail social transfers. In Bulgaria, the CzechRepublic, and Hungary, social transfers exceed the levels observed in the cohesion countries. InSlovenia and Poland they are even higher (relative to GDP) than among EU members. As wasnoted, some of the CEECs have begun to take the measure of the situation and are acting,apparently successfully, to address it (witness the 2-3 percentage points of GDP reduction inPoland and Hungary between 1995 and 2000). But in the absence of systemic action, theupward trend appears inexorable in the Czech Republic (where spending on social transfers hasrisen by more than 3 percentage points of GDP between 1995 and 2000), and the Slovak Republicmay well soon follow suit. The time has therefore come, even for those countries that avoidedpension system crises, to move ahead with more systemic reform if they want to secure old-ageprotection over the long run, while improving labor market incentives in the short run.
Health care reform is another way to pursue the latter objective. To make up forpersisting inefficiencies in the sector, current health insurance contribution rates are set farhigher than those prevailing within the EU. Above and beyond the direct benefits it wouldbring to the sector, more decisive action on health care reform, by creating room for cutting backthe payroll tax, could also contribute indirectly to the overarching growth and convergence theCEECs have set out for themselves.
Finally, we have highlighted how key expenditure programs could be redirected towardgrowth objectives. The education sector, for example, could make a better contribution to CEECintegration into the global knowledge economy if countries took advantage of the passing of a"baby bust" wave to downsize the staffing and facilities of basic and vocational education, andto shift resources toward other educational inputs as well as higher or more generic levels ofeducation.
Transport networks can also play a key role in making growth a reality. But their impactwill be more powerfully felt if investment decisions are guided by economic rather than byother considerations. In practice, for many countries this would imply prioritizing maintenanceexpenditures and phasing in new motorway construction only as the underlying traffic justifiesit.
Similarly, the rates of return on environmental programs can vary within a considerablemargin. In some cases they can actually be quite high. Estimates presented in this reportsuggest that clean air (and to a lesser extent clean water) measures would yield the highesteconomic benefits in relation to costs, but raise questions about the amount of investment intowaste management that would be economically viable. These indications are still tentative,however, and the merit of each individual project will need to be ascertained on a case-by-casebasis. But the cause of growth and convergence will be better served if those projects showingthe highest return receive first priority.
To conclude, the general thrust of expenditure strategies put forward in PEPs appearsboth appropriate and, at first blush, at least theoretically feasible. As was noted at the outset,
- 100-

An Expenditure Strategyfor Growth and Convergence
factors related to the country's political economy and to the institutional framework of publicresource management will play a determining role in framing actual policy choices. This reportwill have served its purpose if it helps illuminate, and perhaps broaden, these choices and helphighlight which courses of action might be practicable, judging by the experience of the CEECsthemselves.
- 101 -

Recent World Bank Technical Papers (continued)
No 463 Stephen Foster, John Chilton, Marcus Moench, Franklin Cardy, and Manuel Schiffler, Gionuidzwater zinRural Developmiienit Facing the Challenges of Supply annd Resouirce Suistainability
No 465 Csaba Csaki and Zvi Lerman, eds, Strictuiral Change in the Farming Sectors in Central and Eastern EuroopeLessonsfor EU Accession-Second World Bankl FAO Workshop, Julle 27-29, 1999
No 466 Barbara Nunberg, Readyfor Euitope Plibic Adnuiistiation Reforni and Europeanli Union Accession in Centraland Eastern Euirope
No 467 Quentin T Wodon with contributions from Robert Ayres, Matias Barenstein, Norman [icks, Kihoon Lee,William Maloney, Pla Peeters, Corinne Siaens, and Shliomo Yitzhaki, Poverty and Policy in Latin Americaand the Caribbean
No 469 Laurian Unnevehr and Nancy Hmrschllorn, Food Safety Issuies in the Developilng World
No 470 Alberto Valdes, ed, Agricultural Snpport Policies in Transitioni Econoniies
No 471 Brian Pinto, Vladimir Diebentsov, and Alexander Morozov, Dismantling Ruissia's Noiipaynitenits SysteiriCreating Conditionsfor Growth
No 472 lit B S Gill, A Diagnostic FranmezWorkfor Reveniue Administrationi
No 473 Esen Ulgenerk and Leila Zlaouil, From Transitio,i to Accession Developing Stable aiid Conipetitive FinancialMarkets in Bulgaria
No 474 loannis N Kessides, ed , Hulngary A Regulatory aiid Striuctiural Review0 of Selected Infrastructiure Sectors
No 475 Csaba Csaki, Zvi Lerman, and Sergey Sotnikov, Farni Sector Restructuring in Belarus Progress andConstraints
No 476 Katherine Terrell, Czech Repuiblic Labor Market Report
No 48 L Csaba Csaki, John Nash, Achimll Fock, and Holger Kray, Food and Agriculture in Bulgaria The Challenge ofPreparingfor EU Accession
No 482 Peter Havlik, Trade anrd Cost Coiripetitiveniess in the Czech Republic, Huingary, Poland, and Slovenia
No 483 Mojmir Mrak, Communlntial Infrastructure in Slovenia Suirvey of lnvestmtieiit Needs and Policies Ainmed atEn1couiraging Private Sector Puirticipatioli
No 484 Csaba Csaki and Laura Tuck, Rutral Developnieuit Strategy Eastern Em tope and Central Asia
No 488 Nina Bubnova, Governance Impact oni Private Iiivestnuient
No 489 Tim Schwarz and David Satola, Telecoiiiniuinucations Legislation in Transitional and Developing Economies
No 490 Jesko Hentschel and Radha Seshagirm, The City Poverty Assessnienit A Priner
No 491 Damel Mullei-jentsch, The Devlopment of Electricity Markets in the Eu, o-Mediterraneani Area
No 492 Tuntmvate Voravate, Douglas F Barnes, and V Susan Bogach, Assessing Markets for Renewable Energy inRutral Areas of Northwesterii Chinia
No 496 Jerry Lebo and Dieter Schelling, Desigii anid Appraisal of Ruiral Transport Infrastructure Ensuring Basic Accessfor Rural Comniinitnues
No 497 Julian A Lampietti, Anthony A Kolb, Sumila Gulyam, and Vahram Avenesyan, Utilihy Pricing and PoorLessonusfroniuArnienia
No 498 Gillian Perkins and Ruslan Yemtsov, Armeenia Restructuring to Suistain Universal General Ediucationi
No 499 Rogrigo A Chaves, Susana Sanchez, Saul Schor, and Emil Tesliuc, Fuimancial Mankets, Credit Conistraintts,anid Inivestmtienit 11 Ruiral Roiiiaiiia
No 500 Zvi Lerman and Karen Brooks, Tuurkmnenistan An Assessiienit of Leasehold-Based Farni Restruictiring
No 501 Aldo Baietti, Private Infrastructture in Enist Asia Lessons Learned in the Aftermath of the Crisis
No 505 Ali Hashimn and Bill Allan, T1easuir-y Reference Model
--No 506 Omer Gokcekus, Nick Manning, Ranjana Mukherjee, and Raj Nallari, Institutiional Emivirouument amid PublicOfficials'Performaince in Gu/yania
No 507 Ranjana Mukherjee, Omer Gokcekus, Nick Mamning, and Pierre Landell-Mills, Bangladesh The Experienceaiid Perceptions of Puiblic Officiiils
No 509 World Bank, Kosovo Economtiic and Social Reformsfor Peace and Reconciliation
No 510 Anatoly Vinokur, Joana Godinlo, Christopher Dye, Nico Nagelkerke, The TB and HIV/AIDS Epidemics inthe Russiant Federation
No 512 Geremia Palomba, Milan Vodopivec, Financing, Efficiency, and Equity in Albanian Eduiction
No 513 Thomas O'Brien, Christian Filhpov, The Cuirrent Regilatory Franmework Governing Butsiness in Builgaria
THE WORLD BANK
I818WH Street, N.WWaslhington, D.C. 20433 USA
'l'elephone: 202-473-1000
Facsimile: 202-477-6391
Internet: www.worldbank.org
E-mail: [email protected]
ISBN 0-8213-5368-3