estimation of erosion and sediment yield by epm model …
TRANSCRIPT
Agriculture & Forestry, Vol. 61, Issue 2: 157-171, 2015, Podgorica 157
DOI: 10.17707/AgricultForest.61.2.14
Sohrab MORADI, Soleiman MOHAMMADI LIMAEI,
Peter LOHMANDER, Mehrdad KHANMOHAMMADI 1
ESTIMATION OF EROSION AND SEDIMENT YIELD BY EPM MODEL
IN ZEMKAN BASIN USING GIS
SUMMARY
Soil is a living, dynamic and non-renewable source in lifetime which is vital for food production and the global balance of ecosystems. Every year more than 75 billion tons of soil erodes from the surface of earth. Taking care for this, appropriate methods needed to prevent erosion and sediment movement, which in its turn requires the presence of information about erosion intensity in the
basin. Lack of statistical data and information on soil erosion and sediment production in Zemkan basin located in the West of Kermanshah Province, is an issue that paved the way to carry out this study with the aim of identification of erosion rate and sedimentation production and exploring sensitive areas of erosion. To achieve the above-mentioned aim, there was used the erosion potential method (EPM) using of geographical information system (GIS) to
reduce errors and increase the relative accuracy in the analysis of the model. Required data in this study were prepared through field observations, existing maps, statistics of meteorological and hydrometric stations and library resources. After inputting maps into the ArcGIS software environment and geo-referencing them, required layer was digitized and there created database for them. Finally, using standard tables provided in the EPM model, accordant values for the basin
extracted and incorporated into the layers according to the relations given in EPM model, map of erosion intensity zoning, erosion and sediment ratio calculated for the basin. Results showed that the rates of especial erosion (WSP) and especial sediment are (GSP), 2742.02 and 1005.55 m3/Km2/y respectively. Class and intensity of erodibility of basin were also identified as very intensive (V). Therefore, different policies of erosion control in the basin are necessary.
Keywords: EPM Model, Erosion, GIS, Sediment, Zemkan basin
INTRODUCTION
One of the most important natural resources of any country is soil (Maghsoudi et al., 2009). Soil is a living, dynamic and non-renewable resource in lifetime of human that is vital for food production, and global balance of
ecosystems (Bracken and Kirkby, 2005). Soil and water resources, economically
1 Sohrab Moradi, (corresponding author: [email protected]), Guilan University & Payame Noor
University Tazeh Abad (Salas Babajani), Kermanshah Iran; Soleiman Mohammadi Limaei,
Mehrdad Khanmohammadi, Faculty of Natural Resources, Guilan University Someh Sara, Rasht
Iran; Peter Lohmander, Professor Department of Forest Economics, Swedish University of
Agricultural Sciences, Umea, Umea, Sweden.
Notes: The authors declare that they have no conflicts of interest. Authorship Form signed online.

Moradi et al. 158
and ecologically, are known as key components of natural resources and
development of agricultural activities and in fact, they are the origin of producing human’s basic needs and provider of natural needs of plants and organisms in ecosystem (Ghanbarzadeh and Gholamrezaee, 2007). Today, accelerated soil erosion is considered as a global problem because of its impact on economy and environment (Kyoung et al, 2005). According to estimation of Food and Agriculture Organization, every year more than 75 billion tons of soil is eroded
from the Earth's surface that is equal to 134 ton/Km2 (Sobhani, 2002). Also
almost two billion tons of valuable soils is lost annually in Iran (Gholami, 2003), as during the years 1951 to 1999 the rate of soil erosion in Iran has increased 450% (Ahmadi, 1999). This indicates the criticality of the status of erosion and the need for its control in Iran.
Shortage of hydrometric stations in most mountainous areas of the West
country, has been the cause for lack of correct identification of areas susceptible
to erosion in surface of basins, so that through taking measure appropriate with
the circumstances prevent removal of this national capital. Lack or extreme
scarcity of data and statistics in the field of soil erosion and sediment production
in the study area (Zemkan basin) has brought problems for residents, including
decrease of productive potential of land, damage to roads, obstruction of bridges
and irrigation channels and destruction of gardens and lands along river of the
basin. Thus, currently the problem of soil erosion and its impacts in the study
area is considered as a serious problem; that through a true understanding of the
processes governing the erosion and obtaining relatively accurate estimation of
sediment rates and waste of soil based on appropriate empirical methods, the
most suitable way to control and inhibit the erosion can be provided. Among the
provided experimental methods and models (FAO, BLM, EPM and PSIAC),
application of experimental models PSIAC and EPM has attracted more attention
of domestic experts and scholars (Rastgou, et al, 2006). Therefore, efficiency of
using EPM model in basins of Iran has been proven (Sokouti et al, 2001). EPM
model includes determining intensity of erosion in a basin, measuring rate of
sediment transport and calculating sedimentation rate in different parts of a basin
(Ghazavi et al, 2012) which was obtained using data from pieces of erosion lands
and measuring sediment after 40 years of research in the former Yugoslav
presented for the first time in 1988 by Gavrilovic at the International Conference
on River Regime (Refahi, 2003); and also has been applied in various fields in
Iran (Refahi & Nematti, 1995- Sadeghi, 1993- Tangestani 2001 and 2006); their
studies indicate acceptability of the results of EPM model. Devente et al. (2005),
by doing a study for prediction of sediment production at basin scale concluded
that in order to get closer to the reality of sediment production in each basin, in
use of these models, topographic data and satellite images should be used in
addition to using semi-quantitative models, for the better implementation of the
results.
Recently, precise system of GIS with great functions has enabled us to
store, retrieve, and update basic information in form of layers or information

Estimation of erosion and sediment yield by EPM model in Zemkan basin using GIS 159
tables. Using this system, human error factors can be minimized (Shirzadi, 2009).
There is some researches in the field of using GIS and remote sensing for
estimating erosion and sediment, including the works by Hill (1993), Ziaee
Esfandrany (2004), Gobin et al (2003), Jalili et al (2005), Amini et al (2010),
Borzoo et al (2008), Amiri (2010) and Rangzan and Moradzadeh (2005).
Bagherzadeh (1993) investigated the efficiency of several models such as EPM
model in Ozon Darreh basin for determining the efficiency of erosion and
sediment. Bayat (2001) also in a study to evaluate efficiency of MPSIAC and
EPM models in estimation of erosion and sediment of Taleghan basin using GIS
investigated these two models. Rangzan et al (2007) in a study in a basin of
Khuzestan in Iran, after comparing the two methods of MPSIAC and EPM,
concluded that the results obtained by both methods are consistent in most
regions. This study examines the process of erosion and sedimentation using
modern techniques in the study area.
MATERIAL AND METHODS
Study area
Zemkan basin is one of the largest basins of Kermanshah Province that is
located between
02' 45" North. Its area is 2338 Km2 and its circumference is
314 km (Figure 1). The average altitude of this basin is 1502 m (maximum 2547
m and minimum 514 m). Zemkan basin consists of three sub basins of Zemkan,
Gerdi Ghaseman and Dallahoo, with areas of 1414, 503 and 421 Km2,
respectively .Its main river called Zemkan with length of 125 Km2 drainages all
area of the basin and enters Sirwan river in Iraq country.
Regarding climate Zemkan basin is located in semi-humid moderate zone
and its major source of rainfall is mountains. The average annual rainfall in basin
of Zemkan has been recorded as 450 mm and average of annual temperature as
15.8 ° C.
Figure 1. The position of study area A. Iran B. Kermanshah Province C. Zemkan basin
Required maps and data
Moradi et al. 160
In this study, the following maps and data, according to the nature of
research and the methods have been used:
A.Statistics and information including meteorological data, information
and maps of the study area in relation to the subject, including data and
information relating to the Iranian Meteorological Agency and Forests,
Rangelands and Watershed Management Organization were collected.
B.Topographic maps with a scale of 1: 50000 from National Geography
Organization of Iran to prepare thematic maps.
C.Regional geological map with a scale of 1: 100,000 for preparing
lithology maps and formation of the region.
D.IRS-P6 satellite images of LissIII and LissIV sensors belonging to 2008
from National Geography Organization of Iran to prepare land use maps of the
study area.
E.Use of software packages ArcGIS, PCI Geomatica and Excel to analyze
and extract basic information and maps needed.
Method
In this study, for estimating intensity of erosion and sedimentation
potential of basin under study, EPM model and RS and GIS techniques have been
used. After inputting the maps into ArcGIS software and making them geo-
referenced, requiring layers were digitized and database for them were created.
Using EPM model, affecting factors to the erosion in the basins were assessed
and scored. In this method the following Coefficient of erosion intensity were
estimate, Basin erosion coefficient (Ψ), land use coefficient (Xa), coefficient of
susceptibility of rock and soil to erosion (Y) and average slope of basin (I) in
different sub basins and finally the entire basin. In each sub basins based on
mentioned before factors, value of Z or coefficient of erosion intensity, average
annual special sediment (Amount of sediment production per unit area) and the
amount of sediment produced were calculated during the year in sub basins and
finally in total basin..
As mentioned before, for ease and accuracy of work in getting the amount
of erosion and sediment production, first the entire basin of Zemkan was divided
to three sub basins named Gerdi Ghaseman, Dallahoo and Zemkan. Then
affecting factors in production of sediment in each of the sub basins were studied.
In the final stage, rate of erosion and sediment production were calculated using
related formula and coefficients. Each of the four factors will be examined later.
A- Observational erosion coefficient (Ψ)
Observational erosion coefficient indicates the appearance of erosion in the
area. This coefficient is determined through field visits conducted in the region
and using Table 1. In this study, in addition to Table 1, the map of the
geomorphology of the basin has been used for determining erosion coefficient.
According to Table 1, erosion coefficient in each sub basins has been calculated
and the results are shown in Figure 2.

Estimation of erosion and sediment yield by EPM model in Zemkan basin using GIS 161
Table 1. Values of observational erosion coefficient (Ψ) (Ahmadi, 1999)
Mean values Erosion conditions of the basin
1 The area has many Gullies and severe erosion
0.9 About 80% of the area has groove-gully erosion
0.8 About 50% of the area has groove-gully erosion
0.7 The total area has surface erosion, sediment and debris, and
little groove-gully erosion
0.6 The total area has surface erosion, but with no traces of deep
erosion (gullies, grooves and debris)
0.5 50% of the area has Surface erosion and the remaining with
no erosion
0.4 20% of the area has Surface erosion and the remaining with
no erosion
0.3 Ground Surface is without visible erosion, but along the
river, debris and landslides are observed
0.2 Ground Surface is without visible erosion and usually has
agricultural coverage
0.1 Ground Surface is without visible erosion and is often
covered by Permanent plants and forest
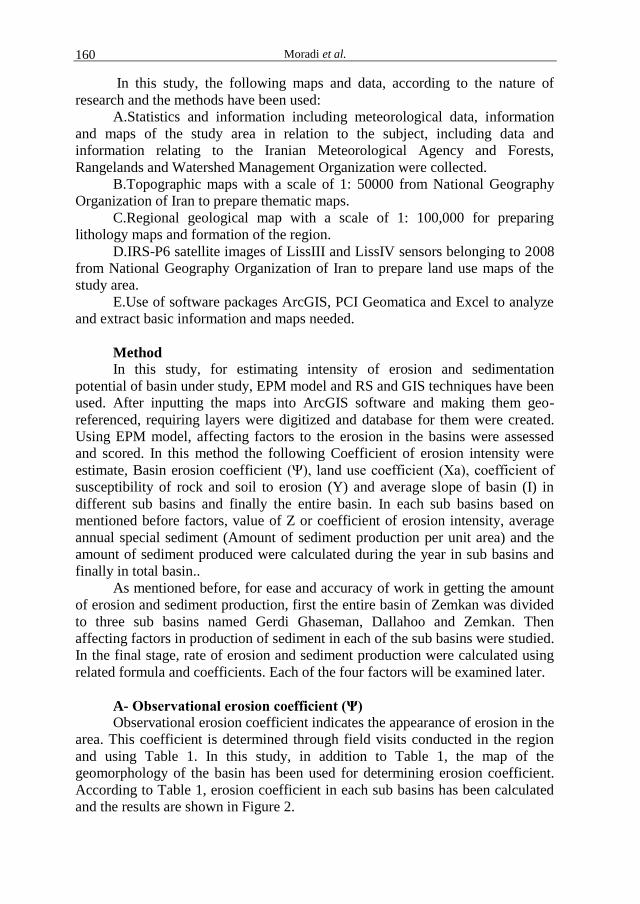
B- Land use coefficient (Xa)
This coefficient is related to the type of land use and scores related to
different uses in sub basins are specified through land use map (Figure 3) and
according to Table 2. For preparing land use map, images of IRS-P6 satellite
from LissIV and LissIII sensors belonging to 2008 from National Geography
Organization of Iran were used. After performing radiometric and geometric
corrections by PCI Geomatica software, classification was done using training
points. Moreover, visual interpretation was performed and the land use map was
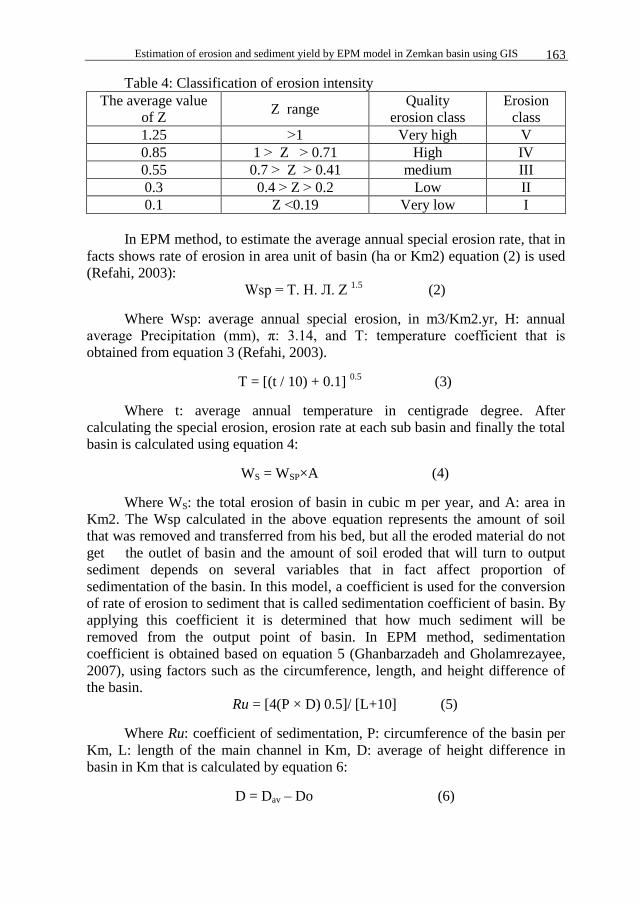
prepared. According to Table 2 and land use map (Figure 3), coefficients of using
land in each sub basin were calculated (Figure 4).
Table 2. Score of land use coefficient (Xa) (Refahi, 2003)
Land use conditions Mean values
Non-arable lands and Badlands 1
Tapa Mahoor and plowed lands for agriculture 0.9
Fruit gardens, vineyards without pastures vegetation 0.8
Plowed fields on the contour line 0.7
Ruined and eroded forests and formed Scrubs on worn soils 0.6
Dry mountainous pastures 0.5
Permanent farms and hay lands 0.4
Drained and covered with grass pastures 0.3
Good forests on steep slopes 0.2
Good forests on gentle slopes 0.1

Moradi et al. 162
C-Coefficient of susceptibility of rock and soil to erosion (Y)
Physical properties of rocks against the climate and biological effects have
decisive role, (Mahmmudi, 2004). In other words, rocks and non-dense deposits
of ground surface are in different classes regarding resistance to erosion. Thus, to
estimate the rate of erosion and production of sediment in the EPM method, it is
necessary to assess susceptibility of rocks in the study area. In the study after
preparing geology and lithology map of the area (Figure 5), through scanning the
paper map with scale of 1:100,000 and its digitization in software Arc GIS,
according to table of coefficient of susceptibility of rock and soil to erosion
(Table 3), the score in different sub basins and finally the whole basin was
determined (Figure 6).
Table 3. Values for rock and soil susceptibility to erosion (Y)
Conditions of rock and soil Mean values
Sand, gravel, schist 2
Loess, tuff, salty soil and steppe soil 1.6
Weathered rock and marl 1.2
red sandstone, Serpentine and flysch sediments 1.1
Podzol, para podzol , crushed schist, mica schist, gneiss,
argillite schist 1
Hard limestone, litter, humus and silicate-bearing soils 0.9
Brown forest soils and mountain soils 0.8
marshy soils and black or dark gray hydro morph 0.6
Chernozem and fine-textured alluvial sediments 0.5
Hard Igneous rocks 0.25
D-The average slope of the basin (I)
In this study, for extracting the slope parameter, using map of digital
elevation model (DEM) and the SLOPE command in the software environment
of Arc GIS, the map of average slope has been obtained (Figure 7). With regard
to the four factors calculated in the previous step (Observational erosion
coefficient, Land use coefficient, susceptibility of rock and soil to erosion and
basin’s average slope), Z value or coefficient of erosion intensity for each sub
basin and finally for total area was calculated using equation 1 (Gavrilovic,
1988).
Z = Y. Xa (Ψ + I 0.5) (1)
By calculating the coefficient of erosion intensity and placing that value in
standard table (Gavrilovic, 1988), that has been set based on the erosion intensity
and coefficient of erosion intensity (z), erosion class of each sub basin is
specified and the results are shown in Figure 8.
Estimation of erosion and sediment yield by EPM model in Zemkan basin using GIS 163
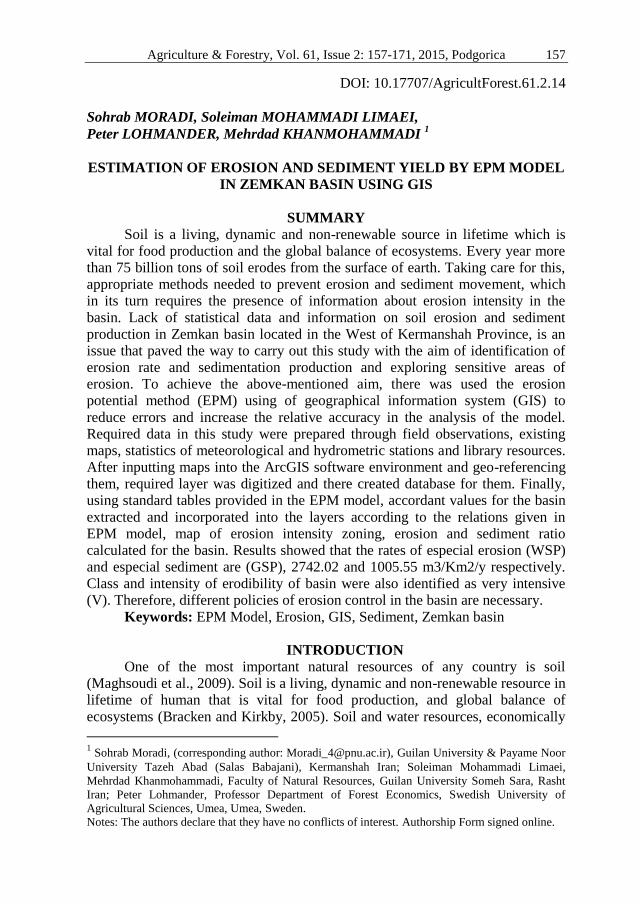
Table 4: Classification of erosion intensity
The average value
of Z Z range
Quality
erosion class
Erosion
class
1.25 1 Very high V
0.85 0.71Z1 High IV
0.55 0.41Z0.7 medium III
0.3 0.2Z0.4 Low II
0.1 0.19Z Very low I
In EPM method, to estimate the average annual special erosion rate, that in
facts shows rate of erosion in area unit of basin (ha or Km2) equation (2) is used
(Refahi, 2003):
Wsp = T. H. Л. Z 1.5
(2)
Where Wsp: average annual special erosion, in m3/Km2.yr, H: annual
average Precipitation (mm), π: 3.14, and T: temperature coefficient that is
obtained from equation 3 (Refahi, 2003).
T = [(t / 10) + 0.1] 0.5
(3)
Where t: average annual temperature in centigrade degree. After
calculating the special erosion, erosion rate at each sub basin and finally the total
basin is calculated using equation 4:
WS = WSP×A (4)
Where WS: the total erosion of basin in cubic m per year, and A: area in
Km2. The Wsp calculated in the above equation represents the amount of soil
that was removed and transferred from his bed, but all the eroded material do not
get the outlet of basin and the amount of soil eroded that will turn to output
sediment depends on several variables that in fact affect proportion of
sedimentation of the basin. In this model, a coefficient is used for the conversion
of rate of erosion to sediment that is called sedimentation coefficient of basin. By
applying this coefficient it is determined that how much sediment will be
removed from the output point of basin. In EPM method, sedimentation
coefficient is obtained based on equation 5 (Ghanbarzadeh and Gholamrezayee,
2007), using factors such as the circumference, length, and height difference of
the basin.
Ru = [4(P × D) 0.5]/ [L+10] (5)
Where Ru: coefficient of sedimentation, P: circumference of the basin per
Km, L: length of the main channel in Km, D: average of height difference in
basin in Km that is calculated by equation 6:
D = Dav – Do (6)

Moradi et al. 164
Where Dav: average height of basin in Km2 and DO: height of outlet point
in river in Km. Then, value of D is calculated and put in equation 4, and
sedimentation coefficient of basin is calculated. The special sediment is
calculated from equation 7:
GSP = WSP × Ru (7)
Where GSP: special sediment (m3/y/Km2). Finally, total sediment of basin
is obtained from equation 8:
GS = GSP × A (8)
Where GS: total sediment (m3/y) and A: area of basin in Km2.
RESULTS AND DISCUSSION
The results of calculation of the values of erosion intensity coefficient (Z)
(Figure 8) based on the values of the coefficients Xa (Figure 2), Y (Figure 4), Ψ
(Figure 6) and I (Figure 7), the special erosion (WSP), total erosion (WS),
coefficient of sedimentation (Ru), special sedimentation (GSP) and total
sediment (GS) have been calculated in sub basins and total basin separately. It
should be mentioned that the values of the erosion coefficient, special erosion,
and total erosion, coefficient of sedimentation, special sediment and total
sediment in each sub basin and total basin are given in Table 5. Based on this,
special erosion rate and total erosion in Zemkan basin is 2.74 (ton/Km2.yr) and
6,409 (ton/yr) respectively. In addition, amount of special sediment and total
sediment in Zemkan basin is 1.005 (ton/Km2.yr) and 2,350 (ton/yr) respectively.
Figure 2. Coefficient of soil erosion map in sub basin of Zemkan using EPM
model
Estimation of erosion and sediment yield by EPM model in Zemkan basin using GIS 165
Figure 3. Land use map of Zemkan basin
Figure 4. Coefficient of land use map in sub basin of Zemkan using EPM
model

Moradi et al. 166
Figure 5. Lithology map of Zemkan basin
Figure 6. Coefficient of rock and soil susceptibility map in sub basin of
Zemkan using EPM model

Estimation of erosion and sediment yield by EPM model in Zemkan basin using GIS 167
Figure 7. Average of slope map in sub basin of Zemkan
Figure 8. Map of erosion class in sub basin of Zemkan

Moradi et al. 168
Table 5. Result of erosion and Sediment in sub basins of Zemkan using EPM model
Total Zemkan Dallahoo Gerdi
Ghaseman
Sub basin
Parameter
2337.42 1413.74 421.08 502.6 Area (Km2)
17.68 14.34 23.89 20.83 Average slope of the basin (I)
0.51 0.72 0.77 0.71 Coefficient of rock and soil
susceptibility (Y)
0.4 0.13 0.34 0.32 Observational erosion coefficient
(Ψ)
0.43 0.38 0.34 0.37 Land use coefficient (Xa)
1 1.06 1.37 1.26 Erosion intensity coefficient (Z)
IV V V V Erosion class
High Very high Very high Very high Quality erosion class
1934.51 2116.31 3113.94 2742.02 Special erosion (WSP)
(m3/Km2.yr)
972286.35 891137.11 4402308.85 6409261.13 Total erosion (WS) (m3/yr)
0.551 0.036 0.494 0.367 Sedimentation coefficient (Ru)
1065.283 76.259 1539.140 1005.55 special sediment (GSP)
(m3/Km2.yr)
535411.3 32111.05 2175943.47 2350383.59 Total sediment (GS) (m3/yr)
CONCLUSIONS
In performing calculation related to EPM model, the coefficients mean of
observational erosion (Ψ), land use (Xa), soil and rock susceptibility to erosion
(Y), and average slope of the basin (I) are calculated and through comparison
with standard tables, rate and class of erosion for each sub basin and total area
were estimated. The erosion intensity coefficient (Z) in sub basins of Gerdi
ghaseman, Dallahoo and Zemkan was calculated respectively as 1, 1.06 and 1.37,
and in total area as 1.26 (Table 5); that's according to standard table (Table 4),
class and intensity of erosion of sub basin Gerdi ghaseman is in High group (IV)
and other sub basins and total basin is in very High group (V). In addition, rate
of special erosion (WSP) and special sediment (GSP) of total basin was estimated
respectively as 2742.02 and 1005.55 (m3/Km
2.yr). Investigation of erosion
intensity map (Figure 8) showed that in all hydrological units of sub basins Gerdi
ghaseman, Dallahoo and Zemkan, for each sub basin only two hydrologic unit
indicates in High erosion class and in all other hydrological units, in all sub
basins, very high erosion rate is dominant; that generally indicates a very high
erosion status in total basin of Zemkan but the impact of each of factors on the
erodibility rate of the basin is completely different.
One of the factors affecting erosion and sediment yield is rainfall regime
and climate of the basin, that by its investigation it was found that much of
Precipitation in basin of Zemkan is rain and in winter, it is associated with snow.
Although by melting snow, surface runoffs start to flow and intensify soil mass
movement; but through field investigations, mass movements of soil were not
observed in basin area, but rainfall especially with high intensity and short time

Estimation of erosion and sediment yield by EPM model in Zemkan basin using GIS 169
caused rapid flow and runoff intensity that destroys large amount of surface soil
and carries it as sediment and suspended sediment to downstream areas of basin.
Other factors affecting erosion and sediment production and creation of
basin flood are physiographic and topographic features such as slope, elevation,
and waterways’ status (Ghanbarzadeh and Gholamrezayee, 2007). Slope of
Zemkan basin in most parts of it is considerable, so that in many parts of the
Gerdi ghaseman sub basin it is more than 30%. The average slope of total basin
is 20.83%, which is effective in accelerating erosion, and the parameter affecting
it including runoff. Generally, in areas with gentle slope because the power of
flowing waters decrease, so less erosion can be seen in various forms; while in
Zemkan basin due to its being mountainous, in most parts of it the opposite
situation occurs. Drainage density of basin is about 4 Km in Km2, which is
indicative of hydrograph and many waterways network in the basin. High slope
of the main waterway about 10% has great impact in much concentration time,
rapid flow, runoff and flooding.
Another factor affecting erosion and sedimentation of basin is land use and
vegetation. It is normal that regions where have suitable forest and pasture
vegetation, are less prone to degradation and soil erosion. In Zemkan basin where
approximately 80% of the area is covered by forest and pasture with different
densities, it is expected that situation of erosion control in basin area is
appropriate and erosion rate is very low, but for different reasons Including
grazing permanent of pasture by livestock in the area, disregarding the balance
of livestock and pasture by ranchers, applying wrong methods of plowing land,
uncontrolled cutting trees, shrubs and bushes, disregarding principles of proper
utilization of lands, conversion of forests and pastures to agricultural lands as
well as particular morphological, physiographical and topographical features of
soil and geology and effect of climatic factors specially distribution and intensity
of rainfall has caused erosion status in the basin to be in very high condition.
Thus, application of various methods of erosion control in the basin is essential.
ACKNOWLEDGEMENTS
The authors would like to thank Payamenoor University for providing
funding this paper.
REFERENCES Ahmadi, H. (1999): Applied Geomorphology. Vol.1, Tehran University presses.
Amini, S. Rafiei, B. Khodabakhsh, S. & Heydari, M. (2010): Estimation of erosion and
sediment yield of Ekbatan Dam drainage basin with EPM, using GIS. Iranian
Journal of Earth Sciences (IJES) 2:173-180.
Amiri, F. (2010): Estimate of Erosion and Sedimentation in Semi-arid Basin using
Empirical Models of Erosion Potential within a Geographic Information System.
Air, Soil and Water Research 3:37-45.
Bagherzadeh, M. (1993): A Study on the Efficiency of Erosion Potential and Sediment
Yield Models Using Remote Sensing and Geographic Information Systems. Msc
thesis, Natural Resources College, University of Tarbiyat Modares, Tehran, Iran.

Moradi et al. 170
Bayat, R. Sarmadyan, F. Darvishsefat, A.A. & Refahi, H.G. (2001): Efficiency survey of
PASIAC and EPM methods in the Taleghan basin using GIS. Journal of
agriculture science. 32: 203- 217.
Borzou, A. Momayezi, M. & Nickandish, A. (2008): Comparison of estimating soil
erosion and sediment by EPM, PSIAC and MPSIAC methods in Chehl Cheshmeh
basin, Fars province. Iranian Journal of Dynamic Agriculture 5:19-29.
Bracken, L.J. & Kirkby, M.J. (2005): Differences in hillslope runoff and sediment
transport rates within two semi- arid catchements in southeast Spain. Journal of
Geomorphology 68: 183 - 200.
Devente, J. & Poesen, J. (2005): Predicting Soil erosion and sediment yield at the basin
scale. Scale issues and semi-quantization Model. Journal of Earth Science 20: 1-
31.
Gavrilovic, Z. (1988): The use of an empirical method for calculating sediment
production and transport in unstudied or torrential streams. Int. Conf. for River
Regime, pp. 411-422.
Ghanbarzadeh, H. & Gholamrezaee, M.R. (2007): Potential Erosion and Sediment
Estimation Using EPM Model in Catchment Basin of Arreh kamar of Fariman
Using GIS, Journal of Geographical Science 7:187- 206.
Ghazavi, R. Vali, A. Maghami, Y. Abdi, J. & Sharafi, S. (2012): Comparison of EPM,
MPSIAC and PSIAC Models for Estimating Sediment and Erosion by Using GIS
(Case Study: Ghaleh-Ghaph Catchment, Golestan Province). Journal of
Geography and Development, 27:117- 126.
Gholami, S.H. (2003): The simulation of daily sediment yield by using distributed SWAT
model in mountainous catchments (Amameh Catchments). Journal of Research
and Construction, 16: 28 – 33.
Gobin, A. & Govers, G. (2003): Pan-European Soil Erosion Risk Assessment. Third
Annual report. European commission funded fifth framework project–contract
QLK5-CT-1999-01323. Available at: http://www.pesera. JRC.it.
Hill, J. (1993): Land Degradation and Soil Erosion Hazard Mapping in Mediterranean
Environment with Operational Earth Observation Satellites. Proceedings of the
international symposium of Operationalization of remote sensing, April,
Enscheda, The Netherlands, pp. 19-23.
Jalili, k. & Hadid, M. (2005): Quality and quantity evaluation of soil erosion and
sedimentation by MPSIAC model using GIS. 3th conference of sedimentation and
erosion.
Kyoung, J.L. Myung, S. Bernard, A.E. Zhenxu, T. Joongdae, C. & Ki-Sung, K. (2005):
GIS-based sediment assessment tool. Journal of Catena 64: 61-80.
Maghsoudi, M. Yamani, M. & Salari, M. (2010): Estimation of erosion and sediment in
Vazneh basin via assessment of effective variables with use of GIS. Journal of
Geography and Development, 16: 119 – 134.
Mahmmudi, F. (2004): Dynamic Geomorphology, 6th edition, Tehran, Payam Noor
university publisher.
Rangzan, K. & Moradzadeh, M. (2006): GIS and RS application for preparing
information layers of land use and land cover for MPSIAC model. Sedimentation
conference. Khuzestan, Iran.
Rangzan, K. Zarasvandi, A. & Heydari, A. (2008): Comparison of EPM and PSIAC
models for estimation of erosion and sediment in Khuzestan Peghah Sorkh
Getvand basin using by RS and GIS technique, Geographical Research Quarterly
64: 123-136.

Estimation of erosion and sediment yield by EPM model in Zemkan basin using GIS 171
Rastgho, S. Ghahraman, B. Sanaei Nejad, H. Davari, K. & Khodashenas, S.R. (2006):
Estimation of erosion and sediment in the Tangh Konesht basin by PASIAC and
EPM models using by GIS. Journal of science and Technology of agriculture and
natural Resources 10: 91-105.
Refahi, H.G. (2003): Water erosion and its control, first print, Tehran, Tehran university
publisher.
Refahi, H.G. & Nematti, M.R. (1993): Using of EPM model on study of erodibility and
sediment yield in the Taleghan basin. Iran agriculture science, 26: 32-45.
Sadeghi, H. (1993): Comparison of some erosion potential and sediment yield assessment
models in Ozon-Dareh sub-catchment. Proceedings of the National Conference on
Land Use Planning, Tehran, Iran, pp. 41-75.
Shirzadi, H. (2009): Land sliding potential in New Road, Sanandaj - Mariwan using
AHP. Unpublished Msc thesis, Natural Resources College, University of Tehran,
Tehran, Iran.
Sobhani, B. (2002): Comparison of FAO and MPSIAC methods for estimating sediment
and erosion using GIS. Journal of agricultural sciences and natural resources 8:
15 – 28.
Sokouti Oskoee, R. Broshkeh, I. Godoosi, J. & Arabkhedri, M. (2001): Evaluation of
efficiency of MPSIAC model in estimation of sedimentation five basins of
Azarbaijan Gharbi province. Journal of Research and Construction 14: 35 – 37.
Tangestani, M.H. (2001): Integrating Geographic Information System in erosion and
sediment yield applications using the Erosion Potential Method (EPM).
Proceedings of the 9th annual conference of the GIS Research UK, eds: D.B.
Kinder and G. Higgs, 18-20 April, University of Glamorgan, Wales.
Tangestani, M.H. (2006): Comparison of EPM and PSIAC models in GIS for erosion and
sediment yield assessment in a semi-arid environment. Afzar Catchment, Fars
Province, Iran. Asian Journal of Earth Sciences 27: 585 – 597.
Ziaee Esfandrany, H. (2004): GIS and RS application for sediment and erosion estimation
of Shahid Abbaspour dam watershed. MS thesis. Shahid Chamran University.