estimating the required return
TRANSCRIPT

The Hedge Fund Explosion: Is the Bang Worth the Buck?
Arindam Bandopadhyaya
James L. Grant Financial Services Forum College of Management
University of Massachusetts Boston May, 2006
Working Paper 1010

The Hedge Fund Explosion:
Is the Bang Worth the Buck?
Arindam Bandopadhyaya Associate Professor of Finance
Department of Accounting and Finance University of Massachusetts - Boston
Boston, MA 02125 [email protected]
James L. Grant Assistant Professor of Finance
Department of Accounting and Finance University of Massachusetts - Boston
Boston, MA 02125 [email protected]
May 17, 2006
We have benefited from helpful discussions with James Abate, Atreya Chakraborty, Ed D’Alelio, William Koehler, and Larry Franko on the subject of hedge funds as alternative investments. Research assistance from Mohit Aggarwal is appreciated. We are also grateful to Philip Quaglieri, Dean of the UMASS-Boston College of Management, for providing assistance and financial support.

KEY FINDINGS AND OBSERVATIONS
• While individual investors make up more than half of all hedge-fund shareholders, foundations, pension funds, and university endowments are increasing their stake.
• Even though hedge funds remain largely unregulated, the legal environment is rapidly changing toward increased disclosure and transparency.
• Hedge funds are largely domiciled “offshore”, but hedge-fund managers are located primarily in the United States, particularly New York, California, Illinois, Connecticut and Florida.
• The overall performance of hedge funds (Credit Suisse/Tremont HFI, 1994-2005) as an asset class is about the same as that of U.S. equities (S&P 500).
• On an absolute-returns basis, hedge funds underperformed the stock market during the “bull market” run-up from 1995 to 1999, while on average they outperformed the market during the “bear market” through 2005.
• The real benefit of hedge funds lies in risk management. This contrasts with the negative publicity that such alternative investment vehicles receive for perceived lack of regulation, transparency, and disclosure.
• During 1994-2005, most hedge-fund “styles” provided solid absolute and risk-adjusted returns.
• The best absolute return styles were Global Macro, Event-Driven-Distressed, and Long-Short Equity. The best hedge-fund styles on a risk-adjusted basis (Sharpe ratio) were Equity Market Neutral, E.D.-Distressed, and Multi-Strategy (combination).
• The worst hedge-fund strategies on a risk-adjusted return basis (1994-2005) were Emerging Markets, Managed Futures, and Dedicated Short Bias.
• Given the risk-management benefit of hedge funds, institutional investors are likely to increase their hedge-fund stakes.
• As the regulatory environment tightens, managers will likely place greater emphasis on risk controls, which may limit abnormally high returns.
• As competition increases, the ability to find top performing managers may become more difficult. Fund managers may also move back to traditional asset management venues.
• As the stock market outlook improves, there may be a shift from hedge funds back to indexing.
• On balance, hedge funds have been clearly worth the “bang for the buck” for fund indexers and active investors.
I. INTRODUCTION Any casual following of the financial news would reveal that hedge funds have
experienced phenomenal growth, especially over the last fifteen years. In terms of
numbers, there were an estimated 8000 hedge funds in 2005, up from only 500 in 1990.
During this fifteen-year period assets under management have grown from an estimated
$50 billion to $1.5 trillion (Financial Times, February 8, 2006). Moreover, the hedge-
fund industry has spawned a “fund of funds” business, which has slowly become the
preferred way of investing in hedge funds, especially for institutional investors. Today,
the number of these combination funds is estimated at about 4000. (Kat and Palaro,
2005).
Until recently, hedge funds have been popular primarily with high-net-worth
individuals. While this is true even today (individual investors make up more than half of
all hedge-fund shareholders), an increasingly larger proportion of hedge-fund investors
are pensions, retirement plans, endowments, and corporations (see Exhibit 1). As further
evidence of the growth of hedge-fund popularity, Exhibit 2 reveals that the largest
pension plans doubled their stake in alternatives, including hedge funds, over a ten-year
period between 1995 and 2005. As a specific example, the March 22, 2006 issue of the
Boston Globe reported that hedge funds account for 5 percent of total assets of the $40
billion of the Massachusetts Pension Reserves Investment Trust. The pension fund's
board plans to increase that share to 10 percent by the end of this year.

A Historical Perspective
Although the common perception is that a hedge-fund is a relatively new concept,
this investment alternative began in the 1940s when Alfred Winslow Jones first combined
a leveraged long-stock position with a portfolio of short-stock positions in an investment
fund; see Inglis (2005) for a more detailed history of the industry. The idea was based on
the principle that fund performance depends on the ability to pick stocks with superior
performance (alpha) rather than on market direction. This strategy outperformed the
returns of mutual funds during those times, which led to an increased popularity of hedge
funds in the 1960s. During that decade the nature of hedge-fund management changed,
with hedge-fund managers leveraging rather than hedging their positions. When the
markets did not perform as robustly as expected, the risky strategies did not prosper and
from the mid-1960s to the end of the 1970s the hedge-fund industry went through a
period of turmoil.
With the advent and burgeoning of the derivatives market, the hedge-fund market
began to flourish. Hedge-fund managers started utilizing more sophisticated strategies
and offering a wider variety of products. At the height of the bull market between 1995
and 1999, hedge funds posted unprecedented high returns (although remaining below the
return on the S&P 500 Index), engendering a rush among traditional money managers to
become hedge-fund managers. The end of the 1990’s turned out to be an interesting
period for the industry. Cash flows into hedge funds, which peaked at $22.2 billion in
1997, were down to a mere $3.3 billion by 1999 (Tremont Capital Management).
Perhaps the booming stock market, with annual returns in the 20%-40% range, made the

search for alternative asset classes unnecessary. However, in 1999, as net
inflows into hedge funds reached their abyss, hedge fund alternatives--as measured by the
Credit Suisse/Tremont Hedge Fund Index (HFI)--posted a respectable gain of 18% in the
presence of the 21% rise in the S&P 500 Index. In the three subsequent years, hedge
funds on the average posted a cumulative return gain of 21% while the S&P 500 was
actually down some 43%.
The strong performance of hedge funds during 2000-2002 turned out to be
attractive to investors who were frantically looking for alternative investment
opportunities. Net inflows to hedge funds were $72 billion in 2003 and $123 billion in
2004. As the markets recovered, hedge-fund returns sustained, although once again the
S&P 500 index returns proved to be stronger. Although industry returns remained strong,
the post tech stock boom period led to the downfall of many hedge funds. With the
recovery of the market and continued market volatility, the most successful hedge funds
have captured excess returns while lowering volatility, thereby preserving capital and
delivering positive returns under all market conditions. 2005 saw a global decline in
hedge-fund inflows as compared to the record setting numbers in 2004. A combination
of weaker hedge-fund performance both in absolute terms and relative to more traditional
funds and a decline in investor sentiment after the 2005 credit rating downgrades of the
motor industry, which left a number of funds with substantial losses, likely explain
declining inflows (Financial Times, February 8, 2006).

Hedge Funds and Massachusetts
From a local perspective, Massachusetts has participated in the hedge fund boom,
but more or less on average in terms of state-wide capital raised and the number of hedge
funds (shown later). In 2003, the Institutional Investor reported that just under 7 percent
of all hedge-fund capital was in Massachusetts, ahead of Texas, Illinois and Maryland,
but behind New York, Connecticut and California. This capital-based breakdown is
shown in Exhibit 3.i That being said, some significant players in the Boston-area mutual-
fund industry have recently moved into hedge funds and other “private” investment
pools. According to an article in the Boston Business Journal (March 3-9, 2006, Vol. 26,
No. 5) Fidelity Investments, MFS Investment Management, Wellington Management
Company, Pioneer Investment Management Inc., Putnam Investments and State Street
Corporation are some of the well-known names in Massachusetts that have jumped into
the private fund management arena (see Exhibit 4a for a sample of private funds managed
by Boston-area mutual fund companies and Exhibit 4b for a list of the ten largest private
fund managers in Massachusetts).
The rest of our hedge-fund survey proceeds as follows. Section II provides an
overview of the types of hedge funds. Section III sheds light on the hedge-fund
regulatory environment. Section IV looks at hedge-fund domiciles and manager
locations, according to comprehensive data provided from the Alternative Asset Center
(AAC). Section V looks at hedge-fund performance, based on the Credit Suisse/Tremont
HFI and hedge-fund styles. Fund performance is measured in absolute terms and relative
to a Capital Market Line (CML) analysis of portfolio returns and risk. Section VI

concludes with two questions regarding “Where have we been?” and “Where are we
going with hedge funds?
II. TYPES OF HEDGE FUNDS
A popular notion is that hedge funds post volatile returns, utilize global macro
strategies, take risky positions in stocks, bonds, currencies, and/or commodities, and are
very highly leveraged. In fact, less than five percent of hedge funds fall under the
category of global macro funds or other seemingly high-risk funds. Most funds either do
not use derivatives or use them only for hedging and many funds are not highly
leveraged. A partial listing of hedge-fund types or what is generally known in the
industry as hedge-fund “styles” is as follows (more details can be obtained from
www.employees.org):
• Convertible Arbitrage: This strategy is identified by hedge investing in the
convertible securities of a company. A typical investment is to long the
convertible bond and short the common stock of the same company. Positions are
designed to generate profits from the fixed income security as well as the short
sale of stock, while protecting principal from market moves.
• Fixed Income Arbitrage: this strategy includes interest-rate-swap arbitrage, US
and non-US government bond arbitrage, forward-yield-curve arbitrage, mortgage-
backed securities arbitrage, capital-structure arbitrage, and closed-end fund
arbitrage. Managers attempt to hedge out most market risk by taking offsetting
positions, often in different securities of the same issuer and on obtaining returns
with low or no correlation to bond (and equity) markets.
• Event-Driven: strategies are defined as equity-oriented investing designed to
capture price movement generated by anticipated corporate actions or events.

These include:
(a) E.D.-Risk Arbitrage: simultaneously take long and short positions, respectively, in
the acquired and acquirer companies in a merger or acquisition. The idea is that
corporate bidders typically overpay for what they get.
(b) E.D.-Distressed Securities: buys deeply discounted equity, debt or trade claims of
firms facing financial distress (bankruptcy or reorganization). The managers hope
to gain from the market’s lack of understanding of the true value of the company
and its securities. Moreover, these securities may be undervalued because
institutional investors are not allowed to invest in less than investment grade
securities.
• Global Macro: aims to profit from changes in global economies typically brought
about by shifts in government policy that impact interest rates, in turn affecting
currency, bond, and stock markets. Many of these funds participate
simultaneously in developed and emerging economies’ equity, bond, currency and
commodities markets.
• Equity Market Neutral: This strategy is designed to exploit equity market
inefficiencies and invests equally in long and short equity portfolios, generally in
the same sectors of the market. The overriding performance goal of this market-
neutral (or beta-equal-zero) strategy is to add positive “alpha” to the risk-free rate
of interest.
• Long/Short Equity: This directional strategy involves equity-oriented investing on
both the long and short sides of the market. Managers have the ability to shift
from value to growth, from small- to medium- to large-capitalization stocks, and
from a net-long position to a net-short position. The focus may be regional, such
as long/short US or European equity, or sector-specific, such as long and short
technology or healthcare stocks. A recent innovation uses economic profit (EVA)
analysis to identify long and short equities based on the fundamentals of wealth
creation (Abate, Grant, and Stewart, 2005).

• Short Selling: Dedicated short investors sell securities short in anticipation of
being able to buy them at a future date at a lower price. The manager's
assessment is that the market has overvalued the security, or anticipates decline in
the price due to events such as accounting irregularities, new competition and
change of management. Once a popular category of hedge funds, the strategy fell
out of fashion during the long bull market in the 1990s when it became difficult to
implement. A new category, "dedicated short bias", which maintains a net short
position, has emerged more recently.
• Managed Futures: This strategy is geared toward listed financial and commodity
futures markets and currency markets around the world. The managers are usually
referred to as Commodity Trading Advisors, or CTAs. Trading disciplines are
generally systematic (mechanical systems) or discretionary. Systematic traders
tend to use price and market-specific information (often technical) to make
trading decisions, while discretionary managers use a judgmental approach.
• Emerging Markets: This strategy involves investing in the securities of emerging
market regions or countries where the inflation rate is relatively high and the
growth rate is deemed volatile.
III. OVERVIEW OF THE HEDGE FUND REGULATORY ENVIRONMENT
Hedge funds are exempt from regulation under the Securities Act of 1933 because
their securities are not offered publicly. In addition, since investment in a particular
hedge-fund is limited to fewer than 100 “accredited investors”ii, these funds are exempt
from the Investment Company Act of 1940. As a result, hedge funds are exempt from the
disclosure and reporting requirements to which other funds are subject. In 1996 the
National Securities Markets Improvement Act was introduced; the Act expanded the
exclusions to funds that have fewer than 500 investors, each with a net worth of at least
$5 million. However, the exemptions do come with a price tag; hedge funds are not

allowed to advertise or solicit business in any manner. In fact, voluntary disclosure of
positions and other investment information may be viewed as soliciting business,
discouraging many hedge funds from making voluntary disclosures to avoid scrutiny
under the Investment Company Act.
All this does not imply that hedge funds can operate completely without
disclosing their financial activities. For example, even though hedge funds are not
required to make disclosures to regulators and the public, by law they do have to provide
information on their financial activities to their shareholders. Also, hedge funds that
trade in derivatives exchanges and have US citizens as investors must register with the
Commodity Futures Trading Commission as Commodity Pool Operators, thereby
subjecting them to the Commodity Exchange Act of 1936 (an Act established to regulate
futures markets).
New regulation from the Securities and Exchange Commission (SEC) was
introduced in 1999, in the wake of the near-collapse of Long Term Capital Management.
Under the regulation a hedge-fund with more than $3 billion of capital or with assets
exceeding $20 billion or with leverage ratios of more than 10:1 were now required to file
quarterly reports with the Federal Reserve, the Treasury Department, the SEC and other
investment interest groups. However, that regulation had little effect on the industry
because it is estimated that only about 3 percent of hedge funds in the world have assets
greater than $500 million and less than 5 percent of funds have leverage ratios of greater
than 10:1.
Under a rule adopted in late 2004, hedge-fund firms have to register with the SEC
by February 1, 2006. All advisors with at least $30 million in assets under management

or at least fifteen individual investors are required to register. Funds that lock up
investors’ money for more than two years or are not accepting new investors are exempt
from registration. Registration on “form ADV” of the SEC requires information on the
educational background of the managers, their past business experience and past
disciplinary problems, fee arrangements, and total assets under management. The SEC
reports that more than 900 firms have registered since the beginning of 2005, along with
others that had registered even before this rule was adopted. While this may be a further
step toward tighter regulation of the hedge-fund industry, many observers point out that
reading ADVs may not be sufficient to replace researching a hedge-fund management
team with interviews and questionnaires, or hiring consultants to investigate funds before
investing in them.
IV: HEDGE-FUND DEMOGRAPHICS
In this section, we look at hedge-fund demographics in the context of (a) hedge-
fund domiciles and (b) location of hedge-fund managers according to comprehensive data
collected by the Alternative Asset Center (AAC). A breakdown of hedge-fund domicile,
with a particular emphasis on U.S. versus non-U.S domiciled hedge funds is first
provided, followed by a global-based breakdown of hedge-fund managers by location,
particularly, U.S. stateside locations.

Hedge-fund Domiciles
Exhibit 5 provides a breakdown of hedge-fund domiciles for U.S. versus non-
U.S.-based hedge funds according to data provided by AAC. Of the 1410 hedge funds
covered in this database as of January 31, 2006, 764 (or 54%) of these funds were
headquartered “offshore”, including the Cayman Islands, British Virgin Islands,
Bahamas, and Bermuda, while 312 hedge funds (or 22%) were domiciled in the United
States. The exhibit also shows that 43 funds were domiciled in Ireland, with a balance of
291 funds (or 21%) domiciled in a category labeled “Other”, consisting primarily of
hedge funds domiciled in Western Europe, particularly France, Germany, and the United
Kingdom.
Exhibit 6 provides a closer look at the breakdown of hedge-fund domicile by U.S.
versus non-U.S.-domiciled funds. The exhibit shows that of the 764 hedge funds
classified as “offshore”, some 530 (or 38% of all funds) were domiciled in the Cayman
Islands. In turn, a large number of offshore funds were domiciled as follows: British
Virgin Islands (107 funds, 8% of the total), Bermuda (91 funds, 6% of the total), and the
Bahamas (36 funds, 2% of the total). As before, the exhibit shows that Ireland made up
3% of reporting funds while Western Europe consists of some 20% of overall hedge
funds covered by the Alternative Asset Center.
In turn, Exhibit 7 provides a state-wide breakdown of the overall number of U.S.
domiciled hedge funds. Not surprisingly, we see that Delaware accounts for 235 (or 75%)
of 312 domiciled U.S. hedge funds as listed in the AAC database. Following that, we see
that no other U.S. state accounts for more than 5% of the total number of U.S. domiciled

hedge funds. Notably, the exhibit shows that only 15 of the AAC reporting funds were
domiciled in California (at 5%), 12 funds (at 4% each) were domiciled in Florida and
New York, 11 funds were domiciled in Illinois, and 8 funds were domiciled in
Connecticut. Moreover, the Alternative Asset Center reports that only 4 hedge funds were
domiciled in Texas, 3 funds in Massachusetts, and 1 hedge-fund domiciled in New
Jersey.
Hedge-fund Manager Location
A contrasting look at hedge-fund domicile versus geographic location of hedge-
fund managers leads to some interesting observations. Unlike the breakdown of hedge
funds by domicile (Exhibits 5 and 6), Exhibit 8 reveals that hedge-fund management is
evenly split between U.S. domiciled managers and non-U.S. domiciled managers.
Particularly, of the 1410 hedge funds reported by the Alternative Asset Center, some 730
of the funds (or 52%) were managed in the U.S., while 680 funds had fund managers
located outside the U.S.
Exhibit 9 provides a breakdown of hedge-fund manager location by U.S. states as
reported in AAC. The exhibit is interesting in that it shows a range of U.S. states where
hedge-fund managers are domiciled along with the number of hedge-fund managers by
states. Not surprisingly, most hedge-fund managers are domiciled in New York, with
some 334 managers or 46% of total U.S. hedge-fund reporting managers in the AAC
database. The second in line is California, which accounts for 106 (or 15%) of U.S.
domiciled hedge-fund managers. All other states in AAC database account for less than

10% of U.S. domiciled fund managers.
Exhibit 10 provides a closer look at hedge-fund manager domicile with a listing
of the top 10 U.S. states by hedge-fund manager location. Again, New York and
California take up the first two U.S. manager domiciled positions, followed by Illinois,
Connecticut, and Florida in positions three to five, with about 40-50 hedge funds with
U.S. domiciled managers (or about 6% each). Next, Massachusetts is listed as number
“six”, with 32 reported U.S. domiciled hedge-fund managers (or about 4% of total)
followed by Texas, New Jersey, Pennsylvania, and Minnesota, in positions seven to 10
respectively, each with less than 3% of reporting managers.
Exhibits 9 and 10 reveal that the top five U.S. states account for some 79% of
hedge-fund manager domiciles, while the top 10 U.S. states account for about 90% of
hedge-fund manager domiciles. Taken together (Exhibits 5-10), the reported hedge-fund
demographics reveal that (a) most hedge funds are domiciled outside the United States,
particularly in the Cayman Islands, and (b) to the extent that hedge funds are domiciled in
the U.S., they are largely domiciled in Delaware. A sharply different picture emerges
from the ACC database when ranking hedge funds by manager location. Notably, about
one-half of reporting funds are managed in the United States, particularly New York,
followed by California, Illinois, Connecticut and Florida.
V: HEDGE-FUND PERFORMANCE AND RISK
In this section we look at hedge-fund performance, with an eye toward assessing risk-
adjusted return performance. First, we analyze the overall performance of hedge funds

versus traditional assets such as equities and then we examine the performance of hedge
funds in the context of a Capital Market Line (CML) assessment of performance versus
risk. Following that, we look at a breakdown of the risk-adjusted performance of 10
hedge-fund “styles” (actually, 13 strategies if one includes a breakdown of the “Event
Driven” classification) as represented by Credit Suisse/Tremont Hedge-fund Indices. Our
hedge-fund performance and style assessment is based on the Credit Suisse/Tremont HFI
and sub indices.
The Credit Suisse/Tremont sub indices parallel the hedge-fund strategies that we
introduced before. The specific names of the 10 hedge-fund styles covered by Credit
Suisse/Tremont include Convertible Arbitrage, Fixed Income Arbitrage, Event-Driven
(including, E.D.-Distressed, E.D.-Risk Arbitrage, and E.D. Multi-Strategy), Global
Macro, Long-Short Equity, Equity Market Neutral, Dedicated Short Bias, Managed
Futures, Emerging Markets, and Multi-Strategy (combination). In our style-based
performance assessment, we look at annualized returns, standard deviation of return (total
risk), and risk-adjusted performance, measured by the Sharpe ratio. The Sharpe ratio is
the annualized fund premium (return over risk-free rate) divided by the standard
deviation of asset or portfolio return.
HFI: Absolute and Risk-Adjusted Returns
We first assess the performance of the Credit Suisse/Tremont HFI versus
traditional assets including the S&P 500, the MSCI World Index, and U.S. Treasury Bills
(a risk-free asset). In this context, Exhibit 11 shows the annualized returns over the 1994

to 2005 period (twelve years since inception) on the Credit Suisse/Tremont HFI versus
three well-known assets. Based on annualized returns alone, hedge funds as an alternative
asset class provided a return which, at about 10.5%, is competitive with that earned on
U.S. equities. Moreover, the twelve-year HFI performance is considerably better than that
observed on the MSCI World index and (not-surprisingly) U.S. Treasury Bills, with
annualized returns of 8.4% and 3.84% respectively.
Exhibit 12 shows the performance of the Credit Suisse/Tremont HFI relative to a
Capital Market Line. While Exhibit 11 reveals that the annualized return to hedge-fund
investing is competitive with that of equity indexing (to the S&P500), Exhibit 12
highlights the benefit of hedge funds from a risk management perspective. Specifically,
the latter exhibit shows that the annualized standard deviation on the Credit
Suisse/Tremont HFI over the 1994 to 2005 period is about 8% (actually, 7.88%), while
the comparable risk measure for the S&P500 was considerably higher, at 15% (14.77%).
Moreover, Exhibit 12 shows that a CML-based strategy that combines the Credit
Suisse/Tremont HFI with the risk-free asset provides better returns on a risk-adjusted
basis than that observed on a two-asset portfolio consisting of the market index (S&P
500) and the risk free asset. In other words, the Sharpe ratio (slope of the CML) for the
Credit Suisse/Tremont HFI is considerably higher than that observed on the S&P500, at
0.87 and 0.45, respectively.
Style-Based Performance and Risk
We now assess the performance of hedge funds by fixed income and equity

“style”. Exhibit 13 shows the annualized returns of the 10 hedge-fund-style
classifications within the Credit Suisse/Tremont HFI. Again, we will illustrate hedge-
fund performance over the twelve years (1994-2005) since inception of the Credit
Suisse/Tremont hedge-fund indices. In this context, we see that the three highest
performing hedge-fund styles, with absolute returns exceeding the 10.5% annualized
return on the Credit Suisse/Tremont HFI and S&P500, were Global Macro, at 13.53%,
Event Driven-Distressed, at 13.44%, and Long-Short Equity, at 11.90%. In turn, Exhibit
13 shows that the three hedge-fund styles with low-to-negative absolute returns were
Managed Futures, at 6.36%, Fixed Income Arbitrage, at 6.28%, and Dedicated Short
Bias, at -2.03%. As seen shortly, Managed Futures and Dedicated Short Bias styles were
troubling because those strategies involve a high level of portfolio risk.
Exhibit 14 shows the performance of hedge-fund styles measured relative to the
CML. In this exhibit, we see that the three best-performing hedge-fund styles as
measured by absolute return, namely Global Macro, E.D.-Distressed, and Long-Short
Equity, also provided attractive risk-adjusted returns. In each case, the annualized
standard deviations, at about 11%, 6.5%, and 10%, respectively, were lower than that
observed on the S&P 500 and MSCI World indexes, with volatility estimates near 15%
and 14% respectively. Also, the Sharpe ratio for the high absolute performing hedge-fund
styles, 0.87, 1.49, and 0.79, respectively, were considerably higher than corresponding
reward-to-risk ratio for the reference equity indexes, S&P 500 and MSCI World, at 0.45
and 0.33.
A closer look at Exhibit 14 reveals that most of the hedge-fund styles

outperformed the market on a risk-adjusted return basis. This is measured by a
predominance of hedge-fund styles- including three high absolute return styles along with
the low risk hedge-fund styles such as Equity Market Neutral, E.D.-Risk Arbitrage, Fixed
Income Arbitrage, Convertible Arbitrage, and Multi Strategy (combination)-that plot
above the CML. The three highest Sharpe ratios were observed on Equity Market
Neutral, E.D.-Distressed (within Event-Driven), and Multi-Strategy, at 2.08, 1.49, and
1.28 respectively. In contrast, the worst performing hedge-fund styles on a risk-adjusted
basis were Emerging Markets, Managed Futures, and (worst yet) Dedicated Short Bias,
with Sharpe ratios of 0.28, 0.21, and -0.34.
Hedge Funds during Bull and Bear Markets
We also looked at hedge-fund performance during both “bull” and “bear” markets
(not shown graphically). Here, we find that hedge funds as an asset class underperformed
the stock market (S&P 500) during the six-year, “bull market” run-up to 1999, while on
average they outperformed the market during the six-year “bear market” through 2005.
As we noted before, hedge funds (overall) provided higher risk-adjusted returns for the
12 years since inception of the Credit Suisse/Tremont HFI, with the primary benefit
coming from portfolio risk management (via risk reduction). Moreover, we observe a
noticeable decrease in the risk of several hedge-fund styles, notably Global Macro and
Long-Short Equity, when comparing risk-adjusted returns during the first half of the
sample period, 1994-1999, with performance and risk considerations during the second
half, 2000-2005.

VI: CONCLUSION
We conclude our hedge-fund survey in the context of two questions: “Hedge
funds: Where have we been?”, and “Hedge funds: Where are we going?” Our reported
findings on hedge-fund shareholders, the regulatory environment, demographics, and
hedge-fund performance can be used to shed light on the first question. Here we observed
that while individual investors still make up more than half of all hedge-fund
shareholders, foundations, pension funds, and university endowments are increasing their
stake in alternatives. While hedge funds still remain largely unregulated, the legal
environment is rapidly moving toward increased disclosure and transparency. Moreover,
while hedge funds are mostly domiciled “offshore”, hedge-fund managers are primarily
located in the United States, particularly New York, California, Illinois, Connecticut, and
Florida.
We find that the overall performance of hedge funds (measured by Credit
Suisse/Tremont HFI, 1994-2005) as an asset class is about the same as that of U.S.
equities (S&P 500). On an absolute-returns basis, hedge funds underperformed the stock
market (S&P 500) during the six-year, “bull market” run-up to 1999, while on average
they outperformed the stock market during the six-year “bear market” (or lull period)
through 2005. Overall, we find that the benefit of hedge funds as an asset class lies in risk
management. This finding is in sharp contrast to the often negative publicity that
alternative investment vehicles receive because of their perceived lack of regulation,
transparency and disclosure.
We also find that during 1994-2005 most hedge-fund “styles” provided solid
absolute and risk-adjusted returns. The best absolute-return-performing styles were
Global Macro, Event Driven-Distressed, and Long-Short Equity, each with returns
exceeding the 10.5% annualized return on the S&P 500 and Credit Suisse/Tremont HFI
benchmarks over the comparable period. The best performing hedge-fund styles on a
risk-adjusted basis (Sharpe ratio) were Equity Market Neutral, E.D.-Distressed, and
Multi-Strategy (combination). In turn, the worst performing hedge-fund strategies on a
risk-adjusted returns basis (1994-2005) were Emerging Markets, Managed Futures, and
Dedicated Short Bias (which was worst of all, with negative annualized return and high
risk). On balance, we find that hedge funds have been clearly worth the “bang for the
buck” for both passive (hedge-fund indexers) and active investors, since hedge-fund
indices and (most) hedge-fund styles outperformed the market on a risk-adjusted returns
basis.
In our answer to the second concluding question, “Hedge funds: Where are we
going?”, we suggest that given the return and risk-management benefits of hedge funds,
investors (particularly institutional investors) will likely continue increasing their stake in
these “just in time” alternatives. As the hedge-fund regulatory environment tightens,
managers will likely place greater emphasis on risk controls, which may limit the
potential for generating abnormally high returns. In turn, as competition heats up, the
ability to find top performing managers may become more difficult. Also, due to
increased operating costs arising from enhanced disclosure and reporting requirements,
some hedge-fund managers may move back to traditional asset management, such as the
mutual fund venue. As the stock market outlook improves, there could also be a shift

away from hedge funds back to indexing.
In sum, we believe that hedge funds are here to stay! These alternative
investments have already shaped the world of portfolio performance and, especially, risk
management in a positive and meaningful way. Going forward, we temper our hedge-
fund findings with the usual caveat that “past performance provides no guarantee of
future performance.”

REFERENCES
Abate, James A., Grant, James L., and Bennett, Stewart III, “The EVA Style of Investing,” Journal of Portfolio Management, Summer 2005.
Clements, Jonathan (2006), “Investing like the pros do: combining index funds with alternative strategies,” The Wall Street Journal, February 8.
Credit Suisse/Tremont Hedge Index (January, 2006), Credit Suisse/Tremont LLC, www.hedgeindex.com
“Cutting Both Ways”, Financial Times, February 8, 2006.
Douglas, Craig M. (2006), “Fund Firms Expand with Big-Money Products”, Boston Business Journal, March 3-9, Vol. 26, No. 5.
Hedge Funds Data Feeder (January 31, 2006), Alternative Asset Center, www.aa-center.com
Inglis, David (2005), “A Brief History of Hedge Funds”, www.hughestrustco.com
Institutional Investor (2003), “The Hedge-fund 100”, June, 40-43. Kat, Harry M. and Palaro, Helder P. (2005), “Who Needs Hedge Funds: A Copula-Based Approach to Hedge-fund Return Replication”, Alternative Investment Research Working Paper Series, Working Paper Number 0027. Kerber, Ross (2006), “Pension officials defend strategy: Hedge funds cut risk in portfolio, they say” Boston Globe, March 22. Kerber, Ross (2006), “SEC Filings Show Boston is a Leader in Hedge Funds”, Boston Globe, April 21.
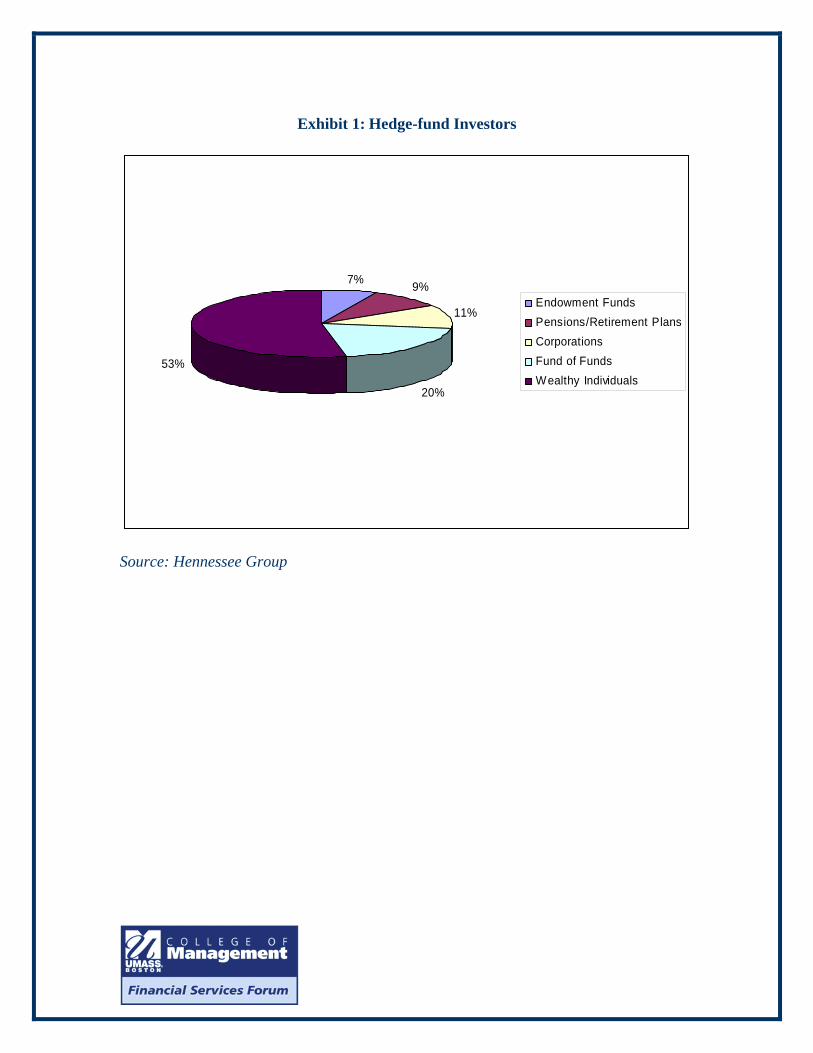
Exhibit 1: Hedge-fund Investors
7% 9%
11%
20%
53%
Endowment FundsPensions/Retirement PlansCorporationsFund of FundsWealthy Individuals
Source: Hennessee Group

Exhibit 2: Investment by Asset Class of the 200 Largest Pension Plans
0.00%
5.00%
10.00%
15.00%
20.00%
25.00%
30.00%
35.00%
40.00%
45.00%
1995 Stake 2005 Stake
Active StocksIndex Stock FundsAlternative InvestmentsBonds and Cash
Adapted from The Wall Street Journal (February 8, 2006). Source: Pensions and Investments

Exhibit 3: Distribution of Hedge-fund Capital by State
0.00%
5.00%
10.00%
15.00%
20.00%
25.00%
30.00%
35.00%
40.00%
45.00%
50.00%
NY CT Out ofUS
CA MA TX IL MD PA WI FL MN NJ
State
Per
cent
age
of H
edge
Fun
d Ca
pit
Source: Institutional Investor.

Exhibit 4a: Sample of Private Funds Managed by Boston-Area Mutual Fund Firms
Firm Fund Asset (in millions) Minimum Investment
Eaton Vance Corp. Belvedere Capital Fund Co. LLC
$12,868 $1 million
Wellington Management Co. Spindrift Investors (Bermuda) LP
$1,187 $3 million
Pioneer Investment Management
Momentum AllWeather Fund
$1,091 $250,000
GMO LLC GMO Multi-Strategy Fund (offshore)
$990 $1 million
State Street Research and Management Co.
Energy and Natural Resources Hedge Fund
$418 $1 million
Evergreen Investments Hedged Equities, Super Accredited LP
$260 $250,000
Putnam Investments Putnam International Equity Fund LLC
$199 NA
Exhibit 4b. 10 Largest Private Fund Managers in Massachusetts
Name Private Fund Assets ($ millions)
Columbia Management ADV. (Bank of America) 28,356.70
Boston Management and Res. (Eaton Vance) 26,379.10
Wellington Management Co. 10,041.90
Adage Capital Management 7,650.00
Grantham Mayo van Otterloo & Co. 6,703.60
Renewable Resources 6,703.20
GMO Australasia 6,422.30
Pioneer Investment Management 5,539.60
Baring Asset Management 5,282.00
Baupost Group 5,152.30
Adapted from the Boston Business Journal and the Boston Globe (Source: SEC)

Exhibit 5Hedge Fund Domicile
Source: Alternative Asset Center
0
100
200
300
400
500
600
700
800
900
USA Offshore Ireland Other
# H
edge
Fun
ds
Cayman+British VI+Bermuda+Bahamas
Exhibit 6Hedge Funds by Selected Domicile
Source: Alternative Asset Center
0
100
200
300
400
500
600
USA Cayman Islands British VirginIslands
Bermuda Bahamas Ireland Other
# H
edge
Fun
ds

Exhibit 7US Hedge Fund Domicile by StatesSource: Alternative Asset Center
0
50
100
150
200
250
USA, Cali
fornia
USA, Colo
rado
USA, Con
necti
cut
USA, Dela
ware
USA, Flor
ida
USA, Idah
o
USA, Illin
ois
USA, Ken
tucky
USA, Mas
sach
usett
s
USA, Nev
ada
USA, New
Jerse
y
USA, New
York
USA, Ohio
USA, Pen
nsylv
ania
USA, Tex
as
USA, Virg
inia
# H
edge
Fun
ds
Exhibit 8Hedge Fund Managers: US Domiciled vs. Non-US Domiciled
Source: Alternative Asset Center
0
200
400
600
800
1000
1200
1400
1600
# HF Managers # US Domiciled Managers # Non-USA Domiciled Managers
# Po
rtfo
lio M
anag
ers
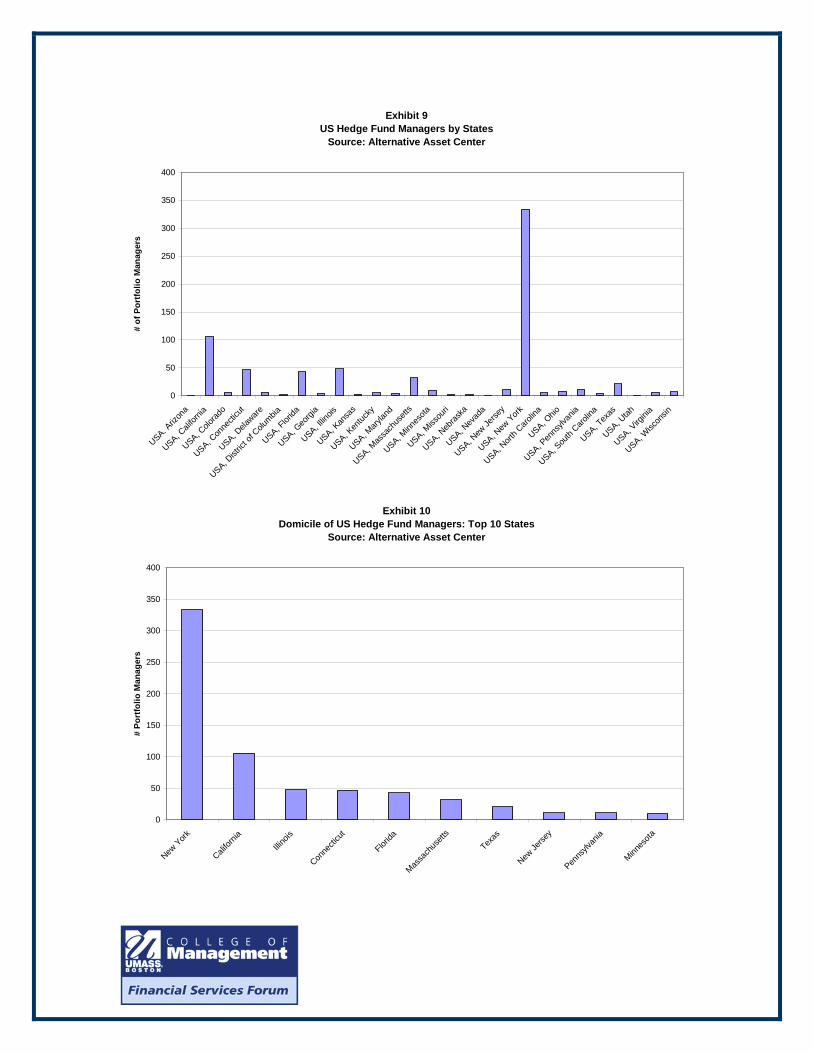
Exhibit 9US Hedge Fund Managers by States
Source: Alternative Asset Center
0
50
100
150
200
250
300
350
400
USA. Ariz
ona
USA, Cali
fornia
USA, Colo
rado
USA, Con
necti
cut
USA, Dela
ware
USA, Dist
rict o
f Colu
mbia
USA, Flor
ida
USA, Geo
rgia
USA, Illin
ois
USA, Kan
sas
USA, Ken
tucky
USA, Mary
land
USA, Mas
sach
usett
s
USA, Minn
esota
USA, Miss
ouri
USA, Neb
raska
USA, Nev
ada
USA, New
Jerse
y
USA, New
York
USA, Nort
h Caro
lina
USA, Ohio
USA, Pen
nsylv
ania
USA, Sou
th Caro
lina
USA, Tex
as
USA, Utah
USA, Virg
inia
USA, Wisc
onsin
# of
Por
tfolio
Man
ager
s
Exhibit 10Domicile of US Hedge Fund Managers: Top 10 States
Source: Alternative Asset Center
0
50
100
150
200
250
300
350
400
New York
Califor
niaIlli
nois
Conne
cticu
t
Florida
Massa
chus
etts
Texas
New Je
rsey
Penns
ylvan
ia
Minnes
ota
# Po
rtfo
lio M
anag
ers
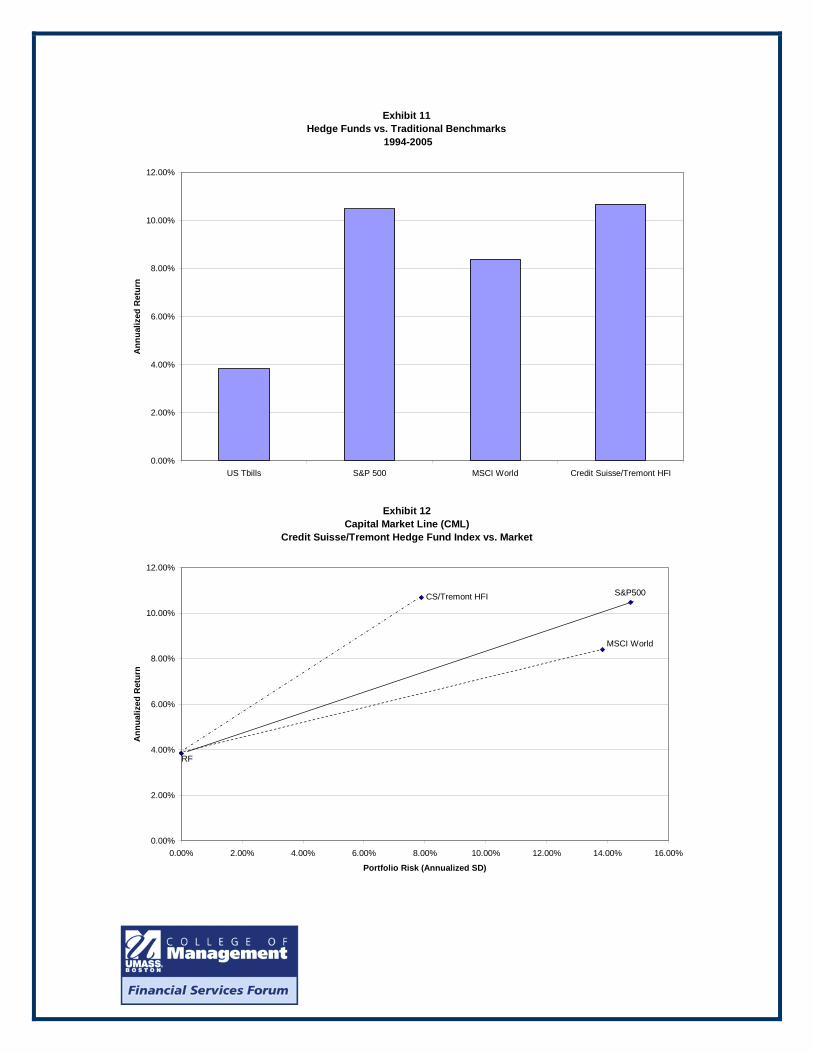
Exhibit 11Hedge Funds vs. Traditional Benchmarks
1994-2005
0.00%
2.00%
4.00%
6.00%
8.00%
10.00%
12.00%
US Tbills S&P 500 MSCI World Credit Suisse/Tremont HFI
Ann
ualiz
ed R
etur
n
Exhibit 12Capital Market Line (CML)
Credit Suisse/Tremont Hedge Fund Index vs. Market
0.00%
2.00%
4.00%
6.00%
8.00%
10.00%
12.00%
0.00% 2.00% 4.00% 6.00% 8.00% 10.00% 12.00% 14.00% 16.00%
Portfolio Risk (Annualized SD)
Ann
ualiz
ed R
etur
n
S&P500
MSCI World
CS/Tremont HFI
RF

Exhibit 13Performance of Hedge Fund Strategies: 1994-2005
-4.00%
-2.00%
0.00%
2.00%
4.00%
6.00%
8.00%
10.00%
12.00%
14.00%
16.00%
Conve
rtible
Arbitra
ge
Dedica
ted S
hort
Emerging
Mark
ets
Equity
Mkt
Neutra
l
Event
Driven
(Com
posit
e)
Distres
sed
Event
Multi-S
trateg
y
Risk Arbi
trage
Fixed I
ncom
e Arb
Global
Macro
Long
/Short E
quity
Manag
ed Futu
res
Multi-S
trateg
y
Ann
ualiz
ed R
etur
n
Exhibit 14Hedge Fund MPT Analysis
(Performance vs. Risk)
-4.00%
-2.00%
0.00%
2.00%
4.00%
6.00%
8.00%
10.00%
12.00%
14.00%
16.00%
0.00% 2.00% 4.00% 6.00% 8.00% 10.00% 12.00% 14.00% 16.00% 18.00%
Portfolio Risk (Annualized SD)
Ann
ualiz
ed R
etur
n
S&P500
RF
MSCI World
CS/Tremont HFI
Dedicated Short
Emerging Mkts
Managed Futures
Equity Mkt Neutral
Distressed Global Macro
Long/Short EquityEvent Driven
Fixed Income Arb
Convertible ArbCMLMulti-Strategy
Risk Arb
Event-Multi

i An April 21, 2006 Boston Globe article suggests that according to more recent SEC data Massachusetts financial firms help manage about 10 percent of the estimated $1.5 trillion held in private funds throughout the country. ii “Accredited investors” have a net worth of at least $1 million and either an income of at least $200,000 individually in each of the past two years, or a joint spousal income of in excess of $300,000 in each of the past two years.