estimating return on investment for interventions and ... · 5 estimating the return on investment...
TRANSCRIPT

Estimating Return on Investment
for interventions and strategies
to increase physical activity
Technical Report
May 2014

2 Estimating the Return on Investment for interventions and strategies to increase physical activity – Technical Report
Matrix and Matrix Knowledge are trading names of TMKG Limited (registered in England
and Wales under registration number 07722300) and its subsidiaries: Matrix Decisions
Limited (registered in England and Wales under registration number 07610972); Matrix
Insight Limited (registered in England and Wales under registration number 06000446);
Matrix Evidence Limited (registered in England and Wales under registration number
07538753); Matrix Observations Limited (registered in England and Wales under
registration number 05710927); and Matrix Knowledge Group International Inc. (registered
in Maryland, USA under registration number D12395794).
Disclaimer In keeping with our values of integrity and excellence, Matrix has taken
reasonable professional care in the preparation of this document. Although Matrix has
made reasonable efforts, we cannot guarantee absolute accuracy or completeness of
information/data submitted, nor do we accept responsibility for recommendations that may
have been omitted due to particular or exceptional conditions and circumstances.
Confidentiality This document contains information which is proprietary to Matrix and may
not be disclosed to third parties without prior agreement.
Except where permitted under the provisions of confidentiality above, this document may
not be reproduced, retained or stored beyond the period of validity, or transmitted in whole,
or in part, without Matrix’s prior, written permission.
© TMKG Ltd, 2012
Any enquiries about this report should be directed to [email protected]

3 Estimating the Return on Investment for interventions and strategies to increase physical activity – Technical Report
Contents
NICE Disclaimer ............................................................................................ 4
1.0 Introduction............................................................................................ 5
2.0 Features of the Physical Activity ROI tool .............................................. 5
3.0 Method .................................................................................................. 8
3.1 Economic model ...................................................................................................................... 8
3.2 Physical activity model for adults ............................................................................................ 8
3.3 Physical activity model for children ....................................................................................... 11
3.4 Model outputs ........................................................................................................................ 12
3.5 Key assumptions ................................................................................................................... 13
3.6 Key limitations ....................................................................................................................... 16
3.7 Sensitivity analysis ................................................................................................................ 16
4.0 Appendices.......................................................................................... 20
4.1 Appendix 1: References ........................................................................................................ 20
4.2 Appendix 2: Glossary ............................................................................................................ 21
4.3 Appendix 3: Definitions of the ROI metrics in the tool........................................................... 22
4.4 Appendix 4: Physical activity interventions included in the tool ............................................ 24
4.5 Appendix 5: Literature review ................................................................................................ 29
4.6 Appendix 6: Model parameters ............................................................................................. 36
4.7 Appendix 7: Additional information ....................................................................................... 40

4 Estimating the Return on Investment for interventions and strategies to increase physical activity – Technical Report
NICE Disclaimer
This tool is intended to help users to understand the return on investment of their chosen package of
interventions. Where relevant, the comparative figures are based on two different ‘packages’ of
interventions, one of which could be ‘baseline’ defined as a hypothetical situation where ‘there are no
interventions’ at present. It is left to the users to select which interventions will make up a package
and decide which packages of interventions they would like to compare.
Readers are asked to read the accompanying User Guide and Technical Report before they use this
tool.
NICE has provided this tool to aid decision-making. NICE cannot be held liable for any investment or
other decisions that are made using information and results obtained from this tool. Implementation of
NICE guidance is the responsibility of local commissioners and/or providers. Commissioners and
providers are reminded that it is their responsibility to implement NICE guidance, in their local context,
in light of their duties to avoid unlawful discrimination and to have regard to promoting equality of
opportunity. Nothing in this tool should be interpreted in a way that would be inconsistent with
compliance with those duties.
If one of more custom interventions are included in a package of interventions NICE recommend this
be made clear in any communications regarding the results
© Copyright National Institute for Health and Clinical Excellence, 2006 (updated 2009). All rights
reserved. This material may be freely downloaded and stored for not-for-profit purposes. No
reproduction by or for commercial organisations, or for commercial purposes, is allowed without the
express written permission of the Institute.

5 Estimating the Return on Investment for interventions and strategies to increase physical activity – Technical Report
1.0 Introduction
On behalf of the National Institute for Health and Care Excellence (NICE), Matrix Knowledge, in
collaboration with LeLan Ltd, have produced this Return on Investment (ROI) tool to help facilitate
decision making at local level in physical activity policy. As part of this programme to support local
decision making, two other tools – in the areas of Tobacco Control and Alcohol Misuse – have been
developed.
The tools have been developed with the aim of enabling users to assess the ROI of implementing a
package of interventions. The tools allow users to estimate benefits that could be achieved through
physical activity programmes in their geographical area (e.g. region county or local authorities). This
required estimating the costs of the interventions as well as their impact. The purpose was to develop
a tool to support commissioners and policy makers in their investment decision by enabling them to
explore the costs and impact of different interventions packages.
2.0 Features of the Physical Activity ROI tool
The tool has a number of useful features for commissioners and planners of local services to promote
physical activity:
There are 13 physical activity interventions in the tool, including:
o 11 adult interventions consisting of:
3 one to one interventions
1 group intervention
1 community intervention
3 workplace interventions
3 environmental interventions
o 2 groups based interventions for children under the age of 15.
A full list and descriptions of these interventions is provided in Appendix 4. In addition, the
tool includes functionality to allow users to incorporate customised (new) interventions.
Most of the interventions and model parameters were drawn from collective NICE Guidance
on physical activity.1 In addition, a literature search was undertaken to include additional
interventions not included in NICE Guidance and to fill data gaps. A list of the key parameters
used to populate the model can be found in Appendix 6.
Users can choose their own local authority or Clinical Commissioning Group (CCG) area,
which has been pre-populated with local-level population data and prevalence of different
levels of physical activity split.2
Each intervention has the following variables attached:
1 NICE guidance PH2, PH8, PH13, PH17, PH41 and PH44
2 The calculations of the number of people in the model are estimates based on 2011 Census data and are split by region.
Regions are defined as the former Government Office Regions, described at: http://www.ons.gov.uk/ons/guide-method/geography/beginner-s-guide/administrative/england/government-office-regions/index.html. The numbers presented in the downloadable word report are rounded to the nearest 1000.

6 Estimating the Return on Investment for interventions and strategies to increase physical activity – Technical Report
o The allocation of the intervention (defined as the percentage of the population that
receives or would receive the intervention). Depending on the intervention, the
population allocated can be either from the inactive population or the general
population. By default, all interventions have a 0% allocation rate assigned.
Therefore, allocation rates need to be set by the user based on actual or desired level
in their local authority or CCG area.
o The effect of the intervention, defined as the percentage increase in people who
move from inactive to either low active (30-149 minutes of moderate exercise per
week) or meeting recommendations (150 minutes or more of moderate exercise per
week). All interventions have a pre-populated effectiveness rate attached (Appendix
4). However, these values can be modified by the user if they have appropriate
evidence of effectiveness from local data or, newly published studies.3
o The cost of the intervention (defined as either the cost of delivery per person or the
total cost of the intervention). As with effect, the cost per person has been pre-
populated for all interventions (Appendix 4), but they can be modified by the user to
adjust, for example, for variances in regional or local prices.
Custom interventions can be created for interventions that have not been included in the
model by default if the three key variables mentioned previously (allocation, effect and cost)
are available to the user from local level data or future publications. Custom interventions are
automatically saved in the tool for future use.
The tool has the ability to group interventions into packages. Packages can include any
combination of interventions. This allows the tool to be used flexibly by users to design
services with different intervention mixes as needed.
As all allocation rates are set to 0% by default, the starting point (Baseline) represents a
scenario of ‘no service provision’. The tool then allows users to build two packages of
interventions:
o The current package. This will typically be used to represent the ‘current scenario’.
To that end, the user must change the allocation of the interventions (from 0%) to the
current level of provision in their local population area.4 The ROI metrics of the
current package will then compare the current package against the Baseline – i.e. the
‘value for money’ of the ‘current scenario’ compared with ‘no service provision’.
o The alternate package. This will be defined by the user by changing the allocation of
the interventions (from the percentages applied in the current package) to reflect
desired levels of service provision.5 The ROI metrics of the alternate package will
then compare:
The alternate package against the Baseline – i.e. ‘desired scenario’
compared with ‘no service provision’.
The alternate package against the current package – i.e. ‘desired
scenario’ compared with ‘current scenario’.
3 We do not recommend making changes to effectiveness rates for interventions unless you have local data or newly published
evidence that is presented - or can be converted to - the effectiveness measure used in the tool. If effectiveness rates are not expressed in the same measure, estimates produced by the tool will not be accurate and may be invalid. 4 As mentioned previously, users can also change the effect and cost of the interventions.
5 Users can also change the cost and effect of the interventions at this stage. However, note that these changes will only apply
the alternate package (and the cost and effect for the current package will remain as previously defined).

7 Estimating the Return on Investment for interventions and strategies to increase physical activity – Technical Report
A number of cost savings and ROI metrics are included in the tool. These are: cost savings,
Incremental Cost Effectiveness Ratio (ICER), net present value (NPV), and benefit-cost ratio.
A glossary of these terms is included in Appendix 1: References
Anokye, N. K., Lord, J., & Fox-Rushby, J. (2014). Is brief advice in primary care a cost-effective way
to promote physical activity?. British journal of sports medicine, 48(3), 202-206.
Araújo-Soares, V., McIntyre, T., MacLennan, G., & Sniehotta, F. F. (2009). Development and
exploratory cluster-randomised opportunistic trial of a theory-based intervention to enhance physical
activity among adolescents. Psychology and Health, 24(7), 805-822.
Baker G., Gray S.R., Wright A., Fitzsimons C., Nimmo M., Lowry R. (2008). The effect of a
pedometer-based community walking intervention "Walking for Wellbeing in the West" on physical
activity levels and health outcomes: a 12-week randomised controlled trial. International Journal of
Behavioral Nutrition and Physical Activity 2008; 5
Department of Health (2008) 'Health Survey for England', NHS: London
Department for Transport (2011) ‘National Travel Survey’. London
NICE (2006) Four Commonly used methods to increase physical activity. Public health guidance 2
NICE (2008) Physical activity and the environment. Public health guidance 8
NICE (2009) Promoting physical activity for children and young people. Public health guidance 17
NICE (2013) Physical activity: brief advice for adults in primary care. Public health guidance 44
NICE (2012) Walking and cycling. Public health guidance 41
Office for National Statistics, http://www.ons.gov.uk/ons/guide-method/geography/beginner-s-
guide/administrative/england/government-office-regions/index.html, accessed on 30/07/2013
Pokhrel, S., Owen, L., Lester-George, A., Coyle, K., Coyle D., Trapero-Bertran M. (2012). Tobacco
Control Return on Investment Tool. London: National Institute for Health and Clinical Excellence.
Sport England (2012) ‘Active People Survey', London

8 Estimating the Return on Investment for interventions and strategies to increase physical activity – Technical Report
Appendix 2.
The cost and ROI metrics are provided for different perspectives or, in other words, sets of
benefits; for example: all cost savings and value of health gains included, all cost savings
included (but no monetary value of health benefits), health care cost savings and value of
health gains, only health care cost savings, only social care cost savings, only productivity
gains, and only transport cost savings. Specific definitions of these metrics are included in
Appendix 3.
For each package the tool calculates the health gains. Health gains are measured in terms of
Quality Adjusted Life Years (QALY) gained.6
The value of the health gains generated by the package is calculated as the QALYs
generated by the package times the ‘value’ of a QALY. The ‘value’ of a QALY is set by default
at £20,000/QALY 7. However this can be modified by the user, to reflect what they are willing
to pay for a QALY.8
Flexible timescales of between one and 48 (lifetime) years are included to allow policy makers
ultimate flexibility in seeing the level of return on investment of the packages of interventions
and how this changes over time.
The tool only provides point estimates (i.e. the average value often called the ‘base results’9)
no uncertainties around the point estimate are provided within the tool. This is because given
the breadth of the model outputs (i.e. a large number of metrics that the tool produces),
incorporating such ‘sensitivity analysis10
’ in each run would significantly prolong the run time.
However, it is critically important to establish the extent to which the model results would be
sensitive to input parameters if they were to change. In order to address this important issue,
this report includes a number of sensitivity analyses carried out by the model developers.
6 A QALY is a year lived in full health, i.e. a year lived without any limitation or disability.
7 NICE considers interventions that cost the NHS less than £20,000 per QALY good value for money
8 Please note that changing this value will delay the calculation running time.
9 Base results are the estimated results using the expected value for each parameter within the model.
10 Sensitivity analysis is a form of analysis which assesses whether the interpretation of the results of an analysis will change if
parameter inputs are varied.

9 Estimating the Return on Investment for interventions and strategies to increase physical activity – Technical Report
3.0 Method
3.1 Economic model
The Physical Activity ROI model is built in Microsoft Excel 2013 and the graphical user interface (GUI)
programmed in Visual Basic 6 software. The tool can be used in all versions of Microsoft Excel from
version 2003. Two economic models, one for adults and one for children, were built to estimate the
cost-effectiveness of each intervention and subsequently, of the package of interventions.11
3.2 Physical activity model for adults
The economic model used in this tool is based on the Markov model developed by Anokye et al
(2012) for the NICE Public Health Intervention Guidance on Physical Activity – Brief advice for adults
in primary care. Figure 1 presents the path the cohort takes once it is exposed (or not) to an
intervention.
Figure 1: Physical activity Markov model structure
The model splits the population into three groups:
Percentage of the population who are inactive, that is doing less than 30 minutes of moderate
intensity physical activity per week.
Percentage of the population who are low active, which is doing between 30 to 149 minutes of
moderate intensity physical activity per week.
Percentage of the population who meet the Department of Health’s (DH) guidelines on
physical activity (150 minutes of moderate intensity physical activity per week).
11
The economic model is adapted from a previous model built for NICE by the Health Economics Research Group (HERG), Economic modelling of brief advice on physical activity for adults in primary care.

10 Estimating the Return on Investment for interventions and strategies to increase physical activity – Technical Report
At year 0 (cycle 1), the starting age at which the cohort is exposed to an intervention is 33 years12
. By
the end of the first cycle, people can sit in one of the three activity states and can remain healthy,
have one of 3 events (non-fatal CHD, non-fatal stroke, type 2 diabetes) or die either from CVD or non-
CVD related causes. The model estimates and discounts costs and benefits associated with each of
the health states for 48 annual cycles.
The effect of the interventions is measured as the change in the percentage of people who become
low active and the percentage who meet the DH guidelines.
Baseline data at local level was drawn from the Local Sport Profile tool published by Sport England.
The data refers to self-reported levels of physical activity collected through the Active People Survey
(2012).
Data on the cost and effect of the interventions was drawn from NICE Guidance and a wider review of
the literature (see Appendix 5 for details)
Health benefits
Physical inactivity is associated with a number of diseases. The model estimates the number of cases
of these diseases that could be prevented if levels of physical activity were increased due to a
package of interventions. Based on the prevented number of disease cases, the model estimates the
impact of the package of interventions in terms of health related quality of life (expressed in Quality
Adjusted Life Years, QALYs13
) and health care costs savings.
The diseases included in the model are:
Chronic heart disease (CHD)
Stroke
Type II diabetes
The probabilities of experiencing these diseases vary with levels of physical activity. Those who
increase their physical activity generally have reduced probabilities of experiencing the diseases,
which results in corresponding improvements in health related quality of life and health care cost
savings.
Productivity benefits
Physical inactivity is assumed to be associated with productivity losses due to morbidity and life years
lost.
Social care benefits - strokes
Physical inactivity is assumed to be associated with increased probability of having a stroke. Stroke
can result in severe disability which may require residential or informal care (at home) provided by the
local authority in a small number of cases
Transport benefits
12
Anokye et al used a starting age of 33 for the Markov model to reflect the evidence on the effectiveness of brief advice. 48 annual cycles were run for the model, resulting in the model ending at age 81. 13
A QALY is a year lived in full health, i.e. a year lived without any limitation or disability.

11 Estimating the Return on Investment for interventions and strategies to increase physical activity – Technical Report
Those who increase their level of physical activity may reduce the number of kilometres (km) they
travel in a car, thus reducing congestion, accidents and greenhouse gases and improving air quality
and noise pollution. Detailed data parameters for the above outlined benefits are provided in Table
A5.4 in Appendix 6.

12 Estimating the Return on Investment for interventions and strategies to increase physical activity – Technical Report
3.3 Physical activity model for children
The model splits the population into two groups:
Percentage of the population who are inactive, that is doing less than 1 hour per day per
week of physical activity.
Percentage of the population who meet recommendations, that is doing more than 1 hour per
day per week of moderate intensity physical activity.
The effect of the interventions is measured as the change in the percentage of children who meet the
recommendations for physical activity.
Baseline data at regional level was drawn from the Physical activity and fitness report published by
the Health and Social Care Information Centre. The data refers to self-reported levels of physical
activity collected through the Health Survey for England (2008).
Data on the cost and effect of the interventions was drawn from NICE Guidance and a wider review of
the literature (see Appendix 5 for details)
Health benefits
Data on the health benefits associated with increased physical activity for children is limited, as not
much is known about the long term effects of a physically active child becoming a physically active
adults, and the subsequent reduction in risk of developing different diseases associated with physical
inactivity. As such, the tool only estimates the QALY gain for achieving the recommended guidelines
of physical activity for one year.
Education benefits
There is some evidence linking physical activity to improved educational outcomes but given that the
evidence is inconsistent, the model does not incorporate these potential benefits.
There are a number of input parameters (e.g. unit cost of disease) which users are not allowed to
change. These are presented in Tables A5.1 to A5.4 in Appendix 6.
The children’s interventions that are included in the tool may not be cost effective due to the
limitations (as outlined above) in estimating the long term effects of physical activity for this
population group. The interventions for children are included in the tool to give users
guidance around the costs and effects of these types of interventions. Users are encouraged
to interpret the results bearing in mind these methodological limitations.

13 Estimating the Return on Investment for interventions and strategies to increase physical activity – Technical Report
3.4 Model outputs
The results of the model are present for two packages of interventions:
The current package. This will typically be used to represent the ‘current scenario’. To that
end, the user must change the allocation of the interventions (from 0%) to the current level of
provision in their local population area.14
The ROI metrics of the current package will then
compare the current package against the Baseline – i.e. the ‘value for money’ of the ‘current
scenario’ compared with ‘no service provision’.
The alternate package. This will be defined by the user by changing the allocation of the
interventions (from the percentages applied in the current package) to reflect the desired
levels of service provision.15
The ROI metrics of the alternate package will then compare:
o The alternate package against the Baseline – i.e. ‘desired scenario’ compared with
‘no service provision’.
o The alternate package against the current package – i.e. ‘desired scenario’
compared with ‘current scenario’.
The baseline serves as the first line comparator for any intervention package. However, users can run
the model for any two packages of interventions, and compare results between the two packages.
The results are organised as follows (see Appendix 3 for the definition of the metrics below).
Interventions overview window
Interventions are presented under three separate menus:
o Individual-level adult interventions
o Population-level adult interventions
o Individual-level child interventions
Allocation, effectiveness and unit costs are displayed for each intervention within each group.
Total cost of ALL interventions in the current package and the alternate package.
Number of people increasing their level of physical activity as a result of ALL interventions in
the current package and the alternate package.
Exercise referral was not recommended in NICE guidance PH2. NICE is currently updating
guidance on exercise referral schemes and the results should be available in September 2014.
We have excluded exercise referral in the tool based on the recommendation. However, users
can use the custom intervention function16
in the tool to estimate the ROI of their exercise
referral schemes.
14
As mentioned previously, users can also change the effect and cost of the interventions. 15
Users can also change the cost and effect of the interventions at this stage. However, note that these changes will only apply the alternate package (and the cost and effect for the current package will remain as previously defined). 16
When creating a custom intervention, effect sizes used must be input using the same definitions of effectiveness as the other interventions which is the % increase in Low active from inactive (30-149 minutes of physical activity per week) or % increase in meeting DH guidelines (greater than 150 minutes of physical activity per week) from inactive

14 Estimating the Return on Investment for interventions and strategies to increase physical activity – Technical Report
Top level results overview
Once run the model gives an overview of the results from a high level for the packages. The metrics
shown are as follows:
Breakdown of Costs
o This gives the overview of the potential cost savings to be generated from the
package in each cost domain, productivity, health and transport.
o The comparisons given are the current package against Baseline, The alternate
package against Baseline, and The current package vs. the alternate package.
Total Costs
o This gives the overview of the total cost savings against the total cost of the
interventions.
o The comparisons given are the current package against Baseline, The alternate
package against Baseline, and The current package vs. the alternate package.
Return on investment metrics
The return on investment metrics give the key analysis of the tool. They are split into four categories,
and each category is further split into the key perspectives of interest to commissioners:
Benefit-Cost Ratio
o All cost savings and value of health gains included
o All cost savings included
o Only health care costs and value of health gains included
o Only health care cost savings included
o Only social care cost savings included
o Only productivity cost savings included
o Only transport cost savings included
Net Present Value
o All cost savings and the value of health gains included
o All cost savings included
o Only health care costs and value of health gains included
o Only health care cost savings included
o Only social care cost savings included
o Only productivity cost savings included
o Only transport cost savings included
Avoidable Burden of Disease (number of QALYs)
ICER
o All cost savings included.
o Only health care cost savings included.
3.5 Key assumptions
The model relies on a number of assumptions to estimate the economic impact of interventions to
increase physical activity. These assumptions are described below.
General modelling assumptions
The economic model is adapted from a previous model built for NICE by the Health Economics
Research Group (HERG), Economic modelling of brief advice on physical activity for adults in primary
care.

15 Estimating the Return on Investment for interventions and strategies to increase physical activity – Technical Report
Costs and benefits are both discounted at 3.5%, in line with NICE Methods for the development of
public health guidance second edition (2009)17
. Costs are presented in £2012/13 prices. Where
necessary, these have been updated using the HM Treasury GDP Deflators (2013). Sensitivity
analysis has been done on the NICE Methods for development of NICE public health guidance18
rate
of 1.5% for both costs and benefits.
Costs are presented in £2012/13 prices. Where necessary, these have been updated using the Office
of National Statistics GDP Deflators (2013).
Physical activity data
Physical activity data is self-reported and no adjustment to these data has been made. However we
acknowledge that research is currently being undertaken to calculate a multiplier that will allow
adjustment of self-reported levels of physical activity in order to estimate the true prevalence in the
population.
Calculation of morbidity and mortality
The user assigns a proportion of the population to be allocated to different interventions that make up
the package. Based on the effectiveness of the interventions in the package, after one year a
proportion of the population will:
Stay inactive
Become low active
Meet DH recommendations for physical activity
Those who increase their activity will have reduced probabilities of developing CHD, stroke and type II
diabetes relative to those who are inactive. This impact is assumed to last for ten years19
, at which
point the probabilities of developing the diseases becomes the same as for inactive person. This
assumption was based on the follow up periods used in the cohort studies for which the relative risks
of the diseases measured in the model produced by Anokye et al (2012) for the NICE guidance,
PH44. As such, the same time period has been applied in our model as it uses the same relative
risks. Please see Table A5.2 and A5.3 in Appendix 6 for baseline and post intervention relative risks
of disease.
Based on the above outlined probabilities, the model estimates the numbers of people who are
healthy, have an event of CHD and stroke and the number of people who develop type II diabetes for
each activity level per year over a 48 year (lifetime) period.
Calculation of health care costs
As previously mentioned, the model estimates the number of people who move to the various health
states and the number of deaths per year. Based on this, annual treatment costs per person
associated with the health states in the model are taken from the National Clinical Guideline Centre
(2011) for each disease and applied to the cohort in order to calculate the total healthcare costs per
year. The costs are made up of the following:
1st CHD event cost
17
National Institute of Health and Clinical Evidence (2009) Methods for the development of NICE public health guidance (second edition) 18
NICE (2012) Methods for development of NICE public health guidance (third edition) Available at: http://publications.nice.org.uk/methods-for-the-development-of-nice-public-health-guidance-third-edition-pmg4 Last accessed: 25/11/2013

16 Estimating the Return on Investment for interventions and strategies to increase physical activity – Technical Report
Post CHD event cost
1st stroke event cost
Post stroke event cost
Annual treatment cost for type II diabetes
Please refer to Table A5.4 in Appendix 6 for more details on the unit costs and sources of data.
Calculation of productivity cost savings
The model estimates the number of inactive people who become either low active or who meet DH
recommendations and of those the number that are employed. It is estimated that an employed
person who increases their activity will avoid 5.23 days of absenteeism per year for ten years. The
total number of days of avoided absence associated with the intervention is thus calculated by
multiplying the number of employed people who have increased their activity by 5.23 days per year
for 10 years.
This figure is then multiplied by the average daily wage rate to give the total productivity cost savings
associated with the intervention. Please refer to Table A5.4 in Appendix 6 for more details of unit
costs and sources of data.
As a result of the number of days of absenteeism associated with physical inactivity and the value
attached to these days, productivity cost savings are the biggest driver of the total cost savings
associated with a package of interventions.
Calculation of social care costs - stroke
The model estimates the number of people who will experience non-fatal events of stroke for all levels
of physical activity. It is estimated that approximately 4% of these people will require informal care
provided by the local authority at a cost of £1,656 per year. Please refer to Table A5.4 in Appendix 6
for more details and sources of data.
Calculation of transport cost savings
It is assumed that if a person increases their physical activity, they reduce the amount of kilometres
(km) they travel in a car per year as result. Data on average annual distance travelled in a car was
taken from the National Travel Survey (2011).
The percentage reduction in the annual distance travelled by car was assumed to 0.05% for people
who are low active and 0.1% for people who meet recommendations for physical activity. These
figures were based on expert opinion, as it has been suggested that if people increase their physical
activity, the amount they travel in a car may not reduce by much as they may use the car to get to
recreation parks or gyms to exercise, but replace small car journeys with walking and cycling.
Transport cost savings are made of the following components:
Congestion
Infrastructure
Accidents
Local air quality
Noise
Greenhouse gases
Indirect taxation

17 Estimating the Return on Investment for interventions and strategies to increase physical activity – Technical Report
The reduction in the number of km travelled in a car per year is then multiplied by transport cost
saving per km to give total transport cost savings for the selected intervention. Please refer to Table
A5.4 in Appendix 6 for more details and sources of data.
3.6 Key limitations
There are a number of limitations for specific elements of the model that the user should be aware of
when making decisions based on its outputs. These have been highlighted in previous sections of the
report. The key limitations that need to be considered when viewing the model as a whole are
described below:
Benefits are calculated on the number of people who increase their physical activity levels
above the low activity and recommended levels of activity thresholds. The model is unable to
calculate benefits for people who achieve marginal increases in physical activity.
Due to the scope of the tool, this version of the model does not include population subgroups
by sex, age, ethnicity and socioeconomic factors.
For any given local area, there will be some level of infrastructure already available to help
increase physical activity. However robust estimates for this parameter were limited and
therefore the model is unable to provide a baseline analysis of infrastructure at a local level
The children’s interventions that are included in the tool may not be cost effective due to the
short timescale over which the impact of the package of interventions is being assessed, and
also because long term data on the health and educational benefits associated with increased
physical activity is limited.
3.7 Sensitivity analysis
The tool is intended as a simple decision aid for local decision makers who use their own local data to
estimate the ROI for their selected package of interventions. As such, only point estimates (i.e. the
average value often called the “base results”20
) of the estimated impact can be obtained, i.e. no
uncertainties around the point estimate are provided in the tool. This is because given the breadth of
the outputs (i.e. a large number of metrics that the tool produces), incorporating such ‘sensitivity
analysis’21
in each run would undermine the simplicity of the tool by prolonging the run time
significantly. The tool is intended to produce the results in real time.
However, it is critically important to establish the extent to which the model results would be sensitive
to input parameters if they were to change (say, if users have improved estimates for inactivity levels
or costs of interventions in their local area). In order to address this important issue, a sensitivity
analysis was carried out by the model developers. The results are described below.
The intention of this analysis is to show that it is reasonable for users to use the estimates of the tool
outputs, even though there may be uncertainty around key input parameters. The sensitivity of the
model outputs are assessed relating to the following key parameters:
Discount rate
20
Base results are the estimated results using the expected value for each parameter within the model. 21
Sensitivity analysis is a form of analysis which assesses whether the interpretation of the results of an analysis will change if parameter inputs are varied.

18 Estimating the Return on Investment for interventions and strategies to increase physical activity – Technical Report
Intervention cost and effectiveness
This analysis is based on East Staffordshire Local Authority. East Staffordshire has an adult
population of 92,096 of which 48.67% (44.823) are inactive. This LA has been selected as it is
representative of an average LA in terms of its inactivity levels. The average adult population across
English LAs is 171,839 (range 6,799 - 1.2 million), average inactivity prevalence is 48.7% (range
39.0% - 62.6%). This was assessed by looking at the variation in these factors across all local
authorities using ONS population statistics (population) and the Active People Survey (inactivity
prevalence).
The sensitivity analysis focused on the incremental cost effectiveness ratio (ICER) for health care
costs only22
over different time horizons. If the user is interested in total costs, the required effect
sizes of the interventions could be lower and still be cost effective due to the additional benefits
included in the total ICER calculation.
Base results
The base results (i.e. the estimated results using the expected value for each parameter within the
model) are shown in Table 1. For a willingness to pay of £20,000 per QALY gained23
in East
Staffordshire:
The current package vs. the baseline can be considered cost-effective
The alternate package vs. the baseline can be considered cost-effective
The alternate package vs. the current package can be considered cost-effective and in the
long run it is dominant24
.
Table 1: Base results for East Staffordshire – Incremental cost effectiveness ratio (health care
costs only) using 3.5% discount rate
Intervention package Time horizon
2 years 5 years 10 years Lifetime
The current package vs.
Baseline £1,764 £1,687 £1,493
The current package
is dominant
The alternate package vs.
Baseline £1,438 £1,363 £1,176
The alternate
package is dominant
The alternate package vs.
The current package £1,392 £1,317 £1,131
The alternate
package is dominant
Impact of discount rate
In economic evaluation, future costs and benefits are discounted to reflect time preference for benefits
-i.e. the greater weighting placed on costs and benefits occurring in the present rather than the future.
22
This particular metric for the sensitivity analysis was chosen as this includes both resource use (incremental costs, i.e. differences in costs between the two intervention packages) and the resulting health outcomes (incremental QALYs, i.e. differences in QALYs between the two intervention packages). Therefore, if the results on this metric are not found sensitive to the changes in input parameters, it is unlikely that other metrics would be sensitive either. 23
The decision maker’s willingness to pay for a QALY gained is usually referred to the ‘threshold’. Currently, the threshold for the NHS used by NICE for public health interventions is £20,000/QALY gained. 24
If the package is both less costly and more beneficial than the comparator it is dominant and therefore cost saving. Please refer to Appendix 2 for further technical details.

19 Estimating the Return on Investment for interventions and strategies to increase physical activity – Technical Report
To allow for this time preference, future costs and benefits are discounted at a specific rate relative to
the number of years in the future they occur. The rate used to discount is called the discount rate.
In the base case analysis, a 3.5% rate was used for costs and benefits. NICE guidelines on economic
evaluations of public health interventions require that the analysis needs to be re-done for 1.5% rate
for QALYs to ascertain the level of uncertainty posed by discount rates (NICE 2012). Therefore, one
way sensitivity analysis was conducted adopting a 1.5% rate for future benefits. The impact of this on
the results is minimal. Where a package of interventions is not dominant (i.e. when the package is not
less costly and does not produce more QALYs that the comparator), the incremental cost per QALY
gained was reduced by a modest amount (e.g. from £1,687 to £1,648 for the current package vs.
Baseline on a 5-year time horizon). More importantly, the interpretation of whether a package was
cost-effective25
did not alter in any comparison.
Table 2: Results for East Staffordshire – Incremental cost per QALY gained (health care costs
only) using 1.5% discount rate
Intervention package Time horizon
2 years 5 years 10 years Lifetime
The current package vs.
Baseline £1,730 £1,648 £1,427
The current package
is dominant
The alternate package vs.
Baseline £1,410 £1,330 £1,117
The alternate
package is dominant
The alternate package vs.
The current package £1,365 £1,285 £1,073
The alternate
package is dominant
Impact of intervention’s costs and effectiveness
A two way analysis was used to explore the impact of interventions’ cost and effectiveness on the
cost-effectiveness of the package as a whole. Two threshold values for the ICER (£20,000 and
£30,000) and effectiveness rates ranging from 1% to 55% were used. For each threshold value and
effectiveness rate, we estimated the maximum cost per person that can be paid for the intervention
for it to remain cost effective at the given threshold. The results are presented in Figure 2. For
example, for an effectiveness rate of 9% (equivalent to brief advice), an intervention can cost up to
£306 per person and still be cost effective based on a threshold of £20,000 per QALY.
25
According to NICE, an intervention is cost-effective if the incremental cost per QALY gained is less than or equal to £20,000 to £30,000.

20 Estimating the Return on Investment for interventions and strategies to increase physical activity – Technical Report
Figure 2: Threshold costs per person of physical activity interventions by effect
Conclusion from the sensitivity analysis
The above sensitivity analysis suggests that the results with respect to the cost-effectiveness of
intervention package as a whole are fairly robust. The discount rate has minimal impact on the
results and it is unlikely that the conclusion of the analysis changes due to changes in the discount
rate. Analysis around the cost and effect of an intervention indicate that even with a low effectiveness
rate and a higher cost per person, an intervention can still fall within the ICER threshold for cost-
effectiveness. Therefore any local variations around these two parameters are unlikely to change the
results of the analysis.
£170.21 £340.42
£510.62 £680.83
£851.04 £1,021.25
£1,191.45 £1,361.66
£1,531.87 £1,702.08 £1,872.29
£0.00
£500.00
£1,000.00
£1,500.00
£2,000.00
£2,500.00
£3,000.00
5% 10% 15% 20% 25% 30% 35% 40% 45% 50% 55%
Co
st p
er p
erso
n f
or
ph
ysic
al a
ctiv
ity
inte
rven
tio
n
Effectiveness with physical activity intervention
£20,000 £30,000

21 Estimating the Return on Investment for interventions and strategies to increase physical activity – Technical Report
4.0 Appendices
4.1 Appendix 1: References
Anokye, N. K., Lord, J., & Fox-Rushby, J. (2014). Is brief advice in primary care a cost-effective way
to promote physical activity?. British journal of sports medicine, 48(3), 202-206.
Araújo-Soares, V., McIntyre, T., MacLennan, G., & Sniehotta, F. F. (2009). Development and
exploratory cluster-randomised opportunistic trial of a theory-based intervention to enhance physical
activity among adolescents. Psychology and Health, 24(7), 805-822.
Baker G., Gray S.R., Wright A., Fitzsimons C., Nimmo M., Lowry R. (2008). The effect of a
pedometer-based community walking intervention "Walking for Wellbeing in the West" on physical
activity levels and health outcomes: a 12-week randomised controlled trial. International Journal of
Behavioral Nutrition and Physical Activity 2008; 5
Department of Health (2008) 'Health Survey for England', NHS: London
Department for Transport (2011) ‘National Travel Survey’. London
NICE (2006) Four Commonly used methods to increase physical activity. Public health guidance 2
NICE (2008) Physical activity and the environment. Public health guidance 8
NICE (2009) Promoting physical activity for children and young people. Public health guidance 17
NICE (2013) Physical activity: brief advice for adults in primary care. Public health guidance 44
NICE (2012) Walking and cycling. Public health guidance 41
Office for National Statistics, http://www.ons.gov.uk/ons/guide-method/geography/beginner-s-
guide/administrative/england/government-office-regions/index.html, accessed on 30/07/2013
Pokhrel, S., Owen, L., Lester-George, A., Coyle, K., Coyle D., Trapero-Bertran M. (2012). Tobacco
Control Return on Investment Tool. London: National Institute for Health and Clinical Excellence.
Sport England (2012) ‘Active People Survey', London

22 Estimating the Return on Investment for interventions and strategies to increase physical activity – Technical Report
4.2 Appendix 2: Glossary
Benefit-Cost Ratio– an indicator used in the formal discipline of cost-benefit analysis which attempts
to summarise the overall value for money of a project by dividing the benefit by the cost.
Burden of Disease – the impact of a health problem in an area measured by financial cost, mortality,
morbidity, or other indicators. It is often quantified in terms of QALYs or DALYs, which combine the
burden due to both death and morbidity into one index.
Disability Adjusted Life Year (DALY) – Disability adjusted life year is a measure of overall disease
burden expressed as the number of years lost due to ill-health disability or early death
Discount Rate – The rate, per year, at which future values are diminished to make them comparable
to values in the present
Health Inequalities – inequalities in respect of life expectancy or general state of health which are
wholly or partly a result of differences in respect of general health determinants.
Incremental Cost-Effectiveness Ratio (ICER) – difference in the expected cost of two interventions,
divided by the difference in the expected effect produced by the two interventions.
Net Present Value (NPV) – The present value of an investment's future net benefits minus the initial
investment.
Productivity Gains – The impact of an intervention on the productivity / income of those receiving the
intervention.
Quality Adjusted Life Year (QALY) – a measure of disease burden, including both the quality and
the quantity of life lived. It is used in assessing the value for money of health interventions.
Return on Investment (ROI) – A general term encompassing the techniques for comparing the costs
and benefits generated by an investment.

23 Estimating the Return on Investment for interventions and strategies to increase physical activity – Technical Report
4.3 Appendix 3: Definitions of the ROI metrics in the tool26
Metric Description
Avoidable burden of disease (QALYs) The product of the number of QALYs gained per person and the population benefiting from the package. This provides an indication of the scale of the health problem that can be resolved by the package.
Benefit-Cost Ratio (including all cost savings and value of health gains)
The sum of all cost savings and value of health gains (monetary value of QALY multiplied by the number of QALYs gained) divided by the cost of the package. A value greater than 1 indicates that the benefits of the package exceed its costs.
Benefit-Cost Ratio (including all cost savings)
The sum of all cost savings divided by the cost of the package. A value greater than 1 indicates that the benefits of the package exceed its costs.
Benefit-Cost Ratio (including only health care cost savings and value of health gains)
The health care cost savings and value of health gains (monetary value of QALY multiplied by the number of QALYs gained) divided by the cost of the package. A value greater than 1 indicates that the benefits of the package exceed its costs.
Benefit-Cost Ratio (including only health care cost savings)
The health care cost savings divided by the cost of the package. A value greater than 1 indicates that the benefits of the package exceed its costs.
Benefit-Cost Ratio (including only social care cost savings)
The social care cost savings divided by the cost of the package. A value greater than 1 indicates that the benefits of the package exceed its costs.
Benefit-Cost Ratio (including only productivity cost savings)
The productivity cost savings divided by the cost of the package. A value greater than 1 indicates that the benefits of the package exceed its costs.
Benefit-Cost Ratio (including only transport benefits)
The transport benefits divided by the cost of the package. A value greater than 1 indicates that the benefits of the package exceed its costs.
ICER (including all cost savings savings) The incremental cost of the package minus the sum of all cost savings divided by the number of QALYs gained. The ICER can be either:
A positive number.
Dominant: if cost of the package minus the sum of all cost savings<0 and QALYs gained>0.
Dominated: if cost of the package minus the sum of all cost savings>0 and QALYs gained<0.
Dominated if cost of the package minus the sum of all cost savings<0, QALYs gained<0, and value of QALYs<cost of the package minus the sum of all cost saving.
26
The benefits and costs are summed for the time horizon selected by the user and annual discounts of 3.5% are applied in keeping with NICE’s methods and HM Treasury ‘Green Book’ guide (2011).

24 Estimating the Return on Investment for interventions and strategies to increase physical activity – Technical Report
Metric Description
ICER (including only health care cost savings)
The incremental cost of the package minus the health care cost savings divided by the number of QALYs gained. The ICER can be either:
A positive number.
Dominant: if cost of the package minus health care cost savings<0 and QALYs gained>0.
Dominated: if cost of the package minus health care cost savings>0 and QALYs gained<0.
Dominated if cost of the package minus the health care cost savings<0, QALYs gained<0, and value of QALYs<cost of the package minus the sum of all cost saving.
NPV (including all cost savings and value of health gains)
The sum of all cost savings and value of health gains (monetary value of QALY multiplied by the number of QALYs gained) minus the cost of the package. A positive value indicates that the value of the benefits of the package exceed its costs. .
NPV (including all cost savings) The sum of all cost savings minus the cost of the package. A positive value indicates that the value of the benefits of the package exceed its costs. .
NPV (including only health care cost savings and value of health gains)
The health care cost savings and value of health gains (monetary value of QALY multiplied by the number of QALYs gained) minus the cost of the package. A positive value indicates that the value of the benefits of the package exceed its costs. .
NPV (including only health care cost savings)
The health care cost savings minus the cost of the package. A positive value indicates that the value of the benefits of the package exceed its costs. .
NPV (including only social care cost savings)
The social care cost savings minus the cost of the package. A positive value indicates that the value of the benefits of the package exceed its costs. .
NPV (including only productivity cost savings)
The productivity cost savings minus the cost of the package. A positive value indicates that the value of the benefits of the package exceed its costs. .
NPV (including only transport benefits) The transport benefits minus the cost of the package. A positive value indicates that the value of the benefits of the package exceed its costs. .

25 Estimating the Return on Investment for interventions and strategies to increase physical activity – Technical Report
4.4 Appendix 4: Physical activity interventions included in the tool
Table A3.1 Physical activity interventions (adults) included in the tool
Intervention
type Intervention Description
% increase in
people who
become low
active
% increase in
people who meet
recommendations
Cost per
person Source
One to one Brief advice
Verbal advice, discussion, negotiation or
encouragement with or without written or
other support or follow up. It could be
opportunistic and can take between 1-20
minutes.
0% 8.7% £9.92 NICE PH44
(2012)
One to one Transport advice
Travel Smart 'Individualised travel
marketing'
(ITM) which highlights travel choices
'people may not know they have' by
providing locally
relevant information and support to
households
4.1% 7.6% £10.87
Calculation
based on
evidence
from NICE
PH41 (2012)
One to one Pedometer Physical activity consultation plus 12
week pedometer walking programme 0% 54% £52.50
Baker et al
(2008)
Group Walking
programmes
Health walks
- organised led walking groups
- telephone calls (1 call from co-ordinator
and then 3 follow up calls)
- "Walk pack" : information on health
walks within local area with info on public
transport, car parks and creche facilities.
9.2% 4.3% £47.42
Calculation
based on
evidence
from NICE
PH41 (2012)

26 Estimating the Return on Investment for interventions and strategies to increase physical activity – Technical Report
Intervention
type Intervention Description
% increase in
people who
become low
active
% increase in
people who meet
recommendations
Cost per
person Source
Community Information/ Media
campaigns
Project STRIDE
- email containing tips on how to achieve
30 minutes of moderate physical activity
per day, 5 days a week
-Regular email surveys regarding level of
physical activity, motivational readiness
and self-efficacy sent after the first 4
weeks, then monthly for 3 months and bi-
monthly for 6 months
- Participants mail in physical activity logs
and brief surveys each month for 12
months. The return of each survey is
reinforced with a monetary incentive ($10
in study). - Feedback forms based on
survey results are generated containing
theory based counselling messages which
can be mailed to participants
1.6% 3% £23.06 Sevick et al
(2007)
Environment
Environmental
cycling
programmes
Cycling demonstration town
-Investment in towns to promote cycling
-Infrastructure improvements such as
building cycle paths
-Education and marketing
6.8% 3.1% £30.0027
Calculation
based on
evidence
from NICE
PH41 (2012)
27
Cost per person is based on an £18 million investment into 6 cycling demonstration towns, covering a total population of 600,000 people of 3 years. In the original economic evaluation by Cope et al, an assumption was made that costs would only be incurred in the first 3 years. Therefore no calculation was made for capital maintenance costs.

27 Estimating the Return on Investment for interventions and strategies to increase physical activity – Technical Report
Intervention
type Intervention Description
% increase in
people who
become low
active
% increase in
people who meet
recommendations
Cost per
person Source
Environment
Environmental
walking & cycling
programmes
Sustainable travel towns
-Investment in walking and cycling
infrastructure
-Personalised travel planning
-Education and marketing
4.1% 7.5% £46.9328
Calculation
based on
evidence
from NICE
PH41 (2012)
Environment Urban planning Introduction of walking cycling routes/
paths 7.1% 15.4% £50.61
29
Calculation
based on
evidence
from NICE
PH8 (2008)
Workplace Health information
& counselling
Physical activity counselling
- One 30 minute health promotion
consultation;
- One 30 minute follow-up telephone call
consultation conducted by an
occupational nurse.
0% 36.6% £64.15 NICE PH13
(2008)
Workplace Walking
programmes
Physical activity walking programme -
Occupational nurses providing employees
with programme services and resources
for the promotion of walking.
0% 13% £63.03 NICE PH13
(2008)
28
Cost per person is based on the total of scheme costs over 4 years (discounted and adjusted for market price) for a population of 316,000 people. No calculation was made for capital maintenance costs. 29
Average cost per user calculated based on the capital and maintenance costs of 4 trails ranging between 3.1-4.6 miles with between 2-3 bridges over a 30 year period

28 Estimating the Return on Investment for interventions and strategies to increase physical activity – Technical Report
Intervention
type Intervention Description
% increase in
people who
become low
active
% increase in
people who meet
recommendations
Cost per
person Source
Workplace Multicomponent
Physical activity counselling and fitness
tests
- One 11 hr training session per nurse;
- One 30 minute physical activity
counselling session;
- Two 30 minute fitness tests performed
by a Physiotherapist
- One 30 minute physical activity follow-up
counselling session.
0% 21% £153.28 NICE PH13
(2008)
29 Estimating the Return on Investment for interventions and strategies to increase physical activity – Technical Report
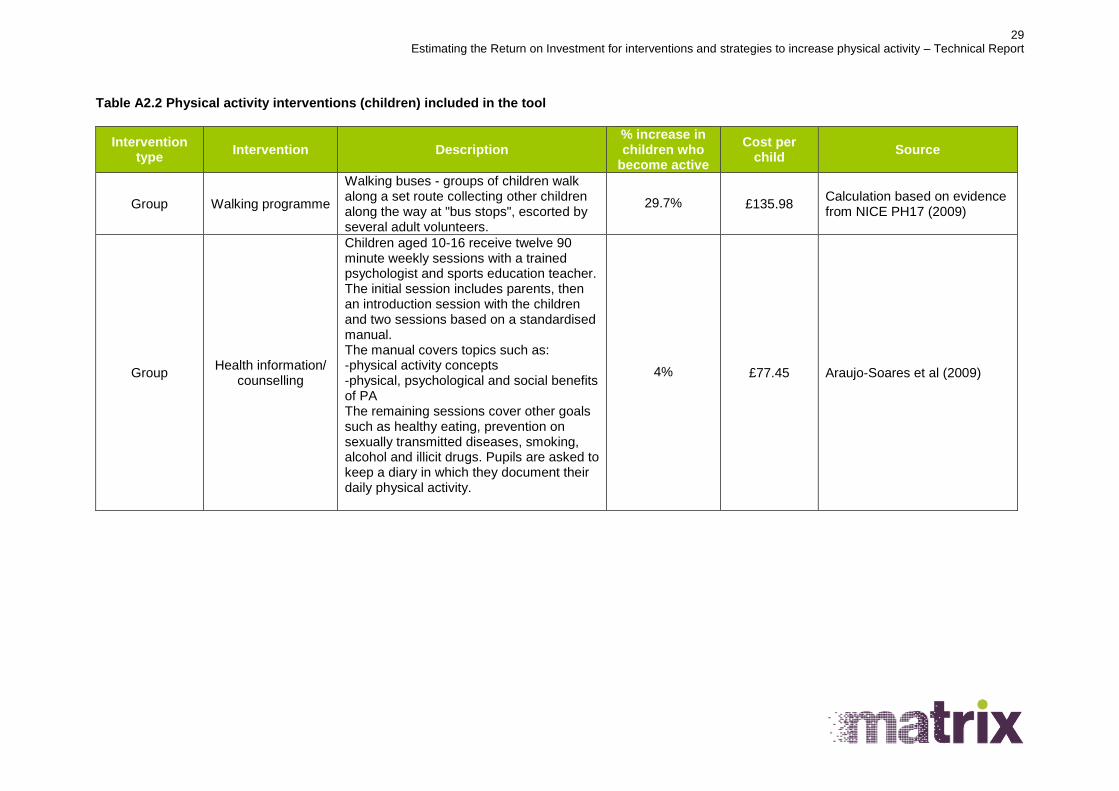
Table A2.2 Physical activity interventions (children) included in the tool
Intervention type
Intervention Description % increase in children who
become active
Cost per child
Source
Group Walking programme
Walking buses - groups of children walk along a set route collecting other children along the way at "bus stops", escorted by several adult volunteers.
29.7% £135.98 Calculation based on evidence from NICE PH17 (2009)
Group Health information/
counselling
Children aged 10-16 receive twelve 90 minute weekly sessions with a trained psychologist and sports education teacher. The initial session includes parents, then an introduction session with the children and two sessions based on a standardised manual. The manual covers topics such as: -physical activity concepts -physical, psychological and social benefits of PA The remaining sessions cover other goals such as healthy eating, prevention on sexually transmitted diseases, smoking, alcohol and illicit drugs. Pupils are asked to keep a diary in which they document their daily physical activity.
4% £77.45 Araujo-Soares et al (2009)

30 Estimating the Return on Investment for interventions and strategies to increase physical activity – Technical Report
4.5 Appendix 5: Literature review
The literature review was developed in consultation with NICE. The objectives of the review were to:
Identify any updates or new interventions within the areas covered by NICE guidance for
increasing physical activity since they were published.
Identify any new interventions for increasing physical activity outside the areas covered by
NICE guidance.
Search strategy
The following databases were used to implement the search strategy:
Medline
Embase
PsycINFO
HMIC
Global health
Cochrane library
Cochrane CENTRAL
Web of Science
EPPI centre
DoPHER
TRID
ERIC
Planex
Article First
Various search strategies were developed for the different databases that were searched. Below is an
example of one of the strategies that was used in Medline.
1. (sport$3 or exertion$1 or walk$3 or bicycl$3 or bike$1 or biking or cyclist$ or (exercis$3 adj5
aerobic$1) or rollerblading or rollerskating or skat$ or athletics or baseball or basketball or boxing or
football$ or soccer or golf$ or gymnastics or aerobics or recreation or playground$ or "martial arts" or
hockey or racquet$ or swimm$ or volleyball or runn$ or jog$ or yoga or pilates or weightlifting or
wrestling or tennis or gardening or recreation$1 or dancing or stairs or (stair$ adj2 climb$)).tw.
2. exp Physical Exertion/ or Exercise/ or Physical Fitness/ or exp "Physical Education and Training"/
or exp Dancing/ or exp Sports/ or exp Yoga/ or Exercise Therapy/ or exp Fitness Centers/ or
Recreation/ or "Play and Playthings"/ or Gardening/
3. (physical adj5 (fit$4 or train$3 or activ$3 or endur$4)).tw.
4. (exercis$3 adj5 (fit$4 or train$3 or activ$3 or endur$4)).tw.
5. (leisure adj5 (centre$1 or center$1 or facilit$)).tw.
6. (fitness adj5 (centre$1 or center$1 or facilit$)).tw.
7. or/1-6

31 Estimating the Return on Investment for interventions and strategies to increase physical activity – Technical Report
8. exp Behavior/ or Motivation/ or Health Knowledge, Attitudes, Practice/
9. ((lifestyle or "life style" or brief) adj2 (change$ or changing or modification$ or modify or modifying
or therapy or therapies or program$ or intervention$)).tw.
10. ((promot$ or uptak$ or encourag$ or increas$ or start$ or adher$) adj5 gym$).tw.
11. ((promot$ or uptak$ or encourag$ or increas$ or start$ or adher$) adj5 physical activit$).tw.
12. ((promot$ or uptak$ or encourag$ or increas$ or start$ or adher$) adj5 (circuits or aqua$)).tw.
13. ((promot$ or uptak$ or encourag$ or increas$ or start$ or adher$) adj5 exercis$).tw.
14. ((promot$ or uptak$ or encourag$ or increas$ or start$ or adher$) adj5 (keep fit or fitness class$
or yoga)).tw.
15. ((decreas$ or reduc$ or discourag$) adj5 (sedentary or deskbound)).tw.
16. (facilitate$ or uptake or "take up" or increase$ or impact$ or effect$ or improve$ or enhance$ or
encourage$ or support$ or promot$ or optimiz$ or optimis$ or adher$ or access$ or motivate$ or
satisfaction or compliance or comply or complie$ or availabl$ or provision or incentive$ or start or
attend or utilis$ or utiliz$).ti.
17. or/8-16
18. ("rapid evidence" adj3 (assess$ or apprais$)).ti,ab.
19. ((Systematic$ or synthes$) adj3 (Research or evaluation$ or finding$ or thematic$ or report or
descriptive or explanatory or narrative or meta$ or review$ or data or literature or studies or evidence
or map or quantitative or study or studies or paper or impact or impacts or effect$ or
compar$)).ti,ab,sh.
20. ("Meta regression" or "meta synth$" or "meta-synth$" or "meta analy$" or "metaanaly$" or "meta-
analy$" or "metanaly$" or "Metaregression" or "Meta-regression" or "Methodologic$ overview" or
"pool$ analys$" or "pool$ data" or "Quantitative$ overview" or "research integration").ti,ab,sh.
21. (review adj3 (effectiveness or effects or systemat$ or synth$ or integrat$ or map$ or
methodologic$ or quantitative or evidence or literature)).ti,ab,sh.
22. (systematic review or meta-analysis).pt.
23. or/18-22
24. Animals/ not (Humans/ and Animals/)
25. (7 and 17 and 23) not 24
26. limit 25 to yr="2006 -Current"
27. (policy or policies or recommendation$ or strategy or strategies).ti.
28. exp Public policy/ or exp Policy making/
29. 27 or 28
30. 7 and 23 and 29

32 Estimating the Return on Investment for interventions and strategies to increase physical activity – Technical Report
31. limit 30 to yr="2006 -Current"
32. 26 or 31
Manual searches of the following websites were undertaken to identify grey literature not available
through systematic database search:
Active Living by Design (http://www.activelivingbydesign.org/)
Association of Public Health Observatories (http://www.apho.org.uk/apho/)
BHF Physical Activity + Health (http://www.bhfactive.org.uk/home/index.html)
British Heart Foundation (http://www.bhf.org.uk)
Centers for Disease Control and Prevention (http://www.cdc.gov/index.htm)
Commission for Architecture and the Built Environment
(http://www.cabe.org.uk/default.aspx?contentitemid=73
The Countryside Agency (http://www.countryside.gov.uk/LAR/Recreation/index.asp)
Defra (http://www.defra.gov.uk/)
Department for Transport (http://www.dft.gov.uk)
Environment Agency (http://www.environment-agency.gov.uk/)
ERPHO (http://www.erpho.org.uk/viewResource.aspx?id=21164)
Forestry Commission (http://www.forestry.gov.uk/)
GetWalking KeepWalking (http://www.getwalking.org)
Global Advocacy for Physical Activity (http://www.globalpa.org.uk/)
Health England (http://www.healthengland.org);
National Centre for Social Research (http://www.natcen.ac.uk)
National Obesity Observatory (http://www.noo.org.uk/data_sources/physical_activity)
NHS Evidence (www.evidence.nhs.uk);
OPENspace (http://www.openspace.eca.ac.uk/)
PAHA (http://www.paha.org.uk/Feature/scottish-physical-activity-data-sources)
Scottish Government (http://www.scotland.gov.uk);
SEPHO (http://www.sepho.org.uk/topics/physActivity.aspx)
Space Syntax (http://www.spacesyntax.com/)
SPARColl (http://www.sparcoll.org.uk/)
Sport England (http://www.sportengland.org);
Stockholm Environment Institute at York (http://www.york.ac.uk/inst/sei/welcome.html)
Sustrans (http://www.sustrans.org.uk/)
The Cochrane Library (http://www.thecochranelibrary.com);
Transport 2000 (http://www.transport2000.org.uk/)
World Health Organization (http://www.euro.who.int);
Transport Research Laboratory (www.trl.co.uk/)
Institute for Road Safety Research (http://www.swov.nl/index_uk.htm)
Screening
From databases that were searched and the grey literature, 15,650 abstracts were identified to be
screened. Table A4.1 provides the exclusion and inclusion criteria that was used to screen papers
identified in the search. To ensure consistency, Matrix reviewed the inclusion/exclusion criteria utilised
in the previous NICE guidance reviews’. The criteria listed below are consistent across the reviews
and provide a broad set of criteria.

33 Estimating the Return on Investment for interventions and strategies to increase physical activity – Technical Report
Table A4.1 Exclusion/inclusion checklist for screening papers
Criteria Exclusion/ Inclusion
code Notes
C1 English language paper If not 1_EX.LANG Only studies published in English will be
included.
C2 Date
To be defined
If not 2_EX.DATE
C3
Country
OECD countries
f not
3_EX.COUNTRY
OECD countries: Australia; Austria;
Belgium; Canada; Chile; Czech
Republic; Denmark; Estonia; Finland;
France; Germany; Greece; Hungary;
Iceland; Ireland; Israel; Italy; Japan;
Korea; Luxembourg; Mexico;
Netherlands, Norway; New Zealand;
Poland; Portugal; Slovak Republic;
Slovenia; Spain; Sweden; Switzerland;
Turkey; United Kingdom, United States.
C4
Population
Papers relating to the general
adult or child population
If not
4_EX.POP
For example interventions aimed at
people with chronic diseases or specific
groups such as athletes or specific
ethnic groups should be excluded
C5
Topic
Papers relating to physical
activity
If not
5_EX.TOPIC
C6
Intervention
Papers relating to interventions
that increase physical activity
If not
6_EX.INTERVENTION
For example physical activity
programmes or environmental
interventions
C7
Setting
Interventions that were carried
out in:
Primary, secondary or
tertiary NHS setting
Any local authority, private,
community or voluntary
social service
Leisure setting
If not
7_EX.SETTING

34 Estimating the Return on Investment for interventions and strategies to increase physical activity – Technical Report
Criteria Exclusion/ Inclusion
code Notes
C 8
Quantitative outcomes
Percentage of participants
who became active (>= 150
min of moderate intensity
activity per week).
Mean increase in the
number of minutes of
exercise per week
If not
8_EX.QUANT
OUTCOME
C9
Effectiveness
Whenever possible, only studies
showing a statistically significant
positive effect will be included.
However if these are not
available, studies showing non-
statistically significant effects
and included in meta-analyses in
previous NICE guidance, may be
considered.
If not
9_EX. EFFECT

35 Estimating the Return on Investment for interventions and strategies to increase physical activity – Technical Report
Criteria Exclusion/ Inclusion
code Notes
Study design
effectiveness studies (RTC,
non RTC, and pre-post
studies)
economic analyses (cost-
benefit analyses; cost-
effectiveness studies; and
cost-utility analyses)
systematic reviews
Studies that look at
effectiveness only:
9_IN.EFFECT
Studies that are
economic analyses:
10_IN.ECON
Systematic reviews that
include any of the study
types:
11_IN.SYSTREV
If relevant to the topic but
does not contain data but
is an opinion piece
include as:
12_IN.BACKGROUND
Studies that report useful
cost and resource data
include as:
13_IN.COST
If unclear:
Q_Query
Systematic reviews that include any of
the study types listed above will be
identified; these will be used as a source
of further primary studies rather than
included in the review in their own right.
Studies that report useful cost and
resource data: These costing studies will
be excluded from the cost-effectiveness
review but will be recorded separately
and used to inform the development of
the economic models.
Feasibility assessment
After abstract screening using the exclusion and inclusion criteria, 114 studies were identified for full
text review and feasibility assessment. The following feasibility criteria were applied to the short listed
studies:

36 Estimating the Return on Investment for interventions and strategies to increase physical activity – Technical Report
Is the setting relevant to the UK context?
Is the intervention already covered by NICE guidance or does it update the guidance?
Does the outcome metric measured in the study allow economic modelling?
Does the paper provide sufficient data on costs or resources to allow costing?
Results
As a result of the feasibility assessment, two studies were identified as feasible to include in the
models in addition to interventions already identified in NICE guidance. Table A4.2 provides a
description of the two studies.
Table A4.2 Studies identified through feasibility assessment
Reference Model Intervention
type Intervention Description
Sevick et al (2007)
Adults Community Information/ media campaigns
Project STRIDE - email containing tips on how to achieve 30 minutes of moderate physical activity per day, 5 days a week -Regular email surveys regarding level of physical activity, motivational readiness and self-efficacy sent for the first 4 weeks, monthly for 3 months and bi-monthly for 6 months - Participants mailed in physical activity logs and brief surveys each month for 12 months. The return of each survey was reinforced with a $10 incentive. - Feedback forms based on survey results were generated containing theory based counselling messages and mailed to participants.
Araujo-Soares et al (2009)
Children Group Health information/ counselling
Children aged 10-16 received twelve 90 minute weekly sessions with a trained psychologist and sports education teacher. The initial session included parents, then an introduction session with the children and two sessions based on a standardised manual. The manual covered topics such as: -physical activity concepts -physical, psychological and social benefits of PA The remaining sessions covered other goals such as healthy eating, prevention on sexually transmitted diseases, smoking, alcohol and illicit drugs. Pupils were asked to keep a diary in which they documented their daily physical activity.

37 Estimating the Return on Investment for interventions and strategies to increase physical activity – Technical Report
4.6 Appendix 6: Model parameters
Table A5.1 Population data
Data Source
Population of local area ONS - Local area specific data
Proportion of population who are inactive Active people survey, Sport England (2012) – local area specific data
Proportion of population who are low active Active people survey, Sport England (2012) – local area specific data
Proportion of population who are high active Active people survey, Sport England (2012) – local area specific data
Proportion of children who meeting recommendations for physical activity
Health Survey for England, Department of Health (2008)
Proportion of children who are inactive Health Survey for England, Department of Health (2008)
Mortality and life table Office for National Statistics
Table A5.2 Baseline risk for CHD, stroke and diabetes
Age CHD Stroke Diabetes Source
33-34 0.000035 0.00008 9E-05 NICE PH44 (2012)
35-44 0.000465 0.00023 0.00028 NICE PH44 (2012)
45-54 0.002095 0.00057 0.000632 NICE PH44 (2012)
55-64 0.00631 0.00291 0.001005 NICE PH44 (2012)
65-74 0.0097 0.0069 0.001116 NICE PH44 (2012)
75-81 0.0097 0.01434 0.001116 NICE PH44 (2012)
Table A5.3 Relative risk data
Data Value Assumption (if
applicable) Source
Relative risk CHD 0.9 Based on evidence from
Hu et al (2007) quoted in NICE PH44 (2012)
Relative risk Stroke 0.86 Based on evidence from
Hu et al (2007) quoted in NICE PH44 (2012)
Relative risk Diabetes 0.67 Based on evidence from
Hu et al (2007) quoted in NICE PH44 (2012)
Relative risk Non CVD mortality after non-fatal CHD event
1.71
No data for CHD so assumed to be same as stroke
NICE PH44 (2012)
Relative risk CVD mortality after non-fatal CHD event
3.89
No data for CHD so assumed to be same as stroke
NICE PH44 (2012)
Relative risk Non CVD mortality after non-fatal stroke event
1.71 Based on evidence from
Hansen et al (2001) quoted in NICE PH44 (2012)
Relative risk CVD mortality after non-fatal stroke event
3.89 Based on evidence from
Hansen et al (2001) quoted

38 Estimating the Return on Investment for interventions and strategies to increase physical activity – Technical Report
Data Value Assumption (if
applicable) Source
in NICE PH44 (2012)
Relative risk Non CVD mortality after diabetes
1.49 Based on evidence from
Preis et al (2009) quoted in NICE PH44 (2012)
Relative risk CVD mortality after diabetes
2.61 Based on evidence from
Preis et al (2009) quoted in NICE PH44 (2012)
Table A5.4 Utility data
Data Value Source
Utility score for healthy people 1.00 Based on evidence from Ward et al (2005) quoted in NICE PH44 (2012)
Utility score (CHD 1st event) 0.80
Based on evidence from Ward et al (2005) quoted in NICE PH44 (2012)
Utility score (post CHD 1st event) 0.92
Based on evidence from Ward et al (2005) quoted in NICE PH44 (2012)
Utility score (Stroke 1st event) 0.63
Based on evidence from Ward et al (2005) quoted in NICE PH44 (2012)
Utility score (Stroke CHD 1st
event) 0.65
Based on evidence from Ward et al (2005) quoted in NICE PH44 (2012)
Utility score (Diabetes CHD 1st
event) 0.90
Based on evidence from Ward et al (2005) quoted in NICE PH44 (2012)
Utility score (33-44 year olds) 0.90 NICE PH44 (2012)
Utility score (45-54 year olds) 0.86 NICE PH44 (2012))
Utility score (55-64 year olds) 0.82 NICE PH44 (2012)
Utility score (65-74 year olds) 0.78 NICE PH44 (2012))
Utility score (75+ year olds) 0.72 NICE PH44 (2012)
QALY gain (30 minutes physical activity)
0.00022243 NICE PH17 (2008)
Table A5.4 Other inputs and cost data
Data Value Assumption (if
applicable) Source
Annual treatment cost of coronary heart disease (1
st event)
£4,204.93 Based on evidence from Ward et al (2005) quoted in NICE PH44 (2012)
Annual treatment cost of coronary heart disease (post 1
st event)
£480.47 Based on evidence from Ward et al (2005) quoted in NICE PH44 (2012)
Annual treatment cost of Stroke (1
st event)
£10,855.90 Based on evidence from Ward et al (2005) quoted in NICE PH44 (2012)
Annual treatment cost of Stroke (post 1
st event)
£2,384.25 Based on evidence from Ward et al (2005) quoted in NICE PH44 (2012)
Annual treatment cost of diabetes £969.47 Based on evidence from Ward et al (2005) quoted in NICE PH44 (2012)

39 Estimating the Return on Investment for interventions and strategies to increase physical activity – Technical Report
Data Value Assumption (if
applicable) Source
Average days of absenteeism saved per year per person participating in a workplace program encouraging increased physical activity
5.23
Based on evidence from Lechner et al (1997) quoted in NICE PH13 (2008)
Average daily wage rate £106.18
Based on evidence from NICE PH13 (2008) and Office for National Statistics
Proportion of stroke patients who would need care
0.332
Based on evidence from Commissioning support for London (2011) quoted in Pokhrel et al (2012)
Local authority care as a % of total informal care for stroke
0.125 Based on evidence from Saka et al (2009) quoted in Pokhrel et al (2012))
LA care cost £1,656.41 Based on evidence from Saka et al (2009) quoted in Pokhrel et al (2012))
Average annual number of car trips per person
614 Calculation based on data from National Travel Survey 2011
Average length of car trip (miles) 7.1 National Travel Survey 2011
Average annual distance travelled by car (miles)
4,301 Calculation based on data from National Travel Survey 2011
Average annual distance travelled by car (km)
6,924 Calculation
% Reduction in annual car distance travelled (km) if low active
0.05%
It is assumed that increasing activity has a
very small impact on
reduction in the number of km
travelled by car
Assumption based on expert opinion
% Reduction in annual car distance travelled (km) if meets recommendations
0.1%
It is assumed that increasing activity has a
very small impact on
reduction in the number of km
travelled by car
Assumption based on expert opinion
Annual car distance travelled if low active (km)
6,921
Calculation: Average annual distance travelled by car (km) * (1-% Reduction in annual car distance travelled (km) if low active) = 6,924*(1-0.05%)

40 Estimating the Return on Investment for interventions and strategies to increase physical activity – Technical Report
Data Value Assumption (if
applicable) Source
Annual car distance travelled if meets recommendations (km)
6,917
Calculation: Average annual distance travelled by car (km) * (1-% Reduction in annual car distance travelled (km) if meets recommendations) = 6,924*(1-0.1%)
Reduction in Km travelled (low active)
3
Calculation: Average annual distance travelled by car (km) - Reduction in Km travelled (low active) = 6,924-6,921
Reduction in Km travelled (meets recommendations)
7
Calculation: Average annual distance travelled by car (km) - Reduction in Km travelled (meets recommendations) = 6,924-6,917
Congestion (Cost per km) £16.97
Based on evidence from NICE PH41 (2012)
Infrastructure (Cost per km) £0.13
Based on evidence from NICE PH41 (2012)
Accident (Cost per km) £1.94
Based on evidence from NICE PH41 (2012)
Local air (Cost per km) £0.52
Based on evidence from NICE PH41 (2012)
Noise (Cost per km) £0.13
Based on evidence from NICE PH41 (2012)
Greenhouse gases (Cost per km) £0.39
Based on evidence from NICE PH41 (2012)
Indirect taxation (Cost per km) -£4.66
Based on evidence from NICE PH41 (2012)
Total transport (cost per km) £15.42
Based on evidence from NICE PH41 (2012)

41 Estimating the Return on Investment for interventions and strategies to increase physical activity – Technical Report
4.7 Appendix 7: Additional information
Accessing the tool
The tool shall be freely available on the NICE website.
Version control
Note that some of the tool inputs are time limited (e.g. population statistics) and may be updated
when new data becomes available. As such, it is the user’s responsibility to ensure that they are using
the latest version of the tool. All versions made available for download will be clearly marked with a
version number.
Referencing the tool
Any analysis based on this tool needs to be acknowledge the use of this tool as follows: “This analysis
is based on NICE Return on Investment Tool for Physical Activity, version 1” and include the citation
as:
Mallender, J., Bertranou, E., Owen, L., Lester-George, A., Jhita, T., Roberts, S. (2013) Physical Activity Return on Investment Tool. London: National Institute of Health and Care Excellence
Project team
Matrix – Jacque Mallender, Evelina Bertranou, Tracey Jhita, Sarah Roberts, Rory Tierney, Mariana
Bacelar, Adeline Durand.
Lelan Ltd. – Adam Lester-George.
Cavill Associates – Nick Cavill
NICE Steering Group – Lesley Owen, Rachel Kettle, Suzi Peden, Victoria Axe, Hugo Crombie, Simon
Ellis, Antony Morgan.
Disclaimer information
NICE has provided this tool to aid decision-making. NICE cannot be held liable for any investment or
other decisions that are made using information and results obtained from this tool. Implementation of
NICE guidance is the responsibility of local commissioners and/or providers. Commissioners and
providers are reminded that it is their responsibility to implement NICE guidance, in their local context,
in light of their duties to avoid unlawful discrimination and to have regard for promoting equality of
opportunity. Nothing in this tool should be interpreted in a way that would be inconsistent with
compliance with those duties.
Acknowledgements
Matrix would like to thank all the individuals who contributed comments during the development of the
tool.
Request to users
This tool may be subject to continuous improvement. If any problem is encountered or inconsistency
is found, please report it to NICE by emailing [email protected]