estimated impacts of sequestration-level funding april...
TRANSCRIPT
Estimated Impacts of Sequestration-Level Funding – FY 2015 Defense Budget
Estimated Impacts of Sequestration-Level Funding
UNITED STATES DEPARTMENT OF DEFENSE FISCAL YEAR 2015 BUDGET REQUEST
APRIL 2014

Estimated Impacts of Sequestration-Level Funding – FY 2015 Defense Budget
The estimated cost of this report or study for the Department of Defense is
approximately $19,000 in DoD labor for the 2014 Fiscal Year.
Generated on 2014Apr03 RefID: 8-1214AF3
Estimated Impacts of Sequestration-Level Funding – FY 2015 Defense Budget
TABLE OF CONTENTS i
Table of Contents 1. Overview ............................................................................................................. 1-1
2. Service and Appropriation Level Impacts .................................................................... 2-1
Change by Service ........................................................................................................... 2-1
Change by Appropriation Title ........................................................................................... 2-1
3. Force Structure Impacts ................................................................................................. 3-1
Army .................................................................................................................................. 3-1
Marine Corps ..................................................................................................................... 3-2
Navy .................................................................................................................................. 3-3
Air Force ............................................................................................................................ 3-4
4. Modernization Impacts ................................................................................................... 4-1
Summary ........................................................................................................................... 4-1
Army .................................................................................................................................. 4-3
Marine Corps ..................................................................................................................... 4-5
Navy .................................................................................................................................. 4-7
Air Force ......................................................................................................................... 4-10
Joint ................................................................................................................................. 4-13
Missile Defense ............................................................................................................... 4-16
5. Operation and Maintenance (O&M) Impacts ................................................................. 5-1
Summary of Service Readiness Funding .......................................................................... 5-1
Facilities Sustainment, Restoration, and Modernization (FSRM) ...................................... 5-4
Installation Services .......................................................................................................... 5-5
Non-Defense and Other Defense O&M ............................................................................ 5-6
6. Military Construction (MILCON) Impacts ...................................................................... 6-1
Summary of MILCON ........................................................................................................ 6-1
7. Other Important Initiatives ............................................................................................. 7-1
Economic Adjustments ...................................................................................................... 7-1
Compensation Savings ..................................................................................................... 7-1
Estimated Impacts of Sequestration-Level Funding – FY 2015 Defense Budget
CHAPTER 1 OVERVIEW 1-1
1. OVERVIEW
The Department of Defense’s Fiscal Year (FY) 2015 budget submission provides the resources necessary to protect and advance U.S. interests and to execute the updated defense strategy, although at increased levels of risk for some missions relative to the planned funding levels in the FY 2014 budget. This budget complies with the limits established for FY 2015 in the Bipartisan Budget Act of 2013 (BBA), but over the remainder of the Future Years Defense Program (FYDP), it exceeds the estimated limits on base budget discretionary DoD funding under current law by $115 billion. These estimated limits reflect the automatic reductions of the caps on Government-wide discretionary funding established in the Budget Control Act of 2011 (BCA). For simplicity, this report will refer to these limits as “BCA levels” or “sequestration levels.” This report outlines the impacts the Department would face today in having to plan and operate at the sequestration levels and documents the significant cuts to forces, modernization, and readiness that would be required at those levels. Of course, BCA-level funding would have similar impacts for non-defense programs, and any increase in defense discretionary caps should be matched by an equivalent increase in the non-defense caps. For defense, this report illustrates the additional warfighting risk the Department will incur if the BCA’s automatic reductions persist. The Department will continue to review and refine this plan as conditions warrant, so while this report shows a specific set of impacts, those impacts may change. The automatic reductions required by the BCA would impose significant cuts to Department resources that would significantly increase risks both in the short- and long-term. These cuts would be in addition to several reductions in planned funding that the Department has already absorbed. Over the past several years, planned DoD spending has been significantly reduced by the following actions:
To comply with the original discretionary spending caps in the BCA, FY 2012 enacted appropriations and the FY 2013 President’s Budget reduced DoD funding by $487 billion compared with the ten-year plan in the FY 2012 President’s Budget.
The March 2013 sequestration reduced base budget FY 2013 DoD funding by an additional $32 billion.
Consistent with the revised caps in the BBA, FY 2014 enacted appropriations reduced DoD funding by $31 billion compared with the President’s Budget request, and the FY 2015 President’s Budget requested $45 billion less than was planned in the FY 2014 budget.
Together, these cuts total almost $600 billion. Accordingly, the Department's planned budgets across the FYDP have been substantially reduced. The Services have already reduced force structure and planned modernizations prior to any additional cuts discussed here. Additionally, compensation savings have been assumed at both funding levels. If these proposed compensation reforms are not enacted, the Department will have no choice but to make further cuts elsewhere in the budget that will deprive our troops of the training and equipment they need to succeed in battle.

Estimated Impacts of Sequestration-Level Funding – FY 2015 Defense Budget
CHAPTER 1 OVERVIEW 1-2
With the addition of projected sequestration-level cuts for FY 2016 through 2021, reductions to planned defense spending for the ten-year period from FY 2012 to 2021 will exceed $1 trillion. If sequestration-level cuts persist, our forces will assume substantial additional risks in certain missions and will continue to face significant readiness and modernization challenges. These impacts would leave our military unbalanced and eventually too small to meet the needs of our strategy fully. At sequestration-level funding, major reductions from the FY 2015-2019 President’s Budget request would include:
Reducing one squadron of F-35 aircraft (cutting acquisition of 15 aircraft would prevent fielding the squadron)
Eliminating the fleet of KC-10 tankers Cutting operational surface combatant ships by 7 in FY 2019 Cutting procurement of 8 ships across the FYDP Divesting the Global Hawk Block 40 fleet Divesting the Predator fleet beginning in FY 2016 Eliminating planned purchases of Reaper aircraft in FY 2018 and FY 2019 Reducing Service readiness funding by $16 billion over the FYDP to include
approximately $9 billion in depot/ship maintenance, which would further increase Service maintenance backlogs
With respect to readiness, sequestration-level funding cuts would intensify existing shortfalls and delay timelines for building joint readiness for full-spectrum operations. Furthermore, if Congress acts to support FYDP funding at the PB15 level, the Department will not have to cut:
Army forces to a total force of 420K Active, 315K National Guard, and 185K Reserve Marine Corps forces to a total active force of 175K An aircraft carrier (CVN-73) to a total inventory of ten aircraft carriers
NOTE: Throughout this report we compare the FY 2015 President's Budget FYDP position to a five-year plan that reflects the estimated automatic reductions required by the BCA in FY 2016-2019. All tables show FY 2015 at the PB15 level; only FY 2016-2019 reflect the BCA levels. For simplicity the tables reflecting BCA reductions in FY 2016-2019 are therefore labeled and referred to throughout the report by the “BBA/BCA” short hand notation.

Estimated Impacts of Sequestration-Level Funding – FY 2015 Defense Budget
CHAPTER 2 SERVICE AND APPROPRIATION LEVEL IMPACTS 2-1
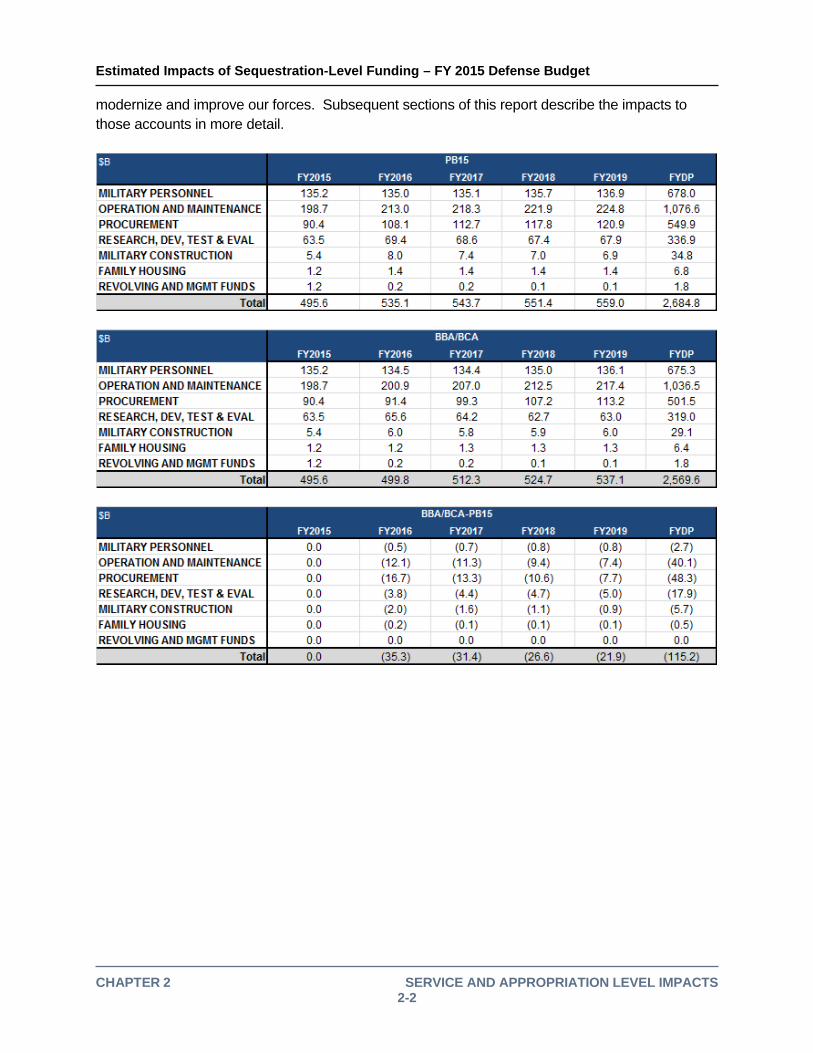
2. SERVICE AND APPROPRIATION LEVEL IMPACTS CHANGE BY SERVICE Under the BBA/BCA scenario, DoD funding would remain at the President’s Budget (PB) 2015 level in FY 2015, and then decline by an estimated $35.3 billion in FY 2016 and an estimated $115.2 billion across the FYDP. Reductions would be made in every Service. Significant reductions to Defense Agencies have already been accomplished at the PB15 level and their funding would be decreased marginally at the sequestration levels.
As of 21-FEB-2014; reflects Discretionary Budget Authority
CHANGE BY APPROPRIATION TITLE The BBA/BCA reductions would affect all appropriations, with one-third of the cuts being taken in Operation and Maintenance (O&M) accounts and nearly two-thirds in the modernization accounts. In fact, the O&M title would grow at an average of only approximately 2 percent per year in FY 2015-2019 at sequestration levels, compared with 3 percent per year in FY 2015-2019 at the FY 2015 President’s Budget level. The Research, Development, Test and Evaluation (RDT&E) title would actually decline across the FYDP at sequestration levels, severely curtailing the Department’s ability to develop new technologies. Investment (Procurement and RDT&E) would grow at only 14 percent in FY 2015-2019 under the BBA/BCA levels, while it would grow nearly 23 percent in the FY 2015 President's Budget. Moreover, investment would account for nearly 60 percent of the total reduction in the BBA/BCA case, further eroding the Department’s ability to
Estimated Impacts of Sequestration-Level Funding – FY 2015 Defense Budget
CHAPTER 2 SERVICE AND APPROPRIATION LEVEL IMPACTS 2-2
modernize and improve our forces. Subsequent sections of this report describe the impacts to those accounts in more detail.
Estimated Impacts of Sequestration-Level Funding – FY 2015 Defense Budget
CHAPTER 3 FORCE STRUCTURE IMPACTS 3-1
3. FORCE STRUCTURE IMPACTS
ARMY
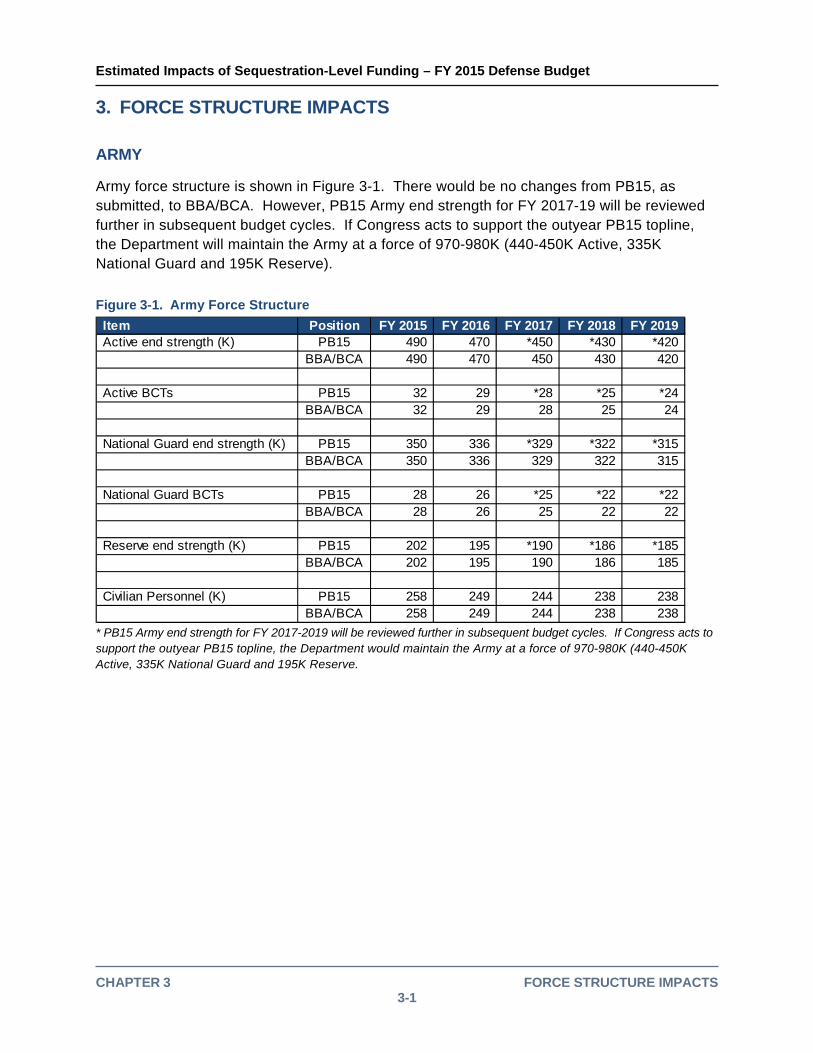
Army force structure is shown in Figure 3-1. There would be no changes from PB15, as submitted, to BBA/BCA. However, PB15 Army end strength for FY 2017-19 will be reviewed further in subsequent budget cycles. If Congress acts to support the outyear PB15 topline, the Department will maintain the Army at a force of 970-980K (440-450K Active, 335K National Guard and 195K Reserve).
Figure 3-1. Army Force Structure
Item Position FY 2015 FY 2016 FY 2017 FY 2018 FY 2019Active end strength (K) PB15 490 470 *450 *430 *420
BBA/BCA 490 470 450 430 420
Active BCTs PB15 32 29 *28 *25 *24BBA/BCA 32 29 28 25 24
National Guard end strength (K) PB15 350 336 *329 *322 *315BBA/BCA 350 336 329 322 315
National Guard BCTs PB15 28 26 *25 *22 *22BBA/BCA 28 26 25 22 22
Reserve end strength (K) PB15 202 195 *190 *186 *185BBA/BCA 202 195 190 186 185
Civilian Personnel (K) PB15 258 249 244 238 238 BBA/BCA 258 249 244 238 238
* PB15 Army end strength for FY 2017-2019 will be reviewed further in subsequent budget cycles. If Congress acts to support the outyear PB15 topline, the Department would maintain the Army at a force of 970-980K (440-450K Active, 335K National Guard and 195K Reserve.
Estimated Impacts of Sequestration-Level Funding – FY 2015 Defense Budget
CHAPTER 3 FORCE STRUCTURE IMPACTS 3-2
MARINE CORPS
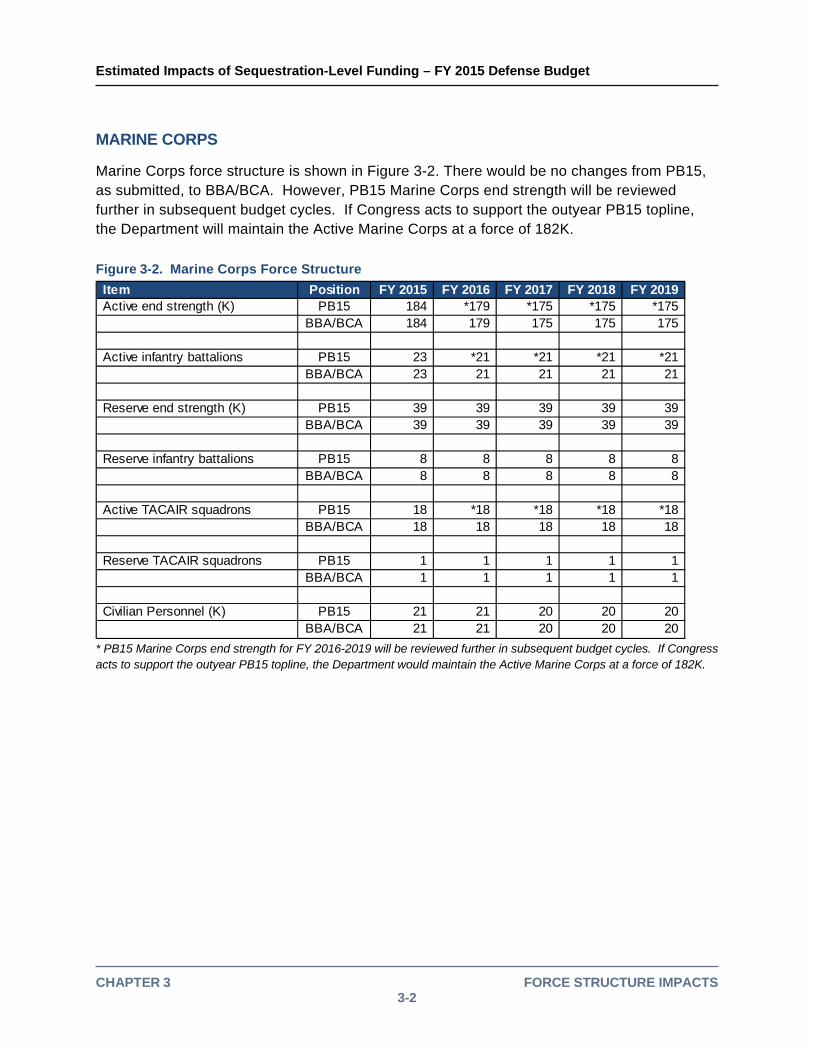
Marine Corps force structure is shown in Figure 3-2. There would be no changes from PB15, as submitted, to BBA/BCA. However, PB15 Marine Corps end strength will be reviewed further in subsequent budget cycles. If Congress acts to support the outyear PB15 topline, the Department will maintain the Active Marine Corps at a force of 182K. Figure 3-2. Marine Corps Force Structure
Item Position FY 2015 FY 2016 FY 2017 FY 2018 FY 2019Active end strength (K) PB15 184 *179 *175 *175 *175
BBA/BCA 184 179 175 175 175
Active infantry battalions PB15 23 *21 *21 *21 *21BBA/BCA 23 21 21 21 21
Reserve end strength (K) PB15 39 39 39 39 39 BBA/BCA 39 39 39 39 39
Reserve infantry battalions PB15 8 8 8 8 8 BBA/BCA 8 8 8 8 8
Active TACAIR squadrons PB15 18 *18 *18 *18 *18BBA/BCA 18 18 18 18 18
Reserve TACAIR squadrons PB15 1 1 1 1 1 BBA/BCA 1 1 1 1 1
Civilian Personnel (K) PB15 21 21 20 20 20 BBA/BCA 21 21 20 20 20
* PB15 Marine Corps end strength for FY 2016-2019 will be reviewed further in subsequent budget cycles. If Congress acts to support the outyear PB15 topline, the Department would maintain the Active Marine Corps at a force of 182K.
Estimated Impacts of Sequestration-Level Funding – FY 2015 Defense Budget
CHAPTER 3 FORCE STRUCTURE IMPACTS 3-3
NAVY
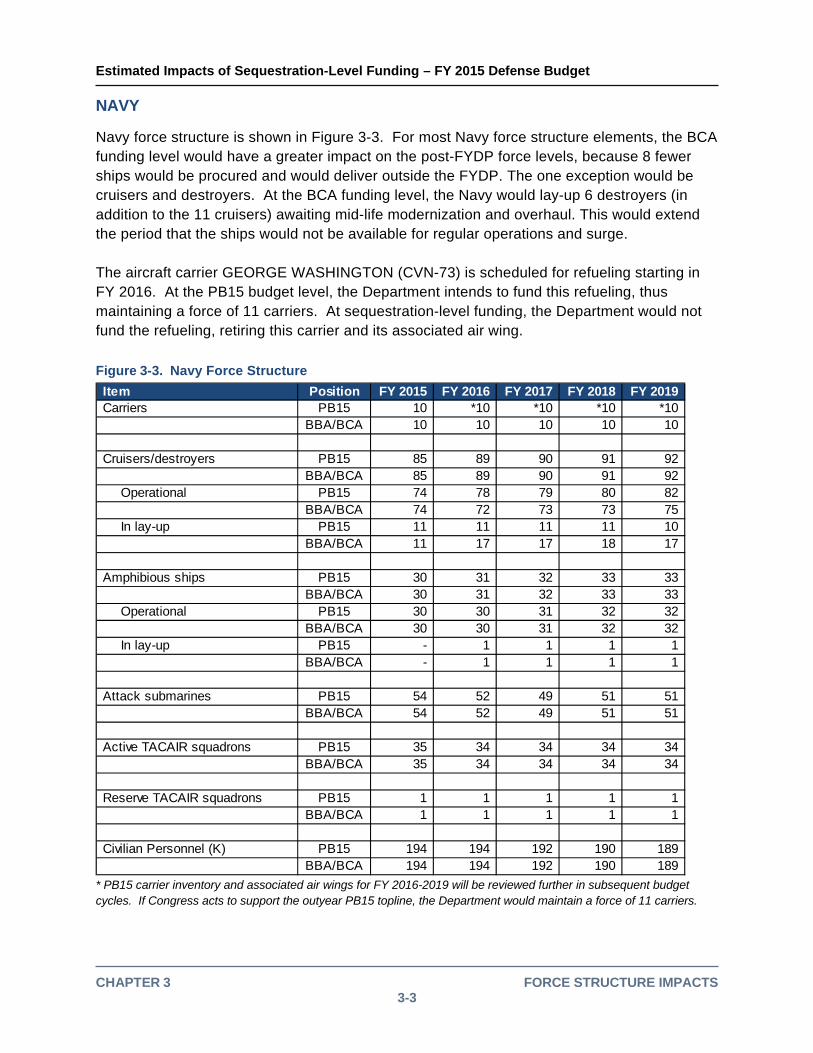
Navy force structure is shown in Figure 3-3. For most Navy force structure elements, the BCA funding level would have a greater impact on the post-FYDP force levels, because 8 fewer ships would be procured and would deliver outside the FYDP. The one exception would be cruisers and destroyers. At the BCA funding level, the Navy would lay-up 6 destroyers (in addition to the 11 cruisers) awaiting mid-life modernization and overhaul. This would extend the period that the ships would not be available for regular operations and surge. The aircraft carrier GEORGE WASHINGTON (CVN-73) is scheduled for refueling starting in FY 2016. At the PB15 budget level, the Department intends to fund this refueling, thus maintaining a force of 11 carriers. At sequestration-level funding, the Department would not fund the refueling, retiring this carrier and its associated air wing. Figure 3-3. Navy Force Structure
Item Position FY 2015 FY 2016 FY 2017 FY 2018 FY 2019Carriers PB15 10 *10 *10 *10 *10
BBA/BCA 10 10 10 10 10
Cruisers/destroyers PB15 85 89 90 91 92 BBA/BCA 85 89 90 91 92
Operational PB15 74 78 79 80 82 BBA/BCA 74 72 73 73 75
In lay-up PB15 11 11 11 11 10 BBA/BCA 11 17 17 18 17
Amphibious ships PB15 30 31 32 33 33 BBA/BCA 30 31 32 33 33
Operational PB15 30 30 31 32 32 BBA/BCA 30 30 31 32 32
In lay-up PB15 - 1 1 1 1 BBA/BCA - 1 1 1 1
Attack submarines PB15 54 52 49 51 51 BBA/BCA 54 52 49 51 51
Active TACAIR squadrons PB15 35 34 34 34 34 BBA/BCA 35 34 34 34 34
Reserve TACAIR squadrons PB15 1 1 1 1 1 BBA/BCA 1 1 1 1 1
Civilian Personnel (K) PB15 194 194 192 190 189 BBA/BCA 194 194 192 190 189
* PB15 carrier inventory and associated air wings for FY 2016-2019 will be reviewed further in subsequent budget cycles. If Congress acts to support the outyear PB15 topline, the Department would maintain a force of 11 carriers.

Estimated Impacts of Sequestration-Level Funding – FY 2015 Defense Budget
CHAPTER 3 FORCE STRUCTURE IMPACTS 3-4
AIR FORCE
Air Force structure is shown in Figure 3-4. At the BCA funding level, the Air Force would field one fewer F-35A squadron by the end of the FYDP. At this funding position, it would also shrink its tanker fleet to 468 aircraft by FY 2019 by terminating the entire KC-10 force starting in FY 2016 (fully removing the force by FY 2020). At the BCA position, the Air Force would divest the entire Global Hawk Block 40 force in FY 2016. It would also terminate the MQ-1 Predator fleet in FY 2016 and substantially reduce the MQ-9 Reaper fleet in FY 2018 and 2019. These changes would result in only 45 fully sustained Predator/Reaper CAPs by the end of the FYDP compared to 55 at the PB15 funding level.
Figure 3-4. Air Force Structure
Item Position FY 2015 FY 2016 FY 2017 FY 2018 FY 2019Active TACAIR sqdns PB15 27 26 26 26 27
BBA/BCA 27 26 26 26 26
National Guard TACAIR squadrons PB15 20 20 19 18 18 BBA/BCA 20 20 19 18 18
Reserve TACAIR squadrons PB15 3 3 3 3 4 BBA/BCA 3 3 3 3 4
Tankers PB15 455 466 478 480 485 BBA/BCA 455 460 463 468 468
U2 PB15 32 32 - - - BBA/BCA 32 32 - - -
Global Hawk 30 PB15 18 18 21 21 21 BBA/BCA 18 18 21 21 21
Global Hawk 40 PB15 11 11 11 11 11 BBA/BCA 11 - - - -
Predator/Reaper CAPs PB15 50 50 50 52 55 BBA/BCA 42 35 38 41 45
Civilian Personnel (K) PB15 177 180 182 181 181 BBA/BCA 177 180 182 181 181

Estimated Impacts of Sequestration-Level Funding – FY 2015 Defense Budget
CHAPTER 4 MODERNIZATION IMPACTS 4-1
4. MODERNIZATION IMPACTS
SUMMARY Procurement and Research, Development, Test and Evaluation (RDT&E) positions and reductions are shown in Figures 4-1 through 4-3. Combat Systems includes procurement of aircraft, warships, tracked vehicles and special operations forces equipment. Systems Development includes all RDT&E that is not Science and Technology (S&T). Maintenance, Training and Support includes investment for equipment, vehicles, and facilities dedicated to these areas. Modernization reductions for space systems are also a small part of this area. Munitions include ammunition, weapons, missiles and associated equipment. Figure 4-1. PB15 Procurement and RDT&E
Item ($B) FY 2015 FY 2016 FY 2017 FY 2018 FY 2019 FYDPCombat Systems 34.5 43.0 45.8 47.2 47.5 218.0Systems Development 40.0 42.8 41.4 39.5 39.9 203.6Maintenance, Training and Support 16.9 21.0 22.4 24.8 25.7 110.8Munitions 7.8 9.8 10.3 10.5 11.2 49.6Communications and Electronics 7.6 9.0 9.1 9.5 9.9 45.0Science and Technology 11.5 12.0 12.1 12.3 12.5 60.5Modifications 2.3 3.0 2.5 2.5 2.5 12.7Spares and Repair Parts 6.2 7.5 7.7 8.5 8.9 38.8Non Defense and Other 27.1 29.6 29.9 30.4 30.7 147.7
Total 153.9 177.5 181.3 185.2 188.8 886.7
PB15
Figure 4-2. BBA/BCA Procurement and RDT&E
Item ($B) FY 2015 FY 2016 FY 2017 FY 2018 FY 2019 FYDPCombat Systems 34.5 35.0 40.3 44.0 46.4 200.2Systems Development 40.0 40.6 38.9 37.2 37.7 194.4Maintenance, Training and Support 16.9 19.2 21.1 22.6 24.4 104.3Munitions 7.8 8.3 8.8 9.4 10.2 44.6Communications and Electronics 7.6 8.1 8.0 8.6 9.3 41.6Science and Technology 11.5 11.6 11.7 11.9 12.1 58.8Modifications 2.3 2.5 2.2 2.1 2.3 11.5Spares and Repair Parts 6.2 6.9 7.3 8.4 8.5 37.3Non Defense and Other 27.1 24.7 25.3 25.5 25.2 127.8
Total 153.9 157.0 163.6 169.9 176.1 820.5
BBA/BCA

Estimated Impacts of Sequestration-Level Funding – FY 2015 Defense Budget
CHAPTER 4 MODERNIZATION IMPACTS 4-2
Figure 4-3. BBA/BCA Procurement and RDT&E Reductions
Item ($B) FY 2015 FY 2016 FY 2017 FY 2018 FY 2019 FYDPCombat Systems - (8.0) (5.5) (3.2) (1.1) (17.8) Systems Development - (2.2) (2.5) (2.3) (2.2) (9.2) Maintenance, Training and Support - (1.8) (1.3) (2.2) (1.3) (6.5) Munitions - (1.4) (1.6) (1.0) (1.1) (5.1) Communications and Electronics - (0.9) (1.1) (0.8) (0.6) (3.4) Science and Technology - (0.4) (0.4) (0.4) (0.4) (1.6) Modifications - (0.4) (0.3) (0.3) (0.1) (1.2) Spares and Repair Parts - (0.6) (0.4) (0.2) (0.3) (1.5) Non Defense and Other (4.9) (4.6) (4.9) (5.6) (19.9)
Total - (20.5) (17.7) (15.3) (12.7) (66.2)
BBA/BCA - PB15
S&T is a key investment area that enables our military to maintain a competitive advantage over our adversaries. Maintaining consistent S&T funding even at sequestration levels would allow the Department to continue to invest in critical research and technology development initiatives that contribute to future capability improvements, such as supporting the Department’s rebalance towards the Asia-Pacific. Therefore, BCA funding for S&T would be relatively unchanged compared with PB15 funding.
Minor Procurement for supplies and equipment other than major weapons systems (specifically any appropriations other than Aircraft Procurement, Shipbuilding and Construction, and Wheeled and Tracked Combat Vehicles) is an important support element to sustain the warfighting capability of the force. Minor Procurement is a portion of the entries in Figure 4-3 (primarily Combat Systems; Maintenance, Training and Support; Munitions; and Communications and Electronics). It would represent about 30 percent of the overall modernization reduction in FY 2016 but would be a smaller percentage of the overall modernization reductions in the remaining years of the FYDP.
Over 50 percent of the BCA modernization reduction would relate to Combat Systems, Systems Development and Munitions. Select program reductions for these areas are shown below by Service.* * Figures 4-4 through 4-31 show budget line items with significant reductions. The PB15 and BBA/BCA funding in these figures may not reflect total program values because a program could have more than one budget line item (Example: "DDG-51", "DDG Mod"). Procurement quantity changes are shown when applicable.

Estimated Impacts of Sequestration-Level Funding – FY 2015 Defense Budget
CHAPTER 4 MODERNIZATION IMPACTS 4-3
ARMY
Blackhawk Blackhawk investments and procurement quantities are shown in Figure 4-4. PB15 funds additional aircraft beginning in FY 2016, allowing for the negotiation of a follow-on multi-year procurement starting in FY 2017. These additional aircraft would not be funded at the BCA funding level. Figure 4-4. Blackhawk
Position Units FY 2015 FY 2016 FY 2017 FY 2018 FY 2019 FYDPPB15 $M 1,369 1,296 1,508 1,542 1,486 7,201 BBA/BCA $M 1,369 963 686 1,542 1,401 5,961 Delta $M - (334) (821) - (85) (1,240) PB15 Procurement Qty 79 71 70 104 86 410 BBA/BCA Procurement Qty 79 56 28 104 82 349 Delta Procurement Qty - (15) (42) - (4) (61)
Budget Line Item = "UH‐60 Blackhawk M Model (MYP)" Apache Remanufacture Apache remanufacture investments and procurement quantities are shown in Figure 4-5. PB15 funds additional aircraft buys, achieving economic procurement rates in FY 2016 versus FY 2018 under the BCA level of funding. Figure 4-5. Apache Remanufacture
Position Units FY 2015 FY 2016 FY 2017 FY 2018 FY 2019 FYDPPB15 $M 651 1,203 1,273 1,370 1,102 5,599 BBA/BCA $M 651 742 868 1,093 1,030 4,384 Delta $M - (461) (405) (277) (72) (1,215) PB15 Procurement Qty 25 40 69 72 53 259 BBA/BCA Procurement Qty 25 29 33 51 54 192 Delta Procurement Qty - (11) (36) (21) 1 (67)
Budget Line Item = "AH‐64 Apache Block IIIA Reman"
Estimated Impacts of Sequestration-Level Funding – FY 2015 Defense Budget
CHAPTER 4 MODERNIZATION IMPACTS 4-4
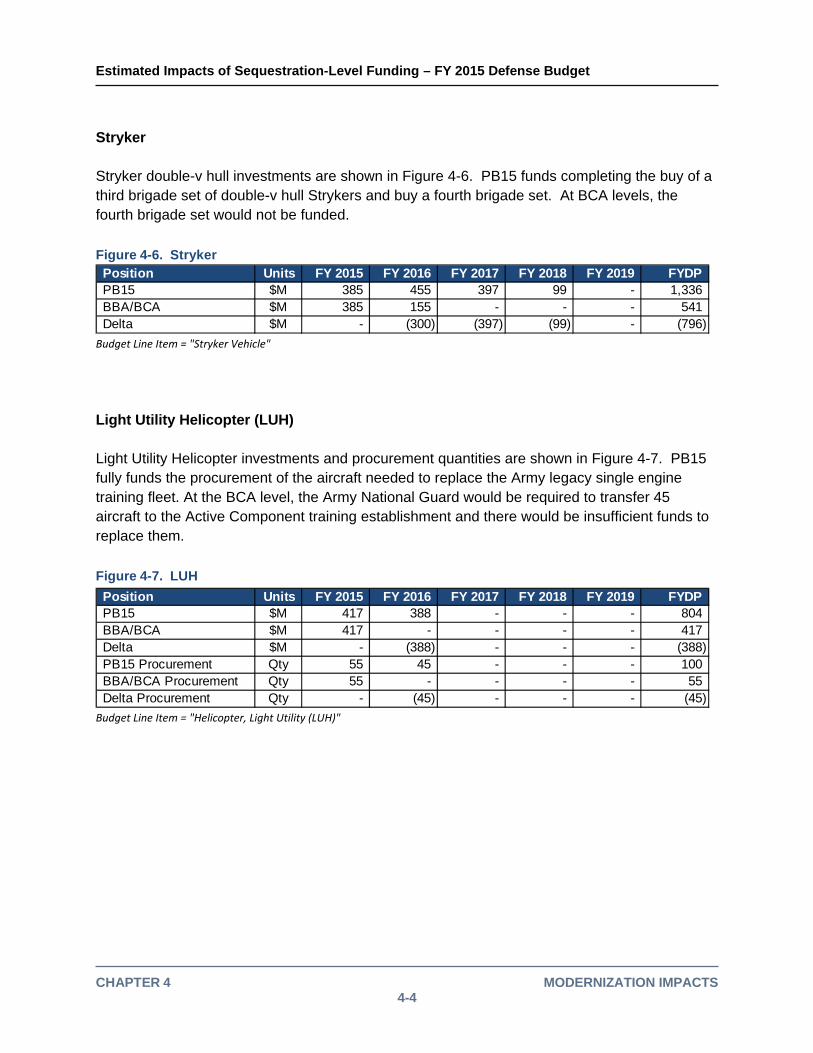
Stryker Stryker double-v hull investments are shown in Figure 4-6. PB15 funds completing the buy of a third brigade set of double-v hull Strykers and buy a fourth brigade set. At BCA levels, the fourth brigade set would not be funded. Figure 4-6. Stryker Position Units FY 2015 FY 2016 FY 2017 FY 2018 FY 2019 FYDPPB15 $M 385 455 397 99 - 1,336 BBA/BCA $M 385 155 - - - 541 Delta $M - (300) (397) (99) - (796)
Budget Line Item = "Stryker Vehicle" Light Utility Helicopter (LUH) Light Utility Helicopter investments and procurement quantities are shown in Figure 4-7. PB15 fully funds the procurement of the aircraft needed to replace the Army legacy single engine training fleet. At the BCA level, the Army National Guard would be required to transfer 45 aircraft to the Active Component training establishment and there would be insufficient funds to replace them.
Figure 4-7. LUH
Position Units FY 2015 FY 2016 FY 2017 FY 2018 FY 2019 FYDPPB15 $M 417 388 - - - 804 BBA/BCA $M 417 - - - - 417 Delta $M - (388) - - - (388) PB15 Procurement Qty 55 45 - - - 100 BBA/BCA Procurement Qty 55 - - - - 55 Delta Procurement Qty - (45) - - - (45)
Budget Line Item = "Helicopter, Light Utility (LUH)"
Estimated Impacts of Sequestration-Level Funding – FY 2015 Defense Budget
CHAPTER 4 MODERNIZATION IMPACTS 4-5
MARINE CORPS
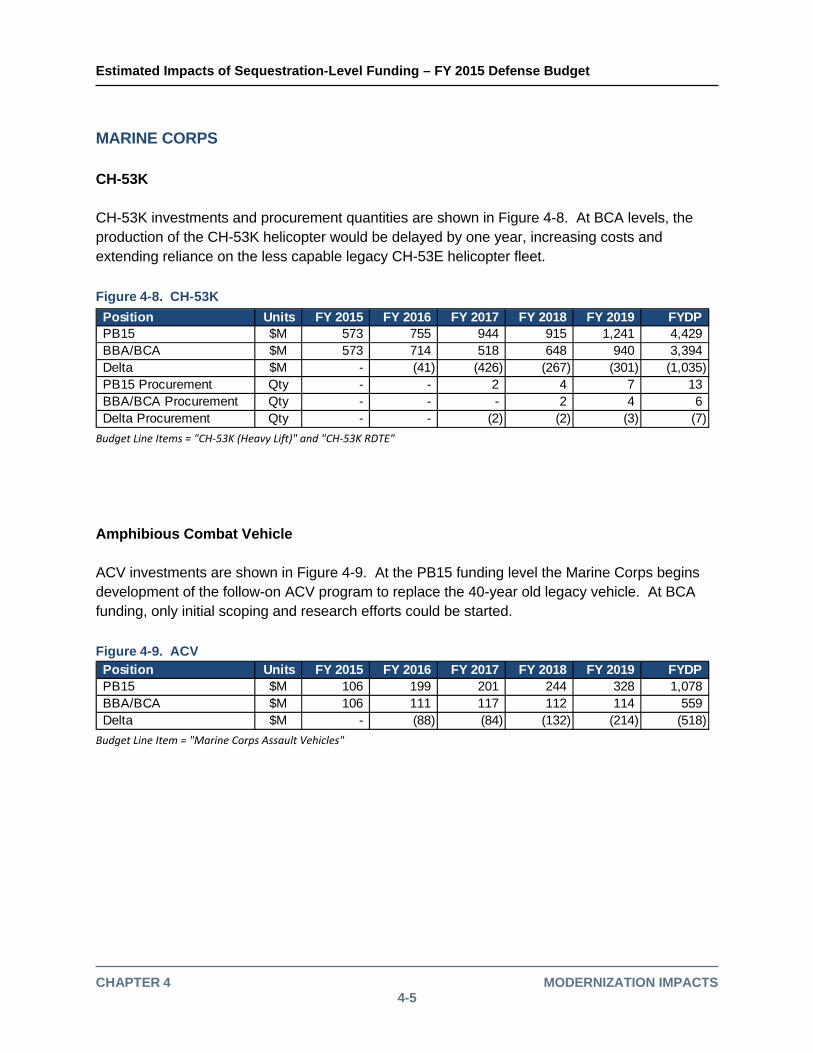
CH-53K CH-53K investments and procurement quantities are shown in Figure 4-8. At BCA levels, the production of the CH-53K helicopter would be delayed by one year, increasing costs and extending reliance on the less capable legacy CH-53E helicopter fleet. Figure 4-8. CH-53K
Position Units FY 2015 FY 2016 FY 2017 FY 2018 FY 2019 FYDPPB15 $M 573 755 944 915 1,241 4,429 BBA/BCA $M 573 714 518 648 940 3,394 Delta $M - (41) (426) (267) (301) (1,035) PB15 Procurement Qty - - 2 4 7 13 BBA/BCA Procurement Qty - - - 2 4 6 Delta Procurement Qty - - (2) (2) (3) (7)
Budget Line Items = "CH‐53K (Heavy Lift)" and "CH‐53K RDTE" Amphibious Combat Vehicle ACV investments are shown in Figure 4-9. At the PB15 funding level the Marine Corps begins development of the follow-on ACV program to replace the 40-year old legacy vehicle. At BCA funding, only initial scoping and research efforts could be started. Figure 4-9. ACV Position Units FY 2015 FY 2016 FY 2017 FY 2018 FY 2019 FYDPPB15 $M 106 199 201 244 328 1,078 BBA/BCA $M 106 111 117 112 114 559 Delta $M - (88) (84) (132) (214) (518)
Budget Line Item = "Marine Corps Assault Vehicles"
Estimated Impacts of Sequestration-Level Funding – FY 2015 Defense Budget
CHAPTER 4 MODERNIZATION IMPACTS 4-6
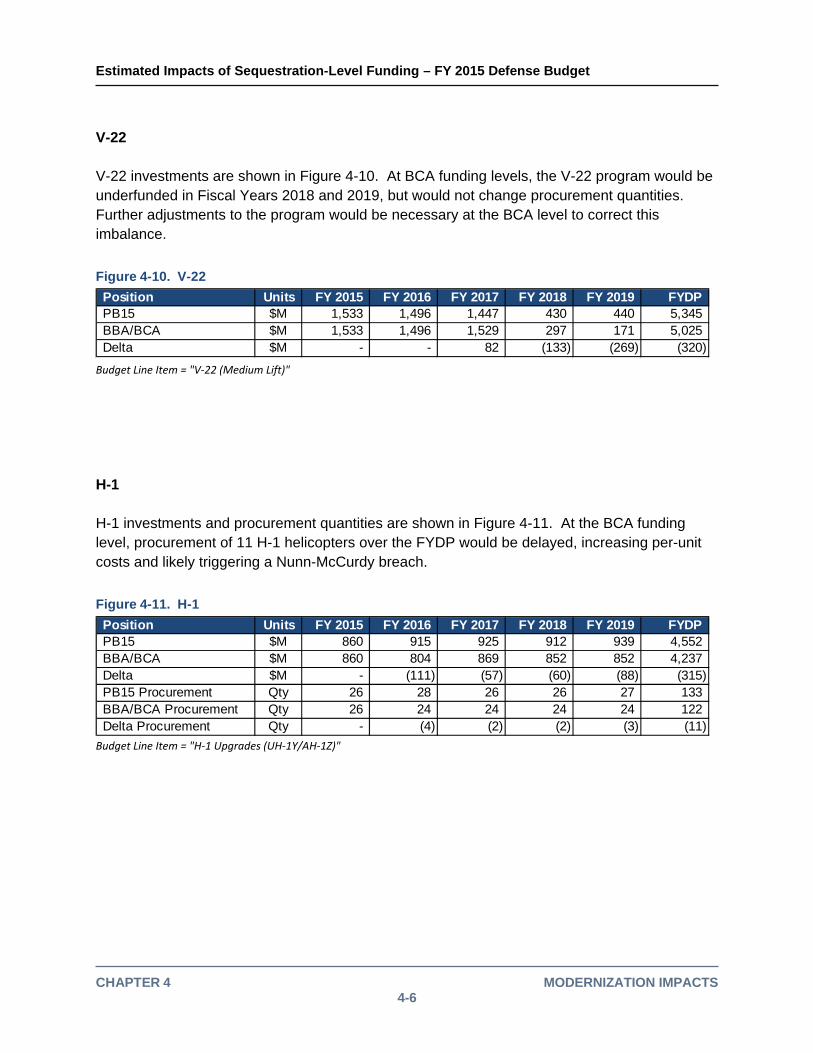
V-22 V-22 investments are shown in Figure 4-10. At BCA funding levels, the V-22 program would be underfunded in Fiscal Years 2018 and 2019, but would not change procurement quantities. Further adjustments to the program would be necessary at the BCA level to correct this imbalance.
Figure 4-10. V-22
Position Units FY 2015 FY 2016 FY 2017 FY 2018 FY 2019 FYDPPB15 $M 1,533 1,496 1,447 430 440 5,345 BBA/BCA $M 1,533 1,496 1,529 297 171 5,025 Delta $M - - 82 (133) (269) (320)
Budget Line Item = "V‐22 (Medium Lift)"
H-1 H-1 investments and procurement quantities are shown in Figure 4-11. At the BCA funding level, procurement of 11 H-1 helicopters over the FYDP would be delayed, increasing per-unit costs and likely triggering a Nunn-McCurdy breach.
Figure 4-11. H-1
Position Units FY 2015 FY 2016 FY 2017 FY 2018 FY 2019 FYDPPB15 $M 860 915 925 912 939 4,552 BBA/BCA $M 860 804 869 852 852 4,237 Delta $M - (111) (57) (60) (88) (315) PB15 Procurement Qty 26 28 26 26 27 133 BBA/BCA Procurement Qty 26 24 24 24 24 122 Delta Procurement Qty - (4) (2) (2) (3) (11)
Budget Line Item = "H‐1 Upgrades (UH‐1Y/AH‐1Z)"
Estimated Impacts of Sequestration-Level Funding – FY 2015 Defense Budget
CHAPTER 4 MODERNIZATION IMPACTS 4-7
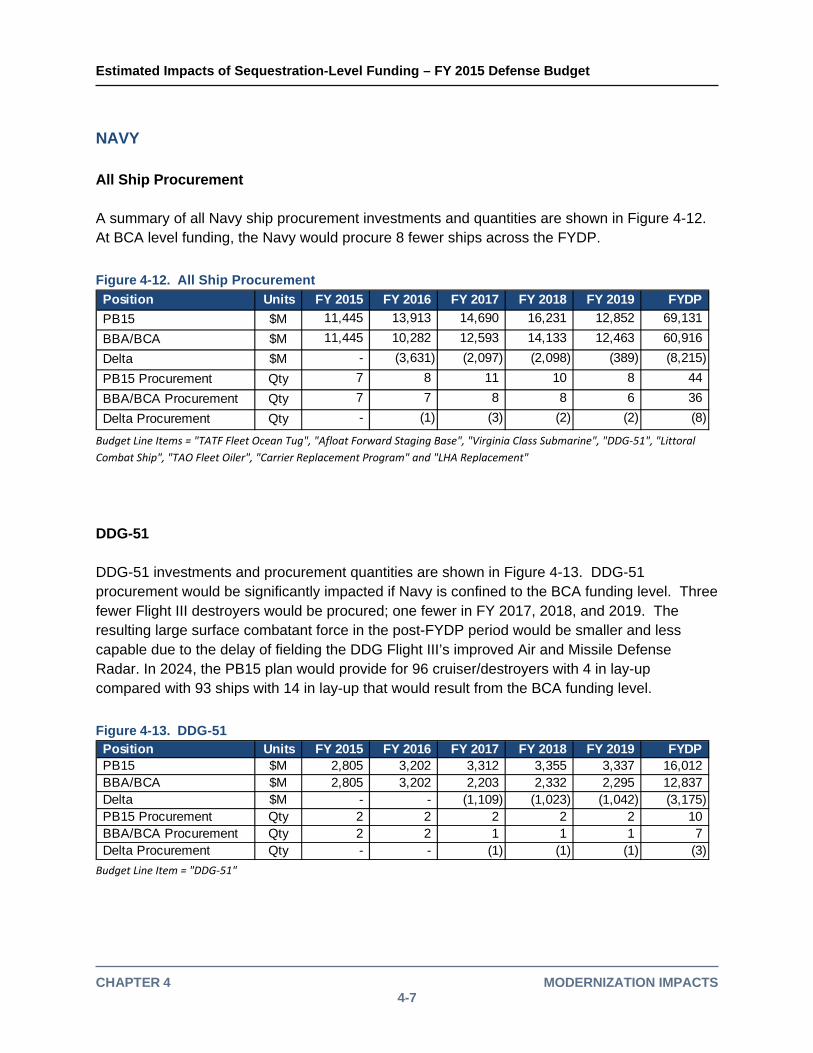
NAVY All Ship Procurement A summary of all Navy ship procurement investments and quantities are shown in Figure 4-12. At BCA level funding, the Navy would procure 8 fewer ships across the FYDP.
Figure 4-12. All Ship Procurement
Position Units FY 2015 FY 2016 FY 2017 FY 2018 FY 2019 FYDP
PB15 $M 11,445 13,913 14,690 16,231 12,852 69,131
BBA/BCA $M 11,445 10,282 12,593 14,133 12,463 60,916
Delta $M - (3,631) (2,097) (2,098) (389) (8,215)
PB15 Procurement Qty 7 8 11 10 8 44
BBA/BCA Procurement Qty 7 7 8 8 6 36
Delta Procurement Qty - (1) (3) (2) (2) (8) Budget Line Items = "TATF Fleet Ocean Tug", "Afloat Forward Staging Base", "Virginia Class Submarine", "DDG‐51", "Littoral
Combat Ship", "TAO Fleet Oiler", "Carrier Replacement Program" and "LHA Replacement" DDG-51 DDG-51 investments and procurement quantities are shown in Figure 4-13. DDG-51 procurement would be significantly impacted if Navy is confined to the BCA funding level. Three fewer Flight III destroyers would be procured; one fewer in FY 2017, 2018, and 2019. The resulting large surface combatant force in the post-FYDP period would be smaller and less capable due to the delay of fielding the DDG Flight III’s improved Air and Missile Defense Radar. In 2024, the PB15 plan would provide for 96 cruiser/destroyers with 4 in lay-up compared with 93 ships with 14 in lay-up that would result from the BCA funding level.
Figure 4-13. DDG-51 Position Units FY 2015 FY 2016 FY 2017 FY 2018 FY 2019 FYDPPB15 $M 2,805 3,202 3,312 3,355 3,337 16,012 BBA/BCA $M 2,805 3,202 2,203 2,332 2,295 12,837 Delta $M - - (1,109) (1,023) (1,042) (3,175) PB15 Procurement Qty 2 2 2 2 2 10 BBA/BCA Procurement Qty 2 2 1 1 1 7 Delta Procurement Qty - - (1) (1) (1) (3)
Budget Line Item = "DDG‐51"
Estimated Impacts of Sequestration-Level Funding – FY 2015 Defense Budget
CHAPTER 4 MODERNIZATION IMPACTS 4-8
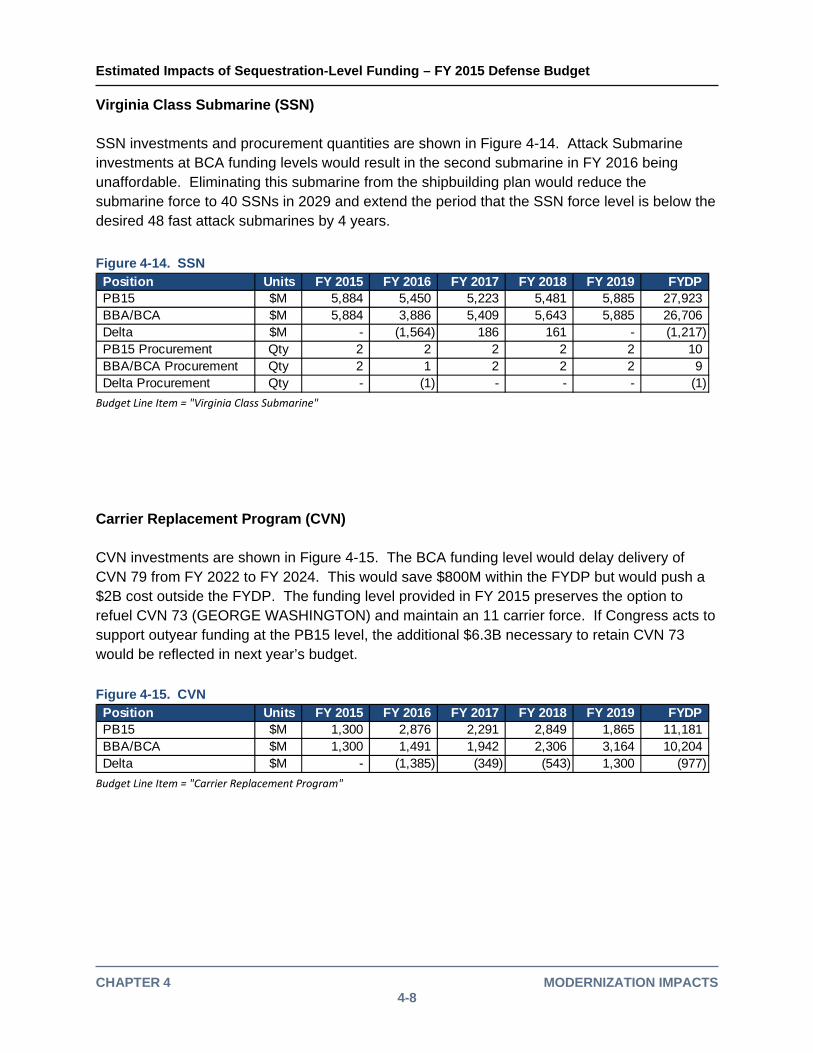
Virginia Class Submarine (SSN) SSN investments and procurement quantities are shown in Figure 4-14. Attack Submarine investments at BCA funding levels would result in the second submarine in FY 2016 being unaffordable. Eliminating this submarine from the shipbuilding plan would reduce the submarine force to 40 SSNs in 2029 and extend the period that the SSN force level is below the desired 48 fast attack submarines by 4 years.
Figure 4-14. SSN Position Units FY 2015 FY 2016 FY 2017 FY 2018 FY 2019 FYDPPB15 $M 5,884 5,450 5,223 5,481 5,885 27,923 BBA/BCA $M 5,884 3,886 5,409 5,643 5,885 26,706 Delta $M - (1,564) 186 161 - (1,217) PB15 Procurement Qty 2 2 2 2 2 10 BBA/BCA Procurement Qty 2 1 2 2 2 9 Delta Procurement Qty - (1) - - - (1)
Budget Line Item = "Virginia Class Submarine"
Carrier Replacement Program (CVN) CVN investments are shown in Figure 4-15. The BCA funding level would delay delivery of CVN 79 from FY 2022 to FY 2024. This would save $800M within the FYDP but would push a $2B cost outside the FYDP. The funding level provided in FY 2015 preserves the option to refuel CVN 73 (GEORGE WASHINGTON) and maintain an 11 carrier force. If Congress acts to support outyear funding at the PB15 level, the additional $6.3B necessary to retain CVN 73 would be reflected in next year’s budget. Figure 4-15. CVN Position Units FY 2015 FY 2016 FY 2017 FY 2018 FY 2019 FYDPPB15 $M 1,300 2,876 2,291 2,849 1,865 11,181 BBA/BCA $M 1,300 1,491 1,942 2,306 3,164 10,204 Delta $M - (1,385) (349) (543) 1,300 (977)
Budget Line Item = "Carrier Replacement Program"
Estimated Impacts of Sequestration-Level Funding – FY 2015 Defense Budget
CHAPTER 4 MODERNIZATION IMPACTS 4-9
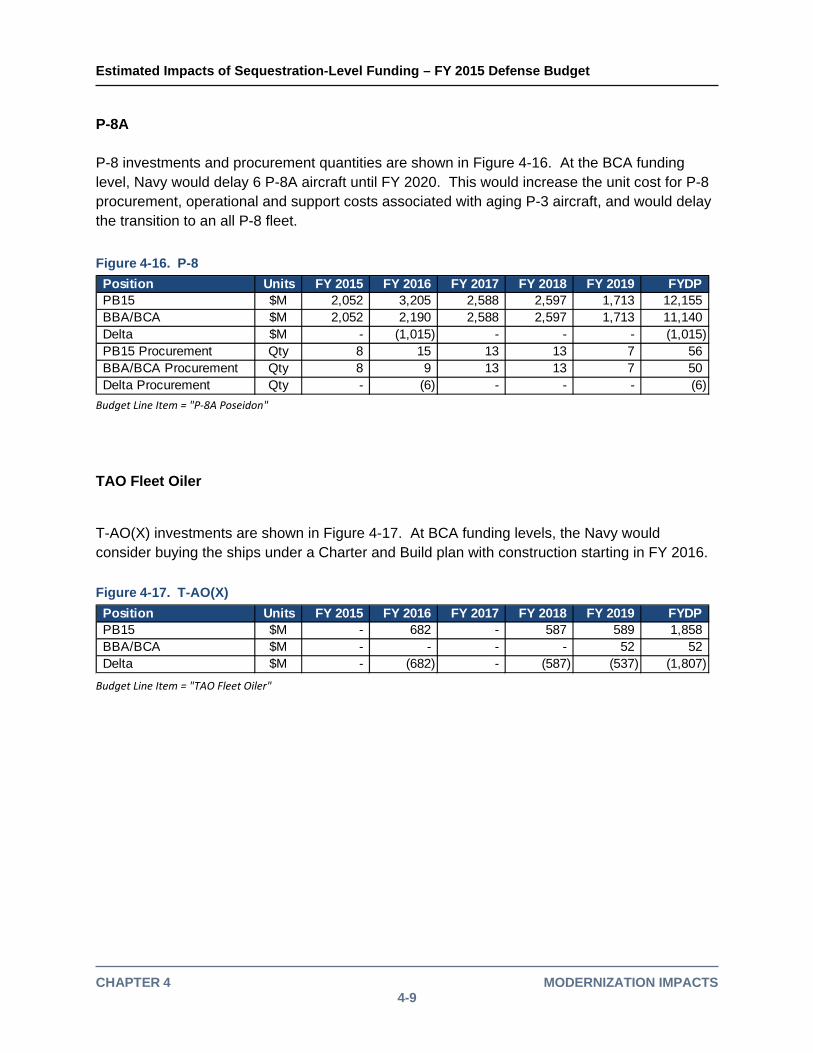
P-8A P-8 investments and procurement quantities are shown in Figure 4-16. At the BCA funding level, Navy would delay 6 P-8A aircraft until FY 2020. This would increase the unit cost for P-8 procurement, operational and support costs associated with aging P-3 aircraft, and would delay the transition to an all P-8 fleet.
Figure 4-16. P-8
Position Units FY 2015 FY 2016 FY 2017 FY 2018 FY 2019 FYDPPB15 $M 2,052 3,205 2,588 2,597 1,713 12,155 BBA/BCA $M 2,052 2,190 2,588 2,597 1,713 11,140 Delta $M - (1,015) - - - (1,015) PB15 Procurement Qty 8 15 13 13 7 56 BBA/BCA Procurement Qty 8 9 13 13 7 50 Delta Procurement Qty - (6) - - - (6)
Budget Line Item = "P‐8A Poseidon" TAO Fleet Oiler
T-AO(X) investments are shown in Figure 4-17. At BCA funding levels, the Navy would consider buying the ships under a Charter and Build plan with construction starting in FY 2016. Figure 4-17. T-AO(X)
Position Units FY 2015 FY 2016 FY 2017 FY 2018 FY 2019 FYDPPB15 $M - 682 - 587 589 1,858 BBA/BCA $M - - - - 52 52 Delta $M - (682) - (587) (537) (1,807)
Budget Line Item = "TAO Fleet Oiler"
Estimated Impacts of Sequestration-Level Funding – FY 2015 Defense Budget
CHAPTER 4 MODERNIZATION IMPACTS 4-10
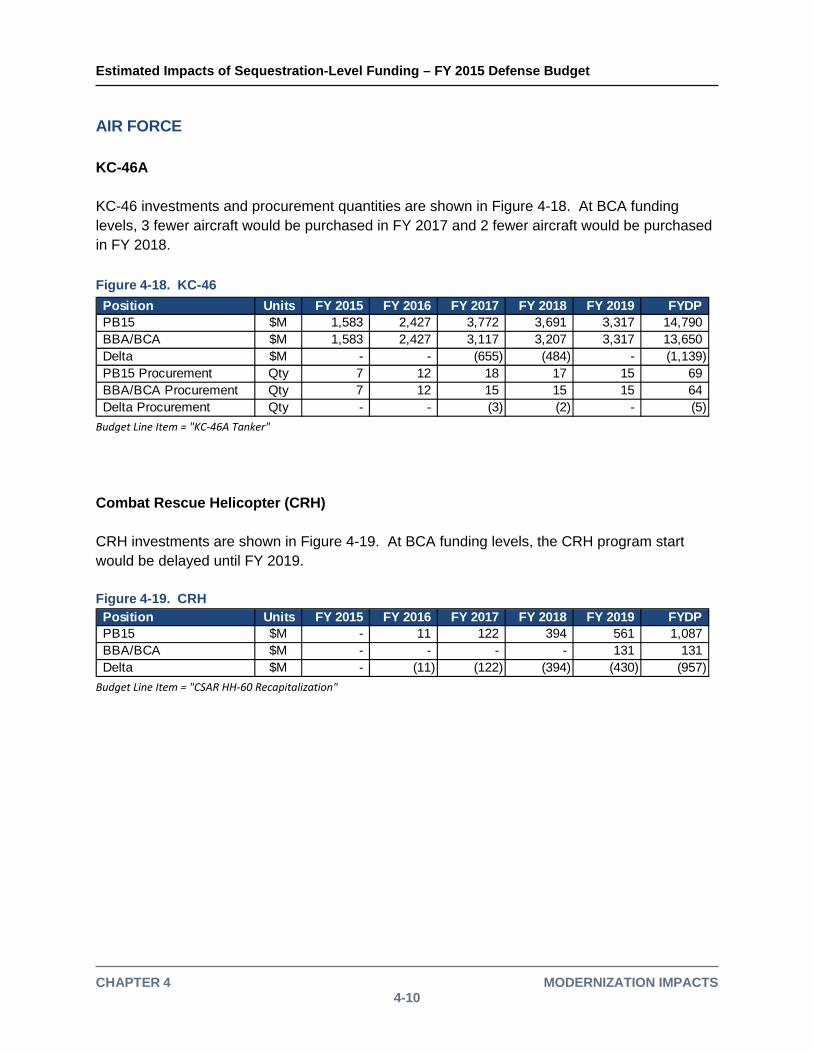
AIR FORCE KC-46A KC-46 investments and procurement quantities are shown in Figure 4-18. At BCA funding levels, 3 fewer aircraft would be purchased in FY 2017 and 2 fewer aircraft would be purchased in FY 2018. Figure 4-18. KC-46
Position Units FY 2015 FY 2016 FY 2017 FY 2018 FY 2019 FYDPPB15 $M 1,583 2,427 3,772 3,691 3,317 14,790 BBA/BCA $M 1,583 2,427 3,117 3,207 3,317 13,650 Delta $M - - (655) (484) - (1,139) PB15 Procurement Qty 7 12 18 17 15 69 BBA/BCA Procurement Qty 7 12 15 15 15 64 Delta Procurement Qty - - (3) (2) - (5)
Budget Line Item = "KC‐46A Tanker" Combat Rescue Helicopter (CRH) CRH investments are shown in Figure 4-19. At BCA funding levels, the CRH program start would be delayed until FY 2019. Figure 4-19. CRH Position Units FY 2015 FY 2016 FY 2017 FY 2018 FY 2019 FYDPPB15 $M - 11 122 394 561 1,087 BBA/BCA $M - - - - 131 131 Delta $M - (11) (122) (394) (430) (957)
Budget Line Item = "CSAR HH‐60 Recapitalization"
Estimated Impacts of Sequestration-Level Funding – FY 2015 Defense Budget
CHAPTER 4 MODERNIZATION IMPACTS 4-11
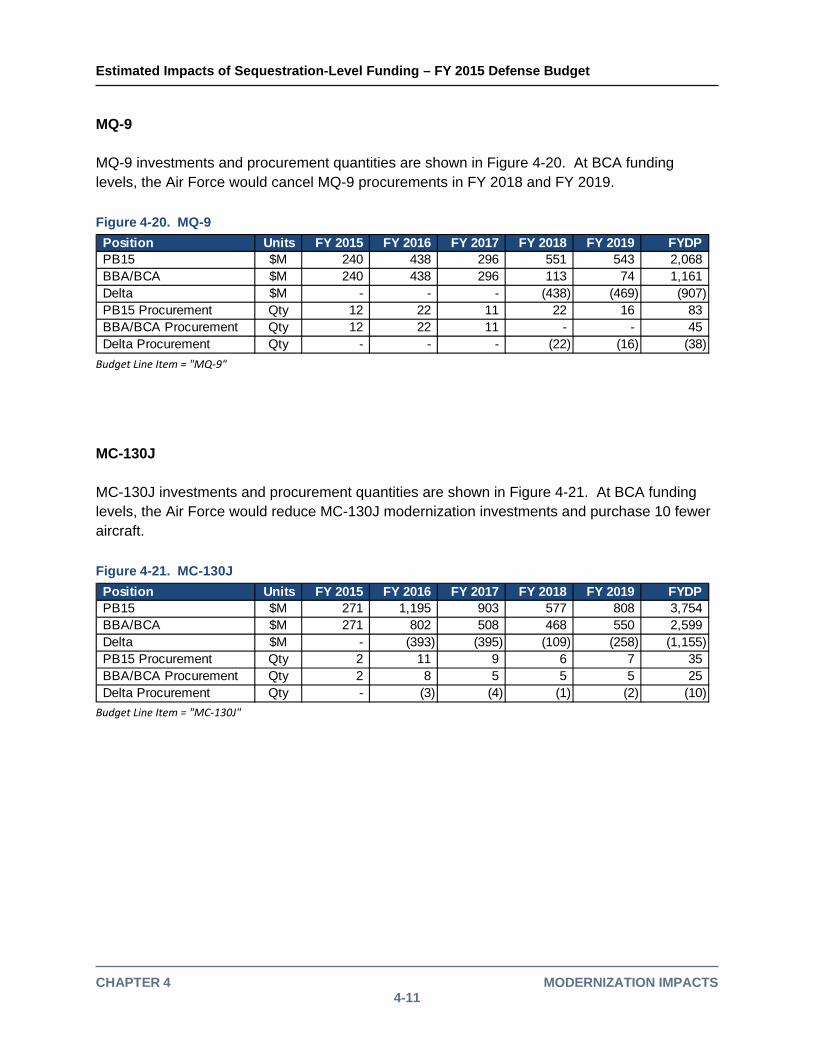
MQ-9 MQ-9 investments and procurement quantities are shown in Figure 4-20. At BCA funding levels, the Air Force would cancel MQ-9 procurements in FY 2018 and FY 2019. Figure 4-20. MQ-9
Position Units FY 2015 FY 2016 FY 2017 FY 2018 FY 2019 FYDPPB15 $M 240 438 296 551 543 2,068 BBA/BCA $M 240 438 296 113 74 1,161 Delta $M - - - (438) (469) (907) PB15 Procurement Qty 12 22 11 22 16 83 BBA/BCA Procurement Qty 12 22 11 - - 45 Delta Procurement Qty - - - (22) (16) (38)
Budget Line Item = "MQ‐9"
MC-130J MC-130J investments and procurement quantities are shown in Figure 4-21. At BCA funding levels, the Air Force would reduce MC-130J modernization investments and purchase 10 fewer aircraft. Figure 4-21. MC-130J
Position Units FY 2015 FY 2016 FY 2017 FY 2018 FY 2019 FYDPPB15 $M 271 1,195 903 577 808 3,754 BBA/BCA $M 271 802 508 468 550 2,599 Delta $M - (393) (395) (109) (258) (1,155) PB15 Procurement Qty 2 11 9 6 7 35 BBA/BCA Procurement Qty 2 8 5 5 5 25 Delta Procurement Qty - (3) (4) (1) (2) (10)
Budget Line Item = "MC‐130J"
Estimated Impacts of Sequestration-Level Funding – FY 2015 Defense Budget
CHAPTER 4 MODERNIZATION IMPACTS 4-12
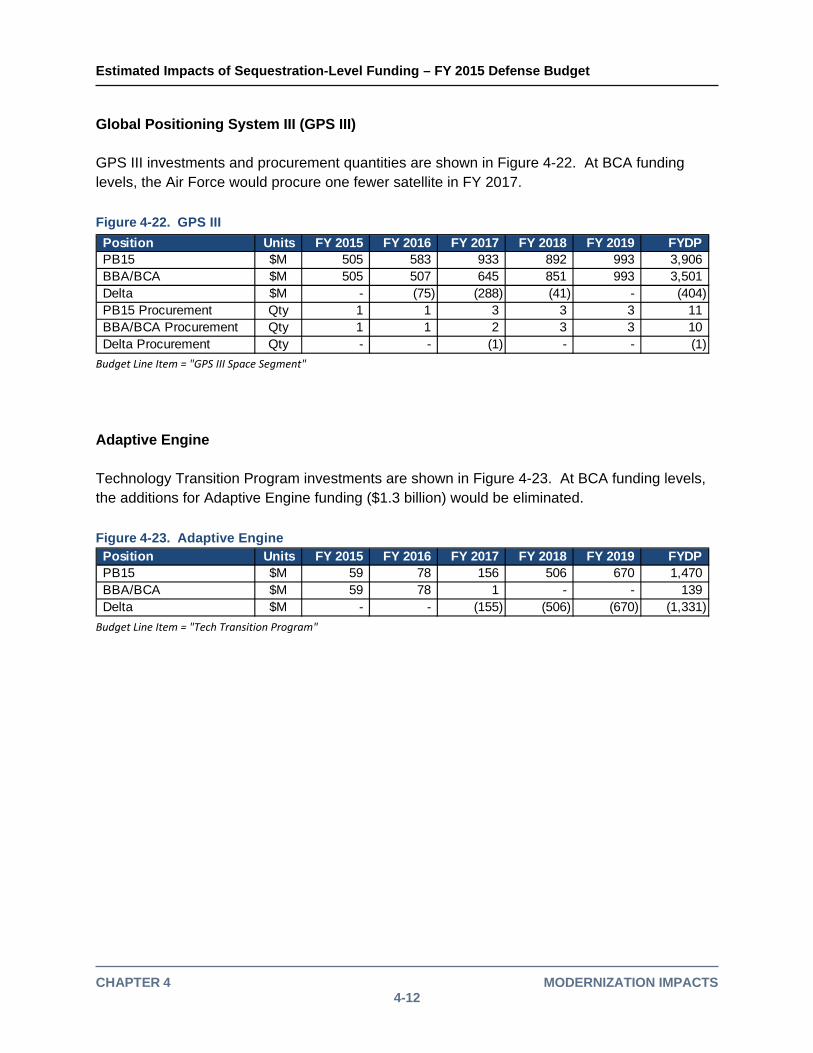
Global Positioning System III (GPS III) GPS III investments and procurement quantities are shown in Figure 4-22. At BCA funding levels, the Air Force would procure one fewer satellite in FY 2017. Figure 4-22. GPS III
Position Units FY 2015 FY 2016 FY 2017 FY 2018 FY 2019 FYDPPB15 $M 505 583 933 892 993 3,906 BBA/BCA $M 505 507 645 851 993 3,501 Delta $M - (75) (288) (41) - (404) PB15 Procurement Qty 1 1 3 3 3 11 BBA/BCA Procurement Qty 1 1 2 3 3 10 Delta Procurement Qty - - (1) - - (1)
Budget Line Item = "GPS III Space Segment" Adaptive Engine Technology Transition Program investments are shown in Figure 4-23. At BCA funding levels, the additions for Adaptive Engine funding ($1.3 billion) would be eliminated. Figure 4-23. Adaptive Engine Position Units FY 2015 FY 2016 FY 2017 FY 2018 FY 2019 FYDPPB15 $M 59 78 156 506 670 1,470 BBA/BCA $M 59 78 1 - - 139 Delta $M - - (155) (506) (670) (1,331)
Budget Line Item = "Tech Transition Program"
Estimated Impacts of Sequestration-Level Funding – FY 2015 Defense Budget
CHAPTER 4 MODERNIZATION IMPACTS 4-13
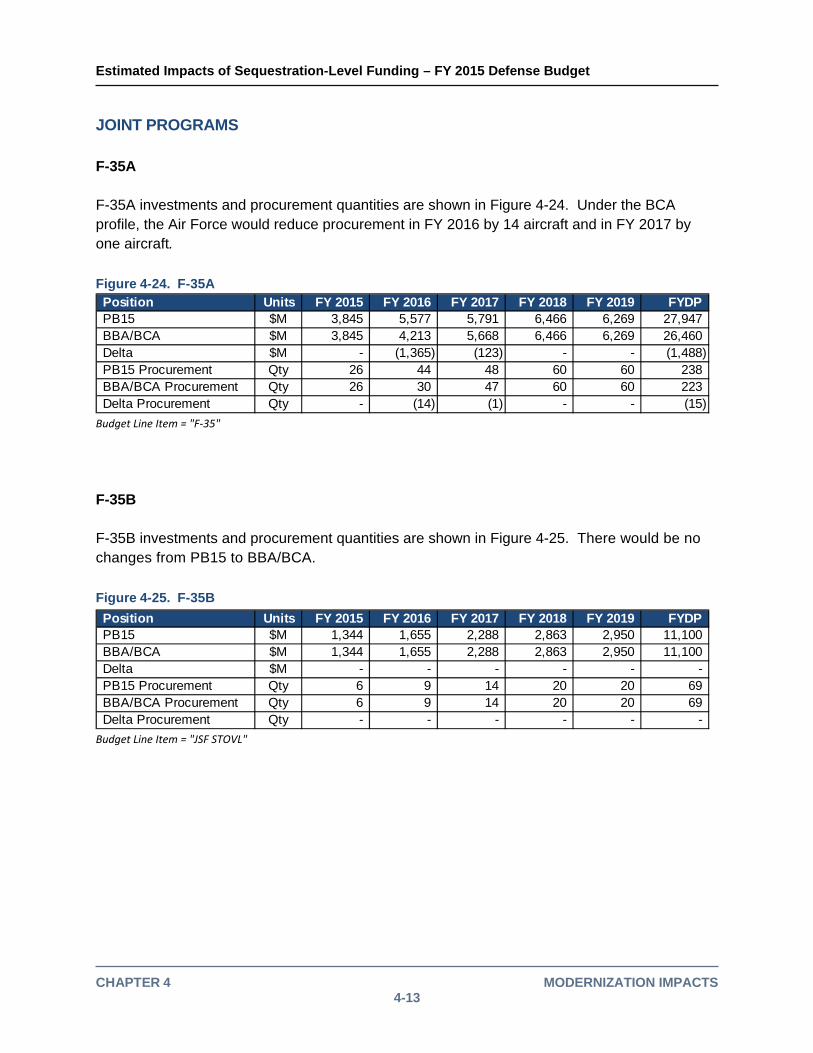
JOINT PROGRAMS F-35A F-35A investments and procurement quantities are shown in Figure 4-24. Under the BCA profile, the Air Force would reduce procurement in FY 2016 by 14 aircraft and in FY 2017 by one aircraft. Figure 4-24. F-35A Position Units FY 2015 FY 2016 FY 2017 FY 2018 FY 2019 FYDPPB15 $M 3,845 5,577 5,791 6,466 6,269 27,947 BBA/BCA $M 3,845 4,213 5,668 6,466 6,269 26,460 Delta $M - (1,365) (123) - - (1,488) PB15 Procurement Qty 26 44 48 60 60 238 BBA/BCA Procurement Qty 26 30 47 60 60 223 Delta Procurement Qty - (14) (1) - - (15)
Budget Line Item = "F‐35" F-35B F-35B investments and procurement quantities are shown in Figure 4-25. There would be no changes from PB15 to BBA/BCA.
Figure 4-25. F-35B
Position Units FY 2015 FY 2016 FY 2017 FY 2018 FY 2019 FYDPPB15 $M 1,344 1,655 2,288 2,863 2,950 11,100 BBA/BCA $M 1,344 1,655 2,288 2,863 2,950 11,100 Delta $M - - - - - - PB15 Procurement Qty 6 9 14 20 20 69 BBA/BCA Procurement Qty 6 9 14 20 20 69 Delta Procurement Qty - - - - - -
Budget Line Item = "JSF STOVL"
Estimated Impacts of Sequestration-Level Funding – FY 2015 Defense Budget
CHAPTER 4 MODERNIZATION IMPACTS 4-14
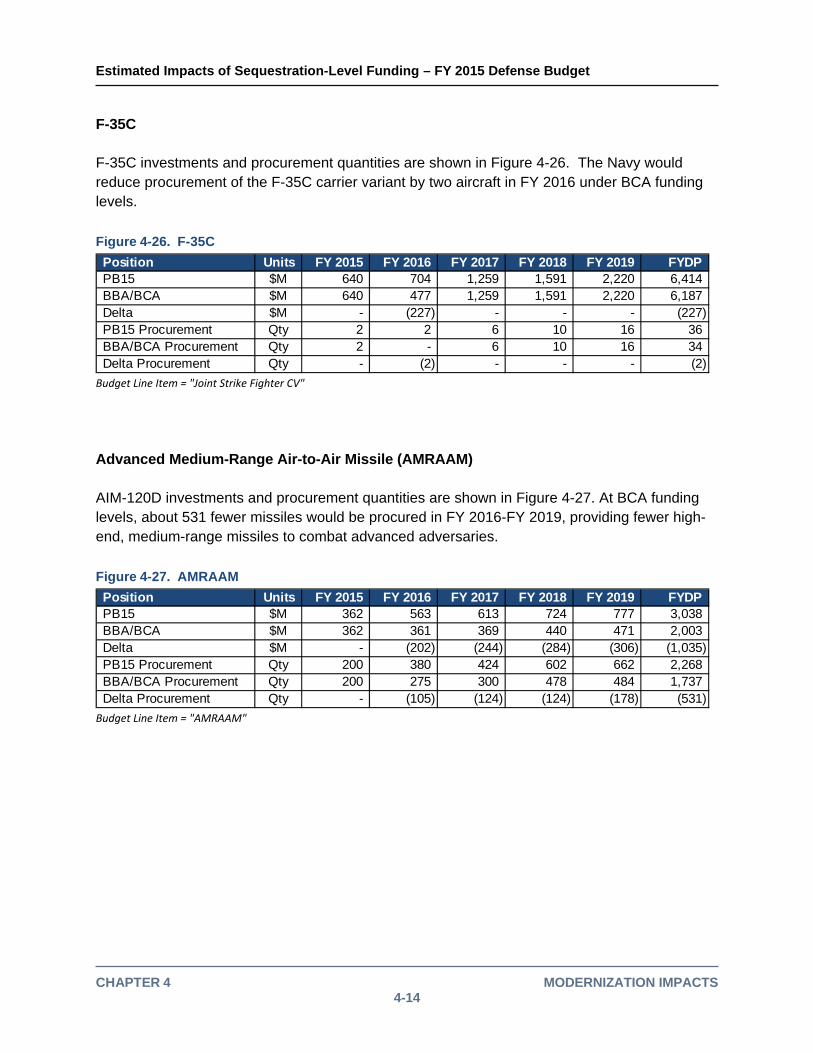
F-35C F-35C investments and procurement quantities are shown in Figure 4-26. The Navy would reduce procurement of the F-35C carrier variant by two aircraft in FY 2016 under BCA funding levels. Figure 4-26. F-35C
Position Units FY 2015 FY 2016 FY 2017 FY 2018 FY 2019 FYDPPB15 $M 640 704 1,259 1,591 2,220 6,414 BBA/BCA $M 640 477 1,259 1,591 2,220 6,187 Delta $M - (227) - - - (227) PB15 Procurement Qty 2 2 6 10 16 36 BBA/BCA Procurement Qty 2 - 6 10 16 34 Delta Procurement Qty - (2) - - - (2)
Budget Line Item = "Joint Strike Fighter CV" Advanced Medium-Range Air-to-Air Missile (AMRAAM) AIM-120D investments and procurement quantities are shown in Figure 4-27. At BCA funding levels, about 531 fewer missiles would be procured in FY 2016-FY 2019, providing fewer high-end, medium-range missiles to combat advanced adversaries. Figure 4-27. AMRAAM
Position Units FY 2015 FY 2016 FY 2017 FY 2018 FY 2019 FYDPPB15 $M 362 563 613 724 777 3,038 BBA/BCA $M 362 361 369 440 471 2,003 Delta $M - (202) (244) (284) (306) (1,035) PB15 Procurement Qty 200 380 424 602 662 2,268 BBA/BCA Procurement Qty 200 275 300 478 484 1,737 Delta Procurement Qty - (105) (124) (124) (178) (531)
Budget Line Item = "AMRAAM"
Estimated Impacts of Sequestration-Level Funding – FY 2015 Defense Budget
CHAPTER 4 MODERNIZATION IMPACTS 4-15
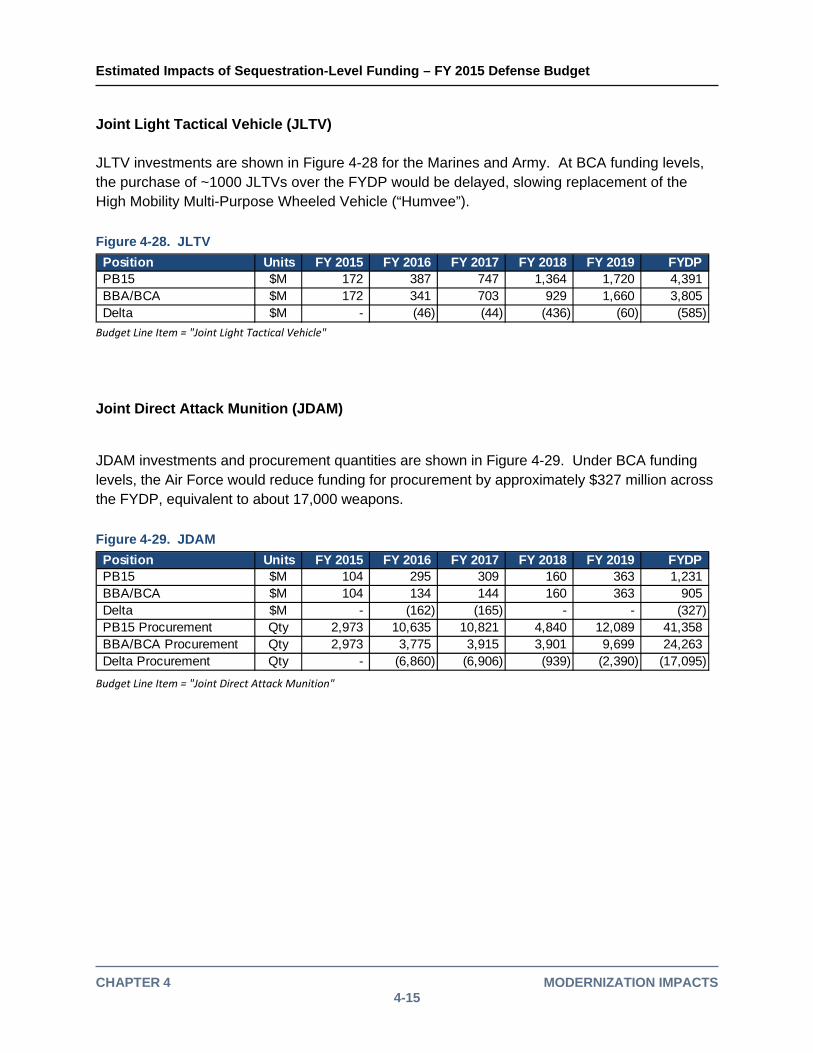
Joint Light Tactical Vehicle (JLTV) JLTV investments are shown in Figure 4-28 for the Marines and Army. At BCA funding levels, the purchase of ~1000 JLTVs over the FYDP would be delayed, slowing replacement of the High Mobility Multi-Purpose Wheeled Vehicle (“Humvee”). Figure 4-28. JLTV
Position Units FY 2015 FY 2016 FY 2017 FY 2018 FY 2019 FYDPPB15 $M 172 387 747 1,364 1,720 4,391 BBA/BCA $M 172 341 703 929 1,660 3,805 Delta $M - (46) (44) (436) (60) (585)
Budget Line Item = "Joint Light Tactical Vehicle" Joint Direct Attack Munition (JDAM)
JDAM investments and procurement quantities are shown in Figure 4-29. Under BCA funding levels, the Air Force would reduce funding for procurement by approximately $327 million across the FYDP, equivalent to about 17,000 weapons. Figure 4-29. JDAM
Position Units FY 2015 FY 2016 FY 2017 FY 2018 FY 2019 FYDPPB15 $M 104 295 309 160 363 1,231 BBA/BCA $M 104 134 144 160 363 905 Delta $M - (162) (165) - - (327) PB15 Procurement Qty 2,973 10,635 10,821 4,840 12,089 41,358 BBA/BCA Procurement Qty 2,973 3,775 3,915 3,901 9,699 24,263 Delta Procurement Qty - (6,860) (6,906) (939) (2,390) (17,095)
Budget Line Item = "Joint Direct Attack Munition"

Estimated Impacts of Sequestration-Level Funding – FY 2015 Defense Budget
CHAPTER 4 MODERNIZATION IMPACTS 4-16
MISSILE DEFENSE Interceptor Follow-on Ballistic Missile Defense Midcourse Defense Segment investments are shown in Figure 4-30. Under the BCA profile, an interceptor follow-on effort would not be funded. Figure 4-30. Interceptor Follow-on Position Units FY 2015 FY 2016 FY 2017 FY 2018 FY 2019 FYDPPB15 $M 1,004 1,131 938 691 628 4,392 BBA/BCA $M 1,004 867 665 602 615 3,753 Delta $M - (264) (273) (89) (13) (639)
Budget Line Item = "Ballistic Missile Defense Midcourse Defense Segment" Additional Ground-Based Sensor Ballistic Missile Defense Sensor investments are shown in Figure 4-31. Under the BCA profile, an additional ground-based sensor would not be funded. Figure 4-31. Additional Ground-Based Sensor Position Units FY 2015 FY 2016 FY 2017 FY 2018 FY 2019 FYDPPB15 $M 393 462 449 403 368 2,075 BBA/BCA $M 393 336 297 258 236 1,519 Delta $M - (126) (152) (145) (132) (556)
Budget Line Item = "Ballistic Missile Defense Sensors"
Estimated Impacts of Sequestration-Level Funding – FY 2015 Defense Budget
CHAPTER 5 OPERATION AND MAINTENANCE (O&M) IMPACTS 5-1
5. OPERATION AND MAINTENANCE (O&M) IMPACTS
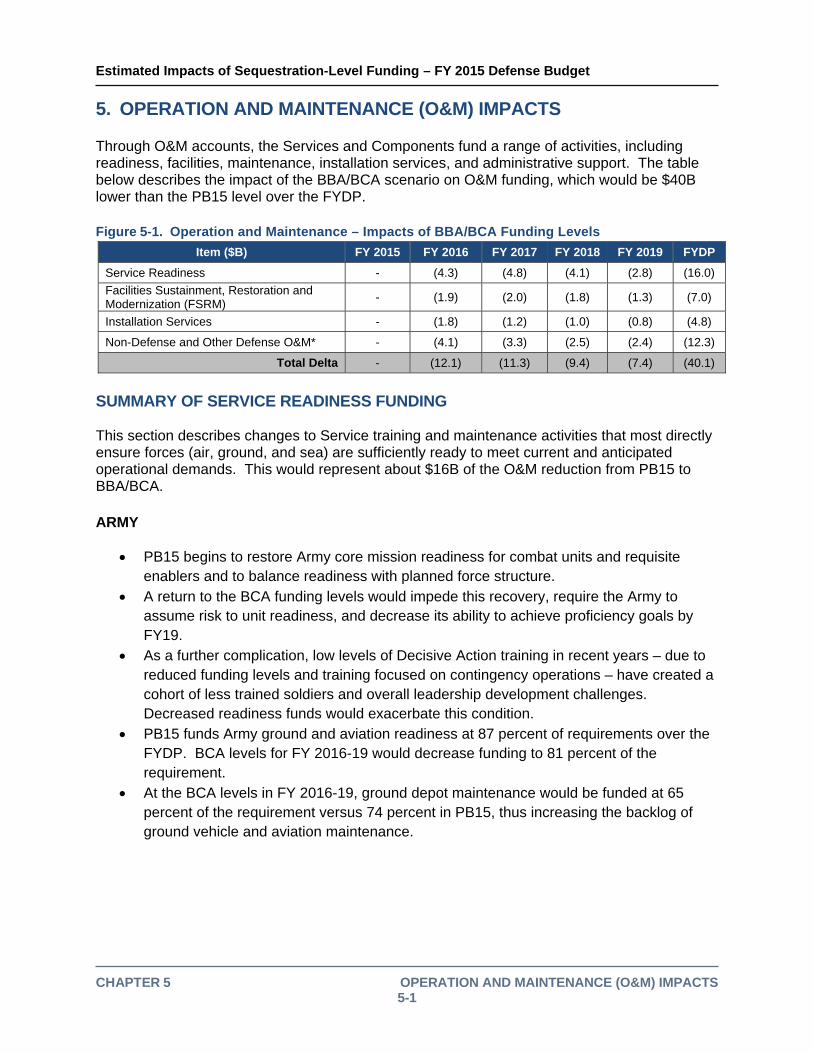
Through O&M accounts, the Services and Components fund a range of activities, including readiness, facilities, maintenance, installation services, and administrative support. The table below describes the impact of the BBA/BCA scenario on O&M funding, which would be $40B lower than the PB15 level over the FYDP. Figure 5-1. Operation and Maintenance – Impacts of BBA/BCA Funding Levels
Item ($B) FY 2015 FY 2016 FY 2017 FY 2018 FY 2019 FYDP
Service Readiness - (4.3) (4.8) (4.1) (2.8) (16.0)
Facilities Sustainment, Restoration and Modernization (FSRM)
- (1.9) (2.0) (1.8) (1.3) (7.0)
Installation Services - (1.8) (1.2) (1.0) (0.8) (4.8)
Non-Defense and Other Defense O&M* - (4.1) (3.3) (2.5) (2.4) (12.3)
Total Delta - (12.1) (11.3) (9.4) (7.4) (40.1)
SUMMARY OF SERVICE READINESS FUNDING This section describes changes to Service training and maintenance activities that most directly ensure forces (air, ground, and sea) are sufficiently ready to meet current and anticipated operational demands. This would represent about $16B of the O&M reduction from PB15 to BBA/BCA. ARMY
PB15 begins to restore Army core mission readiness for combat units and requisite enablers and to balance readiness with planned force structure.
A return to the BCA funding levels would impede this recovery, require the Army to assume risk to unit readiness, and decrease its ability to achieve proficiency goals by FY19.
As a further complication, low levels of Decisive Action training in recent years – due to reduced funding levels and training focused on contingency operations – have created a cohort of less trained soldiers and overall leadership development challenges. Decreased readiness funds would exacerbate this condition.
PB15 funds Army ground and aviation readiness at 87 percent of requirements over the FYDP. BCA levels for FY 2016-19 would decrease funding to 81 percent of the requirement.
At the BCA levels in FY 2016-19, ground depot maintenance would be funded at 65 percent of the requirement versus 74 percent in PB15, thus increasing the backlog of ground vehicle and aviation maintenance.
Estimated Impacts of Sequestration-Level Funding – FY 2015 Defense Budget
CHAPTER 5 OPERATION AND MAINTENANCE (O&M) IMPACTS 5-2
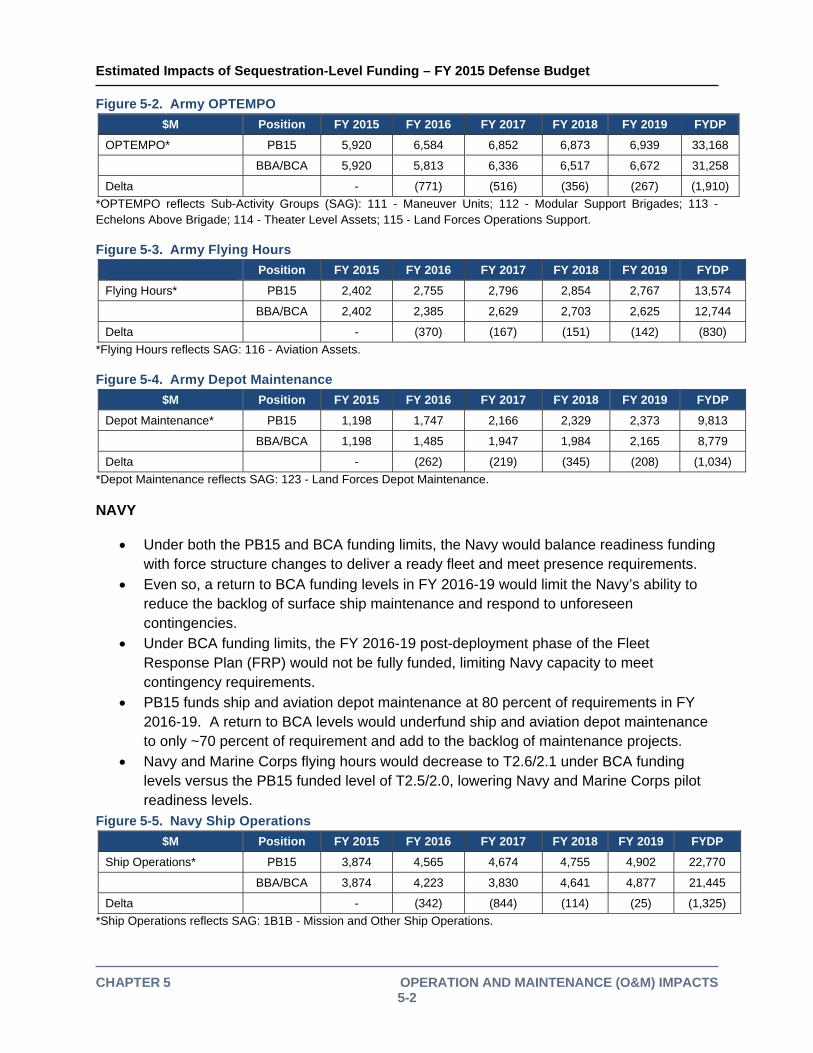
Figure 5-2. Army OPTEMPO
$M Position FY 2015 FY 2016 FY 2017 FY 2018 FY 2019 FYDP
OPTEMPO* PB15 5,920 6,584 6,852 6,873 6,939 33,168
BBA/BCA 5,920 5,813 6,336 6,517 6,672 31,258
Delta - (771) (516) (356) (267) (1,910)
*OPTEMPO reflects Sub-Activity Groups (SAG): 111 - Maneuver Units; 112 - Modular Support Brigades; 113 - Echelons Above Brigade; 114 - Theater Level Assets; 115 - Land Forces Operations Support.
Figure 5-3. Army Flying Hours
Position FY 2015 FY 2016 FY 2017 FY 2018 FY 2019 FYDP
Flying Hours* PB15 2,402 2,755 2,796 2,854 2,767 13,574
BBA/BCA 2,402 2,385 2,629 2,703 2,625 12,744
Delta - (370) (167) (151) (142) (830)
*Flying Hours reflects SAG: 116 - Aviation Assets.
Figure 5-4. Army Depot Maintenance
$M Position FY 2015 FY 2016 FY 2017 FY 2018 FY 2019 FYDP
Depot Maintenance* PB15 1,198 1,747 2,166 2,329 2,373 9,813
BBA/BCA 1,198 1,485 1,947 1,984 2,165 8,779
Delta - (262) (219) (345) (208) (1,034)
*Depot Maintenance reflects SAG: 123 - Land Forces Depot Maintenance.
NAVY
Under both the PB15 and BCA funding limits, the Navy would balance readiness funding with force structure changes to deliver a ready fleet and meet presence requirements.
Even so, a return to BCA funding levels in FY 2016-19 would limit the Navy’s ability to reduce the backlog of surface ship maintenance and respond to unforeseen contingencies.
Under BCA funding limits, the FY 2016-19 post-deployment phase of the Fleet Response Plan (FRP) would not be fully funded, limiting Navy capacity to meet contingency requirements.
PB15 funds ship and aviation depot maintenance at 80 percent of requirements in FY 2016-19. A return to BCA levels would underfund ship and aviation depot maintenance to only ~70 percent of requirement and add to the backlog of maintenance projects.
Navy and Marine Corps flying hours would decrease to T2.6/2.1 under BCA funding levels versus the PB15 funded level of T2.5/2.0, lowering Navy and Marine Corps pilot readiness levels.
Figure 5-5. Navy Ship Operations
$M Position FY 2015 FY 2016 FY 2017 FY 2018 FY 2019 FYDP
Ship Operations* PB15 3,874 4,565 4,674 4,755 4,902 22,770
BBA/BCA 3,874 4,223 3,830 4,641 4,877 21,445
Delta - (342) (844) (114) (25) (1,325)
*Ship Operations reflects SAG: 1B1B - Mission and Other Ship Operations.

Estimated Impacts of Sequestration-Level Funding – FY 2015 Defense Budget
CHAPTER 5 OPERATION AND MAINTENANCE (O&M) IMPACTS 5-3
Figure 5-6. Navy and Marine Corps Flying Hours
$M Position FY 2015 FY 2016 FY 2017 FY 2018 FY 2019 FYDP
Flying Hours* PB15 7,161 7,108 7,281 7,385 7,421 36,356
BBA/BCA 7,161 6,801 6,982 7,110 7,100 35,154
Delta - (307) (299) (275) (321) (1,202)
*Flying Hours reflects SAGs: 1A1A - Mission and Other Flight Operations; 1A2A - Fleet Air Mission.
Figure 5-7. Navy Ship Maintenance
$M Position FY 2015 FY 2016 FY 2017 FY 2018 FY 2019 FYDP
Ship Maintenance PB15 5,301 5,275 5,296 5,794 5,603 27,269
BBA/BCA 5,301 5,024 4,984 5,232 5,226 25,767
Delta - (251) (312) (562) (377) (1,502)
*Ship Maintenance reflects SAG: 1B4B - Ship Depot Maintenance.
Figure 5-8. Navy and Marine Corps Aviation Depot Maintenance
$M Position FY 2015 FY 2016 FY 2017 FY 2018 FY 2019 FYDP
Aviation Depot Maintenance
PB15 897 963 1,042 1,005 1,028 4,935
BBA/BCA 897 906 933 939 935 4,610
Delta - (57) (109) (66) (94) (325)
*Aviation Depot Maintenance reflects SAG: 1A5A - Aircraft Depot Maintenance.
AIR FORCE
The Air Force would prioritize readiness, funding flying hours under the BCA to the maximum executable level for the BCA force structure. Additional flying hours in PB15 are associated with the restoration of KC-10 and F-35 force structure.
Even so, the Air Force might not be able to fully execute the flying hours if other readiness levers (such as Weapons Systems Sustainment, Training Resources Availability) were underfunded.
Under BCA funding limits, Weapons Systems Sustainment (WSS) would be significantly underfunded – roughly 67 percent of requirements funded from FY 2016-19. In contrast, the PB15 funds WSS at 78 percent on average.
In addition to WSS shortfalls, BCA funding levels would leave critical readiness accounts underfunded, including exercises, simulators, training ranges, threat emitters, and Modeling and Simulation.
Figure 5-9. Air Force Flying Hours
$M Position FY 2015 FY 2016 FY 2017 FY 2018 FY 2019 FYDP
Flying Hours* PB15 7,637 7,506 7,454 7,645 7,506 37,748
BBA/BCA 7,637 7,339 7,272 7,460 7,339 37,047
Delta - (167) (182) (185) (167) (701)
*Flying Hours reflect Service provided flying hour program.
Estimated Impacts of Sequestration-Level Funding – FY 2015 Defense Budget
CHAPTER 5 OPERATION AND MAINTENANCE (O&M) IMPACTS 5-4
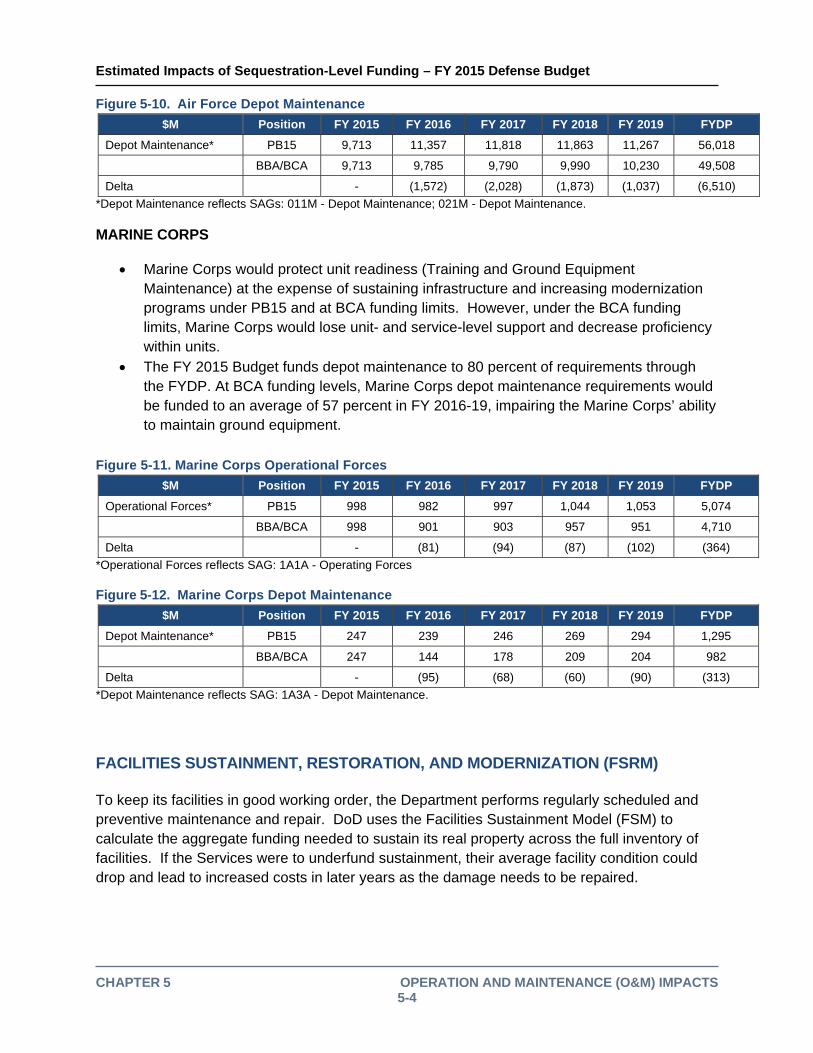
Figure 5-10. Air Force Depot Maintenance
$M Position FY 2015 FY 2016 FY 2017 FY 2018 FY 2019 FYDP
Depot Maintenance* PB15 9,713 11,357 11,818 11,863 11,267 56,018
BBA/BCA 9,713 9,785 9,790 9,990 10,230 49,508
Delta - (1,572) (2,028) (1,873) (1,037) (6,510)
*Depot Maintenance reflects SAGs: 011M - Depot Maintenance; 021M - Depot Maintenance.
MARINE CORPS
Marine Corps would protect unit readiness (Training and Ground Equipment Maintenance) at the expense of sustaining infrastructure and increasing modernization programs under PB15 and at BCA funding limits. However, under the BCA funding limits, Marine Corps would lose unit- and service-level support and decrease proficiency within units.
The FY 2015 Budget funds depot maintenance to 80 percent of requirements through the FYDP. At BCA funding levels, Marine Corps depot maintenance requirements would be funded to an average of 57 percent in FY 2016-19, impairing the Marine Corps’ ability to maintain ground equipment.
Figure 5-11. Marine Corps Operational Forces
$M Position FY 2015 FY 2016 FY 2017 FY 2018 FY 2019 FYDP
Operational Forces* PB15 998 982 997 1,044 1,053 5,074
BBA/BCA 998 901 903 957 951 4,710
Delta - (81) (94) (87) (102) (364)
*Operational Forces reflects SAG: 1A1A - Operating Forces
Figure 5-12. Marine Corps Depot Maintenance
$M Position FY 2015 FY 2016 FY 2017 FY 2018 FY 2019 FYDP
Depot Maintenance* PB15 247 239 246 269 294 1,295
BBA/BCA 247 144 178 209 204 982
Delta - (95) (68) (60) (90) (313)
*Depot Maintenance reflects SAG: 1A3A - Depot Maintenance.
FACILITIES SUSTAINMENT, RESTORATION, AND MODERNIZATION (FSRM) To keep its facilities in good working order, the Department performs regularly scheduled and preventive maintenance and repair. DoD uses the Facilities Sustainment Model (FSM) to calculate the aggregate funding needed to sustain its real property across the full inventory of facilities. If the Services were to underfund sustainment, their average facility condition could drop and lead to increased costs in later years as the damage needs to be repaired.
Estimated Impacts of Sequestration-Level Funding – FY 2015 Defense Budget
CHAPTER 5 OPERATION AND MAINTENANCE (O&M) IMPACTS 5-5
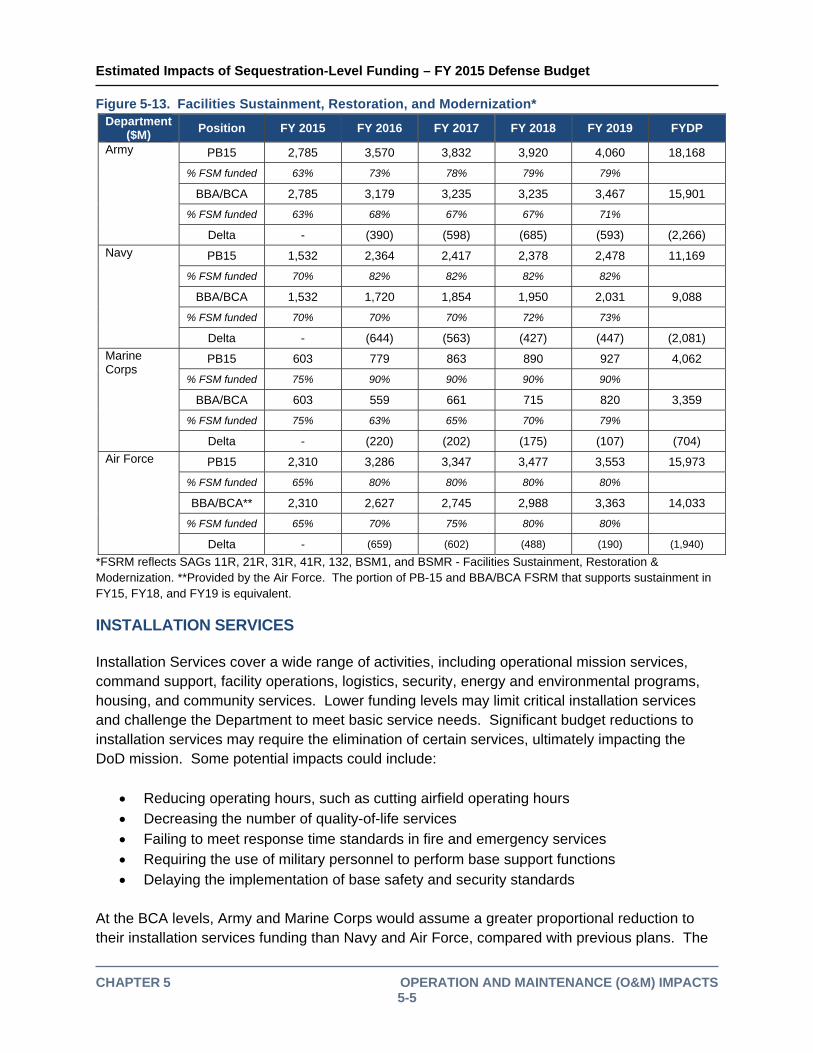
Figure 5-13. Facilities Sustainment, Restoration, and Modernization* Department
($M) Position FY 2015 FY 2016 FY 2017 FY 2018 FY 2019 FYDP
Army PB15 2,785 3,570 3,832 3,920 4,060 18,168
% FSM funded 63% 73% 78% 79% 79%
BBA/BCA 2,785 3,179 3,235 3,235 3,467 15,901
% FSM funded 63% 68% 67% 67% 71%
Delta - (390) (598) (685) (593) (2,266)
Navy PB15 1,532 2,364 2,417 2,378 2,478 11,169
% FSM funded 70% 82% 82% 82% 82%
BBA/BCA 1,532 1,720 1,854 1,950 2,031 9,088
% FSM funded 70% 70% 70% 72% 73%
Delta - (644) (563) (427) (447) (2,081)
Marine Corps
PB15 603 779 863 890 927 4,062
% FSM funded 75% 90% 90% 90% 90%
BBA/BCA 603 559 661 715 820 3,359
% FSM funded 75% 63% 65% 70% 79%
Delta - (220) (202) (175) (107) (704)
Air Force PB15 2,310 3,286 3,347 3,477 3,553 15,973
% FSM funded 65% 80% 80% 80% 80%
BBA/BCA** 2,310 2,627 2,745 2,988 3,363 14,033
% FSM funded 65% 70% 75% 80% 80%
Delta - (659) (602) (488) (190) (1,940)
*FSRM reflects SAGs 11R, 21R, 31R, 41R, 132, BSM1, and BSMR - Facilities Sustainment, Restoration & Modernization. **Provided by the Air Force. The portion of PB-15 and BBA/BCA FSRM that supports sustainment in FY15, FY18, and FY19 is equivalent.
INSTALLATION SERVICES Installation Services cover a wide range of activities, including operational mission services, command support, facility operations, logistics, security, energy and environmental programs, housing, and community services. Lower funding levels may limit critical installation services and challenge the Department to meet basic service needs. Significant budget reductions to installation services may require the elimination of certain services, ultimately impacting the DoD mission. Some potential impacts could include:
Reducing operating hours, such as cutting airfield operating hours Decreasing the number of quality-of-life services Failing to meet response time standards in fire and emergency services Requiring the use of military personnel to perform base support functions Delaying the implementation of base safety and security standards
At the BCA levels, Army and Marine Corps would assume a greater proportional reduction to their installation services funding than Navy and Air Force, compared with previous plans. The

Estimated Impacts of Sequestration-Level Funding – FY 2015 Defense Budget
CHAPTER 5 OPERATION AND MAINTENANCE (O&M) IMPACTS 5-6
PB15 increases shown below help mitigate some of the risk taken in these accounts.
Figure 5-14. Installation Services* Department
($M) Position FY 2015 FY 2016 FY 2017 FY 2018 FY 2019 FYDP
Army PB15 8,622 9,056 9,159 9,362 9,725 45,924
BBA/BCA
8,622 7,483 8,198 8,653 9,153 42,111
Delta - (1,573) (960) (709) (572) (3,813)
Navy PB15 4,501 4,613 4,582 4,651 4,737 23,084
BBA/BCA
4,501 4,556 4,530 4,599 4,684 22,869
Delta - (57) (52) (53) (53) (215)
Marine Corps PB15 2,090 2,152 2,104 2,123 2,149 10,618
BBA/BCA
2,090 1,986 1,927 1,941 1,964 9,907
Delta - (166) (177) (182) (186) (711)
Air Force PB15 6,101 6,271 6,439 6,532 6,630 31,974
BBA/BCA
6,101 6,295 6,414 6,507 6,605 31,922
Delta - 23 (25) (25) (26) (52)
*Installation Services reflects SAGs 11Z, 21Z, 31Z, and 41Z - Base Support; 131 - and Base Operations Support; and BSS1 and BSSR - Base Operating Support.
NON-DEFENSE AND OTHER DEFENSE O&M The Services’ ability to effectively train and achieve their readiness goals would be affected by FY 2016-19 BCA reductions in other O&M accounts, such as Combat and Servicewide Communications, Specialized Skill Training, Logistics Support, Prepositioned Stocks, and Environmental Restoration. The other O&M portfolio indirectly supports Service readiness by funding such areas as training and recruiting, institutional training, strategic positioning of critical warfighting stocks, communications, transportation, environmental restoration, and administration. The portfolio also supports intelligence programs and defense-wide activities, such as the Defense Health Program, Special Operations Command (SOCOM), Office of the Secretary of Defense (OSD), and Department of Defense Education Activity (DODEA). Most of these defense-wide activities did not receive additional funding above estimated BCA levels and their respective administrative accounts remain adjusted for sequestration even at the PB15 position. Figure 5-15. Non-Defense and Other Defense O&M
$M Position FY 2015 FY 2016 FY 2017 FY 2018 FY 2019 FYDP
Other O&M PB15 124,802 131,816 134,922 136,715 139,392 667,647
BBA/BCA 124,802 127,716 131,643 134,166 136,998 655,325
Delta (4,100) (3,279) (2,549) (2,394) (12,322)
Estimated Impacts of Sequestration-Level Funding – FY 2015 Defense Budget
CHAPTER 6 MILITARY CONSTRUCTION (MILCON) IMPACTS 6-1
6. MILITARY CONSTRUCTION (MILCON) IMPACTS
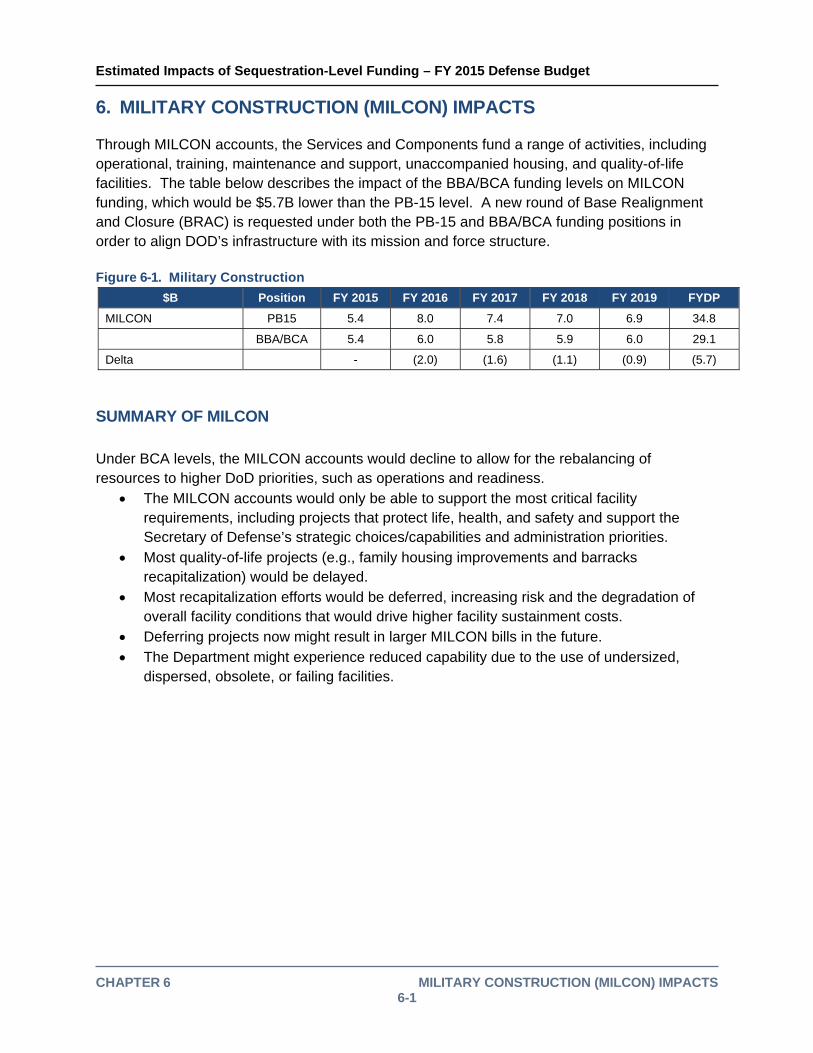
Through MILCON accounts, the Services and Components fund a range of activities, including operational, training, maintenance and support, unaccompanied housing, and quality-of-life facilities. The table below describes the impact of the BBA/BCA funding levels on MILCON funding, which would be $5.7B lower than the PB-15 level. A new round of Base Realignment and Closure (BRAC) is requested under both the PB-15 and BBA/BCA funding positions in order to align DOD’s infrastructure with its mission and force structure. Figure 6-1. Military Construction
$B Position FY 2015 FY 2016 FY 2017 FY 2018 FY 2019 FYDP
MILCON PB15 5.4 8.0 7.4 7.0 6.9 34.8
BBA/BCA 5.4 6.0 5.8 5.9 6.0 29.1
Delta - (2.0) (1.6) (1.1) (0.9) (5.7)
SUMMARY OF MILCON
Under BCA levels, the MILCON accounts would decline to allow for the rebalancing of resources to higher DoD priorities, such as operations and readiness.
The MILCON accounts would only be able to support the most critical facility requirements, including projects that protect life, health, and safety and support the Secretary of Defense’s strategic choices/capabilities and administration priorities.
Most quality-of-life projects (e.g., family housing improvements and barracks recapitalization) would be delayed.
Most recapitalization efforts would be deferred, increasing risk and the degradation of overall facility conditions that would drive higher facility sustainment costs.
Deferring projects now might result in larger MILCON bills in the future. The Department might experience reduced capability due to the use of undersized,
dispersed, obsolete, or failing facilities.
Estimated Impacts of Sequestration-Level Funding – FY 2015 Defense Budget
CHAPTER 7 OTHER IMPORTANT INITIATIVES 7-1
7. OTHER IMPORTANT INITIATIVES
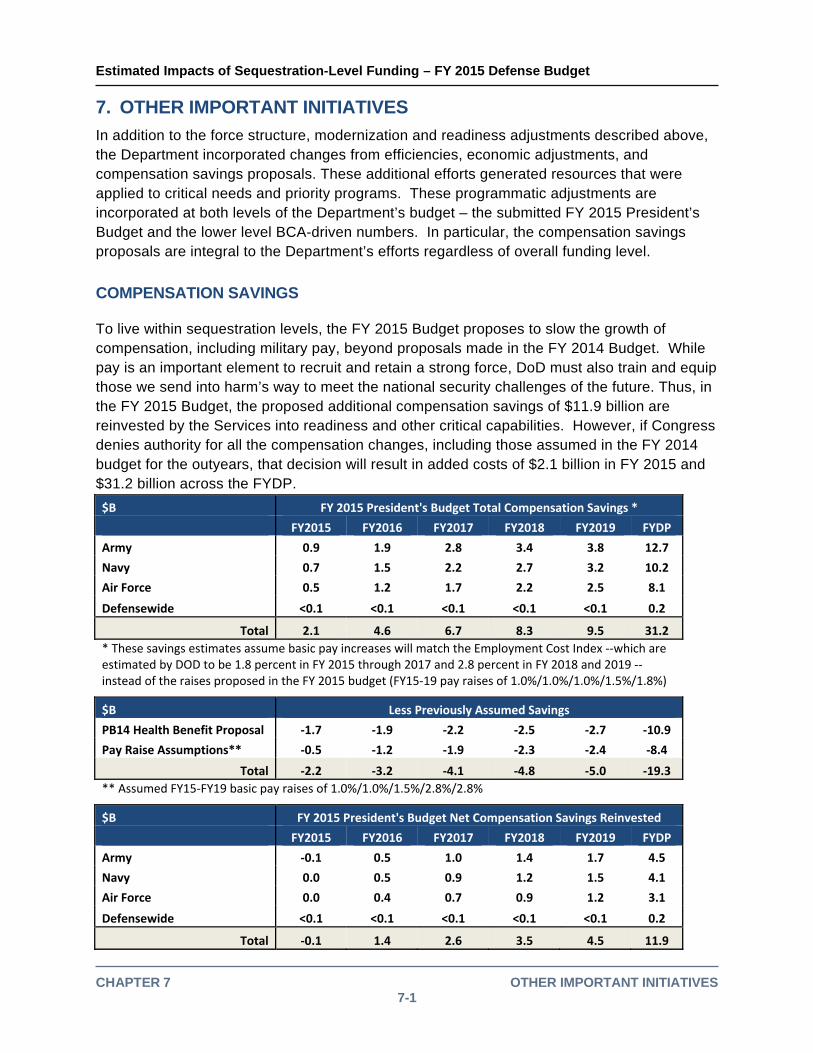
In addition to the force structure, modernization and readiness adjustments described above, the Department incorporated changes from efficiencies, economic adjustments, and compensation savings proposals. These additional efforts generated resources that were applied to critical needs and priority programs. These programmatic adjustments are incorporated at both levels of the Department’s budget – the submitted FY 2015 President’s Budget and the lower level BCA-driven numbers. In particular, the compensation savings proposals are integral to the Department’s efforts regardless of overall funding level.
COMPENSATION SAVINGS To live within sequestration levels, the FY 2015 Budget proposes to slow the growth of compensation, including military pay, beyond proposals made in the FY 2014 Budget. While pay is an important element to recruit and retain a strong force, DoD must also train and equip those we send into harm’s way to meet the national security challenges of the future. Thus, in the FY 2015 Budget, the proposed additional compensation savings of $11.9 billion are reinvested by the Services into readiness and other critical capabilities. However, if Congress denies authority for all the compensation changes, including those assumed in the FY 2014 budget for the outyears, that decision will result in added costs of $2.1 billion in FY 2015 and $31.2 billion across the FYDP.
$B FY 2015 President's Budget Total Compensation Savings *
FY2015 FY2016 FY2017 FY2018 FY2019 FYDP
Army 0.9 1.9 2.8 3.4 3.8 12.7
Navy 0.7 1.5 2.2 2.7 3.2 10.2
Air Force 0.5 1.2 1.7 2.2 2.5 8.1
Defensewide <0.1 <0.1 <0.1 <0.1 <0.1 0.2
Total 2.1 4.6 6.7 8.3 9.5 31.2
* These savings estimates assume basic pay increases will match the Employment Cost Index ‐‐which are estimated by DOD to be 1.8 percent in FY 2015 through 2017 and 2.8 percent in FY 2018 and 2019 ‐‐ instead of the raises proposed in the FY 2015 budget (FY15‐19 pay raises of 1.0%/1.0%/1.0%/1.5%/1.8%)
$B Less Previously Assumed Savings
PB14 Health Benefit Proposal ‐1.7 ‐1.9 ‐2.2 ‐2.5 ‐2.7 ‐10.9
Pay Raise Assumptions** ‐0.5 ‐1.2 ‐1.9 ‐2.3 ‐2.4 ‐8.4
Total ‐2.2 ‐3.2 ‐4.1 ‐4.8 ‐5.0 ‐19.3
** Assumed FY15‐FY19 basic pay raises of 1.0%/1.0%/1.5%/2.8%/2.8%
$B FY 2015 President's Budget Net Compensation Savings Reinvested
FY2015 FY2016 FY2017 FY2018 FY2019 FYDP
Army ‐0.1 0.5 1.0 1.4 1.7 4.5
Navy 0.0 0.5 0.9 1.2 1.5 4.1
Air Force 0.0 0.4 0.7 0.9 1.2 3.1
Defensewide <0.1 <0.1 <0.1 <0.1 <0.1 0.2
Total ‐0.1 1.4 2.6 3.5 4.5 11.9

Estimated Impacts of Sequestration-Level Funding – FY 2015 Defense Budget
CHAPTER 7 OTHER IMPORTANT INITIATIVES 7-1