establising and using risk management effectively
TRANSCRIPT

Establishing and Using Risk Management
Effectively Singapore, IS 2009
Mark PowellAttwater Consulting
SAIC, Decision and Risk TechnologiesStevens Institute of Technology
University of Houston Clear Lake

Tutorial Schedule13:30 –
Preliminaries, Introduction
13:45 –
Risk Concepts, How to Implement a Risk Management Program in an Enterprise
15:00 –
Break15:10 –
Useful Risk Management Metrics, Recent
Advances in Risk Assessment16:50 –
Summary and Evaluation
17:00 –
You are free to go
Estabilishing and Using Risk Management Effectively -
©
Mark Powell, 2000-2009 Slide # 2

Attendee Introductions (Time Allowing)
•
Your Name, Employer, and Type of Business
•
Your Job and Type of Work You Do•
Do You Work with Risk or Risk Management?
•
What you are hoping to gain from today’s tutorial
Estabilishing and Using Risk Management Effectively -
©
Mark Powell, 2000-2009 Slide # 3
Your Tutorial Instructor: Mark A. Powell
•
Director, Decision and Risk Technologies, SAIC•
Professor, Systems Engineering, Stevens Institute of Technology, University of Houston Clear Lake
•
Over 35 years Experience in Systems Engineering and Project Management
•
Former Chair, INCOSE Risk Management Working Group•
INCOSE Technical Leadership Team, Assistant Director for Systems Processes
•
Contact Information at the End of Tutorial Package, Contact Welcomed
Estabilishing and Using Risk Management Effectively -
©
Mark Powell, 2000-2009 Slide # 4

Introduction
•
Topics•
The Concept of Risk
•
What We do about Risk•
How to Implement a Risk Management Program in an Enterprise
•
Useful Risk Management Metrics•
Recent Advances in Risk Assessment
Estabilishing and Using Risk Management Effectively -
©
Mark Powell, 2000-2009 Slide # 5
The Concept of Risk
Estabilishing and Using Risk Management Effectively -
©
Mark Powell, 2000-2009 Slide # 6

Discussion:
What is Risk?
Estabilishing and Using Risk Management Effectively -
©
Mark Powell, 2000-2009 Slide # 7
What is Risk?•
Simply An Uncertain Future Consequence•
The Level of the Potential Consequence is Generally Uncertain
•
Whether or Not the Consequence will
be Realized may
be Uncertain
•
Possible Levels
of the Consequence:•
Only
Adverse –
Asteroid Hitting the Earth
•
Only
Advantageous
–
Gift of a Lottery Ticket•
Or, May Range from some Adverse Level
to
some Advantageous Level
–
An Investment in a Stock or Mutual Fund
Estabilishing and Using Risk Management Effectively -
©
Mark Powell, 2000-2009 Slide # 8

Some Common Risk Terminology Conventions
•
Engineering•
Risks
have Only
Adverse
Consequences –
Purely a Negative Connotation•
Opportunities
have Only
Advantageous
Consequences –
Purely a Positive Connotation•
Rarely
Address Risks with Consequences that
can range from Adverse
to Advantageous•
Business (including PMI)•
Risks Usually Considered to Range from Adverse
to Advantageous
•
Both Adverse Only
and Advantageous Only Consequence Risks are Simply Called Risks
Estabilishing and Using Risk Management Effectively -
©
Mark Powell, 2000-2009 Slide # 9

Convention for This Tutorial and a Recommendation
•
Will Refer to Adverse Only
and Advantageous Only
Consequence Risks AND
Risks that Range
from Adverse
to Advantageous as Simply Risks•
The Math
is All the Same•
Adverse Only
and Advantageous Only
Consequence Risks are Actually Rare, Even in Engineering
•
Recommendation:•
Conform to the convention in your Project or Enterprise•
BUT, Be Alert to the Fact that almost all Apparent Adverse Only
and Advantageous Only
Consequence Risks Usually Range to the Other Side
•
Be Prepared to Address this Situation•
Never Ignore the Other Side
Estabilishing and Using Risk Management Effectively -
©
Mark Powell, 2000-2009 Slide # 10

Quantifying Risk•
The Measure
of Uncertainty is Probability
•
The Measure
of Risk: The Probability that the Consequence
at Some Level will be Realized•
May be: Probability that the Consequence Above
a Specific Level will be Realized
•
May be: Probability that the Consequence Below
a Specific Level will be Realized
•
May be: Probability that the Consequence in a Specific Range
will be Realized•
Two Aspects
of Quantifying Risk
•
Consequence Level•
Probability of that Consequence Level being Realized
Estabilishing and Using Risk Management Effectively -
©
Mark Powell, 2000-2009 Slide # 11
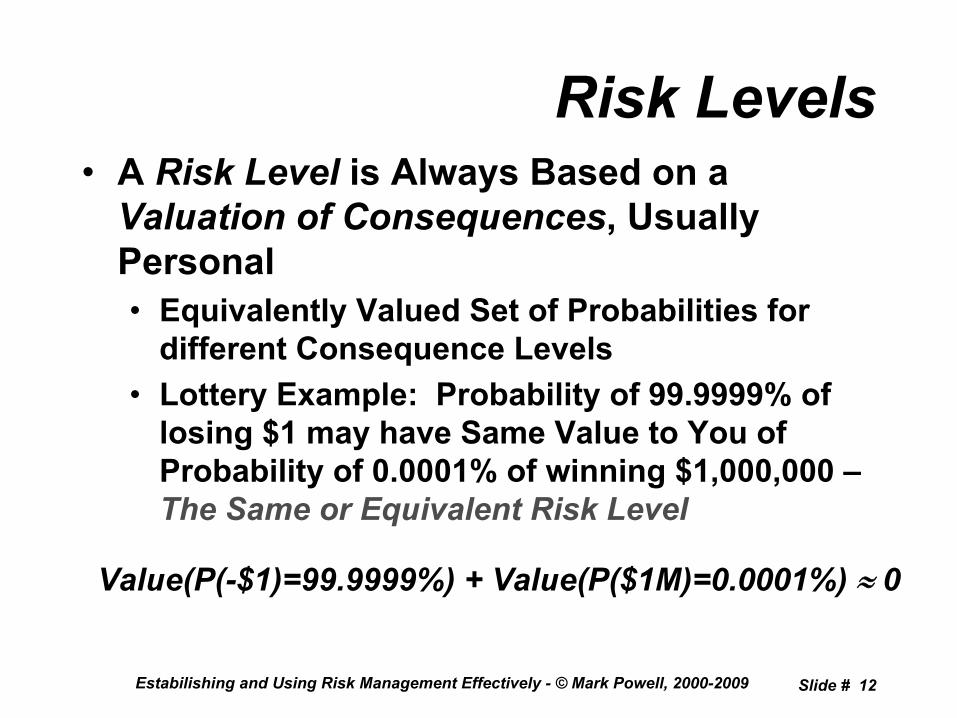
Risk Levels•
A Risk Level
is Always Based on a
Valuation of Consequences, Usually Personal•
Equivalently Valued Set of Probabilities for different Consequence Levels
•
Lottery Example: Probability of 99.9999% of losing $1 may have Same Value to You of Probability of 0.0001% of winning $1,000,000 –
The Same or Equivalent Risk Level
Estabilishing and Using Risk Management Effectively -
©
Mark Powell, 2000-2009 Slide # 12
Value(P(-$1)=99.9999%) + Value(P($1M)=0.0001%) ≈ 0

Approaches to Risk Levels•
There are No One-Size-Fits-
All
Approaches –
Every Risk is Different•
Marginal
Consequence Scales for Values may be Linear, Exponential, Logarithmic, or Other
•
Probability Scales are Generally Linear or Logarithmic
•
Shapes of Equivalent Risk Levels, as a functions of Consequence and Probability, are Generally Concave
or Convex, but Could be Any Shape
Estabilishing and Using Risk Management Effectively -
©
Mark Powell, 2000-2009 Slide # 13
Logarithmic
Exponential
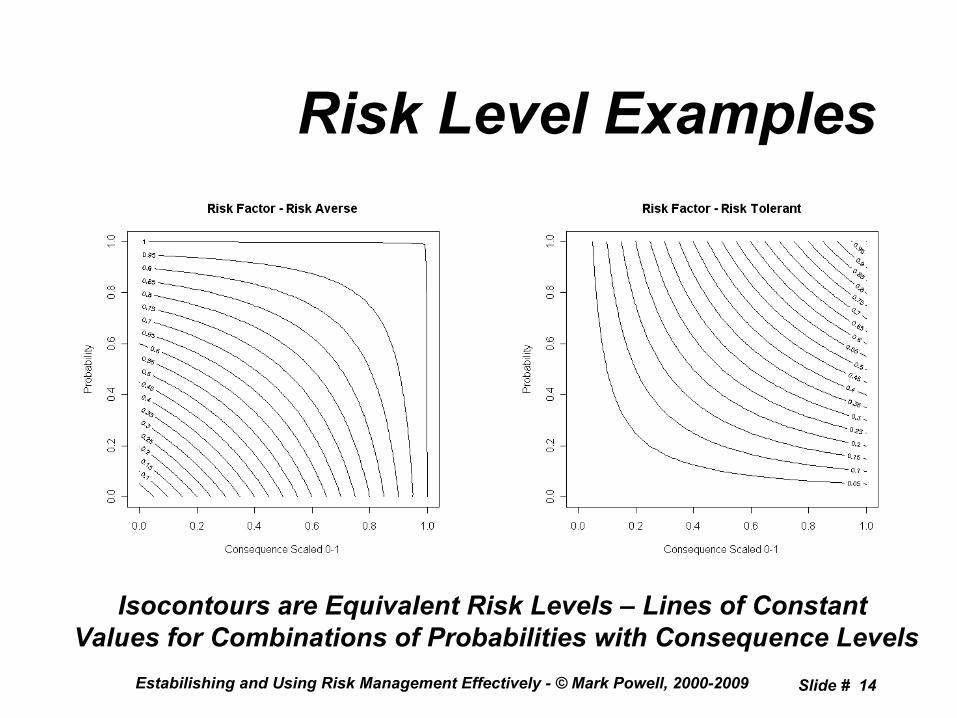
Risk Level Examples
Estabilishing and Using Risk Management Effectively -
©
Mark Powell, 2000-2009 Slide # 14
Isocontours are Equivalent Risk Levels –
Lines of Constant Values for Combinations of Probabilities with Consequence Levels

The Concept of Acceptable Risk
•
A Low Enough Risk Level is Acceptable – Can Live with it if Consequences are Realized
•
A Too High Risk Level is Unacceptable
–
Cannot Live with it if Consequences are Realized
•
There may be a Set of Risk Levels
between Acceptable
and Unacceptable
Estabilishing and Using Risk Management Effectively -
©
Mark Powell, 2000-2009 Slide # 15
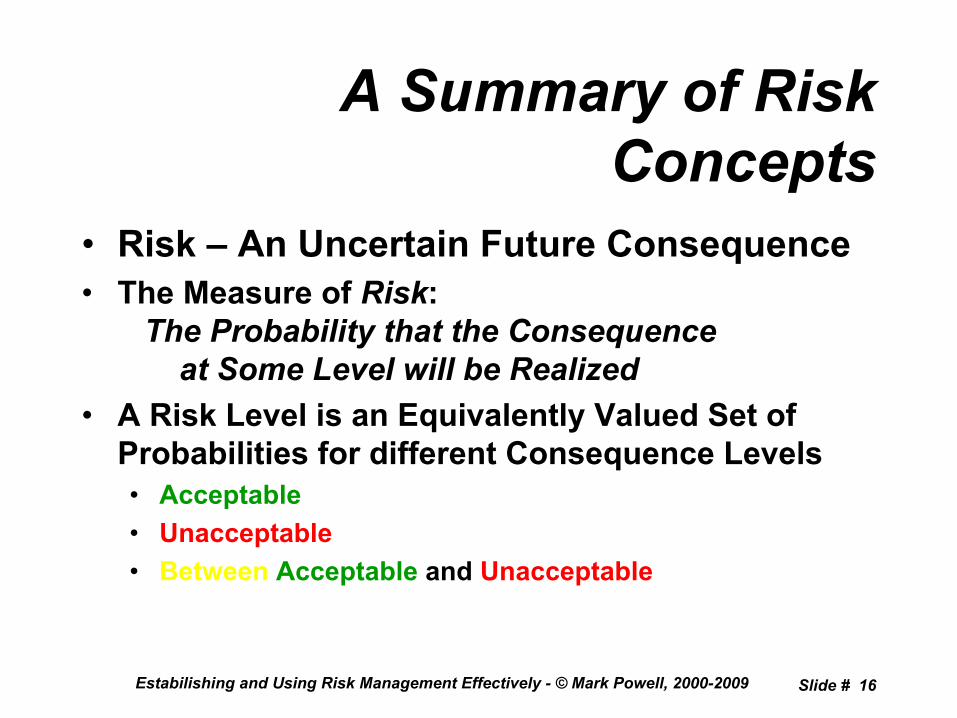
A Summary of Risk Concepts
•
Risk –
An Uncertain Future Consequence•
The Measure of Risk:
The Probability that the Consequence at Some Level will be Realized
•
A Risk Level is an Equivalently Valued Set of Probabilities for different Consequence Levels•
Acceptable•
Unacceptable•
Between
Acceptable
and Unacceptable
Estabilishing and Using Risk Management Effectively -
©
Mark Powell, 2000-2009 Slide # 16

What We Do About Risk
Estabilishing and Using Risk Management Effectively -
©
Mark Powell, 2000-2009 Slide # 17

First, Where does Risk Appear in a Project?
•
It’s Everywhere! It’s Everywhere!•
Schedule
–
Being on Schedule is not
Guaranteed•
Budget
–
Being within Budget is not
Guaranteed•
Performance
–
Desired Performance is
not Guaranteed•
Every Decision in a Project is Based on Risk
Estabilishing and Using Risk Management Effectively -
©
Mark Powell, 2000-2009 Slide # 18

What Should We Want
to Do About Risk?
•
If the Consequence is Only Adverse, We may want to Expend Resources
to Avoid it
•
If the Consequence is Only Advantageous, We may want to Expend Resources
to
Make it Happen•
If Both are Possible for a Single Consequence, We may want to Expend Resources
to Push it from Adverse
towards Advantageous•
This is Just Common Sense
Estabilishing and Using Risk Management Effectively -
©
Mark Powell, 2000-2009 Slide # 19
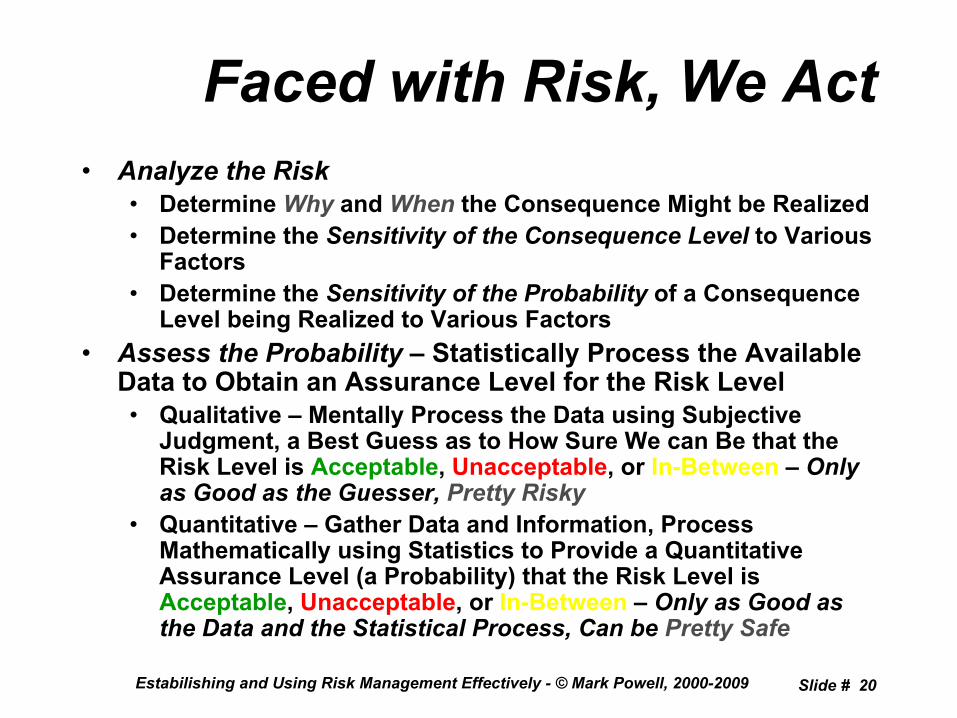
Faced with Risk, We Act•
Analyze the Risk•
Determine Why
and When
the Consequence Might be Realized•
Determine the Sensitivity of the Consequence Level
to Various Factors
•
Determine the Sensitivity of the Probability
of a Consequence Level being Realized to Various Factors
•
Assess
the Probability –
Statistically Process the Available Data to Obtain an Assurance Level for the Risk Level•
Qualitative
–
Mentally Process the Data using Subjective Judgment, a Best Guess as to How Sure We can Be that the Risk Level is Acceptable, Unacceptable, or In-Between
–
Only as Good as the Guesser, Pretty Risky
•
Quantitative
–
Gather Data and Information, Process Mathematically using Statistics to Provide a Quantitative Assurance Level (a Probability) that the Risk Level is Acceptable, Unacceptable, or In-Between
–
Only as Good as the Data and the Statistical Process, Can be Pretty Safe
Estabilishing and Using Risk Management Effectively -
©
Mark Powell, 2000-2009 Slide # 20

Based on Our Risk Assessment
•
For a Decision, Select the Alternative
with the Highest Assurance
of the Lowest Risk Level
•
For General Risks, Set Up a Decision•
If Sufficiently Sure
Risk Level is Acceptable, We Do Nothing
•
If Sufficiently Sure
Risk Level is Unacceptable, We Must Expend Resources to Mitigate
(Reduce) the Risk Level to an Acceptable
Level•
Else, Plan
for Mitigation, but Just Watch and Re-Assess when New Data is Obtained
•
Somebody Must Decide
What Sufficiently Sure
is for Each Risk
Estabilishing and Using Risk Management Effectively -
©
Mark Powell, 2000-2009 Slide # 21
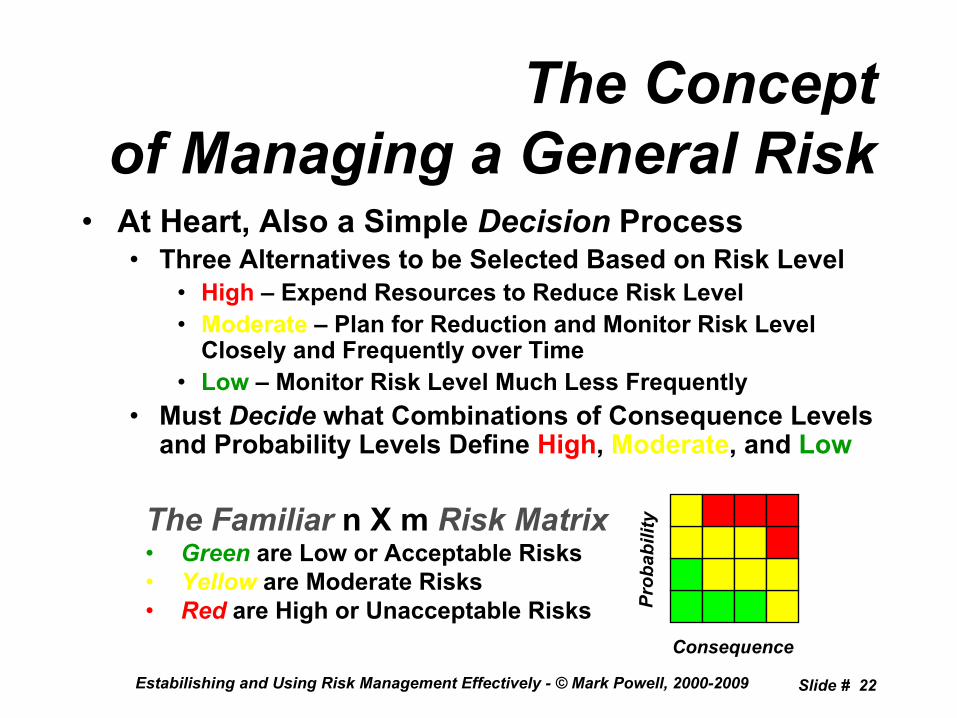
The Concept of Managing a General Risk
•
At Heart, Also a Simple Decision
Process•
Three Alternatives to be Selected Based on Risk Level•
High
–
Expend Resources to Reduce Risk Level•
Moderate
–
Plan for Reduction and Monitor Risk Level Closely and Frequently over Time
•
Low
–
Monitor Risk Level Much Less Frequently•
Must Decide
what Combinations of Consequence Levels and Probability Levels Define High, Moderate, and Low
Estabilishing and Using Risk Management Effectively -
©
Mark Powell, 2000-2009 Slide # 22
The Familiar n X m Risk Matrix•
Green
are Low or Acceptable Risks•
Yellow
are Moderate Risks•
Red
are High or Unacceptable RisksConsequence
Prob
abili
t y

How to Create a Risk Matrix•
Develop Your Risk Level Contours based on Values
on the
Consequence (Decide)•
Decide
on Acceptable
and Unacceptable
Risk Levels
•
Quantize Consequence and Probability Scales Appropriately
•
Fill in the Colors (G, Y, R) Appropriately
Estabilishing and Using Risk Management Effectively -
©
Mark Powell, 2000-2009 Slide # 23

More on the General Risk Management Concept
•
The Risk Matrix Illustrates the Decision Structure
–
Risk Levels Determine Actions
•
Risk Assessment Provides the Decision Discriminator
–
Assurance
of the Risk
Level, Based on the Data•
If Qualitative, Mentally
Process Data to
Produce an Assurance
for the Level of Risk•
If Quantitative, Statistically
Process Data to
Produce an Assurance
for the Level of Risk•
The Level of Assurance Required for Action is Determined by the Project Risk Strategy
Estabilishing and Using Risk Management Effectively -
©
Mark Powell, 2000-2009 Slide # 24
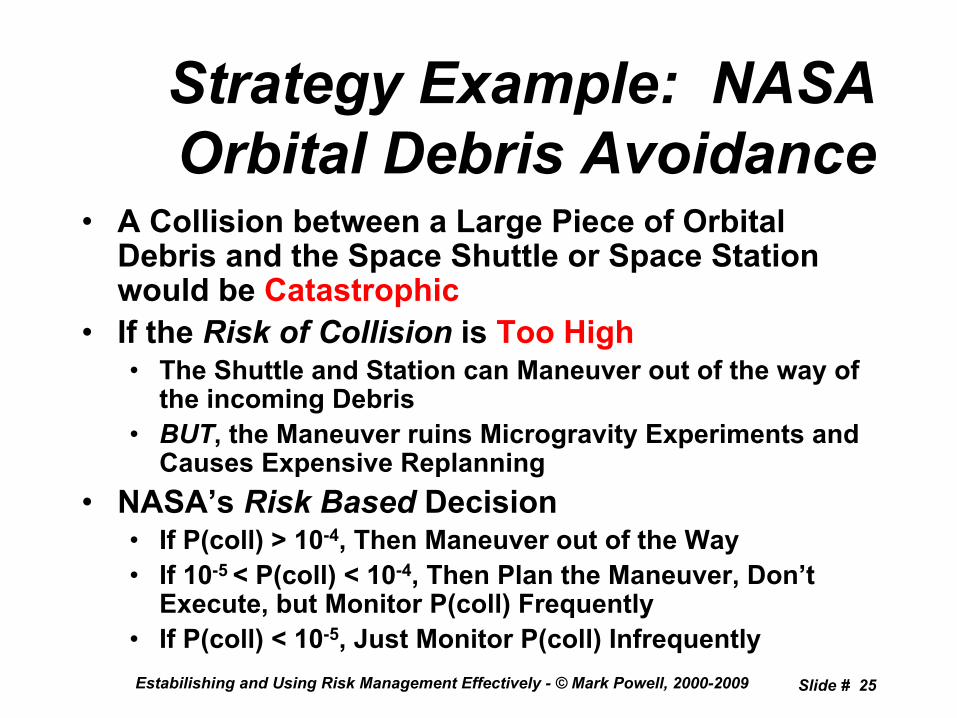
Strategy Example: NASA Orbital Debris Avoidance
•
A Collision between a Large Piece of Orbital Debris and the Space Shuttle or Space Station would be Catastrophic
•
If the Risk of Collision
is Too High•
The Shuttle and Station can Maneuver out of the way of the incoming Debris
•
BUT, the Maneuver ruins Microgravity Experiments and Causes Expensive Replanning
•
NASA’s Risk Based
Decision•
If P(coll) > 10-4, Then Maneuver out of the Way•
If 10-5 < P(coll) < 10-4, Then Plan the Maneuver, Don’t Execute, but Monitor P(coll) Frequently
•
If P(coll) < 10-5, Just Monitor P(coll) InfrequentlyEstabilishing and Using Risk Management Effectively -
©
Mark Powell, 2000-2009 Slide # 25
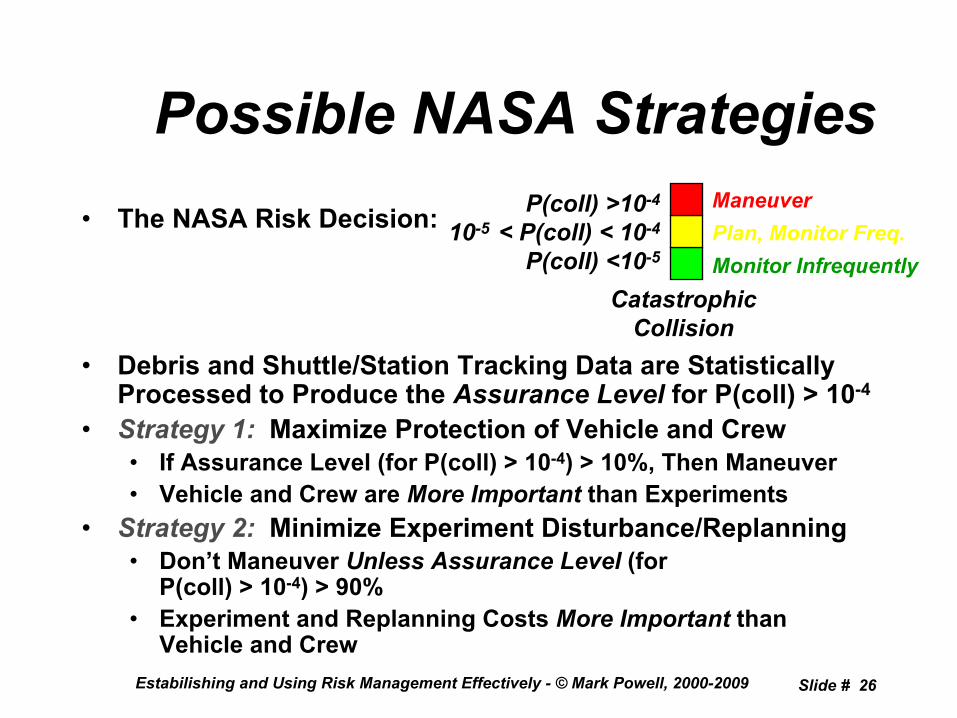
Possible NASA Strategies•
The NASA Risk Decision:
•
Debris and Shuttle/Station Tracking Data are Statistically Processed to Produce the Assurance Level
for P(coll) > 10-4
•
Strategy 1:
Maximize Protection of Vehicle and Crew•
If Assurance Level
(for P(coll) > 10-4) > 10%, Then Maneuver•
Vehicle and Crew are More Important
than Experiments•
Strategy 2:
Minimize Experiment Disturbance/Replanning•
Don’t Maneuver Unless Assurance Level
(for P(coll) > 10-4) > 90%
•
Experiment and Replanning Costs More Important
than Vehicle and Crew
Estabilishing and Using Risk Management Effectively -
©
Mark Powell, 2000-2009 Slide # 26
P(coll) >10-4
10-5 < P(coll) < 10-4
P(coll) <10-5
CatastrophicCollision
ManeuverPlan, Monitor Freq.Monitor Infrequently

Summary: What We Do with Risks
•
Analyze
the Risk –
Determine Root Causes and Sensitivities
•
Assess
the Risk –
Determine Assurance of Risk Levels based on the Data
•
For Decisions
–
Select the Alternative with the Highest Probability of the Lowest Risk Level
•
For General Risks•
Decide
on Our Acceptable/Unacceptable
Risk Levels•
Decide
on Our Risk Strategy –
Assurance Levels for Action
•
Act (Do Nothing, Watch Closely, or Mitigate) Depending on our Assessed Risk Levels and Strategy
Estabilishing and Using Risk Management Effectively -
©
Mark Powell, 2000-2009 Slide # 27

How to Implement a Risk Management Program
in a Project
Estabilishing and Using Risk Management Effectively -
©
Mark Powell, 2000-2009 Slide # 28
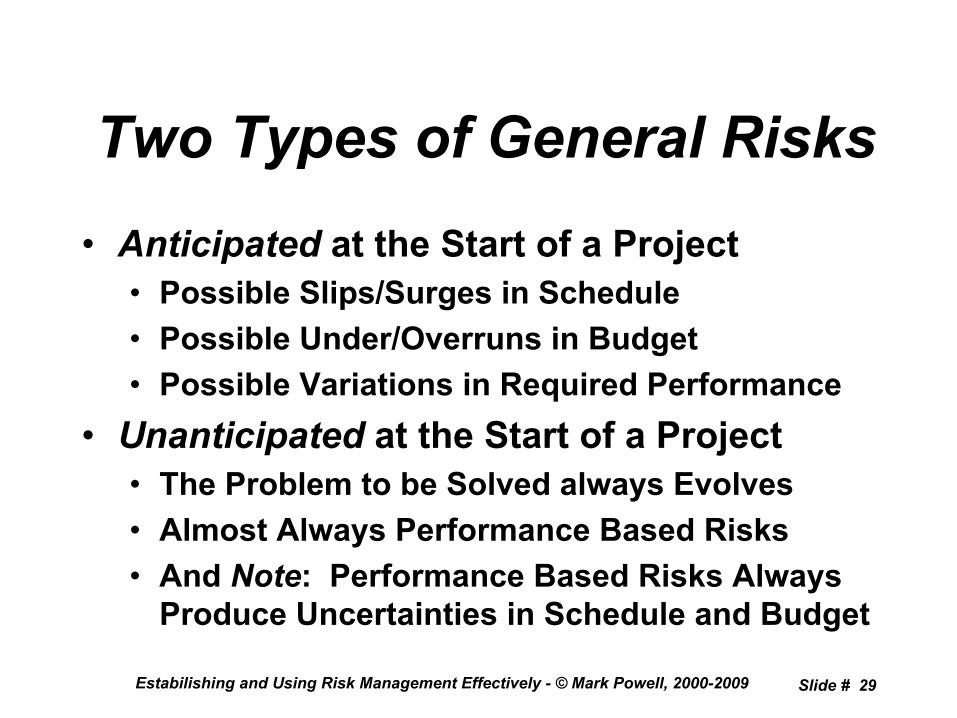
Two Types of General Risks•
Anticipated
at the Start of a Project
•
Possible Slips/Surges in Schedule•
Possible Under/Overruns in Budget
•
Possible Variations in Required Performance•
Unanticipated
at the Start of a Project
•
The Problem to be Solved always Evolves•
Almost Always Performance Based Risks
•
And Note: Performance Based Risks Always Produce Uncertainties in Schedule and Budget
Estabilishing and Using Risk Management Effectively -
©
Mark Powell, 2000-2009 Slide # 29

Handling Initially Anticipated Risks
•
Project Management
Processes are Risk Mitigation
Processes•
Time-Proven Lessons Learned
on What to do and What to NOT do to Make a Project or Enterprise a Success –
Reducing Risk!•
Project Management Plans
are Risk Management Plans
for Initially Anticipated Risks (Mostly focused on Schedule and Budget)
•
Systems Engineering
Processes are Risk Mitigation
Processes•
Time-Proven Lessons Learned
on What to do and What to NOT do to assure Required Technical Performance is Achieved
•
Systems Engineering Management Plans
(and associated Plans) are Risk Management Plans
for Initially Anticipated Technical Performance Risks
•
Example: Verification Reduces the Risk that Performance Requirements were not Satisfied
Estabilishing and Using Risk Management Effectively -
©
Mark Powell, 2000-2009 Slide # 30
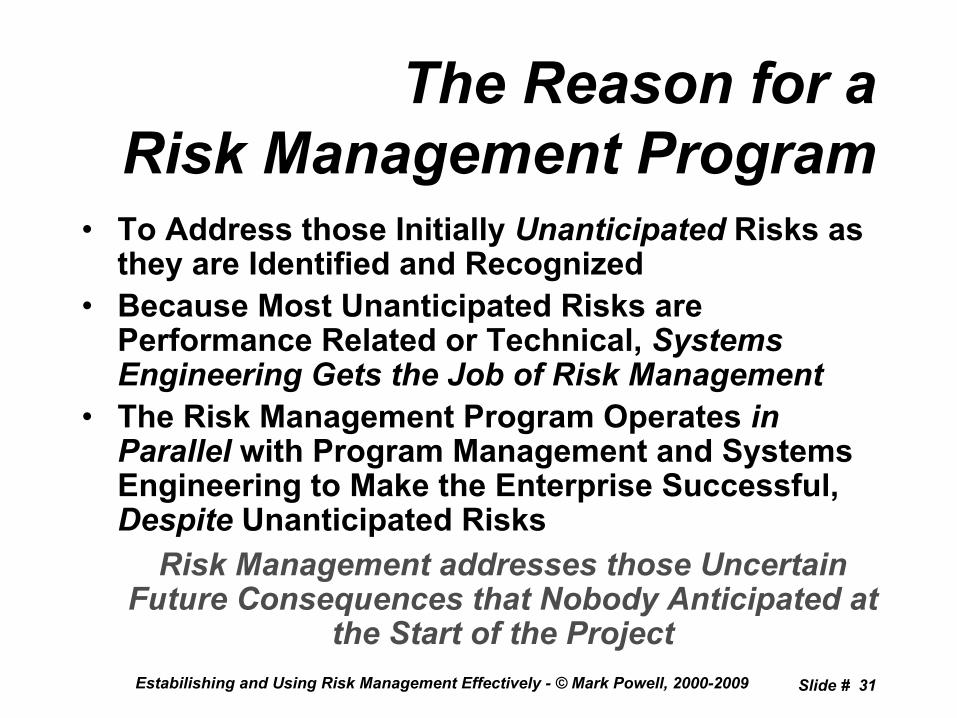
The Reason for a Risk Management Program
•
To Address those Initially Unanticipated
Risks as they are Identified and Recognized
•
Because Most Unanticipated Risks are Performance Related or Technical, Systems Engineering Gets the Job of Risk Management
•
The Risk Management Program Operates in Parallel
with Program Management and Systems
Engineering to Make the Enterprise Successful, Despite
Unanticipated Risks
Estabilishing and Using Risk Management Effectively -
©
Mark Powell, 2000-2009 Slide # 31
Risk Management addresses those Uncertain Future Consequences that Nobody Anticipated at
the Start of the Project

How to Implement a Risk Management Program
•
Project Manager and Chief Systems Engineer Decide
on Risk Margins
for Budget and Schedule•
Based on Thoroughness
of Project Management Plan•
Based on Factors related to Inherent Risks –
e.g., newness of technology, complexity, size, etc.
•
Risk Margin Resources Primarily used for Risk Analysis, Assessment, and Mitigation
•
Project Manager and Chief Systems Engineer Decide
on a Project Risk Strategy
(ies)•
Chief Systems Engineer Appoints a Risk Manager•
Risk Manager Develops Risk Management Plan
and Manages Risk Management Processes and Activities
•
Systems Engineering Management Plan Establishes Risk Identification Culture
and Processes for Project Team to Identify Risks
Estabilishing and Using Risk Management Effectively -
©
Mark Powell, 2000-2009 Slide # 32

Risk Management Processes
•
Risk Planning
–
Establish Procedures for Conducting Risk Management on the Project
•
Risk Identification
–
Discovery of Unanticipated Uncertain Future Consequences during the Project Life
•
Risk Analysis
–
Establish Root Causes and Sensitivities•
Risk Assessment
–
Statistically Process Data to Determine Assurance of Risk Level
•
Risk Mitigation
–
Plan and Execute a Project to Reduce or Eliminate Risk Level
•
Risk Tracking and Control
–
Monitor and Measure Risk Management on the Project
•
Risk Communication
–
Explaining How Project Success is Being Assured by Managing Risk
Estabilishing and Using Risk Management Effectively -
©
Mark Powell, 2000-2009 Slide # 33

How to Use Risk Management in a Project
•
All
Project Personnel and Teams should be Actively Identifying Risks as Normal Part of Job
•
Risk Manager and RM Team•
Review
Risks Identified by Project Personnel•
Assign
Risk Analysis Tasks to Engineering and Project Teams as Needed
•
Perform
Risk Assessments as Needed (including Monitoring)•
Propose
Risk Mitigation Plans for Project Team to Execute•
Track and Control All Risks•
Prepare Risk Metrics and Risk Communications•
Project Manager and Chief Systems Engineer•
Communicate
Risk Metrics and Overall Risk Posture Project•
Decide
Upon Risk Mitigations, Assign Tasks to Project Teams•
Manage
Risk Margins, Release Resources Only
when Project Risk Posture Diminishes with Time and Project Maturity
Estabilishing and Using Risk Management Effectively -
©
Mark Powell, 2000-2009 Slide # 34

Typical Use of Risk Margins•
95+% of Resource (Budget and Schedule) Expenditures on Risk Management•
Performance of Risk Analyses by Engineering or Project Teams –
Pulled Away from Normal Job•
Performance of Risk Assessments by RM Team•
Performance of Risk Mitigation Plans by Project Teams –
Pulled Away from Normal Job
•
Accepted
Risks Commit Risk Margins Until becoming OBE•
< 5% of Resource Expenditures (Budget and Schedule) on Risk Management•
Risk Planning•
Risk Tracking and Control•
Risk Communications•
Risk Identification Should be Part of Normal Job and thus not Use Risk Margin Resources
Estabilishing and Using Risk Management Effectively -
©
Mark Powell, 2000-2009 Slide # 35
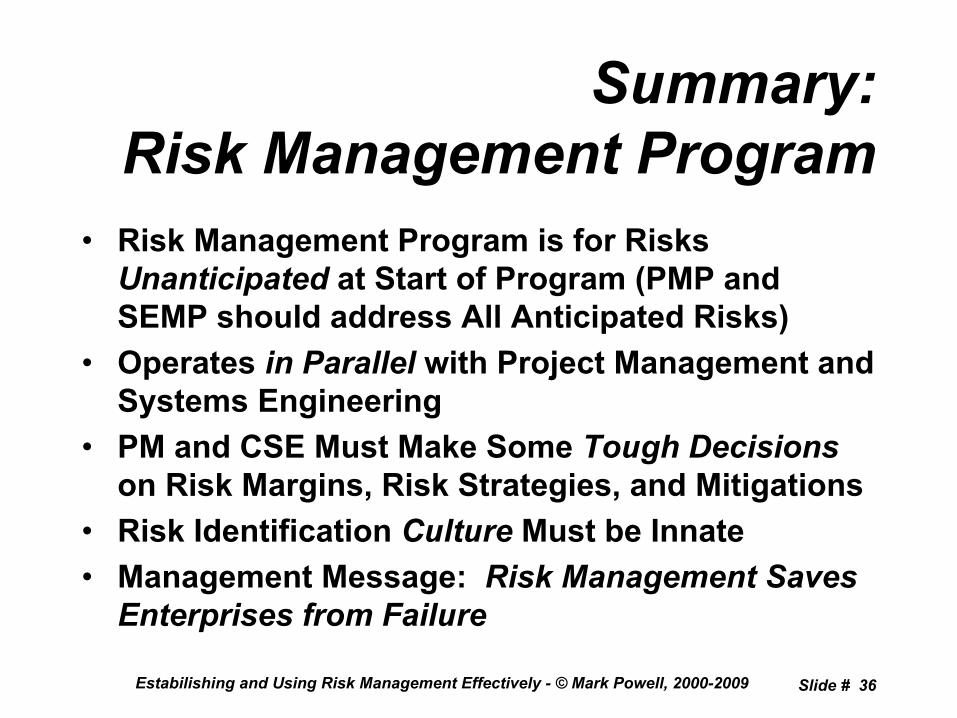
Summary: Risk Management Program
•
Risk Management Program is for Risks Unanticipated
at Start of Program (PMP and
SEMP should address All Anticipated Risks)•
Operates in Parallel
with Project Management and
Systems Engineering•
PM and CSE Must Make Some Tough Decisions
on Risk Margins, Risk Strategies, and Mitigations•
Risk Identification Culture
Must be Innate
•
Management Message: Risk Management Saves Enterprises from Failure
Estabilishing and Using Risk Management Effectively -
©
Mark Powell, 2000-2009 Slide # 36

Short Break
Please Be Back in 10 Minutes
Estabilishing and Using Risk Management Effectively -
©
Mark Powell, 2000-2009 Slide # 37
Useful Risk Metrics
Estabilishing and Using Risk Management Effectively -
©
Mark Powell, 2000-2009 Slide # 38
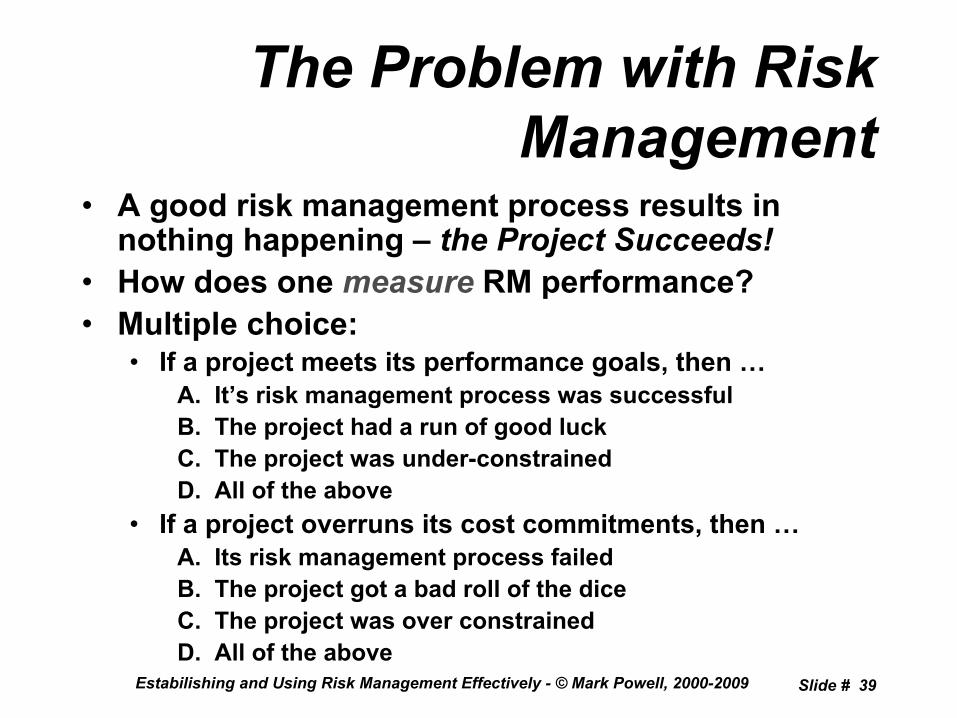
The Problem with Risk Management
•
A good risk management process results in nothing happening –
the Project Succeeds!
•
How does one measure
RM performance?•
Multiple choice: •
If a project meets its performance goals, then …A. It’s risk management process was successfulB. The project had a run of good luckC. The project was under-constrainedD. All of the above
•
If a project overruns its cost commitments, then …A. Its risk management process failedB. The project got a bad roll of the diceC. The project was over constrainedD. All of the above
Estabilishing and Using Risk Management Effectively -
©
Mark Powell, 2000-2009 Slide # 39

Risk Management Metrics?•
What
do you measure?
•
How
do you measure it?•
How do we know what is a good
measurement, or a bad
measurement?•
The International Council on Systems Engineering (INCOSE) Chartered Risk Management Working Group (RMWG) to Investigate RM Metrics
Estabilishing and Using Risk Management Effectively -
©
Mark Powell, 2000-2009 Slide # 40

INCOSE RMWG RM Metrics Proposal
•
RM Metrics Classified by Usage Frequency •
Infrequent
Metrics•
Usually before or after a project•
When significant performance issues are noted•
During the development of a Risk Management process•
Continuous
Metrics•
Measure the process during execution•
Measure the quality of the products during execution•
Attempt to make interim corrections if needed•
On-demand
Metrics•
When a measurable result is available, compare to expectations
•
Ad Hoc or Periodic
Estabilishing and Using Risk Management Effectively -
©
Mark Powell, 2000-2009 Slide # 41
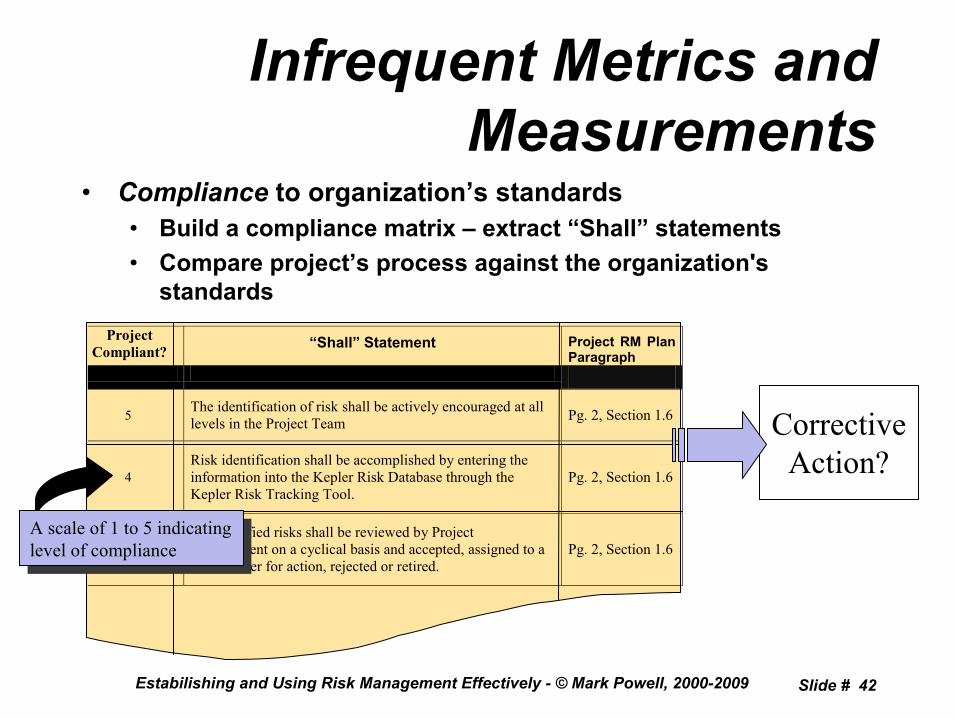
Infrequent Metrics and Measurements
•
Compliance
to organization’s standards•
Build a compliance matrix –
extract “Shall”
statements•
Compare project’s process against the organization's standards
Estabilishing and Using Risk Management Effectively -
©
Mark Powell, 2000-2009 Slide # 42
Project Compliant? “Shall” Statement Project RM Plan
Paragraph
5 The identification of risk shall be actively encouraged at all levels in the Project Team Pg. 2, Section 1.6
4 Risk identification shall be accomplished by entering the information into the Kepler Risk Database through the Kepler Risk Tracking Tool.
Pg. 2, Section 1.6
All identified risks shall be reviewed by Project Management on a cyclical basis and accepted, assigned to a Risk Owner for action, rejected or retired.
Pg. 2, Section 1.6
Corrective Action?
A scale of 1 to 5 indicating level of compliance
A scale of 1 to 5 indicating level of compliance

Infrequent Metrics and Measurements
•
Compliance
to “Best Practices”•
No consensus on what are “Best Practices”•
Use CMMs as a substitute
Estabilishing and Using Risk Management Effectively -
©
Mark Powell, 2000-2009 Slide # 43
FA 1.1 FA 1.2 FA 2.5Manage
RiskFA 3.3 FA 3.4
LEVEL 5
LEVEL 4
LEVEL 3
LEVEL 2
LEVEL 1
LEVEL 0
Quantitative effectiveness goals are establishedContinuous process improvement
Evidence that work is accomplished
Performance is planned and tracked
Standard process is definedPrograms tailor the standard process
Measurable goals are establishedPerformance is predicted
GENERICPRACTICES &ATTRIBUTES
FA- SPECIFICPRACTICES

Continuous Metrics
•
Compliance to Plan•
Performance•
Effectiveness
•
Efficiency•
Staleness
•
Trending
Estabilishing and Using Risk Management Effectively -
©
Mark Powell, 2000-2009 Slide # 44

Continuous Metrics: Compliance to Plan
•
Compliance
to RM Plan•
Is the project actually doing what it said it would do?
•
A simple compliance matrix•
Shall statements from the RM Plan for the project versus evidence that the activities are actually performed
•
Determine corrective action
Estabilishing and Using Risk Management Effectively -
©
Mark Powell, 2000-2009 Slide # 45

Continuous Metrics: Performance
•
Performance –
measure the performance of the process•
Effectiveness•
Effective: No or very few unforeseen problems
occur•
Approach: How many problems
occurred that were never identified as risks
•
Efficiency•
Efficient: Catching risks early
when it is more cost effective to mitigate them
•
Approach: Measure the time between when a risk was identified and when it became a problem
•
Staleness•
How many risk products are “stuck”
in a process step•
And, how long have they been there
Estabilishing and Using Risk Management Effectively -
©
Mark Powell, 2000-2009 Slide # 46

The Effectiveness Metric•
Performance –
Effectiveness
•
Premise: An effective risk management system will prevent unexpected problems
•
PE
, Process Effectiveness is the ratio of problems encountered, Np
, that were not identified as risks, to the total of risks identified, Nr , and problems encountered
PE = 1 –
Np
/(Np
+ Nr
)•
Measure of goodness: 90% = good; 80% = watch; 70% = Action
•
Action: causal analysis and process improvement
Estabilishing and Using Risk Management Effectively -
©
Mark Powell, 2000-2009 Slide # 47
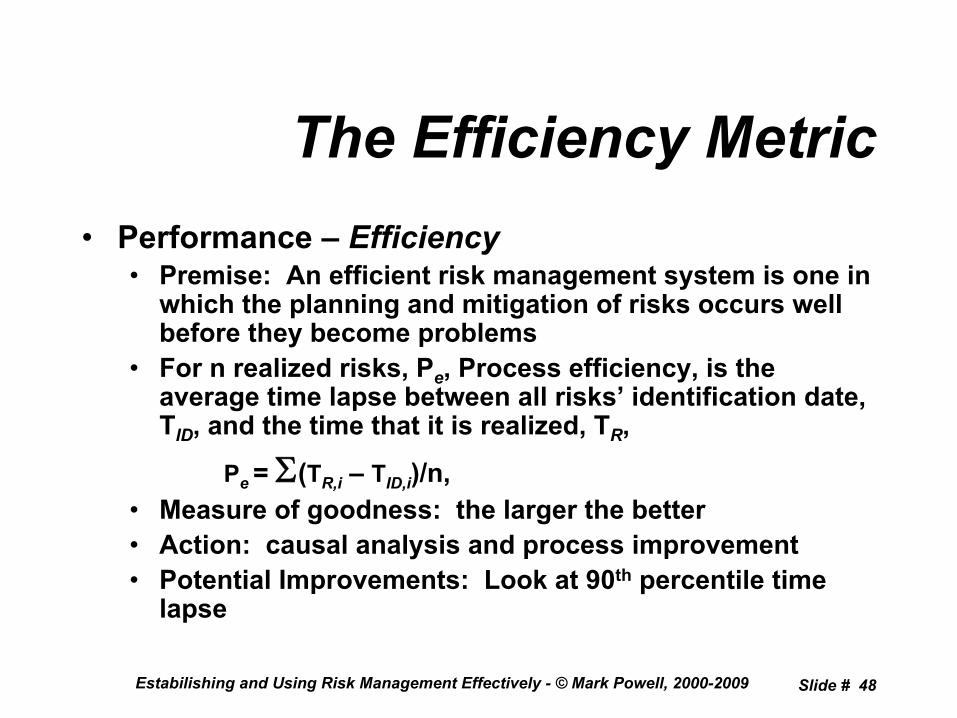
The Efficiency Metric•
Performance –
Efficiency
•
Premise: An efficient risk management system is one in which the planning and mitigation of risks occurs well before they become problems
•
For n realized risks, Pe
, Process efficiency, is the average time lapse between all risks’
identification date, TID
, and the time that it is realized, TR
,
Pe = Σ(TR,i
–
TID,i
)/n, •
Measure of goodness: the larger the better•
Action: causal analysis and process improvement•
Potential Improvements: Look at 90th
percentile time lapse
Estabilishing and Using Risk Management Effectively -
©
Mark Powell, 2000-2009 Slide # 48
The Staleness Metric•
Performance –
Staleness
•
Residence time for risks in major steps•
Short residence times: < ~30 days, are “Excellent”; long residence times: ~180 are “Very Poor”
•
Measure of goodness: 90% short = good; 80% short = watch; < 70% short = Action
•
Action: direct project management attention to insure actions on stale risks
•
Example measures:•
First Latency: Time identified to time first action by project management
•
Second Latency: Time from assignment to a Risk Owner to time the project Accepts
risk mitigation plan•
Subsequent Latencies: Lateness tracked against dates on the steps in the risk mitigation plan
Estabilishing and Using Risk Management Effectively -
©
Mark Powell, 2000-2009 Slide # 49
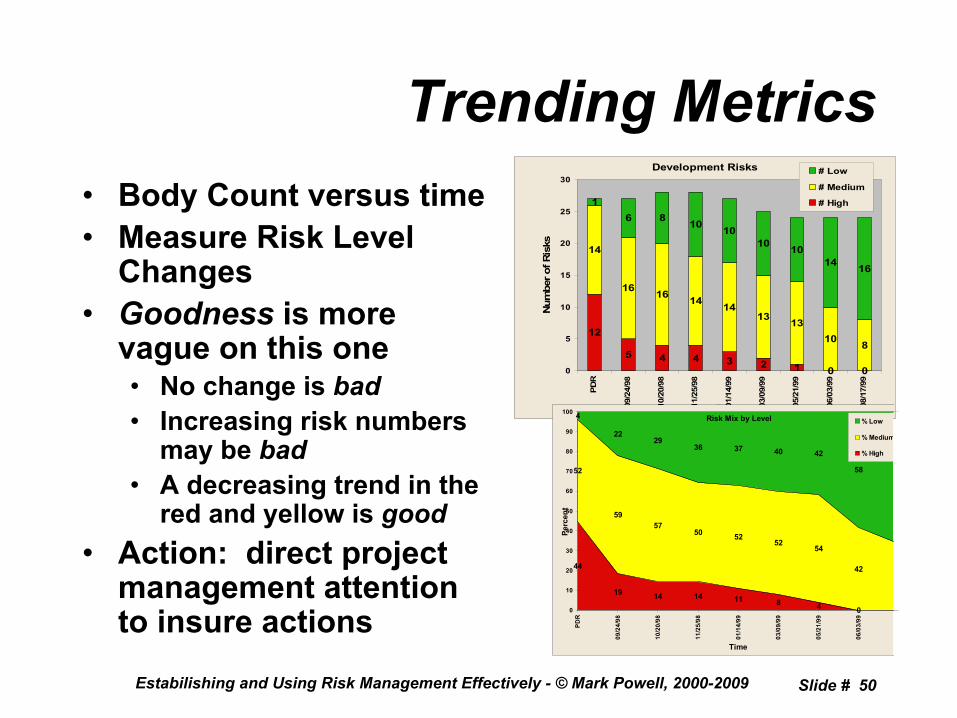
Trending Metrics•
Body Count versus time
•
Measure Risk Level Changes
•
Goodness
is more vague on this one•
No change is bad•
Increasing risk numbers may
be bad•
A decreasing trend in the red and yellow is good
•
Action: direct project management attention to insure actions
Estabilishing and Using Risk Management Effectively -
©
Mark Powell, 2000-2009 Slide # 50
Development Risks
12
5 4 3 2 1 0 0
14
16 16 14 1413 13
10 8
16 8 10 10
10 1014 16
40
5
10
15
20
25
30
PDR
09/2
4/98
10/2
0/98
11/2
5/98
01/1
4/99
03/0
9/99
05/2
1/99
06/0
3/99
08/1
7/99
Time
Num
ber o
f Ris
ks
# Low
# Medium
# High
Risk Mix by Level
44
19 14 14 11 80
52
5957
50 5252
54
42
4
2229
36 37 40
58
4
42
0
10
20
30
40
50
60
70
80
90
100
PDR
09/2
4/98
10/2
0/98
11/2
5/98
01/1
4/99
03/0
9/99
05/2
1/99
06/0
3/99
Time
Perc
ent
% Low
% Medium
% High

More Trending Metrics•
Waterfall charts•
Measure•
Latency (Calculated elsewhere)•
Errors in prediction of impact or effectiveness of mitigation•
Goodness: Miss residual risk by half a color•
Action: direct project management attention to correct
Estabilishing and Using Risk Management Effectively -
©
Mark Powell, 2000-2009 Slide # 51
Ris
k Le
vel
Time
Mitigation Plan Mitigation Effectiveness
AMEs Planned
AMEs Actual
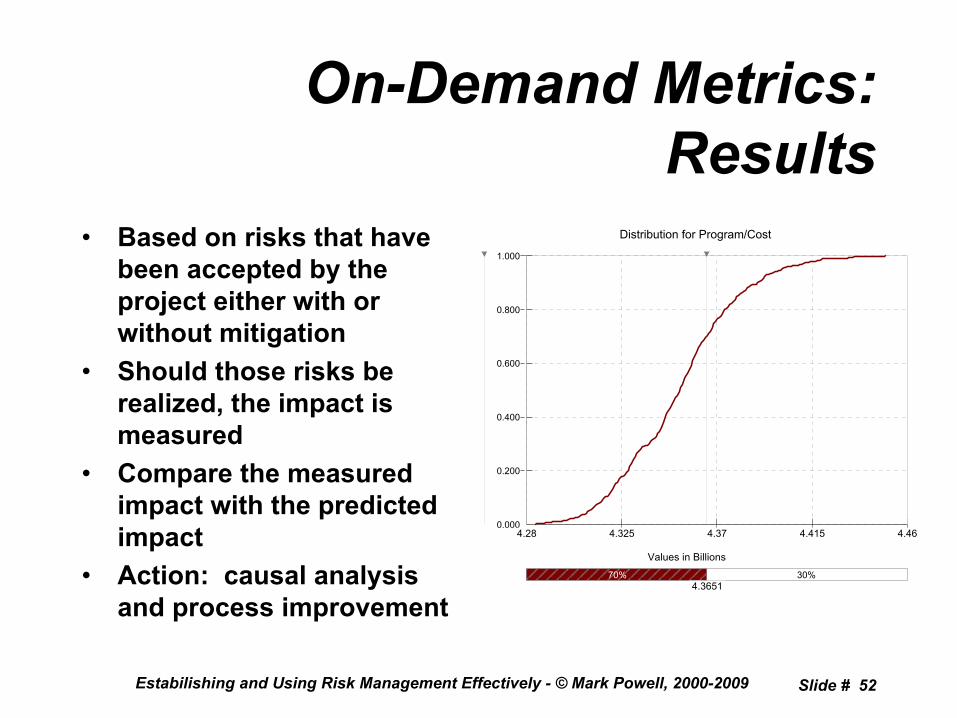
On-Demand Metrics: Results
•
Based on risks that have been accepted by the project either with or without mitigation
•
Should those risks be realized, the impact is measured
•
Compare the measured impact with the predicted impact
•
Action: causal analysis and process improvement
Estabilishing and Using Risk Management Effectively -
©
Mark Powell, 2000-2009 Slide # 52
Distribution for Program/Cost
Values in Billions
0.000
0.200
0.400
0.600
0.800
1.000
4.28 4.325 4.37 4.415 4.46
4.34.3
4.28 4.325 4.37 4.415 4.46
70% 30% 4.3651

Summary of Metrics•
Infrequent•
Measure the quality of the process•
Compliance to the organization’s standards•
Comparison with Best Practices•
Continuous•
Compliance to plan•
Performance•
Effectiveness•
Efficiency•
Staleness•
Trending•
On-demand•
Results -
for accepted
risks that are realized, compare actual risk outcomes with predictions
Estabilishing and Using Risk Management Effectively -
©
Mark Powell, 2000-2009 Slide # 53

INCOSE RMWG Recommendation
•
A Proper Combination
of Metrics should be Selected•
Individual Metrics are Not Sufficient
•
Should Include Each Frequency Type•
Risk Management Performance is Measurable, and Hence Manageable
•
Risk Management Can be Justified
Estabilishing and Using Risk Management Effectively -
©
Mark Powell, 2000-2009 Slide # 54
Recent Advances in Risk Assessment
Estabilishing and Using Risk Management Effectively -
©
Mark Powell, 2000-2009 Slide # 55
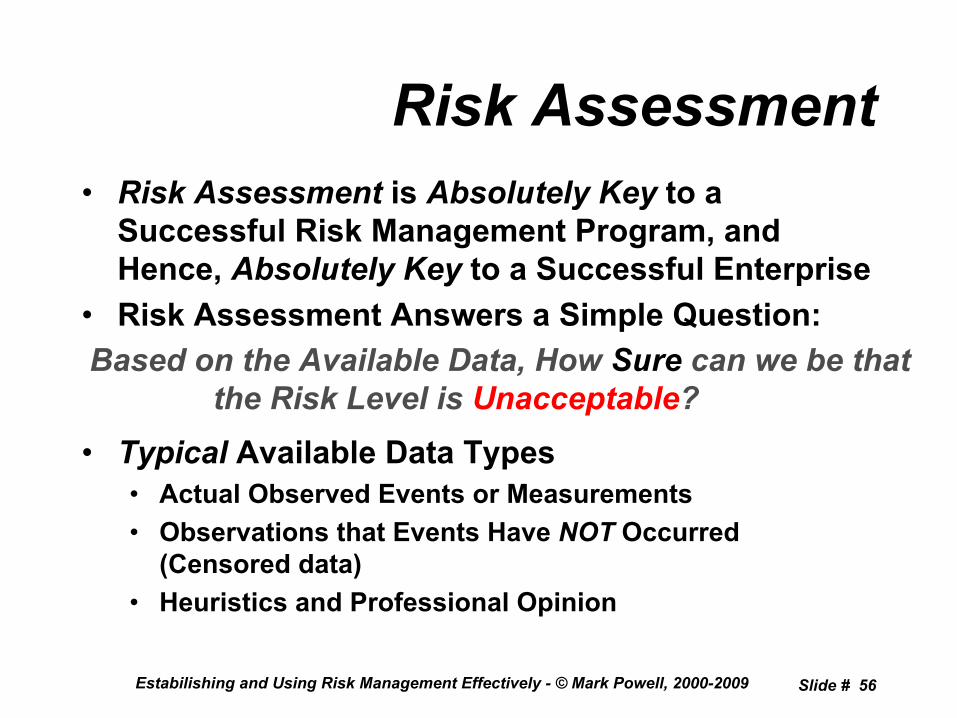
Risk Assessment•
Risk Assessment
is Absolutely Key
to a
Successful Risk Management Program, and Hence, Absolutely Key
to a Successful Enterprise
•
Risk Assessment Answers a Simple Question:
•
Typical
Available Data Types•
Actual Observed Events or Measurements•
Observations that Events Have NOT
Occurred (Censored data)
•
Heuristics and Professional Opinion
Estabilishing and Using Risk Management Effectively -
©
Mark Powell, 2000-2009 Slide # 56
Based on the Available Data, How Sure
can we be that the Risk Level is Unacceptable?
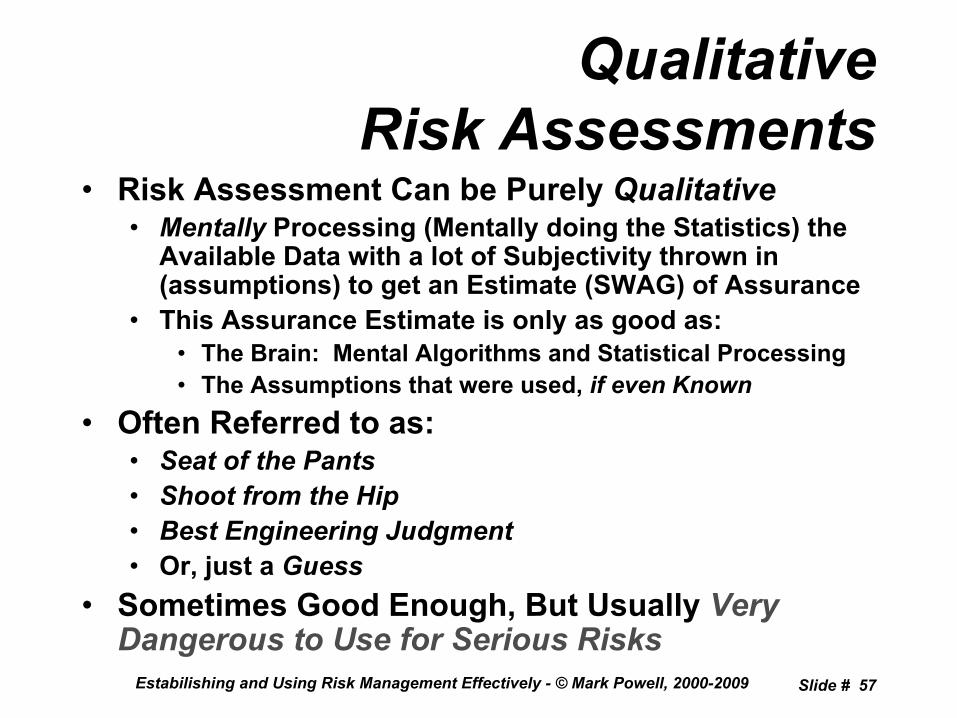
Qualitative Risk Assessments
•
Risk Assessment Can be Purely Qualitative•
Mentally
Processing (Mentally doing the Statistics) the Available Data with a lot of Subjectivity thrown in (assumptions) to get an Estimate (SWAG) of Assurance
•
This Assurance Estimate is only as good as:•
The Brain: Mental Algorithms and Statistical Processing•
The Assumptions that were used, if even Known•
Often Referred to as:•
Seat of the Pants•
Shoot from the Hip•
Best Engineering Judgment•
Or, just a Guess•
Sometimes Good Enough, But Usually Very Dangerous to Use for Serious Risks
Estabilishing and Using Risk Management Effectively -
©
Mark Powell, 2000-2009 Slide # 57

Quantitative Risk Assessments
•
Mathematically
Models Uncertainty, Consequence Root Causes, and Sensitivities
•
Process All Available Data using Statistical Methods
to Obtain Quantitative Measures of Assurance of Risk Levels
•
Proper Quantitative Risk Assessments Use No Assumptions, are Very Reliable
and Repeatable•
Why Don’t We Use Quantitative Risk Assessments?•
Proper Risk Assessment Formulations for Real World Problems
using All Available Data without Assumptions almost always become Analytically Intractable
•
Even Numerical Approaches (Monte Carlo Methods) almost always Impossible
to Use for the Proper Assessment•
Classical Statistical Methods do not use Censored Data or Heuristics very Well, if at All, Nor Outliers
•
Classical Statistical Methods use Many (Usually Unstated) Assumptions
Estabilishing and Using Risk Management Effectively -
©
Mark Powell, 2000-2009 Slide # 58
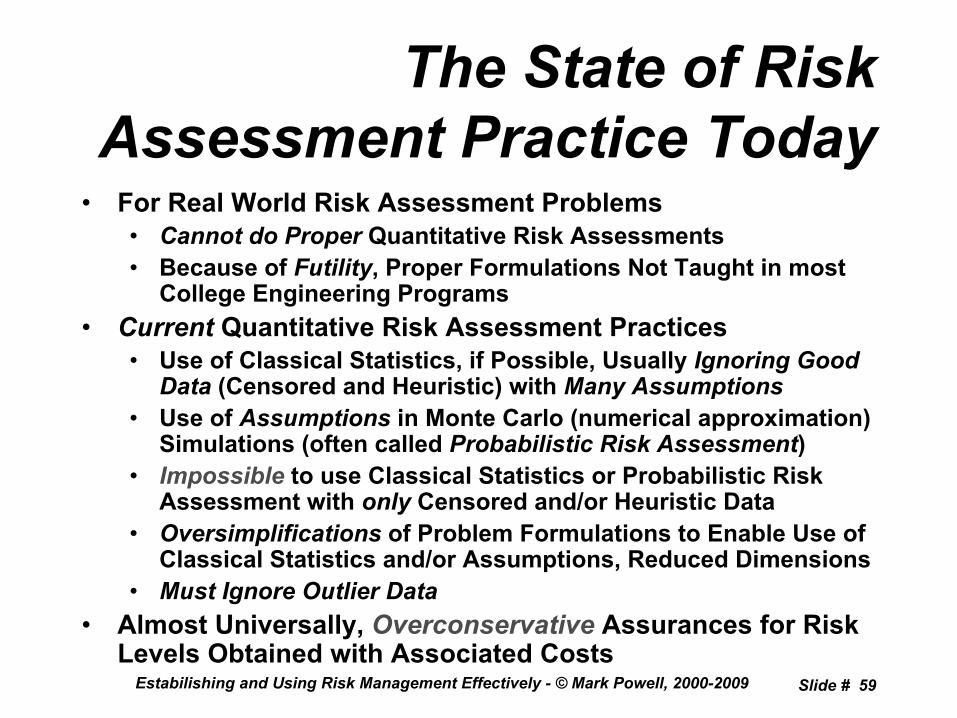
The State of Risk Assessment Practice Today
•
For Real World Risk Assessment Problems•
Cannot do Proper
Quantitative Risk Assessments•
Because of Futility, Proper Formulations Not Taught in most College Engineering Programs
•
Current
Quantitative Risk Assessment Practices•
Use of Classical Statistics, if Possible, Usually Ignoring Good Data
(Censored and Heuristic) with Many Assumptions•
Use of Assumptions
in Monte Carlo (numerical approximation) Simulations (often called Probabilistic Risk Assessment)
•
Impossible
to use Classical Statistics or Probabilistic Risk Assessment with only
Censored and/or Heuristic Data•
Oversimplifications
of Problem Formulations to Enable Use of Classical Statistics and/or Assumptions, Reduced Dimensions
•
Must Ignore Outlier Data•
Almost Universally, Overconservative
Assurances for Risk Levels Obtained with Associated Costs
Estabilishing and Using Risk Management Effectively -
©
Mark Powell, 2000-2009 Slide # 59

The Recent Advancement•
Not Really an Advancement in Quantitative Risk Assessment
•
New Numerical Methods
Allow Proper Quantitative Risk Assessment to be Done
•
In the Mid 1990’s, European Biomedicine Began Using New Markov Chain Monte Carlo
Methods to Produce Quantitative Risk Assessments
•
Markov Chain Monte Carlo
Methods provide very good numerical approximations for Real World Analytically Intractable Risk Assessment Formulations
•
No Assumptions Necessary, Models of Objectivity Can be Used Instead
•
All Data Types
can be Fused into the Assessment and Used Effectively, including Censored and Heuristic
•
No Need to Ignore Outlier Data
Estabilishing and Using Risk Management Effectively -
©
Mark Powell, 2000-2009 Slide # 60

Markov Chain Monte Carlo•
A More General
Version of Monte Carlo Methods
•
Does Not
Require Defined Sampling Models•
Does Not
Require Assumptions, Completely Objective•
Will Work with Analytically Intractable Formulations•
Can work for Very High Dimensional Problems
(up to 20,000 related sources of uncertainty)
•
Simple Algorithms
to Code, but Not Amenable to Packaging as a Computational Tool
•
When Used in Risk Assessment, Provides Full Quantitative Assurance of Risk Levels
for the
Most Complicated Real World Risk Assessment Problems
Estabilishing and Using Risk Management Effectively -
©
Mark Powell, 2000-2009 Slide # 61

Example: Space Shuttle Cargo Transfer Bag Test
•
Cargo Transfer Bags (CTB) to be Carried on Shuttle to Space Station
•
Required Zipper Cycle Life –
2,000 Cycles•
If CTB Zipper Fails During Launch or Descent, Loose Object could Penetrate the Hull (Rare Event with Extreme Consequences)
•
Performed a Single Test•
One CTB Only•
8,000 Successful Zipper Cycles•
Relevant QuestionHow Sure
can we be from the ONE Test Result that the TRUE Risk of CTB Zipper failure by 2,000 Cycles is below some
Acceptable Level?
Estabilishing and Using Risk Management Effectively -
©
Mark Powell, 2000-2009 Slide # 62

Synopsis for the CTB Test•
Test Datum:
Successful 8K Cycles without a Failure on One CTB Zipper
•
Assumptions (outrageous):•
Zipper Cycling Cannot Improve Reliability of the CTB Zipper•
At Least 62.4% of CTB failures will occur before 30,000 Cycles•
No Stated Minimum Acceptable Risk –
So Parameterize
Estabilishing and Using Risk Management Effectively -
©
Mark Powell, 2000-2009 Slide # 63
Risk of CTB Zipper Failure by 2K Cycles (R2K
)Assurance Provided by Test Results
P(True R2K
< R2K
)1% 75%5% 88%10% 94%20% 98%
Could Not be Solved WithoutMarkov Chain Monte Carlo Methods!

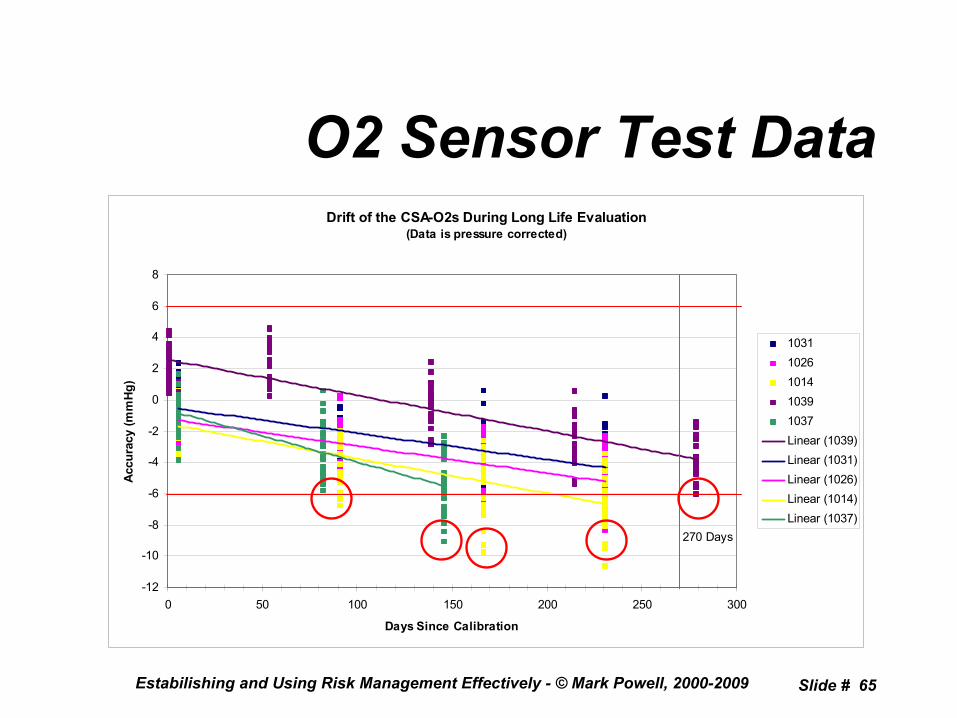
Example: ISS O2 Sensor Drift
•
Problem: Space Station Oxygen Sensor Measurement Accuracy is Observed to drift
with Time•
If the Measured O2
is in Error by more than ±6mmHG within 270 days since Calibration, it could Kill
an Astronaut•
Already Compensating for Pressure Variations in Measurement Accuracy (Successful)
•
Proposed Solution Options: •
Test for Drift rates and Compensate for Drift; OR,•
Redesign O2
Sensor and Ship Up to ISS•
Questions:•
What is the Existing
Risk of Sensor Accuracy Drift Beyond Acceptable Limits?
•
What is the Risk After
the Proposed Drift Compensation?
Estabilishing and Using Risk Management Effectively -
©
Mark Powell, 2000-2009 Slide # 64
O2 Sensor Test Data
Estabilishing and Using Risk Management Effectively -
©
Mark Powell, 2000-2009 Slide # 65
Drift of the CSA-O2s During Long Life Evaluation(Data is pressure corrected)
-12
-10
-8
-6
-4
-2
0
2
4
6
8
0 50 100 150 200 250 300
Days Since Calibration
Accu
racy
(mm
Hg)
10311026101410391037Linear (1039)Linear (1031)Linear (1026)Linear (1014)Linear (1037)
270 Days

Drift Corrected O2 Sensor Data
Estabilishing and Using Risk Management Effectively -
©
Mark Powell, 2000-2009 Slide # 66
Drift Time-Corrected CSA-O2s During Long Life Evaluation(Data is pressure corrected)
-12
-10
-8
-6
-4
-2
0
2
4
6
8
0 50 100 150 200 250 300
Days Since Calibration
Accu
racy
(mm
Hg)
10311026101410391037
270 Days

Before and After Drift Correction Risk Results
Estabilishing and Using Risk Management Effectively -
©
Mark Powell, 2000-2009 Slide # 67
Linear Scale Logarithmic Scale

O2 Sensor Risk Summary•
Without Drift Compensation, Risk of Exceeding Accuracy Limits at 270 Days is 36-46% (with 90% Assurance)
•
With Drift Compensation, 95% Sure
Risk of Exceeding Accuracy Limits at 270 Days is < 1.5%
•
Additional O2 Level Compensation could Reduce Risk Further
•
No Assumptions Needed
Estabilishing
and Using Risk Management Effectively -
©
Mark Powell, 2000-2009 Slide # 68
Could Not be Solved WithoutMarkov Chain Monte Carlo Methods!

Example: RSR Loose Screw Risk
•
Problem: Screws Holding Locker Door in Place in Shuttle Bay are Too Short•
If Door Looses Integrity, or Falls off, Something could Penetrate the Shuttle Hull during Launch or Descent
•
What is The Risk of having a Loose Screw, that could then Lead to a Risk of Losing a Door, and Losing a Shuttle and Crew?
•
Data: 8 screws of 273 observed Loose, but not Lost•
Decision:•
Replace and Retighten All Screws, OR•
Delay Flight
Estabilishing
and Using Risk Management Effectively -
©
Mark Powell, 2000-2009 Slide # 69

Risk of Panel Door Loss•
Complex Risk Question•
Loss of any Latch or Hinge Plate on Door will cause Loss of Door Integrity
•
Loss of a Latch or Hinge Plate requires Loss of One or More Screws
•
How many lost screws, in what patterns for Latch or Hinge Plate will Cause Loss of Door?
•
The Answer Defines Failure Modes•
Potential Failure Modes•
Any One to Six Screws Lost in a Latch or Hinge Plate Causes Door Integrity Loss -
Conservative•
Specific Pattern of One to Six Screws Lost in a Latch or Hinge Plate Causes Door Integrity Loss –
Realistic
Engineering, and Less Conservative
Estabilishing
and Using Risk Management Effectively -
©
Mark Powell, 2000-2009 Slide # 70
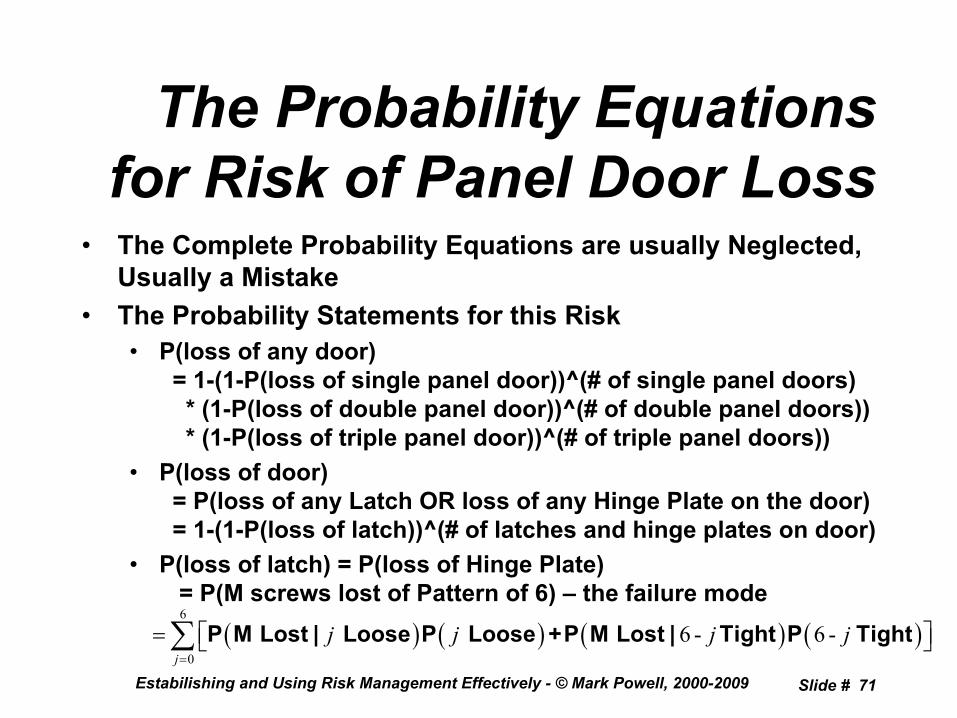
The Probability Equations for Risk of Panel Door Loss
•
The Complete Probability Equations are usually Neglected, Usually a Mistake
•
The Probability Statements for this Risk•
P(loss
of any door)
= 1-(1-P(loss of single panel door))^(# of single panel doors)
* (1-P(loss of double panel door))^(# of double panel doors))
* (1-P(loss of triple panel door))^(# of triple panel doors))
•
P(loss
of door) = P(loss
of any Latch OR loss of any Hinge Plate on the door)
= 1-(1-P(loss of latch))^(# of latches and hinge plates on door)
•
P(loss
of latch) = P(loss
of Hinge Plate)
= P(M screws lost of Pattern of 6) –
the failure mode
Estabilishing
and Using Risk Management Effectively -
©
Mark Powell, 2000-2009 Slide # 71
( ) ( ) ( ) ( )6
06 - 6 -
jj j j j
=
= ⎡ ⎤⎣ ⎦∑ P M Lost | Loose P Loose +P M Lost | Tight P Tight

Predicted Risk of RSR Panel Door Failure
•
Consider All Conservative Failure Modes (1 to 6 screws may be needed to Retain Each Latch and Each Hinge Plate)
•
Worst Case –
Specific Screw Patterns will Reduce Risk•
Table of Predicted Risks for Failure due to Lost Screws
Estabilishing and Using Risk Management Effectively -
©
Mark Powell, 2000-2009 Slide # 72
Failure Mode Definition
(# Lost Screws in Pattern of 6)
P(Loss Single Door|Data)
P(Loss Double Door|Data)
P(Loss Triple Door|Data)
P(Loss Any Door|Data)
1 or more 1.91% 3.78% 5.62% 29.34%2 or more 2.35e-2% 4.69e-2% 7.04e-2% 0.422%3 or more 2.57e-4% 5.14e-4% 7.71e-4 4.63e-3%4 or more 2.23e-6% 4.47e-6% 6.70e-6% 4.02e-5%5 or more 1.34e-8% 2.68e-8% 4.02e-8% 2.41e-7%
6 4.11e-11% 8.23e-11% 1.23e-10% 7.41e-10%
Actually, One of those Very Rare Quantitative RiskAssessment Problems Solvable Analytically, But Shuttle
Engineers Did not Know How to Properly Formulate it
For More Information on Proper Quantitative Risk
Assessment and MCMC•
Numerous Texts, Check Amazon
•
I Welcome Contact•
Articles
•
Examples•
Stevens Courses•
SYS 601: Probability and Statistics for Systems Engineers
•
SYS 660: Decision and Risk Analysis for Complex Systems
•
Webcampus: http://webcampus.stevens.eduEstabilishing and Using Risk Management Effectively -
©
Mark Powell, 2000-2009 Slide # 73

Summary and Conclusions•
Risk Management Programs Insure Against Project Perils
to Ensure Project Success•
Proper Risk Management and Risk Communications Improve Customer and Line Management Confidence
•
A Good Set of Risk Management Metrics Enable Effective Management of the RM Process, and Good Communications
•
New Numerical Methods Enable Proper Quantitative Risk Assessment
without Assumptions
to Make Risk Management More Effective
and Efficient
Estabilishing and Using Risk Management Effectively -
©
Mark Powell, 2000-2009 Slide # 74
Risk Management Can beEstablished and Used Effectively

Contact Information
•
e-mail•
•
•
Telephone•
SAIC: 281-335-3662
•
Cell: 208-521-2941
Estabilishing and Using Risk Management Effectively -
©
Mark Powell, 2000-2009 Slide # 75