erdc/itl tr-19-4 'multiaxial fatigue strength of ...multiaxial fatigue strength of structural...
TRANSCRIPT
ERD
C/IT
L TR
-19-
4
Multiaxial Fatigue Strength of Structural Bolts Under Combined Cyclic Axial and Shear Demands
Info
rmat
ion
Tech
nolo
gy L
abor
ator
y
Guillermo A. Riveros, Hussam N. Mahmoud, and Santiago R. Lopez
June 2019
Approved for public release; distribution is unlimited.

The U.S. Army Engineer Research and Development Center (ERDC) solves the nation’s toughest engineering and environmental challenges. ERDC develops innovative solutions in civil and military engineering, geospatial sciences, water resources, and environmental sciences for the Army, the Department of Defense, civilian agencies, and our nation’s public good. Find out more at www.erdc.usace.army.mil.
To search for other technical reports published by ERDC, visit the ERDC online library at http://acwc.sdp.sirsi.net/client/default.

ERDC/ITL TR-19-4 June 2019
Multiaxial Fatigue Strength of Structural Bolts Under Combined Cyclic Axial and Shear Demands
Guillermo A. Riveros Information Technology Laboratory U.S. Army Engineer Research and Development Center 3909 Halls Ferry Road Vicksburg, MS 39180-6199
Hussam N. Mahmoud and Santiago R. Lopez Colorado State University Department of Civil and Environmental Engineering Campus Delivery 1372 Fort Collins, CO 80523-1372
Final report
Approved for public release; distribution is unlimited.
Prepared for U.S. Army Corps of Engineers Washington, DC 20314-1000
Under Project 19735, “Redesign of Miter Gate Pintle Sockets and Connections”
ERDC/ITL TR-19-4 ii
Abstract
High-strength bolts are used extensively in structures and are regarded as the better option for connections subjected to fatigue when compared to welds and rivets. Studies have shown the superior resistance of high-strength bolts to fatigue and conclude that it should not be an issue when a bolt is properly pre-tensioned. Nevertheless, a recent application of properly pre-tensioned bolts subjected to shear stress reversals shows extensive fatigue cracking and total severing of up to 50% of the bolts in the connections. Sufficient evidence based on experimental testing and field observations exist to suggest the possibility of fully pre-tensioned bolts coming loose due to shear stress reversals. The problem of transverse vibrational loosening of bolts has been extensively researched, as well as the issue of bolt fatigue. Only recently have they been considered together although no studies of this interaction have been conducted on high-strength bolts. Certain mechanisms mark the onset of bolt loosening and fatigue when bolts are subjected to cyclic shear or shear combined with tension. In this study, causes of bolt loosening and fatigue failure of bolted connections are explored. Specifically, the study pertains to structural bolts that are subjected to cyclic loads in multiple directions with shear reversals, which are typical of miter gate-to-pintle socket connections.
DISCLAIMER: The contents of this report are not to be used for advertising, publication, or promotional purposes. Citation of trade names does not constitute an official endorsement or approval of the use of such commercial products. All product names and trademarks cited are the property of their respective owners. The findings of this report are not to be construed as an official Department of the Army position unless so designated by other authorized documents.
DESTROY THIS REPORT WHEN NO LONGER NEEDED. DO NOT RETURN IT TO THE ORIGINATOR.
ERDC/ITL TR-19-4 iii
Contents Abstract .................................................................................................................................... ii
Figures and Tables ................................................................................................................... v
Preface .................................................................................................................................... vii
Unit Conversion Factors ....................................................................................................... viii
Acronyms and Abbreviations ................................................................................................ ix
1 Introduction ...................................................................................................................... 1 1.1 Statement of the problem ................................................................................. 1 1.2 Purpose .............................................................................................................. 2 1.3 Objective and scope of research ...................................................................... 3 1.4 Organization ....................................................................................................... 3
2 Literature Review: Causes of Failure in High-Strength Bolts ..................................... 4 2.1 Loss of pre-tension in bolts ............................................................................... 4
2.1.1 Non-rotational loss of pre-tension .............................................................................. 5 2.1.2 Rotational self-loosening ............................................................................................ 7
2.2 Fatigue of high-strength bolts ......................................................................... 16 2.2.1 Fatigue of bolts loaded in tension ............................................................................ 17 2.2.2 Fatigue bolts loaded in shear ................................................................................... 19 2.2.3 Combined axial and transverse loading on bolts .................................................... 23 2.2.4 Multiaxial fatigue ....................................................................................................... 23 2.2.5 Environmentally assisted cracking .......................................................................... 25
2.3 Conclusions, hypothesis, and research approach ........................................ 26 2.3.1 Conclusions ............................................................................................................... 26 2.3.2 Hypothesis ................................................................................................................. 27 2.3.3 Research approach ................................................................................................... 28
3 Experimental Methods .................................................................................................. 29 3.1 Introduction ..................................................................................................... 29 3.2 Common elements to both tests ................................................................... 29
3.2.1 Location setting and equipment .............................................................................. 29 3.2.2 Design of test frame and load transfer mechanism ............................................... 30 3.2.3 Fabrication................................................................................................................. 34
3.3 Loosening experiment .................................................................................... 35 3.3.1 Test matrix for loosening experiment ...................................................................... 35 3.3.2 Test setup for loosening experiment ....................................................................... 36 3.3.3 Instrumentation plan ................................................................................................ 38 3.3.4 Loosening test protocol ............................................................................................ 39
3.4 Multiaxial fatigue experiment ........................................................................ 40 3.4.1 Test matrix for multiaxial fatigue.............................................................................. 40

ERDC/ITL TR-19-4 iv
3.4.2 General overview of the structure ............................................................................ 41 3.4.3 Instrumentation and data collection ........................................................................ 43 3.4.4 Test and specimen configuration ............................................................................. 43 3.4.5 Multiaxial fatigue protocol ........................................................................................ 43
4 Results of Loosening Experiments .............................................................................. 44 4.1 Introduction ..................................................................................................... 44 4.2 Results of bolt loosening tests ....................................................................... 44 4.3 Discussion and analysis of results ................................................................ 45
4.3.1 Friction coefficients ................................................................................................... 46 4.3.2 Discussion of loosening results and plots ............................................................... 47
5 Experimental Results of Multiaxial Fatigue of Bolts with Initial Loss of Preload ............................................................................................................................ 51 5.1 Introduction ...................................................................................................... 51 5.2 Results of multiaxial tests on high-strength bolts ......................................... 51 5.3 Discussion and analysis of results ................................................................ 53
5.3.1 Failure profiles .......................................................................................................... 53 5.3.2 S-N curves.................................................................................................................. 58
6 Summary and Conclusions ........................................................................................... 61 6.1 Summary .......................................................................................................... 61 6.2 Conclusions ...................................................................................................... 61
References ............................................................................................................................. 63
Report Documentation Page

ERDC/ITL TR-19-4 v
Figures and Tables
Figures
Figure 1. Axial oscillation setup from (Goodier and Sweeney 1945). ................................... 9 Figure 2. Schematic of a typical transverse vibration loosening experiment (Pai and Hess 2002). ....................................................................................................................... 11 Figure 3. Thread slip accumulation with points of stick, slip and strain for each point during the shear reversal. .............................................................................................. 12 Figure 4. Two stages of loosening and nut rotation (adapted from Jiang et al. 2003). ........................................................................................................................................ 13 Figure 5. Typical plot of displacement amplitude vs. number of cycles (Jiang et al. 2003). ........................................................................................................................................ 14 Figure 6. Bolt subjected to cyclic tension and crack nucleation at the first engaged thread (Schijve 2001). ............................................................................................. 19 Figure 7. Loosening fatigue mechanism (Hashimura and Socie 2006). ............................ 22 Figure 8. Categorization of multiaxial fatigue approaches according to You and Lee (1996). ............................................................................................................................... 24 Figure 9. (a) Frame front elevation. (b) Frame side elevation. ............................................. 30 Figure 10. Load transfer elevation cut (dimensions in mm). ............................................... 32 Figure 11. Load transfer internal cut front view (dimensions in mm). ................................ 33 Figure 12. Load transfer front elevation (dimensions in mm). ............................................ 33 Figure 13. Top box, back plate (dimensions in mm). ............................................................ 34 Figure 14. Height gage. ............................................................................................................ 34 Figure 15. (a) Magnetic drill, (b) Drill station for top 3 in. hole, (c) CNC machine with carbide endmill, (d) counterbore hole milled using CNC machine. ............................. 35 Figure 16. Setup for loosening test. ........................................................................................ 37 Figure 17. Front elevation......................................................................................................... 37 Figure 18. Side elevation. ........................................................................................................ 37 Figure 19. Bolt instrumentation. ............................................................................................. 39 Figure 20. Front view of the multiaxial setup. ........................................................................ 42 Figure 21. Horizontal actuator attached to back plate. ........................................................ 42 Figure 22. Overview of loosening of high-strength bolts. ..................................................... 45 Figure 23. Histogram of µ. ....................................................................................................... 46 Figure 24. (a) Before, and (b) after rotational loss of pre-tension. ...................................... 47 Figure 25. Plots of full loss of preload in regular A325. ...................................................... 48 Figure 26. Plots of partial loss in galvanized A325 bolts. .................................................... 49 Figure 27. Plots of no loss in galvanized A325 bolts. ........................................................... 50 Figure 28. Fractographic profile of specimen #2 (Galvanized 20S_20T N=43,423). ............................................................................................................................... 54 Figure 29. Fractographic profile of specimen #13 (Regular 20S_20T N=6,876). ............. 54

ERDC/ITL TR-19-4 vi
Figure 30. Fractographic profile of specimen #6 (Galvanized 16S_16T N=32,964). ............................................................................................................................... 55 Figure 31. Fractographic profile of specimen #20 (Regular 16S_16T N=53,484). .......... 55 Figure 32. Fractographic profile of specimen #10 (Galvanized 8S_8T N=838,878). ............................................................................................................................. 56 Figure 33. Fractographic profile of specimen #4 (Galvanized 10S_20T N=100,167). ............................................................................................................................. 56 Figure 34. Fractographic profile of specimen #15 (Regular 10S_20T N=228736). ......... 57 Figure 35. Fractographic profile of specimen #9 (Galvanized 8S_16T N=180070). .............................................................................................................................. 57 Figure 36. Fractographic profile of specimen #22 (Regular 8S_16T N=136232). ........... 58 Figure 37. Galvanized A325 tension S-N curve. .................................................................... 59 Figure 38. Regular A325 tension S-N curve. ......................................................................... 59 Figure 39. Galvanized A325 shear S-N curve. ..................................................................... 60 Figure 40. Regular A325 shear S-N curve. ............................................................................ 60
Tables
Table 1. Hole clearance for different thread fits (Nassar and Housari 2007). ................... 15 Table 2. Fatigue tests on untightened bolts (Fisher et al. 1952). ........................................ 18 Table 3. Endurance of pre-tensioned bolts-mean load of five tons with an alternating load =±2.5 tons (Fisher et al. 1952). .................................................................. 18 Table 4. Test matrix of loosening tests. .................................................................................. 36 Table 5. Test matrix for multiaxial fatigue of high-strength bolts. ........................................ 41 Table 6. Results for regular A325 bolt loosening. ................................................................. 44 Table 7. Results for galvanized A325 bolt loosening. ........................................................... 45 Table 8. Results of multiaxial fatigue on high-strength bolts. .............................................. 52

ERDC/ITL TR-19-4 vii
Preface
This study was conducted for the Navigation System Research Program, U.S. Army Engineer Research and Development Center (ERDC), project #19735 “Redesign of Miter Gate Pintle Sockets and Connections.” The Technical Monitor was Mr. Charles E. Wiggins.
The work was performed by the Computational Analysis Branch (CAB) of the Computational Science and Engineering Division (CSED), ERDC-Information Technology Laboratory (ERDC-ITL). At the time of publication, Dr. Jeffrey L. Hensley was Chief of the CAB, ERDC-ITL; Dr. Jerrell R. Ballard, Jr. was Chief of the CSED, ERDC-ITL; and Mr. David R. Richards was the Technical Director for ERDC-ITL. The Deputy Director of ERDC-ITL was Ms. Patti S. Duett and the Director was Dr. David A. Horner.
The Commander of ERDC was COL Ivan P. Beckman and the Director was Dr. David W. Pittman.

ERDC/ITL TR-19-4 viii
Unit Conversion Factors
Multiply By To Obtain
cubic feet 0.02831685 cubic meters
cubic inches 1.6387064 E-05 cubic meters
degrees (angle) 0.01745329 radians
feet 0.3048 meters
inches 0.0254 meters
inch-pounds (force) 0.1129848 newton meters
kilopounds (force) 4.4482216 kilonewtons
pounds (force) 4.448222 newtons
pounds (force) per foot 14.59390 newtons per meter
pounds (force) per inch 175.1268 newtons per meter
pounds (force) per square foot 47.88026 pascals
pounds (force) per square inch 6.894757 kilopascals
pounds (mass) 0.45359237 kilograms
pounds (mass) per cubic foot 16.01846 kilograms per cubic meter
pounds (mass) per cubic inch 2.757990 E+04 kilograms per cubic meter
pounds (mass) per square foot 4.882428 kilograms per square meter
slugs 14.59390 kilograms
square feet 0.09290304 square meters
square inches 6.4516 E-04 square meters

ERDC/ITL TR-19-4 ix
Acronyms and Abbreviations Acronym Meaning
AASHTO American Association of State Highway and Transportation Officials
AREA American Railway Engineering Association
AISC American Institute of Steel Construction
CAB Computational Analysis Branch
CAFL Constant Amplitude Fatigue Limit
CHL Coastal Hydraulics Laboratory
CPM Cycles Per Minute
CSED Computational Science and Engineering Division
DoD Department of Defense
EAC Environmentally Assisted Cracking
EL Environmental Laboratory
ERDC Engineer Research and Development Center
HE Hydrogen Embrittlement
ITL Information Technology Laboratory
L Loss
NL No Loss
PL Partial Loss
RCSC Research Council on Structural Connections
HRC Rockwell Hardness
PID Proportional Integral Derivative
SCC Stress Corrosion Cracking
SLC Sustained Load Cracking
TR Technical Report
USACE U.S. Army Corps of Engineers

ERDC/ITL TR-19-4 1
1 Introduction 1.1 Statement of the problem
The use of high-strength bolts in steel structures is widespread. They are regarded as the better option for connections subjected to fatigue when compared to welds and rivets. These connections are designed with fully pre-tensioned bolts to clamp the plates, creating what is known as a “slip-critical connection.” Nevertheless, sufficient observations and reports exist to suggest the possibility of fully pre-tensioned, high-strength bolts coming loose due to shear stress reversals. A recent application of properly pre-tensioned bolts subjected to shear stress reversals shows extensive fatigue cracking, including severing of up to 50% of the bolts in the connections.
Slip-critical connections are widely used in structures (e.g., bridges, cranes, transmission towers, and wind turbine towers). The first nine versions of the American Institute of Steel Construction (AISC) Specification (up to 1949) had no mention of the concept of slip-critical connections, and the capacity of bolts in shear was considered comparable to rivets (AISC 1934–1949). The first appearance of the concept of slip-critical bolted connections was in the AISC (1961) specification, with reference to research conducted by the Research Council on Structural Connections (RCSC 1951, 1954).
Currently, the AISC has developed and updated their recommendations. The following is the specific injunction regarding when slip-critical connections should be used in the RCSC (2009) specification for structural joints using high-strength bolts.
“Slip-critical joints are required in applications involving shear or combined shear and tension in the following cases (RCSC 2009):
• joints that are subject to fatigue load with reversal of the loading direction,
• joints that utilize oversized holes, • joints that utilize slotted holes, except those with applied load
approximately normal (within 80 to 100 degrees) to the direction of the long dimension of the slot and,

ERDC/ITL TR-19-4 2
• joints in which slip at the faying surfaces would be detrimental to the performance of the structure.”
However, not much attention has been given to the potential loss of pre-tension due to shear cyclic loading at loads below, and close to the slip load, as a precursor to bolt fatigue in slip-critical joints.
The aerospace and automotive industries have conducted considerable research concerning the fatigue failure of bolts and their loosening due to transverse vibration. In structural and civil industries, however, high-strength structural bolts have not been studied as extensively under cyclic shear.
It is important to note that when a bolt is properly pre-tensioned, fatigue life should not be of concern as long as the pre-tension load is not overcome by the applied tension load (Fisher et al. 1952). However, it has been shown that when sufficient shear force is applied throughout a series of cycles to a properly pre-tensioned bolt, loosening will take place (Junker 1969, 1973; Nassar and Housari 2007; Yokoyama et al. 2012). It is worth noting that previous studies have been conducted on non-structural bolts that demonstrate their potential for loosening under a shear force that is lower than 59% of the force that causes slip of the head (Pai and Hess 2002; Dinger and Friedrich 2011). In this case, loosening of the bolt will occur due to localized slip at the threads, and at slower rates. It is therefore logical to hypothesize that there is a potential for loosening of slip-critical connections using structural bolts at loads below, yet close to the slip-load, and such a hypothesis merits further evaluation.
1.2 Purpose
The purpose of this project is to determine the causes for bolt failure found during scheduled inspections in the connection between the Pintle socket and Miter Gate bottom girder of canal lock gates. These large hydraulic structures are a crucial component of the infrastructure systems that enable wealth creation through national and international trade. Any failure of these structures would be catastrophic, possibly creating enormous economic losses, not to mention potential loss of life. Furthermore, there are prospective economic gains to be achieved by improving the connection reliability and reducing the need for repair with added stop times.
ERDC/ITL TR-19-4 3
1.3 Objective and scope of research
The specific objective of this research project is to shed light on the causes of bolt loosening and fatigue failure of bolted connections, especially those that are subjected to cyclic loads in multiple directions with shear reversals, these are typical of miter-gate-to-pintle socket connections.
Certain mechanisms mark the onset of bolt loosening and fatigue when bolts are subjected to cyclic shear or shear combined with tension. The actual mechanisms and limits when this occurs are explored in the literature, experimentally, and recommendations are provided.
1.4 Organization
This technical report (TR) is divided into six chapters. Following the introductory chapter (Chapter 1), Chapter 2 is a review of existing literature on the topics of loss of preload and bolt fatigue. Chapter 3 contains the experimental methods which include information on the fabrication and design of both tests, including a test matrix and test protocol for each test. Chapters 4 and 5 discuss the results obtained experimentally for loosening of bolts subjected to cyclic shear and multiaxial fatigue of bolts, respectively. Chapter 6 summarizes and extracts conclusions of the findings and makes recommendations.
ERDC/ITL TR-19-4 4
2 Literature Review: Causes of Failure in High-Strength Bolts
2.1 Loss of pre-tension in bolts
The problem of bolt loosening ranges from early stage loss of pre-tension due to plastic deformations, to nuts fully rotating loose from bolts. The most common occurrence of total self-loosening has always been in applications with high levels of vibration, such as train tracks and automobiles. The issue of nuts rotating loose is more than a century old as registered by early patent records. Since the late 1800s, there have been various patents recommending improvements in fastener design to stop bolts from inadvertently loosening on the joints. For example, a proposed nut-locking method for preventing railroad fasteners from rotating loose was suggested by Kaylor (1873), where a pliable metal washer with a layer of hard rubber underneath was used. The rubber forces the washer to bend around the corners of the nut under the pressure of the preload, attempting to prevent the nut from rotating. The effectiveness of this solution is questionable since it reduces the stiffness of the connection, subjecting the bolt to carry the load excursions and making it more prone to fatigue. Nevertheless, this is one example of many similar patents that reveal the incidence of bolt loosening during the mid-eighteen-hundreds.
Numerous experiments have been conducted to isolate the causes of the loosening problem. Early tests by German engineers in the 1930s attributed loosening to plastic deformation within the fastener and on the joint surfaces (Boomsma 1955). The problem of sustained loss of pre-tension was studied experimentally via load oscillation in a variety of experiments without being able to entirely replicate the issue. The problem was not entirely isolated until transverse vibration was finally evaluated by Junker and Strelow (1966). Although further work has been completed since then, this test method still remains the benchmark in the aerospace and automotive industries for testing the potential for loosening of fasteners under vibration.
Subsequently, Hashimura and Socie (2006) studied fatigue and loosening as a coupled phenomenon under transverse load. These studies, however, were limited to the automotive industry and its unique bolt sizes and classes.
ERDC/ITL TR-19-4 5
The following is a discussion of the causes for loss of pre-tension (alternatively called loosening) of bolts, by which joints lose their clamping force. Subsequently, the studies on the fatigue behavior of bolts, in relation to loosening, are summarized and discussed. Finally, a brief discussion of the effects of combined longitudinal and transverse cyclic loading on the fatigue and loosening of bolts is included.
2.1.1 Non-rotational loss of pre-tension
The causes of non-rotational loss of pre-tension are numerous and researchers have explored each aspect to some extent in the past century. However, the contribution that non-rotational losses make to the total potential loss of pre-tension is relatively small, and not all causes need be considered for a given connection. These causes include embedding, creep, relaxation, yielding, thermal gradients, and wear. These issues are discussed in some detail in the following sections.
2.1.1.1 Embedding loss
Embedding loss is due to localized plastic deformation of the surfaces at molecular contact points beneath the head and the nut and in between joint surfaces. This loss amounts to about 10% of the total preload. Researchers have found that once tightening has been established, approximately 80% of this type of loss occurs when it is first loaded under service loads, and that the remaining 20% occurs over time (Meyer and Strelow 1972). The design of the joints usually accounts for embedding loss.
2.1.1.2 Creep in gaskets
Gasket creep occurs when soft sealing materials between stiffer joint metals experience a reduction in their seating stress over time. Gaskets are mostly used in pressure pipes and automobiles to produce a tight seal where leaks are to be avoided. Recent developments have improved this issue with respect to previous design methods by enforcing leak tightness of the joint to prevent emissions. These improvements are achieved by taking into consideration parameters such as the creep factor of the gasket, the scattering due to the tightening of the device, the unloading compressive modulus of elasticity of the gasket, and the rate of change of said modulus of elasticity with compressive stress (Zerres and Guérout 2004).

ERDC/ITL TR-19-4 6
2.1.1.3 Surface coating creep
To avoid corrosion, bolts and joint components are coated with a material lower on the galvanic scale than steel. Zinc is a common material used and is applied via electro-plating or hot-dip galvanizing, providing a coating thicknesses of 8 µm and 40 µm, respectively. This can become an issue when the bolt is holding together several plates with zinc layers, generating an added total deformable zinc thickness that could be greater than the elongation of the bolt produced by the preload. Yang and DeWolf (1999) conducted a study that tested several coating materials. They determined that the loss of clamping force in galvanized steel high-strength bolts is primarily due to creep strain in the galvanized coating. The creep strain (Equation 1) can be represented as
ε (t) = α +β tm (1)
2.1.1.4 Stress relaxation
Very similar to creep, stress relaxation is a long term loss. This occurs when a high level of stress is applied, initially producing a strain that is maintained through time. This is a phenomenon governed by temperature and the level of stress/strain at which the material is maintained. Moreover, different materials have different behaviors in this respect. For instance, Tendo et al. (2001) found that in the case of type 304 N plates and cold-rolled type 304 plates, deformation could not be observed and the decrease in the bolt stress was no more than 2%.
2.1.1.5 Yielding caused by loading
Given that bolts are preloaded at stresses slightly below or at the yield stress of the material, additional loads large enough to overcome the clamping force add to the preload of the bolt, this may cause it to yield or exceed the yield stress. The design considerations for the joint normally account for this.
2.1.1.6 Differential thermal expansion
Because the bolt shaft is contained inside the air gap of the bolt hole, which is then sealed by the clamping head and nut, it can cool or heat at a slower rate than the surrounding joint materials. This produces a variation in the clamp force, which according to Sears and King (2004), can produce fugitive emissions on flanged joints of pressure pipes where connections

ERDC/ITL TR-19-4 7
must stay within tight tolerances. However, this reduction in the preload is temporary and does not account for sustained loosening.
2.1.1.7 Loosening via wear of the clamped parts
In some cases, the design of the joint requires the accommodation of movements through a specific degree of friction. For example in railroads, such is the case of fishplates that secure rail sections together and sustain movement from the rails expanding and contracting. In this instance, a bolted joint can sustain fretting wear, this could produce a brown powder called “cocoa” (Sakai 2008). The presence of the powder is an indication of the loss of material corresponding to loss of pre-tension.
Microslip is another cause of this type of wear, this can occur in many locations on the joint, including regions away from the bolt when it is properly pre-tensioned, and on the bolt itself. It is however more likely to occur first in regions away from the hole because clamping force drops with distance from the bolt. In their study of uncertainties in bolted joints, Ibrahim and Pettit (2005) considered wear through micro-slip in regions away from the hole as a damping mechanism. This varied non-linearly with the amplitude of the tangential force. Pai and Hess (2003) studied micro-slip on the threads and found that it can accumulate and lead to complete slip and rotational self-loosening of a bolt.
2.1.2 Rotational self-loosening
Rotational self-loosening, also known simply as loosening, is the type of loss of pre-tension that has generated the most concern, as it can propitiate sudden and catastrophic failures. This is a widely recognized failure mechanism in the automotive and aeronautical industries. For example, Toyota recalled 26,830 Tacoma pickup trucks from 2005–2011 due to issues with a loosening fastener that presented a major risk of seat belt failure (Transport Canada 2013). Additionally, in a report on the investigation of the 20 August 2011 crash of the Unmanned Aerial Vehicle, EQ-4B Global Hawk, T/N 04-2017 from the U.S. Air Force, insufficient cap screw torque was cited as a contributory factor to the mishap (Lozier 2012). The following is a summary of the historic progression in research toward a better understanding of the causes of rotational self-loosening.
ERDC/ITL TR-19-4 8
2.1.2.1 Axial loading and vibration
The first theories about rotational self-loosening were based on the assumption that an oscillatory axial load on the bolt would have the effect of rotating the nut loose. The first researchers to propose a theory of axially loaded loosening were Goodier and Sweeney (1945). In their study, 19 mm (3/4 in.) bolts were loaded from 2.22 kN to 26.69 kN (500 lb to 6000 lb) in tension while monitoring the rotation of the nut. The maximum rotation detected was 2 degrees, and the minimum was 0.7 degrees in 500 cycles. Figure 1 illustrates the arrangement used to conduct axial loading tests.

ERDC/ITL TR-19-4 9
Figure 1. Axial oscillation setup from (Goodier and Sweeney 1945).
2.1.2.2 Torsional loading
The study conducted by Yokoyama et al. (2012) investigated the self-loosening of bolted joints under rotational loading and was concerned with the relationship between the loosening torsion and tightening torsion when subjected to rotational loading. The bolts tested were M14 (0.55 in. diameter) with a grip length of 160 mm (6.3 in.), and were located between two rotating plates with sensors for bolt head rotation, bolt shaft torsion, and pre-tension. The results of the study confirmed that loosening does occur when the thread surface undergoes complete slip. It was determined

ERDC/ITL TR-19-4 10
that the argument needs to hold true for there to be sustained loosening (Equation 2)
TSL<TW<TST (2)
Where:
TSL is the torque required to cause slip on the threads in the loosening direction,
TST is the torque required to cause slip on the threads in the tightening direction, and
TW is the torque required to cause slip on the bearing surface.
2.1.2.3 Transverse vibration
Pioneered by Gerhard Junker (1969), bolt loosening has been experimentally investigated in a variety of setups. Junker’s innovative device was designed for testing loosening of fasteners caused by transverse vibration. Junker carried out tests on hex head cap screws (DIN 933, M10x1.5x30), and socket head cap screws, 1960 series, (3/8 in.–16 × 1–1/4 in.), subjecting them to a displacement controlled vibration. It was found that pre-tension was lost within 200–500 cycles, and is due to both rotation of the nut and relaxation of the material the bolt is in contact with. This result was obtained in several tests run at frequencies of 10 cycles per minute (cpm) and 3000 cpm. For both frequencies, a similar behavior was observed as a function of the number of cycles (Junker 1969), hence, showing that the phenomenon of loosening is independent of frequency. Notably, the plots of Transverse Force vs. Number of Cycles resemble fatigue S–N curves, this later led Hashimura and Socie (2006) to study fatigue and loosening together. In addition, it was concluded that when sufficient force was applied to overcome static friction and cause the head of the bolt to slip, there will be rotational self-loosening of the fastener. This term was coined as critical-slip. However, the concept of critical-slip has been revised by the concept of localized slip at the threads by Pai and Hess (2002). Figure 2 shows the basic test setup for a transverse vibration loosening experiment.

ERDC/ITL TR-19-4 11
Figure 2. Schematic of a typical transverse vibration loosening experiment (Pai and Hess 2002).
Pai and Hess (2002) tested 63.5 mm (2.5 in.) and 76.2 mm (3 in.) long grade 5 and grade 8, 0.5 UNC 13 (0.5 in. diameter and 13 threads per in.) screws with varying types of lubrication to induce different friction coefficients for the threads and the head. The results showed that loosening occurs at significantly lower shear forces than those required to initiate slip of the head. This occurs via localized slip in the threads, which is stored through friction on the back cycle and expands throughout the rest of the threads. In fact, the data showed that shear loads of 59%–66% of those required to cause complete slip of the head were sufficient to generate sustained loosening. The study highlighted the different factors contributing to loosening, and the source of loosening was eventually isolated through alternating types of lubricant on threads and head. Figure 3 shows the mechanism for the progressive loosening of a bolt via the accumulation of slip in the threads with varying direction of the shear force (Fs) throughout each cycle.

ERDC/ITL TR-19-4 12
Figure 3. Thread slip accumulation with points of stick, slip and strain for each point during the shear reversal.
Jiang et al. (2003) carried out an investigation of the early stage self-loosening of bolts under shear load. They designed their own experiment with an ability to run displacement and load control tests. Results showed that early stage self-loosening is caused by local cyclic plastic deformation in the threads. Jiang et al. (2003) shows the difference between early stage loosening and the faster rate of the second stage. Also, comparing displacement vs. load control tests, they were able to deduce that displacement between the plates is a more telling factor in loosening compared to the shear force (Figure 4).

ERDC/ITL TR-19-4 13
Figure 4. Two stages of loosening and nut rotation (adapted from Jiang et al. 2003).
After their initial investigations, Jiang et al. (2003) conducted another study using M12X1.75 (~0.5 in.) bolts preloaded up to 75% of the yield stress and subjected to transverse cyclic displacement. They found that the dividing line between early stage loosening and continued self-loosening was at 0.5 degrees of nut rotation. In the early stage, the loss of preload occurs because of non-rotational causes such as stress relaxation. This loss then initiates the second stage of self-loosening, where the rotation of the nut dominates the loss of preload. Additionally, the plots of the amplitude of the displacement vs. the number of cycles to failure resemble fatigue S–N plots. Figure 5 shows a typical plot of the displacement amplitude against the number of cycles to loosening. For this study, total loosening was considered to have happened when the preload reached 10% of its initial value.

ERDC/ITL TR-19-4 14
Figure 5. Typical plot of displacement amplitude vs. number of cycles (Jiang et al. 2003).
These plots are comparable to the ones developed by Junker (1969) where the transverse force applied to the bolt plotted against the number of cycles to complete rotational loosening resembles a fatigue S–N curve. Following this lead, Hashimura and Socie (2006) studied the loss of preload as a coupled phenomenon, namely loosening-fatigue under transverse load. This issue is discussed further in Section 2.2.2.
Nassar and Housari (2007) examined the effects of hole clearance and thread fit on self-loosening of threaded fasteners, and conducted tests on bolts with thread clearances of 3%, 6%, and 10% of the bolt’s nominal diameter. The bolts used in the study were hex head ½ in. 13 grade 5 with a thread fit of 2A and nuts fit that varied between 1B, 2B, and 3B. The machine used was a modified version of the Junker machine that added a bolt rotation sensor. It was concluded that when thread clearance is increased, loosening increases in a near-exponential fashion, assuming that the displacement amplitude is sufficient to cause slip of the head and fully consume the available hole clearance. Table 1 shows the percentage of hole clearance for different thread fits that this study evaluated (Nassar and Housari 2007). In Table 1, the nomenclature “1B-2A” for example, stands for a combination of 1B nut thread fit and 2A bolt thread fit.
Dinger and Friedrich (2011) contributed to the research conducted in this field with both a numerical and an experimental study. They obtained their data experimentally using a more sophisticated version of the now standardized Junker setup, which allowed for measuring bolt head dis-placement. The bolts tested were M10 (~3/8 in.) 60–10.9 (following ISO

ERDC/ITL TR-19-4 15
965 and DIN 13 specifications for the threads). The experimental study allowed for the confirmation that self-loosening is initiated when complete thread slip is achieved and localized slip at the head takes place though this type has a fairly lower rate of loosening than that occurring due to complete slip of the head.
Table 1. Hole clearance for different thread fits (Nassar and Housari 2007).
Hole Clearance (% of diameter)
Thread Fit 1B-2A 2B-2A 3B-2A
3% 3%/1B-2A 3%/2B-2A 3%/3B-2A 6% 6%/1B-2A 6%/2B-2A 6%/3B-2A 10% 10%/1B-2A 10%/2B-2A 10%/3B-2A
Jiang et al. (2013) conducted an experimental study of bolts in curvic couplings with rotational transverse loading. This study included testing of 51 mm (2 in.) long bolts with a diameter of 5.71 mm (3/32 in.) and a bolt head diameter of 8.88 mm (3/8 in.). The results confirmed that loosening due to cyclic transverse loading may be initiated through localized slip without complete slip at the bolt head, and that self-rotation of the nut occurs without complete slip of the bolt head.
Friede and Lange (2009) studied the loosening phenomenon on M20 10.9 bolts (0.79 in.) with a preload of 160kN (36 kip) achieved according to the DIN 18800-7 standard with a torque wrench. This is roughly equivalent to an A354 grade BD bolt with a 36 kip preload. A displacement of ±2 mm (0.08 in.) was applied to all specimens at frequencies of 0.2 to 1 Hz. Using Equation 3 for the marginal slip a, and varying the clamping length lk from 20 mm to 100 mm (0.79 in. to 3.94 in.), they found that all bolts would loosen. Nevertheless, the loosening would occur at different rates depending on the clamping length.
v kF μla
EI
3
12 (3)
Where:
Fv is the preload,
µ is the friction coefficient,

ERDC/ITL TR-19-4 16
lk is the clamping length,
E is Young’s modulus, and
I is the moment of inertia of the bolt section.
Although the 20 mm (0.79 in.) bolts, studied by Friede and Lange (2009), are the largest tested under the loosening scenario, all research on loosening of bolted connections was done predominantly within the automotive and aeronautical industries. Hence, the main focus of these loosening studies of fasteners is for automotive and aeronautical purposes under conditions of transverse vibration. However, it is important to note that so far no studies of self-loosening under transverse cyclic load have been performed on the sizes and classes of stainless steel, bronze, A325, or A490 high-strength structural bolts that are used in the construction of Miter Gates for the Pintle socket connections.
2.2 Fatigue of high-strength bolts
As previously indicated in Section 1, bolts could experience fatigue failure when subjected to axial tension cyclic loading if not properly preloaded, depending on the level of stress range applied. Substantial research has been conducted on the properties of bolts subjected to cyclic load along the longitudinal axis. Fisher and Beedle (1964) examined the existing literature on the topic of bolted and riveted joints up to that year, summarized several studies comparing bolts and rivets, and highlighted the higher fatigue strength of bolts in comparison to that of rivets. This is owing to the fact that bolts are preloaded, whereas rivets are not. These studies were accompanied by recommendations on tightening procedures for bolts to ensure proper preload and to resist slip.
High-strength bolts are the best means for connecting two members subjected to fatigue. Fisher and Beedle (1964) collected early studies that were conducted on the fatigue of bolts and rivets, with the earliest study dating back to 1938. The review of the literature shows the superior properties of high-strength bolts under fatigue. Munse (1970) also reported on extensive research conducted on rivets and high-strength bolts, and the fatigue characteristics of high-strength bolts was found to be superior to those of rivets and butt welds. Munse (1970) also concluded that the specifications for fasteners subjected to stress reversals that would cause fatigue was overly conservative (American Association of State
ERDC/ITL TR-19-4 17
Highway and Transportation Officials, (AASHTO),1 and American Railway Engineering Association, (AREA)). Munse (1970) suggested a reduction of 25% in the number of fasteners necessary for these types of connections from what was deemed necessary by the specifications. Munse (1970) noted that if holes are excessively oversized, an intolerable loss of clamping and reduction in fatigue resistance will result. Munse (1970) further concluded that the greatest fatigue resistance is always obtained with the highest clamping force. Each one of these early studies emphasized the importance of having the highest clamping force possible to increase the resistance to fatigue. Nevertheless, no cyclic shear tests were conducted.
2.2.1 Fatigue of bolts loaded in tension
As mentioned earlier, fatigue may be avoided in bolts under tension cyclic loading if the bolts are properly preloaded. Specifically, bolts will not fail due to fatigue as long as the service loads remain below those for which the joint was designed. Fisher et al. (1952) studied the effects of preloading on the fatigue life of bolts under tension. The study indicated that fatigue can be avoided with a proper level of pre-tension. In such cases, the preload will be sufficient to maintain pressure between the clamped plates under the maximum tension on the bolt. This relieves the bolt of the load fluctuation, and therefore, fatigue is not an issue. Table 2 and Table 3 summarize the results of the experiment conducted by Fisher et al. (1952).
1 AASHO (American Association of State Highway Officials) was changed to AASHTO (American Association of State Highway and Transportation Officials) November 13, 1973.

ERDC/ITL TR-19-4 18
Table 2. Fatigue tests on untightened bolts (Fisher et al. 1952).
Mean load 5 tons
Alternating Load (Tons) Endurance (Cycles)
2.5 143,000
2.5 84,500
2.5 199,000
2.5 143,000
2 295,000
1.65 554,000
1.5 1,020,000
1.45 15 million unbroken
1.28 15 million unbroken
Table 3. Endurance of pre-tensioned bolts-mean load of five tons with an alternating load =±2.5 tons (Fisher et al. 1952).
Bolt No.
Pre-tension
Endurance (Cycles) Load (Tons) Stress (Tons/in2)
1 0 0 143,000
2 1.38 3.9 73,000
3 2.41 6.85 89,800
4 3.88 11 333,000
5 5.8 16.4 519,000
6 6.54 18.5 10 million unbroken
7 7.9 22.4 11.6 million unbroken
8 9.57 27 13.2 million unbroken
Experiments have been conducted on bolts loaded in cyclic tension, including prying action (Astaneh et al. 1989). Astaneh et al. (1989) evaluated double-angle, beam-column connections, and subjected them to rotation. They were fastened using ¾ in. ribbed bolts that had been removed from an existing structure along with new ¾ in. diameter A 325 bolts. The resulting load configuration on the bolts was cyclic tension with some prying action. Astaneh et al. (1989) also determined that these idealized pinned ended connections would fail because of bolt failure due
ERDC/ITL TR-19-4 19
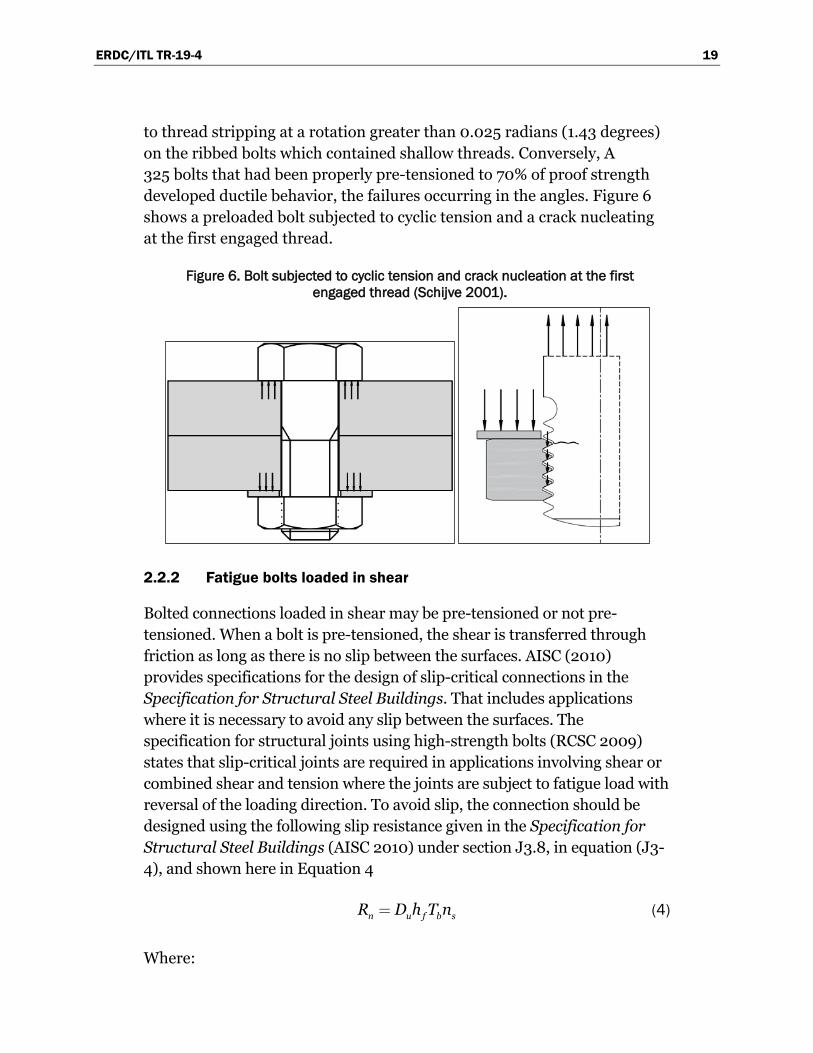
to thread stripping at a rotation greater than 0.025 radians (1.43 degrees) on the ribbed bolts which contained shallow threads. Conversely, A 325 bolts that had been properly pre-tensioned to 70% of proof strength developed ductile behavior, the failures occurring in the angles. Figure 6 shows a preloaded bolt subjected to cyclic tension and a crack nucleating at the first engaged thread.
Figure 6. Bolt subjected to cyclic tension and crack nucleation at the first engaged thread (Schijve 2001).
2.2.2 Fatigue bolts loaded in shear
Bolted connections loaded in shear may be pre-tensioned or not pre-tensioned. When a bolt is pre-tensioned, the shear is transferred through friction as long as there is no slip between the surfaces. AISC (2010) provides specifications for the design of slip-critical connections in the Specification for Structural Steel Buildings. That includes applications where it is necessary to avoid any slip between the surfaces. The specification for structural joints using high-strength bolts (RCSC 2009) states that slip-critical joints are required in applications involving shear or combined shear and tension where the joints are subject to fatigue load with reversal of the loading direction. To avoid slip, the connection should be designed using the following slip resistance given in the Specification for Structural Steel Buildings (AISC 2010) under section J3.8, in equation (J3-4), and shown here in Equation 4
n u f b sR D h T n (4)
Where:

ERDC/ITL TR-19-4 20
Rn is the available slip resistance,
µ is the mean slip coefficient for Class A or B surfaces as applicable and as follows or as determined by the following tests:
• For Class A surfaces (unpainted clean mill scale steel surfaces or surfaces with Class A coatings on blast-cleaned steel or hot-dipped galvanized and roughened surfaces), µ=0.30.
• For Class B Surfaces (unpainted blast-cleaned steel surfaces or surfaces with Class B coatings on blast-cleaned steel), µ=0.50.
Du is 1.13 a multiplier that reflects the ratio of mean installed bolt pre-tension to specified minimum bolt pre-tension. Other values may be stipulated by the engineer of record,
Tb is the minimum fastener tension given in Table J3.1 (kips), or Table J3.1M (kN),
ns is the number of slip planes required to permit the connection to slip, and
hf is the factor for fillers determined as follows:
• Where there are no fillers or where bolts have been added to distribute loads in the filler, hf = 1.0.
• Where bolts have not been added to distribute the load in the filler, for one filler between connected parts, hf = 1.0, and for two or more fillers between connected parts, hf = 0.85.
In the case of slip-critical connections, stress is not concentrated on the contact interface between the bolt and the hole, but is transmitted through friction between the clamped parts. An essential factor is the friction coefficient between the plates, this determines the friction force that transfers the stresses throughout the jointed components. When the static friction is overcome, several mechanisms begin to take place that contribute to the load transfer mechanism and to the degradation of the joint surfaces. Ibrahim and Pettit (2005) noted that when slip occurs, friction coefficients change with each loading phase because of wear. This gradual degradation of the surfaces produces uncertainties.
Following the lead of the similarity of the loosening curves to the S–N fatigue curves developed for bolted and welded connection, Hashimura and

ERDC/ITL TR-19-4 21
Socie (2006) studied the coupled phenomenon of loosening and fatigue of bolted joints subjected to transverse vibration. The study included testing M10 bolts without washers and with threads in the shear plane. The experiment was run under displacement control with the use of rollers in between the plates to reduce friction. Preloads were applied only up to a maximum of 50% of the yield strength of the bolts. The study showed that if a bolt loosens in the low cycle region of 103–104 cycles, crack nucleation is not present, and therefore, the loss of pre-tension is attributable to rotational loosening. Alternatively, if the bolt loosened in the high cycle region of 105–106 cycles, a crack was observed at the root of the first engaged thread in every bolt tested (Hashimura and Socie, 2006). Figure 7 illustrates the different mechanisms by which a bolt may loosen or fatigue as presented by Hashimura and Socie (2006).

ERDC/ITL TR-19-4 22
Figure 7. Loosening fatigue mechanism (Hashimura and Socie 2006).
Start
Reduction of F due to strain ratcheting: Fr
(Fi-Fr)>Fth-L
Self-loosening with nut rotation(without fatigue
crack)
ΔPt/2>ΔPtw/2
Fatigue crack nucleation
Yes
Fatigue crack propagation
Self-loosening with nut rotation
(with fatigue crack)
YesNo
No loosening
a) Low cycle region loosening
b) High cycle region loosening
Stag
e 2
Stag
e 1
Stag
e 3
Stag
e 2
Stag
e 1
No
Where:
Fr = reduction of preload caused by strain ratcheting, Fi = the initial preload,

ERDC/ITL TR-19-4 23
Fth−L = the threshold preload below which rotational loosening occurs, ΔPt/2 = the amplitude of the cyclic transverse force, and ΔPtw/2 = the threshold amplitude of transverse force above which
fatigue takes place.
2.2.3 Combined axial and transverse loading on bolts
The AISC (2010) specifies that for a combination of loading in the axial and transverse direction, Equation 5 can be used to determine a reduction factor to multiply by the available bolt slip resistance. Rn is obtained by Equation 4.
usc
u b b
Tk
D T n 1 (5)
Where:
Ksc is the reduction factor to be multiplied by Rn (Equation 4),
Tu is the required tension force using LRFD load combinations in kips or kN,
nb is the number of bolts carrying the applied tension,
Du is as defined previously in Section 2.2.2, 1.13, and is a multiplier that reflects the ratio of mean installed bolt pre-tension to the specified minimum bolt pre-tension, and
Tb is the minimum fastener tension given in the AISC Specifications (AISC 2010) Table J3.1 (kips) or Table J3.1M (kN).
The Ksc factor varies from zero to one, and is exactly zero when the tension per bolt is equal to the preload. Therefore, it simply states that when the applied tension is enough to nullify the contact force, the slip resistance is completely eliminated.
2.2.4 Multiaxial fatigue
You and Lee (1996) reviewed and classified research conducted since 1980 on multiaxial fatigue. Most multiaxial assessments reduce multiaxial loading to an equivalent uniaxial loading. Approaches to multiaxial fatigue

ERDC/ITL TR-19-4 24
were classified by You and Lee (1996) into five different categories as shown in Figure 8. The results of this review study indicated that the major improvements in multiaxial fatigue assessment methods during this period were the consideration of material anisotropy and the application of Mohr’s circle within energy methods. Several models were investigated and their applications and limitations discussed.
Figure 8. Categorization of multiaxial fatigue approaches according to You and Lee (1996).
There are several types of loading in multiaxial fatigue. There can be either proportional or non-proportional loading, depending on whether the principal stress orientation stays the same with respect to the loading axes throughout the loading cycles, or if it rotates relative to the applied loads, respectively. In addition, the applied loading may be in phase, or out of phase, depending on whether the main loads are applied simultaneously, or asynchronously, with a shift in phase. The effects of these types of loading must be considered to appropriately describe the fatigue behavior of the material being analyzed given the predicted service loads (Socie and Marquis 2000).

ERDC/ITL TR-19-4 25
2.2.5 Environmentally assisted cracking
Esaklul and Ahmed (2009) compiled and summarized studies and tests on environmentally assisted cracking (EAC). EAC comprises stress corrosion cracking (SCC), hydrogen embrittlement, (HE) and sustained load cracking (SLC). High-strength steels, along with titanium alloys, and aluminum alloys are most vulnerable to EAC. However, research shows that fasteners with a Rockwell Hardness (HRC) bellow HRC34 (hardness measured on the Rockwell C scale as is the case for most structural steel) are not susceptible to environmentally assisted cracking.
Subsequently, Brahimi (2014) summarized the latest knowledge on HE of fasteners, shedding more light on the issue of HE as defined by theoretical advances and experimental research. SCC and SLC are now considered subsets of HE, this is defined as “a permanent loss of ductility in a metal or alloy caused by hydrogen in combination with stress, either externally applied or internal residual stress” (Brahimi 2014). HE is a mechanism of failure that occurs within a tensile stressed metal. Interstitial or diffusible hydrogen (hydrogen that is free to move) migrates to the point of highest stress concentration, making the steel brittle at that location. A crack eventually forms, and the hydrogen then migrates following the crack tip as the crack progresses until the point at which the element fractures.
With regard to the conditions of the fastener that precipitates the process, Brahimi (2014) states that there are the following three main components: (1) material susceptibility, (2) the presence of hydrogen, and (3) stress concentrations. The latter two components are triggers whose intensity may speed up, or slow down the process. The root of the phenomenon, and the most influential cause in the process, is material susceptibility due to poor material conditions arising from the manufacturing process. Studies show that within the properties that make a material susceptible to HE, the most important is hardness. The latest research consensus and standards arrive at the value of HRC 39 (±1.0), below which most materials with well controlled manufacturing processes will not be susceptible to HE. This is contrasted with the recommendation by some standards that define more conservative values ranging from 31–35 HRC. These have been adopted primarily as a precaution against manufacturing errors. However, in well controlled production processes, a value of 39 (±1.0) HRC has been established as the reference point for susceptibility.

ERDC/ITL TR-19-4 26
The above condition for avoiding EAC is met by both A325 and A490 bolts according to their production properties. Although EAC could factor into the process of failure, it is considered minor since existing structures for lock gates have been designed according to specifications that call for corrosion-resisting materials (U.S. Army Corps of Engineers (USACE) 1994).
2.3 Conclusions, hypothesis, and research approach
2.3.1 Conclusions
Fatigue studies on bolts under tension and shear have been reviewed with the conclusion that the problem of fatigue may be avoided with proper pre-tension of bolts. Therefore, the cause of fatigue must be linked to improper preload or loss of preload throughout the life of the bolt. Consequently, the following issues have been explored in this chapter:
First, many studies and theories addressing the problem of loss of pre-tension have been examined. It was found that the most accurate theories validated experimentally for the loss of pre-tension are the ones that isolate cyclic shear (both transverse and rotational) as the cause of the issue (Junker 1969, 1973; Nassar and Housari 2007; Yokoyama et al. 2012). Nevertheless, most of the research conducted has been done in the context of the automotive and aeronautical industries, no loosening studies have been conducted on proper structural bolts. However, the phenomenon of rotational self-loosening due to transverse vibration has been reduced to a critical cyclic displacement which occurs due to loading parameters including geometric factors and friction coefficients. Moreover, it has also been determined that the self-loosening phenomenon is independent from the frequency of the cyclic motion. Because of these two observations, this phenomenon may be extrapolated to larger structural bolts used in civil infrastructures, such as Miter Gates subjected to cyclic shear loads with lower frequencies, than those found in the automotive and aeronautical vibration loads.
The second phenomenon explored is the issue of fatigue once sufficient preload has been lost, including throughout the loosening process. It was found that the coupled phenomenon of rotational self-loosening and fatigue (Hashimura and Socie 2006) evidences a balance between the two, depending on several factors. Most important are the preload and the transverse force relative to the friction force. Consideration was also given

ERDC/ITL TR-19-4 27
to the increased rate of failure when considering the addition of tensile forces on the bolt. This has been provided for in the latest version of the AISC (2010) specification with a mathematical formula that considers the reduction in slip resistance due to a reduction in the contact force. However, other factors will need to be considered once the bolt begins to loosen and this expression should be verified experimentally.
Third, considering the lack of studies specifically on multiaxial fatigue of bolts, the available literature on the general topic of multiaxial fatigue, as condensed by You and Lee (1996) and Socie and Marquis (2000), was summarized, and their basic principles presented, serving as guidance for future studies concerning this more specific scenario.
Last, literature on the issue of environmentally assisted cracking, or HE, was reviewed. This provided a framework for deciding whether this is an issue for the bolts under consideration (including reference material) for use in other portions of the Miter Gates. It was found that this phenomenon is not of major concern when it comes to the bolts, given that they are usually below the hardness limits that cause HE.
2.3.2 Hypothesis
The failure phenomenon is most likely comprised of the following two processes: (1) the rotational loss of pre-tension, and (2) multiaxial fatigue.
If there is no slip, there should be no loosening, and therefore, fatigue would be present only at points on the plates where the stress is transmitted through contact between the clamped surfaces.
If there is slip, there are two possible scenarios:
• When loading is enough to generate localized slip at threads but not full slip of the head (force ~50% of force for slip of the head), there will be localized slip and a very low rate of loosening accompanied by fatigue cracks initiating at the root of the first engaged threads.
• When the mean force is sufficient to generate full slip of the head, there will be quick, sustained loosening in the range of 102 to 104 loading cycles.

ERDC/ITL TR-19-4 28
2.3.3 Research approach
Although extensive studies have been conducted on the topics of fatigue and loosening, future experimental investigations seek to gain fundamental understanding in how these phenomena may affect such large structural bolts as those used in lock gates. The development of these experimental data can provide the necessary understanding to improve the design specifications for these types of connections. From the results obtained experimentally, evaluation criterion of the existing structures may be surmised to accurately estimate their remaining life.

ERDC/ITL TR-19-4 29
3 Experimental Methods 3.1 Introduction
This chapter presents the experimental methods used for testing loss of preload and multiaxial fatigue. The tests were divided into two stages to isolate each behavior since the mechanisms for each occur at different ranges of stress cycles. Furthermore, fatigue deterioration of the bolt is dependent on whether the bolt loosens (Fisher et al. 1952). Therefore, the overarching process of failure, as illustrated in Chapter 2 where loosening acts as a precursor to fatigue, is studied by separating the two phenomena in order to understand each behavior independently. Nevertheless, the same frame and loading mechanism were used for both experiments. Therefore, this chapter is separated into three main sections.
The first section includes the common elements to both tests. These are the location, setting and equipment, design of the test frame, design of the load transfer mechanism, and fabrication. The remaining two sections detail each of the experiments, respectively. They include the test matrix, an instrumentation plan, and a test protocol for each experiment.
3.2 Common elements to both tests
This section expands on details of the location and setting for the experiment, the equipment used, the design criteria for both horizontal and vertical test frames, the design of the load transfer mechanism (two vertically adjacent built up box sections), and the part-out, shop drawings and fabrication of the experimental apparatus. All these components were used for the loosening experiment (Section 3.3) and the multiaxial fatigue experiment (Section 3.4).
3.2.1 Location setting and equipment
The experiments were carried out on top of a 0.61 m (2 ft) thick reinforced concrete block laying over a 0.61 m (2 ft) thick reinforced concrete strong-floor. This setting allowed for anchoring the frame down via four, 2 in. diameter threaded rods, each six ft long, to the concrete strong-floor. The setting is shown in Figure 9.

ERDC/ITL TR-19-4 30
Figure 9. (a) Frame front elevation. (b) Frame side elevation. (a) (b)
Each bolt was installed in the frame with two fatigue rated actuators, each capable of generating 110 kips of cyclic force at up to 4 Hz. One of the actuators was mounted vertically to act in tension, the other actuator was mounted horizontally to act in shear. The actuators were operated via a computer that signals to both an MTS system corporation hydraulic pressure system and an MTS system corporation controller in order to run the loading protocols.
3.2.2 Design of test frame and load transfer mechanism
This section describes the major components of the test setup, including the bidirectional test frame and the load transfer mechanism used to create the desired loading on the single test bolt. The first subsection describes the design criteria for both horizontal and vertical test frames. Subsequently, details on the built-up box sections used to transfer the loads are described.

ERDC/ITL TR-19-4 31
3.2.2.1 Bidirectional self-reacting frame
Both experiments were set within a bidirectional, self-reacting frame constructed of a horizontal and a vertical frame, each with its corresponding actuator. First, a horizontal self-reacting frame was connected via anchor bolts through the concrete block and into the concrete strong-floor. This horizontal frame provided support and the load path to a horizontal actuator that generated cyclic shear on the vertical bolt. Second, surrounding the horizontal frame was a vertical frame which stood on the concrete floor and supported a vertical actuator to produce cyclic tension on the vertical bolt. The cyclic tension was concentrated through the bolt and transferred via the load transfer mechanism to the horizontal frame and to the anchor rods. The actuator tension would produce a compression on the vertical structure that was taken by the concrete strong-floor. These frames were designed to take the maximum load output of the actuators under repeated loading. By checking and correcting fatigue prone details on the existing frames, all of the elements of these frames were adapted to keep stresses below the constant amplitude fatigue limit (CAFL) throughout the frames given the 110 Kip loading capacity provided by the actuators.
3.2.2.2 Load transfer mechanism design
Both horizontal and vertical load paths would transfer the shear and tension through the test bolt via the load transfer mechanism. These were designed as two vertically adjacent, built-up box sections. The interface between the top plate of the bottom section, and the bottom plate of the top section, would act as the shear plane of the bolted connection to be tested. The test bolt clamped together these two plates and was the only fastener connecting the top box to the bottom section.
To arrive at the final configuration, design calculations for different alternatives were carried out on MathCAD, and followed the design principles and standards set forth by the AAISC manual. Furthermore, finite element models were developed using ABAQUS to evaluate stresses at certain critical locations of the experimental apparatus. These stresses were the main constraint since they needed to be maintained below the CAFL to avoid fatigue cracks on the load transfer mechanism through the duration of the experiment at maximum loads. The CAFL for high-strength bolts that are snug-tight with cracks originating at the root of the first engaged thread is 48.26 MPa (7 ksi), and for bolt holes with cracks originating at the side of the holes is also 48.26 MPa (7 ksi). Given these

ERDC/ITL TR-19-4 32
inputs, and several iterations with different plate thicknesses and bolt locations and sizes, the final design was established. Drawings of this configuration can be seen in Figure 10–12
Figure 10. Load transfer elevation cut (dimensions in mm).
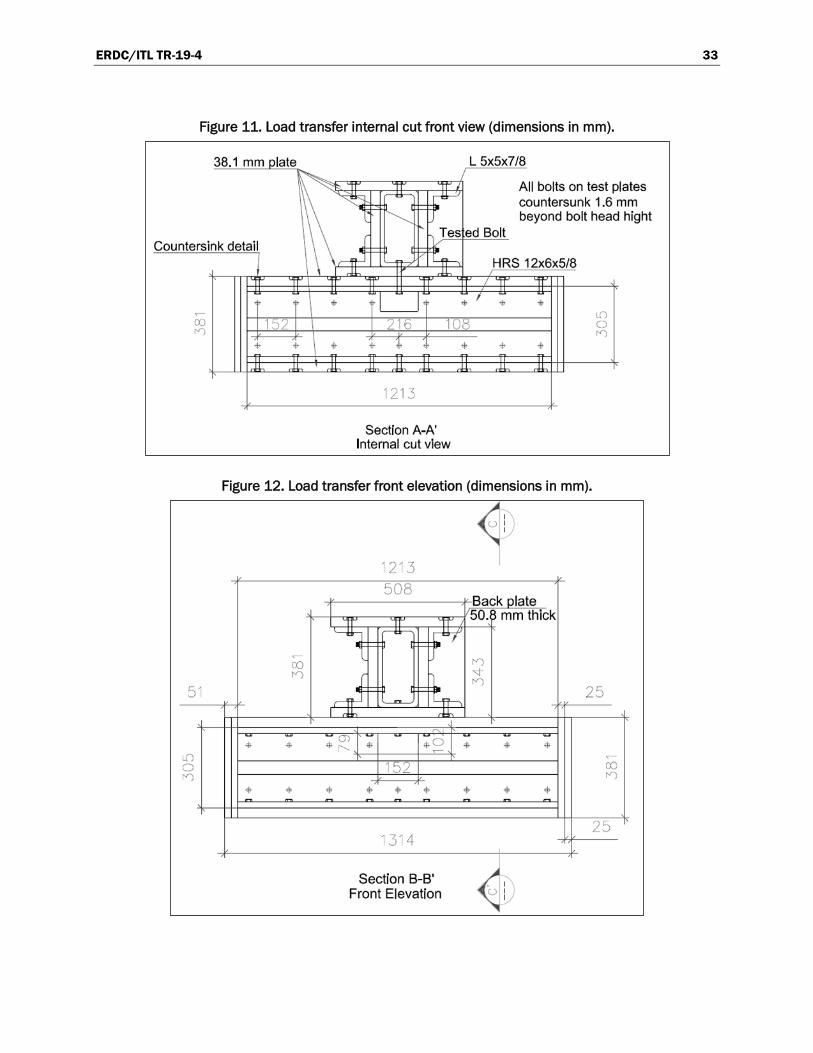
ERDC/ITL TR-19-4 33
Figure 11. Load transfer internal cut front view (dimensions in mm).
Figure 12. Load transfer front elevation (dimensions in mm).

ERDC/ITL TR-19-4 34
3.2.3 Fabrication
The design was broken down into individual part drawings for shop fabrication. Each part was accurately drawn for perfect fit. Pieces were marked and cut to size using a band saw. Next, each part was marked using a height gage with 100th in. precision to localize the hole positions.
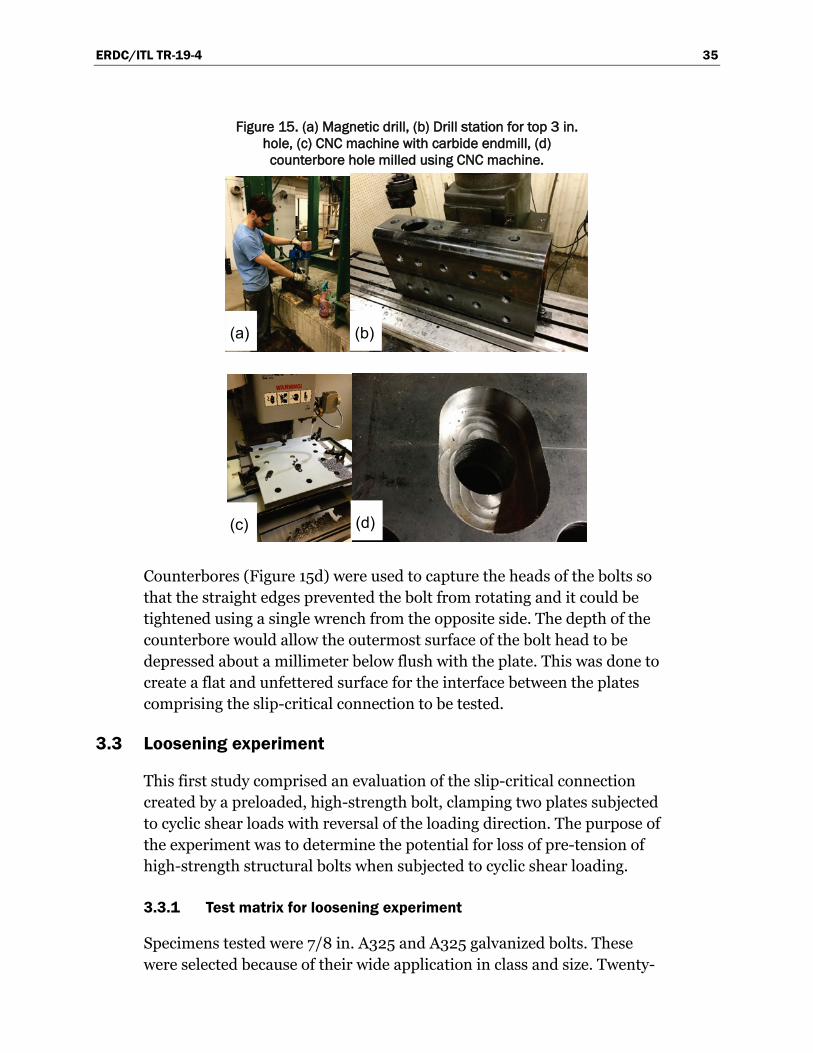
Figure 13 shows the detail of the counterbore holes to be milled using a titanium coated carbide endmill on the CNC machine. Figure 14 also shows the height gage used to mark directly on the plates the crosslines for each hole location. Each piece was squared against the table and marked accordingly. The holes and counterbores were then drilled using various drilling and milling methods. Figure 15 shows the methods used and a sample counterbored hole.
Figure 13. Top box, back plate (dimensions in mm).
Figure 14. Height gage.
ERDC/ITL TR-19-4 35
Figure 15. (a) Magnetic drill, (b) Drill station for top 3 in. hole, (c) CNC machine with carbide endmill, (d) counterbore hole milled using CNC machine.
Counterbores (Figure 15d) were used to capture the heads of the bolts so that the straight edges prevented the bolt from rotating and it could be tightened using a single wrench from the opposite side. The depth of the counterbore would allow the outermost surface of the bolt head to be depressed about a millimeter below flush with the plate. This was done to create a flat and unfettered surface for the interface between the plates comprising the slip-critical connection to be tested.
3.3 Loosening experiment
This first study comprised an evaluation of the slip-critical connection created by a preloaded, high-strength bolt, clamping two plates subjected to cyclic shear loads with reversal of the loading direction. The purpose of the experiment was to determine the potential for loss of pre-tension of high-strength structural bolts when subjected to cyclic shear loading.
3.3.1 Test matrix for loosening experiment
Specimens tested were 7/8 in. A325 and A325 galvanized bolts. These were selected because of their wide application in class and size. Twenty-
(a) (b)
(c) (d)

ERDC/ITL TR-19-4 36
three 7/8 in. A325 bolts, and Twenty-seven 7/8 in. galvanized A325 bolts were tested under cyclic shear at varying percentages of the slip load. (Table 4).
Table 4. Test matrix of loosening tests.
Test Matrix of Loosening Tests (all 7/8 inch diameter bolts)
% of Rn A325 A325 Galv.
60% 5 0
70% 7 3
80% 7 4
90% 3 9
95% 0 7
98% 1 4
Total 23 27
3.3.2 Test setup for loosening experiment
The bolt being tested connected and clamped the bottom plate of the top box to the top plate of a lower, orthogonally placed, built-up section that closed the loop and returned the load back to the frame. As such, the bolt was the only connecting element between the two shear plates. Each of these shear plates had a thickness of 1.5 in. These were built-up, bolted sections with counterbored holes where necessary to provide a flat surface for the horizontal shear interface plane. For this experiment, the vertical actuator was not used to isolate the effects of cyclic shear on the loosening phenomenon as explored in the literature. Lateral bracing was provided by placing angles on the sides of the top box, bolted to the bottom section, and greased on the sides to avoid creating additional friction. A chain hoist was used as a vertical brace for the actuator knuckle to reduce torsional loading, thus, eliminating any prying action. Figure 16 shows the physical setup while Figure 17 and Figure 18 show drawings of the front view of the test and a side sketch of the arrangement, respectively.

ERDC/ITL TR-19-4 37
Figure 16. Setup for loosening test.
Figure 17. Front elevation.
Figure 18. Side elevation.
Additionally, as seen in Figure 17 and Figure 18, the double box design for transferring tension and shear loads to the bolt was further refined to be integrated to the frame reacting system. Torsional and shear support for the next experiment, in which vertical tension would be applied, was

ERDC/ITL TR-19-4 38
provided by anchoring the load transfer mechanism via a bolted connection to a hollow rectangular section attached under the horizontal frame.
3.3.3 Instrumentation plan
Several alternatives were considered for measuring the preload on the bolt. The method selected was a rosette strain gage attached to the shank of the bolt and wired through a hole in the head. This was done in order to collect data for the torque and the tension on the bolt. This was done by shaving a small portion off from the side of the bolt shank and inserting the wires through a hole in the bolt head adjacent to the shaved section. The strain gage was attached using the adhesive described below. This strain reading would then be converted into a corresponding stress using an elastic modulus of 200,000 MPa (29,000 ksi) for the bolt steel. The preload was calculated using the cross-sectional area at the location of the strain gage.
3.3.3.1 Properties of strain gauges
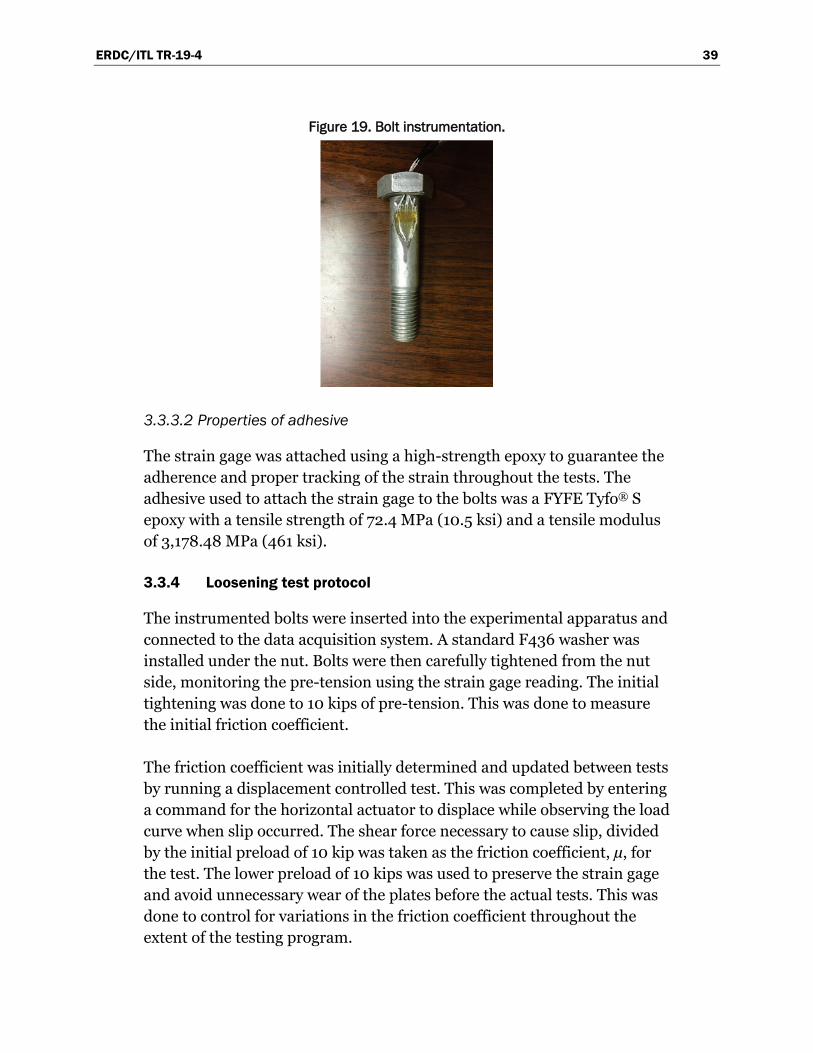
Strain gages were used to determine the preload during tightening and throughout the test. Strain gage selection was done considering the size and necessary strain readings. The strain gages used for this experiment were rosette strain gages from Omega (reference number KFH-3-350-D17-11L3M3S). These had a 350 ohm resistance on a 3 mm grid for each direction, including one vertical along the length of the bolt, and two at 45 degrees on either side. One rosette strain gage was attached to each bolt on the side (Figure 19).
ERDC/ITL TR-19-4 39
Figure 19. Bolt instrumentation.
3.3.3.2 Properties of adhesive
The strain gage was attached using a high-strength epoxy to guarantee the adherence and proper tracking of the strain throughout the tests. The adhesive used to attach the strain gage to the bolts was a FYFE Tyfo® S epoxy with a tensile strength of 72.4 MPa (10.5 ksi) and a tensile modulus of 3,178.48 MPa (461 ksi).
3.3.4 Loosening test protocol
The instrumented bolts were inserted into the experimental apparatus and connected to the data acquisition system. A standard F436 washer was installed under the nut. Bolts were then carefully tightened from the nut side, monitoring the pre-tension using the strain gage reading. The initial tightening was done to 10 kips of pre-tension. This was done to measure the initial friction coefficient.
The friction coefficient was initially determined and updated between tests by running a displacement controlled test. This was completed by entering a command for the horizontal actuator to displace while observing the load curve when slip occurred. The shear force necessary to cause slip, divided by the initial preload of 10 kip was taken as the friction coefficient, µ, for the test. The lower preload of 10 kips was used to preserve the strain gage and avoid unnecessary wear of the plates before the actual tests. This was done to control for variations in the friction coefficient throughout the extent of the testing program.

ERDC/ITL TR-19-4 40
Following the friction test, lines were drawn on the bolt shank tip and the nut, such that they were aligned at snug-tight to visualize whether the nuts rotated during the test. Subsequently, for each proper test done under force control, the instrumented bolt was tightened to the requisite preload of 39 kip as indicated in the AISC (2010) table J3.1 for the size of bolts used. Finally, before initiating the test, a picture of the bolt was taken at its tightened position.
After preloading the bolt, a sine wave loading pattern was programed on the controller and data acquisition was initiated. The loading pattern was created for each bolt depending on the friction coefficient and the percentage of the preload desired. This was done at various frequencies throughout the testing program. Finally, the cyclic shear loading procedure was initiated and run until either the bolt was completely loose, or sufficient cycles had occurred without loosening.
3.4 Multiaxial fatigue experiment
The second study evaluated the fatigue life of bolts subjected to multiaxial loading. It is well known that a bolt will fail under fatigue when there is an initial lack of pre-tension, or when it is lost or diminished through transverse (shear) cyclic loading. This study adds the combined tension effect to the shear loading to assess fatigue life reductions caused by the combination of stresses on a bolt with initial loss of pre-tension.
3.4.1 Test matrix for multiaxial fatigue
Specimens tested were 7/8 in. A325 and A325 galvanized bolts. These were selected because of their wide application in class and size. Several load combinations of shear and tension were applied to the test specimens. A total of twenty-four bolt specimens, twelve for each type of bolt, were included in the test matrix (Table 5).
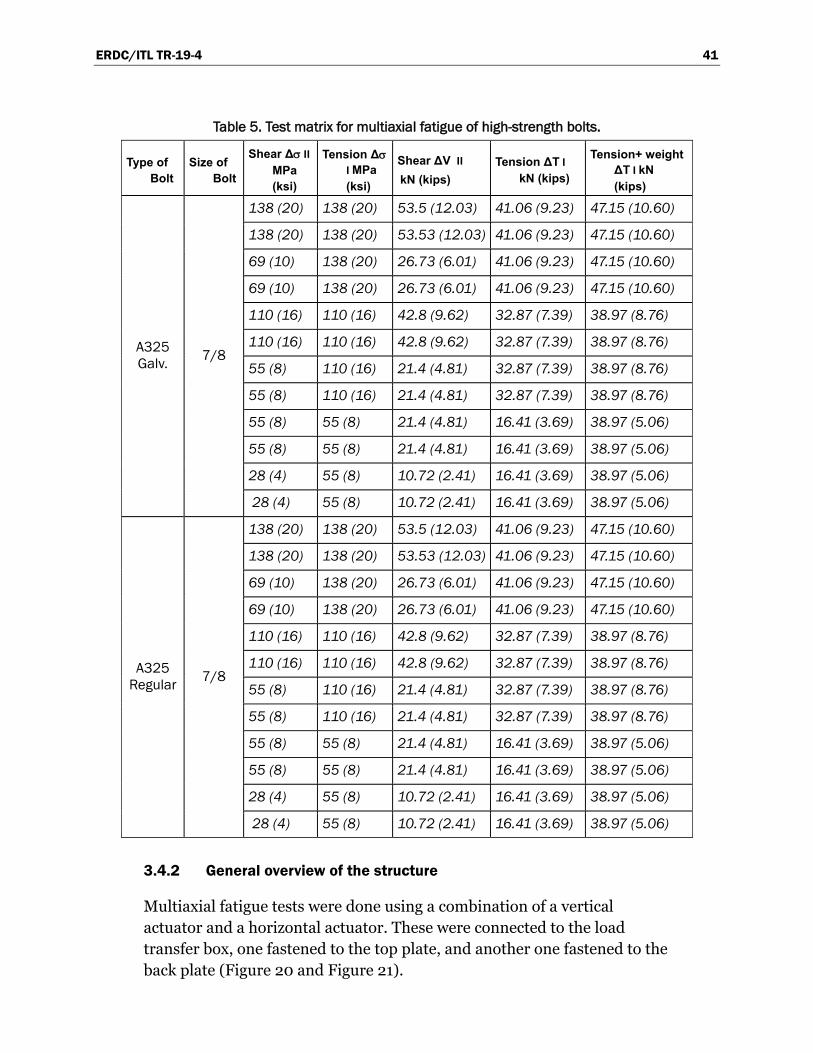
ERDC/ITL TR-19-4 41
Table 5. Test matrix for multiaxial fatigue of high-strength bolts.
Type of Bolt
Size of Bolt
Shear Δσ II MPa (ksi)
Tension Δσ I MPa (ksi)
Shear ΔV II kN (kips)
Tension ΔT I kN (kips)
Tension+ weight ΔT I kN (kips)
A325 Galv. 7/8
138 (20) 138 (20) 53.5 (12.03) 41.06 (9.23) 47.15 (10.60)
138 (20) 138 (20) 53.53 (12.03) 41.06 (9.23) 47.15 (10.60)
69 (10) 138 (20) 26.73 (6.01) 41.06 (9.23) 47.15 (10.60)
69 (10) 138 (20) 26.73 (6.01) 41.06 (9.23) 47.15 (10.60)
110 (16) 110 (16) 42.8 (9.62) 32.87 (7.39) 38.97 (8.76)
110 (16) 110 (16) 42.8 (9.62) 32.87 (7.39) 38.97 (8.76)
55 (8) 110 (16) 21.4 (4.81) 32.87 (7.39) 38.97 (8.76)
55 (8) 110 (16) 21.4 (4.81) 32.87 (7.39) 38.97 (8.76)
55 (8) 55 (8) 21.4 (4.81) 16.41 (3.69) 38.97 (5.06)
55 (8) 55 (8) 21.4 (4.81) 16.41 (3.69) 38.97 (5.06)
28 (4) 55 (8) 10.72 (2.41) 16.41 (3.69) 38.97 (5.06)
28 (4) 55 (8) 10.72 (2.41) 16.41 (3.69) 38.97 (5.06)
A325 Regular 7/8
138 (20) 138 (20) 53.5 (12.03) 41.06 (9.23) 47.15 (10.60)
138 (20) 138 (20) 53.53 (12.03) 41.06 (9.23) 47.15 (10.60)
69 (10) 138 (20) 26.73 (6.01) 41.06 (9.23) 47.15 (10.60)
69 (10) 138 (20) 26.73 (6.01) 41.06 (9.23) 47.15 (10.60)
110 (16) 110 (16) 42.8 (9.62) 32.87 (7.39) 38.97 (8.76)
110 (16) 110 (16) 42.8 (9.62) 32.87 (7.39) 38.97 (8.76)
55 (8) 110 (16) 21.4 (4.81) 32.87 (7.39) 38.97 (8.76)
55 (8) 110 (16) 21.4 (4.81) 32.87 (7.39) 38.97 (8.76)
55 (8) 55 (8) 21.4 (4.81) 16.41 (3.69) 38.97 (5.06)
55 (8) 55 (8) 21.4 (4.81) 16.41 (3.69) 38.97 (5.06)
28 (4) 55 (8) 10.72 (2.41) 16.41 (3.69) 38.97 (5.06)
28 (4) 55 (8) 10.72 (2.41) 16.41 (3.69) 38.97 (5.06)
3.4.2 General overview of the structure
Multiaxial fatigue tests were done using a combination of a vertical actuator and a horizontal actuator. These were connected to the load transfer box, one fastened to the top plate, and another one fastened to the back plate (Figure 20 and Figure 21).

ERDC/ITL TR-19-4 42
Figure 20. Front view of the multiaxial setup.
Figure 21. Horizontal actuator attached to back plate.

ERDC/ITL TR-19-4 43
3.4.3 Instrumentation and data collection
Data was collected using the controller software Model 793.00 (System Software provided by MTS). Included within this software, The Station Builder application was used to set up the proportional integral derivative (PID) controller parameters for coordinating both actuators. Once these parameters were established, the Station Manager application was used to program the cycle pattern and interlock limits for each test, and for manipulating the 3000 lb top load transfer built-up section. Readouts from the instrumentation installed within the actuators of displacement and force was obtained for feedback to the station servo control, and for this experiment, this was the collected data. These values were recorded every 0.1 second.
3.4.4 Test and specimen configuration
Bolts denominated by the reference name A325 regular, and A325 hot dip galvanized, with a nominal diameter of 7/8 in. were tested under multiaxial fatigue. The specimen to be tested was inserted from the bottom up into the aligned holes in the plates that make up the interface between the bottom and top built-up box sections. A nut and washer was attached to the bolt and secured in place. The bolt would be taken to a snug tight configuration before the test. This was done instead of fully preloading to evaluate the potential for fatigue of bolts that have lost most of their preload due to cyclic shear.
3.4.5 Multiaxial fatigue protocol
The test protocol consisted of installing the bolt with the head on the bottom plate and the nut on the top plate. The nut was taken to a finger-tight configuration and marked with a line across the nut and bolt shank. Then the nut was tightened to a snug-tight condition and the bolts were then tested at the level of stress for the particular test. The test was run to the point of failure, or two million cycles, whichever occurred first. The number of cycles was recorded for each bolt, photographs were taken of each bolt failure surface, and the test setup was evaluated, cleaned, and prepared for the next test.
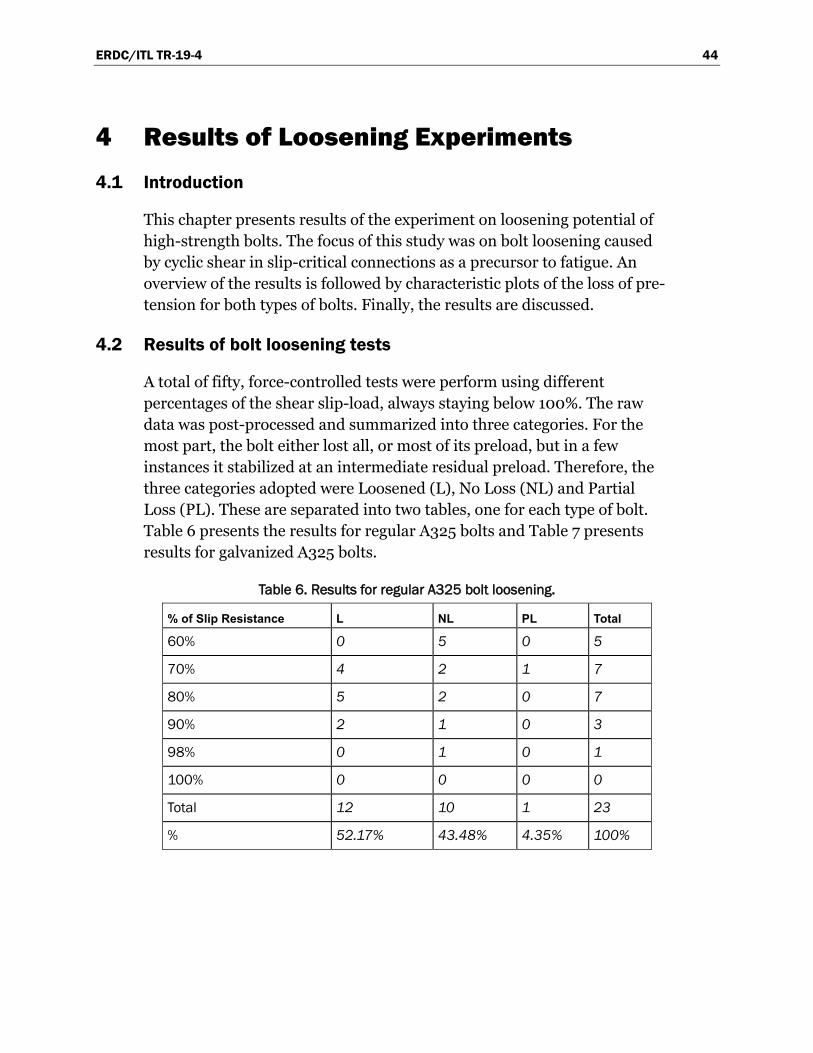
ERDC/ITL TR-19-4 44
4 Results of Loosening Experiments 4.1 Introduction
This chapter presents results of the experiment on loosening potential of high-strength bolts. The focus of this study was on bolt loosening caused by cyclic shear in slip-critical connections as a precursor to fatigue. An overview of the results is followed by characteristic plots of the loss of pre-tension for both types of bolts. Finally, the results are discussed.
4.2 Results of bolt loosening tests
A total of fifty, force-controlled tests were perform using different percentages of the shear slip-load, always staying below 100%. The raw data was post-processed and summarized into three categories. For the most part, the bolt either lost all, or most of its preload, but in a few instances it stabilized at an intermediate residual preload. Therefore, the three categories adopted were Loosened (L), No Loss (NL) and Partial Loss (PL). These are separated into two tables, one for each type of bolt. Table 6 presents the results for regular A325 bolts and Table 7 presents results for galvanized A325 bolts.
Table 6. Results for regular A325 bolt loosening.
% of Slip Resistance L NL PL Total
60% 0 5 0 5
70% 4 2 1 7
80% 5 2 0 7
90% 2 1 0 3
98% 0 1 0 1
100% 0 0 0 0
Total 12 10 1 23
% 52.17% 43.48% 4.35% 100%
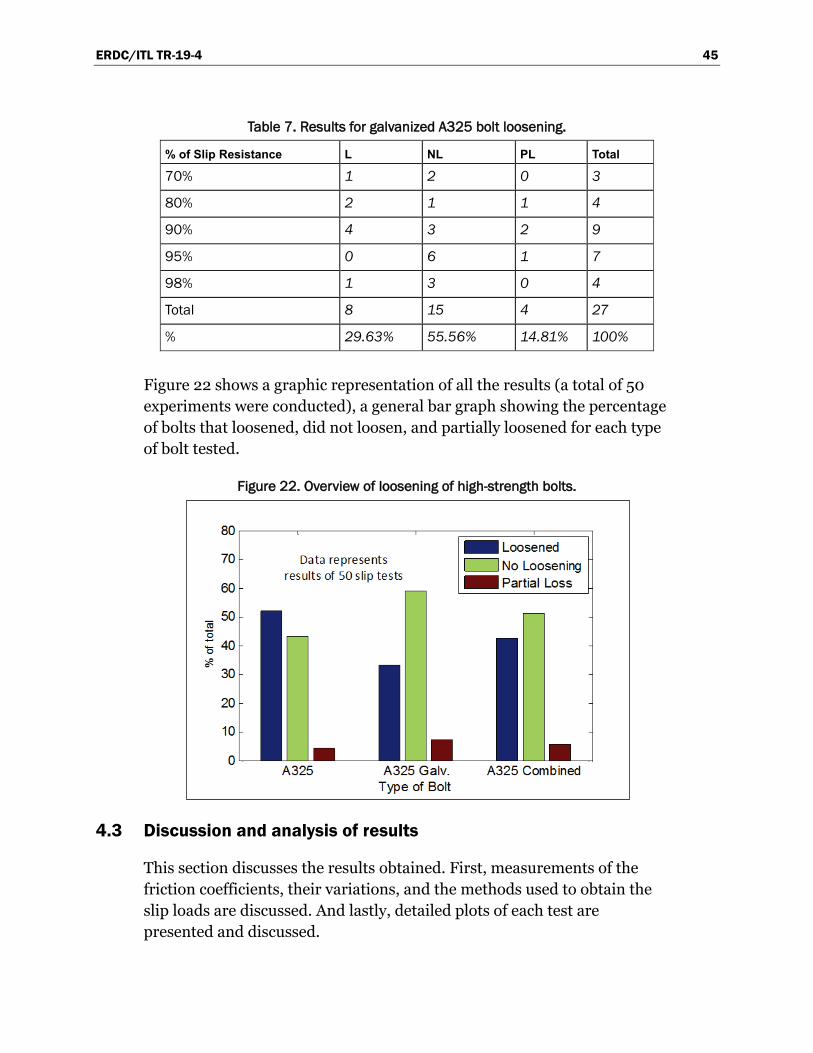
ERDC/ITL TR-19-4 45
Table 7. Results for galvanized A325 bolt loosening.
% of Slip Resistance L NL PL Total
70% 1 2 0 3
80% 2 1 1 4
90% 4 3 2 9
95% 0 6 1 7
98% 1 3 0 4
Total 8 15 4 27
% 29.63% 55.56% 14.81% 100%
Figure 22 shows a graphic representation of all the results (a total of 50 experiments were conducted), a general bar graph showing the percentage of bolts that loosened, did not loosen, and partially loosened for each type of bolt tested.
Figure 22. Overview of loosening of high-strength bolts.
4.3 Discussion and analysis of results
This section discusses the results obtained. First, measurements of the friction coefficients, their variations, and the methods used to obtain the slip loads are discussed. And lastly, detailed plots of each test are presented and discussed.

ERDC/ITL TR-19-4 46
4.3.1 Friction coefficients
The friction coefficients were experimentally derived. The variations in the friction coefficient were accounted for by testing and updating it each time the bolt was changed. The initial measurement showed a value of 0.35, this was taken to initiate the first tests. Nevertheless, there was variation throughout the tests, and a general increase of the coefficient as the tests progressed. The coefficients of friction determined experimentally ranged from 0.35–0.68 with a mean of 0.46 and a standard deviation of 0.1. Some factors that contributed to these variations were changes in ambient temperature and the accumulation of steel powder due to wear throughout the tests. These were controlled to some extent by testing at a similar time of day each day and by cleaning the plates between bolt installations. Figure 23 shows a histogram of the values obtained for µ.
Figure 23. Histogram of µ.
Friction coefficients were used to calculate the slip load using Equation 6
nФR μP (6)
Where:
Ф = 1,
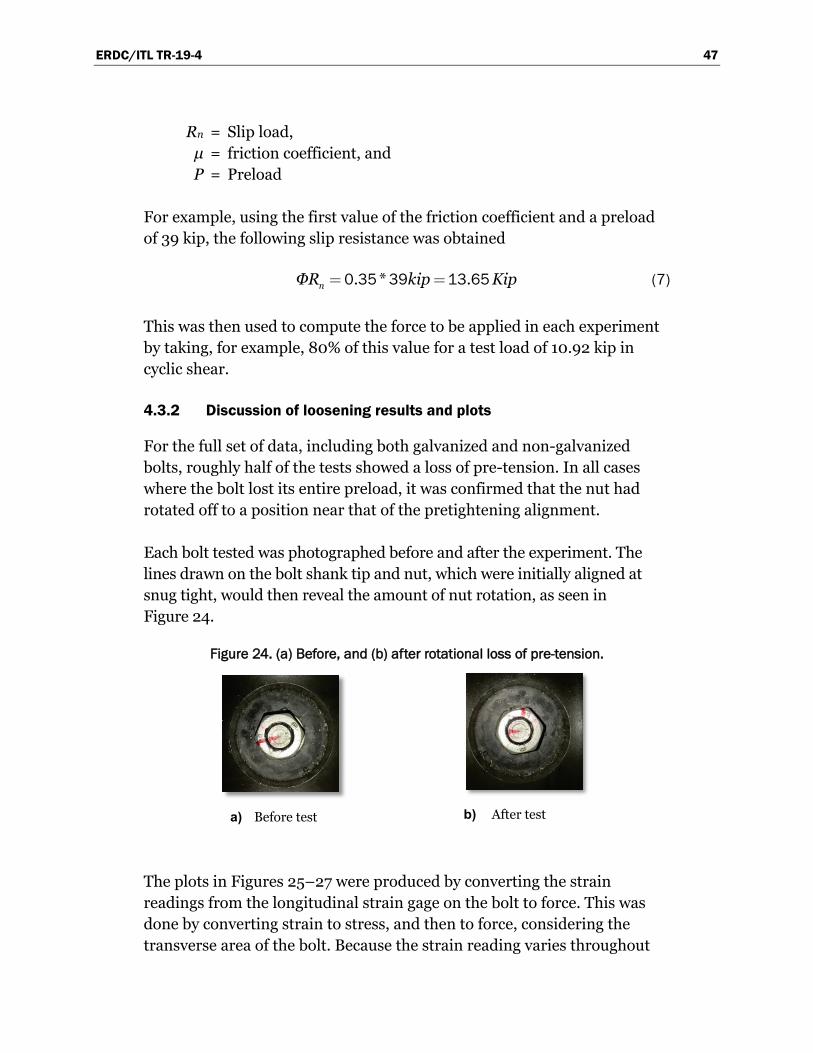
ERDC/ITL TR-19-4 47
Rn = Slip load, μ = friction coefficient, and P = Preload
For example, using the first value of the friction coefficient and a preload of 39 kip, the following slip resistance was obtained
. * . nФR kip Kip 0 35 39 13 65 (7)
This was then used to compute the force to be applied in each experiment by taking, for example, 80% of this value for a test load of 10.92 kip in cyclic shear.
4.3.2 Discussion of loosening results and plots
For the full set of data, including both galvanized and non-galvanized bolts, roughly half of the tests showed a loss of pre-tension. In all cases where the bolt lost its entire preload, it was confirmed that the nut had rotated off to a position near that of the pretightening alignment.
Each bolt tested was photographed before and after the experiment. The lines drawn on the bolt shank tip and nut, which were initially aligned at snug tight, would then reveal the amount of nut rotation, as seen in Figure 24.
Figure 24. (a) Before, and (b) after rotational loss of pre-tension.
a) Before test
b) After test
The plots in Figures 25–27 were produced by converting the strain readings from the longitudinal strain gage on the bolt to force. This was done by converting strain to stress, and then to force, considering the transverse area of the bolt. Because the strain reading varies throughout
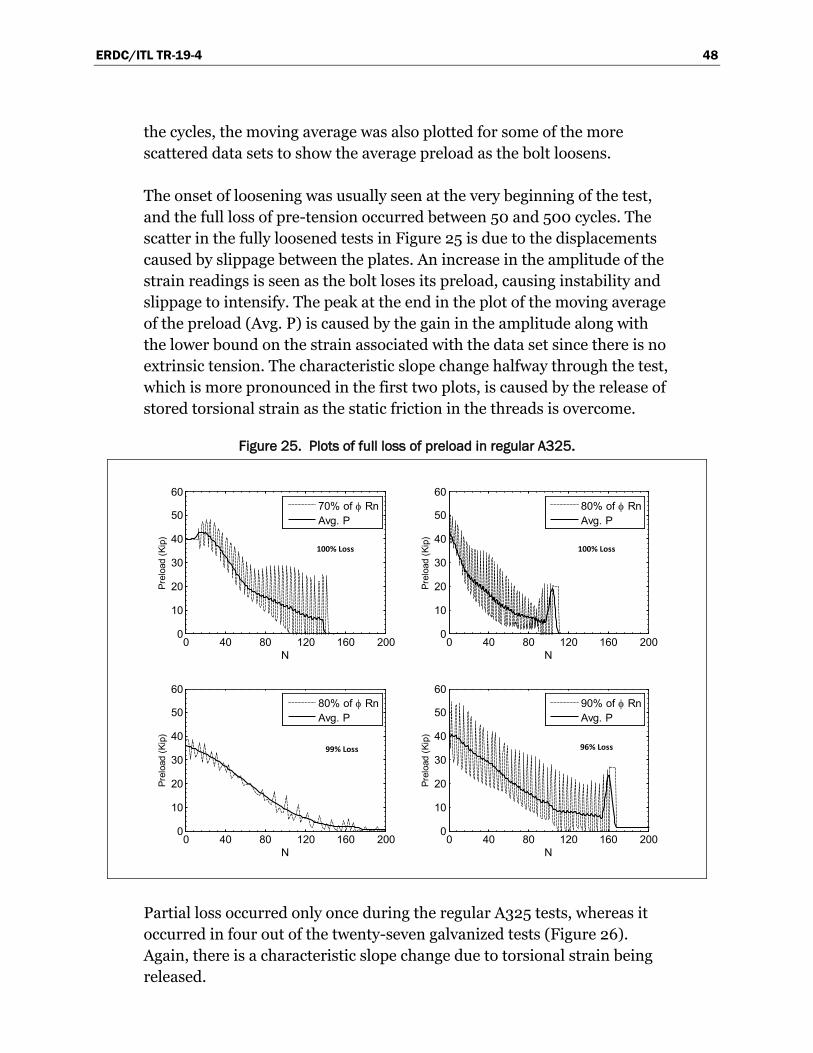
ERDC/ITL TR-19-4 48
the cycles, the moving average was also plotted for some of the more scattered data sets to show the average preload as the bolt loosens.
The onset of loosening was usually seen at the very beginning of the test, and the full loss of pre-tension occurred between 50 and 500 cycles. The scatter in the fully loosened tests in Figure 25 is due to the displacements caused by slippage between the plates. An increase in the amplitude of the strain readings is seen as the bolt loses its preload, causing instability and slippage to intensify. The peak at the end in the plot of the moving average of the preload (Avg. P) is caused by the gain in the amplitude along with the lower bound on the strain associated with the data set since there is no extrinsic tension. The characteristic slope change halfway through the test, which is more pronounced in the first two plots, is caused by the release of stored torsional strain as the static friction in the threads is overcome.
Figure 25. Plots of full loss of preload in regular A325.
0 40 80 120 160 2000
10
20
30
40
50
60
Prel
oad
(Kip
)
N
80% of φ RnAvg. P
0 40 80 120 160 2000
10
20
30
40
50
60
Prel
oad
(Kip
)
N
90% of φ RnAvg. P
0 40 80 120 160 2000
10
20
30
40
50
60
Prel
oad
(Kip
)
N
70% of φ RnAvg. P
0 40 80 120 160 2000
10
20
30
40
50
60
Prel
oad
(Kip
)
N
80% of φ RnAvg. P
100% Loss
99% Loss
100% Loss
96% Loss
Partial loss occurred only once during the regular A325 tests, whereas it occurred in four out of the twenty-seven galvanized tests (Figure 26). Again, there is a characteristic slope change due to torsional strain being released.
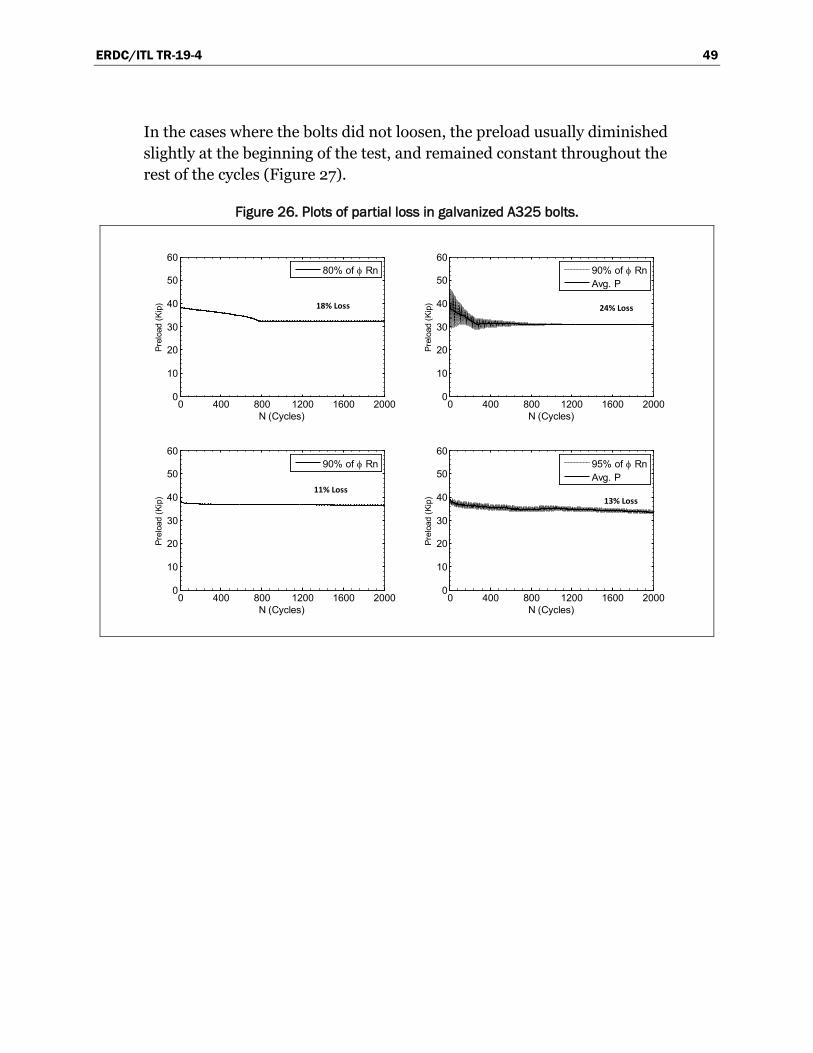
ERDC/ITL TR-19-4 49
In the cases where the bolts did not loosen, the preload usually diminished slightly at the beginning of the test, and remained constant throughout the rest of the cycles (Figure 27).
Figure 26. Plots of partial loss in galvanized A325 bolts.
0 400 800 1200 1600 20000
10
20
30
40
50
60
Prel
oad
(Kip
)
N (Cycles)
80% of φ Rn
0 400 800 1200 1600 20000
10
20
30
40
50
60
Prel
oad
(Kip
)N (Cycles)
90% of φ RnAvg. P
0 400 800 1200 1600 20000
10
20
30
40
50
60
Prel
oad
(Kip
)
N (Cycles)
90% of φ Rn
0 400 800 1200 1600 20000
10
20
30
40
50
60
Prel
oad
(Kip
)
N (Cycles)
95% of φ RnAvg. P
18% Loss 24% Loss
11% Loss13% Loss

ERDC/ITL TR-19-4 50
Figure 27. Plots of no loss in galvanized A325 bolts.
0 400 800 1200 1600 20000
10
20
30
40
50
60
Prel
oad
(Kip
)
N (Cycles)
80% of φ Rn
0 400 800 1200 1600 20000
10
20
30
40
50
60
Prel
oad
(Kip
)
N (Cycles)
90% of φ RnAvg. P
0 400 800 1200 1600 20000
10
20
30
40
50
60Pr
eloa
d (K
ip)
N (Cycles)
70% of φ Rn
0 400 800 1200 1600 20000
10
20
30
40
50
60
Prel
oad
(Kip
)
N (Cycles)
95% of φ Rn
4% Loss
3% Loss
2% Loss
3% Loss
A simple heuristic was used to classify each bolt test into one of the three categories. By visual inspection of the shape of the plots, the following categories were determined. Thus, NL tests fell below 8% loss of preload, PL tests ranged from 11–24% loss of preload, and L tests went from 72–100% of loss of the initial preload. This shows that there is a discrete nature to the results. In general, it was shown that NL was observed 70% or less of φRn were applied as the cyclic shear load. This implies that bolts should be subjected to 70% of their calculated slip resistance value to minimize the potential for loosening. Galvanized bolts showed a lower propensity to loosening. This may have been due to the surface coating that prevents the nut from turning on the washer given the plastic deformations of the coating layer.

ERDC/ITL TR-19-4 51
5 Experimental Results of Multiaxial Fatigue of Bolts with Initial Loss of Preload
5.1 Introduction
This chapter presents the results of multiaxial fatigue experiments on high-strength bolts. The purpose of this study was to establish characteristic fatigue lives caused by combining shear with tension loading damage on high-strength structural bolts. The results are presented in table form. The characteristic code equation, typical simple tension, and simple shear plots are discussed. Finally, the results are plotted logarithmically in typical Stress Range – Number of Cycles (S-N) curve form and discussed. For conclusions and recommendations refer to Chapter 6, Section 6.3.2.
5.2 Results of multiaxial tests on high-strength bolts
A Total of 23 bolts were tested, including 14 galvanized bolts and 11 regular bolts. Table 8 shows the results obtained. Bolts tested were A325 bolts with nominal diameter of 22.22 mm (7/8 in.), and a minimum proof strength of 586.05 MPa (85 ksi). The first column separates the tests into galvanized and non-galvanized bolts. Different combinations of shear and tension, as shown in columns 2 and 3, were applied to each bolt for up to two million cycles. The number of cycles to failure (N) was recorded in the second to last column.

ERDC/ITL TR-19-4 52
Table 8. Results of multiaxial fatigue on high-strength bolts.
Type of bolt Size of bolt
Shear Δσ II MPa (ksi)
Tension Δσ I MPa (ksi) N
Test Number
7/8
138 (20) 138 (20) 17507 1
138 (20) 138 (20) 40441 11
138 (20) 138 (20) 52848 12
A325 Galv.
138 (20) 138 (20) 43423 2
138 (20) 138 (20) 45538 3
69 (10) 138 (20) 100167 4
69 (10) 138 (20) 40921 5
110 (16) 110 (16) 32964 6
110 (16) 110 (16) 23522 7
55 (8) 110 (16) 57455 8
55 (8) 110 (16) 180070 9
55 (8) 55 (8) 838878 10
55 (8) 55 (8) 2000000 16
28 (4) 55 (8) 2000000 17
28 (4) 55 (8) 2000000
A325 Regular 7/8
138 (20) 138 (20) 6876 13
138 (20) 138 (20) 14248 14
69 (10) 138 (20) 228736 15
69 (10) 138 (20) 62552 18
110 (16) 110 (16) 61179 19
110 (16) 110 (16) 53484 20
55 (8) 110 (16) 247424 21
55 (8) 110 (16) 136232 22
55 (8) 55 (8) 2000000 23
55 (8) 55 (8) 2000000 28 (4) 55 (8) 2000000 28 (4) 55 (8) 2000000

ERDC/ITL TR-19-4 53
5.3 Discussion and analysis of results
No strain gages were used for multiaxial test specimens since any adaptation to the bolts would generate additional notches, altering the fatigue life of the bolt. This was evidenced in a trial run on an instrumented bolt where the failure occurred much earlier than in unaltered bolts. Fracture occurred on this test result, shown on the first row of Table 8, at 17,507 cycles, compared to 40,000–50,000 cycles with the same stress combination. Also, the location of failure on the instrumented bolt was near the instrumentation zone, with the head fracturing off the bolt. Whereas, on the unaltered bolts, fracture occurred near the threads.
Tests 11 and 12 were run as verification tests to confirm the data points obtained from tests 2 and 3. The deviation from the trend line was attributed to typical fatigue scatter and the influence of rotation of the bolt caused by transverse reversals.
5.3.1 Failure profiles
Typical failure surfaces are included below. Fracture regions are evidenced by rough portions on the profile while fatigue surface characteristics can be seen in the crack growth regions.
5.3.1.1 Shear to tension ration 1:1
The following images show the characteristic failure profiles for the specimens subjected to a one-to-one shear to tension ratio. These are organized by stress first and then by type of bolt.
As shown in Figure 28, the crack grows progressively inward from the root of the first engaged thread. In the first specimen, the crack follows the helical shape of the threads and striations are seen in a concentric pattern.
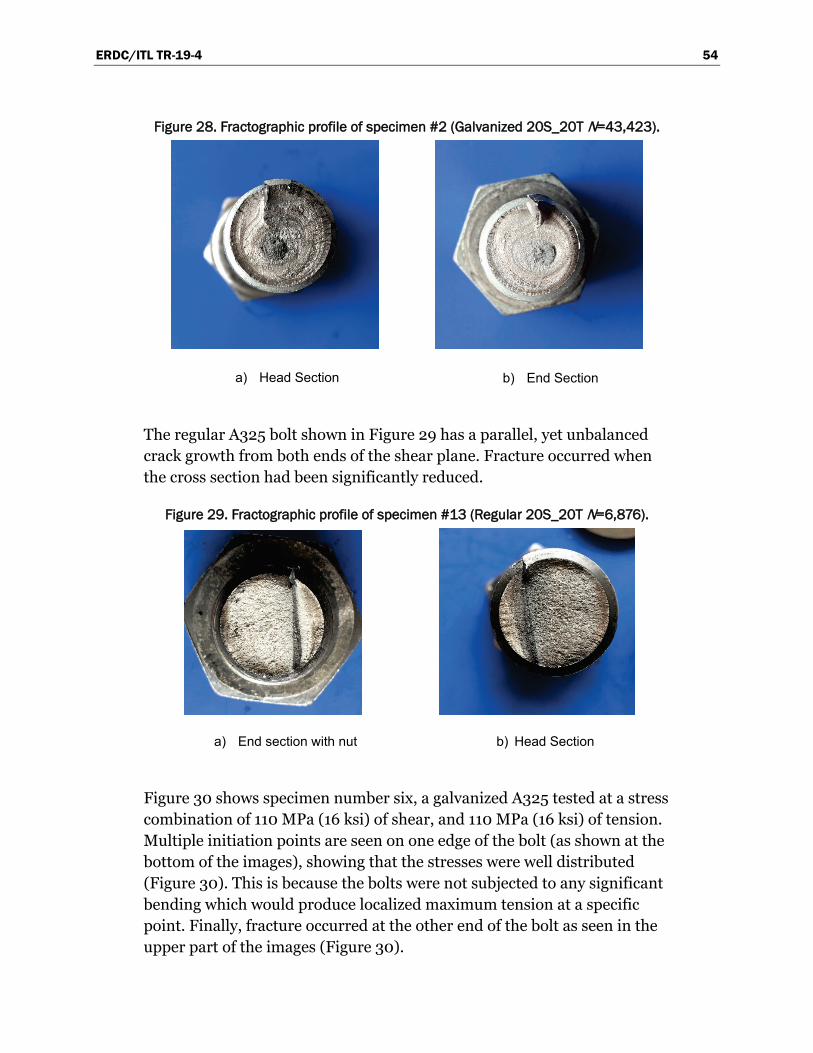
ERDC/ITL TR-19-4 54
Figure 28. Fractographic profile of specimen #2 (Galvanized 20S_20T N=43,423).
a) Head Section
b) End Section
The regular A325 bolt shown in Figure 29 has a parallel, yet unbalanced crack growth from both ends of the shear plane. Fracture occurred when the cross section had been significantly reduced.
Figure 29. Fractographic profile of specimen #13 (Regular 20S_20T N=6,876).
a) End section with nut
b) Head Section
Figure 30 shows specimen number six, a galvanized A325 tested at a stress combination of 110 MPa (16 ksi) of shear, and 110 MPa (16 ksi) of tension. Multiple initiation points are seen on one edge of the bolt (as shown at the bottom of the images), showing that the stresses were well distributed (Figure 30). This is because the bolts were not subjected to any significant bending which would produce localized maximum tension at a specific point. Finally, fracture occurred at the other end of the bolt as seen in the upper part of the images (Figure 30).

ERDC/ITL TR-19-4 55
Figure 30. Fractographic profile of specimen #6 (Galvanized 16S_16T N=32,964).
a) End section with nut
b) Head Section
Specimen number twenty, shown in Figure 31, shows tearing of the threads. The fatigue striations suggest a small rotational effect with thumb.
Figure 31. Fractographic profile of specimen #20 (Regular 16S_16T N=53,484).
a) End section with nut
b) Head Section
The images in Figure 32 are of specimen number ten, subjected to 55 MPa (8 ksi) shear, and 55 MPa (8 ksi) tension. This galvanized bolt has a fracture region that extends in a thin line (vertical in the images) across the bolt, perpendicular to the crack growth direction.

ERDC/ITL TR-19-4 56
Figure 32. Fractographic profile of specimen #10 (Galvanized 8S_8T N=838,878).
a) End section with nut
b) Head Section
5.3.1.2 Shear to tension ratio 1:2
Fractographic profiles of specimen number four (Figure 33) begin a series of figures showing a two to one relationship in tension to shear stress. Specimen four shows the finer grain in the fatigue region to the left. This stable crack was dominated by tension, and less rotationally affected by shear, grew from the left and culminated in the fracture zone on the right (Figure 33).
Figure 33. Fractographic profile of specimen #4 (Galvanized 10S_20T N=100,167).
a) End section with nut
b) Head Section
A similar pattern as above is seen in Figure 34, this shows a regular bolt for the same stress combination. As in the previous section, there is evidence of no bending because of multiple initiation points.

ERDC/ITL TR-19-4 57
Figure 34. Fractographic profile of specimen #15 (Regular 10S_20T N=228736).
a) End section with nut
b) Head Section
At a reduced stress combination of 55 MPa (8 ksi) in shear, and 110 MPa (16 ksi) in tension, a larger fatigue region and a smaller fracture region can be seen. Figure 35 and Figure 36 show the failure profile for specimen number nine (galvanized) and twenty-two (regular), with a typical horizontal crack growth plane and a fracture plane, with a characteristic change in angle.
Figure 35. Fractographic profile of specimen #9 (Galvanized 8S_16T N=180070).
a) End section with nut
b) Head Section

ERDC/ITL TR-19-4 58
Figure 36. Fractographic profile of specimen #22 (Regular 8S_16T N=136232).
a) End section with nut
b) Head Section
5.3.2 S-N curves
S-N curves were developed from the multiaxial fatigue data. These show the number of cycles to failure for a given stress range. The data is compared to existing S-N curves in the AISC (2010) specification. These were plotted using the equations for shear and tension loading. The purpose of the comparison is to show how the combination of tension and shear damage will affect the expected fatigue life of the bolt as compared to simple shear and simple tension, respectively.
Figures 37–40 show the S-N curves for galvanized A325 tension, A325 tension, galvanized A325 shear, and A325 shear, respectively. For the tension S-N curves in Figure 37, the data set shows a close resemblance to the equation provided for fatigue for bolts subjected to tension only. As expected, the red dot and green trend line for a one-to-one relationship of tension to shear have lower fatigue life compared to the same value of tension, but with half the shear. The fatigue lives are increased when the shear is only half of the tension compared to the one-to-one relationship. For the shear S-N curve in Figure 39 and Figure 40, the figures clearly show that adding tension to the shear reversals causes obvious reduction to the fatigue strength in comparison to shear only loading.

ERDC/ITL TR-19-4 59
Figure 37. Galvanized A325 tension S-N curve.
Figure 38. Regular A325 tension S-N curve.

ERDC/ITL TR-19-4 60
Figure 39. Galvanized A325 shear S-N curve.
Figure 40. Regular A325 shear S-N curve.

ERDC/ITL TR-19-4 61
6 Summary and Conclusions 6.1 Summary
High-strength bolts are widely used in the construction of civil infrastructure. For hydraulic steel structures such as Miter gates, these bolts are used extensively and are subjected to cyclic loadings from the daily operation of the gate. Because the connections are under repeated cyclic loads, they are designed as slip-critical connections, in which load is transferred through friction between the connected plates. However, under repeated cyclic shear loads, the bolts could potentially loosen, and as a result, subsequent, partial, or complete loss of pretention could occur. Once the bolt pretention is depleted, the load transfer mechanism becomes through the bearing of the bolt on the bolt hole, and the bolt becomes more vulnerable to fatigue failure. The potential for loss of pretention under repeated shear loads has been previously observed for high-strength bolts, other reports have noted the same issue.
The purpose of this study was to investigate the causes for bolt failure found during scheduled inspections in the Pintle socket to Miter Gate bottom girder connection. Specifically, the purpose of this study was twofold: (1) to confirm the potential for bolt loosening under cyclic shear loading, and (2) to evaluate the fatigue failure of bolted connections that are subjected to multiaxial (shear and tension) fatigue loading cyclic. This was realized through experimental tests of individual bolts at the Colorado State University Structures Laboratory. Certain mechanisms mark the onset of bolt loosening and fatigue when bolts are subjected to cyclic shear or shear combined with tension. The actual mechanisms and limits when this occurs were explored in the literature and experimentally, and recommendations were provided. The evaluated bolts included A325 standard and galvanized bolts. For the bolt loosening tests, a total of fifty, force-controlled experiments were conducted using different percentages of the shear slip-load. The data was post-processed and summarized into three categories.
6.2 Conclusions
Friction coefficients between faying surfaces vary due to several factors, therefore, efforts should be invested in reducing uncertainty in these values through testing. Using similar steel plates, an updated value of 0.30

ERDC/ITL TR-19-4 62
for class A surfaces in the AISC (2010) would be on the safe side for design. However, 50% of the cyclic tests that were performed at loads between 70% and 95% of the experimentally derived slip-load, lost their entire preload within 50–500 cycles. In light of this experimental data, it is safe to say that rotational loss of preload caused by cyclic shear is a significant issue in structural bolts, and a potential predominant factor in the progressive deterioration of slip-critical joints subjected to relative displacement. The results showed in many cases the bolt either lost all, or most of its preload. However in a few instances, it stabilized at an intermediate residual preload.
In general, it was shown that no loss of pretention was observed when 70% or less of φRn was applied as the cyclic shear load. This implies that bolts should be subjected to 70% of their calculated slip resistance value to minimize the potential for loosening.
The data set produced for multiaxial fatigue testing showed a close resemblance to the equation provided for fatigue for bolts subjected to tension only. The S-N fatigue curves produced for the combined tension-shear loading appear to be in close proximity to the tension only S-N curve available in the AISC (2010) specification. However, these curves are clearly below the shear-only curve available in the AISC (2010) specification. These curves can be used to assess bolts for multiaxial fatigue if they are found to have been loosened in the field. It is not recommended, however, that bolts, in the Pintle socket connection, be designed for fatigue as bearing-type connections.

ERDC/ITL TR-19-4 63
References American Institute of Steel Construction (AISC) Committee. 2010. "Specification for
Structural Steel Buildings (ANSI/AISC 360-10)." American Institute of Steel Construction, Chicago-Illinois.
American Institute of Steel Construction (AISC). 1934. “Standard specification.” (January).
American Institute of Steel Construction (AISC). 1949. “Specification for the design, fabrication and erection of structural steel for buildings.”
Astaneh, Abolhassan, Marwan N. Nader, and Lincoln Malik. 1989. "Cyclic behavior of double angle connections." Journal of Structural Engineering 115(5): 1101–1118. https://doi.org/10.1061/(ASCE)0733-9445(1989)115:5(1101).
Boomsma, M. 1955. "Loosening and fatigue strength of bolted joints." The Engineer 200(5196): 284–286.
Dinger, G., and C. Friedrich. 2011. "Avoiding self-loosening failure of bolted joints with numerical assessment of local contact state." Engineering Failure Analysis 18(8): 2188–2200. https://doi.org/10.1016/j.engfailanal.2011.07.012.
Esaklul, Khlefa A., and Tawfik M. Ahmed. 2009. "Prevention of failures of high strength fasteners in use in offshore and subsea applications." Engineering Failure Analysis 16(4): 1195–1202.
Fisher, John W., and L. S. Beedle. 1964. "Bibliography on bolted and riveted structural joints.” ASCE Manual No. 48 (67–15).
Fisher, W. A. P., R. H. Cross, and G. M. Norris. 1952. "Pre-tensioning for preventing fatigue failure in bolts: simple theory and an account of experiments carried out at the RAE." Aircraft Engineering and Aerospace Technology 24(6): 160–163.
Friede, R., and J. Lange. 2009. "Self loosening of prestressed bolts." In Nordic Steel Construction Conference (NSCC). Sweeden, Malmö. 2–4.
Goodier, J. N. 1945. "Loosening by vibration of threaded fastening." Mechanical Engineering 67(12): 798–802.
Hashimura, Shinji, and Darrell F. Socie. 2006. "A study of loosening and fatigue failure of bolted joints under transverse vibration." Transactions of the Japan Society of Mechanical Engineers Part C 72(4): 1297–1304.
Ibrahim, R. A., and C. L. Pettit. 2005. "Uncertainties and dynamic problems of bolted joints and other fasteners." Journal of Sound and Vibration 279(3): 857–936. https://doi.org/10.1016/j.jsv.2003.11.064.
Jiang, Xiangjun, Yongsheng Zhu, Jun Hong, Xi Chen, and Youyun Zhang. 2013. "Investigation into the loosening mechanism of bolt in curvic coupling subjected to transverse loading." Engineering Failure Analysis 32: 360–373. https://doi.org/10.1016/j.engfailanal.2013.04.005.

ERDC/ITL TR-19-4 64
Jiang, Yanyao, Ming Zhang, and Chu-Hwa Lee. 2003. "A study of early stage self-loosening of bolted joints." Transactions of the American Society of Mechanical Engineers Journal of Mechanical Design 125(3): 518–526.
Junker, Gerhard. H. 1969. “New criteria for self-loosening of fasteners under vibration.” SAE Technical Paper (690055) 314–335. https://doi.org/10.4271/690055.
Junker, Gerhard. H. 1973. “Criteria for self-loosening of fasteners under vibration.” Aircraft Engineering 45(1): 12–14. https://doi.org/10.1108/eb034981.
Kaylor, E. 1873. Improvement in nut-locks. United States Patent Office, United States.
Lozier, Mark. C. 2012. United States Air Force Aircraft Accident Investigation Board Report: EQ-4B Global Hawk, T/N 04-2017.
Meyer, G., and D. Strelow. 1972. "How to calculate preload loss due to permanent set in bolted joints." Assembly Engineering.
Munse, William Herman. 1970. Riveted And bolted structural joints. University of Illinois Engineering Experiment Station. College of Engineering. University of Illinois at Urbana-Champaign.
Nassar, Sayed A., and Basil A. Housari. 2007. "Study of the effect of hole clearance and thread fit on the self-loosening of threaded fasteners." Journal of Mechanical Design 129(6): 586–594. doi:10.1115/1.2717227.
Pai, N. G., and D. P. Hess. 2002. "Experimental study of loosening of threaded fasteners due to dynamic shear loads." Journal of Sound and Vibration 253(3): 585–602. https://doi.org/10.1006/jsvi.2001.4006.
Pai, N. G., and D. P. Hess. 2002. "Three-dimensional finite element analysis of threaded fastener loosening due to dynamic shear load." Engineering Failure Analysis 9(4): 383–402. https://doi.org/10.1016/S1350-6307(01)00024-3.
Pai, N. G., and D. P. Hess. 2003. “Influence of fastener placement on vibration-induced loosening.” Journal of Sound and Vibration 268: 617–626.
Research Council on Structural Connections (RCSC). 1951. “Specifications for assembly of structural joints using high tensile steel bolts.” Chicago, Illinois.
Research Council on Structural Connections (RCSC). 1954. “Assembly of structural joints using high strength steel bolts approved by research council on riveted and bolted.” Chicago, Illinois.
Research Council on Structural Connections (RCSC). 2009. Specification for Structural Joints Using High-Strength Bolts. Chicago, Illinois.
Sakai, T. 2008. Bolted joint engineering fundamentals and applications. DIN Deutches Institut fur Normung e.V. Beuth Verlag GmbH: GE: Berlin.
Schijve, J. 2001. Fatigue of structures and materials. The Netherlands: Springer.
Sears, G., and D. King, D. 2004. “Joint integrity management of critical flanges.” International Journal of Pressure Vessels and Piping 81: 513–519.

ERDC/ITL TR-19-4 65
Socie, D. F., and G. B. Marquis. 2000. “Multiaxial fatigue.” Society of Automotive Engineers Warrendale: PA.
Tendo, M., K. Yamada, and Y. Shimura. 2001. “Stress relaxation behavior at high-tension bolted connections of stainless-steel plates.” Journal of Engineering Materials and Technology 123: 198.
Transport Canada. 2013. “Motor vehicle safety recalls database.” Transport Canada Recall# 2013273, <http://wwwapps.tc.gc.ca/Saf-Sec-Sur/7/VRDB-BDRV/search-recherche/detail.aspx?lang=eng&mk=0&md=0&fy=0&ty=9999&ft=&ls=0&sy=0&rn=2013273&cf=SearchResult> (retrieved 16 November 2015).
U.S. Army Corps of Engineers (USACE). 1994. Lock gates and operating equipment. EM 1110-2-2703 Washington: DC.
U.S. Army Corps of Engineers (USACE). 2014. Design of hydraulic steel structures. ETL 1110-2-584. Washington: DC.
Yang, J., and J. T. DeWolf. 1999. “Mathematical model for relaxation in high-strength bolted connections.” Journal of Structural Engineering 125(August) 803–809.
Yokoyama, T., M. Olsson, S. Izumi, and S. Sakai. 2012. “Investigation into the self-loosening behavior of bolted joint subjected to rotational loading.” Engineering Failure Analysis Elsevier Ltd 23: 35–43.
You, B. R., and S. B. Lee. 1996. “A critical review on multiaxial fatigue assessments of metals.” International Journal of Fatigue 18(4): 235–244.
Zerres, H., and Y. Guérout. 2004. “Present calculation methods dedicated to bolted flanged connections.” International Journal of Pressure Vessels and Piping 81: 211–216.
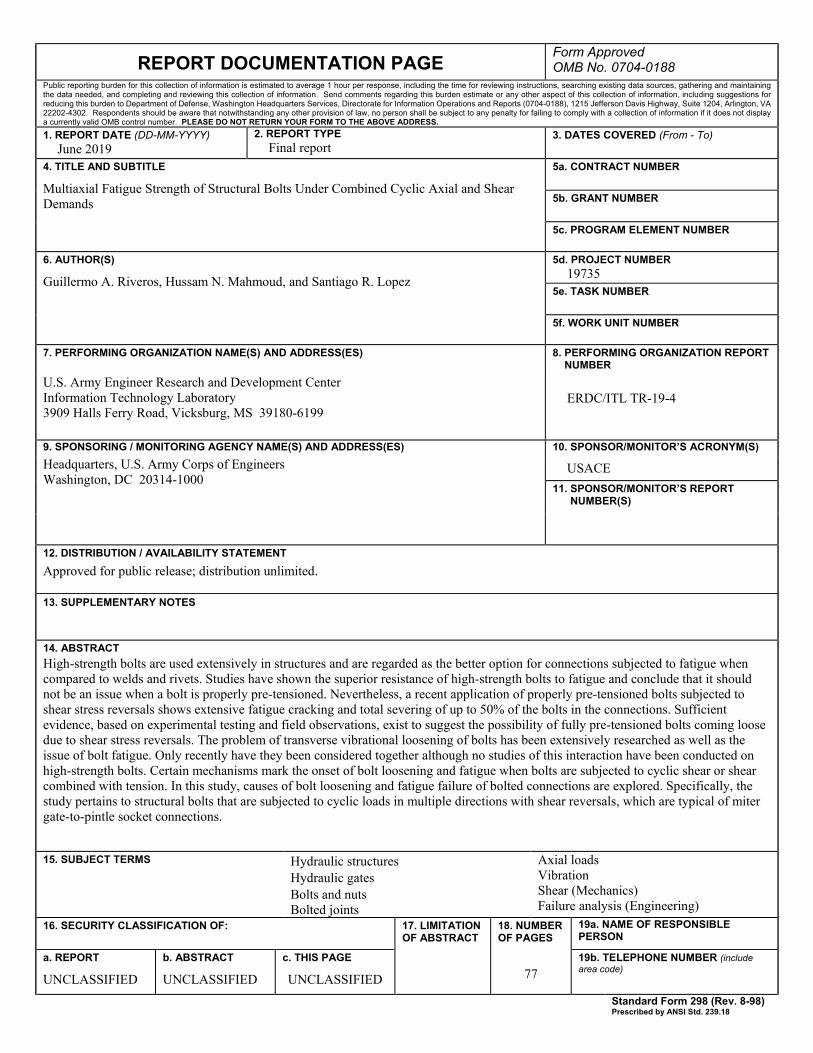
REPORT DOCUMENTATION PAGE Form Approved OMB No. 0704-0188
Public reporting burden for this collection of information is estimated to average 1 hour per response, including the time for reviewing instructions, searching existing data sources, gathering and maintaining the data needed, and completing and reviewing this collection of information. Send comments regarding this burden estimate or any other aspect of this collection of information, including suggestions for reducing this burden to Department of Defense, Washington Headquarters Services, Directorate for Information Operations and Reports (0704-0188), 1215 Jefferson Davis Highway, Suite 1204, Arlington, VA 22202-4302. Respondents should be aware that notwithstanding any other provision of law, no person shall be subject to any penalty for failing to comply with a collection of information if it does not display a currently valid OMB control number. PLEASE DO NOT RETURN YOUR FORM TO THE ABOVE ADDRESS. 1. REPORT DATE (DD-MM-YYYY)
June 2019 2. REPORT TYPE
Final report 3. DATES COVERED (From - To)
4. TITLE AND SUBTITLE
Multiaxial Fatigue Strength of Structural Bolts Under Combined Cyclic Axial and Shear Demands
5a. CONTRACT NUMBER
5b. GRANT NUMBER
5c. PROGRAM ELEMENT NUMBER
6. AUTHOR(S)
Guillermo A. Riveros, Hussam N. Mahmoud, and Santiago R. Lopez
5d. PROJECT NUMBER 19735
5e. TASK NUMBER
5f. WORK UNIT NUMBER
7. PERFORMING ORGANIZATION NAME(S) AND ADDRESS(ES) 8. PERFORMING ORGANIZATION REPORT NUMBER
U.S. Army Engineer Research and Development Center Information Technology Laboratory 3909 Halls Ferry Road, Vicksburg, MS 39180-6199
ERDC/ITL TR-19-4
9. SPONSORING / MONITORING AGENCY NAME(S) AND ADDRESS(ES) 10. SPONSOR/MONITOR’S ACRONYM(S) Headquarters, U.S. Army Corps of Engineers Washington, DC 20314-1000
USACE 11. SPONSOR/MONITOR’S REPORT NUMBER(S)
12. DISTRIBUTION / AVAILABILITY STATEMENT Approved for public release; distribution unlimited.
13. SUPPLEMENTARY NOTES
14. ABSTRACT High-strength bolts are used extensively in structures and are regarded as the better option for connections subjected to fatigue when compared to welds and rivets. Studies have shown the superior resistance of high-strength bolts to fatigue and conclude that it should not be an issue when a bolt is properly pre-tensioned. Nevertheless, a recent application of properly pre-tensioned bolts subjected to shear stress reversals shows extensive fatigue cracking and total severing of up to 50% of the bolts in the connections. Sufficient evidence, based on experimental testing and field observations, exist to suggest the possibility of fully pre-tensioned bolts coming loose due to shear stress reversals. The problem of transverse vibrational loosening of bolts has been extensively researched as well as the issue of bolt fatigue. Only recently have they been considered together although no studies of this interaction have been conducted on high-strength bolts. Certain mechanisms mark the onset of bolt loosening and fatigue when bolts are subjected to cyclic shear or shear combined with tension. In this study, causes of bolt loosening and fatigue failure of bolted connections are explored. Specifically, the study pertains to structural bolts that are subjected to cyclic loads in multiple directions with shear reversals, which are typical of miter gate-to-pintle socket connections.
15. SUBJECT TERMS
Hydraulic structures Hydraulic gates Bolts and nuts Bolted joints
Axial loads Vibration Shear (Mechanics) Failure analysis (Engineering)
16. SECURITY CLASSIFICATION OF: 17. LIMITATION OF ABSTRACT
18. NUMBER OF PAGES
19a. NAME OF RESPONSIBLE PERSON
a. REPORT
UNCLASSIFIED
b. ABSTRACT
UNCLASSIFIED
c. THIS PAGE
UNCLASSIFIED 77 19b. TELEPHONE NUMBER (include area code)
Standard Form 298 (Rev. 8-98) Prescribed by ANSI Std. 239.18