erdc tr-14-10 'laboratory evaluation of expedient low ... · laboratory evaluation of...
TRANSCRIPT

ERD
C TR
-14-
10
Airfield Damage Repair Modernization Program
Laboratory Evaluation of Expedient Low-Temperature Admixtures for Runway Craters in Cold Weather
Engi
neer
Res
earc
h an
d D
evel
opm
ent
Cent
er
Jared I. Oren, Robert D. Moser, Veera Boddu, Charles A. Weiss, Jr., and Jay Clausen
October 2014
Approved for public release; distribution is unlimited.

The U.S. Army Engineer Research and Development Center (ERDC) solves the nation’s toughest engineering and environmental challenges. ERDC develops innovative solutions in civil and military engineering, geospatial sciences, water resources, and environmental sciences for the Army, the Department of Defense, civilian agencies, and our nation’s public good. Find out more at www.erdc.usace.army.mil.
To search for other technical reports published by ERDC, visit the ERDC online library at http://acwc.sdp.sirsi.net/client/default.

Airfield Damage Repair Modernization Program
ERDC TR-14-10 October 2014
Laboratory Evaluation of Expedient Low-Temperature Admixtures for Runway Craters in Cold Weather
Jared I. Oren and Jay Clausen Cold Regions Research and Engineering Laboratory (CRREL) U.S. Army Engineer Research and Development Center 72 Lyme Road Hanover, NH 03755-1290
Robert D. Moser and Charles A. Weiss, Jr. Geotechnical and Structures Laboratory (GSL) U.S. Army Engineer Research and Development Center 3909 Halls Ferry Rd. Vicksburg, MS 39180-6199
Veera Boddu Construction Engineering Research Laboratory (CERL) U.S. Army Engineer Research and Development Center 2902 Newmark Drive Champaign, IL 61826-9005
Final Report
Approved for public release; distribution is unlimited.
Prepared for Air Force Civil Engineer Center Tyndall Air Force Base, FL 32403-5319
Under The Airfield Damage Repair Modernization Program

ERDC TR-14-10 ii
Abstract
The research included in this report investigates admixtures that can im-prove the low-temperature early strength gain performance of two prod-ucts already in existence (which are currently in limited use by the Air Force) for hasty runway repair. The first product, a “flowable fill,” is a low-level cementitious sandy mixture used to rapidly fill the bulk of a runway crater; the second product, a rapid setting concrete, seals the final 10–12 in. of the crater and allows heavy-vehicle trafficability.
The primary operational requirements, which the current two-part solu-tion meet at higher temperatures (greater than 10°C) but which require improvements at lower temperatures (−10°C to 10°C), involve time of set and 2 hr unconfined compressive strength (UCS). This research ignores typical concerns, such as long-term durability, aesthetics, and corrosion, that are of minimal importance in this expedient field-use application—horizontal surface repairs not expected to last more than two to five years. Results from this study are expected to be incorporated into operational testing, using Air Force equipment, personnel, and techniques, for small and large crater repair at sub-freezing temperatures. This report describes laboratory tests to improve the early strength gain performance of both repair materials to repair small-to-large craters at ambient temperatures of −10°C to 10°C.
DISCLAIMER: The contents of this report are not to be used for advertising, publication, or promotional purposes. Citation of trade names does not constitute an official endorsement or approval of the use of such commercial products. All product names and trademarks cited are the property of their respective owners. The findings of this report are not to be construed as an official Department of the Army position unless so designated by other authorized documents. DESTROY THIS REPORT WHEN NO LONGER NEEDED. DO NOT RETURN IT TO THE ORIGINATOR.

ERDC TR-14-10 iii
Contents Abstract .......................................................................................................................................................... ii
Illustrations ..................................................................................................................................................... v
Preface ...........................................................................................................................................................vii
Acronyms and Abbreviations ................................................................................................................... viii
Unit Conversion Factors ...............................................................................................................................x
1 Introduction ............................................................................................................................................ 1 1.1 Background ....................................................................................................................... 1 1.2 Project description ............................................................................................................ 1 1.3 Project objectives .............................................................................................................. 3
1.3.1 Admixture investigations ........................................................................................................... 3 1.3.2 Utility Fill and Rapid Set hot water testing ................................................................................ 4 1.3.3 Aluminum sulfate Rapid Set testing ......................................................................................... 5
2 Technical Approach .............................................................................................................................. 6 2.1 Introduction ....................................................................................................................... 6 2.2 Materials normalization .................................................................................................... 7 2.3 Mixing ................................................................................................................................. 8 2.4 Sample preparation and curing ........................................................................................ 9 2.5 Material evaluation tests .................................................................................................. 9
2.5.1 Slump and workability ............................................................................................................... 9 2.5.2 Set time .................................................................................................................................... 10 2.5.3 Two-hour unconfined compressive strength .......................................................................... 11
3 Summary of Related Historical Research ......................................................................................12 3.1 Introduction ..................................................................................................................... 12 3.2 Materials and effects summary ..................................................................................... 13
4 Utility Fill and Rapid Set Concrete Materials Analyses .............................................................. 23 4.1 Introduction ..................................................................................................................... 23 4.2 Materials .......................................................................................................................... 23 4.3 Methods ........................................................................................................................... 24
4.3.1 Morphology, chemistry, and mineralogy ................................................................................. 24 4.3.2 Chemical interactions .............................................................................................................. 25 4.3.3 Thermal properties................................................................................................................... 26
4.4 Results and discussion ................................................................................................... 26 4.4.1 Morphology, chemisty, and mineralogy .................................................................................. 26 4.4.2 Chemical interactions .............................................................................................................. 34 4.4.3 Thermal properties................................................................................................................... 38
4.5 Conclusions from the materials analyses ...................................................................... 42
ERDC TR-14-10 iv
5 Results and Discussion ...................................................................................................................... 44 5.1 Introduction ..................................................................................................................... 44 5.2 Aluminum sulfate Rapid Set test phase ........................................................................ 44 5.3 Utility Fill and Rapid Set hot water test phase ............................................................... 48 5.4 Admixture investigations, Rapid Set .............................................................................. 51 5.5 Admixture investigations, Utility Fill ................................................................................ 52 5.6 Models for prediction and results repeatability ............................................................. 55
6 Conclusions .......................................................................................................................................... 60
7 Recommendations .............................................................................................................................. 62
References ................................................................................................................................................... 65
Appendix A: Laboratory Test Data ........................................................................................................... 68
Appendix B: Additional Figures and Tables ........................................................................................ 103
Appendix C: Materials ............................................................................................................................. 106
Report Documentation Page

ERDC TR-14-10 v
Illustrations
Figures
1 Humboldt Universal Penetrometer used for all penetration resistance testing to estimate set times ........................................................................................................................ 10
2 A 300K lb Riehle machine (shown above) was used to conduct all unconfined compressive strength testing ...................................................................................................... 11
3 Comparison of freezing point and dosage for various calcium salt admixtures .................. 15 4 The relationship between freezing point depression and the total percent solids
in the mix water ............................................................................................................................ 20 5 SEMs of Utility Fill before hydration ........................................................................................... 27 6 SEMs of Rapid Set Concrete Mix before hydration .................................................................. 27 7 Low and high magnification images of the microstructure present in Rapid Set
with water ...................................................................................................................................... 28 8 Low and high magnification images of the microstructure present in Rapid Set
with aluminum sulfate ................................................................................................................. 28 9 Low and high magnification images of the microstructure present in Rapid Set
with calcium chloride ................................................................................................................... 29 10 Low and high magnification images of the microstructure present in Utility Fill
with water ...................................................................................................................................... 30 11 XRD pattern and quantitative analysis results of the cement fraction from Utility
Fill ................................................................................................................................................... 32 12 XRD pattern and quantitative analysis results of the cement fraction from Rapid
Set................................................................................................................................................... 33 13 FTIR spectra comparison of Rapid Set Concrete Mix (“RS-0”) and Utility Fill
concrete mix (“UF-0”) before hydration ..................................................................................... 35 14 FTIR spectra of Rapid Set Concrete Mix before (“RS-0”) and after hydration (“RS-
1” and “RS-2”) .............................................................................................................................. 36 15 FTIR spectra of Utility Fill Concrete Mix before (“UF-0”) and after hydration (“UF-
1” and “UF-2”) ............................................................................................................................... 37 16 FTIR spectra of Rapid Set Concrete Mix (“RS-0”), aluminum sulfate and RS-0,
and aluminum sulfate mixture ................................................................................................... 38 17 Normalized heat flow curves obtained using isothermal calorimetry at 23°C ................... 39 18 Thermogram of Rapid Set cement mixture before hydration ................................................. 41 19 Thermogram of Rapid Set cement mixture after hydration .................................................... 41 20 Thermogram of Utility Fill cement mixture before hydration .................................................. 42 21 Thermogram of Utility Fill cement mixture after hydration ..................................................... 42 22 2 hr UCS (psi) vs. SetTime (min) by Nom_Temp_C, filtered by different amounts
of aluminum sulfate (g) used in Rapid Set Concrete Mix........................................................ 46 23 Determining the correlation between 2 hr UCS and the amount of aluminum
sulfate used (g) in Rapid Set Concrete Mix ............................................................................... 47

ERDC TR-14-10 vi
24 Prediction results of select stepwise regression models for the first round of aluminum sulfate (task 3) testing (e.g., 57 tests with first shipment of Rapid Set product), using AIC stopping criterion. Data are ordered from smallest to largest by actual set time observed and plotted as set time versus ordered sample number (sample 1 is the fastest set time at 7 min; sample 63 is slowest at 72 min) ................................................................................................................................................ 58
25 Prediction results of select stepwise regression models for all aluminum sulfate (task 3) testing, using AIC stopping criterion. Data are ordered from smallest to largest by actual set time observed and plotted as set time versus ordered sample number (sample 1 is the fastest set time at 7 min; sample 63 is slowest at 72 min) ...................................................................................................................................... 58
Tables
1 Freezing point depressants potentially useful for cold weather concreting ......................... 14 2 Accelerators for cold weather concreting .................................................................................. 15 3 Strength enhancers for cold weather concreting ..................................................................... 16 4 Plasticizers or super plasticizers for cold weather concreting ............................................... 17 5 Air entrainers for cold weather concreting ................................................................................ 17 6 Water reducers and retarders for cold weather concreting .................................................... 18 7 Retarders for cold weather concreting ...................................................................................... 19 8 XRF oxide analysis results for the cement fraction of Utility Fill and Rapid Set .................. 31 9 Normalized heat generated over 6 hr test duration ................................................................ 40 10 Admixtures used throughout testing .......................................................................................... 44 11 Performance summary of aluminum sulfate admixture in Rapid Set Concrete Mix .......... 45 12 Utility Fill hot water test: performance summary of Utility Fill at specified ambient
and dry materials temperatures using mixing water at specified temperatures. No admixtures added .................................................................................................................. 49
13 Rapid Set hot water test: performance summary of Rapid Set Concrete Mix at specified ambient and dry materials temperatures using mixing water at specified temperatures. No admixtures added........................................................................ 49
14 Admixture investigations summary, Rapid Set: performance summary of Rapid Set at specified ambient, dry materials temperatures when using mixing water solutions at specified temperatures and a variety of admixtures (alone and in combination) ................................................................................................................................. 52
15 Admixture Investigations Summary, Utility Fill: performance summary of Utility Fill at specified ambient, dry materials temperatures when using mixing water solutions at specified temperatures and a variety of admixtures (alone and in combination) ................................................................................................................................. 54
16 Prediction results of select stepwise regression models for the first round of aluminum sulfate (task 3) testing (first 57 tests with the first shipment of Rapid Set product), using Aikake Information Criterion (AIC) stopping criterion ............................. 55
17 Prediction results of select stepwise regression models for all aluminum sulfate (task 3) Rapid Set testing, using AIC stopping criterion .......................................................... 56
18 Recommended heat sheet sizes for heating 200 gal. plastic water tanks in a volumetric mixer ........................................................................................................................... 62

ERDC TR-14-10 vii
Preface
This work was funded by the Air Force Civil Engineering Center (AFCEC) under the Airfield Damage Repair Modernization Program (sponsor: Dr. Craig Rutland) at the U.S. Army Engineer Research and Development Center, Geotechnical and Structures Laboratory (ERDC-GSL), to answer questions related to improving cold weather performance of materials used in expedient horizontal surface repairs.
The work was performed by Jared I. Oren (Force Projection and Sustain-ment Branch, Dr. Edel R. Cortez, Chief) and Jay Clausen (Terrestrial and Cryospheric Sciences Branch, Timothy Cary, Chief), U.S. Army Engineer Research and Development Center, Cold Regions Research and Engineer-ing Laboratory (ERDC-CRREL); Dr. Veera Boddu and Joyce Baird (Envi-ronmental Processes Branch, Deborah Curtin, Chief), ERDC Construction Engineering Research Laboratory (ERDC-CERL); and Dr. Robert D. Moser (Concrete and Materials Branch, Christopher M. Moore, Chief) and Dr. Charles A. Weiss, Jr. (Engineering Systems and Materials Division, Larry N. Lynch, Chief), ERDC-GSL.
The authors wish to acknowledge the following individuals for their sup-port during this activity: Dr. Craig Rutland (AFCEC sponsor), Jeb Tingle (ERDC Airfield Damage Repair project manager), William D. Carruth, and Terry-Ann Stanton (ERDC-GSL) and William T. Burch, Kevin Haskins, and Louise V. Parker (ERDC-CRREL).
At the time of publication, Dr. Justin Berman was Chief of the Research and Engineering Division. The Deputy Director of ERDC-CRREL was Dr. Lance Hansen, and the Director was Dr. Robert Davis.
COL Jeffrey R. Eckstein was the Commander of ERDC, and Dr. Jeffery P. Holland was the Director.

ERDC TR-14-10 viii
Acronyms and Abbreviations ADR Airfield Damage Repair
AFCEC Air Force Civil Engineer Center
AIC Aikake Information Criterion
Al Aluminum
Al2(SO4)3 Aluminum Sulfate Hydrate (or Aluminum Sulfate)
Al2O3 Aluminum Oxide
AS Aluminum Sulfate (Hydrate)
ASTM American Society for Testing and Materials
BIC Bayesian Information Criterion
C2S Dicalcium Silicate, or Larnite
C3A Tricalcium Aluminate
C3S Tricalcium Silicate
C4AF Tetracalcium Alumino Ferrite
CaCl2 Calcium Chloride
Ca(NO3)2 Calcium Nitrate
CaO Calcium Oxide
CaSO4 Calcium Sulfate
CC Calcium Chloride
CERL Construction Engineering Research Laboratory
CLSM Flow Consistency of Controlled Low Strength Material
CN Calcium Nitrate
COTS Commercial Off-the-Shelf
CRREL Cold Regions Research and Engineering Laboratory
CS Calcium Sulfate (Hemi-Hydrate)

ERDC TR-14-10 ix
CSA Calcium Sulfoaluminate
ERDC US Army Engineer Research and Development Center
Fe2O3 Iron Oxide
FTIR Fourier Transform Infrared
Gle Glenium 7500 Water Reducer
GSL Geotechnical and Structures Laboratory
H2O Water
IR Infrared
LOI Loss On Ignition
MRE Meal, Ready-to-Eat
OH Hydroxide
Poz Pozzutec 20+ Accelerator
RCC Roller-Compacted Concrete
RMSE Root Mean Squared Error
SEM Scanning Electron Microsopy
Si Silicon
SiO2 Silicon Dioxide
SN Sodium Nitrate
SS Sodium Sulfate
SO3 Sulfur Trioxide
Sug Cane Sugar
TGA Thermogravimetry Analysis
UCS Unconfined Compressive Strength
USACE US Army Corps of Engineers
w/c Water-Cement
XRD X-ray Diffraction
XRF X-ray Fluorescence Spectroscopy

ERDC TR-14-10 x
Unit Conversion Factors
Multiply By To Obtain
bars 100 kilopascals
cubic yards 0.7645549 cubic meters
degrees (angle) 0.01745329 radians
degrees Fahrenheit (F-32)/1.8 degrees Celsius
feet 0.3048 meters
inches 0.0254 meters
ounces (U.S. fluid) 2.957353 E-05 cubic meters
pounds (force) per square inch 6.894757 kilopascals
pounds (mass) 0.45359237 kilograms
square inches 6.4516 E-04 square meters
yards 0.9144 meters

ERDC TR-14-10 1
1 Introduction
1.1 Background
In support of the U.S. Air Force Civil Engineer Center’s (AFCEC) Airfield Damage Repair (ADR) Modernization Program, the Engineering Research and Development Center (ERDC) Geotechnical and Structures Laboratory (GSL) Airfields and Pavements Branch previously developed a novel solu-tion to the problem of rapidly repairing, in all environments, small and large craters on airfields. Building on this solution, our report investigates admixtures that can improve the low-temperature early strength gain per-formance of two products developed for the Airfield Damage Repair Mod-ernization Program for the purpose of expedient runway repair: a Utility Fill for rapid bulk crater filling and a Rapid Set concrete for heavy-load trafficking and load support.
The solutions hereby provided are intended for only the stated purpose: the expedient filling of blast holes (in horizontal surfaces at −10°C to 10°C) using GSL’s Utility Fill and Rapid Set hard cap solution approach when low temperatures are a concern (high altitude, winter, or other expectation of near- or below-zero temperatures). These solutions are not intended for civilian construction because the material produced may not meet the re-quired quality, durability, and appearance normally required by most hor-izontal and vertical construction applications.
1.2 Project description
The ERDC-GSL runways and airfields program’s novel solution to airfield crater repair can be applied in all environments, in a wide range of tem-peratures. The Air Force’s expedient ADR process occurs in two steps: first, filling the bulk of the crater void space (less 10 in. to the top of the crater) with a rapidly hardening flowable fill material called “Utility-Fill One-Step” (produced by Buzzi Unicem USA Inc). The Utility Fill is a dry, gray powder composed of silica sand and a variety of calcium silicates, aluminous materials, and gypsum, hardening quickly to an initial “set” of approximately 250 psi with the on-site addition and minimal mixing of water (a volumetric mixer is preferred due to rapid-set properties). Once initial set has been reached (typically about 30 min), a second layer, called

ERDC TR-14-10 2
the “hard cap” is added to the crater (filling the final 10 in. depth) to in-crease the strength and durability of the road surface. The hard cap con-sists of a slight variation of the commercially available “Rapid Set Concrete Mix” (produced by CTS, cement specifically for the GSL program). The Rapid Set mix also requires only the addition of water and mixing because it consists of a pre-blend of Type III Portland cement (calcium sulfoaluminate [CSA] cement with some small amount of admixtures for workability), 3/8 in. pea gravel, and a small amount of concrete sand (less than 1%). The hard cap is designed to have an initial workability, a set (500 psi) by 45 min from the initial addition of water, and an uncon-strained compressive strength (UCS) at two hr that will allow for the min-imum of 100 (and target 1000+) vehicle traffic loads required by the Air Force. The Air Force minimum loading is simulated during testing using GSL’s load cart and an F-15 tire loaded at 35,000 lb at 325 psi.*
While the two-step solution to crater repair has demonstrated success at mild temperatures (greater than 10°C), both the Utility Fill and the hard cap demonstrate issues with time of set (and with the ability to set and not freeze) and early strength gain in temperature ranges of −10°C to 10°C. In an attempt to improve the two-step solution’s performance and reliability over a wider temperature range, the research requirements outlined below address this deficiency. In addition, to target other potential horizontal surface repair applications, including asphalt surface and sub-surface ex-pedient repair, our research explored improvements to the Utility Fill at near- and sub-freezing temperatures.
ERDC tested and evaluated a variety of methods to improve the perfor-mance of the existing Utility Fill and hard cap over the widest feasible low temperature ranges with minimal alteration to candidate solutions at dif-ferent temperature ranges. This investigation used a combination of rapid materials analyses and a survey of the most promising materials outlined in previous cold-weather admixtures research to perform a down-selection of potentially suitable admixtures (see Section 3). For expediency, some admixtures were initially screened for suitability using mortar mixes by using primarily ASTM (American Society for Testing and Materials) pene-
* For more information on similar crater repair methods, equipment, and materials used by the U.S. Ar-
my, see Center for Army Lessons Learned (2011).
ERDC TR-14-10 3
tration resistance procedure C403 (ASTM International 2008b). We tested with a concrete mix the best performing combination, performing both penetration resistance and unconfined compressive strength testing. All laboratory tests were conducted at the ERDC Cold Regions Research and Engineering Laboratory (CRREL) in Hanover, NH. In addition, a variety of materials analyses were conducted at ERDC-GSL in Vicksburg, MS, and at the ERDC Construction Engineering Research Laboratory (CERL) in Champaign, IL.
1.3 Project objectives
The GSL program manager outlined three areas (discussed in the sections below) of research involving improvements to the set times and early strength gains for both the Utility Fill and Rapid Set materials.
1.3.1 Admixture investigations
The first goal was to determine a suitable admixture and proportion neces-sary to improve the performance of the Utility Fill under the following constraints:
1. Utility Fill time of set (time to reach ≥250 psi penetration resistance) min-imum and maximum: 15 min and 30 min.
2. Temperature ranges suitability goal for new admixture: −15°C to 10°C. 3. Admixtures must be added to the water with no alterations to the Utility
Fill dry mix.
To investigate possible admixtures for addition to the Utility Fill mix, im-plied tasks included evaluating the chemistry of the flowable fill, identify-ing candidate admixtures for inclusion, running lab tests (small batch), and performing other investigations and analyses.
In addition to investigations involving the addition of the admixture to the Utility Fill, we were to determine a suitable admixture and proportion necessary to improve the performance of the Rapid Set under the follow-ing constraints:
1. Hard cap time of set (time to reach 500 psi penetration resistance) mini-mum and maximum: 15 min and 45 min.
2. Temperature ranges suitability goal for new admixture: −15°C to 10°C.

ERDC TR-14-10 4
3. 2 hr UCS: ≥2500 psi. 4. Admixtures must be added to the water with no alterations to the Rapid
Set dry mix. 5. Mixing water temperature is 5°C to 10°C.
Note that using only aluminum sulfate hydrate (Al2[SO4]3 × 12H2O) ad-mixture, solutions satisfying the optional fifth constraint would provide an improvement to the performance of the hard cap at cold temperatures be-cause aluminum sulfate acts primarily as an accelerant to the hydration process and is a poor freezing-point depressant. An aluminum sulfate–water solution that remained close to 0°C for an extended period of time would exhibit significant icing and would not have a strong hydration ac-celerant effect when introduced to the Rapid Set dry mix.
1.3.2 Utility Fill and Rapid Set hot water testing
To improve the initiation of the reaction process (reliability and speed) at low ambient and ground temperatures (−10°C to 10°C) for both the Utility Fill and in the hard cap, the second goal was to determine a suitable ad-mixture and proportion necessary to chemically heat (via exothermic reac-tion) the mixing water for use in both. Any admixture added must provide this reaction initiation improvement without degrading the performance of either mixture (e.g., set or UCS values or estimates for short-term dura-bility).
This task attempted to satisfy the same constraints as outlined in the first task but in a way that did not alter either mixture (Utility Fill or Rapid Set), instead introducing admixture to the water directly. This approach was perceived by the project manager and client (Air Force) as the ideal solution given the tactical and practical short-term constraints involved in introducing any changes to the mixtures already procured and in use.
A second objective of the hot water testing was posed in the event that chemical heating of the mixing water proved unreliable or ineffective: to improve the initiation of the reaction process (reliability and speed) in both Utility Fill and the hard cap at low ambient and ground temperatures (−15°C to 10°C) and to determine suitable temperatures (to be heated me-chanically) of the mixing water.

ERDC TR-14-10 5
1.3.3 Aluminum sulfate Rapid Set testing
In previous research, the GSL program identified aluminum sulfate as the best known admixture to add to the hard cap to improve the initial set and 2 hr UCS at temperatures below 10°C. Therefore, our third goal involved quantifying (with a higher degree of statistical certainty than provided in previous GSL testing) the proportions of aluminum sulfate (from the cur-rent vendor, Fisher Scientific) necessary to meet the following constraints:
1. Hard cap time of set (time to reach 500 psi penetration resistance) mini-mum and maximum: 15 min and 45 min.
2. Temperature ranges suitability goal for new admixture: −15°C to 10°C. 3. 2 hr UCS: ≥2500 psi. 4. Admixtures must be added to the water with no alterations to the Rapid
Set dry mix.

ERDC TR-14-10 6
2 Technical Approach
2.1 Introduction
The desired end state of the materials analyses and laboratory testing was to determine the most reliable method to improve the performance of both the Utility Fill and Rapid Set materials at near- and sub-freezing tempera-tures where successful performance involved time of set and early strength gain requirements. To reach this end state, testing followed several distinct phases. First, because previous testing identified aluminum sulfate as the most promising admixture for use in the Rapid Set at near and sub-freezing temperatures, the aluminum sulfate Rapid Set test phase was conducted first to better quantify the proportions and effects of aluminum sulfate given a variety of effects variables (e.g., ambient and materials temperatures and water-cement ratio [w/c]).
We conducted two analysis categories in parallel to prepare for the final two test phases. To develop an exhaustive list of admixtures that could al-low the Utility Fill and the Rapid Set to meet the objectives in the final two test phases, we conducted a historical analysis of cold-weather concrete and flowable fill materials. Next, we completed a materials and chemistry analysis of both the Utility Fill and the Rapid Set to understand the unique hydration processes occurring in each material and their response to vari-ous effects variables. We then combined this analysis with the historical analysis to identify a shortlist of potential admixtures for use in the final two test phases.
After the historical, materials, and chemistry analyses were complete, we began the hot water test phase to determine the feasibility of mechanical or chemical heating of the mixing water to reach the objectives for set time and 2 hr UCS for the Utility Fill and Rapid Set materials. The final test phase explored admixtures (alone and in combination) for their potential based on historical analysis and compatibility with the Utility Fill and Rap-id Set materials. To reduce the combinatorial complexity of this test phase, we first determined the effects of individual admixtures, quantifying their effects at minimum and maximum useful proportions. The team deter-mined these extremes by considering historical research and recommen-dations, water solubility as a function of temperature, and other variables.

ERDC TR-14-10 7
After this individual admixtures test phase, we used the admixtures in combination to obtain the material performance results historically re-quired as will be discussed in further detail in the Section 3 Summary of Related Historical Research (freeze point depressant, acceleration of the hydration process, and potential initial retarders to lower results variabil-ity).
To further reduce the time required to perform a large number of tests during the admixture investigations phase, we sieved the Rapid Set mate-rials and removed all course aggregates, performing all testing with the remaining mortar (cement, sand, mixing water, and admixture). While we did not expect the set times and strength gains for the mortar mixes to minimally deviate from concrete mixes with the same admixture ratios, this procedure allowed for a more rapid screening of poor combinations of admixtures by ruling out candidates. Previous testing (for example, Oren et al. 2013) demonstrated the suitability of mortar testing as a surrogate for concrete batch testing if the results of the mortar testing is suitably mapped to equivalent concrete batches with similar effects variables and proportions (e.g., ambient and materials temperature, w/c, and admixture proportions).
2.2 Materials normalization
The team used the following procedure to prepare the Utility Fill and the Rapid Set materials for all testing. Both materials were provided directly from the manufacturer and from a stockpile from previous testing (at GSL). Therefore, due to potential settling of the component materials in the stock pile, the materials exhibited a larger degree of variability in com-ponent proportions than if delivered from the manufacturer in 60 lb buck-ets. Typical testing allows for tight controls of the ratios of cement to fines to course aggregates ratios; but for two primary reasons, determining the-se exact ratios and controlling them to typical laboratory testing standards was infeasible in this rapid investigation. First, the exact proportions (and their variability in each batch) and material contents are proprietary in-formation and so must be experimentally determined. However, experi-mentally determining these proportions with a large degree of precision was infeasible because the materials used were harvested from 2000 lb “super sacks” from the manufacturer; and the harvesting team did not have the ability to mix the entire 2000 lb sack contents uniformly prior to

ERDC TR-14-10 8
creating 60 lb bucket samples. Therefore, to mitigate the effects of this variability in each 60 lb bucket sample while still meeting the testing time-lines, a random sample of buckets received were measured for their fines (cement and sand)-to-aggregates ratio; and then all samples were con-trolled to that mean ratio with the dry mix weights for both materials con-trolled to 60 lb. A higher than normal variability in the cement-to-sand ratio then likely still existed. This remaining variability had a moderately negative impact on the predictability of our results in the aluminum sul-fate Rapid Set testing (see the Models for factors prediction, results re-peatability section). However, as will be discussed further, the results and recommendations resulting in each test phase remain conclusive despite this slight degradation in our ability to predict set times and compressive strength gain over time.
2.3 Mixing
The batch sizes in all Rapid Set and Utility Fill testing varied from 3 lb to 60 lb (5 gal. bucket size). Because of the small size of batches in these in-vestigations, materials were able to be suitably mixed with several modifi-cations to ASTM Standard C192 (ASTM International 2007). If chemical admixtures were used, they were dissolved in the mixing water at the de-sired initial water temperature (in many cases, tap water at 6°C–10°C). The water solution was then brought to the desired testing temperature (from −5°C to 90°C). For each mix, we identified a target w/c and held out a small amount of water to add only as necessary (the amount varied de-pending on the batch size) to incrementally reach a target slump or work-ability estimate (5 in. slump for Rapid Set testing; 10 in. slump for Utility Fill as indicated in the objectives section [Section 1.3]).
We used a handheld mixer (a drill with an attachment) and added all dry materials to a large mixing trough. We then added two-thirds of the water solution and all dry materials (Rapid Set or Utility Fill). We mixed the Utility Fill or Rapid Set for 2–3 min and visually inspected it for workabil-ity prior to adding additional water solution as necessary. Mixing was con-tinued. Mixing occurred for a total of 3–5 min prior to conducting a slump test (see Material evaluation tests section).

ERDC TR-14-10 9
2.4 Sample preparation and curing
All materials were staged in cold rooms at the desired ambient and mate-rials’ nominal temperature (−15°C, −10°C, −5°C, 0°C, 5°C, 10°C, 20°C) for a minimum of 24 hr prior to testing. We monitored cold rooms for their average daily temperature and recorded detailed data (minute readings) to ensure low instant temperature variability. Immediately after mixing, each Rapid Set or Utility Fill mix was cast into plastic cylindrical molds (size varied depending on batch size: 2-in. diameter × 4-in. height, 3-in. diame-ter × 6-in. height, 4-in. diameter × 8-in. height), tapped with a mallet to ensure consolidation, not capped (to simulate realistic operational proce-dures), and stored in the same room at the desired ambient temperature.
2.5 Material evaluation tests
2.5.1 Slump and workability
A combination of slump tests and mixture workability estimates (less pre-cise) were conducted for all mortar and concrete mixes during initial mix-ing. Slump tests were conducted per ASTM standard C143 (ASTM Interna-tional 2002). Initial workability was measured for some Rapid Set and Utility Fill mixtures and on a 1–10 scale (1 = unworkable/stiff, 10 = liquid pour). Because of time limitations, we conducted a modification of ASTM D6103-97, “Standard Test Method for Flow Consistency of Controlled Low Strength Material (CLSM)” (ASTM International 1997), to measure the flow consistency of the Utility Fill, using a combination of a slump esti-mate (10 in. ± 2 in. criterion) and an initial workability estimate. Because concrete mixing is often performed under poorly controlled internal and external factors in this field expedient application, we attempted to pro-duce in the end recipes for the Rapid Set with a reliable 4–7 workability (mildly to extremely workable with no visible component materials segre-gation) or 4–6-in. slump while adhering to all other performance require-ments. Utility Fill recipes were designed for an imprecise slump estimate of 10 in. ± 2 in. and a workability estimate of 10. Water–cement ratios listed in subsequent sections are imprecise estimates as the precise quanti-ties of cement, fine aggregates, and course aggregates (Rapid Set only) are unknown in both pre-mixed materials. Because of time constraints, only the ratio of fines to course aggregates was measured in the samples (omit-ting the ratio of cement to fine aggregates).

ERDC TR-14-10 10
2.5.2 Set time
Measuring set time was a requirement for all samples for both the Utility Fill and Rapid Set materials because we wanted to alter and control the variety of factors, such as the type of cement, w/c, temperature, and the addition of chemical admixtures (Klieger and Lamond 1994), that may in-fluence concrete set times. Testing was conducted in accordance with ASTM C403 (ASTM International 2008b) using a Humboldt Universal Penetrometer (Figure 1). Only minor modifications were made to the standard, such as the test was conducted at different time intervals than recommended so that we could capture the early strength gain infor-mation. The test monitored the stiffening of fresh concrete as the hydra-tion process proceeded after the initial contact of water and binder materi-al (Mindess and Young 1981). The designated values of initial and final set were set at 500 and 1000 psi, respectively. Initial set was considered to be the point at which fresh concrete had lost its workability, and final set was when the concrete began to gain significant strength. In this application, the initial set was the primary target of investigation; and any penetration resistance readings beyond 500 psi were used only as an indicator of strength gain during the admixture investigations phase of testing.
Figure 1. Humboldt Universal Penetrometer used for all penetration resistance testing to
estimate set times.

ERDC TR-14-10 11
2.5.3 Two-hour unconfined compressive strength
Measuring UCS was a requirement for all samples for the Rapid Set be-cause a design strength of 2500 psi UCS was previously determined by the sponsor as the minimum strength necessary for this expedient runway re-pair application. All UCS testing was conducted in accordance with ASTM C39, Standard Test Method for Compressive Strength of Cylindrical Con-crete Specimens (ASTM International 2008a), using a 300K lb Riehle compressive strength machine (Figure 2).
Figure 2. A 300K lb Riehle machine (shown above) was used to conduct all unconfined
compressive strength testing.

ERDC TR-14-10 12
3 Summary of Related Historical Research
3.1 Introduction
Cold weather concreting using admixtures has been of interest since the 1950s with much of the research conducted first by the Russians and fol-lowed by the Scandinavian countries in the 1980s. Korhonen (1990) sum-marizes this earlier research conducted by the Russians and Scandinavi-ans. The research by Korhonen and colleagues in the 1990s and early 2000s forms the basis of cold concreting knowledge in the United States. During this period, Korhonen and others published a dozen reports on be-half of the U.S. Army Corps of Engineers (USACE), ERDC-CRREL (Korhonen 1990, 1999, 2002a, 2002b, 2006; Korhonen and Brook 1996; Korhonen and Orchino 2001; Korhonen and Semen 2005; Korhonen et al. 1997a, 1997b, 1997c, 2004). These reports evaluated different types, com-binations, and concentrations of admixtures for cold weather concreting at temperatures from 5°C to −20°C.
Given the current project goals, the relevance of the body of research cited above is somewhat limited to the application of runway repair. For exam-ple, the maximum set-time criteria for the CTS Rapid Set Concrete were limited to 45 min and 30 min for the Utility Fill. However, very few of the studies cited above recorded the set time of the concrete. In addition, the minimum compressive strength desired at 2 hr for the CTS Rapid Set Con-crete is 2500 psi and 250 psi for the Utility Fill. However, none of the studies cited above determined the compressive strength of the various concrete admixtures at 2 hr. In most instances, the earliest compressive strength measurements were conducted at 7 days and then periodically on 7-day intervals out to 56 days in some instances. Although compressive strength versus time is somewhat linear in the interval of 7 to 56 days, this is not the case over shorter time intervals. Compressive strength versus time over the first 24 hr to several days is expressed as a polynomial or power curve. Thus, the ability to extrapolate from the late-time compres-sive strengths to predict the compressive strength at the early-time condi-tions is limited.

ERDC TR-14-10 13
3.2 Materials and effects summary
A number of different admixtures can be added to concrete to depress its freezing point; to improve strength, workability or slump, and resistance to freezing; to accelerate the reaction; to reduce the water requirement; or to improve strength. Table 1 lists a number of salt and salt mixtures that lower the freezing point of water and have potential use for cold weather concreting. The admixtures identified with an asterisk following the name are those identified to be in common use although it was acknowledged that the chloride based compounds caused corrosion problems (Korhonen 1990). Korhonen’s (1990) compilation of data indicates the highest 28-day compressive strength was observed with the addition of ammonium hy-droxide, followed by sodium chloride, then calcium chloride with sodium nitrite. The U.S. Army’s patented admixture of sodium nitrate and sodium sulfate at a dosage of 4.5% and 1.5%, respectively, is recommended for cold weather concreting (Korhonen et al. 1997c).
Some of the same materials listed in Table 1 are also used as accelerants to speed up the reaction rate, to accelerate settling, and to increase early strength gain (Table 2). Korhonen et al. (1997c) identified some of the best accelerators, associated freezing point temperature by dosage, and found that higher dosages yielded lower freezing points (Figure 3). Calcium ni-trate (Ca[NO3]2)with a dosage of 8.5% by cement weight yielded a freezing point below −8°C. Admixtures that produced the best strength coupled with rapid setting included sodium nitrate + potassium carbonate, sodium nitrite + sodium sulfate, sodium nitrite + calcium nitrite, and sodium ni-trite.

ERDC TR-14-10 14
Table 1. Freezing point depressants potentially useful for cold weather concreting.
Types of Admixtures Compound Name NH40H ammonium hydroxide CaCl2 calcium chloride* CaCl2 + NaNO2 calcium chloride + sodium nitrite* CaCl2 + Ca(NO3)2 calcium chloride + calcium nitrate Ca(NO3)2 calcium nitrate Ca(NO3)2 + CO(NH2)2 calcium nitrate + urea* Ca(NO3)2 + Na2SO4 calcium nitrate + sodium sulfate* Ca(NO2)2 calcium nitrite Ca(NO2)2 + CO(NH2)2 calcium nitrite + urea* Ca(NO2)2 / (NO3)2 + CO(NH2)2 calcium nitrite / nitrate + urea* [Ca(NO2)2 / (NO3)2 + CaCl2] + CaCl2 + NaNO2 calcium nitrite / nitrate + calcium chloride + sodium nitrite* Ca(NO2)2 / (NO3)2 +CaCl2 + CO(NH2) calcium nitrite / nitrate + calcium chloride + urea* Ca(CH3COO)2 calcium magnesium acetate Ca(NO3)2 /(H2COH)2 calcium nitrate / ethylene glycol C2H6O ethylene alcohol (H2COH)2 ethylene glycol LiOH lithium hydroxide LiNO3 lithium nitrate C6H9MnO6 × 2(H20) manganese acetate MgCl2 magnesium chloride Mg(NO3)2 magnesium nitrate MgSO4 magnesium sulfate CH4O methyl alcohol CH3CO2K potassium acetate K2CO3 potassium carbonate* KCl potassium chloride KNO3 potassium nitrate C2H3NaO2 sodium acetate NaCl sodium chloride* NaCl + CaCl2 sodium chloride + calcium chloride NaNO3 sodium nitrate NaNO3 + Na2SO4 sodium nitrate + sodium sulfate NaNO2 sodium nitrite* NaNO2 + Na2SO4 sodium nitrite + sodium sulfate* NaNO2 + Ca(NO3)2 + CaCl2 sodium nitrite + calcium nitrate + calcium chloride* NH4OH ammonium hydroxide* Na2SO4 sodium sulfate C3H8O propyl alcohol C4H6O3 propylene carbonate C3H8O2 propylene glycol CH4N2O urea *Common admixtures as identified by Korhonen (1990).

ERDC TR-14-10 15
Table 2. Accelerators for cold weather concreting.
Types of Admixtures Compound Name or Vendor CaCl2 calcium chloride CaBr calcium bromide Ca(NO3)2 calcium nitrate Ca(NO2)2 calcium nitrite Ca(C2H3O2)2 calcium acetate Ca(HCOO)2 calcium formate K2CO3 potassium carbonate DCI W. R. Grace Polarset W. R. Grace Daraset W. R. Grace DP Master Builders, Inc.* EY-11 Master Builders, Inc.* Pozzolith 122-HE Master Builders, Inc. Pozzolith NC 534 Master Builders, Inc. Pozzutec 20 Master Builders, Inc. Pozzutec 20+ Master Builders, Inc. Rheocrete CNI Master Builders, Inc.
* Admixture not commercially available.
Figure 3. Comparison of freezing point and dosage for various calcium salt admixtures.
ERDC TR-14-10 16
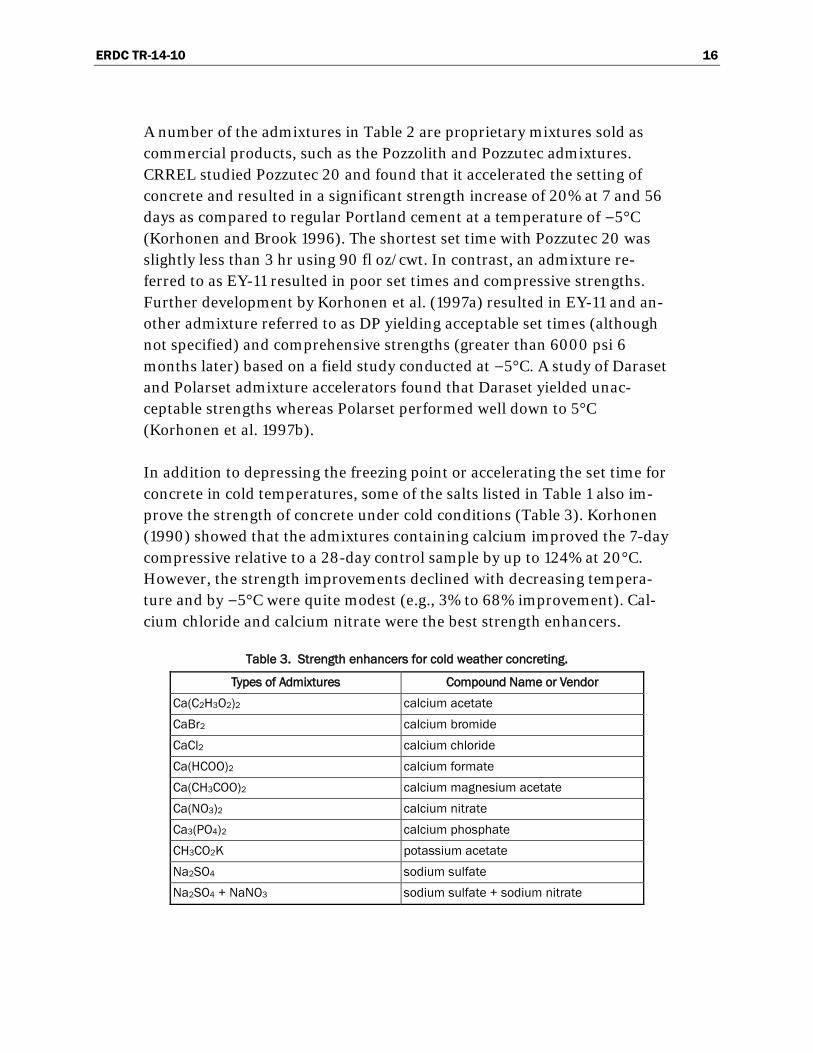
A number of the admixtures in Table 2 are proprietary mixtures sold as commercial products, such as the Pozzolith and Pozzutec admixtures. CRREL studied Pozzutec 20 and found that it accelerated the setting of concrete and resulted in a significant strength increase of 20% at 7 and 56 days as compared to regular Portland cement at a temperature of −5°C (Korhonen and Brook 1996). The shortest set time with Pozzutec 20 was slightly less than 3 hr using 90 fl oz/cwt. In contrast, an admixture re-ferred to as EY-11 resulted in poor set times and compressive strengths. Further development by Korhonen et al. (1997a) resulted in EY-11 and an-other admixture referred to as DP yielding acceptable set times (although not specified) and comprehensive strengths (greater than 6000 psi 6 months later) based on a field study conducted at −5°C. A study of Daraset and Polarset admixture accelerators found that Daraset yielded unac-ceptable strengths whereas Polarset performed well down to 5°C (Korhonen et al. 1997b).
In addition to depressing the freezing point or accelerating the set time for concrete in cold temperatures, some of the salts listed in Table 1 also im-prove the strength of concrete under cold conditions (Table 3). Korhonen (1990) showed that the admixtures containing calcium improved the 7-day compressive relative to a 28-day control sample by up to 124% at 20°C. However, the strength improvements declined with decreasing tempera-ture and by −5°C were quite modest (e.g., 3% to 68% improvement). Cal-cium chloride and calcium nitrate were the best strength enhancers.
Table 3. Strength enhancers for cold weather concreting.
Types of Admixtures Compound Name or Vendor Ca(C2H3O2)2 calcium acetate CaBr2 calcium bromide CaCl2 calcium chloride Ca(HCOO)2 calcium formate Ca(CH3COO)2 calcium magnesium acetate Ca(NO3)2 calcium nitrate Ca3(PO4)2 calcium phosphate CH3CO2K potassium acetate Na2SO4 sodium sulfate Na2SO4 + NaNO3 sodium sulfate + sodium nitrate

ERDC TR-14-10 17
Plasticizers or super plasticizers are also added to the various cold weather concrete admixtures to improve workability or slump, to reduce the water requirement, or to improve strength (Table 4).
Table 4. Plasticizers or super plasticizers for cold weather concreting.
Plasticizers Types of Admixtures Compound Name or Vendor
lignosulphonic acids and salts Various hydroxylated carboxylic acids and salts Various Polyheed 997 Master Builders, Inc. Pozzolith 322-N Master Builders, Inc.
Super Plasticizers sulphonated melamine formaldehyde Various sulphonated naphthalene formaldehyde Various modified lignosulphonates Various polycarboxylate materials Various
In addition, air entrainers are often added to cold weather concrete admix-ture to improve workability or slump and resistance to freezing (Table 5). Upon thawing, these admixtures can lose up to 5% strength.
Table 5. Air entrainers for cold weather concreting.
Types of Admixtures Compound Name or Vendor salts of wood resins Various animal fats or oils Various vegetable fats or oils Various sulphonated hydrocarbons Various Daravair W. R. Grace Daravair 1000 W. R. Grace Darex II AEA W. R. Grace MB AE 90 Master Builders, Inc. MB-VR Standard Master Builders, Inc. Micro-Air Master Builders, Inc.
In some cold weather concreting situations, water reducers are needed or retarders are needed if the concrete sets too quickly at the working tem-perature. Table 6 is list of water reducers or water reducers and retarders.

ERDC TR-14-10 18
Table 6. Water reducers and retarders for cold weather concreting.
Types of Admixtures Compound Name or Vendor Water Reducers
WRDA 19 W. R. Grace WRDA 82 W. R. Grace WRDA w/ Hycol W. R. Grace Daracem 19 W. R. Grace Daracem 55 W. R. Grace Daracem 65 W. R. Grace Mira 70 W. R. Grace Polyheed 997 Master Builders, Inc. Pozzolith 122-N Master Builders, Inc. Pozzolith 322-N Master Builders, Inc. Rheobuild 1000 Master Builders, Inc. Rheobuild 3000 FC Master Builders, Inc. Glenium 3000 NS Master Builders, Inc.
High Range Water Reducers Daracem 19 W. R. Grace Daracem 100 W. R. Grace Mira 70 W. R. Grace Adva Flow W. R. Grace Adva 100 W. R. Grace Polyheed 997 Master Builders, Inc. Rheobuild 1000 Master Builders, Inc. Rheobuild 3000FC Master Builders, Inc. Glenium 3000 NS Master Builders, Inc.
Water Reducers and Accelerators Daraccel W. R. Grace Pozzolith 122-HE Master Builders, Inc. Pozzutec 20 Master Builders, Inc. Pozzutec 20+ Master Builders, Inc.
Water Reducers and Retarders Daratrad 17 W. R. Grace Recover W. R. Grace Delvo Stabilizer Master Builders, Inc. Pozzolith 100-XR Master Builders, Inc.
High Range Water Reducers and Retarders Daracem 100 W. R. Grace

ERDC TR-14-10 19
In other situations, only a retarder is needed for cold weather concreting. Table 7 provides a list of retarders.
Table 7. Retarders for cold weather concreting.
Retarders hydroxylated carboxylic acids Various lignins Various sugar Various phosphates Various Daratard 17 W. R. Grace Delvo Stabilizer Master Builders, Inc. Pozzolith 100-XR Master Builders, Inc.
Korhonen and Orchino (2001) found that a combination of calcium chlo-ride with an accelerant, water reducer and accelerant, and high-water re-ducer were the best combination for lowering the freezing point and for rapid concrete set, workability, and strength although this report did not specifically identify the admixtures or dosages desirable to mix with con-crete. Similarly, Korhonen (2002a) found that a combination of admix-tures worked well and met his criteria for cold weather concreting at tem-peratures below 5°C, but he did not identify the specific admixtures and dosages. Korhonen (2002b) found that concrete admixtures worked best if the mixing water contained more than 3% solutes, and he suggested that some Russian studies indicated dosages as high as 20% worked well. Stud-ies indicated that in the field, off-the-shelf admixtures could be readily mixed with cold water using standard equipment and could yield accepta-ble concrete at temperatures between 0°C and −5°C (Korhonen 2006).
Based upon the previous findings, most recent studies on cold weather concrete systems have focused on using a combination of several commer-cially available chemical admixtures. These mixtures have been found to depress the freezing point of the concrete mix water, to protect the fresh concrete at subfreezing temperature (as low as −5°C), and to promote ear-ly strength gain without requiring temporary shelters and external heating (Barna et al. 2010b).
Barna et al. (2010a) tested five different combinations (i.e., 5 mixes) of admixture ingredients in a full-scale, winter field trial at Fort Wainwright, AK. The admixtures included Glenium 3000NS, Pozzutec 20+, Rheocrete

ERDC TR-14-10 20
CNI, and Rheomac VMA. Only three admixture ingredients were com-bined for any one mix. They found that all five mixes reached the required 4000 psi compressive strength within 5 days of curing and that all but one of the mixtures (the only mix containing the Rheomac VMA) had contin-ued to gain strength (to about 7000 psi) when tested on day 28. Freezing point measurements revealed that mix 1 had a substantially lower freezing point (25.4°F) than the other four mixes (which ranged from 30.5°F to 29.2°F). This is not surprising given that this mix had a substantially high-er percent of total solids than the other four mixes. For mixes 1, 2, 3, and 4, Figure 4 shows the linear relationship between the chemical admixtures in the mix water (percent solids) and the resulting initial freezing point (as initially described by Korhonen et al. [2004]). Mix 1 contained 8 fl oz/cwt Glenium 3000NS, 68.0 fl oz/cwt Pozzutec 20+, and 4 g/yd of Rheocrete CNI. However, the researchers did not follow the gain in strength of these materials within the first few hours. (Rheomac VMA is an admixture that had not previously been used in cold-weather concrete systems. It is a cor-rosion inhibitor that also enhances concrete viscosity and provides stabil-ity against segregation.)
Figure 4. The relationship between freezing point depression and the total percent solids in
the mix water.
Cortez et al. (2010) conducted laboratory tests on a combination of Rheocrete CNI and Pozzutec 20+ admixtures for use as cold roller-
Initi
al F
reez
ing
Poin
t Tem
pera
ture
(de
gree
s F)
32
y = -0.58x + 33.44 R2 = 0.99
30
28
26
24 0 2 4 6 8 10 12 14 16
Total Percent solids (by mass of water)

ERDC TR-14-10 21
compacted concrete (cold-RCC). They tested a series of seven combina-tions of these admixtures. Each combination was an improvement on the previous formulation. They cured samples at room temperature (22.8°C) and in the cold (at O°C and −5°C). The final formulation was tested in a full-scale field demonstration conducted at Fort Drum, NY, where the am-bient air temperature was −0.6°C. In the field study, compressive strengths were measured after 1, 3, 7, and 28 days. The final formulation contained 658 lb/yd3 cement, 2225 lb/yd3 coarse aggregate, 1094 lb/yd3 fine aggregate, 249.6 lb/yd3 added water, 50 lb/yd3 Rheocrete (with 16.25% solids), and 34.72 lb/yd3 Pozzutec (with 13.89% solids); and the final calculated moisture content for this formulation was 6.23%. In the field, a second formulation was also tested that contained slightly more added water and had a calculated moisture content of 7.03%.
After 1 day, the lower-moisture mix cured at 22.8°C yielded a compressive strength of 4000 psi. After 3 days, the mix cured at O°C yielded a similar compressive strength; and the mix cured at −5°C yielded a similar com-pressive strength after 28 days.
Barna et al. (2010b) have also conducted both laboratory and field evalua-tions of rapid setting cementitious materials for large crater repair. Test materials included Rapid Set DOT Cement, Cera-Tech Pavemend EX-H, Degussa ThoRoc Repair Mortar, Ultimax Concrete, and Ultimax Aquacrete. Although they measured compressive strengths after 2 hr, none of the tests were conducted in the cold.
In laboratory tests conducted by Barna et al. (2010a) at room temperature, only the Rapid Set DOT Cement met the requirements of greater than or equal to 3000 psi at 2 hr and greater than or equal to 5000 psi at 1 and 28 days. The initial set time was 60 min, the final set time was 80 min, and the slump was measured to be 4 in. (water temperature was 22°C). How-ever, the performance of the ThoRoc Repair Mortar 10-61 was also rela-tively good with a compressive strength greater than 3000 psi after 4 hr and nearly 5000 psi at 1 and 28 days. The laboratory tests conducted at 32°C clearly showed reduced compressive strengths for all the materials tested with increased initial and final set times. Barna et al. (2010a) con-cluded that this illustrated the need to test materials under the anticipated temperature conditions.

ERDC TR-14-10 22
For the field tests, Barna et al. (2010b) repaired large craters that they then subjected to trafficking with a load cart (after 4 hr) equipped with an F-15E tire. The air temperatures were 32–36°C for this test. Two materials performed best: the Rapid Set DOT Cement and the ThoRoc 10-61 Rapid Repair Mortar. Both sustained over 5000 passes of the F-15 load cart with only low severity cracking. Barna et al. (2010b) also noted that although Pavemend EX-H (a material developed for hot weather) did not perform well in the laboratory tests, it performed well in the field test.

ERDC TR-14-10 23
4 Utility Fill and Rapid Set Concrete Materials Analyses
4.1 Introduction
The primary focus of the materials analyses phase was to identify various compounds of the two concrete mixtures, Utility Fill and Rapid Set, before and after hydration and setting. This information would provide their chemical composition, mineralogy and hydraulic reactivity, and the chem-ical changes that contribute to the physical and mechanical properties of the concrete. These analyses may also isolate the effect of admixtures. The information will also provide insight to improve the unconfined compres-sive strength and the setting kinetics through modifications to the compo-sition of the two concrete mixtures. The analyses conducted are primarily divided into three categories: physical properties, chemical properties, and thermal properties. Morphological observations were conducted using scanning electron microscopy (SEM) and chemical composition and min-eralogy—using wavelength-dispersive X-ray fluorescence spectroscopy, X-ray diffraction, and Blaine fineness (i.e., surface area). To characterize changes in the resulting microstructure, SEM was conducted on hydrated samples and, in some cases, an accelerating admixture. Chemical analysis included Fourier Transform Infrared (FTIR) spectroscopy, which basically provides various chemical functional groups. We evaluated thermal analy-sis and early-age hydraulic reactivity by using in-situ isothermal calorimetry techniques to monitor in real time setting and the heat flow associated with cementation reactions.
4.2 Materials
As described in previous sections, the two materials of interest for this study were Utility Fill and Rapid Set. CRREL sent to CERL and GSL sam-ples of Utility Fill and Rapid Set concrete before and after hydration. Some samples were hydrated on-site at CERL and GSL. Since the primary inter-est in these materials was how the early-age properties can be improved, many of the characterization efforts focused on the cementing phase of each material (only about 7% and 35% by mass in Utility Fill and Rapid Set, respectively). To isolate the cement fraction of each material, the lab

ERDC TR-14-10 24
passed the as-received material through a #325 (44 µm) sieve to remove the aggregate. X-ray diffraction measurements, described in a subsequent section, verified the success of this method.
4.3 Methods
The following sections provide a brief description of the instruments and the approaches to characterization of the materials.
4.3.1 Morphology, chemistry, and mineralogy
4.3.1.1 Scanning electron microscopy
Using SEM, we characterized the microstructure present in Utility Fill and Rapid Set cements with water and accelerator solutions. The samples measured included Utility Fill with water (H2O), Rapid Set with water, Rapid Set with a 15% calcium chloride (CaCl2) solution, and Rapid Set with a 10% aluminum sulfate hydrate solution. All samples had a w/c of 0.6. Samples were imaged after at least 3 days of hydration. Specimens for SEM imaging were freshly fractured and affixed to SEM stubs with the ex-posed fracture surface facing up for imaging. We imaged the specimens by using an FEI Nova NanoSEM 630 variable pressure field emission SEM. Using a backscattered electron detector to reveal changes in microstruc-ture and the distribution of phases according to their respective densities, we performed imaging at an accelerating voltage of 5 to 15 kV and used low-vacuum environmental mode (pressure of 0.1–1.0 mb) to minimize charging and dehydration of the samples.
4.3.1.2 Wavelength-dispersive X-ray fluorescence spectroscopy
Using X-ray fluorescence spectroscopy (XRF), we determined the meas-urements of the chemical composition of the cement fraction isolated from the Utility Fill and Rapid Set materials. All analyses used a Panalytical Axios Cement XRF spectrometer. Internal calibrations for all relevant el-ements present in cement-based materials were used to quantify the chemical composition. Using a Claisse fluxy with a lithium borate fluxing medium, we prepared samples as fused disks. Additionally, we prepared a full oxide analysis of relevant elements detected for each cement, normal-izing the full composition by an external loss-on-ignition (LOI) experi-ment.

ERDC TR-14-10 25
4.3.1.3 X-ray diffraction
X-ray diffraction (XRD) determined the measurements of the mineralogy of the cement fraction extracted from the Utility Fill and Rapid Set materi-als. Using a Panalytical X’Pert Pro materials research diffractometer equipped with a Co-Kα X-ray source operated at 45 kV and 40 mA, the team obtained diffraction patterns to be used for quantitative phase identi-fication. Random powder-pack samples were prepared from the cement that had already passed a #325 sieve. Diffraction patterns were obtained over a period of 2 hr from 2° to 70° 2θ with a step size of 0.02° 2θ. MDI Jade 2010 software with access to the powder diffraction file database per-formed the phase identification.
4.3.1.4 Blaine fineness/reactive surface area
Using the Blaine fineness technique according to C204-11, “Standard Test Methods for Fineness of Hydraulic Cement by Air-Permeability Appa-ratus” (ASTM International 2011) we determined the measurements of the reactive surface area (i.e., the surface area available for hydraulic reactions to initiate) of the cement fraction extracted from the Utility Fill and Rapid Set materials.
4.3.2 Chemical interactions
The predominant chemical functional groups present in the two cement mixtures were obtained using FTIR spectroscopy. The chemical composi-tion and mineralogical information was also obtained using XRF and XRD as described above.
Samples of the concrete were ground to a fine powder before analyses. We used a JASCO instruments (JASCO Analytical Instruments, Easton, MD) model FT/IR-4100 Spectrometer to obtain the spectra within the range of 500–4000 cm-1 with a resolution of 4 cm-1, and we obtained spectra of concrete mixtures before and after hydration for comparison and to isolate chemical changes after hydration.

ERDC TR-14-10 26
4.3.3 Thermal properties
4.3.3.1 Isothermal calorimetry
Using isothermal calorimetry, we investigated measurements of the early-age heat flow associated with hydraulic reactions. The samples measured included Utility Fill with water, Rapid Set with water, Rapid Set with a 15% calcium chloride solution, and Rapid Set with a 10% aluminum sulfate hy-drate solution. We took all measurements with a TA Instrument TAM Air isothermal calorimeter operated at 23°C. To capture the initial wetting of the cement and early-age reactions, an in situ mixing ampoule was used rather than mixing externally to the calorimeter and inserting which would not capture any early-age phenomena. We prepared the appropriate mass-es of solution and cement and inserted them into the in situ mixing am-poule, which was then inserted into the calorimeter. Following ampoule insertion, we allowed the system to stabilize for at least 1 hr. Once stabi-lized, we inserted the solution into the ampoule and mixed it with the ce-ment. Samples were prepared with a w/c of 0.6 to ensure full wetting of the cement. All tests were carried out to an age of 6 hr. We collected early-age heat flow curves and calculated integrated heats of hydration.
4.3.3.2 Thermogravimetry analysis
We used a Shimadzu Model TGA 50 (Shimadzu Corporation, Kyoto, Ja-pan) to obtain thermograms of Rapid Set and Utility Fill samples (hydrat-ed and non-hydrated). Weight loss profiles were taken from room temper-ature to 1000°C in a nitrogen atmosphere with a heating rate of 10°C/min and with a resolution of 0.001 mg. These thermograms could provide a thermal fingerprint of the materials. Based on the weight loss during a specific temperature range, one can identify the amount of hydration and other chemical changes. Samples with admixtures were not tested during the preliminary study.
4.4 Results and discussion
4.4.1 Morphology, chemistry, and mineralogy
4.4.1.1 Gross morphology and microstructural characterization
CERL collected at their facilities the gross morphology of samples of Utili-ty Fill and Rapid Set (Figures 5 and 6). They crushed samples into gran-

ERDC TR-14-10 27
ules both before and after hydration, and the granules then were gold sputtered. The scanning electron micrographs were obtained using a Scanning Electron Microscope model JSM-6390 from JEOL USA, Inc. (Peabody, MA). GSL provided SEMs showing more detailed microstruc-tures of the samples (Figures 9–12).
(a) 5K× magnification
(b) 9K× magnification
Figure 5. SEMs of Utility Fill before hydration.
(a) 5K× magnification
(b) 10K× magnification
Figure 6. SEMs of Rapid Set Concrete Mix before hydration.
SEM imaging of the fracture surfaces investigated the microstructure of samples prepared by reacting the cementitious material from Rapid Set and Utility Fill materials with various solutions. Figure 7 shows the typical microstructure observed in the Rapid Set material when reacted with wa-ter. The microstructure is dominated by acicular ettringite (a calcium aluminosulfate hydrate) and some large calcium sulfate (CaSO4) precipi-

ERDC TR-14-10 28
tates and is consistent with the microstructure typically observed at early ages with CSA cements.
(a) 5K× SEM micrograph
(b) 20K× SEM micrograph
Figure 7. Low and high magnification images of the microstructure present in Rapid Set with water.
Figure 8 shows the microstructure present when Rapid Set material was reacted with water including an aluminum sulfate accelerating admixture. Acicular ettringite needles, similar to when water was used alone, were present along with gel-like material that bound the ettringite needles to-gether. Overall, the microstructure was more dense and likely stronger and less permeable than when aluminum sulfate was not present.
(a) 5K× SEM micrograph
(b) 20K× SEM micrograph
Figure 8. Low and high magnification images of the microstructure present in Rapid Set with aluminum sulfate.

ERDC TR-14-10 29
When calcium chloride was used as the accelerating admixture along with Rapid Set material, we observed a significant change in the microstructure (Figure 9). Ettringite needles, which are typically present in the micro-structure of CSA-based cementitious composites, were not present. Ra-ther, short, weakly bonded crystals that were likely a mixture of Friedel’s salt (a calcium aluminum chlorohydrate) and calcium sulfate phases were present. The presence of these phases is evidence of reduced early-age strength and set times.
(a) 5K× SEM micrograph
(b) 20K× SEM micrograph
Figure 9. Low and high magnification images of the microstructure present in Rapid Set with calcium chloride.
Figure 10 provides images of the typical microstructure observed in hy-drated Utility Fill samples. Ettringite needles completely dominated the microstructure, which is consistent with a material that is largely com-posed of CSA cement, and corroborates the reduced calcium oxide (CaO) and silicon dioxide (SiO2) content measured in the Utility Fill cementitious fraction by XRF.

ERDC TR-14-10 30
(a) 5K× SEM micrograph
(b) 20K× SEM micrograph
Figure 10. Low and high magnification images of the microstructure present in Utility Fill with water.
4.4.1.2 Mineralogy and chemical analysis
Table 8 provides the results from XRF chemical analyses of the cement fraction of Rapid Set and Utility Fill materials. The high sulfur trioxide (SO3) and aluminum oxide (Al2O3) compositions present in both materials along with the relatively low calcium oxide content (typically about 60% in Portland cements) are indicative of an alternative cement chemistry likely associated with a CSA cement. As a result, traditional Bogue equations for calculating the proportion of phases in a traditional Portland cement (C3S, C2S, C3A, and C4AF*) are not applicable; and quantitative XRD should be used. The high LOI values measured (ASTM C150 limits LOI to 3.0% [ASTM International 2012]) are likely associated with organic impurities present in the aggregates of the Rapid Set and Utility Fill materials that passed through the #325 sieve and were additive with the LOI of the cementitious phase itself.
Figures 11 and 12 provide results from XRD analyses, including qualitative phase identification and quantitative analysis results obtained from whole pattern fitting, for the cementing phase of Utility Fill and Rapid Set ce-ments, respectively. In both cases, phases observed in only CSA cements
* Cement chemist notation for tricalcium silicate, dicalcium silicate, tricalcium aluminate, and
tetracalcium alumino ferrite.

ERDC TR-14-10 31
were present, including Yeelimite, Belite, Bassanite, and Anhydrite. Only trace amounts of quartz were observed, confirming the effectiveness of the sieving procedure in removing the siliceous aggregates and in isolating the cementitious fraction of each material. Trace peaks for various hydration products, including ettringite and portlandite, were observed in the Utility Fill material, indicating minor hydration likely associated with exposure to ambient relative humidity. In the Rapid Set material, an increased amount of Larnite (C2S) was observed, which corroborates the increased calcium oxide and silicon dioxide contents measured by XRF.
Table 8. XRF oxide analysis results for the cement fraction of Utility Fill and Rapid Set.
Sample ID Utility Fill (cement fraction)
Wt. % Rapid Set (cement fraction)
Wt. % SiO2 13.13 14.45 Al2O3 19.87 15.34 Fe2O3 2.16 1.03 CaO 38.46 47.63 MgO 0.81 1.39 SO3 17.50 14.61 K2O 0.50 0.62 Na2O 0.17 0.26 P2O5 0.11 0.08 TiO2 0.86 0.64 Mn2O3 0.05 0.02 SrO 0.08 0.16 ZnO 0.004 0.018 LOI 6.30 3.76 Total 100.00 100.00
Results of chemical and mineralogical analyses confirmed the present of CSA cement in both Rapid Set and Utility Fill materials. The presence of CSA is an important consideration when selecting accelerating admixtures for cold weather applications as many accelerators typically used for Port-land cements (e.g., Type, I, I/II, and III) will not have the same effect when CSA cementing chemistries are present.

ERDC TR-14-10 32
Figure 11. XRD pattern and quantitative analysis results of the cement fraction from Utility Fill.

ERDC TR-14-10 33
Figure 12. XRD pattern and quantitative analysis results of the cement fraction from Rapid Set.
4.4.1.3 Reactive surface area
We made measurements of Blaine fineness to estimate the reactive surface area available in the cementitious fraction of Utility Fill and Rapid Set ma-terials. Blaine fineness values of 582 m2/kg and 448 m2/kg were measured for Utility Fill and Rapid Set materials, respectively. These fineness values are similar to what are typically obtained for Type III Portland cements;

ERDC TR-14-10 34
and as a result, one can assume the ground cement particles are of a simi-lar size of 1 to about 15 µm.
4.4.2 Chemical interactions
The XRF and XRD analyses of the cement mixtures show the various min-eralogical components and chemical compositions present. IR spectrosco-py can aid in further studying specific compounds and their chemical changes during hydration. A focused examination as a function of hydra-tion rates and time and in the presence of admixtures would help to draw conclusions and to design an ideal concrete mixture. This report discusses only a preliminary IR observation of the Rapid Set and Utility Fill to iden-tify the differences in the two cement mixes. As stated in the above section, based on XRF, the Rapid Set has higher calcium oxide and silicon dioxide while the Utility Fill has slightly higher amounts of aluminum oxide, iron oxide (Fe2O3), and sulfur trioxide. It is difficult to conclude that these min-eral component differences are major contributing factors for the im-proved early high unconfined compressive strength development in Rapid Set. Rapid Set with aluminum sulfate helped with early strength develop-ment. It would be interesting to study chemical changes that take place in these concrete mixtures.
We examined the infrared (IR) spectra, in particular the hydroxyl, silicate and aluminates, and metal oxide compounds. The hydroxyl radicals ob-served using IR can be from the water molecules that are just surface ad-sorbed, structurally bound as OH (hydroxide), or from crystal hydrates. However, these can be isolated based on the frequencies they impart to the spectrum. The peaks in the spectra can be from the molecular stretching, vibration, and bending. These peaks of the same chemical moiety can help with confirmation. Similarly the metal hydroxides, sulfates or sulfites, phosphates, carbonates, and chlorates can also be observed. For example, in clays, OH stretching modes can occur in the region of 3400–3750 cm−1; metal-OH bending can occur in the range of 650–950 cm−1. Si–O and Al–O stretching can be in the range 700–1200 cm−1 while bending of these can be in the low frequency range of 150–600 cm−1 (Schroder 2002). Of-ten, the overlap of these absorption or transmission frequencies can be re-solved by analyzing the stretching, vibration, and bending frequencies. Figure 13 shows the IR spectra of initial materials (before hydration) of Rapid Set (“RS-0”) and Utility Fill (“UF-0”).

ERDC TR-14-10 35
Figure 13. FTIR spectra comparison of Rapid Set Concrete Mix (“RS-0”) and Utility Fill
concrete mix (“UF-0”) before hydration.
These mixes are chemically similar, but certain functional groups at 1133, 1000, 883, and 685 cm−1 give distinct variation in properties. The stretch-ing hydroxyl (OH) groups in the range of 3500–4000 cm−1 are typically associated with silicon (Si) and aluminum (Al). The peaks at 3608 and 3633 can be assigned to Bassanite hydroxyls. The specific peak present in Rapid Set, for example at 1000 cm−1, can be attributed to calcium sulfate. The peak at 1133 can be due to sulfate (Ylmen et al. 2009). Observation of changes in these peaks with hydration and as a function of setting time and strength would help improve formulations and cementing process.
Figure 14 shows the FTIR spectra of the Rapid Set material before and af-ter hydration. The specific peaks at wave numbers 1100 and 783 cm−1 dis-appear after hydration. Also, no major increase in OH peaks at about 3600 cm−1 shows that no free moisture is available, perhaps indicating that all the water added is bound. Peaks at 1500 and 2140 either disappear or ap-

ERDC TR-14-10 36
pear at reduced intensity after hydration. Several other peaks show the chemical functional groups that exist in the matrix. Disappearance of peak at 883 cm−1 indicates carbonate reactions and the involvement of carbon dioxide.
Figure 14. FTIR spectra of Rapid Set Concrete Mix before (“RS-0”) and after hydration (“RS-1”
and “RS-2”).
Figure 15 shows the FTIR spectra of the Utility Fill material before and af-ter hydration. The specific peaks at wave numbers approximately 1100 and 879 cm−1 appear before hydration. However, the after-hydration disap-pearance is inconsistent in sample RS-1 and RS-2. These peaks need fur-ther investigation to identify variations in the hydration process. In both the hydrated samples, there is an increase in hydroxyl groups at about 3450–3500 cm−1. This hydroxyl stretching in association with the peaks in the range of 1100 to 1250 cm−1 indicate levels of water saturation and polymerization of silicate compounds in Rapid Fill. The peaks at about 2300–2370 cm−1 indicate the formation of sodium aluminosilicate com-pounds (Efimov and Pogareva 2000).

ERDC TR-14-10 37
Figure 15. FTIR spectra of Utility Fill Concrete Mix before (“UF-0”) and after hydration (“UF-1”
and “UF-2”).
Figure 16 shows IR spectra of Rapid Set (“RS-0”), Aluminum Sulfate, and Rapid Set after hydration along including aluminum sulfate (“CTS-RS-aluminum sulfate”). The significant observation is the presence of sulfate ions in the frequency range of 1100–1150 cm−1, which is expected. It can also be noted that the presence of a hydroxyl peak at 3459 cm−1 indicates that with the addition of the aluminum sulfate admixture, there are more free hydroxyls (or water molecules).
A detailed IR study with the presence of admixtures is desirable and would help identify the effects of adding a specific admixture.

ERDC TR-14-10 38
Figure 16. FTIR spectra of Rapid Set Concrete Mix (“RS-0”), aluminum sulfate and RS-0, and
aluminum sulfate mixture.
4.4.3 Thermal properties
4.4.3.1 Isothermal calorimetry—early-age hydration reactions
Isothermal calorimetry was used to monitor early-age hydration reactions in the cementitious material extracted from Rapid Set and Utility Fill ma-terials. Figure 17 shows normalized heat flow curves, obtained using iso-thermal calorimetry, for Rapid Set and Utility Fill materials with water and calcium chloride and aluminum sulfate accelerating admixtures. The kinetics of early-age reactions varied significantly depending on the mate-rials and solution used. In the case of the Rapid Cement when mixed with water, we observed two peaks. The initial peak was associated with the wetting of the cement, and initial dissolution followed by a secondary hy-dration peak likely associated with the formation of ettringite. When we used aluminum sulfate, hydration reactions accelerated significantly, fol-lowed by continued hydration at rates similar to those when only water was present. When we used calcium chloride, initial wetting heats were

ERDC TR-14-10 39
similar to water alone. By early-age, hydration was inhibited significantly when compared with water alone, followed by an increase in heat flow as-sociated with continued hydration beyond 1 hr. The behavior of the Utility Fill material was significantly different with a reduced heat associated with the wetting and hydration peak. We observed a third hydration peak in Utility Fill, at an approximate duration of 5 hr, that is likely associated with hydration of C3S observed by XRD to be present in the Utility Fill ma-terial. Total normalized heats generated over the 6 hr test duration of each material were calculated by integrating the area under each calorimetry curve and are provided in Table 9.
These results confirm that the total heat generated by each cement and ac-celerating admixture combination is similar. However, changes in chemis-try between the Utility Fill and Rapid Set materials and the various accel-erating admixtures investigated in combination with the Rapid Set material did have a significant impact on reaction kinetics measured by isothermal calorimetry.
Figure 17. Normalized heat flow curves obtained using isothermal calorimetry at 23°C.
0
0.01
0.02
0.03
0.04
0.05
0.06
0.07
0.08
0.09
0 1 2 3 4 5 6
Hea
t Flo
w (W
/g)
Time (hr)
RS with H2O
RS with Al2(SO4)3
RS with CaCl2
UF with H2O

ERDC TR-14-10 40
Table 9. Normalized heat generated over 6 hr test duration.
Material Integrated Heat Over 6 hr (J/g) RS with H2O 214.2 UF with H2O 225.1 RS with CaCl2 248.6 RS with Al2(SO4)3 198.8
4.4.3.2 Thermogravimetric analysis
Results of thermogravimetric analysis (TGA) are presented in Figures 18 through 21. The data provide a fingerprint of the materials before and after the hydration reactions of the two cements. The data show the weight loss as a function of temperature. Additional thermograms of the samples with admixtures would help comment on how the admixtures affect the chemi-cal bonding and the mechanical properties. The weight loss over the entire temperature range for Rapid Set is about 13% (14.8%–1.8%) while it is about 9.6 % (17.4–7.8%) for Utility Fill. The heating rate is about 10°C/min in a nitrogen atmosphere at a flow rate of 100 mL/min.
The thermogram in Figure 18 shows minor loss of physically adsorbed moisture in the Rapid Set material prior to hydration. Figure 19 presents the thermogram obtained following hydration of the Rapid Set material with water. A clear mass loss associated with a loss of free moisture and dehydration of ettringite phases present in the hydrated material occurs in the range of 100°C to 120°C. Following this mass loss, we observed a grad-ual reduction in mass that is likely associated with more tightly bound moisture. Perhaps samples with admixtures will be different and will pro-vide further information on how they interact with the cement matrix.
Figures 20 and 21 present thermograms of the Utility Fill materials before and after hydration, respectively. Similar to the Rapid Set material, we ob-served in the Utility Fill material prior to hydration a minor mass loss as-sociated with loss of free moisture. Following hydration, mass loss of ap-proximately 5 %, which is associated with loss of free moisture and dehydration of ettringite and other hydrates present in the hydrated mi-crostructure, was observed in the temperature range of 100°C to 120°C.

ERDC TR-14-10 41
Figure 18. Thermogram of Rapid Set cement mixture before hydration.
Figure 19. Thermogram of Rapid Set cement mixture after hydration.

ERDC TR-14-10 42
Figure 20. Thermogram of Utility Fill cement mixture before hydration.
Figure 21. Thermogram of Utility Fill cement mixture after hydration.
4.5 Conclusions from the materials analyses
We can make many conclusions based on the analyses of the Rapid Set and Utility Fill materials and of various admixture. The key findings were as follows:

ERDC TR-14-10 43
• XRD and XRF analysis confirmed that the both Rapid Set and Utility Fill materials are composed largely of CSA cements. This finding was also confirmed by SEM imaging of the hydrated microstructure, which were dominated by ettringite and calcium sulfate phases typically asso-ciated with the hydration of CSA cements. These results have implica-tions in that many admixtures typically used for Portland cement-based concretes may not be applicable with CSA cements.
• SEM imaging of the composite obtained when Rapid Set and Utility Fill materials were hydrated with water alone and with calcium chloride and aluminum sulfate admixtures showed large changes in microstruc-ture. When water alone was used, both Rapid Set and Utility Fill mi-crostructures looked typical of CSA cements with a dominance of ettringite along with other calcium sulfate phases. When aluminum sulfate was used, the microstructure appeared to become more dense with additional gel-like binding phases between individual ettringite needles. When calcium chloride was used, the microstructure was less dense and less interlocked as the aspect ratio of phases was decreased.
• Isothermal calorimetry confirmed the effectiveness of aluminum sul-fate and the poor performance of calcium chloride. When aluminum sulfate was present, the hydration peak was accelerated into the range of wetting of the cement, resulting in an almost instantaneous activa-tion of the hydration process. When calcium chloride was present, the hydration peak was suppressed; and most early-age heat generation was associated with the wetting peak followed by slow hydration.
• FTIR spectroscopy showed changes in the chemical interactions pre-sent before and after hydration. However, additional work will be nec-essary to correlate these changes with admixtures used and with mac-ro-scale material performance.
• Thermogravimetric analysis showed minimal free moisture in the as-received Rapid Set and Utility Fill materials prior to hydration. Follow-ing hydration, mass losses at 100°C to 120°C were observed, which are associated with the loss of free moisture and the dehydration of ettringite phases. These results are consistent with a CSA cementitious material composition.

ERDC TR-14-10 44
5 Results and Discussion
5.1 Introduction
Appendix A (Tables A1–A7) includes all data for admixtures tested indi-vidually or in combination during each phase. Rather than discuss each table in detail, they are summarized in the tables and graphs that follow and referenced, as necessary, in the text below. The various admixtures and their combinations will be referred to in tables and in figures accord-ing to Table 10.
Table 10. Admixtures used throughout testing.
Admixture Abbreviation* Chemical Formula Aluminum Sulfate (hydrate) AS Al2S3O12.xH2O ; x = 12–14 Calcium Chloride CC CaCl2 Calcium Nitrate CN Ca(NO3)2 Calcium Sulfate (hemi-hydrate) CS CaSO4·.5H2O Cane Sugar (granulated) Sug C12H22O11 Glenium 7500 water-reducer Gle unknown (COTS† product) Pozzutec 20+ accelerator (aluminum sulfate)
Poz unknown (COTS product)
Sodium Nitrate SN NaNO2 Sodium Sulfate SS Na2SO4 * These abbreviations are used in the tables in this section and in Appendix A †Commercial off-the-shelf
5.2 Aluminum sulfate Rapid Set test phase
Previously, limited GSL research demonstrated that aluminum sulfate strongly accelerated the hydration process for the type III cement in the Rapid Set, though exact quantities required as a function of w/c and ambi-ent, ground, and materials temperatures were unknown. The purpose of this test phase was to provide a higher degree of statistical certainty for recommended proportions of aluminum sulfate to be used given a variety of w/c and temperature factors. The secondary and broader goal was to determine one or two aluminum sulfate proportions that could span −10°C to 20°C ambient, ground, and materials’ temperatures and still meet the set times and 2 hr UCS goals. Table 11 summarizes these recommended

ERDC TR-14-10 45
proportions. These recommendations are based directly on data in Appen-dix A or inferred from it (e.g., if aluminum sulfate 500 g failed to set at −10 °C, we inferred that aluminum sulfate 500 g fails to set at −15°C). Figure 22 shows the detailed performance of aluminum sulfate in terms of set time and 2 hr UCS, filtered by test temperature and aluminum sulfate pro-portion.
Table 11. Performance summary of aluminum sulfate admixture in Rapid Set Concrete Mix.
Aluminum Sulfate Amount Used Temperatures Successful? Y/N/close/Unk (unknown)*,†,‡
g aluminum sulfate per 60 lb dry Rapid Set
% aluminum sulfate by dry weight Rapid
Set −15°C −10°C −5°C 0°C 5°C 10°C 15°C 20°C 0 0.0% N N N N N N Y Y 100 0.4% N N N N close close Y Y 200 0.7% N N N Y Y Y Unk Unk 300 1.1% N close Y Y Y Y N N 400 1.5% N N N close N N N N 500 1.8% N N N N N N N N 600 2.2% N N N N N N N N 700 2.6% N N N N N N N N * Success is defined as set time ≥ 15 min, 45 min, and 2hr UCS ≥ 2500 psi ; set is defined as ≥ 500 psi penetration resistance. † Dry materials and ambient average temperatures at specified levels in chart; mixing water about 10°C; target slump = 4–6 in.; water
quantities 7.5–9.0 lb per 60 lb dry Rapid Set (more water necessary as aluminum sulfate is added) ‡ Aluminum sulfate dissolved in mixing water and immediately mixed into Rapid Set mix
Not explicitly shown in Table 11 nor Figure 22 are the results variability as a function of w/c. While the results of set times and 2 hr UCS vary with w/c, the results shown are based on an average slump of 4–6 in., corre-sponding to a workability estimate of 4–6 (1 = unworkable, 10 = liquid pour). Because aluminum sulfate is hygroscopic, we added slightly higher amounts of water to each batch, with a rough trend of 0.25–5 lb additional water needed per 60 lb Rapid Set batch with each addition of 100 g of aluminum sulfate. Adding this additional water was necessary to maintain an average slump of 4–6 in. We should note that, at the extremes of suc-cessful performance for each row in Table 11 (for example: −10°C and +10°C for 300 g aluminum sulfate), w/c ratios that deviate from 4−6 in. slumps are likely to fail the set time and 2 hr UCS goals.

ERDC TR-14-10 46
Figure 22. 2 hr UCS (psi) vs. SetTime (min) by Nom_Temp_C, filtered by different amounts of
aluminum sulfate (g) used in Rapid Set Concrete Mix.
Table 11 demonstrates that using aluminum sulfate at higher dosage rates (>1.1% by weight of dry Rapid Set) tends to cause a “false set” due to two primary factors. First, the cement rapidly stiffens as the aluminum sulfate stores most of the available water. Then, the mixture hardens as high heat is generated during both the heat of dissolution into the mixing water and in the initial cement hydration process (of the remaining available water). These effects in turn result in an incomplete hydration process with com-pressive strengths much lower than the 2500 psi 2 hr UCS goal. Figure 23

ERDC TR-14-10 47
demonstrates the negative correlation between the amount of aluminum sulfate used and 2 hr UCS and shows testing at all temperatures and w/c.
Figure 23. Determining the correlation between 2 hr UCS and the amount of aluminum sulfate used (g) in Rapid Set Concrete Mix.
Results in this phase of testing demonstrate that aluminum sulfate, used in the right proportions within the right ambient, ground, and materials temperature ranges, is a suitable admixture for accelerating the hydration process of Rapid Set concrete at low temperatures. One should take care to avoid using too high proportions of aluminum sulfate as this has a nega-tive effect on early (and assumed, though not demonstrated, ultimate) strength gain, lowers workability, and can cause either “false” or “flash sets” to occur.

ERDC TR-14-10 48
5.3 Utility Fill and Rapid Set hot water test phase
The objective of the second task was to determine whether a suitable ad-mixture could chemically heat (via exothermic reaction) the mixing water for use in both the Utility Fill and the hard cap to meet the time of set and 2 hr UCS goals (Rapid Set only). Any admixture added must provide this reaction initiation improvement without degrading the performance of ei-ther mixtures (set or UCS values, estimates for short-term durability, or other). The project manager and the sponsor (AFCEC) have deemed their approach to solving the performance issues at low temperatures lowest risk given tactical and practical short-term constraints with introducing any changes to the mixtures already procured and in use. In addition, the PM and sponsor have deemed the mechanical heating of the mixing water stored in the concrete equipment higher risk due to potentially permanent, invasive vehicle alteration issues, cost, and other potential issues. Solu-tions involving mechanical heating and additions to the dry materials were not explored in depth for these reasons.
To meet the objective of the second task, we conducted testing in two phases. First, we conducted a series of hot water tests for both the Utility Fill and the Rapid Set to identify the temperature ranges where hot water (whether mechanically or chemically heated) enabled successful times of set and strength gains. Tables 12 and 13 summarize results and recom-mendations for hot water usage for Utility Fill and Rapid Set, respectively. These recommendations are based directly on data in Appendix A (table A6) or inferred from it (e.g., because the Utility Fill failed to set with hot water at 40°C and an ambient materials temperature of −5°C, we inferred that the Utility Fill fails to set using <40°C water at a ≤−5°C ambient, ma-terials temperatures).

ERDC TR-14-10 49
Table 12. Utility Fill hot water test: performance summary of Utility Fill at specified ambient and dry materials temperatures using mixing water at specified temperatures. No admixtures added.
Ambient, Dry Materials Temp °C
Average Time of Set (min to reach 250 psi penetration resistance) per Water Temp (°C) in Below Row
100 90 80 70 60 50 40 30 20 10 5
20
6
9
14
10
8
23
28
5 0
10
no set -5
15
frozen
-10 -15
frozen
frozen
Meets time of set (15–30 min to reach 250 psi penetration resistance) requirement
Borderline meeting time of set requirement
Fails to meet time of set UCS requirement
Table 13. Rapid Set hot water test: performance summary of Rapid Set Concrete Mix at specified ambient and
dry materials temperatures using mixing water at specified temperatures. No admixtures added.
Ambient, Dry Materials Temp
°C
Average Time of Set (min to reach 500 psi penetration resistance); Average 2 hr UCS per Water Temp (°C) in Below Row:
100 90 80 70 60 50 40 30 20 10 5
20
35 ; 4840 10
30 ; 4617
70 ; 3866
5 0
43 ; 4423
80 ; 3769 -5
39 ; >3500
-10 -15
meets time of set (15-45 min to reach 500 psi penetration resistance)and 2 hr UCS (>2500 psi) requirements
borderline meeting time of set and 2 hr UCS requirements
fails to meet time of set and 2 hr UCS requirements
The results in Tables 12 and 13 demonstrate the feasibility of using heated mixing water within certain temperature ranges for successful Utility Fill and Rapid Set performance. We used the following heuristic throughout the testing to estimate the minimum mixing water temperature required depending on the ambient or dry materials temperature:

ERDC TR-14-10 50
𝑇𝑤𝑎𝑡𝑒𝑟𝑚𝑖𝑛 =𝑊𝑤𝑎𝑡𝑒𝑟 + 𝑊𝑑𝑟𝑦 𝑚𝑖𝑥
𝑊𝑤𝑎𝑡𝑒𝑟𝑥 min{0 − 𝑇𝑎𝑚𝑏&𝑚𝑎𝑡, 0} + 1
where
𝑇𝑤𝑎𝑡𝑒𝑟𝑚𝑖𝑛 = the minimum temperature of the mixing water required for successful Utility Fill or Rapid Set performance, in °C,
𝑊𝑤𝑎𝑡𝑒𝑟 = the weight of the water required in the mix to achieve the desired slump,
𝑊𝑑𝑟𝑦 𝑚𝑖𝑥 = the weight of the dry mix (Utility Fill or Rapid Set), 𝑇𝑎𝑚𝑏&𝑚𝑎𝑡= the ambient and materials temperature.
The heuristic provided the test team with a lower bound for the water temperature by incorporating a rough estimate for the composite mixture temperature (once water was added) and the minimum temperature to raise the composite mixture to enable the hydration process. Because the ratio of the total weight to water weight in both mixtures was approxi-mately 9 to 12:1, each degree difference between the mixture goal tempera-ture and the ambient temperature required a minimum of 10°C higher wa-ter temperature.
Further research should be conducted to determine in more detail the op-timal wet mixture composite temperature ranges suitable to meet the time of set and 2 hr UCS goals. This would then enable construction of a more thorough and reliable hot water model and would aid in planning future Utility Fill and Rapid Set low-temperature activities.
The high temperatures required for the large volumes of mixing water highlight the difficulty of chemically heating the water with known admix-tures (using heat of dissolution; oxidation-reduction reactions, such as used in flameless water heaters in military rations heaters;* or other tech-niques) to achieve the ambient temperature ranges shown in Tables 12 and 13. In addition, the large volume of admixtures required to chemically heat the water would have to not interfere with the cement hydration process
* An example oxidation-reduction reaction that is used to reliably heat military rations (“Meal, Ready-to-
Eat,” or MREs) involves the generation of heat in an electron-transfer process called an oxidation-reduction reaction, where water oxidizes magnesium metal. For more information on this example re-action method, see HowStuffWorks (2013).

ERDC TR-14-10 51
(by either storing most of the available water or acting as an retarding agent or inhibitor) nor cause short- or medium-term negative effects, such as increased concrete temperature expansion or other durability concerns, and would pose no significant safety hazards in use or in storage. For these reasons, we determined that mechanical heating is a more feasible method than admixtures to heat the mixing water to the temperature ranges speci-fied in Tables 12 and 13. The admixture investigations section demon-strates this infeasibility by testing a variety of salts. See the recommenda-tions section for a candidate method of employing the Utility Fill at low ambient and dry materials temperatures by using a mechanical heating solution.
5.4 Admixture investigations, Rapid Set
The purpose of the rapid set admixture investigations task was to improve the performance of the Rapid Set with the following constraints:
1. Hard cap time of set (time to reach 500 psi penetration resistance) min/max: [15 min, 45 min].
2. Temperature ranges suitability goal for new admixture: [−15°C, 10°C]. 3. 2 hr UCS: ≥ 2500 psi. 4. Admixtures must be added to the water with no alterations to the Rapid
Set dry mix. 5. Mixing water temperature: −5°C to 0°C for an extended period of time
prior to start of mission. (Optional additional constraint to improve length of time water can sit in the mixing vehicle prior to conducting rapid run-way repair mission.)
Note that solutions satisfying the fifth constraint would provide an im-provement to the performance of the hard cap at cold temperatures using only an aluminum sulfate admixture because aluminum sulfate acts pri-marily as an accelerant to the hydration process and is a poor freezing point depressant. An aluminum sulfate and water solution close to 0°C for an extended period of time would exhibit significant icing and does not have a strong hydration accelerant effect when introduced to the Rapid Set dry mix.
Table 14 summarizes the performance of all admixtures used (alone or in combination) at a variety of ambient and mixing water temperatures. Ad-

ERDC TR-14-10 52
mixtures used throughout this phase of investigations were determined as the most promising candidates for depressing the freezing point of the mix-ing water, accelerating the hydration process, and improving the w/c or overall cementitious content in the mix. See Section 3 for more information on each admixture and its corresponding properties.
Table 14. Admixture investigations summary, Rapid Set: performance summary of Rapid Set at specified ambient, dry materials temperatures when using mixing water solutions at specified temperatures and a
variety of admixtures (alone and in combination).
Admixture
Ambient Temp (°C)
Solution Temp
(°C) (just prior to mix UF)
Max 20 min Penetration Resistance
(psi)
Max 45 min Penetration Resistance
(psi)
2 hr UCS (psi)
Slump (in.)
Freezing Concerns?
(Y/N/some) Promising?
(Y/N)
AS −5 5–10 20 >800 3100 4 N Y*
−5 0 0 0 0 0 Y N
CC −5 0 0 0
6–7 N N
CS −5 0 16 32
6–7 Y N
CC-AS −5 0 40 40
5–6 Y N
CC-CN −5 -5 16 40
5–6 N N
−5 0 8 56
5–6 N N
CC-Sug −5 0 0 32
6–7 N N
CC-Poz −5 0 0 16
5–6 N N
CN-Poz −5 0 0 15
5–6 N N * Best performance shown in table for the range of admixture proportions investigated. For specific admixture proportions investigated
and all related data, see Appendix A.
While some of the admixture combinations allowed the Rapid Set to set and to reach 2500 psi unconfined strength, none of the admixture combi-nations were able to meet the required timeframes for set and strength gain when the water solution was cooled between −5°C and 0°C prior to mixing with the Rapid Set. Consequently, aluminum sulfate at a variety of cold ambient and dry materials temperatures with a minimum mixing so-lution temperature of 5°C provided the only suitable performance for the Rapid Set. Refer to Table 11 for the recommended aluminum sulfate pro-portions as a function of ambient and dry mix temperatures.
5.5 Admixture investigations, Utility Fill
The purpose of the Utility Fill admixture investigations task was to improve the performance of the Utility Fill with the following constraints:

ERDC TR-14-10 53
1. Utility Fill time of set (time to reach ≥250 psi penetration resistance) min/max: [15 min, 30 min].
2. Temperature ranges suitability goal for new admixture: [-15°C, 10°C]; 3. Admixtures must be added to the water with no alterations to the Utility
Fill dry mix.
Penetration resistance increased for all samples when the available water froze (excluding samples that successfully depressed the water freezing point), which could easily be mischaracterized as an initial set. All promis-ing admixture samples were therefore screened with a 2 hr UCS test to en-sure a minimal amount of compressive strength gain (about 100 psi). We deemed predominantly or completely frozen any samples with less than 100 psi UCS results and discarded them. The primary concern with freez-ing of the Utility Fill layer is that the Utility Fill will not have a minimum bearing pressure even when confined in a small hole (approximately 8 × 8 × 3 ft depth), causing the hard cap layer to fail under the large (5000 psi) anticipated vehicle loadings. In addition, substantial freezing and thawing of the Utility Fill layer poses a large risk for heaving with a low number of freeze–thaw cycles. While the Utility Fill may spread the high vehicle load-ings sufficiently when partially frozen because of confinement in a rela-tively small area, performance may suffer when the ground thaws or after several freeze–thaw cycles. See the recommendations section for addition-al constraints to be explored to mitigate durability concerns of the Utility Fill while not imposing an excessive requirement for unconfined strength.
Table 15 summarizes the performance of all admixtures used (alone or in combination) at a variety of ambient and mixing water temperatures. Ad-mixtures used throughout this phase of investigations were determined as the most promising candidates for depressing the freezing point of the mixing water, accelerating the hydration process, and improving the w/c or overall cementitious content in the mix. See Section 3 for more infor-mation on each admixture and its corresponding properties.
We did not discover any admixtures that could produce results similar to the control at 20°C ambient temperature and 5°C–10°C mixing water temperature. However, one admixture type (single or combination) that performed slightly better than the control tests at −5°C ambient and dry materials temperature and 60°C–80°C mixing water temperature was aluminum sulfate, with the best performance using aluminum sulfate 8%

ERDC TR-14-10 54
by weight in water solution (results for aluminum sulfate 8% shown in ta-ble 15. The aluminum sulfate admixture exhibited the same 30 and 60 min penetration resistance values as the control, with a slightly higher 2 hr UCS reading. Additional testing should be conducted to determine wheth-er this improvement is statistically significant and whether the 2 hr UCS for both the control and the aluminum sulfate admixture at solution tem-perature 80°C is sufficiently durable.
Table 15. Admixture Investigations Summary, Utility Fill: performance summary of Utility Fill at specified ambient, dry materials temperatures when using mixing water solutions at specified temperatures and a
variety of admixtures (alone and in combination).
Admixture
Ambient/Dry
Materials Temp (°C)
Solution Temp
(°C) (just prior to mix UF)
Max 30 min Penetration Resistance
(psi)*
Max 60 min Penetration Resistance
(psi)*
2 hr UCS (psi)
Slump (in.)
Freezing Concerns?
(Y/N/some) Promising?
(Y/N)
AS −5 5–10 0 0 0 8 Y N −5 60 240 640 0 10 Y N −5 80 520 800 98 8 some Y*
CC −5 10 0 176 0 8 Y N −5 60 208 488 0 10 Y N −5 80 224 520 0 9 Y N
Gle −5 60 144 360 0 10 Y N −5 80 384 760 33 9 some N
SN −5 5–10 0 0 0 9 N N SS −5 5–10 0 0 0 9 N N CC-CN −5 5–10 0 0 0 9 N N CC-SS −5 5–10 0 112 0 9 N N AS-CN −5 5–10 0 40 0 8 N N AS-SS −5 5–10 0 24 0 8 N N AS-SN −5 5–10 0 32 0 8 N N
Control (no admix) −5 80 520 800 74 9 some Y
Control (no admix) 20 10 >800 >800 507 9 n/a n/a
* Best performance shown in table for the range of admixture proportions investigated. For specific admixture proportions investigated and all related data, see Appendix A.
We discovered no admixtures that could provide suitable performance when the mixing water was in the range of 0°C–10°C. Because of this, our best demonstrated performance for the Utility Fill at cold temperatures required manual heating of the mixing water (or aluminum sulfate 8%–

ERDC TR-14-10 55
water solution) to 60°C–80°C to enable the Utility Fill to set in 15–30 min without freezing. See the recommendations section for additional future testing to improve this performance and to investigate durability concerns. It also includes other recommendations to successfully heat the Utility Fill mixing water in an operational setting.
5.6 Models for prediction and results repeatability
We fit various stepwise regression models on our data in task 3 (aluminum sulfate Rapid Set testing) using standard statistical software (JMP [SAS Institute Inc. 2012]) to quantify which effects variables exert the greatest influence on our dependent variable (set time or 2 hr UCS) and to account for as much variance as possible in our overall models. Table 17 summa-rizes prediction results by using all data from task 3, and Table 16 summa-rizes prediction results by using only a portion of data from task 3 (all test-ing conducted with the first shipment of Rapid Set).
Table 16. Prediction results of select stepwise regression models for the first round of aluminum sulfate (task 3) testing (first 57 tests with the first shipment of Rapid Set product), using Aikake Information Criterion (AIC)
stopping criterion.
Model #
Predict Variable Data Used Input Factors
Train Test All Data
Factors Chosen (within
a = .01) Adj R2*
Root Mean
Squared Error
(RMSE) Adj R2 RMSE Adj R2 RMSE
1 Set time (min)
all (includes
incomplete data)
admix (quantity);
temp; water; admix × temp; admix × water; temp × water
admix; temp; water;
admix × temp
0.428 15.5 0.389 13.9 0.444 15.2
2 Set time (min)
all (excludes tests 7, 12–14, 17–22)
admix (quantity);
temp; water; admix × temp; admix × water; temp × water
admix; temp; water
0.767 7.5 0.63 10.1 0.715 8.4
* Adjusted coefficient of determination

ERDC TR-14-10 56
Table 17. Prediction results of select stepwise regression models for all aluminum sulfate (task 3) Rapid Set testing, using AIC stopping criterion.
Model #
Predict Variable Data Used Input Factors
Train Test All Data Factors Chosen
(within a=.05) Adj R2 RMSE Adj R2 RMSE Adj R2 RMSE
1 Set time (min)
task 3 (all) admix (quantity);
temp; water; admix × temp; admix × water; temp × water
admix; temp; admix × temp
0.71 8.6 0.43 11.5 0.68 9.0
2 Set time (min)
task 3 (all except tests
12–14)
admix (quantity);
temp; water; admix × temp; admix × water; temp × water
admix; temp 0.587 9.4 0.42 12 0.65 9.4
3 Set time (min)
task 3 (all except cook's
distance outliers_1)
admix (quantity);
temp; water; admix × temp; admix × water; temp × water
admix; temp; admix × temp
0.84 5.9 0.43 11.5 0.68 9.0
4 Set time (min)
task 3 (all except cook's
distance outliers_2)
admix (quantity);
temp; water; admix × temp; admix × water; temp × water
admix; temp 0.86 6.0 0.45 11.3 0.65 9.4
5 Set time (min)
task 3 (all except tests
12–14, and
17–21)
admix (quantity);
temp; water; admix × temp; admix × water; temp × water
admix; temp; water
0.767 7.6 0.48 11.0 0.66 9.3
All models in Table 17 are color coded green, yellow, or red in terms of overall efficacy in both prediction ability on a blind data subset (random split: 75% train, 25% test) as measured by the test RMSE and in its ability to account for explainable variance as described by the adjusted coefficient of determination (adj R2). We first observe that, if only modeling the first uniform batch of materials used in testing (Table 16, we can explain at most approximately 71% of the overall data variance (max adj R2 .715) or 63% of the data variance in the blind data subset. This in turn leads to a prediction ability of set time (our dependent variable) within approximate-ly 8.4 and 10.1 min for the overall and blind data (subset data only), re-

ERDC TR-14-10 57
spectively. However, if we model the entire task 3 data set (Table 17), we can explain at most approximately 65%–68% of the overall data variance (max adj R2 .65–.68), and 42%–48% of the data variance in the blind data subset. This in turn leads to a prediction ability of set time within approx-imately 9.0–9.3 min and 11–11.5 min for the overall and blind data (all da-ta), respectively. We conclude that, because we cannot control the contents of the Rapid Set from batch to batch when using less than a 2000 lb batch, our ability to model and predict results with each batch is degraded. How-ever, when we control the ratio of fines to course aggregates in each batch, we can limit this variability and still produce results that are repeatable though slightly degraded.
Next, we note the importance of removing outlier points as we compare model results in both tables. Our ability to account for the data variance dramatically improves between models 1 and 2 in Table 16, and to a lesser extent in Table 17.
Finally, we note that several models produce suitable prediction perfor-mance using similar factors. All three “best” models shared the following factors: time, admixture proportion used, nominal temperature, and water content (w/c). One of the possible two-way interaction terms was also sta-tistically relevant in some of the best models: water × temp. It is likely that this two-way interaction term and possible others would have had a larger statistical effect if all Rapid Set samples were more closely comparable. However, because the test team was unable to tightly control the ce-ment:sand:course aggregates, this variability from batch to batch masked lesser variations that may have been otherwise accounted for with two-way interaction terms.
We now compare select models’ prediction abilities graphically to identify potential problems in various models, such as non-normality in error terms, and other undesirable effects, such as the inability to predict suita-bly in certain ranges rather than overall average prediction ability. To do this, we use each model’s estimates for factors used and coefficient terms to predict penetration resistance on our withheld blind test data subset (as well as record results from the model’s training data subset). We then or-der all data by actual penetration resistance observed from lowest to high-est, as shown in Figures 24 and 25.

ERDC TR-14-10 58
Figure 24. Prediction results of select stepwise regression models for the first round of
aluminum sulfate (task 3) testing (e.g., 57 tests with first shipment of Rapid Set product), using AIC stopping criterion. Data are ordered from smallest to largest by actual set time
observed and plotted as set time versus ordered sample number (sample 1 is the fastest set time at 7 min; sample 63 is slowest at 72 min).
Figure 25. Prediction results of select stepwise regression models for all aluminum sulfate (task 3) testing, using AIC stopping criterion. Data are ordered from smallest to largest by
actual set time observed and plotted as set time versus ordered sample number (sample 1 is the fastest set time at 7 min; sample 63 is slowest at 72 min).

ERDC TR-14-10 59
The vertical distance of each predicted model value to the actual penetra-tion resistance value (blue diamonds) represents the magnitude of each error term because a prediction will lie directly on the blue diamonds if there were no error between the predicted and actual values.
We first observe that model 2 in Figure 24 (data subset task 3) has pre-dicted values more normally scattered about the actual values than the best models in Figure 25 (all data task 3); or in other words, the first mod-el exhibits fewer non-normality concerns. Both models in Figure 24 pre-dict 20–30 min lower than actual set times when set times are greater than 55 min. While this is clear evidence of a violation of our normality as-sumption when constructing regression models, the amount is low enough to be acceptable.
We also observe the importance of removing outlier points as we compare model results in both figures. While Tables 16 and 17 demonstrated the importance of removing outlier points to improve our overall model RMSE and adjusted variance, removing outliers is also important for lowering the maximum variance from predicted values. Model 1 shown in Figure 24, though it demonstrated similar RMSE and adjusted variance in Table 17 to the models 2–5 shown in Figure 25, exhibits a tendency to have large vari-ance from the actual set time as noted in sample numbers 6, 7, 12, 48, and 58.
We conclude that our best models shared the following effects variables: time, admixture (aluminum sulfate) proportion used, nominal tempera-ture, and water content (w/c ratio). In addition, if Rapid Set samples were able to be more tightly controlled in future testing, two-way interaction terms to include water × temp (and possibly others) should be considered. We have demonstrated that aluminum sulfate can be used in future testing with a significant amount of reliability around the intended set times rec-ommended in Table 11, given a fixed w/c and ambient, dry materials and water temperatures.

ERDC TR-14-10 60
6 Conclusions
ERDC tested and evaluated a variety of methods to improve the cold weather performance of a two-step solution currently in limited use for the purpose of expedient runway repair by the Air Force. The two-step solu-tion involves placing a flowable fill (Utility Fill), which quickly hardens in approximately 30 min, in the majority of the crater; the repair team then places a Rapid Set concrete as the top layer, which allows for heavy runway traffic (2500 psi) within approximately 45 additional minutes. Because both the Utility Fill and Rapid Set exhibit issues setting and reaching de-sign strengths when the temperature is below 10°C, we explored a variety of methods to improve the performance of both materials at near- and sub-freezing temperatures (ambient, ground, and materials’ tempera-tures).
The first investigation involved improving the Rapid Set performance in temperature ranges of −10°C to 10°C by using aluminum sulfate hydrate (aluminum sulfate). We demonstrated that aluminum sulfate provided suitable performance for both set times and 2 hr UCS; Table 11 details proportions for water content and aluminum sulfate by weight of dry Rap-id Set. The set times for all aluminum sulfate testing proved to be predict-able with an average error of 9 min when using the following effects varia-bles: water content, ambient temperature (when temperature of the dry materials is approximately the same as ambient temperature), quantity of aluminum sulfate used, and an optional 2-way interaction term water × temperature. This error could be improved in the future by having tighter controls on the Rapid Set proportions per batch used because the batches varied considerably due to retrieving them from a 2000 lb sack of the ce-ment, sand, and course aggregate materials.
The next investigation determined the ranges of hot water suitable for set times and strength gain requirements for the Utility Fill and Rapid Set us-ing no admixtures. Hot water was a suitable method for obtaining success-ful results for both materials, and tables 12 and 13 summarize these re-sults. This discovery allows for two options for successful emplacement of the Rapid Set materials: use of aluminum sulfate or mechanical heating of the mixing water (using no admixtures). Because the laboratory testing

ERDC TR-14-10 61
may exhibit different heat transfer properties than a realistic operational environment, the most promising temperature ranges for ambient, mate-rials, and mixing water should be tested in an operational environment using realistically-sized craters (see recommendations section).
The final investigation explored a variety of admixtures (alone and in combination) that may improve the performance of both the Utility Fill and Rapid Set materials at near- and sub-freezing temperatures. The pri-mary constraint is that any admixtures used must be soluble in the mixing water. We identified a small list of admixtures to explore from a large list of potential admixtures previously identified in historical investigations to provide one of three performance characteristics (depressing the freezing point of the mixing water, accelerating the hydration process, or lowering the w/c, thereby increasing the total cementitious content). We found no admixtures that demonstrated better performance than the aluminum sul-fate in the Rapid Set, which produced reliable results from −5°C to 10°C, meeting all objectives and constraints. We found no admixtures that demonstrated significantly better performance than hot water for the Utility Fill in temperature ranges −5°C to 10°C though early results indi-cate that a combination of hot water at 60°C–80°C and aluminum sulfate may slightly improve the early strength of the Utility Fill as compared to using only hot water in the same temperature ranges.
Because the aluminum sulfate provided suitable, reliable, and repeatable results for the Rapid Set at −5°C to 10°C ambient and dry materials tem-perature using no mechanical heating of the mixing water (which ranged from 5°C to 10°C), the Rapid Set is deemed likely to achieve desired per-formance characteristics in these ranges (e.g., low risk). The Utility Fill, however, exhibits a greater degree of risk (with results reliability and re-peatability) around the current best discovered approach: mechanical heating of the mixing water between 40°C and 80°C (depending on ambi-ent and dry materials’ temperature; see Table 11 for detailed recommenda-tions).

ERDC TR-14-10 62
7 Recommendations
The first recommendation involves the practical implementation of heat-ing and maintaining the mixing water at 40°C–80°C. Table 18 summarizes the amount of heat or energy needed to use electrical heating (“heat sheets”) to heat a single 200 gal. tank from a starting temperature of 10°C to a variety of end temperatures in certain time periods.
Table 18. Recommended heat sheet sizes for heating 200 gal. plastic water tanks in a volumetric mixer.
Water Start Temp (°C)
Water End Temp (°C)
Time Required (hr)
Energy Required (MJ)
Power Required (W/sec)
Heat Sheets Total Surface Area required (in2)
10 40 24 95 1100 880 10 40 48 95 550 440 10 60 24 158 1833 1466 10 60 48 158 916 733 10 80 24 222 2566 2053 10 80 48 222 1283 1026
The heat sheets used in all calculations in Table 18 are specifically de-signed for plastic containers as the heat sheets maintain a maximum tem-perature of 85°C. The recommendations for heat sheet total surface area assume that the outside of the tanks and heat sheets are covered in an in-sulating material, such as a spray foam with an approximate efficiency of insulation (R-value) of 7.* Metallic storage tanks that us a 2.5 W/in2 heat sheet option can reduce to 12–16 hr the time to heat the water from 10°C to 60°C–80°.†
In addition to heating the mixing-water tanks externally via heat sheets, another suitable method includes immersion heaters.‡ The limiting factor for the total time required to raise the mixing water temperature to the de-
* One type of spray foam possibly suitable for this application has an R-value of 7.0 at a 1 in. spray-foam
depth: http://www.spray-foam.com/compare.html. † See the heat sheets designed for metal surfaces at: http://www.spray-foam.com/compare.html. ‡ An example immersion heating system can be found at: http://www.mcmaster.com/#immersion-
heaters/=llda1b.

ERDC TR-14-10 63
sired 40°C–80°C range remains the maximum safe temperature allowed for the plastic water tank material to prevent permanent deformation or fire hazards. Any immersion heating solutions also assume that the out-side of the tanks and water tank cover is covered in an insulating material with an approximate R-value of 7. Again, a spray foam may possibly be suitable for this application.
A second set of investigations should be conducted to determine the min-imum confined and unconfined strength required in the variety of intend-ed applications for the Utility Fill for horizontal surface repair when being capped with asphalt or Rapid Set. The use of hot water (60°C–80°C) al-lowed for a partial hydration process in the Utility Fill, resulting in a 2 hr unconfined compressive strength of 70–100 psi at −5°C (ambient and dry materials temperature). This strength has been determined in previous testing as more than adequate for repairing large blast holes in runways because the environment (blast hole) suitably confines the materials. The dominant characteristic required of the Utility Fill in this case is penetra-tion resistance of less than 250 psi after being initially flowable when pouring the materials. The hot water testing demonstrated greater than 500 psi reliable results within 30 min of initial mixing, far exceeding this requirement. However, additional testing should be conducted to deter-mine minimum penetration resistance and unconfined (or confined) strength required in other cases where repair requires a different surface, such as asphalt, or where repair areas may be partially or entirely uncon-fined.
We expect that the Utility Fill performance would significantly improve if the dry materials temperature were even slightly warmer than ambient temperature as the required set times (15–30 min) are low enough that the average materials temperature would remain significantly higher than its surroundings long enough for the early hydration process to occur. There-fore, if possible, the Utility Fill dry materials should be stored above 10°C, which would significantly improve the 30 min UCS. Future laboratory and operational testing should be conducted to quantify the increase in UCS enabled by this increase in dry materials temperature. Other options for improving the early strength gain of the Utility Fill that could also be ex-plored involve increasing the cement content of the Utility Fill. One prom-ising method to do this without having to add cement to the mixing bins (if this is perceived as operationally infeasible) might involve adding Type III

ERDC TR-14-10 64
cement to the dry mix directly in the repair hole (in layers if experimental-ly determined necessary to maintain consistency), adding hot water direct-ly to the dry materials in the hole, and performing some mechanical mix-ing directly in the hole.
The final set of recommendations is centered on the need for operational testing of realistic size airfield repair holes (from 6 ft × 6 ft × 32 in. to large crater sizes, such as 15 ft × 15 ft × 50 in.). Operational testing is needed to validate the performance of the repair materials and repair processes in realistic environmental conditions and using actual repair equipment available to the Air Force ADR teams. One major question left unresolved is the extent of time of set and early strength gain differences for both the Utility Fill and Rapid Set materials at the same laboratory testing tempera-tures (ambient and ground). It is expected that the repair materials will set and gain strength faster in the operational environment because of several differences in testing, including mass of repair materials, and resulting heat transfer differences. It is expected that the laboratory test cylinders lose significantly more heat generated by the heat of hydration to the envi-ronment (air, ground) than would be expected for a typically sized repair crater. Therefore, while we expect that the laboratory tests are conserva-tive in terms of the performance of the materials at sub-freezing tempera-tures, the extent of the differences is currently unknown until the conclu-sion of operational testing.

ERDC TR-14-10 65
References ASTM International. 1997. Standard Test Method for Flow Consistency of Controlled Low
Strength Material (CLSM). In Annual Book of ASTM Standards. D6103-97. West Conshohocken, PA: ASTM International.
ASTM International. 2002. Standard Test Method for Slump of Hydraulic-Cement Concrete. C143. West Conshohocken, PA: ASTM International.
ASTM International. 2007. Standard Practice for Making and Curing Concrete Test Specimens in the Laboratory. C192. West Conshohocken, PA: ASTM International.
ASTM International. 2008a. Standard Test Method for Compressive Strength of Cylindrical Concrete Specimens. C39. West Conshohocken, PA: ASTM International.
ASTM International. 2008b. Standard Test Method for Time of Setting of Concrete Mixtures by Penetration Resistance. C403. West Conshohocken, PA: ASTM International.
ASTM International. 2011. Standard Test Methods for Fineness of Hydraulic Cement by Air-Permeability Apparatus. In Annual Book of ASTM Standards. C204. West Conshohocken, PA: ASTM International.
ASTM International. 2012. Standard Specification for Portland Cement. C150. West Conshohocken, PA: ASTM International.
Barna, L. A. 2011. Phase III. Guidance for Optimizing Admixture Dosage Rates. ERDC/CRREL TR-10-7. Hanover, NH: U.S. Army Engineer Research and Development Center.
Barna, L. A., J. S. Tingle, and P. S. McCaffrey. 2010a. Laboratory and Field Evaluation of Rapid Setting Cementitious Materials for Large Crater Repair. ERDC/CRREL TR-10-4. Hanover, NH: U.S. Army Engineer Research and Development Center.
Barna, L. A., P. M. Seeman, and C. J. Korhonen. 2010b. Cold Weather Admixture Systems Demonstration at Fort Wainwright, AK. ERDC/CRREL TR-10-6. Hanover, NH: U.S. Army Engineer Research and Development Center.
Center for Army Lessons Learned. 2011. Route Remediation Handbook. No. 12-1. https://call2.army.mil/toc.aspx?document=6799&
Cortez, E., L. Barna, C. Smith, and T. Peltz. 2010. Cold Roller-Compacted Concrete for Roads and Hardstands on Army Installations in Cold Regions. ERDC/CRREL TR-10-8. Hanover, NH: U.S. Army Engineer Research and Development Center.

ERDC TR-14-10 66
Efimov A.M. and V.G. Pogareva. 2000. Water-related IR Absorption Spectra for Some Phosphate and Silicate Glasses. Journal of Non-Crystalline Solids. 275 (3): 189-198.
HowStuffWorks. 2013. How MREs Work: Flameless Heaters. How Stuff Works. http://science.howstuffworks.com/mre4.htm.
Klieger, J., and P. Lamond. 1994. Significance of Tests and Properties of Concrete and Concrete-Making Materials. Philadelphia, PA: American Society for Testing and Materials
Korhonen, C. J., 1990. Antifreeze Admixtures for Cold Regions Concreting: A Literature Review. Special Report 90-32. Hanover, NH: Cold Regions Research and Engineering Laboratory.
Korhonen, C. J., 1999. Expedient Low-Temperature Concrete Admixtures for the Army. Special Report 99-17. Hanover, NH: Cold Regions Research and Engineering Laboratory.
Korhonen, C. J., 2002a. Off-the-Shelf Antifreeze Admixtures. ERDC/CRREL TR-02-7. Hanover, NH: U.S. Army Engineer Research and Development Center.
Korhonen, C. J., 2002b. Effect of High Doses of Chemical Admixtures on the Freeze-Thaw Durability of Portland Cement Concrete. ERDC/CRREL TR-02-5. Hanover, NH: U.S. Army Engineer Research and Development Center.
Korhonen, C. J., 2006. Extending the Season for Concrete Construction and Repair Phase II- Defining Engineering Parameters. ERDC/CRREL TR-06-8. Hanover, NH: U.S. Army Engineer Research and Development Center.
Korhonen, C. J., and J. W. Brook. 1996. Freezing temperature protection admixture for Portland cement concrete. Special Report 96-28. Hanover, NH: Cold Regions Research and Engineering Laboratory.
Korhonen, C. J., and S. A. Orchino. 2001. Off-the-Shelf Antifreeze Admixture for Concrete. ERDC/CRREL TR-01-2. Hanover, NH: U.S. Army Engineer Research and Development Center.
Korhonen, C. J., and P. M. Seman. 2005. Placing Antifreeze Concrete at Grand Forks Air Force Base. ERDC/CRREL TR-05-9. Hanover, NH: U.S. Army Engineer Research and Development Center.
Korhonen, C. J., B. Charest, and K. Romisch. 1997a. Developing new low-temperature admixtures for concrete. Special Report 97-9. Hanover, NH: Cold Regions Research and Engineering Laboratory.
Korhonen, C. J., E. R. Cortez, T. A. Durning, and A. A. Jeknavorian. 1997b. Antifreeze admixtures for concrete. Special Report 97-26. Hanover, NH: Cold Regions Research and Engineering Laboratory.

ERDC TR-14-10 67
Korhonen, C. J., R. D. Thomas, and E. R. Cortez. 1997c. Increasing Cold Weather Masonry Construction Productivity. ERDC/CRREL Special Report 97-16. Hanover, NH: U.S. Army Engineer Research and Development Center, Cold Regions Research and Engineering Laboratory.
Korhonen, C. J., P. M. Seman, and L. A. Barna. 2004. Extending the Season for Concrete Construction and Repair: Phase I—Establishing the Technology. ERDC/CRREL TR-04-2. Hanover, NH: U.S. Army Engineer Research and Development Center.
Kutner, M. H., C. J. Nachtsheim, J. Neter, and W. L. 2005. Applied Linear Statistical Models. 5th ed. New York: McGraw-Hill.
McGlaughlin Spray Foam Insulation. n.d. Compare Spray Foam. New Britain, PA: McGlaughlin Spray Foam Insulation. http://www.spray-foam.com/compare.html.
McMaster-Carr. n.d. Immersion Heaters. Robbinsville, NJ: McMaster-Carr. http://www.mcmaster.com/#immersion-heaters/=llda1b.
Mindess, S., and J. F. Young. 1981. Concrete. Englewood Cliffs, NJ: Prentice-Hall.
Oren. J. I., E. R. Cortez, and C. E. Smith, Jr. 2013. Laboratory Evaluation of Expedient Low-Temperature Concrete Admixtures for Repairing Blast Holes in Cold Weather. ERDC/CRREL TR-13-1. Hanover, NH: U.S. Army Engineer Research and Development Center.
SAS Institute Inc. 2012. JMP 9 Statistical Discovery Software. http://www.jmp.com.
Schroder, P. A. 2002. Infrared spectroscopy in clay science. CMS workshop lectures 11:181–206.
Ylmen, R., U. Jaglid, B-M. Steenari, and I. Panas. 2009. Early hydration and setting of Portland cement monitored by IR, SEM and Vicat techniques. Cement and Concrete Research 39: 433–439.

ERDC TR-14-10 68
Appendix A: Laboratory Test Data Table A1. Admixture investigations, Rapid Set (task 1): mortar mix at −5°C nominal
temperature, water cooled to nominal temperature before test.
Admix Admix Combo
Name
Admix 1 Amount
(by % weight water)
Admix 2 Amount
(by % weight water:
Penetration Resistance (psi) Workability
(1–10: 1 = unworkable,
10 = pour)
Time (min)
20 45 120 Calcium Chloride
CC 15% 15% 0 0 64 5–6
Calcium Chloride, Calcium Nitrate
CC-CN 4%, 15% 4% 15% 16 40 144 5–6 CC-CN 8%, 15% 8% 15% 0 0 96 5–6 CC-CN 10%, 10% 10% 10% 8 40 144 5–6
Table A2. Admixture investigations, Rapid Set (task 1): mortar mix at −5°C nominal temperature, water
cooled to 0°C before test.
Admix Admix Combo
Name
Admix 1 Amount
(by % weight water)
Admix 2 Amount
(by % weight water)
Actual Solution
(g) Mix #
Penetration Resistance (psi) Workability
(1–10, 1 = unworkable,
10 = pour)
Time (min)
20 45 120
Calcium Chloride
CC 6% 6% 271 1 8 40 128 6–8
Calcium Sulfate
CS .5% .5% 271 3 16 128 264 7–8 CS 6% 6% 271 4 16 32 240 5–6
Calcium Chloride, Calcium Sulfate
CC-CS 6%, .5% 6% .5% 271 5 40 40 112 5–6 CC-CS 6%, 1% 6% 1% 271 6 8 40 80 5–6 CC-CS 10%, 1% 10% 1% 271 7 0 24 80 5–6
Calcium Chloride, Sugar (Granular)
CC-Sug 6%, 1% 6% 1% 271 8 0 2 10 8–9 CC-Sug 12%, 1% 12% 1% 249 9 0 32 80 6–7 CC-Sug 6%, 2% 6% 2% 279 10 0 0 80 6–7 CC-Sug 12%, 2% 12% 2% 271 11 0 0 40 6–7
Calcium Chloride, Calcium Nitrate
CC-CN 4%, 10% 4% 10% 249 12 8 56 176 5–6

ERDC TR-14-10 69
Table A3. Admixture investigations, Rapid Set (task 1): mortar mix at −5°C nominal temp, water cooled to 0°C before test.
Admix
Admix Combo Name
Admix 1 Amount
(by % weight water)
Admix 2 Amount
(by % weight water)
Actual Solution
(g) Mix #
Penetration Resistance (psi)
Time psi Time psi
Time (min)
20 45 120 120
Calcium Chloride
CC 20% 20% 293 16 0 0 40 338 360 CC 30% 30% 293 17 0 0 8 330 120 CC 45% 45% 293 18 0 0 0 321 40
Calcium Chloride, Sugar
CC-Sug 30%, 1%
30% 1% 271 19 0 0 8 313 40
CC-Sug 45%, 1%
45% 1% 271 20 0 0 24 305 40
CC-Sug 45%, 2%
45% 2% 271 21 0 0 40 297 60
Calcium Chloride, Calcium Nitrate
CC-CN 15%, 30%
15% 30% 271 22 0 0 48 290 120
CC-CN 15%, 45%
15% 45% 271 23 0 16 40 282 100
CC-CN 30%, 30%
30% 30% 293 24 0 0 0 263 0
CC-CN 30%, 45%
30% 45% 316 25 0 0 40 254 60
Calcium Chloride, Aluminum Sulfate
CC-AS 15%, 5%
15% 5% 271 26 0 0 160 271 7680
CC-AS 40%, 5%
40% 5% 271 27 0 8 40 244 80 273 80
Calcium Chloride, Pozzutec 20+
CC-Poz 15%, .2%
15% .2% 271 28 0 24 152 233 400 263 52
CC-Poz 15%, 1%
15% 1% 271 29 0 16 144 215 280 246 520
CC-Poz 15%, 2%
15% 2% 271 30 0 16 136 206 240 240 360
Calcium Nitrate, Pozzutec 20+
CN-Poz 15%, 10%
15% 10% 271 32 0 144 222 320 259 640

ERDC TR-14-10 70
Table A4. Admixture investigations, Utility Fill (task 1): −5°C nominal temp, heat water to specified temp, mix admix into water, mix Utility Fill. Single admixtures used.
Admix Admix Combo
Name
Admix Amount
(by % weight water)
Actual Solution
(g) Mix #
Penetration Resistance (psi)
Slump
(in.)
Time (min)
15 30 60 2 hr UCS
Calcium Chloride
CC 5% 5% 653 50 40 208 488 0 10 CC 15% 15% 628 51 0 0 40 0 10
Aluminum Sulfate
AS 5% 5% 767 52 40 128 432 0 10 AS 8% 8% 810 53 80 240 640 0 10
Glenium 7500 plasticizer
Gle 1% 1% 570 55 0 144 360 0 10 Gle 2% 2% 538 56 0 64 176 0 10
Control (no admix)
611 57 72 312 688 0 10
Calcium Chloride
CC 5% 5% 624 66 48 224 520 5 9 CC 15% 15% 635 67 0 0 120 12 9
Aluminum Sulfate
AS 5% 5% 756 68 120 448 800 50 8 AS 8% 8% 905 69 112 520 800 98 7
Glenium 7500 plasticizer
Gle 1% (measure in mL)
1% 499 71 64 384 760 33 9
Gle 2% (measure in mL)
2% 524 72 16 232 560 23 10
Control (no admix)
637 73 232 520 800 74 9
Control room
(materials 20 °C)
626 74 800 507 9

ERDC TR-14-10 71
Table A5. Admixture investigations, Utility Fill (task 1): −5°C Nominal Temp, heat water to specified temp, mix admix into water, mix Utility Fill. Single and combination admixtures used.
Admix
Admix Combo Name
Admix 1 Amount
(by % weight water)
Admix 2 Amount
(by % weight water)
Actual Solution
(g) Mix #
Penetration Resistance (psi)
Slump (in.) Notes/Observations
Time (min)
15 60 2 hr UCS
Calcium Chloride
CC 15% 15% 375 35 0 176 0 7–8 soft/liquid at 2 hr CC 80% 80% 504 36 0 0 0 6–7 soft/liquid at 2 hr
Aluminum Sulfate
AS 5% 5% 357 37 0 0 0 6–7 crumbles at 2 hr AS 10% 10% 393 38 0 8 0 7–8 crumbles at 2 hr AS 15% 15% 431 39 0 0 0 6–7 crumbles at 2 hr
Sodium Sulfate
SS 5% 5% 374 40 0 0 0 8–9 soft at 2 hr
Calcium Chloride, Sodium Sulfate
CC-SS 15%, 5%
15% 5% 351 41 0 112 0 8–9 soft at 2 hr
Aluminum Sulfate, Sodium Sulfate
AS-SS 5%, 5%
5% 5% 361 43 0 24 0 7–8 soft at 2 hr
AS-SS 8%, 8%
8% 8% 454 44 0 16 0 7–8 soft at 2 hr
Sodium Nitrate
SN 45% 45% 484 45 0 0 0 8–9 liquid at 2 hr
Aluminum Sulfate, Sodium Nitrate
AS-SN 5%, 5%
5% 5% 404 46 0 32 0 6–7 soft at 2 hr
AS-SN 8%, 45%
8% 45% 459 47 0 0 0 7–8 soft at 2 hr
Calcium Chloride, Calcium Nitrate
CC-CN 45%, 45%
45% 45% 620 48 0 0 0 8–9 liquid at 2 hr
Aluminum Sulfate, Calcium Nitrate
AS-CN 8%, 15%
8% 15% 415 49 0 40 0 7–8 soft at 2 hr

ERD
C TR-14-10
72
Table A6. Utility Fill and Rapid Set hot water test phase (task 2).
Sample PenRes_(psi) 2hr_UCS_(psi) SetTime_(min) Time_elaps_(min) Nom_Temp_C Water Temp Mixture water_lb ratio_mix Slump penetr1.1 464 10 20 20 UF 3.75 1:0.89:13.3:0 9.5 penetr1.1 20 20 UF 3.75 1:0.89:13.3:0 9.5 penetr1.1 20 20 UF 3.75 1:0.89:13.3:0 9.5 penetr1.1 20 20 UF 3.75 1:0.89:13.3:0 9.5 penetr1.2 760 10 20 20 UF 3.75 1:0.89:13.3:0 9.5 penetr1.2 20 20 UF 3.75 1:0.89:13.3:0 9.5 penetr1.2 20 20 UF 3.75 1:0.89:13.3:0 9.5 penetr1.2 20 20 UF 3.75 1:0.89:13.3:0 9.5 penetr1.3 760 10 20 20 UF 3.75 1:0.89:13.3:0 9.5 penetr1.3 20 20 UF 3.75 1:0.89:13.3:0 9.5 penetr1.3 20 20 UF 3.75 1:0.89:13.3:0 9.5 penetr1.3 20 20 UF 3.75 1:0.89:13.3:0 9.5 penetr1.1 20 20 UF 3.75 1:0.89:13.3:0 9.5 penetr1.2 20 20 UF 3.75 1:0.89:13.3:0 9.5 penetr1.1 500 8 20 20 UF 3.75 1:0.89:13.3:0 9.5 penetr1.2 500 7 20 20 UF 3.75 1:0.89:13.3:0 9.5 penetr1.3 500 7 20 20 UF 3.75 1:0.89:13.3:0 9.5 penetr2.1 120 8 20 20 UF 4 1:0.95:13.3:0 9.75 penetr2.1 288 10 20 20 UF 4 1:0.95:13.3:0 9.75 penetr2.1 20 20 UF 4 1:0.95:13.3:0 9.75 penetr2.1 20 20 UF 4 1:0.95:13.3:0 9.75 penetr2.2 152 8 20 20 UF 4 1:0.95:13.3:0 9.75 penetr2.2 424 10 20 20 UF 4 1:0.95:13.3:0 9.75 penetr2.2 20 20 UF 4 1:0.95:13.3:0 9.75 penetr2.2 20 20 UF 4 1:0.95:13.3:0 9.75 penetr2.3 240 8 20 20 UF 4 1:0.95:13.3:0 9.75 penetr2.3 528 10 20 20 UF 4 1:0.95:13.3:0 9.75

ERD
C TR-14-10
73
Sample PenRes_(psi) 2hr_UCS_(psi) SetTime_(min) Time_elaps_(min) Nom_Temp_C Water Temp Mixture water_lb ratio_mix Slump penetr2.3 20 20 UF 4 1:0.95:13.3:0 9.75 penetr2.3 20 20 UF 4 1:0.95:13.3:0 9.75 penetr2.1 20 20 UF 4 1:0.95:13.3:0 9.75 penetr2.2 20 20 UF 4 1:0.95:13.3:0 9.75 penetr2.1 500 10 20 20 UF 4 1:0.95:13.3:0 9.75 penetr2.2 500 9 20 20 UF 4 1:0.95:13.3:0 9.75 penetr2.3 500 9 20 20 UF 4 1:0.95:13.3:0 9.75 penetr4.1 232 5 20 60 UF 4.5 1:1.07:13.3:0 9 penetr4.1 800 7 20 60 UF 4.5 1:1.07:13.3:0 9 penetr4.1 20 60 UF 4.5 1:1.07:13.3:0 9 penetr4.1 20 60 UF 4.5 1:1.07:13.3:0 9 penetr4.2 192 5 20 60 UF 4.5 1:1.07:13.3:0 9 penetr4.2 800 7 20 60 UF 4.5 1:1.07:13.3:0 9 penetr4.2 20 60 UF 4.5 1:1.07:13.3:0 9 penetr4.2 20 60 UF 4.5 1:1.07:13.3:0 9 penetr4.3 312 5 20 60 UF 4.5 1:1.07:13.3:0 9 penetr4.3 800 7 20 60 UF 4.5 1:1.07:13.3:0 9 penetr4.3 20 60 UF 4.5 1:1.07:13.3:0 9 penetr4.3 20 60 UF 4.5 1:1.07:13.3:0 9 penetr4.1 20 60 UF 4.5 1:1.07:13.3:0 9 penetr4.2 20 60 UF 4.5 1:1.07:13.3:0 9 penetr4.1 500 6 20 60 UF 4.5 1:1.07:13.3:0 9 penetr4.2 500 6 20 60 UF 4.5 1:1.07:13.3:0 9 penetr4.3 500 6 20 60 UF 4.5 1:1.07:13.3:0 9 penetr5.1 48 10 20 5 UF 3.75 1:0.89:13.3:0 11 penetr5.1 480 15 20 5 UF 3.75 1:0.89:13.3:0 11 penetr5.1 1160 20 20 5 UF 3.75 1:0.89:13.3:0 11 penetr5.1 5200 30 20 5 UF 3.75 1:0.89:13.3:0 11

ERD
C TR-14-10
74
Sample PenRes_(psi) 2hr_UCS_(psi) SetTime_(min) Time_elaps_(min) Nom_Temp_C Water Temp Mixture water_lb ratio_mix Slump penetr5.2 48 10 20 5 UF 3.75 1:0.89:13.3:0 11 penetr5.2 440 15 20 5 UF 3.75 1:0.89:13.3:0 11 penetr5.2 1280 20 20 5 UF 3.75 1:0.89:13.3:0 11 penetr5.2 6000 30 20 5 UF 3.75 1:0.89:13.3:0 11 penetr5.3 56 10 20 5 UF 3.75 1:0.89:13.3:0 11 penetr5.3 376 15 20 5 UF 3.75 1:0.89:13.3:0 11 penetr5.3 1520 20 20 5 UF 3.75 1:0.89:13.3:0 11 penetr5.3 4800 30 20 5 UF 3.75 1:0.89:13.3:0 11 penetr5.1 20 5 UF 3.75 1:0.89:13.3:0 11 penetr5.2 20 5 UF 3.75 1:0.89:13.3:0 11 penetr5.1 500 12.5 20 5 UF 3.75 1:0.89:13.3:0 11 penetr5.2 500 12.5 20 5 UF 3.75 1:0.89:13.3:0 11 penetr5.3 500 12.5 20 5 UF 3.75 1:0.89:13.3:0 11 penetr7.1 112 7 10 60 UF 4.25 1:1.01:13.3:0 6.25 penetr7.1 496 9 10 60 UF 4.25 1:1.01:13.3:0 6.25 penetr7.1 10 60 UF 4.25 1:1.01:13.3:0 6.25 penetr7.1 10 60 UF 4.25 1:1.01:13.3:0 6.25 penetr7.2 152 7 10 60 UF 4.25 1:1.01:13.3:0 6.25 penetr7.2 544 9 10 60 UF 4.25 1:1.01:13.3:0 6.25 penetr7.2 10 60 UF 4.25 1:1.01:13.3:0 6.25 penetr7.2 10 60 UF 4.25 1:1.01:13.3:0 6.25 penetr7.3 200 7 10 60 UF 4.25 1:1.01:13.3:0 6.25 penetr7.3 760 9 10 60 UF 4.25 1:1.01:13.3:0 6.25 penetr7.3 10 60 UF 4.25 1:1.01:13.3:0 6.25 penetr7.3 10 60 UF 4.25 1:1.01:13.3:0 6.25 penetr7.1 10 60 UF 4.25 1:1.01:13.3:0 6.25 penetr7.2 10 60 UF 4.25 1:1.01:13.3:0 6.25 penetr7.1 500 8 10 60 UF 4.25 1:1.01:13.3:0 6.25

ERD
C TR-14-10
75
Sample PenRes_(psi) 2hr_UCS_(psi) SetTime_(min) Time_elaps_(min) Nom_Temp_C Water Temp Mixture water_lb ratio_mix Slump penetr7.2 500 8 10 60 UF 4.25 1:1.01:13.3:0 6.25 penetr7.3 500 8 10 60 UF 4.25 1:1.01:13.3:0 6.25 penetr8.1 0 10 10 20 UF 4.25 1:1.01:13.3:0 11 penetr8.1 8 15 10 20 UF 4.25 1:1.01:13.3:0 11 penetr8.1 64 20 10 20 UF 4.25 1:1.01:13.3:0 11 penetr8.1 300 25 10 20 UF 4.25 1:1.01:13.3:0 11 penetr8.2 0 10 10 20 UF 4.25 1:1.01:13.3:0 11 penetr8.2 8 15 10 20 UF 4.25 1:1.01:13.3:0 11 penetr8.2 72 20 10 20 UF 4.25 1:1.01:13.3:0 11 penetr8.2 296 25 10 20 UF 4.25 1:1.01:13.3:0 11 penetr8.3 0 10 10 20 UF 4.25 1:1.01:13.3:0 11 penetr8.3 24 15 10 20 UF 4.25 1:1.01:13.3:0 11 penetr8.3 88 20 10 20 UF 4.25 1:1.01:13.3:0 11 penetr8.3 328 25 10 20 UF 4.25 1:1.01:13.3:0 11 penetr8.1 10 20 UF 4.25 1:1.01:13.3:0 11 penetr8.2 10 20 UF 4.25 1:1.01:13.3:0 11 penetr8.1 500 22.5 10 20 UF 4.25 1:1.01:13.3:0 11 penetr8.2 500 22.5 10 20 UF 4.25 1:1.01:13.3:0 11 penetr8.3 500 22.5 10 20 UF 4.25 1:1.01:13.3:0 11 penetr9.1 0 10 10 5 UF 4.25 1:1.01:13.3:0 11 penetr9.1 0 15 10 5 UF 4.25 1:1.01:13.3:0 11 penetr9.1 64 20 10 5 UF 4.25 1:1.01:13.3:0 11 penetr9.1 112 25 10 5 UF 4.25 1:1.01:13.3:0 11 penetr9.2 0 10 10 5 UF 4.25 1:1.01:13.3:0 11 penetr9.2 0 15 10 5 UF 4.25 1:1.01:13.3:0 11 penetr9.2 40 20 10 5 UF 4.25 1:1.01:13.3:0 11 penetr9.2 136 25 10 5 UF 4.25 1:1.01:13.3:0 11 penetr9.3 0 10 10 5 UF 4.25 1:1.01:13.3:0 11

ERD
C TR-14-10
76
Sample PenRes_(psi) 2hr_UCS_(psi) SetTime_(min) Time_elaps_(min) Nom_Temp_C Water Temp Mixture water_lb ratio_mix Slump penetr9.3 0 15 10 5 UF 4.25 1:1.01:13.3:0 11 penetr9.3 48 20 10 5 UF 4.25 1:1.01:13.3:0 11 penetr9.3 136 25 10 5 UF 4.25 1:1.01:13.3:0 11 penetr9.1 10 5 UF 4.25 1:1.01:13.3:0 11 penetr9.2 10 5 UF 4.25 1:1.01:13.3:0 11 penetr9.1 500 27.5 10 5 UF 4.25 1:1.01:13.3:0 11 penetr9.2 500 27.5 10 5 UF 4.25 1:1.01:13.3:0 11 penetr9.3 500 27.5 10 5 UF 4.25 1:1.01:13.3:0 11 penetr10.1 0 15 0 20 UF 4 1:0.95:13.3:0 10.75 penetr10.1 0 25 0 20 UF 4 1:0.95:13.3:0 10.75 penetr10.1 40 30 0 20 UF 4 1:0.95:13.3:0 10.75 penetr10.1 96 35 0 20 UF 4 1:0.95:13.3:0 10.75 penetr10.2 0 15 0 20 UF 4 1:0.95:13.3:0 10.75 penetr10.2 0 25 0 20 UF 4 1:0.95:13.3:0 10.75 penetr10.2 44 30 0 20 UF 4 1:0.95:13.3:0 10.75 penetr10.2 88 35 0 20 UF 4 1:0.95:13.3:0 10.75 penetr10.3 0 15 0 20 UF 4 1:0.95:13.3:0 10.75 penetr10.3 0 25 0 20 UF 4 1:0.95:13.3:0 10.75 penetr10.3 40 30 0 20 UF 4 1:0.95:13.3:0 10.75 penetr10.3 80 35 0 20 UF 4 1:0.95:13.3:0 10.75 penetr10.1 0 20 UF 4 1:0.95:13.3:0 10.75 penetr10.2 0 20 UF 4 1:0.95:13.3:0 10.75 penetr10.1 0 20 UF 4 1:0.95:13.3:0 10.75 penetr10.2 0 20 UF 4 1:0.95:13.3:0 10.75 penetr10.3 0 20 UF 4 1:0.95:13.3:0 10.75 penetr11.1 304 12 0 60 UF 4 1:0.95:13.3:0 7.25 penetr11.1 544 14 0 60 UF 4 1:0.95:13.3:0 7.25 penetr11.1 800 0 60 UF 4 1:0.95:13.3:0 7.25

ERD
C TR-14-10
77
Sample PenRes_(psi) 2hr_UCS_(psi) SetTime_(min) Time_elaps_(min) Nom_Temp_C Water Temp Mixture water_lb ratio_mix Slump penetr11.1 0 60 UF 4 1:0.95:13.3:0 7.25 penetr11.2 110 12 0 60 UF 4 1:0.95:13.3:0 7.25 penetr11.2 496 14 0 60 UF 4 1:0.95:13.3:0 7.25 penetr11.2 800 0 60 UF 4 1:0.95:13.3:0 7.25 penetr11.2 0 60 UF 4 1:0.95:13.3:0 7.25 penetr11.3 376 12 0 60 UF 4 1:0.95:13.3:0 7.25 penetr11.3 632 14 0 60 UF 4 1:0.95:13.3:0 7.25 penetr11.3 800 0 60 UF 4 1:0.95:13.3:0 7.25 penetr11.3 0 60 UF 4 1:0.95:13.3:0 7.25 penetr11.1 0 60 UF 4 1:0.95:13.3:0 7.25 penetr11.2 0 60 UF 4 1:0.95:13.3:0 7.25 penetr11.1 500 9 0 60 UF 4 1:0.95:13.3:0 7.25 penetr11.2 500 11 0 60 UF 4 1:0.95:13.3:0 7.25 penetr11.3 500 9 0 60 UF 4 1:0.95:13.3:0 7.25 penetr13.1 40 10 -15 90 UF 4.25 1:1.01:13.3:0 1 penetr13.1 288 -15 90 UF 4.25 1:1.01:13.3:0 1 penetr13.1 -15 90 UF 4.25 1:1.01:13.3:0 1 penetr13.1 -15 90 UF 4.25 1:1.01:13.3:0 1 penetr13.2 200 10 -15 90 UF 4.25 1:1.01:13.3:0 1 penetr13.2 576 -15 90 UF 4.25 1:1.01:13.3:0 1 penetr13.2 -15 90 UF 4.25 1:1.01:13.3:0 1 penetr13.2 -15 90 UF 4.25 1:1.01:13.3:0 1 penetr13.3 152 10 -15 90 UF 4.25 1:1.01:13.3:0 1 penetr13.3 576 -15 90 UF 4.25 1:1.01:13.3:0 1 penetr13.3 -15 90 UF 4.25 1:1.01:13.3:0 1 penetr13.3 -15 90 UF 4.25 1:1.01:13.3:0 1 penetr13.1 -15 90 UF 4.25 1:1.01:13.3:0 1 penetr13.2 -15 90 UF 4.25 1:1.01:13.3:0 1

ERD
C TR-14-10
78
Sample PenRes_(psi) 2hr_UCS_(psi) SetTime_(min) Time_elaps_(min) Nom_Temp_C Water Temp Mixture water_lb ratio_mix Slump penetr13.1 -15 90 UF 4.25 1:1.01:13.3:0 1 penetr13.2 -15 90 UF 4.25 1:1.01:13.3:0 1 penetr13.3 -15 90 UF 4.25 1:1.01:13.3:0 1 penetr15.1 0 15 -15 61.8 UF 4 1:0.95:13.3:0 10.75 penetr15.1 40 20 -15 61.8 UF 4 1:0.95:13.3:0 10.75 penetr15.1 96 30 -15 61.8 UF 4 1:0.95:13.3:0 10.75 penetr15.1 224 45 -15 61.8 UF 4 1:0.95:13.3:0 10.75 penetr15.2 0 15 -15 61.8 UF 4 1:0.95:13.3:0 10.75 penetr15.2 16 20 -15 61.8 UF 4 1:0.95:13.3:0 10.75 penetr15.2 80 30 -15 61.8 UF 4 1:0.95:13.3:0 10.75 penetr15.2 200 45 -15 61.8 UF 4 1:0.95:13.3:0 10.75 penetr15.3 0 15 -15 61.8 UF 4 1:0.95:13.3:0 10.75 penetr15.3 16 20 -15 61.8 UF 4 1:0.95:13.3:0 10.75 penetr15.3 72 30 -15 61.8 UF 4 1:0.95:13.3:0 10.75 penetr15.3 184 45 -15 61.8 UF 4 1:0.95:13.3:0 10.75 penetr15.1 8 120 -15 61.8 UF 4 1:0.95:13.3:0 10.75 penetr15.2 -15 61.8 UF 4 1:0.95:13.3:0 10.75 penetr15.1 8 -15 61.8 UF 4 1:0.95:13.3:0 10.75 penetr15.2 -15 61.8 UF 4 1:0.95:13.3:0 10.75 penetr15.3 -15 61.8 UF 4 1:0.95:13.3:0 10.75 penetr16.1 0 10 -5 61 UF 4.25 1:1.01:13.3:0 9.25 penetr16.1 80 15 -5 61 UF 4.25 1:1.01:13.3:0 9.25 penetr16.1 680 -5 61 UF 4.25 1:1.01:13.3:0 9.25 penetr16.1 -5 61 UF 4.25 1:1.01:13.3:0 9.25 penetr16.2 8 10 -5 61 UF 4.25 1:1.01:13.3:0 9.25 penetr16.2 168 15 -5 61 UF 4.25 1:1.01:13.3:0 9.25 penetr16.2 800 -5 61 UF 4.25 1:1.01:13.3:0 9.25 penetr16.2 -5 61 UF 4.25 1:1.01:13.3:0 9.25

ERD
C TR-14-10
79
Sample PenRes_(psi) 2hr_UCS_(psi) SetTime_(min) Time_elaps_(min) Nom_Temp_C Water Temp Mixture water_lb ratio_mix Slump penetr16.3 0 10 -5 61 UF 4.25 1:1.01:13.3:0 9.25 penetr16.3 120 15 -5 61 UF 4.25 1:1.01:13.3:0 9.25 penetr16.3 696 -5 61 UF 4.25 1:1.01:13.3:0 9.25 penetr16.3 -5 61 UF 4.25 1:1.01:13.3:0 9.25 penetr16.1 -5 61 UF 4.25 1:1.01:13.3:0 9.25 penetr16.2 -5 61 UF 4.25 1:1.01:13.3:0 9.25 penetr16.1 500 14 -5 61 UF 4.25 1:1.01:13.3:0 9.25 penetr16.2 500 14 -5 61 UF 4.25 1:1.01:13.3:0 9.25 penetr16.3 500 14 -5 61 UF 4.25 1:1.01:13.3:0 9.25 penetr17.1 0 15 -5 40 UF 4 1:0.95:13.3:0 10.5 penetr17.1 16 20 -5 40 UF 4 1:0.95:13.3:0 10.5 penetr17.1 72 30 -5 40 UF 4 1:0.95:13.3:0 10.5 penetr17.1 240 35 -5 40 UF 4 1:0.95:13.3:0 10.5 penetr17.2 0 15 -5 40 UF 4 1:0.95:13.3:0 10.5 penetr17.2 24 20 -5 40 UF 4 1:0.95:13.3:0 10.5 penetr17.2 72 30 -5 40 UF 4 1:0.95:13.3:0 10.5 penetr17.2 224 35 -5 40 UF 4 1:0.95:13.3:0 10.5 penetr17.3 0 15 -5 40 UF 4 1:0.95:13.3:0 10.5 penetr17.3 24 20 -5 40 UF 4 1:0.95:13.3:0 10.5 penetr17.3 80 30 -5 40 UF 4 1:0.95:13.3:0 10.5 penetr17.3 272 35 -5 40 UF 4 1:0.95:13.3:0 10.5 penetr17.1 -5 40 UF 4 1:0.95:13.3:0 10.5 penetr17.2 -5 40 UF 4 1:0.95:13.3:0 10.5 penetr17.1 -5 40 UF 4 1:0.95:13.3:0 10.5 penetr17.2 -5 40 UF 4 1:0.95:13.3:0 10.5 penetr17.3 -5 40 UF 4 1:0.95:13.3:0 10.5 penetr18.1 40 12 -5 60 UF 4 1:0.95:13.3:0 9 penetr18.1 160 15 -5 60 UF 4 1:0.95:13.3:0 9

ERD
C TR-14-10
80
Sample PenRes_(psi) 2hr_UCS_(psi) SetTime_(min) Time_elaps_(min) Nom_Temp_C Water Temp Mixture water_lb ratio_mix Slump penetr18.1 472 17 -5 60 UF 4 1:0.95:13.3:0 9 penetr18.1 -5 60 UF 4 1:0.95:13.3:0 9 penetr18.2 16 12 -5 60 UF 4 1:0.95:13.3:0 9 penetr18.2 64 15 -5 60 UF 4 1:0.95:13.3:0 9 penetr18.2 144 17 -5 60 UF 4 1:0.95:13.3:0 9 penetr18.2 300 -5 60 UF 4 1:0.95:13.3:0 9 penetr18.3 -5 60 UF 4 1:0.95:13.3:0 9 penetr18.3 -5 60 UF 4 1:0.95:13.3:0 9 penetr18.3 -5 60 UF 4 1:0.95:13.3:0 9 penetr18.3 -5 60 UF 4 1:0.95:13.3:0 9 penetr18.1 195 120 -5 60 UF 4 1:0.95:13.3:0 9 penetr18.2 154 120 -5 60 UF 4 1:0.95:13.3:0 9 penetr18.1 500 195 15 -5 60 UF 4 1:0.95:13.3:0 9 penetr18.2 500 154 16 -5 60 UF 4 1:0.95:13.3:0 9 penetr18.3 -5 60 UF 4 1:0.95:13.3:0 9 penetr19.1 0 20 -5 40 UF 4 1:0.95:13.3:0 10 penetr19.1 176 35 -5 40 UF 4 1:0.95:13.3:0 10 penetr19.1 300 50 -5 40 UF 4 1:0.95:13.3:0 10 penetr19.1 800 -5 40 UF 4 1:0.95:13.3:0 10 penetr19.2 0 20 -5 40 UF 4 1:0.95:13.3:0 10 penetr19.2 40 35 -5 40 UF 4 1:0.95:13.3:0 10 penetr19.2 192 50 -5 40 UF 4 1:0.95:13.3:0 10 penetr19.2 440 -5 40 UF 4 1:0.95:13.3:0 10 penetr19.3 -5 40 UF 4 1:0.95:13.3:0 10 penetr19.3 -5 40 UF 4 1:0.95:13.3:0 10 penetr19.3 -5 40 UF 4 1:0.95:13.3:0 10 penetr19.3 -5 40 UF 4 1:0.95:13.3:0 10 penetr19.1 11 120 -5 40 UF 4 1:0.95:13.3:0 10

ERD
C TR-14-10
81
Sample PenRes_(psi) 2hr_UCS_(psi) SetTime_(min) Time_elaps_(min) Nom_Temp_C Water Temp Mixture water_lb ratio_mix Slump penetr19.2 6 120 -5 40 UF 4 1:0.95:13.3:0 10 penetr19.1 11 -5 40 UF 4 1:0.95:13.3:0 10 penetr19.2 6 -5 40 UF 4 1:0.95:13.3:0 10 penetr19.3 -5 40 UF 4 1:0.95:13.3:0 10 penetr20.1 320 15 20 20 UF 4 1:0.95:13.3:0 9.75 penetr20.1 2200 20 20 UF 4 1:0.95:13.3:0 9.75 penetr20.1 20 20 UF 4 1:0.95:13.3:0 9.75 penetr20.1 20 20 UF 4 1:0.95:13.3:0 9.75 penetr20.2 328 15 20 20 UF 4 1:0.95:13.3:0 9.75 penetr20.2 1840 20 20 UF 4 1:0.95:13.3:0 9.75 penetr20.2 20 20 UF 4 1:0.95:13.3:0 9.75 penetr20.2 20 20 UF 4 1:0.95:13.3:0 9.75 penetr20.3 20 20 UF 4 1:0.95:13.3:0 9.75 penetr20.3 20 20 UF 4 1:0.95:13.3:0 9.75 penetr20.3 20 20 UF 4 1:0.95:13.3:0 9.75 penetr20.3 20 20 UF 4 1:0.95:13.3:0 9.75 penetr20.1 857 120 20 20 UF 4 1:0.95:13.3:0 9.75 penetr20.2 830 120 20 20 UF 4 1:0.95:13.3:0 9.75 penetr20.1 500 857 9 20 20 UF 4 1:0.95:13.3:0 9.75 penetr20.2 500 830 9 20 20 UF 4 1:0.95:13.3:0 9.75 penetr20.3 20 20 UF 4 1:0.95:13.3:0 9.75 penetr21.1 40 10 20 5.1 UF 4 1:0.95:13.3:0 10 penetr21.1 200 15 20 5.1 UF 4 1:0.95:13.3:0 10 penetr21.1 1600 20 20 5.1 UF 4 1:0.95:13.3:0 10 penetr21.1 20 5.1 UF 4 1:0.95:13.3:0 10 penetr21.2 56 10 20 5.1 UF 4 1:0.95:13.3:0 10 penetr21.2 288 15 20 5.1 UF 4 1:0.95:13.3:0 10 penetr21.2 1520 20 20 5.1 UF 4 1:0.95:13.3:0 10

ERD
C TR-14-10
82
Sample PenRes_(psi) 2hr_UCS_(psi) SetTime_(min) Time_elaps_(min) Nom_Temp_C Water Temp Mixture water_lb ratio_mix Slump penetr21.2 20 5.1 UF 4 1:0.95:13.3:0 10 penetr21.3 20 5.1 UF 4 1:0.95:13.3:0 10 penetr21.3 20 5.1 UF 4 1:0.95:13.3:0 10 penetr21.3 20 5.1 UF 4 1:0.95:13.3:0 10 penetr21.3 20 5.1 UF 4 1:0.95:13.3:0 10 penetr21.1 1245 120 20 5.1 UF 4 1:0.95:13.3:0 10 penetr21.2 822 120 20 5.1 UF 4 1:0.95:13.3:0 10 penetr21.1 500 1245 17.5 20 5.1 UF 4 1:0.95:13.3:0 10 penetr21.2 500 822 15 20 5.1 UF 4 1:0.95:13.3:0 10 penetr21.3 20 5.1 UF 4 1:0.95:13.3:0 10 penetr22.1 0 15 20 20 RapSet 7.1 1:0.37:13.3:0 9 penetr22.1 0 20 20 20 RapSet 7.1 1:0.37:13.3:0 9 penetr22.1 16 25 20 20 RapSet 7.1 1:0.37:13.3:0 9 penetr22.1 24 30 20 20 RapSet 7.1 1:0.37:13.3:0 9 penetr22.2 0 15 20 20 RapSet 7.1 1:0.37:13.3:0 9 penetr22.2 0 20 20 20 RapSet 7.1 1:0.37:13.3:0 9 penetr22.2 16 25 20 20 RapSet 7.1 1:0.37:13.3:0 9 penetr22.2 30 20 20 RapSet 7.1 1:0.37:13.3:0 9 penetr22.3 20 20 RapSet 7.1 1:0.37:13.3:0 9 penetr22.3 20 20 RapSet 7.1 1:0.37:13.3:0 9 penetr22.3 20 20 RapSet 7.1 1:0.37:13.3:0 9 penetr22.3 20 20 RapSet 7.1 1:0.37:13.3:0 9 penetr22.1 4896 120 20 20 RapSet 7.1 1:0.37:13.3:0 9 penetr22.2 4784 120 20 20 RapSet 7.1 1:0.37:13.3:0 9 penetr22.1 500 4896 35 20 20 RapSet 7.1 1:0.37:13.3:0 9 penetr22.2 500 4784 35 20 20 RapSet 7.1 1:0.37:13.3:0 9 penetr22.3 20 20 RapSet 7.1 1:0.37:13.3:0 9 penetr23.1 0 30 0 60 RapSet 7.1 1:0.37:13.3:0 9

ERD
C TR-14-10
83
Sample PenRes_(psi) 2hr_UCS_(psi) SetTime_(min) Time_elaps_(min) Nom_Temp_C Water Temp Mixture water_lb ratio_mix Slump penetr23.1 0 45 0 60 RapSet 7.1 1:0.37:13.3:0 9 penetr23.1 0 55 0 60 RapSet 7.1 1:0.37:13.3:0 9 penetr23.1 0 60 RapSet 7.1 1:0.37:13.3:0 9 penetr23.2 0 30 0 60 RapSet 7.1 1:0.37:13.3:0 9 penetr23.2 0 45 0 60 RapSet 7.1 1:0.37:13.3:0 9 penetr23.2 0 55 0 60 RapSet 7.1 1:0.37:13.3:0 9 penetr23.2 0 60 RapSet 7.1 1:0.37:13.3:0 9 penetr23.3 0 60 RapSet 7.1 1:0.37:13.3:0 9 penetr23.3 0 60 RapSet 7.1 1:0.37:13.3:0 9 penetr23.3 0 60 RapSet 7.1 1:0.37:13.3:0 9 penetr23.3 0 60 RapSet 7.1 1:0.37:13.3:0 9 penetr23.1 3780 120 0 60 RapSet 7.1 1:0.37:13.3:0 9 penetr23.2 3758 120 0 60 RapSet 7.1 1:0.37:13.3:0 9 penetr23.1 500 3780 80 0 60 RapSet 7.1 1:0.37:13.3:0 9 penetr23.2 500 3758 80 0 60 RapSet 7.1 1:0.37:13.3:0 9 penetr23.3 500 80 0 60 RapSet 7.1 1:0.37:13.3:0 9 penetr24.1 0 15 0 90 RapSet 7.1 1:0.37:13.3:0 8.5 penetr24.1 0 20 0 90 RapSet 7.1 1:0.37:13.3:0 8.5 penetr24.1 800 30 0 90 RapSet 7.1 1:0.37:13.3:0 8.5 penetr24.1 35 0 90 RapSet 7.1 1:0.37:13.3:0 8.5 penetr24.2 0 15 0 90 RapSet 7.1 1:0.37:13.3:0 8.5 penetr24.2 0 20 0 90 RapSet 7.1 1:0.37:13.3:0 8.5 penetr24.2 24 30 0 90 RapSet 7.1 1:0.37:13.3:0 8.5 penetr24.2 56 35 0 90 RapSet 7.1 1:0.37:13.3:0 8.5 penetr24.3 0 90 RapSet 7.1 1:0.37:13.3:0 8.5 penetr24.3 0 90 RapSet 7.1 1:0.37:13.3:0 8.5 penetr24.3 0 90 RapSet 7.1 1:0.37:13.3:0 8.5 penetr24.3 0 90 RapSet 7.1 1:0.37:13.3:0 8.5

ERD
C TR-14-10
84
Sample PenRes_(psi) 2hr_UCS_(psi) SetTime_(min) Time_elaps_(min) Nom_Temp_C Water Temp Mixture water_lb ratio_mix Slump penetr24.1 4428 120 0 90 RapSet 7.1 1:0.37:13.3:0 8.5 penetr24.2 4417 120 0 90 RapSet 7.1 1:0.37:13.3:0 8.5 penetr24.1 500 4428 25 0 90 RapSet 7.1 1:0.37:13.3:0 8.5 penetr24.2 500 4417 60 0 90 RapSet 7.1 1:0.37:13.3:0 8.5 penetr24.3 0 90 RapSet 7.1 1:0.37:13.3:0 8.5 penetr25.1 0 15 10 20 RapSet 8 1:0.41:13.3:0 8.5 penetr25.1 0 25 10 20 RapSet 8 1:0.41:13.3:0 8.5 penetr25.1 16 35 10 20 RapSet 8 1:0.41:13.3:0 8.5 penetr25.1 32 45 10 20 RapSet 8 1:0.41:13.3:0 8.5 penetr25.2 0 15 10 20 RapSet 8 1:0.41:13.3:0 8.5 penetr25.2 0 25 10 20 RapSet 8 1:0.41:13.3:0 8.5 penetr25.2 0 35 10 20 RapSet 8 1:0.41:13.3:0 8.5 penetr25.2 24 45 10 20 RapSet 8 1:0.41:13.3:0 8.5 penetr25.3 10 20 RapSet 8 1:0.41:13.3:0 8.5 penetr25.3 10 20 RapSet 8 1:0.41:13.3:0 8.5 penetr25.3 10 20 RapSet 8 1:0.41:13.3:0 8.5 penetr25.3 10 20 RapSet 8 1:0.41:13.3:0 8.5 penetr25.1 3860 120 10 20 RapSet 8 1:0.41:13.3:0 8.5 penetr25.2 3871 120 10 20 RapSet 8 1:0.41:13.3:0 8.5 penetr25.1 500 3860 70 10 20 RapSet 8 1:0.41:13.3:0 8.5 penetr25.2 500 3871 70 10 20 RapSet 8 1:0.41:13.3:0 8.5 penetr25.3 10 20 RapSet 8 1:0.41:13.3:0 8.5 penetr26.1 16 15 10 60 RapSet 6.8 1:0.35:13.3:0 5 penetr26.1 120 20 10 60 RapSet 6.8 1:0.35:13.3:0 5 penetr26.1 800 25 10 60 RapSet 6.8 1:0.35:13.3:0 5 penetr26.1 35 10 60 RapSet 6.8 1:0.35:13.3:0 5 penetr26.2 72 15 10 60 RapSet 6.8 1:0.35:13.3:0 5 penetr26.2 800 20 10 60 RapSet 6.8 1:0.35:13.3:0 5

ERD
C TR-14-10
85
Sample PenRes_(psi) 2hr_UCS_(psi) SetTime_(min) Time_elaps_(min) Nom_Temp_C Water Temp Mixture water_lb ratio_mix Slump penetr26.2 25 10 60 RapSet 6.8 1:0.35:13.3:0 5 penetr26.2 35 10 60 RapSet 6.8 1:0.35:13.3:0 5 penetr26.3 10 60 RapSet 6.8 1:0.35:13.3:0 5 penetr26.3 10 60 RapSet 6.8 1:0.35:13.3:0 5 penetr26.3 10 60 RapSet 6.8 1:0.35:13.3:0 5 penetr26.3 10 60 RapSet 6.8 1:0.35:13.3:0 5 penetr26.1 4899 120 10 60 RapSet 6.8 1:0.35:13.3:0 5 penetr26.2 4334 120 10 60 RapSet 6.8 1:0.35:13.3:0 5 penetr26.1 500 4899 30 10 60 RapSet 6.8 1:0.35:13.3:0 5 penetr26.2 500 4334 30 10 60 RapSet 6.8 1:0.35:13.3:0 5 penetr26.3 10 60 RapSet 6.8 1:0.35:13.3:0 5 penetr27.1 15 -5 90 RapSet 6.6 1:0.34:13.3:0 4.75 penetr27.1 20 -5 90 RapSet 6.6 1:0.34:13.3:0 4.75 penetr27.1 30 -5 90 RapSet 6.6 1:0.34:13.3:0 4.75 penetr27.1 40 -5 90 RapSet 6.6 1:0.34:13.3:0 4.75 penetr27.2 15 -5 90 RapSet 6.6 1:0.34:13.3:0 4.75 penetr27.2 20 -5 90 RapSet 6.6 1:0.34:13.3:0 4.75 penetr27.2 30 -5 90 RapSet 6.6 1:0.34:13.3:0 4.75 penetr27.2 40 -5 90 RapSet 6.6 1:0.34:13.3:0 4.75 penetr27.3 -5 90 RapSet 6.6 1:0.34:13.3:0 4.75 penetr27.3 -5 90 RapSet 6.6 1:0.34:13.3:0 4.75 penetr27.3 -5 90 RapSet 6.6 1:0.34:13.3:0 4.75 penetr27.3 -5 90 RapSet 6.6 1:0.34:13.3:0 4.75 penetr27.1 >3500 120 -5 90 RapSet 6.6 1:0.34:13.3:0 4.75 penetr27.2 -5 90 RapSet 6.6 1:0.34:13.3:0 4.75 penetr27.1 500 >3500 42.5 -5 90 RapSet 6.6 1:0.34:13.3:0 4.75 penetr27.2 500 35 -5 90 RapSet 6.6 1:0.34:13.3:0 4.75 penetr27.3 -5 90 RapSet 6.6 1:0.34:13.3:0 4.75

ERD
C TR-14-10
86
Table A7. Aluminum Sulfate Rapid Set Test Phase (task 3). All tests listed are using 60 lb dry Rapid Set mix. Admixture type (if used) is Aluminum Sulfate.
Sample PenRes_
(psi) 2hr_UCS_
(psi) SetTime_
(min) Time_elaps_
(min) Admix_
wt_g Admix_% (wt.cem)
Nom_Temp_C
water_ lb ratio_mix Slump Train Test
penetr1.1 8 15 0 0.0% 20 7.1 1:0.37:1:1.1 4 1 0 penetr1.1 48 25 0 0.0% 20 7.1 1:0.37:1:1.1 4 1 0 penetr1.1 800 35 0 0.0% 20 7.1 1:0.37:1:1.1 4 1 0 penetr1.1 0 0 0 0.0% 20 7.1 1:0.37:1:1.1 4 1 0 penetr1.2 0 15 0 0.0% 20 7.1 1:0.37:1:1.1 4 1 0 penetr1.2 52 25 0 0.0% 20 7.1 1:0.37:1:1.1 4 0 1 penetr1.2 800 35 0 0.0% 20 7.1 1:0.37:1:1.1 4 1 0 penetr1.2 0 0.0% 20 7.1 1:0.37:1:1.1 4 1 0 penetr1.3 0 0.0% 20 7.1 1:0.37:1:1.1 4 1 0 penetr1.3 0 0.0% 20 7.1 1:0.37:1:1.1 4 1 0 penetr1.3 0 0.0% 20 7.1 1:0.37:1:1.1 4 1 0 penetr1.3 0 0.0% 20 7.1 1:0.37:1:1.1 4 0 1 penetr1.1 4858 115 0 0.0% 20 7.1 1:0.37:1:1.1 4 1 0 penetr1.2 4958 120 0 0.0% 20 7.1 1:0.37:1:1.1 4 0 1 penetr1.3 4970 125 0 0.0% 20 7.1 1:0.37:1:1.1 4 0 1 penetr1.1 500 4858 30 0 0.0% 20 7.1 1:0.37:1:1.1 4 0 1 penetr1.2 500 4970 30 0 0.0% 20 7.1 1:0.37:1:1.1 4 1 0 penetr1.3 0 0.0% 20 7.1 1:0.37:1:1.1 4 1 0 penetr2.1 0 15 0 0.0% 20 8.1 1:0.42:1:1.1 6 1 0 penetr2.1 24 20 0 0.0% 20 8.1 1:0.42:1:1.1 6 1 0 penetr2.1 264 30 0 0.0% 20 8.1 1:0.42:1:1.1 6 1 0 penetr2.1 8000 35 0 0.0% 20 8.1 1:0.42:1:1.1 6 1 0 penetr2.2 0 15 0 0.0% 20 8.1 1:0.42:1:1.1 6 0 1 penetr2.2 28 20 0 0.0% 20 8.1 1:0.42:1:1.1 6 1 0 penetr2.2 800 30 0 0.0% 20 8.1 1:0.42:1:1.1 6 1 0 penetr2.2 8000 35 0 0.0% 20 8.1 1:0.42:1:1.1 6 1 0

ERD
C TR-14-10
87
Sample PenRes_
(psi) 2hr_UCS_
(psi) SetTime_
(min) Time_elaps_
(min) Admix_
wt_g Admix_% (wt.cem)
Nom_Temp_C
water_ lb ratio_mix Slump Train Test
penetr2.3 0 15 0 0.0% 20 8.1 1:0.42:1:1.1 6 1 0 penetr2.3 32 20 0 0.0% 20 8.1 1:0.42:1:1.1 6 1 0 penetr2.3 504 30 0 0.0% 20 8.1 1:0.42:1:1.1 6 1 0 penetr2.3 8000 35 0 0.0% 20 8.1 1:0.42:1:1.1 6 1 0 penetr2.1 5399 120 0 0.0% 20 8.1 1:0.42:1:1.1 6 1 0 penetr2.2 5292 120 0 0.0% 20 8.1 1:0.42:1:1.1 6 1 0 penetr2.3 0 0.0% 20 8.1 1:0.42:1:1.1 6 1 0 penetr2.1 500 5399 32.5 0 0.0% 20 8.1 1:0.42:1:1.1 6 1 0 penetr2.2 500 5292 25 0 0.0% 20 8.1 1:0.42:1:1.1 6 1 0 penetr2.3 500 30 0 0.0% 20 8.1 1:0.42:1:1.1 6 1 0 penetr3.1 0 15 0 0.0% 20 8.1 1:0.44:1.1:1.2 9 1 0 penetr3.1 0 20 0 0.0% 20 8.1 1:0.44:1.1:1.2 9 0 1 penetr3.1 40 35 0 0.0% 20 8.1 1:0.44:1.1:1.2 9 1 0 penetr3.1 800 40 0 0.0% 20 8.1 1:0.44:1.1:1.2 9 1 0 penetr3.2 0 15 0 0.0% 20 8.1 1:0.44:1.1:1.2 9 1 0 penetr3.2 0 20 0 0.0% 20 8.1 1:0.44:1.1:1.2 9 0 1 penetr3.2 40 35 0 0.0% 20 8.1 1:0.44:1.1:1.2 9 1 0 penetr3.2 800 40 0 0.0% 20 8.1 1:0.44:1.1:1.2 9 1 0 penetr3.3 0 15 0 0.0% 20 8.1 1:0.44:1.1:1.2 9 1 0 penetr3.3 0 20 0 0.0% 20 8.1 1:0.44:1.1:1.2 9 1 0 penetr3.3 40 35 0 0.0% 20 8.1 1:0.44:1.1:1.2 9 0 1 penetr3.3 800 40 0 0.0% 20 8.1 1:0.44:1.1:1.2 9 1 0 penetr3.1 4529 120 0 0.0% 20 8.1 1:0.44:1.1:1.2 9 0 1 penetr3.2 4685 120 0 0.0% 20 8.1 1:0.44:1.1:1.2 9 1 0 penetr3.3 4562 125 0 0.0% 20 8.1 1:0.44:1.1:1.2 9 1 0 penetr3.1 500 4529 37.5 0 0.0% 20 8.1 1:0.44:1.1:1.2 9 0 1 penetr3.2 500 4685 37.5 0 0.0% 20 8.1 1:0.44:1.1:1.2 9 1 0

ERD
C TR-14-10
88
Sample PenRes_
(psi) 2hr_UCS_
(psi) SetTime_
(min) Time_elaps_
(min) Admix_
wt_g Admix_% (wt.cem)
Nom_Temp_C
water_ lb ratio_mix Slump Train Test
penetr3.3 500 4562 37.5 0 0.0% 20 8.1 1:0.44:1.1:1.2 9 1 0 penetr4.1 8 15 0 0.0% 20 8.1 1:0.4:0.9:1 6.5 1 0 penetr4.1 40 20 0 0.0% 20 8.1 1:0.4:0.9:1 6.5 1 0 penetr4.1 104 25 0 0.0% 20 8.1 1:0.4:0.9:1 6.5 1 0 penetr4.1 800 30 0 0.0% 20 8.1 1:0.4:0.9:1 6.5 1 0 penetr4.2 8 15 0 0.0% 20 8.1 1:0.4:0.9:1 6.5 1 0 penetr4.2 40 20 0 0.0% 20 8.1 1:0.4:0.9:1 6.5 0 1 penetr4.2 108 25 0 0.0% 20 8.1 1:0.4:0.9:1 6.5 1 0 penetr4.2 800 30 0 0.0% 20 8.1 1:0.4:0.9:1 6.5 1 0 penetr4.3 0 0 0 0.0% 20 8.1 1:0.4:0.9:1 6.5 0 1 penetr4.3 0 0 0 0.0% 20 8.1 1:0.4:0.9:1 6.5 0 1 penetr4.3 0 0 0 0.0% 20 8.1 1:0.4:0.9:1 6.5 1 0 penetr4.3 0 0 0 0.0% 20 8.1 1:0.4:0.9:1 6.5 1 0 penetr4.1 5192 120 0 0.0% 20 8.1 1:0.4:0.9:1 6.5 1 0 penetr4.2 5572 120 0 0.0% 20 8.1 1:0.4:0.9:1 6.5 1 0 penetr4.3 5181 125 0 0.0% 20 8.1 1:0.4:0.9:1 6.5 1 0 penetr4.1 500 5181 27.5 0 0.0% 20 8.1 1:0.4:0.9:1 6.5 1 0 penetr4.2 500 5572 27.5 0 0.0% 20 8.1 1:0.4:0.9:1 6.5 1 0 penetr4.3 0 0.0% 20 8.1 1:0.4:0.9:1 6.5 1 0 penetr4.1.1 0 15 100 0.0% 20 8.1 1:0.42:1:1.1 6.5 0 1 penetr4.1.1 5840 20 100 0.0% 20 8.1 1:0.42:1:1.1 6.5 1 0 penetr4.1.1 0 0 100 0.0% 20 8.1 1:0.42:1:1.1 6.5 1 0 penetr4.1.1 0 0 100 0.0% 20 8.1 1:0.42:1:1.1 6.5 0 1 penetr4.1.2 0 15 100 0.0% 20 8.1 1:0.42:1:1.1 6.5 0 1 penetr4.1.2 4160 20 100 0.0% 20 8.1 1:0.42:1:1.1 6.5 1 0 penetr4.1.2 0 0 100 0.0% 20 8.1 1:0.42:1:1.1 6.5 1 0 penetr4.1.2 0 0 100 0.0% 20 8.1 1:0.42:1:1.1 6.5 1 0

ERD
C TR-14-10
89
Sample PenRes_
(psi) 2hr_UCS_
(psi) SetTime_
(min) Time_elaps_
(min) Admix_
wt_g Admix_% (wt.cem)
Nom_Temp_C
water_ lb ratio_mix Slump Train Test
penetr4.1.3 0 0 100 0.0% 20 8.1 1:0.42:1:1.1 6.5 0 1 penetr4.1.3 0 0 100 0.0% 20 8.1 1:0.42:1:1.1 6.5 0 1 penetr4.1.3 0 0 100 0.0% 20 8.1 1:0.42:1:1.1 6.5 1 0 penetr4.1.3 0 0 100 0.0% 20 8.1 1:0.42:1:1.1 6.5 1 0 penetr4.1.1 3757 100 0.0% 20 8.1 1:0.42:1:1.1 6.5 1 0 penetr4.1.2 3645 100 0.0% 20 8.1 1:0.42:1:1.1 6.5 1 0 penetr4.1.3 3489 100 0.0% 20 8.1 1:0.42:1:1.1 6.5 1 0 penetr4.1.1 500 3757 17.5 100 0.0% 20 8.1 1:0.42:1:1.1 6.5 0 1 penetr4.1.2 500 3489 17.5 100 0.0% 20 8.1 1:0.42:1:1.1 6.5 0 1 penetr4.1.3 100 0.0% 20 8.1 1:0.42:1:1.1 6.5 1 0 penetr5.1 0 25 101 1.2% 5 8.1 1:0.42:1:1.1 8 1 0 penetr5.1 0 35 101 1.2% 5 8.1 1:0.42:1:1.1 8 1 0 penetr5.1 16 40 101 1.2% 5 8.1 1:0.42:1:1.1 8 0 1 penetr5.1 800 63 101 1.2% 5 8.1 1:0.42:1:1.1 8 1 0 penetr5.2 0 25 101 1.2% 5 8.1 1:0.42:1:1.1 8 1 0 penetr5.2 0 35 101 1.2% 5 8.1 1:0.42:1:1.1 8 1 0 penetr5.2 20 40 101 1.2% 5 8.1 1:0.42:1:1.1 8 1 0 penetr5.2 800 63 101 1.2% 5 8.1 1:0.42:1:1.1 8 1 0 penetr5.3 0 25 101 1.2% 5 8.1 1:0.42:1:1.1 8 1 0 penetr5.3 0 35 101 1.2% 5 8.1 1:0.42:1:1.1 8 1 0 penetr5.3 24 55 101 1.2% 5 8.1 1:0.42:1:1.1 8 0 1 penetr5.3 800 63 101 1.2% 5 8.1 1:0.42:1:1.1 8 1 0 penetr5.1 3452 101 1.2% 5 8.1 1:0.42:1:1.1 8 1 0 penetr5.2 3160 101 1.2% 5 8.1 1:0.42:1:1.1 8 1 0 penetr5.3 101 1.2% 5 8.1 1:0.42:1:1.1 8 0 1 penetr5.1 500 3452 51.5 101 1.2% 5 8.1 1:0.42:1:1.1 8 0 1 penetr5.2 500 3160 51.5 101 1.2% 5 8.1 1:0.42:1:1.1 8 1 0

ERD
C TR-14-10
90
Sample PenRes_
(psi) 2hr_UCS_
(psi) SetTime_
(min) Time_elaps_
(min) Admix_
wt_g Admix_% (wt.cem)
Nom_Temp_C
water_ lb ratio_mix Slump Train Test
penetr5.3 500 59 101 1.2% 5 8.1 1:0.42:1:1.1 8 1 0 penetr5.1.1 0 15 202 2.3% 5 7.1 1:0.37:1:1.1 4.75 1 0 penetr5.1.1 16 25 202 2.3% 5 7.1 1:0.37:1:1.1 4.75 1 0 penetr5.1.1 152 30 202 2.3% 5 7.1 1:0.37:1:1.1 4.75 0 1 penetr5.1.1 8000 32 202 2.3% 5 7.1 1:0.37:1:1.1 4.75 0 1 penetr5.1.2 0 15 202 2.3% 5 7.1 1:0.37:1:1.1 4.75 1 0 penetr5.1.2 16 25 202 2.3% 5 7.1 1:0.37:1:1.1 4.75 1 0 penetr5.1.2 144 30 202 2.3% 5 7.1 1:0.37:1:1.1 4.75 0 1 penetr5.1.2 80 32 202 2.3% 5 7.1 1:0.37:1:1.1 4.75 1 0 penetr5.1.3 0 15 202 2.3% 5 7.1 1:0.37:1:1.1 4.75 1 0 penetr5.1.3 40 25 202 2.3% 5 7.1 1:0.37:1:1.1 4.75 1 0 penetr5.1.3 800 30 202 2.3% 5 7.1 1:0.37:1:1.1 4.75 1 0 penetr5.1.3 0 0 202 2.3% 5 7.1 1:0.37:1:1.1 4.75 0 1 penetr5.1.1 3441 120 202 2.3% 5 7.1 1:0.37:1:1.1 4.75 1 0 penetr5.1.2 3497 120 202 2.3% 5 7.1 1:0.37:1:1.1 4.75 0 1 penetr5.1.3 202 2.3% 5 7.1 1:0.37:1:1.1 4.75 1 0 penetr5.1.1 500 3441 31 202 2.3% 5 7.1 1:0.37:1:1.1 4.75 0 1 penetr5.1.2 202 2.3% 5 7.1 1:0.37:1:1.1 4.75 1 0 penetr5.1.3 500 3497 27.5 202 2.3% 5 7.1 1:0.37:1:1.1 4.75 1 0 penetr5.2.1 0 15 300 3.4% 5 9.1 1:0.47:1:1.1 3.5 1 0 penetr5.2.1 800 20 300 3.4% 5 9.1 1:0.47:1:1.1 3.5 1 0 penetr5.2.1 5600 21 300 3.4% 5 9.1 1:0.47:1:1.1 3.5 1 0 penetr5.2.1 0 0 300 3.4% 5 9.1 1:0.47:1:1.1 3.5 1 0 penetr5.2.2 0 15 300 3.4% 5 9.1 1:0.47:1:1.1 3.5 1 0 penetr5.2.2 800 20 300 3.4% 5 9.1 1:0.47:1:1.1 3.5 1 0 penetr5.2.2 7200 21 300 3.4% 5 9.1 1:0.47:1:1.1 3.5 1 0 penetr5.2.2 0 0 300 3.4% 5 9.1 1:0.47:1:1.1 3.5 0 1

ERD
C TR-14-10
91
Sample PenRes_
(psi) 2hr_UCS_
(psi) SetTime_
(min) Time_elaps_
(min) Admix_
wt_g Admix_% (wt.cem)
Nom_Temp_C
water_ lb ratio_mix Slump Train Test
penetr5.2.3 0 15 300 3.4% 5 9.1 1:0.47:1:1.1 3.5 1 0 penetr5.2.3 800 20 300 3.4% 5 9.1 1:0.47:1:1.1 3.5 1 0 penetr5.2.3 6400 21 300 3.4% 5 9.1 1:0.47:1:1.1 3.5 1 0 penetr5.2.3 0 0 300 3.4% 5 9.1 1:0.47:1:1.1 3.5 1 0 penetr5.2.1 2883 300 3.4% 5 9.1 1:0.47:1:1.1 3.5 1 0 penetr5.2.2 2749 300 3.4% 5 9.1 1:0.47:1:1.1 3.5 0 1 penetr5.2.3 300 3.4% 5 9.1 1:0.47:1:1.1 3.5 1 0 penetr5.2.1 500 2883 17.5 300 3.4% 5 9.1 1:0.47:1:1.1 3.5 1 0 penetr5.2.2 2749 17.5 300 3.4% 5 9.1 1:0.47:1:1.1 3.5 1 0 penetr5.2.3 500 17.5 300 3.4% 5 9.1 1:0.47:1:1.1 3.5 1 0 penetr6.1 0 45 160 1.8% 5 9.1 1:0.47:1:1.1 5 1 0 penetr6.1 0 55 160 1.8% 5 9.1 1:0.47:1:1.1 5 0 1 penetr6.1 16 60 160 1.8% 5 9.1 1:0.47:1:1.1 5 0 1 penetr6.1 624 70 160 1.8% 5 9.1 1:0.47:1:1.1 5 1 0 penetr6.2 0 45 160 1.8% 5 9.1 1:0.47:1:1.1 5 1 0 penetr6.2 0 55 160 1.8% 5 9.1 1:0.47:1:1.1 5 0 1 penetr6.2 16 60 160 1.8% 5 9.1 1:0.47:1:1.1 5 1 0 penetr6.2 40 70 160 1.8% 5 9.1 1:0.47:1:1.1 5 1 0 penetr6.3 0 45 160 1.8% 5 9.1 1:0.47:1:1.1 5 1 0 penetr6.3 16 55 160 1.8% 5 9.1 1:0.47:1:1.1 5 1 0 penetr6.3 24 60 160 1.8% 5 9.1 1:0.47:1:1.1 5 1 0 penetr6.3 160 70 160 1.8% 5 9.1 1:0.47:1:1.1 5 1 0 penetr6.1 4183 120 160 1.8% 5 9.1 1:0.47:1:1.1 5 1 0 penetr6.2 3952 120 160 1.8% 5 9.1 1:0.47:1:1.1 5 0 1 penetr6.3 3627 125 160 1.8% 5 9.1 1:0.47:1:1.1 5 1 0 penetr6.1 500 4183 65 160 1.8% 5 9.1 1:0.47:1:1.1 5 1 0 penetr6.2 500 3952 71.5 160 1.8% 5 9.1 1:0.47:1:1.1 5 0 1
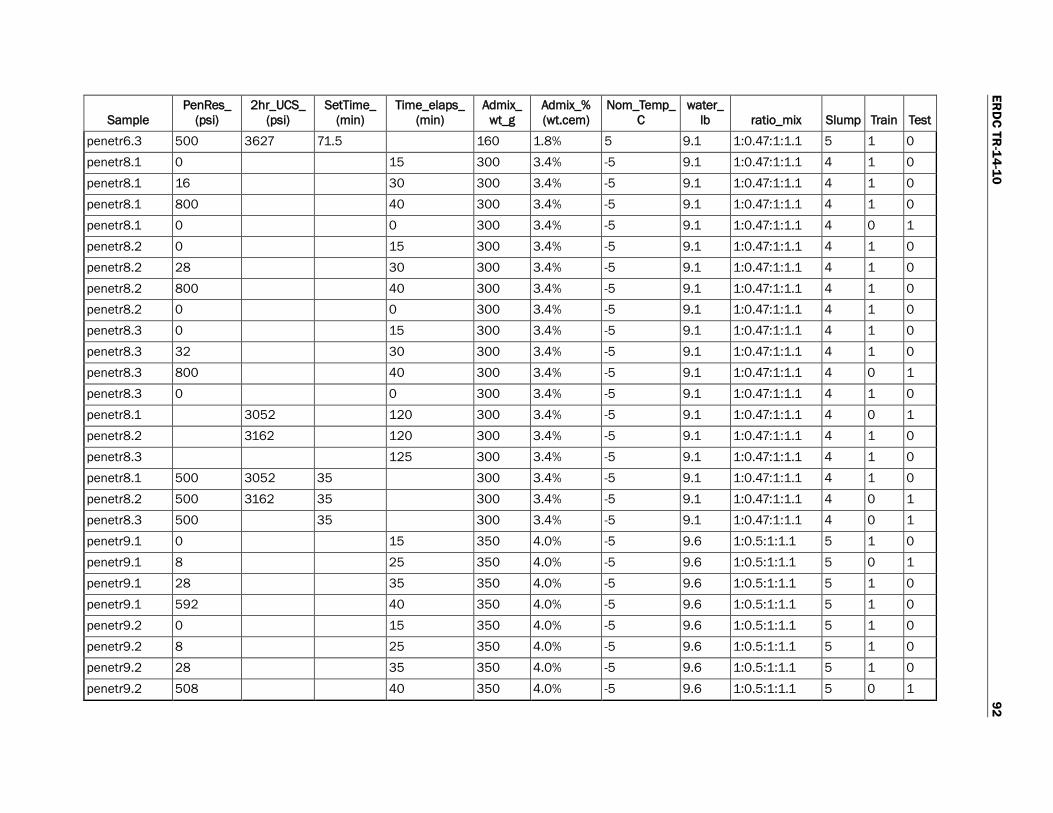
ERD
C TR-14-10
92
Sample PenRes_
(psi) 2hr_UCS_
(psi) SetTime_
(min) Time_elaps_
(min) Admix_
wt_g Admix_% (wt.cem)
Nom_Temp_C
water_ lb ratio_mix Slump Train Test
penetr6.3 500 3627 71.5 160 1.8% 5 9.1 1:0.47:1:1.1 5 1 0 penetr8.1 0 15 300 3.4% -5 9.1 1:0.47:1:1.1 4 1 0 penetr8.1 16 30 300 3.4% -5 9.1 1:0.47:1:1.1 4 1 0 penetr8.1 800 40 300 3.4% -5 9.1 1:0.47:1:1.1 4 1 0 penetr8.1 0 0 300 3.4% -5 9.1 1:0.47:1:1.1 4 0 1 penetr8.2 0 15 300 3.4% -5 9.1 1:0.47:1:1.1 4 1 0 penetr8.2 28 30 300 3.4% -5 9.1 1:0.47:1:1.1 4 1 0 penetr8.2 800 40 300 3.4% -5 9.1 1:0.47:1:1.1 4 1 0 penetr8.2 0 0 300 3.4% -5 9.1 1:0.47:1:1.1 4 1 0 penetr8.3 0 15 300 3.4% -5 9.1 1:0.47:1:1.1 4 1 0 penetr8.3 32 30 300 3.4% -5 9.1 1:0.47:1:1.1 4 1 0 penetr8.3 800 40 300 3.4% -5 9.1 1:0.47:1:1.1 4 0 1 penetr8.3 0 0 300 3.4% -5 9.1 1:0.47:1:1.1 4 1 0 penetr8.1 3052 120 300 3.4% -5 9.1 1:0.47:1:1.1 4 0 1 penetr8.2 3162 120 300 3.4% -5 9.1 1:0.47:1:1.1 4 1 0 penetr8.3 125 300 3.4% -5 9.1 1:0.47:1:1.1 4 1 0 penetr8.1 500 3052 35 300 3.4% -5 9.1 1:0.47:1:1.1 4 1 0 penetr8.2 500 3162 35 300 3.4% -5 9.1 1:0.47:1:1.1 4 0 1 penetr8.3 500 35 300 3.4% -5 9.1 1:0.47:1:1.1 4 0 1 penetr9.1 0 15 350 4.0% -5 9.6 1:0.5:1:1.1 5 1 0 penetr9.1 8 25 350 4.0% -5 9.6 1:0.5:1:1.1 5 0 1 penetr9.1 28 35 350 4.0% -5 9.6 1:0.5:1:1.1 5 1 0 penetr9.1 592 40 350 4.0% -5 9.6 1:0.5:1:1.1 5 1 0 penetr9.2 0 15 350 4.0% -5 9.6 1:0.5:1:1.1 5 1 0 penetr9.2 8 25 350 4.0% -5 9.6 1:0.5:1:1.1 5 1 0 penetr9.2 28 35 350 4.0% -5 9.6 1:0.5:1:1.1 5 1 0 penetr9.2 508 40 350 4.0% -5 9.6 1:0.5:1:1.1 5 0 1

ERD
C TR-14-10
93
Sample PenRes_
(psi) 2hr_UCS_
(psi) SetTime_
(min) Time_elaps_
(min) Admix_
wt_g Admix_% (wt.cem)
Nom_Temp_C
water_ lb ratio_mix Slump Train Test
penetr9.3 0 15 350 4.0% -5 9.6 1:0.5:1:1.1 5 1 0 penetr9.3 8 25 350 4.0% -5 9.6 1:0.5:1:1.1 5 0 1 penetr9.3 32 35 350 4.0% -5 9.6 1:0.5:1:1.1 5 1 0 penetr9.3 544 40 350 4.0% -5 9.6 1:0.5:1:1.1 5 1 0 penetr9.1 3757 120 350 4.0% -5 9.6 1:0.5:1:1.1 5 1 0 penetr9.2 3645 120 350 4.0% -5 9.6 1:0.5:1:1.1 5 1 0 penetr9.3 125 350 4.0% -5 9.6 1:0.5:1:1.1 5 1 0 penetr9.1 500 3757 37.5 350 4.0% -5 9.6 1:0.5:1:1.1 5 1 0 penetr9.2 500 3645 40 350 4.0% -5 9.6 1:0.5:1:1.1 5 1 0 penetr9.3 350 4.0% -5 9.6 1:0.5:1:1.1 5 1 0 penetr10.1 40 10 500 5.7% -5 10.1 1:0.52:1:1.1 1 1 0 penetr10.1 248 13 500 5.7% -5 10.1 1:0.52:1:1.1 1 1 0 penetr10.1 800 15 500 5.7% -5 10.1 1:0.52:1:1.1 1 1 0 penetr10.1 0 0 500 5.7% -5 10.1 1:0.52:1:1.1 1 1 0 penetr10.2 81 10 500 5.7% -5 10.1 1:0.52:1:1.1 1 1 0 penetr10.2 800 13 500 5.7% -5 10.1 1:0.52:1:1.1 1 1 0 penetr10.2 0 0 500 5.7% -5 10.1 1:0.52:1:1.1 1 1 0 penetr10.2 0 0 500 5.7% -5 10.1 1:0.52:1:1.1 1 1 0 penetr10.3 0 0 500 5.7% -5 10.1 1:0.52:1:1.1 1 1 0 penetr10.3 0 0 500 5.7% -5 10.1 1:0.52:1:1.1 1 0 1 penetr10.3 0 0 500 5.7% -5 10.1 1:0.52:1:1.1 1 1 0 penetr10.3 0 0 500 5.7% -5 10.1 1:0.52:1:1.1 1 1 0 penetr10.1 3286 500 5.7% -5 10.1 1:0.52:1:1.1 1 1 0 penetr10.2 3371 500 5.7% -5 10.1 1:0.52:1:1.1 1 1 0 penetr10.3 500 5.7% -5 10.1 1:0.52:1:1.1 1 1 0 penetr10.1 500 3286 14 500 5.7% -5 10.1 1:0.52:1:1.1 1 1 0 penetr10.2 500 3371 11.5 500 5.7% -5 10.1 1:0.52:1:1.1 1 1 0

ERD
C TR-14-10
94
Sample PenRes_
(psi) 2hr_UCS_
(psi) SetTime_
(min) Time_elaps_
(min) Admix_
wt_g Admix_% (wt.cem)
Nom_Temp_C
water_ lb ratio_mix Slump Train Test
penetr10.3 500 500 5.7% -5 10.1 1:0.52:1:1.1 1 1 0 penetr11.1 0 15 450 5.1% -10 8.6 1:0.44:1:1.1 1.5 1 0 penetr11.1 16 20 450 5.1% -10 8.6 1:0.44:1:1.1 1.5 1 0 penetr11.1 200 35 450 5.1% -10 8.6 1:0.44:1:1.1 1.5 1 0 penetr11.1 8000 45 450 5.1% -10 8.6 1:0.44:1:1.1 1.5 1 0 penetr11.2 0 15 450 5.1% -10 8.6 1:0.44:1:1.1 1.5 1 0 penetr11.2 16 20 450 5.1% -10 8.6 1:0.44:1:1.1 1.5 0 1 penetr11.2 280 35 450 5.1% -10 8.6 1:0.44:1:1.1 1.5 0 1 penetr11.2 8000 45 450 5.1% -10 8.6 1:0.44:1:1.1 1.5 0 1 penetr11.3 0 0 450 5.1% -10 8.6 1:0.44:1:1.1 1.5 1 0 penetr11.3 0 0 450 5.1% -10 8.6 1:0.44:1:1.1 1.5 1 0 penetr11.3 0 0 450 5.1% -10 8.6 1:0.44:1:1.1 1.5 1 0 penetr11.3 0 0 450 5.1% -10 8.6 1:0.44:1:1.1 1.5 1 0 penetr11.1 450 5.1% -10 8.6 1:0.44:1:1.1 1.5 1 0 penetr11.2 450 5.1% -10 8.6 1:0.44:1:1.1 1.5 1 0 penetr11.3 450 5.1% -10 8.6 1:0.44:1:1.1 1.5 0 1 penetr11.1 500 40 450 5.1% -10 8.6 1:0.44:1:1.1 1.5 1 0 penetr11.2 500 40 450 5.1% -10 8.6 1:0.44:1:1.1 1.5 1 0 penetr11.3 500 450 5.1% -10 8.6 1:0.44:1:1.1 1.5 1 0 penetr12.1 0 15 300 3.4% -10 9.1 1:0.47:1:1.1 9.5 1 0 penetr12.1 0 30 300 3.4% -10 9.1 1:0.47:1:1.1 9.5 1 0 penetr12.1 0 45 300 3.4% -10 9.1 1:0.47:1:1.1 9.5 1 0 penetr12.1 800 59 300 3.4% -10 9.1 1:0.47:1:1.1 9.5 1 0 penetr12.2 0 15 300 3.4% -10 9.1 1:0.47:1:1.1 9.5 1 0 penetr12.2 0 30 300 3.4% -10 9.1 1:0.47:1:1.1 9.5 1 0 penetr12.2 0 45 300 3.4% -10 9.1 1:0.47:1:1.1 9.5 0 1 penetr12.2 680 59 300 3.4% -10 9.1 1:0.47:1:1.1 9.5 1 0

ERD
C TR-14-10
95
Sample PenRes_
(psi) 2hr_UCS_
(psi) SetTime_
(min) Time_elaps_
(min) Admix_
wt_g Admix_% (wt.cem)
Nom_Temp_C
water_ lb ratio_mix Slump Train Test
penetr12.3 0 15 300 3.4% -10 9.1 1:0.47:1:1.1 9.5 0 1 penetr12.3 0 30 300 3.4% -10 9.1 1:0.47:1:1.1 9.5 0 1 penetr12.3 0 45 300 3.4% -10 9.1 1:0.47:1:1.1 9.5 0 1 penetr12.3 800 59 300 3.4% -10 9.1 1:0.47:1:1.1 9.5 1 0 penetr12.1 34 300 3.4% -10 9.1 1:0.47:1:1.1 9.5 0 1 penetr12.2 688 300 3.4% -10 9.1 1:0.47:1:1.1 9.5 1 0 penetr12.3 300 3.4% -10 9.1 1:0.47:1:1.1 9.5 1 0 penetr12.1 500 34 52 300 3.4% -10 9.1 1:0.47:1:1.1 9.5 1 0 penetr12.2 500 688 52 300 3.4% -10 9.1 1:0.47:1:1.1 9.5 1 0 penetr12.3 500 52 300 3.4% -10 9.1 1:0.47:1:1.1 9.5 1 0 penetr13.1 0 15 300 3.4% -10 8.6 1:0.44:1:1.1 9.25 1 0 penetr13.1 0 30 300 3.4% -10 8.6 1:0.44:1:1.1 9.25 1 0 penetr13.1 64 45 300 3.4% -10 8.6 1:0.44:1:1.1 9.25 1 0 penetr13.1 760 55 300 3.4% -10 8.6 1:0.44:1:1.1 9.25 1 0 penetr13.2 0 15 300 3.4% -10 8.6 1:0.44:1:1.1 9.25 1 0 penetr13.2 0 30 300 3.4% -10 8.6 1:0.44:1:1.1 9.25 1 0 penetr13.2 32 45 300 3.4% -10 8.6 1:0.44:1:1.1 9.25 1 0 penetr13.2 640 55 300 3.4% -10 8.6 1:0.44:1:1.1 9.25 1 0 penetr13.3 0 15 300 3.4% -10 8.6 1:0.44:1:1.1 9.25 1 0 penetr13.3 0 30 300 3.4% -10 8.6 1:0.44:1:1.1 9.25 1 0 penetr13.3 16 45 300 3.4% -10 8.6 1:0.44:1:1.1 9.25 1 0 penetr13.3 608 55 300 3.4% -10 8.6 1:0.44:1:1.1 9.25 1 0 penetr13.1 1159 300 3.4% -10 8.6 1:0.44:1:1.1 9.25 1 0 penetr13.2 1582 300 3.4% -10 8.6 1:0.44:1:1.1 9.25 1 0 penetr13.3 300 3.4% -10 8.6 1:0.44:1:1.1 9.25 0 1 penetr13.1 500 1159 50 300 3.4% -10 8.6 1:0.44:1:1.1 9.25 1 0 penetr13.2 500 1582 50 300 3.4% -10 8.6 1:0.44:1:1.1 9.25 1 0

ERD
C TR-14-10
96
Sample PenRes_
(psi) 2hr_UCS_
(psi) SetTime_
(min) Time_elaps_
(min) Admix_
wt_g Admix_% (wt.cem)
Nom_Temp_C
water_ lb ratio_mix Slump Train Test
penetr13.3 500 50 300 3.4% -10 8.6 1:0.44:1:1.1 9.25 0 1 penetr13.2.1 88 15 300 3.4% -10 7.6 1:0.39:1:1.1 9.25 1 0 penetr13.2.1 800 40 300 3.4% -10 7.6 1:0.39:1:1.1 9.25 0 1 penetr13.2.1 0 45 300 3.4% -10 7.6 1:0.39:1:1.1 9.25 1 0 penetr13.2.1 0 0 300 3.4% -10 7.6 1:0.39:1:1.1 9.25 1 0 penetr13.2.2 168 15 300 3.4% -10 7.6 1:0.39:1:1.1 4 1 0 penetr13.2.2 800 40 300 3.4% -10 7.6 1:0.39:1:1.1 4 0 1 penetr13.2.2 0 45 300 3.4% -10 7.6 1:0.39:1:1.1 4 1 0 penetr13.2.2 0 0 300 3.4% -10 7.6 1:0.39:1:1.1 4 1 0 penetr13.2.3 768 0 300 3.4% -10 7.6 1:0.39:1:1.1 4 1 0 penetr13.2.3 0 0 300 3.4% -10 7.6 1:0.39:1:1.1 4 0 1 penetr13.2.3 0 0 300 3.4% -10 7.6 1:0.39:1:1.1 4 0 1 penetr13.2.3 0 0 300 3.4% -10 7.6 1:0.39:1:1.1 4 0 1 penetr13.2.1 2236 300 3.4% -10 7.6 1:0.39:1:1.1 4 1 0 penetr13.2.2 2474 300 3.4% -10 7.6 1:0.39:1:1.1 4 1 0 penetr13.2.3 300 3.4% -10 7.6 1:0.39:1:1.1 4 1 0 penetr13.2.1 500 2236 42.5 300 3.4% -10 7.6 1:0.39:1:1.1 4 0 1 penetr13.2.2 500 2474 42.5 300 3.4% -10 7.6 1:0.39:1:1.1 4 1 0 penetr13.2.3 500 300 3.4% -10 7.6 1:0.39:1:1.1 4 0 1 penetr14.1 0 0 300 3.4% 10 8.6 1:0.44:1:1.1 0 1 0 penetr14.1 0 0 300 3.4% 10 8.6 1:0.44:1:1.1 0 0 1 penetr14.1 0 0 300 3.4% 10 8.6 1:0.44:1:1.1 0 1 0 penetr14.1 0 0 300 3.4% 10 8.6 1:0.44:1:1.1 0 1 0 penetr14.2 0 0 300 3.4% 10 8.6 1:0.44:1:1.1 0 1 0 penetr14.2 0 0 300 3.4% 10 8.6 1:0.44:1:1.1 0 0 1 penetr14.2 0 0 300 3.4% 10 8.6 1:0.44:1:1.1 0 0 1 penetr14.2 0 0 300 3.4% 10 8.6 1:0.44:1:1.1 0 0 1

ERD
C TR-14-10
97
Sample PenRes_
(psi) 2hr_UCS_
(psi) SetTime_
(min) Time_elaps_
(min) Admix_
wt_g Admix_% (wt.cem)
Nom_Temp_C
water_ lb ratio_mix Slump Train Test
penetr14.3 0 0 300 3.4% 10 8.6 1:0.44:1:1.1 0 1 0 penetr14.3 0 0 300 3.4% 10 8.6 1:0.44:1:1.1 0 1 0 penetr14.3 0 0 300 3.4% 10 8.6 1:0.44:1:1.1 0 0 1 penetr14.3 0 0 300 3.4% 10 8.6 1:0.44:1:1.1 0 1 0 penetr14.1 300 3.4% 10 8.6 1:0.44:1:1.1 0 1 0 penetr14.2 300 3.4% 10 8.6 1:0.44:1:1.1 0 1 0 penetr14.3 300 3.4% 10 8.6 1:0.44:1:1.1 0 1 0 penetr14.1 500 7 300 3.4% 10 8.6 1:0.44:1:1.1 0 1 0 penetr14.2 500 7 300 3.4% 10 8.6 1:0.44:1:1.1 0 1 0 penetr14.3 500 7 300 3.4% 10 8.6 1:0.44:1:1.1 0 1 0 penetr14.1.1 16 15 300 3.4% 10 10.6 1:0.55:1:1.1 3.5 1 0 penetr14.1.1 88 17 300 3.4% 10 10.6 1:0.55:1:1.1 3.5 1 0 penetr14.1.1 800 18 300 3.4% 10 10.6 1:0.55:1:1.1 3.5 1 0 penetr14.1.1 0 0 300 3.4% 10 10.6 1:0.55:1:1.1 3.5 1 0 penetr14.1.2 8 15 300 3.4% 10 10.6 1:0.55:1:1.1 3.5 0 1 penetr14.1.2 168 17 300 3.4% 10 10.6 1:0.55:1:1.1 3.5 0 1 penetr14.1.2 800 18 300 3.4% 10 10.6 1:0.55:1:1.1 3.5 1 0 penetr14.1.2 0 0 300 3.4% 10 10.6 1:0.55:1:1.1 3.5 1 0 penetr14.1.3 16 15 300 3.4% 10 10.6 1:0.55:1:1.1 3.5 1 0 penetr14.1.3 768 17 300 3.4% 10 10.6 1:0.55:1:1.1 3.5 1 0 penetr14.1.3 0 0 300 3.4% 10 10.6 1:0.55:1:1.1 3.5 1 0 penetr14.1.3 0 0 300 3.4% 10 10.6 1:0.55:1:1.1 3.5 1 0 penetr14.1.1 3017 300 3.4% 10 10.6 1:0.55:1:1.1 3.5 0 1 penetr14.1.2 3155 300 3.4% 10 10.6 1:0.55:1:1.1 3.5 0 1 penetr14.1.3 3140 300 3.4% 10 10.6 1:0.55:1:1.1 3.5 1 0 penetr14.1.1 500 3017 17.5 300 3.4% 10 10.6 1:0.55:1:1.1 3.5 1 0 penetr14.1.2 500 3155 17.5 300 3.4% 10 10.6 1:0.55:1:1.1 3.5 1 0

ERD
C TR-14-10
98
Sample PenRes_
(psi) 2hr_UCS_
(psi) SetTime_
(min) Time_elaps_
(min) Admix_
wt_g Admix_% (wt.cem)
Nom_Temp_C
water_ lb ratio_mix Slump Train Test
penetr14.1.3 500 3140 16 300 3.4% 10 10.6 1:0.55:1:1.1 3.5 1 0 penetr15.1 0 40 100 1.1% 10 8.1 1:0.42:1:1.1 9.75 0 1 penetr15.1 8 45 100 1.1% 10 8.1 1:0.42:1:1.1 9.75 0 1 penetr15.1 104 50 100 1.1% 10 8.1 1:0.42:1:1.1 9.75 1 0 penetr15.1 800 52 100 1.1% 10 8.1 1:0.42:1:1.1 9.75 1 0 penetr15.2 0 30 100 1.1% 10 8.1 1:0.42:1:1.1 9.75 1 0 penetr15.2 0 40 100 1.1% 10 8.1 1:0.42:1:1.1 9.75 1 0 penetr15.2 216 45 100 1.1% 10 8.1 1:0.42:1:1.1 9.75 1 0 penetr15.2 800 50 100 1.1% 10 8.1 1:0.42:1:1.1 9.75 1 0 penetr15.3 0 30 100 1.1% 10 8.1 1:0.42:1:1.1 9.75 0 1 penetr15.3 0 40 100 1.1% 10 8.1 1:0.42:1:1.1 9.75 1 0 penetr15.3 96 45 100 1.1% 10 8.1 1:0.42:1:1.1 9.75 1 0 penetr15.3 800 50 100 1.1% 10 8.1 1:0.42:1:1.1 9.75 1 0 penetr15.1 3157 100 1.1% 10 8.1 1:0.42:1:1.1 9.75 1 0 penetr15.2 2961 100 1.1% 10 8.1 1:0.42:1:1.1 9.75 0 1 penetr15.3 100 1.1% 10 8.1 1:0.42:1:1.1 9.75 1 0 penetr15.1 500 3157 51 100 1.1% 10 8.1 1:0.42:1:1.1 9.75 1 0 penetr15.2 500 2961 47.5 100 1.1% 10 8.1 1:0.42:1:1.1 9.75 0 1 penetr15.3 500 47.5 100 1.1% 10 8.1 1:0.42:1:1.1 9.75 1 0 penetr16.1 16 15 200 2.3% 10 8.6 1:0.44:1:1.1 3 1 0 penetr16.1 240 19 200 2.3% 10 8.6 1:0.44:1:1.1 3 1 0 penetr16.1 800 21 200 2.3% 10 8.6 1:0.44:1:1.1 3 1 0 penetr16.1 0 0 200 2.3% 10 8.6 1:0.44:1:1.1 3 1 0 penetr16.2 0 15 200 2.3% 10 8.6 1:0.44:1:1.1 3 0 1 penetr16.2 336 19 200 2.3% 10 8.6 1:0.44:1:1.1 3 1 0 penetr16.2 800 21 200 2.3% 10 8.6 1:0.44:1:1.1 3 1 0 penetr16.2 0 0 200 2.3% 10 8.6 1:0.44:1:1.1 3 0 1

ERD
C TR-14-10
99
Sample PenRes_
(psi) 2hr_UCS_
(psi) SetTime_
(min) Time_elaps_
(min) Admix_
wt_g Admix_% (wt.cem)
Nom_Temp_C
water_ lb ratio_mix Slump Train Test
penetr16.3 32 15 200 2.3% 10 8.6 1:0.44:1:1.1 3 1 0 penetr16.3 800 19 200 2.3% 10 8.6 1:0.44:1:1.1 3 1 0 penetr16.3 0 0 200 2.3% 10 8.6 1:0.44:1:1.1 3 1 0 penetr16.3 0 0 200 2.3% 10 8.6 1:0.44:1:1.1 3 0 1 penetr16.1 2906 200 2.3% 10 8.6 1:0.44:1:1.1 3 1 0 penetr16.2 2955 200 2.3% 10 8.6 1:0.44:1:1.1 3 1 0 penetr16.3 200 2.3% 10 8.6 1:0.44:1:1.1 3 0 1 penetr16.1 500 2906 20 200 2.3% 10 8.6 1:0.44:1:1.1 3 1 0 penetr16.2 500 2955 20 200 2.3% 10 8.6 1:0.44:1:1.1 3 1 0 penetr16.3 500 17 200 2.3% 10 8.6 1:0.44:1:1.1 3 0 1 penetr17.1 0 20 300 3.4% 0 7.1 1:0.37:1:1.1 0 0 1 penetr17.1 24 30 300 3.4% 0 7.1 1:0.37:1:1.1 0 1 0 penetr17.1 8000 35 300 3.4% 0 7.1 1:0.37:1:1.1 0 1 0 penetr17.1 0 0 300 3.4% 0 7.1 1:0.37:1:1.1 0 1 0 penetr17.2 0 20 300 3.4% 0 7.1 1:0.37:1:1.1 0 0 1 penetr17.2 24 30 300 3.4% 0 7.1 1:0.37:1:1.1 0 1 0 penetr17.2 7200 35 300 3.4% 0 7.1 1:0.37:1:1.1 0 0 1 penetr17.2 0 0 300 3.4% 0 7.1 1:0.37:1:1.1 0 1 0 penetr17.3 0 0 300 3.4% 0 7.1 1:0.37:1:1.1 0 1 0 penetr17.3 0 0 300 3.4% 0 7.1 1:0.37:1:1.1 0 1 0 penetr17.3 0 0 300 3.4% 0 7.1 1:0.37:1:1.1 0 1 0 penetr17.3 0 0 300 3.4% 0 7.1 1:0.37:1:1.1 0 0 1 penetr17.1 2624 300 3.4% 0 7.1 1:0.37:1:1.1 0 1 0 penetr17.2 2912 300 3.4% 0 7.1 1:0.37:1:1.1 0 1 0 penetr17.3 300 3.4% 0 7.1 1:0.37:1:1.1 0 1 0 penetr17.1 500 2624 32.5 300 3.4% 0 7.1 1:0.37:1:1.1 0 1 0 penetr17.2 500 2912 32.5 300 3.4% 0 7.1 1:0.37:1:1.1 0 1 0

ERD
C TR-14-10
100
Sample PenRes_
(psi) 2hr_UCS_
(psi) SetTime_
(min) Time_elaps_
(min) Admix_
wt_g Admix_% (wt.cem)
Nom_Temp_C
water_ lb ratio_mix Slump Train Test
penetr17.3 500 300 3.4% 0 7.1 1:0.37:1:1.1 0 1 0 penetr18.1 0 15 200 2.3% 0 7.6 1:0.39:1:1.1 5 1 0 penetr18.1 16 30 200 2.3% 0 7.6 1:0.39:1:1.1 5 0 1 penetr18.1 480 40 200 2.3% 0 7.6 1:0.39:1:1.1 5 1 0 penetr18.1 0 0 200 2.3% 0 7.6 1:0.39:1:1.1 5 1 0 penetr18.2 0 15 200 2.3% 0 7.6 1:0.39:1:1.1 5 1 0 penetr18.2 16 30 200 2.3% 0 7.6 1:0.39:1:1.1 5 0 1 penetr18.2 720 40 200 2.3% 0 7.6 1:0.39:1:1.1 5 1 0 penetr18.2 0 0 200 2.3% 0 7.6 1:0.39:1:1.1 5 0 1 penetr18.3 0 0 200 2.3% 0 7.6 1:0.39:1:1.1 5 1 0 penetr18.3 0 0 200 2.3% 0 7.6 1:0.39:1:1.1 5 1 0 penetr18.3 0 0 200 2.3% 0 7.6 1:0.39:1:1.1 5 0 1 penetr18.3 0 0 200 2.3% 0 7.6 1:0.39:1:1.1 5 1 0 penetr18.1 3230 200 2.3% 0 7.6 1:0.39:1:1.1 5 1 0 penetr18.2 3226 200 2.3% 0 7.6 1:0.39:1:1.1 5 1 0 penetr18.3 200 2.3% 0 7.6 1:0.39:1:1.1 5 1 0 penetr18.1 500 3230 41 200 2.3% 0 7.6 1:0.39:1:1.1 5 0 1 penetr18.2 500 3226 35 200 2.3% 0 7.6 1:0.39:1:1.1 5 1 0 penetr18.3 500 200 2.3% 0 7.6 1:0.39:1:1.1 5 1 0 penetr19.1 0 15 200 2.3% -5 8.1 1:0.42:1:1.1 7 0 1 penetr19.1 0 25 200 2.3% -5 8.1 1:0.42:1:1.1 7 1 0 penetr19.1 0 35 200 2.3% -5 8.1 1:0.42:1:1.1 7 1 0 penetr19.1 16 60 200 2.3% -5 8.1 1:0.42:1:1.1 7 1 0 penetr19.2 0 0 200 2.3% -5 8.1 1:0.42:1:1.1 7 1 0 penetr19.2 0 0 200 2.3% -5 8.1 1:0.42:1:1.1 7 1 0 penetr19.2 0 0 200 2.3% -5 8.1 1:0.42:1:1.1 7 1 0 penetr19.2 64 0 200 2.3% -5 8.1 1:0.42:1:1.1 7 1 0

ERD
C TR-14-10
101
Sample PenRes_
(psi) 2hr_UCS_
(psi) SetTime_
(min) Time_elaps_
(min) Admix_
wt_g Admix_% (wt.cem)
Nom_Temp_C
water_ lb ratio_mix Slump Train Test
penetr19.3 0 0 200 2.3% -5 8.1 1:0.42:1:1.1 7 1 0 penetr19.3 0 0 200 2.3% -5 8.1 1:0.42:1:1.1 7 1 0 penetr19.3 0 0 200 2.3% -5 8.1 1:0.42:1:1.1 7 1 0 penetr19.3 0 0 200 2.3% -5 8.1 1:0.42:1:1.1 7 0 1 penetr19.1 2426 200 2.3% -5 8.1 1:0.42:1:1.1 7 1 0 penetr19.2 2132 200 2.3% -5 8.1 1:0.42:1:1.1 7 1 0 penetr19.3 200 2.3% -5 8.1 1:0.42:1:1.1 7 1 0 penetr19.1 500 2426 200 2.3% -5 8.1 1:0.42:1:1.1 7 1 0 penetr19.2 500 2132 200 2.3% -5 8.1 1:0.42:1:1.1 7 1 0 penetr19.3 500 200 2.3% -5 8.1 1:0.42:1:1.1 7 1 0 penetr20.1 8 15 750 8.5% -15 9.1 1:0.47:1:1.1 8 1 0 penetr20.1 800 25 750 8.5% -15 9.1 1:0.47:1:1.1 8 1 0 penetr20.1 0 0 750 8.5% -15 9.1 1:0.47:1:1.1 8 1 0 penetr20.1 0 0 750 8.5% -15 9.1 1:0.47:1:1.1 8 1 0 penetr20.2 0 15 750 8.5% -15 9.1 1:0.47:1:1.1 8 1 0 penetr20.2 320 25 750 8.5% -15 9.1 1:0.47:1:1.1 8 1 0 penetr20.2 640 29 750 8.5% -15 9.1 1:0.47:1:1.1 8 1 0 penetr20.2 0 0 750 8.5% -15 9.1 1:0.47:1:1.1 8 1 0 penetr20.3 16 15 750 8.5% -15 9.1 1:0.47:1:1.1 8 1 0 penetr20.3 640 25 750 8.5% -15 9.1 1:0.47:1:1.1 8 1 0 penetr20.3 800 29 750 8.5% -15 9.1 1:0.47:1:1.1 8 0 1 penetr20.3 0 0 750 8.5% -15 9.1 1:0.47:1:1.1 8 1 0 penetr20.1 822 750 8.5% -15 9.1 1:0.47:1:1.1 8 1 0 penetr20.2 889 750 8.5% -15 9.1 1:0.47:1:1.1 8 0 1 penetr20.3 750 8.5% -15 9.1 1:0.47:1:1.1 8 0 1 penetr20.1 500 822 20 750 8.5% -15 9.1 1:0.47:1:1.1 8 1 0 penetr20.2 500 889 27 750 8.5% -15 9.1 1:0.47:1:1.1 8 1 0

ERD
C TR-14-10
102
Sample PenRes_
(psi) 2hr_UCS_
(psi) SetTime_
(min) Time_elaps_
(min) Admix_
wt_g Admix_% (wt.cem)
Nom_Temp_C
water_ lb ratio_mix Slump Train Test
penetr20.3 500 20 750 8.5% -15 9.1 1:0.47:1:1.1 8 0 1 penetr21.1 0 10 400 4.6% 0 8.6 1:0.44:1:1.1 6.5 0 1 penetr21.1 144 15 400 4.6% 0 8.6 1:0.44:1:1.1 6.5 1 0 penetr21.1 800 20 400 4.6% 0 8.6 1:0.44:1:1.1 6.5 0 1 penetr21.1 0 0 400 4.6% 0 8.6 1:0.44:1:1.1 6.5 1 0 penetr21.2 16 10 400 4.6% 0 8.6 1:0.44:1:1.1 6.5 1 0 penetr21.2 136 15 400 4.6% 0 8.6 1:0.44:1:1.1 6.5 0 1 penetr21.2 800 20 400 4.6% 0 8.6 1:0.44:1:1.1 6.5 1 0 penetr21.2 0 0 400 4.6% 0 8.6 1:0.44:1:1.1 6.5 0 1 penetr21.3 0 0 400 4.6% 0 8.6 1:0.44:1:1.1 6.5 0 1 penetr21.3 0 0 400 4.6% 0 8.6 1:0.44:1:1.1 6.5 0 1 penetr21.3 0 0 400 4.6% 0 8.6 1:0.44:1:1.1 6.5 0 1 penetr21.3 0 0 400 4.6% 0 8.6 1:0.44:1:1.1 6.5 1 0 penetr21.1 2204 400 4.6% 0 8.6 1:0.44:1:1.1 6.5 0 1 penetr21.2 2252 400 4.6% 0 8.6 1:0.44:1:1.1 6.5 0 1 penetr21.3 400 4.6% 0 8.6 1:0.44:1:1.1 6.5 0 1 penetr21.1 500 2204 17.5 400 4.6% 0 8.6 1:0.44:1:1.1 6.5 1 0 penetr21.2 500 2252 17.5 400 4.6% 0 8.6 1:0.44:1:1.1 6.5 1 0 penetr21.3 500 400 4.6% 0 8.6 1:0.44:1:1.1 6.5 1 0

ERDC TR-14-10 103
Appendix B: Additional Figures and Tables
Figure B1. Task 3 (aluminum sulfate) testing: set time (time to reach 500 psi, in min) vs.
the amount of aluminum sulfate used (g), filtered by testing temperature (°C). All completed tests in task 3 are shown.
Figure B2. Task 3 (aluminum sulfate) testing: set time (time to reach 500 psi, in min) vs.
the amount of aluminum sulfate used (g), filtered by testing temperature (°C). Tests shown only where 2 hr UCS is greater than 2500 psi.

ERDC TR-14-10 104
Figure B3. Task 3 (aluminum sulfate) testing: 2 hr UCS vs. the amount of aluminum sulfate
used (g), filtered by testing temperature (°C). All completed tests in task 3 are shown.
Figure B4. Task 3 (aluminum sulfate) testing: 2 hr UCS vs. amount of aluminum sulfate used
(g), filtered by testing temperature (°C). Tests shown only where 2 hr UCS is greater than 2500 psi.

ERDC TR-14-10 105
Figure B5. Task 3 (aluminum sulfate) testing: 2 hr UCS vs. set time (time to reach 500 psi, in
min), filtered by the amount of aluminum sulfate used (g). All completed tests in task 3 are shown.
Figure B6. Task 3 (aluminum sulfate) testing: 2 hr UCS vs. set time (time to reach 500 psi, in
min), filtered by testing temperature (°C). All completed tests in task 3 are shown.
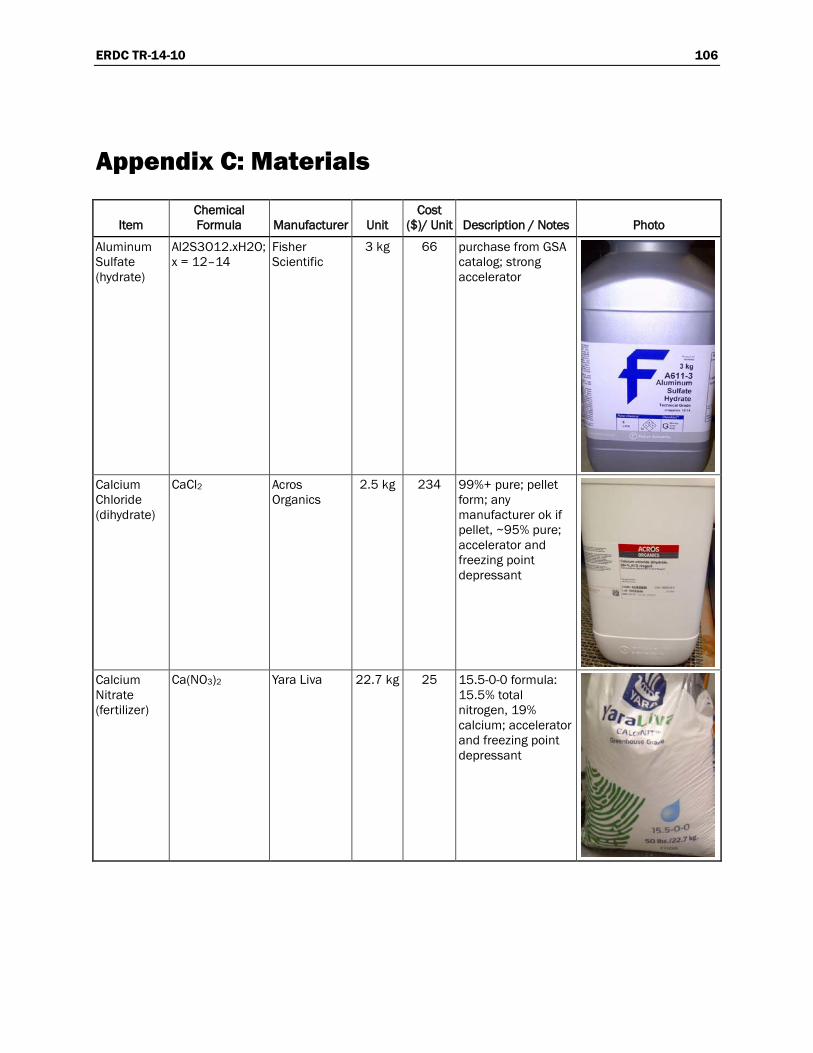
ERDC TR-14-10 106
Appendix C: Materials
Item Chemical Formula Manufacturer Unit
Cost ($)/ Unit Description / Notes Photo
Aluminum Sulfate (hydrate)
Al2S3O12.xH2O; x = 12–14
Fisher Scientific
3 kg 66 purchase from GSA catalog; strong accelerator
Calcium Chloride (dihydrate)
CaCl2 Acros Organics
2.5 kg 234 99%+ pure; pellet form; any manufacturer ok if pellet, ~95% pure; accelerator and freezing point depressant
Calcium Nitrate (fertilizer)
Ca(NO3)2 Yara Liva 22.7 kg 25 15.5-0-0 formula: 15.5% total nitrogen, 19% calcium; accelerator and freezing point depressant

ERDC TR-14-10 107
Item Chemical Formula Manufacturer Unit
Cost ($)/ Unit Description / Notes Photo
Calcium Sulfate (hemi-hydrate)
CaSO4·.5H2O Fisher Scientific
10 kg 348 aka calcined gypsum or plaster of Paris; potential accelerator
Cane Sugar (granulated)
C12H22O11 C&H 2.3 kg 5 sucrose; temporary retardant
Glenium 7500 water-reducer
unknown (COTS product)
BASF 1 kg 2 COTS high-range water-reducing admixture
Pozzutec 20+ accelerator
unknown (COTS product)
BASF 15.3 kg Unk COTS non-chloride, water-reducing and accelerating admixture
Rapid Set Concrete Mix
COTS (Exact contents/ proportions unknown)
CTS — — Approximate ratios: 1:1.1:1.1 type III cement:sand: crushed stone; additional accelerators and other contents may be present

ERDC TR-14-10 108
Item Chemical Formula Manufacturer Unit
Cost ($)/ Unit Description / Notes Photo
Sodium Nitrate
NaNO2 Dudadiesel Biodiesel Supply
2.3 kg 13 99.2%+ pure prills (pellets); potential accelerator
Sodium Sulfate (anhydrous)
Na2SO4 Mallinckrodt .5 kg 6 potential accelerator
Utility Fill COTS (Exact contents/ proportions unknown)
CTS — — “flowable fill;” approximate proportions: 93% sand, 7% type III cement (with possible admixtures)

REPORT DOCUMENTATION PAGE Form Approved
OMB No. 0704-0188 Public reporting burden for this collection of information is estimated to average 1 hour per response, including the time for reviewing instructions, searching existing data sources, gathering and maintaining the data needed, and completing and reviewing this collection of information. Send comments regarding this burden estimate or any other aspect of this collection of information, including suggestions for reducing this burden to Department of Defense, Washington Headquarters Services, Directorate for Information Operations and Reports (0704-0188), 1215 Jefferson Davis Highway, Suite 1204, Arlington, VA 22202-4302. Respondents should be aware that notwithstanding any other provision of law, no person shall be subject to any penalty for failing to comply with a collection of information if it does not display a currently valid OMB control number. PLEASE DO NOT RETURN YOUR FORM TO THE ABOVE ADDRESS. 1. REPORT DATE (DD-MM-YYYY)
10-07-2014 2. REPORT TYPE
Technical Report/Final 3. DATES COVERED (From - To)
4. TITLE AND SUBTITLE
Laboratory Evaluation of Expedient Low-Temperature Admixtures for Runway Craters in Cold Weather
5a. CONTRACT NUMBER
5b. GRANT NUMBER
5c. PROGRAM ELEMENT NUMBER
6. AUTHOR(S)
Jared I. Oren, Robert D. Moser, Veera Boddu, Charles A. Weiss, Jr., and Jay Clausen
5d. PROJECT NUMBER
5e. TASK NUMBER
5f. WORK UNIT NUMBER
7. PERFORMING ORGANIZATION NAME(S) AND ADDRESS(ES) 8. PERFORMING ORGANIZATION REPORT NUMBER
Cold Regions Research and Engineering Laboratory (CRREL) U.S. Army Engineer Research and Development Center (ERDC) 72 Lyme Road Hanover, NH 03755-1290
ERDC TR-14-10
9. SPONSORING / MONITORING AGENCY NAME(S) AND ADDRESS(ES) 10. SPONSOR/MONITOR’S ACRONYM(S) Air Force Civil Engineer Center Tyndall Air Force Base, FL 32403-5319
AFCEC 11. SPONSOR/MONITOR’S REPORT NUMBER(S)
12. DISTRIBUTION / AVAILABILITY STATEMENT Approved for public release; distribution is unlimited.
13. SUPPLEMENTARY NOTES
The Airfield Damage Repair Modernization Program
14. ABSTRACT The research included in this report investigates admixtures that can improve the low-temperature early strength gain performance of two products already in existence (which are currently in limited use by the Air Force) for hasty runway repair. The first product, a “flowable fill,” is a low-level cementitious sandy mixture used to rapidly fill the bulk of a runway crater; the second product, a rapid setting concrete, seals the final 10–12 in. of the crater and allows heavy-vehicle trafficability.
The primary operational requirements, which the current two-part solution meet at higher temperatures (greater than 10°C) but which require improvements at lower temperatures (−10°C to 10°C), involve time of set and 2 hr unconfined compressive strength (UCS). This research ignores typical concerns, such as long-term durability, aesthetics, and corrosion, that are of minimal importance in this expedient field-use application—horizontal surface repairs not expected to last more than two to five years. Results from this study are expected to be incorporated into operational testing, using Air Force equipment, personnel, and techniques, for small and large crater repair at sub-freezing temperatures. This report describes laboratory tests to improve the early strength gain performance of both repair materials to repair small-to-large craters at ambient temperatures of −10°C to 10°C.
15. SUBJECT TERMS Airfield damage repair Cold weather concrete
Crater repair Flowable fill Rapid set
Runway repair
16. SECURITY CLASSIFICATION OF: 17. LIMITATION OF ABSTRACT
18. NUMBER OF PAGES
19a. NAME OF RESPONSIBLE PERSON
a. REPORT
Unclassified
b. ABSTRACT
Unclassified
c. THIS PAGE
Unclassified SAR 121 19b. TELEPHONE NUMBER (include area code)
Standard Form 298 (Rev. 8-98) Prescribed by ANSI Std. 239.18